Embed Size (px)
Citation preview

4th International Conference On Building Energy, Environment
Impact of upwind urbanization on the downwind urban heat island effect
X. Zhou 1, H. Chen 1
1School of Architecture & Urban Planning
Huazhong University of Science & Technology, Luoyu Road 1037, Wuhan, China
SUMMARY The aim of this study is assessing the impact of upwind urbanization on the UHI effect of downwind areas. To achieve that, we selected two areas next to each other along the prevailing wind direction of Wuhan in summer. One is in the upwind position, and the other is in the downwind position. To quantitatively evaluate the impact, we set 2 groups of 10 cases with different building densities, building heights in the upwind area, and used Weather Research and Forecasting model of WRF to simulate each of the cases. According to the results, the average surface skin temperature of downwind area increased approximate 7% when the building density of upwind area increased from 25% to 45%. However, the average surface skin temperature of downwind area remained unchanged after the building density of upwind area exceeded 30%.
INTRODUCTION Urbanization is one of the most extreme ways in which human activities change local land use and induce local land surface characteristics in urban areas that are substantially different from those in surrounding areas (Grimmond et al., 2004; Zhang and Chen, 2014). The urban heat island (UHI) effect is one of the most significant phenomena caused by urbanization, and has been observed worldwide (Childs and Raman, 2005; Gaffin and Coauthors, 2008). According to the record, the urbanization rate of China had reached to 51.27% till 2011. By 2050, there is a potential that the urbanization rate of China may break through 70%. Therefore, Chinese major cities will maintain their expansions and growths in recent decades. That means if without precise planning and control, the UHI effects will become more and more serious in these cities.
Urbanization changes the local climate and environment, especially the UHI effect, and it is widely recognised in most countries and areas all over the world. In the Atlanta metropolitan area, maximum annual land surface temperature differences of 5.7 K were generated by the land use and land cover (LULC) changes from evergreen forest to medium-intensity urban land (Fu and Weng, 2016). In eastern Sudan, increased rainfall concentration and possible risk of soil erosion were investigated during the LULC changes from 1941 to 2009 (Sulieman and Elagib, 2012). A significant negative relationship between distance from centre of the city and heat intensity was discovered in Addis Ababa, Ethiopia, indicating increasing thermal consequences of the rapid urbanization (Feyisa et al., 2016). Due to the LULC changes, the 2 m air temperature in Putrajaya is increasing at the rate
of 1.66 ℃ per decade, while the prevailing urban heat island
intensity (UHII) of the area is about 2.1 ℃ (Morris et al., 2016).
It has been found that climate change caused by urbanization may even lead, in the case of Malawi, to reverse (i.e. urban to rural) migration (Suckall et al., 2015). As for the relationship between urbanization and precipitation, the Pearl River Delta
area of China experiences fewer and shorter precipitation events with a lower precipitation frequency (ratio of rainy hours, about 3 days per year less). However, short-duration heavy rain events play a more significant role over the Pearl River Delta urban areas (Chen et al., 2015). Moreover, in the same area, it was found that thermal circulation induced by urbanization affected ozone formation (Li et al., 2016). With the CO2 emission data for Malaysia from 1970-2011, increasing CO2 emissions were found to be associated with urbanization (Shahbaz et al., 2016). As there are quite significant connections between urbanization and urban climate and environment changes, He et al. developed an urban climate map based on the typical urban morphological features of Beijing, in order to propose a series of available mitigation measures and climatic spatial planning guidelines for improving urban climatic conditions (He et al., 2015). Ng et al. analyzed the relationship between frontal area density representing urban morphology and urban climate in Hong Kong (Ng et al., 2011), and they found the air quality in Hong Kong was closely connected with its urban morphology (Yuan et al., 2014). By using an urban landscape metrics framework, McCarty and Kaza empirically examined whether fragmentary and sprawling urban patterns are associated with low air quality in the United States (McCarty and Kaza, 2015). Urbanization will not only affect the urban itself on its UHI effect, as far as we know, the changes of urban morphology will cause its downwind rural areas’ temperature to rise 0.5 to 1 °C in Wuhan, China (Zhou, 2013).
Hence, this study selected a summer period with most significant UHI effect, and assessed the impact of upwind urbanization on the UHI effect of downwind areas. To quantitatively evaluate the impact, firstly, we selected two areas next to each other along the prevailing wind direction of Wuhan; then, we set 3 groups of 15 cases with different building densities, building heights, or green coverage ratios in the upwind area, and used Weather Research and Forecasting model of WRF to simulate each of the cases.
METHODS To achieve the urban scale simulation in this study, we applied of the weather research and forecasting model (WRF), a meso-scale meteorological model. The WRF model is a fully compressible and non-hydrostatic model (with a run-time hydrostatic option) (Avolio et al., 2017). Its vertical coordinate is a terrain-following hydrostatic pressure coordinate. The grid staggering is the Arakawa C-grid. The WRF model works for meso-scale phenomena such as sea breezes and mountain valley flows with large area coverage at coarse resolution (Xue et al., 2017). The WRF model predicts wind velocity, wind direction, temperature, water vapor, cloud cover, precipitation, and pressure distribution on different underlying surfaces (Birch et al., 2017). However, anthropogenic effects and urban form are not fully considered in the basic WRF model.
ISBN: 978-0-646-98213-7 COBEE2018-Paper288 page 874

4th International Conference On Building Energy, Environment
To meet the needs of improving the model, Chen et al. coupled the urban canopy model (UCM) with the original model in the form of the WRF/UCM (Chen et al., 2011). The urban canopy layer is the closest layer to the land surface with a height comparable to the average height of buildings. It is the layer with the most direct impact on the urban boundary layer, which is also one of the most important key factors in forming the urban microclimate. The WRF/UCM has calculated the impact of urban form on the absorption and reflection of long-wave and short-wave radiation (Wai et al., 2017). Besides, the WRF/UCM also considers the following influencing factors: (1) buildings and vegetation blocking effect on air-flow; (2) the turbulence effects around buildings and vegetation; (3) multiple reflections in urban canyons; (4) anthropogenic heat emission from buildings and traffic; and (5) the shading effect of vegetation. Hence, the WRF/UCM model has been widely used in urban climate studies, and its resolution and accuracy have been verified and approved by many related studies. We have previously done the validation, and the results provided confidence in the model as a predictive tool that can be used to estimate the change in local climates and thermal environments (Zhou et al., 2016).
To increase its resolution and accuracy, we applied the WRF coupled with Urban Canopy Model (UCM) to this study, and chose Monin and Obukhov scheme for Surface layer physics (Monin AS, Obukhov AM, 1954), Thompson et al. scheme for microphysics(Thompson G et al., 2004), Mlawer et al. scheme for long-wave and short-wave radiation physics (Mlawer EJ et al., 1997), Noah scheme for land surface model (LSM) (Chen F and Dudhia J, 2001).
SETTINGS As shown in Fig. 1, Wuhan is the capital of Hubei Province in China. It is located at the confluence of the Han and Yangtze Rivers along the middle reaches of the latter. Wuhan occupies a land area of 8,494.41 km2, and has a population of 10,540,500. The city is famous for its vast area of inland water, which covers 2,217.6 km2, one-fourth its total area. Wuhan has a humid subtropical climate with abundant rainfall and four distinct seasons. The city experiences an extremely hot and humid summer, leading it to be known as one of the Three Boilers of China.
Fig. 1 Study area and domain settings
USGS land-use and land-cover category 24 was applied to the geographic data used in this study. The simulations
commenced at 1200 Universal Time, Coordinated (UTC) on 12 August 2011, and time integration was performed for 78 h. To clarify the impact of urban morphology on the urban climate and environment, the NECP/NCAR FNL global meteorological dataset supplied by the National Center for Atmospheric Research (NCAR) was applied to all cases. We set 3 domains as shown in Fig. 5; details of the domains are given in table 1.
We set 5 cases with different average building heights of upwind area from 9 m to 45 m (the average building height in 1970s and 2000s in Wuhan, respectively); 5 cases with different average building density of upwind area from 25% to 45% (according to the master plan of Wuhan urban planning in 2020 ). No difference is set in downwind area among cases. Details of case settings are given in table 2.
Table 1 Computational domains and grid arrangements
Domain (X[km] x Y[km] x Z[km])
The number of grids
The size of grids (km)
D1 225x225 x 20 50x50x35 4.5
D2 150x150 x 20 100x100x35 1.5
D3 50x50 x 20 100x100x35 0.5
Table 2 Case settings (Average values)
RESULTS We set 5 cases of different building heights from lowest (9m in case 1) to highest (45m in case 5) in the upwind area. Building heights of the 5 cases are the same in the downwind area. As shown in Fig. 2, the average surface temperature (TSK) of upwind area (Ave._U) slightly decreased (less than 1%), while the maximum TSK (Max._U) with distinct decreasing by about 3% and the minimum values (Min._U) by about 2% increasing. We assumed that the decreasing of the average and maximum TSK are due to the shading effect of tall buildings. Tall buildings provide street canyon with shades and thus lower the TSK during the daytime. However, much of the radiation absorbed by the upper part of high-rise buildings during the day is released into the street canyon in the hours during night, therefore, the minimum TSK increased.
Upwind Area Building Height
(m)
Building Density
(%)
Greening Rate (%)
Impact of
Building Height
Case_1 9 25 30
Case_2 18 25 30
Case_3 27 25 30
Case_4 36 25 30
Case_5 45 25 30
Impact of
Building Density
Case_1 9 25 30
Case_2 9 30 30
Case_3 9 35 30
Case_4 9 40 30
Case_5 9 45 30
Downwind Area 36 65 20
ISBN: 978-0-646-98213-7 COBEE2018-Paper288 page 875
4th International Conference On Building Energy, Environment
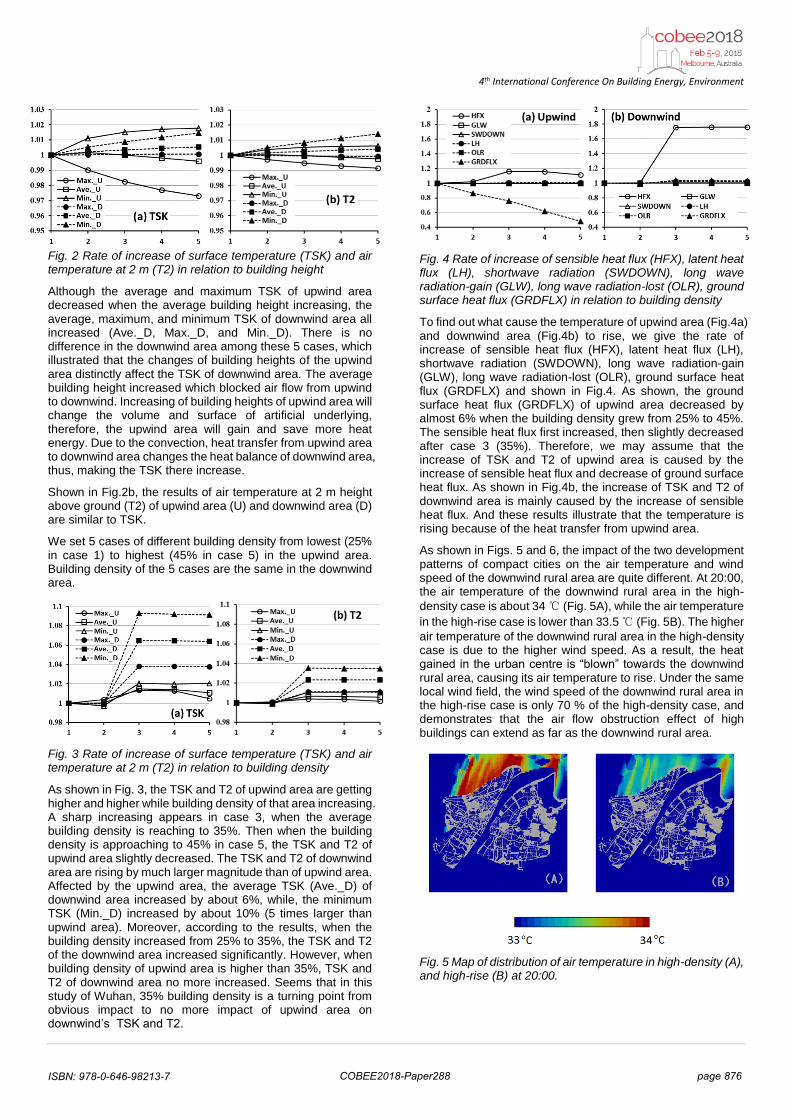
Fig. 2 Rate of increase of surface temperature (TSK) and air temperature at 2 m (T2) in relation to building height
Although the average and maximum TSK of upwind area decreased when the average building height increasing, the average, maximum, and minimum TSK of downwind area all increased (Ave._D, Max._D, and Min._D). There is no difference in the downwind area among these 5 cases, which illustrated that the changes of building heights of the upwind area distinctly affect the TSK of downwind area. The average building height increased which blocked air flow from upwind to downwind. Increasing of building heights of upwind area will change the volume and surface of artificial underlying, therefore, the upwind area will gain and save more heat energy. Due to the convection, heat transfer from upwind area to downwind area changes the heat balance of downwind area, thus, making the TSK there increase.
Shown in Fig.2b, the results of air temperature at 2 m height above ground (T2) of upwind area (U) and downwind area (D) are similar to TSK.
We set 5 cases of different building density from lowest (25% in case 1) to highest (45% in case 5) in the upwind area. Building density of the 5 cases are the same in the downwind area.
Fig. 3 Rate of increase of surface temperature (TSK) and air temperature at 2 m (T2) in relation to building density
As shown in Fig. 3, the TSK and T2 of upwind area are getting higher and higher while building density of that area increasing. A sharp increasing appears in case 3, when the average building density is reaching to 35%. Then when the building density is approaching to 45% in case 5, the TSK and T2 of upwind area slightly decreased. The TSK and T2 of downwind area are rising by much larger magnitude than of upwind area. Affected by the upwind area, the average TSK (Ave._D) of downwind area increased by about 6%, while, the minimum TSK (Min._D) increased by about 10% (5 times larger than upwind area). Moreover, according to the results, when the building density increased from 25% to 35%, the TSK and T2 of the downwind area increased significantly. However, when building density of upwind area is higher than 35%, TSK and T2 of downwind area no more increased. Seems that in this study of Wuhan, 35% building density is a turning point from obvious impact to no more impact of upwind area on downwind’s TSK and T2.
Fig. 4 Rate of increase of sensible heat flux (HFX), latent heat flux (LH), shortwave radiation (SWDOWN), long wave radiation-gain (GLW), long wave radiation-lost (OLR), ground surface heat flux (GRDFLX) in relation to building density
To find out what cause the temperature of upwind area (Fig.4a) and downwind area (Fig.4b) to rise, we give the rate of increase of sensible heat flux (HFX), latent heat flux (LH), shortwave radiation (SWDOWN), long wave radiation-gain (GLW), long wave radiation-lost (OLR), ground surface heat flux (GRDFLX) and shown in Fig.4. As shown, the ground surface heat flux (GRDFLX) of upwind area decreased by almost 6% when the building density grew from 25% to 45%. The sensible heat flux first increased, then slightly decreased after case 3 (35%). Therefore, we may assume that the increase of TSK and T2 of upwind area is caused by the increase of sensible heat flux and decrease of ground surface heat flux. As shown in Fig.4b, the increase of TSK and T2 of downwind area is mainly caused by the increase of sensible heat flux. And these results illustrate that the temperature is rising because of the heat transfer from upwind area.
As shown in Figs. 5 and 6, the impact of the two development patterns of compact cities on the air temperature and wind speed of the downwind rural area are quite different. At 20:00, the air temperature of the downwind rural area in the high-
density case is about 34 ℃ (Fig. 5A), while the air temperature
in the high-rise case is lower than 33.5 ℃ (Fig. 5B). The higher
air temperature of the downwind rural area in the high-density case is due to the higher wind speed. As a result, the heat gained in the urban centre is “blown” towards the downwind rural area, causing its air temperature to rise. Under the same local wind field, the wind speed of the downwind rural area in the high-rise case is only 70 % of the high-density case, and demonstrates that the air flow obstruction effect of high buildings can extend as far as the downwind rural area.
Fig. 5 Map of distribution of air temperature in high-density (A), and high-rise (B) at 20:00.
ISBN: 978-0-646-98213-7 COBEE2018-Paper288 page 876

4th International Conference On Building Energy, Environment
Fig. 6 Map of distribution of wind speed in high-density (A), and high-rise (B) at 20:00.
CONCLUSIONS In this study, we set 5 cases with different average building heights of upwind area from 9 m to 45 m; 5 cases with different average building density of upwind area from 25% to 45%.
We found out that the increase of building height of upwind area causes the maximum and average TSK and T2 of upwind area to drop, while causing TSK and T2 of downwind area to rise. The TSK and T2 of upwind area are getting higher and higher while building density increasing. A sharp increasing appears when the average building density is reaching to 35%. Then when the building density is approaching to 45%, the TSK and T2 of upwind area slightly decreased. The TSK and T2 of downwind area are rising by much larger magnitude than of upwind area. After checking the energy balance of upwind area and downwind area, we found out that the increase of TSK and T2 of upwind area is caused by the increase of sensible heat flux and decrease of ground surface heat flux, and the increase of TSK and T2 of downwind area is mainly caused by the increase of sensible heat flux. And these results illustrate that the temperature is rising because of the heat transfer from upwind area. Moreover, we also found that the decrease of temperature of upwind area is caused by the decrease of absorbed radiation.
ACKNOWLEDGEMENT
This work was supported by the Youth project of National Natural Science Foundation of China (Grant No. 51708237), the State Key Program of National Natural Science of China (Grant No. 51538004), by the 57th China Postdoctoral Science Foundation funded project (Grant No. 2015M572144), by the Independent Innovation Fund of Huazhong University of Science and Technology (Grant No. 0118220100), and by the JURC short term internship program, by the National Natural Science Foundation of China Youth Fund.
REFERENCES Avolio E., Federico S., Miglietta M.M., Fuedo T. Lo, Calidonna C.R., Sempreviva A.M., Sensitivity analysis of WRF modelPBL schemes in simulating boundary-layer variables insouthern Italy: An experimental campaign. Atmos. Res. 192(2017) 58-71.
Birch L., Cronin T., Tziperman E., Glacial Inception on Baffin Island: The Role of Insolation, Meteorology, and Topography. J. Clim. 30 (2017) 4047-4064.
Childs P. P., and S. Raman, 2005: Observations and
numerical simulations of urban heat island and sea breeze circulations over New York City. Pure Appl. Geophys. , 162, 1955-1980.
Chen S., Li W.B., Du Y.D., Mao C.Y., Zhang L., Urbanization effect on precipitation over the Pearl River Delta based on CMORPH data. Adv. Clim. Chang. Res. 6 (2015) 16-22.
Chen F., Kusaka H., Bornstein R., Ching J., Grimmond C.S.B., Grossman-Clarke S., Loridan T., Manning K.W., Martilli A., Miao S.G., Sailor D., Salamanca F.P., Taha H., Tewari M., Wang X.M., Wyszogrodzkia A.A., Zhang C.L., The integrated WRF/urban modelling system development evaluation and applications to urban environmental problems. Int. J. Clim. 31 (2011) 273-288.
Chen F and Dudhia J. Coupling an advanced land surface-hydrology model with the Penn State-NCAR MM5 modeling system. Part I: Model implementation and sensitivity. Monthly Weather Review 2001; 129: 569-585.
Fu P., and Weng Q.H., A time series analysis of urbanization induced land use and land cover change and its impact on land surface temperature with Landsat imagery. Remote Sens. Environ. 175 (2016) 205–214.
Feyisa L.G., Meilby H., Jenerette G.D., Pauliet S., Locally optimized separability enhancement indices for urban land cover mapping: Exploring thermal environmental consequences of rapid urbanization in Addis Ababa, Ethiopia, Remote Sens. Environ. 175 (2016) 14–31.
Grimmond C.S.B., Salmond J. A., Oke T. R., Offerle B., and Lemonsu A., 2004: Flux and turbulence measurements at a densely built-up site in Marseille: Heat, mass (water and carbon dioxide), and momentum. J. Geophys. Res., 109.
Gaffin, S. R., and Coauthors, 2008: Variations in New York City’s urban heat island strength over time and space. Theor. Appl. Climatol., 94, 1-11.
He X.D., Shen S.G., Miao S.G., Dou J.J., Zhang Y.Z., Quantitative detection of urban climate resources and the establishment of an urban climate map (UCMap) system in Beijing. Build. Environ. 92 (2015) 668-678.
Li M.M., Yu S., Mao Z.C., Liu M.X., Huang X., Impacts of thermal circulations induced by urbanization on ozone formation in the Pearl River Delta region, China, Atmos. Environ. 127 (2016) 382-392.
Morris K.I., Chan A., Salleh S.A., Ooi M.C.G., Oozeer M.Y., Abakr Y.A., Numerical study on the urbanisation of Putrajaya and its interaction with the local climate, over a decade. Urban Clim. 16 (2016) 1–24.
McCarty J., Kaza N., Urban form and air quality in the United States, Landsc. Urban Plan. 139 (2015) 168–179.
Monin AS, Obukhov AM. Basic laws of turbulent mixing in the surface layer of the atmosphere. Tr. Akad. Nauk SSSR Geophiz 1954; Inst. 24(151): 163-187.
Mlawer EJ, Taubman SJ, Brown PD, Iacono MJ, Clough SA. Radiative transfer for inhomogeneous atmospheres: RRTM, a validated correlated-k model for the longwave. JOURNAL OF GEOPHYSICAL RESEARCH 1997; 102(D14):16,663-16,682.
Ng E., Yuan C., Chen L., Ren C., Fung J.C.H., Improving the wind environment in high-density cities by understanding urban morphology and surface roughness: A study in Hong Kong. Landsc. Urban Plan. 101 (2011) 59–74.
Sulieman H.M., and Elagib N.A., Implications of climate, land-
ISBN: 978-0-646-98213-7 COBEE2018-Paper288 page 877

4th International Conference On Building Energy, Environment
use and land-cover changes for pastoralism in eastern Sudan, J. Arid Environ. 85 (2012) 132-141.
Suckall N., Fraser E., Forster P., Mkwambisi D., Using a migration systems approach to understand the link between climate change and urbanisation in Malawi. Appl. Geogr. 63 (2015) 244-252.
Shahbaz M., Loganathan N., Muzaffar A.T., Ahmed K., Jabran M.A., How urbanization affects CO 2 emissions in Malaysia?The application of STIRPAT model, Renew. Sustain. EnergyRev. 57 (2016) 83–93.
Thompson G, Rasmussen RM and Manning K. Explicit forecasts of winter precipitation using an improved bulk microphysics scheme. Part I: Description and sensitivity analysis. Monthly Weather Review 2004; 132: 519-542.
Wai K.M., Wang X.M., Lin T.H., Wong M.S., Zeng S.K., He N., Ng E., Lau K., Wang D.H., Observational evidence of a long-term increase in precipitation due to urbanization effects and its implications for sustainable urban living. Sci. Total Environ. 599-600 (2017) 647-654.
Xue L., Edwards R., Huggins A., Lou X.F., Rasmussen R.,
Tessendorf S., Holbrook P., Blestrud D., Kunkel M., Glenn B., Parkinson S., WRF Large-eddy Simulations of chemical tracer deposition and seeding effect over complex terrain from ground- and aircraft-based Agl generators. Atmos. Res. 190 (2017) 89-103.
Yuan C., Ng E., Norford L.K., Improving air quality in high-density cities by understanding the relationship between air pollutant dispersion and urban morphologies. Build. Environ. 71 (2014) 245-258.
Zhang N., Chen Y., 2014: A case study of the upwind urbanization influence on the urban heat island effects along the Suzhou-Wuxi corridor. American Meteorological Society, 53, 333-344.
Zhou X., 2013: Research on the impact of urban morphology on urban climate in the built-up zone. Doctoral dissertation of Huazhong University of Science and Technology, 1-176.
Zhou X.F., Ooka R., Chen H., Kawamoto, Y., Kikumoto H., Impacts of inland water area changes on the local climate of Wuhan, China. Indoor Built Environ. 25(2) (2016) 296-313.
ISBN: 978-0-646-98213-7 COBEE2018-Paper288 page 878