Embed Size (px)
Citation preview
APPROVED: Bill Elieson, Co-Major Professor Gerald Knezek, Co-Major Professor Lin Lin, Committee Member Mike Spector, Chair of the Department of
Learning Technologies Herman Totten, Dean of the College of
Information Mark Wardell, Dean of the Toulouse
Graduate School
IMPACT OF VIDEO PRESENTATION FEATURES ON INSTRUCTIONAL
ACHIEVEMENT AND INTRINSIC MOTIVATION IN
SECONDARY SCHOOL LEARNERS
Ronald B. Bland, B.A., M.S.
Dissertation Prepared for the Degree of
DOCTOR OF PHILOSOPHY
UNIVERSITY OF NORTH TEXAS
December 2012
Bland, Ronald B., Impact of video presentation features on instructional
achievement and intrinsic motivation in secondary school learners. Doctor of
Philosophy (Educational Computing), December 2012, 137 pp., 7 tables, 10
figures, references, 223 titles.
This study analyzed instructional achievement and intrinsic motivation
among 21st century secondary students utilizing a video lecture incorporating
both student reaction cutaway images and immediate content interaction within
the lecture. Respondents (n = 155) were from multiple classes and grade levels
at a suburban Texas high school. Four groups of students viewed the identical
lecture with differing video and content interaction treatments. Students
responded to a pretest/posttest survey to assess academic achievement in
addition to an intrinsic motivation instrument to assess student interest.
Group one (the control group) viewed the 12 minute lecture without
enhancement. A second group viewed the identical lecture with student reaction
shots inserted in the video. Another group viewed the lecture with content
question intervention inserted into the video. The final group saw the lecture with
the student reaction shots and content question intervention combined in the
video.
A repeated measures multivariate analysis of variance (MANOVA) was
used to compare results from a 14 item pretest/posttest. Combined, the groups
showed no significance (𝑝 = .069) indicating no associations were identified by
the experiment. Although no association was identified, this may be a reflection
of the generic nature of the video lecture and the lack of association with the
experiment and actual classroom content within their courses. Students also
completed the Intrinsic Motivation Instrument which was analyzed using a
MANOVA. Although no significant findings were present in either group viewing
the student reaction or the content question interaction treatments individually,
the group viewing the combined treatment showed significance in three scales:
Interest/Enjoyment (𝑝 = .007), Perceived Competence (𝑝 = .027) and
Effort/Importance (𝑝 = .035) Recommendations for refinement of the current
experiment as well as future studies are provided.

ii
Copyright 2012
by
Ronald B. Bland

iii
ACKNOWLEDGEMENTS
I am indebted to Bill Eliesen for his knowledge, patience and helpful
feedback during this process. Without his encouragement, I might still be looking
at stacks of notes and blank paper. I also need to thank Gerald Knezek who
continually impresses with his insight. From the beginning of my master’s
program, I always hoped I could have him on my committee and I appreciate his
mentorship throughout my time at UNT. With these two gentlemen leading my
committee, it has been a truly enjoyable experience.
Thanks to Al Hemmle, Becky Thompson and all the MHS faculty for
allowing me to conduct this experiment with their classes.
I must thank my parents for always supporting me in anything I have ever
attempted and always being my biggest advocates.
Mostly, I must thank the best kids anyone could hope for, Samantha and
Christopher, for allowing me to work on my paper instead of giving them their
deserved attention. And finally, the lovely Chantel has a special place in heaven
for putting up with me. Everyone knows it and I appreciate it.
iv
TABLE OF CONTENTS
ACKNOWLEDGEMENTS ..................................................................................... iii
LIST OF TABLES ................................................................................................ vii
LIST OF FIGURES ............................................................................................. viii
CHAPTER 1: INTRODUCTION ............................................................................ 1
Description of Problem............................................................................... 1
Purpose of the Study ....................................................................... 3
Rationale ......................................................................................... 3
Video Instruction ............................................................................. 5
Response Systems ......................................................................... 7
Summary ......................................................................................... 7
Conceptual Framework .............................................................................. 9
Media Comparisons ........................................................................ 9
Video Instruction ........................................................................... 10
Response Studies ......................................................................... 12
Summary ....................................................................................... 13
Definition of Terms, Limitations, and Delimitations .................................. 13
Definition of Terms ........................................................................ 13
Limitations ..................................................................................... 15
Delimitations.................................................................................. 15
CHAPTER 2: LITERATURE REVIEW ................................................................ 17
Communicating with 21st Century Students ............................................ 17
Student’s Interest in Video ............................................................ 17
Shoot for the Target ...................................................................... 20
Communication ............................................................................. 22
The Tools of 21st Century Educators ...................................................... 26
Media Differences ......................................................................... 26
Visual Attention ............................................................................. 32
Perception Matters ........................................................................ 38
v
Video as a Learning Tool .............................................................. 41
Bloom’s Taxonomy Revised .......................................................... 51
Student Engagement in the 21st Century ..................................... 52
Peer Influence ............................................................................... 56
Immediate feedback ...................................................................... 57
Summary ................................................................................................. 59
CHAPTER 3: METHODOLOGY ......................................................................... 61
Data Source ............................................................................................. 61
Research Questions ................................................................................ 61
Video with Audience Feedback ..................................................... 62
Video with Content Question Interaction ....................................... 62
Video with Audience Feedback and Content Question Interaction ........................................................................... 62
Hypotheses .............................................................................................. 63
Hypotheses 1a .............................................................................. 63
Hypotheses 1b .............................................................................. 63
Hypotheses 2a .............................................................................. 64
Hypotheses 2b .............................................................................. 64
Hypotheses 3a .............................................................................. 64
Hypotheses 3b .............................................................................. 65
Research Design ..................................................................................... 65
Pretest/Posttest ............................................................................. 65
Intrinsic Motivation Inventory ......................................................... 65
Administration ............................................................................... 67
CHAPTER 4: RESULTS ..................................................................................... 72
Data Analysis ........................................................................................... 72
Intrinsic Motivation Inventory ................................................................... 72
Hypothesis Testing .................................................................................. 74
Test of Hypothesis 1a: Association of Instructional Achievement and a Video with Audience Reaction Scenes ............................................................................... 74
vi
Test of Hypothesis 1b: Association of Intrinsic Motivation and a Video with Audience Reaction Scenes ............................ 75
Test of Hypothesis 2a: Association of Instructional Achievement and Content Question Interaction ................. 78
Test of Hypothesis 2b: Association of Intrinsic Motivation and Content Question Interaction .............................................. 80
Test of Hypothesis 3a: Association of Instructional Achievement and a Video with Audience Reaction Scenes and Content Question Interaction .......................... 82
Test of Hypothesis 3b: Association of Intrinsic Motivation and a Video with Audience Reaction Scenes Content Question Interaction ........................................................... 83
Summary of Findings ............................................................................... 85
CHAPTER 5: SUMMARY, DISCUSSION, AND RECOMMENDATIONS ............................................................................ 89
Summary of Hypothesis Testing .............................................................. 89
Implications of Findings Regarding Instructional Achievement ................ 97
Implications of Findings Regarding Intrinsic Motivation ........................... 98
Comparison of Findings to Previous Studies ......................................... 100
Recommendations for Future Studies.................................................... 103
Regarding Instructional Achievement .......................................... 107
Regarding Intrinsic Motivation ..................................................... 108
Summary ............................................................................................... 109
REFERENCES ................................................................................................. 111
vii
LIST OF TABLES
1. The Taxonomy Table ............................................................................... 52
2. Summary of Cronbach’s Alpha for Each Scale of the Intrinsic Motivation Inventory ....................................................................................... 73
3. Scale Comparison of the Audience Reaction Group to the Control Group ............................................................................................ 77
4. Interpretation of Cohen’s d for Effect Sizes .............................................. 77
5 Scale Comparison of the Content Question Interaction Group to the Control Group................................................................................ 81
6. Scale Comparison of the Combination Audience Reaction Scenes and Content Question Interaction Group to the Control Group ............ 85
7. Summary of Hypothesis Testing .............................................................. 91
viii
LIST OF FIGURES
1. Laswell’s model of communication .......................................................... 23
2. Shannon and Weaver’s model of communication .................................... 24
3. Shramm’s model of communication ......................................................... 24
4. Strom and Strom’s shared experience chart ............................................ 26
5. A frame from the lecture capture video presentation ............................... 68
6. Visual representation of the research groups .......................................... 70
7. Visual comparison of the audience reaction group to the control group .. 75
8. Visual comparison of the content question interaction group to the control group ................................................................................. 80
9. Visual comparison of the combined audience reaction and content question interaction group to the control group ............................. 84
10. Visual comparison of the results by group ............................................... 94
1
CHAPTER 1
INTRODUCTION
Description of Problem
Twenty-first century students possess significant positive qualities and are
afforded seemingly unlimited opportunities that were not available in the recent
past. They also present unique and more complex challenges that public school
systems were forced to address in past generations. Not only are today’s
teachers faced with teaching their subjects, they must also deal with more
distractions, less attention, and conflicting motivation.
High school teachers have noticed that things are different with today’s
students. “I’ve had to change my teaching a lot recently, and I still wonder how
much they’re learning” (Healy, 1990, p. 13). “I feel like kids have one foot out the
door on whatever they’re doing—they’re incredibly easily distracted” (Healy,
1990, p. 14).
This leads to an important question. Are students not as smart as in past
years? Mean SAT scores have remained flat or shown a slight decline in recent
years, so the academic capabilities of these students remain equivalent (College
Board, 2011). Regardless, something about today’s high school students has
changed.
There is one thing you know for sure: These kids are different. They study, work, write, and interact with each other in ways that are very different
2
from the ways that you did growing up. They read blogs rather than newspapers. They often meet each other online before they meet in person. They probably don’t even know what a library card looks like, much less have one; and if they do, they’ve probably never used it. They get their music online—often for free, illegally—rather than buying it in record stores. They’re more likely to send an instant message (IM) than to pick up the telephone to arrange a date later in the afternoon. They adopt and pal around with virtual Neopets online instead of pound puppies. And they’re connected to one another by a common culture. Major aspects of their lives—social interactions, friendships, civic activities—are mediated by digital technologies. And they’ve never known any other way of life. (Palfrey & Gasser, 2008, p. 2)
A recent Kaiser Foundation study found that young people 8 to 18 years
old watch television or videos an average of four hours daily while averaging an
additional fifty minutes every day playing video games (Small & Vorgon, 2008).
While some of the productions viewed are amateur in origin, the rapid-fire,
graphic-laden, professional techniques used in network programming and
advertising are the standard against which students view educational videos.
In other research regarding today’s youth, Yahoo Finance (2012) reported,
“In order to keep Digital Natives engaged, content creators and marketers will
need to think differently” ( para 3).
However, the infrastructure of public education has remained
fundamentally unchanged since its creation in the “era when more than 90% of
young people still lived on farms or in rural areas” (Kelly, McCain, & Jukes, 2009,
p. 3).
This is why engaging today’s students remains a constant concern for
educators in a system designed for a different era (Bellanca & Brandt, 2010;
3
Jukes, McCain, & Crockett, 2010; Kelly et al., 2009; Small & Vorgon, 2008;
Strom & Strom, 2009; Tapscott, 2008).
Purpose of the Study
The current study addresses a multi-faceted question of the potential use
of video instruction to reach and facilitate learning for today’s high school
students. The inclusion of audience reaction scenes, student interaction, and
combinations of the two are evaluated as to their ability to improve recall, student
motivation, and interest.
The primary question of interest for the current study is: Among high
school students, is there any association between instructional achievement and
the use of video with audience reaction scenes, video with student interaction,
and/or video with audience reaction scenes and student interaction.
Rationale
Remember the interest the Titanic rekindled as the 100th anniversary of its
sinking approached? In the days before the anniversary, a Wall Street Journal
article addressed a myth about the disaster. The ship was fitted with lifeboats for
less than half of the passengers not because of aesthetics or costs as claimed in
some books or films. Rather, testimony revealed that Titanic carried 25% more
lifeboats than maritime laws required. The regulations had not been modernized
since being written in a different era for significantly smaller ships (Berg, 2012).
Similarly, numerous books litter the bookshelf—Teaching the Digital
Generation, Born Digital, Adolescents in the Internet Age, grown up digital,
4
iBrain, Understanding the Digital Generation, 21st Century Skills: Rethinking How
Students Learn—all predicting problems with an educational system designed in
a different era for significantly dissimilar students (Bellanca & Brandt, 2010;
Jukes et al., 2010; Kelly et al., 2009; Palfrey & Gasser, 2008; Small & Vorgon,
2008; Strom & Strom, 2009; Tapscott, 2008).
In just the past decade, “the United States has fallen further behind on
international assessments of student learning” (Darling-Hammond & McCloskey,
2012, p. 1). “In 2006, the U.S. ranked 35th among the top 40 countries in
mathematics and 31st in science, a decline in both raw scores and rankings from
3 years earlier (Institute of Education Sciences, 2007)” (as cited in Darling-
Hammond & McCloskey, 2012, p. 1).
This gives credibility to the theory that students and their environment
have changed, but are schools prepared to adapt as well? “The learning styles
of today’s digital kids are significantly different than those for whom our high
schools were originally designed” (Kelly, et al., 2009, p. 9). “In fact, they are so
different from us that we can no longer use either our 20th century knowledge or
our training as a guide to what is best for them educationally” (Prensky, 2006, p.
9).
The problem is clear. Even though student engagement is an
acknowledged key component in effective learning, students are still dropping out
of school because it’s “boring” (Haag, 2012, p. 1B; Marzano & Pickering, 2011).
5
Medina (2008) identifies the dilemma, “We don’t pay attention to boring things”
(p. 71).
An essential element to effective communication is an overlapping area of
commonality so that the message being transmitted may be understood
(Schramm, 1973). Teachers must continue to evolve, just as business leaders,
public speakers, and countless other professionals have learned, and adapt to
the current audience.
If teenagers enjoy using technology and media, would not teachers be
more effective to respect, and possibly embrace, this motivation? Indeed,
teachers and students will both grow through reciprocal learning (Strom & Strom,
2009).
Hobbs (2011) summarizes the current environment, “Make no mistake
about it: using popular culture, mass media, and digital media motivates and
engages students. And students need to be motivated and engaged—genuine
learning simply doesn’t happen without it” (p. 6).
Video Instruction
Studies have shown that video can be an effective tool for learning
(Schmidt & Anderson, 2007; West, Farmer, & Wolff, 1991). In fact, today’s
students may prefer to watch a video online or on their phone, giving them a
sense of one-to-one communication rather than listen to a lecture in a live
setting. Sal Khan, creator of hundreds of video-based lessons, said, “I’ve gotten
6
a lot of feedback. It really does feel like I’m sitting next to the person and we’re
looking at the paper together” (Gupta & Cetta, 2012).
A report from the U.S. Department of Education (Means, Toyama,
Murphy, Bakia, & Jones, 2010) “suggests that online delivery of material leads to
improvements in student outcomes relative to live delivery, with hybrid live-plus-
Internet delivery having the largest benefits of all” (Figlio, Rush, & Yin, 2010, p.
3).
Lecture capture can also be an effective use of video instruction.
Students may replay the recordings at their convenience to better understand
difficult concepts, review for exams, or stay up-to-date while absent (Gosper et
al., 2007; Odhabi & Nicks-McCaleb, 2011; Toppin, 2011; Wieling & Hofman,
2010).
Research has shown both high student perceptions of positive learning
experiences using this technology, as well as higher scores (Day, Burn, &
Gerdes, 2009; Goldbert & McKhann, 2000; Gosper et al., 2007; McElroy, 2006;
Soong, Chan, Cheers, & Hu, 2006).
In contrast to the lecture review, the pre-lesson or the flip model of
instruction has received recent attention. This process moves fact gathering and
lectures online for students to study before coming to class, which allows class
time to be spent on hands-on learning, with more robust discussions, and in-
depth activities (Sparks, 2011). The flip model expands the time for collaboration
which, along with the video, appeals to today’s students (Gupta & Cetta, 2012).
7
Response Systems
Dewey (1916) wrote that people learn by doing and learning should be an
active experience. In this context, “doing” in a classroom setting may be as
simple as holding up colored cards (Kelhum, Carr, & Dozier, 2001). Electronic
versions of these response systems—known as clickers, classroom response
systems, personal response systems or two dozen other labels—help maintain
student attention, provide the opportunity for immediate remediation, and allow
full interaction with the instructor (Heward, 1978; Kay & LeSage, 2009). Online
classes may be programmed to allow for similar benefits.
Recent studies indicate that students consider these systems useful for
their own understanding of subject matter and enjoy using them (Abrahamson,
1999; Judson & Sawada, 2002). But “beyond discovering that students both
enjoy and value the use of an electronic response system, the issue of
instructional achievement remains open” (Judson & Sawada, 2002, p. 175).
Limited studies in the high school setting have returned similar results (Barnes,
2008).
Fies and Marshall (2006) agree, “Missing from current CRS [classroom
response systems] research reports are tightly controlled comparisons in which
the only difference is the use, or lack of use, of a CRS” (p. 106).
Summary
Today’s students are bred to be more media savvy, with shorter attention
spans, than students in past generations. To effectively teach high school
8
students, teachers must employ tools and techniques that appeal to their
environmentally-influenced minds.
The purpose of the present study is to examine both the signals in the
video presentation and the attention triggered by the response system to
ascertain the effect on current high school students. The goal is to simply
determine the best presentation method of the medium when consumed by
today’s high school students. If it is confirmed that student perceptions, attention
and/or learning are increased by including a few easily-inserted audience
reaction clips, or strategically inserted questions, would not we all benefit by
including these elements in high school lessons?
Conceptual Framework
Media Comparisons
A century has passed since Thorndike (1912) wrote that instructional
media should be used in the classroom. Whether media can influence learning
has not received much debate as most agree with Gagné (1965) who stated
“most instructional functions can be performed by most media” (p. 364).
Schramm (1977) reached a similar conclusion stating, “We have plentiful
evidence that people learn from the media, but very little evidence as to which
medium, in a given situation, can bring about the most learning” (p. 43).
Over the years, there have been dozens of studies comparing student
learning from one medium to another. The majority has found that most students
learn comparably no matter the media (Clark, 1983, 1994; Cobb, 1997;
9
Schramm, 1977). The studies, enough to fill its own book, have “started to go
round in circles” (Cobb, 1997, p. 21).
Since the discussion seems unproductive, others suggest the question
should be altered (Briggs, 1977). Morrison (1994) wrote, “It seems more
productive to consider the effectiveness of the whole unit of instruction rather
than the individual components” (p. 42).
Jonassen, Campbell and Davidson (1994) warned, “The debate between
Kozma and Clark, which focuses on the relative importance of media attributes
vs. instructional methods, is the wrong issue to debate” (p. 31). They added,
“Clark believes that learning is situated in the instructional methods that
manipulate learner processing. Kozma accommodates the role of context in
learning and knowledge construction but still focuses only on context delivered
through the media, ignoring media within the learning context” (p. 32). They
conclude by stating, “The more important debate is not about the relative efficacy
of instructional components as much as it is the role of learner and the context of
learning” (p. 32).
The present study concurs with the more recent articles on media study in
that it seeks no comparison between the effectiveness of video instruction and
other media but seeks to find a correlation between the high school learner and
video instruction.
10
Video Instruction
Several studies have concluded that visual attention is associated, either
positively or negatively, through use of formal features (Alwitt, Anderson, Lorch,
& Levin, 1980; Anderson & Lorch, 1983; Campbell, Wright, & Huston, 1987; Watt
& Welch, 1982; Williams, 1981). Some of the features associated with continual
viewing are visual effects, cuts, pans, and visual movement (Anderson, Alwitt,
Lorch, & Levin, 1979).
Huston and Wright (1983) found that children make feature-content
associations based upon their experiences with the medium to alert them to
upcoming content. These associations act as clues about how much mental
processing effort to exert, which influences storage and recall of content.
Salomon (1979) provided evidence that comprehension is affected by the use of
familiar formal features.
Baggaley and Duck (1976) conducted a series of experiments employing
video instruction. Each experiment compared two cameras recording exactly the
same presentation, but with slightly differing perspectives. When a speaker’s
notes were included in the framing, the audience found the speaker “more
confusing” (p. 88) than the same presentation framed without the notes. When
the speaker was photographed in front of an electronically generated background
scene, he was found to be “more reliable” (p. 90) than when he gave the same
lecture in front of a blank background. Another study captured a speaker looking
directly into the camera while the other viewed the speaker from a 45-degree

11
angle as though engaged in a discussion. All questions produced more
favorable ratings of the angled view, even though sometimes not statistically
significant.
The most significant results were obtained from a study using audience
reaction shots intercut with the presentation. One group viewed a presentation
with students engaged and attentive. The second saw the same students, but
this time expressing disinterest and doodling. “By far the most significant finding
in this respect is that in the negative tape the lecturer was seen as more
confusing, more shallow and more inexpert” (Baggaley & Duck, 1976, p. 95).
So will the cutaways involving positive student reactions constitute a video
feature that will increase attention? Huston et al. (1981) found it does, “Form
may be of interest to audiences independently of content and may communicate
information beyond that explicitly contained in content messages” (p. 33).
Baggaley and Duck (1976) agreed stating, “visual cues quite irrelevant to
a performance may unwittingly affect judgments of it” (p. 86). The concluded,
“the simple visual imagery of a television production may actually dominate its
verbal content, overriding audience reactions to it in several ways” (p. 105).
And how important is perception? Consider the Dr. Fox study. A
professional actor was coached to present an elaborate lecture, including a
question and answer session, to a group of faculty and graduate students.
Armed with an impressive vita, he was highly evaluated and fully believable by
those that heard him speak (Naftulin, Ware, & Donnelly, 1973).
12
Response Studies
Roschelle, Penuel, and Abrahamson (2004) summarized 26 studies using
response systems in math, chemistry and the humanities.
These ranged from promoting greater student engagement (16 studies),
increasing understanding of complex subject matter (11 studies), increasing
interest and enjoyment of class (7 studies), promoting discussion and interactivity
(6 studies), helping students gauge their own level of understanding (5 studies),
teachers having better awareness of student difficulties (4 studies), extending
material to be covered beyond class time (2 studies), improving quality of
questions asked (1 study), and overcoming shyness (1 study) (Abrahamson,
2006; Roschelle et al., 2004).
Two medical education experiments looked specifically at achievement
and found positive results. In these experiments, Pradhan, Sparano, and Ananth
(2005) tested two groups of residents. One group received a typical lecture while
the second group heard the same lecture utilizing a response system. A pre-
test/post-test was assessed and the improvement from the interactive students
was almost 20% greater than the lecture-only group. The total number of
students in both groups was 17. Schackow and Loya (2004, p. 503) used similar
methodology and found a similar significant difference. Their conclusion stated,
At least two plausible explanations for these results exist: (1) improved retention occurs with active participation in the lecture process and (2) improved retention occurs when key learning points are highlighted prior to testing.
13
Summary
The present study examines the concepts of video instruction, its appeal
and instructional value to current high school students. Secondly, response
questions were interspersed within the presentations to increase active attention
and participation in the lesson while increasing subject retention.
Definition of Terms, Limitations, and Delimitations
Definition of Terms
Digital Natives/Digital Immigrants
Digital natives refer to today’s students. “They are native speakers of
technology, fluent in the digital language of computers, video games, and the
Internet” (Prensky, 2006, p. 9). Those not born into the digital world are referred
to as digital immigrants. “We have adopted many aspects if the technology but
just like those who learn another language later in life, we retain an ‘accent’
because we still have one foot in the past” (Prensky, 2006, p. 9).
Engagement
Student engagement is “the attention, interest, investment and effort
students expend in the work of learning” (Marks, 2000, p. 155).
Formal Features
Formal features of television are attributes or characteristics of the
medium such as animation, eye contact, high action, scene variability, camera
14
zooms, cuts and dissolves, special visual effects, music, sound effects. Items,
which are independent of the program content (Zettl, 2005).
Motivation
“To be motivated means to be moved to do something. A person who
feels no impetus or inspiration to act is thus characterized as unmotivated,
whereas someone who is energized or activated toward an end is considered
motivated” (Ryan & Deci, 2000, p. 54).
“Intrinsic motivation is defined as the doing of an activity for its inherent
satisfactions rather and for some separable consequence” (Ryan & Deci, 2000,
p. 56).
“Extrinsic motivation is a construct that pertains whenever an activity is
done in order to attain some separable outcome” (Ryan & Deci, 2000, p. 60).
Peer Pressure
Peer pressure has been defined as “when people your own age
encourage you to do something or keep from doing something else, no matter if
you personally want to or not” (Brown, Clasen, & Eicher, 1986, p. 522).
Television versus Video
The terms television and video are used interchangeably in the
manuscript. Merriam-Webster (2012) lists several definitions for television, one
of which is “television as a means of communication” (para 3b). Video is defined
simply as “television” (para 1). The choice of term appears to be chronology-
based. More recent writings use video, while older works cite television. With
15
either term, the reference is to the visual content and characteristics of the
communication piece rather than the physical device.
Limitations
The video recording is a lecture presented by a member of the faculty at
the high school being studied. While no member of the respondent group was a
student in this teacher’s classroom, it should be assumed that some of the
population may be aware of the teacher’s identity. Likewise, some of the
students appearing in the video may be familiar to the respondents; however,
none of the students involved are from the same class as the respondents.
Many of the respondents are minors so parental permission was required
before inclusion into the study. It is unknown how many parents denied
permission but this could affect the bias of the respondents.
The current study relies on some self-report data, which may not provide
completely accurate data. Bias may appear since self-report responses “depend
on participants to truthfully and accurately report on their attitudes and
characteristics” (Doyle, 2004, p.3). This does not always happen. “For example,
some respondents may deliberately answer questions incorrectly or flippantly”
(Doyle, 2004, p. 3).
Delimitations
The current study is restricted only to video instruction with audience
reaction clips and student interaction. The interaction was via computer

16
response. Respondents were assigned to each treatment by computer-
generated random groupings.
17
CHAPTER 2
LITERATURE REVIEW
Communicating with 21st Century Students
Student’s Interest in Video
To be effective at most things, we adapt our behavior to the context.
Whether it is climate, language, culture, or any number of other areas, we act,
dress, and speak according to our surroundings. This is evidenced by a student’s
nonschool world, which provides the context, or surroundings, that shape them; a
world that is filled with new technologies, new tools and their new normal
(Valkenburg, 2004). Today’s kids “are using media and technology from before
breakfast until bedtime and beyond” (Hobbs, 2011, p. 7). “The socialization,
learning, health, and lifestyle of today’s teenagers are distinctive because of their
access to the Internet, cell phones, computers, wireless organizers, iPods, and
satellite television” (Strom & Strom, 2009, p. xv). We are in a “new era, which
might be called the age of personal or participatory media” (Kluth, 2006, p. 3).
The course from childhood, through adolescence on into adulthood that
once was an ostensibly distinct process, is now a blur. Culture critics and child
psychologists have observed that the “phenomenon of childhood is disappearing”
(p. 4) rather children are being treated as small adults (Valkenburg, 2004).
Consider the effect Sesame Street had on how kids thought in the past, and then
18
try to imagine what the visual bombardment of simultaneous images, text and
sounds is having on today’s students (Jukes et al., 2010). “What used to be
simply a generation gap that separated young people’s values, music and habits
from those of their parents has now become a huge divide resulting in two
separate cultures” (Small & Vorgon, 2008, p. 3).
A Pew Internet & American Life Project found that 93% of American teens
use the Internet and 38% of American teens typically create and share their own
artwork, photos, stories or videos online (Pew Research Center, 2011). “The old
media model was: there is one source of truth. The new media model is: there
are multiple sources of truth, and we will sort it out” (Kluth, 2006, p. 5).
One example of our changing environment is the fact that YouTube didn’t
exist until 2005. Today, an hour of video is uploaded to YouTube every second
in the day (Grossman, 2012, p. 40).
But is this a problem? Tapscott said the current environment is an
advantage. “While there is much controversy, the early evidence suggests that
the digital immersion has a tangible, positive impact… The Net Gen mind seems
to be incredibly flexible, adaptable and multimedia savvy” (Tapscott, 2008, p. 98).
Prensky introduced the digital natives debate a decade ago. He proposed
that young people’s actual cognitive process has been altered by the
environment and other researchers agree (Fenley, 2010; Prensky, 2001). In fact,
with just one generation of exposure to current digital stimuli, research shows
young people’s brains are actually neurologically wired differently than previous

19
generations (Jukes et al., 2010; Small & Vorgon, 2008). Prensky (2001) stated,
“It is now clear that as a result of this ubiquitous environment and the sheer
volume of their interaction with it, today’s students think and process information
fundamentally differently from their predecessors” (p. 1). Kelly et al. (2009)
agreed, “[Students] actually think differently than older people who did not grow
up in the digital environment” (p. 5).
Some have countered this belief, asserting digital natives arguments are
based on “sweeping generalizations” (Brumberger, 2011, p. 20) and “have been
subjected to little critical scrutiny” (Bennett, Maton, & Kervin, 2008, p. 776).
While Kennedy et al. (2009) agree that while the technology use among teens is
high, “they don’t necessarily want or expect to use these technologies to support
some activities, including learning” (p. 5).
There can be no disagreement that today’s environment forces young
people to deal with myriad visual stimuli at a rapid-fire pace, unparalleled in
history (Healy, 1990; Lemke, 2010). Teens are sophisticated audiences, dealing
with a sensory-rich world full of color, sound graphics, and video (Butler, 2010).
“This is especially the case in terms of visual information: kids are more visually
oriented” (Kelly et al., 2009, p. 16). Weigel, Straughn, and Gardner (2010)
reported, “Students today are increasingly ‘keyed to the visual’” (p. 10), while
Coats (2007) argued they are “the most visual of all learning cohorts” (p. 126).
Tapscott (2008) simply called them “visual experts” (p. 106).
20
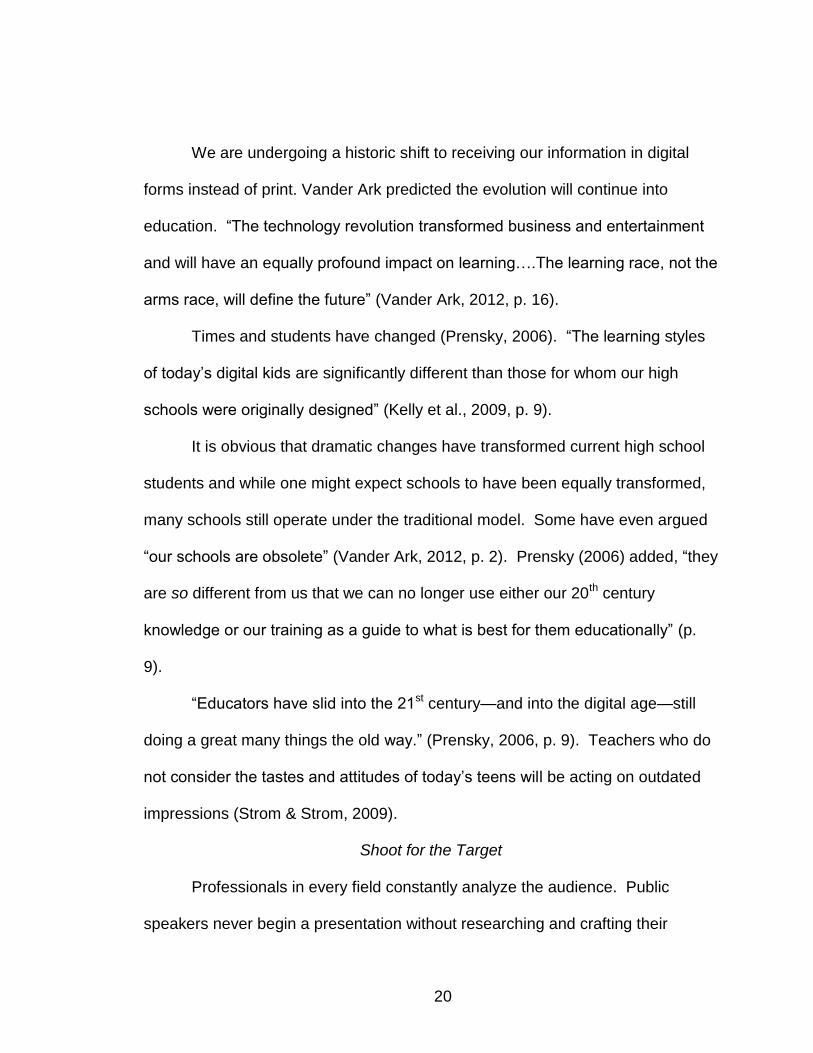
We are undergoing a historic shift to receiving our information in digital
forms instead of print. Vander Ark predicted the evolution will continue into
education. “The technology revolution transformed business and entertainment
and will have an equally profound impact on learning….The learning race, not the
arms race, will define the future” (Vander Ark, 2012, p. 16).
Times and students have changed (Prensky, 2006). “The learning styles
of today’s digital kids are significantly different than those for whom our high
schools were originally designed” (Kelly et al., 2009, p. 9).
It is obvious that dramatic changes have transformed current high school
students and while one might expect schools to have been equally transformed,
many schools still operate under the traditional model. Some have even argued
“our schools are obsolete” (Vander Ark, 2012, p. 2). Prensky (2006) added, “they
are so different from us that we can no longer use either our 20th century
knowledge or our training as a guide to what is best for them educationally” (p.
9).
“Educators have slid into the 21st century—and into the digital age—still
doing a great many things the old way.” (Prensky, 2006, p. 9). Teachers who do
not consider the tastes and attitudes of today’s teens will be acting on outdated
impressions (Strom & Strom, 2009).
Shoot for the Target
Professionals in every field constantly analyze the audience. Public
speakers never begin a presentation without researching and crafting their
21
message for a particular audience. Retailers carefully analyze what products to
stock and how they should be displayed in an attempt to gain the upmost
response from their target audience. Even young people, almost always, use
manners never previously demonstrated when meeting the parents of their
friends.
In almost every profession and instance of personal communication, we
attempt to fit into our surroundings, but can that be said of the institution of public
education? We know that “teenagers enjoy using tools of technology” (Strom &
Strom, 2009, p. xvi). If this motivation were respected, schools would be more
effective. (Strom & Strom, 2009). Today’s students are not the same as those
who sat through lectures and followed basic instructions in past generations.
New kinds of learners are emerging.
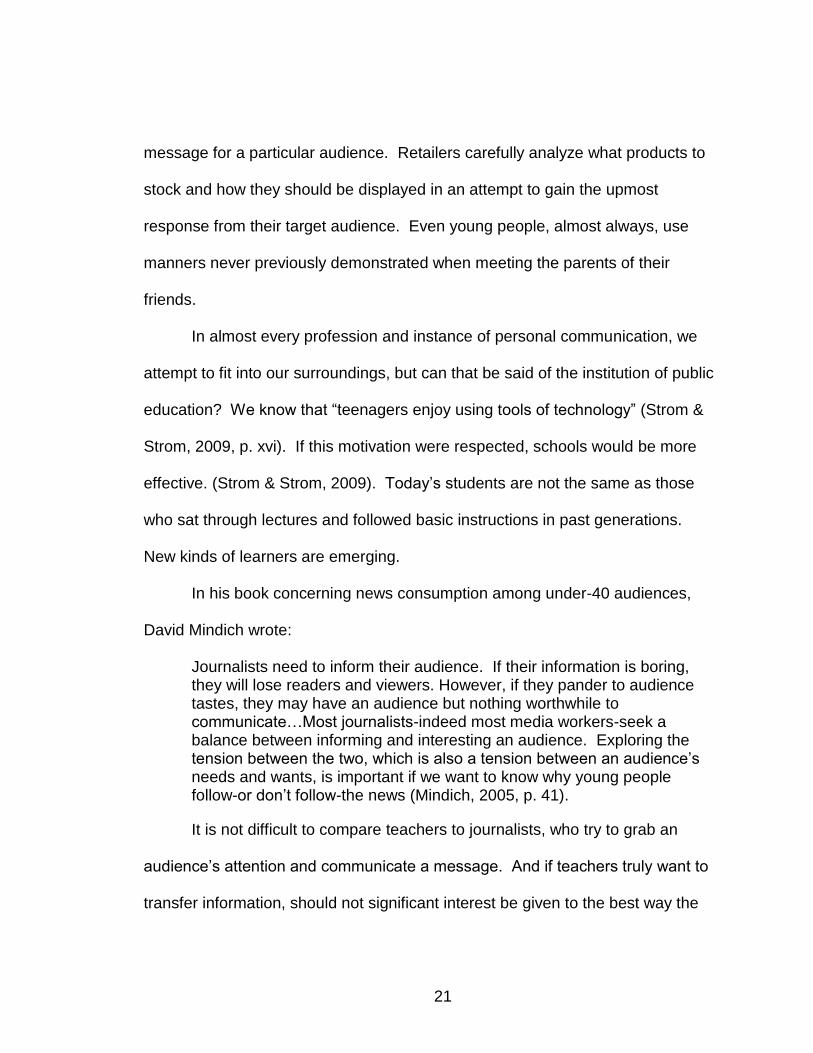
In his book concerning news consumption among under-40 audiences,
David Mindich wrote:
Journalists need to inform their audience. If their information is boring, they will lose readers and viewers. However, if they pander to audience tastes, they may have an audience but nothing worthwhile to communicate…Most journalists-indeed most media workers-seek a balance between informing and interesting an audience. Exploring the tension between the two, which is also a tension between an audience’s needs and wants, is important if we want to know why young people follow-or don’t follow-the news (Mindich, 2005, p. 41).
It is not difficult to compare teachers to journalists, who try to grab an
audience’s attention and communicate a message. And if teachers truly want to
transfer information, should not significant interest be given to the best way the
22
students want to receive that information? Mindich issued a warning, “news
outlets that ignore ‘want’ do so at their own peril” (2005, p. 47).
Teachers should always consider the audience and the conditioning of
that audience when preparing any instructional material. Well-designed
instruction, aids the transfer of knowledge (Perkins & Salomon, 1988). One of
the many issues facing teachers is how to reach today’s students.
Highly motivated learners will learn, regardless of the quality of the learning experience. Similarly, unmotivated learners are a challenge even for the best teachers. But the more you can consider your learners’ attitudes and motivations, the better you can tailor the learning experience. (Dirksen, 2012, p. 28)
“What we see, and how we see it, and what it means to us is focused,
concentrated, and conditioned by our cultural connections” (Bisplinghoff, 1994, p.
341). Our “reality,” (p. 341) according to Bisplinghoff (1994), is learned by
“growing up in a particular culture and absorbing its rules…”
All communication, including learning, is based on more than an individual’s perceptions at the time that communication is taking place. Perception can be very subjective, and it is constantly changing. We rely on our senses to provide us with data; we rely on our experiences, thoughts, and values to organize, interpret, and explain what we see, hear, taste, touch, and smell. (Stern & Robinson, 1994, p. 32)
Strom and Strom (2009) found schools are not addressing the civilization
of today’s students. “Many [students] claim a disconnect between life online after
school hours and methods of learning used in classrooms” (p. 70).
Communication
Obviously, students should not be given undue authority, however if
teachers and students share the same building for dozens of hours each week,
23
should not an effective level of communication be present? Just like traveling to
a different culture, communication between two divergent parties may require
deliberation.
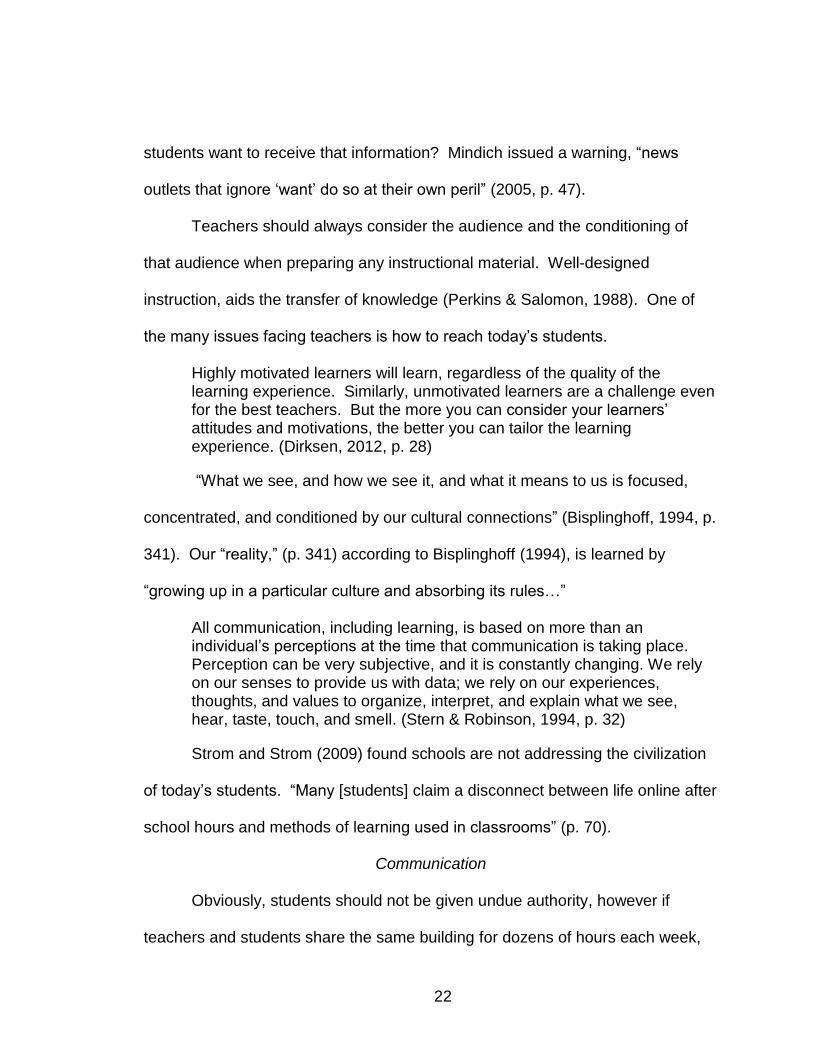
Laswell was quite possibly the first to present the basic elements of
communication in his famous sentence: “Who says what in which channel to
whom with what effect” (Laswell, 1948, p. 37)?
Figure 1. Laswell’s model of communication Adapted from “Communication Models,” by F. Wisely, in Visual Literacy: A Spectrum of Visual Learning by D. Moore and F. Dwyer, 1994, p. 89. Copyright 1994 by Educational Technology Publications.
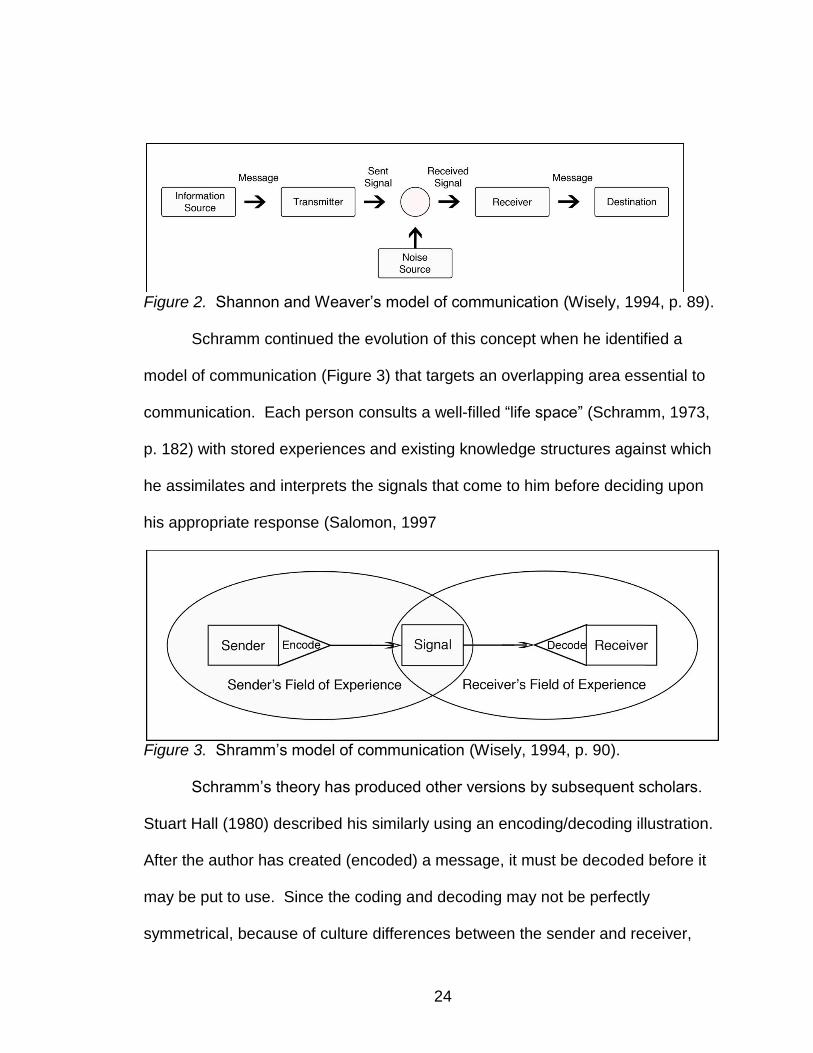
Shannon and Weaver (1949) introduced their mathematical model (Figure
2) around the same time. Their model, focused on the field of
telecommunications, is primarily directed at the channels of communication
between the sender and the receiver. They introduced the “noise source” as a
reason for failed communication—meaning “the message arriving at the
destination is not the exact one sent from the information source” (Wisely, 1994,
p. 89).
24
Figure 2. Shannon and Weaver’s model of communication (Wisely, 1994, p. 89).
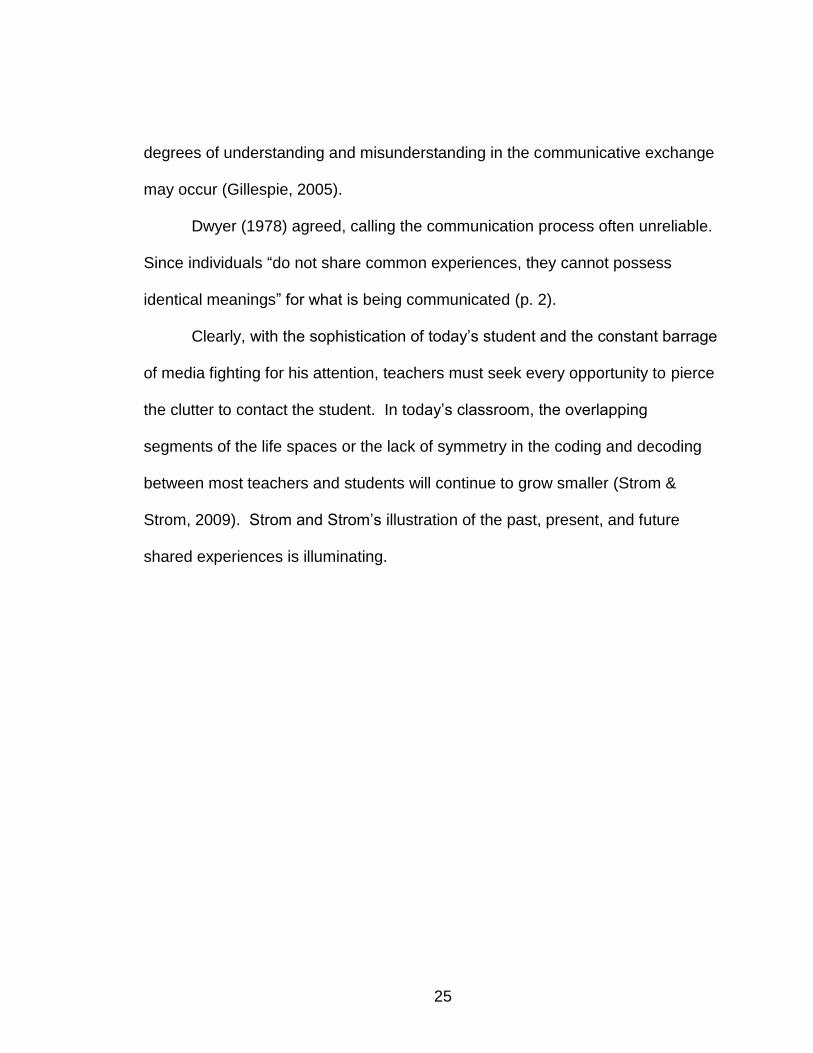
Schramm continued the evolution of this concept when he identified a
model of communication (Figure 3) that targets an overlapping area essential to
communication. Each person consults a well-filled “life space” (Schramm, 1973,
p. 182) with stored experiences and existing knowledge structures against which
he assimilates and interprets the signals that come to him before deciding upon
his appropriate response (Salomon, 1997
Figure 3. Shramm’s model of communication (Wisely, 1994, p. 90).
Schramm’s theory has produced other versions by subsequent scholars.
Stuart Hall (1980) described his similarly using an encoding/decoding illustration.
After the author has created (encoded) a message, it must be decoded before it
may be put to use. Since the coding and decoding may not be perfectly
symmetrical, because of culture differences between the sender and receiver,
25
degrees of understanding and misunderstanding in the communicative exchange
may occur (Gillespie, 2005).
Dwyer (1978) agreed, calling the communication process often unreliable.
Since individuals “do not share common experiences, they cannot possess
identical meanings” for what is being communicated (p. 2).
Clearly, with the sophistication of today’s student and the constant barrage
of media fighting for his attention, teachers must seek every opportunity to pierce
the clutter to contact the student. In today’s classroom, the overlapping
segments of the life spaces or the lack of symmetry in the coding and decoding
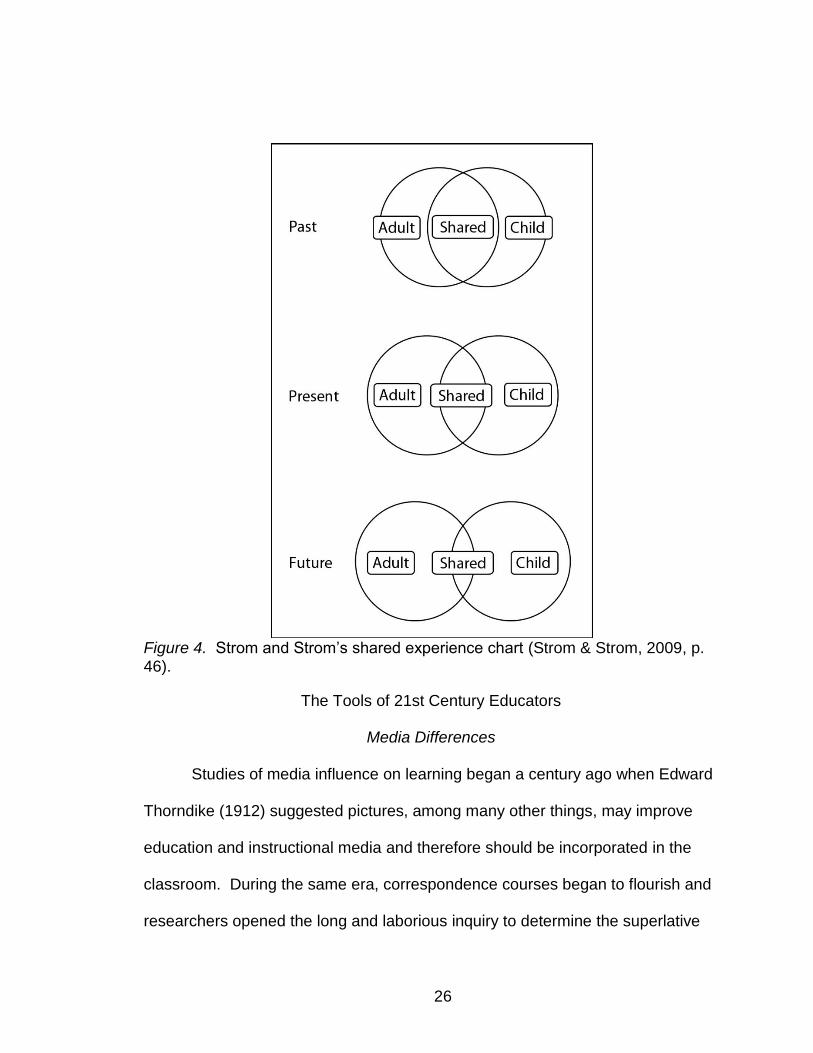
between most teachers and students will continue to grow smaller (Strom &
Strom, 2009). Strom and Strom’s illustration of the past, present, and future
shared experiences is illuminating.
26
Figure 4. Strom and Strom’s shared experience chart (Strom & Strom, 2009, p. 46).
The Tools of 21st Century Educators
Media Differences
Studies of media influence on learning began a century ago when Edward
Thorndike (1912) suggested pictures, among many other things, may improve
education and instructional media and therefore should be incorporated in the
classroom. During the same era, correspondence courses began to flourish and
researchers opened the long and laborious inquiry to determine the superlative

27
media for education. In those studies, researchers compared student outcomes
for lessons that are delivered through two different media, searching for the
superior method of teaching effectiveness (Conger, 2005).
Gagné (1965) summarized the findings from early studies stating, “most
instructional functions can be performed by most media” (p. 364). Schramm
(1977) reached a similar conclusion stating, “we have plentiful evidence that
people learn from the media, but very little evidence as to which medium, in a
given situation, can bring about the most learning” (p. 43).
In 1974, Olson wrote
Perhaps the function of the new media is not primarily that of providing more effective means for conveying the kinds of information evolved in the last five hundred years of book or literate culture, but rather that of using the new media as a means of exploring and representing our experience in ways that parallel those involved in that literate culture (p. 8).
A decade later, the “gloves came off” when Richard Clark (1983)
published the argument that media are “mere vehicles that deliver instruction but
do not influence student achievement any more than the truck that delivers our
groceries causes changes in our nutrition” (p. 445). Even in studies that show
learning has taken place; Clark’s position was that the medium itself had no
effect on the outcome. If there are differences in learning outcomes, they appear
because the instruction itself was changed to suit the medium (Clark, 1983). He
does not classify attributes as variables in media theory “because they are
neither necessary or unique to a particular medium” (Kozma, 1994, p. 13).
28
Kozma (1991) countered Clark’s argument by reporting that some
students will learn regardless of the delivery device, but “others will be able to
take advantage of a particular medium’s characteristics to help construct
knowledge” (p. 205). Television, he said, “differs in several ways from books that
may affect cognitive structures and processes” (p. 189). Kozma took the holistic
approach that media and method have an “integral relationship; both are part of
the design” (p. 205).
In 1994, Kozma reframed the question, “the appropriate question is not do
but will media influence learning” (p. 7)?
If there is no relationship between media and learning it may be because we have not yet made one. If we do not understand the potential relationship between media and learning, quite likely one will not be made. And finally, if we preclude consideration of a relationship in our theory and research by conceptualizing media as “mere vehicles,” we are likely to never understand the potential for such a relationship (Kozma, 1994, p. 7).
Specifically, to understand the role of media in learning we must ground a theory of media in the cognitive and social process by which knowledge is constructed, we must define media in ways that are compatible and complementary with these processes, we must conduct research on the mechanisms by which characteristics of media might interact with and influence these processes, and we must design our interventions in ways that embed media in these processes (Kozma, 1994, p. 8).
Clark (1994) replied simply, “When a study demonstrates that media
attributes are sufficient to cause learning, the study has failed to control for
instructional method and is therefore confounded” (p. 25). Clark believed that
media comparison studies are a non-argument since a valid research approach
is impossible given that the lesson has to be changed because of the media and
therefore has to be a variable. Others suggested that comparing media should

29
not be done with such a narrow view because the lesson should be adapted to
the media. Ludwig von Bertalanffy (1965) stated, “If the meaning of Goethe’s
Faust, or Van Gogh’s landscapes, or Bach’s Art of the Fugue could be
transmitted in discursive terms, their authors should and would not have
bothered to write poems, paint, or compose, but would rather have written
scientific treatises” (p. 41).
In fact, this particular issue has provided fodder to educational
researchers so frequently that a book, The No Significant Difference
Phenomenon, (Russell, 2001) was compiled on the topic. The book spans 89
pages simply listing the vital information from each study with a brief summary
quote. The collection shows that most studies have found no significant
difference in student outcomes when the independent variable was the method of
course delivery. (Russell, 2001, 2012). Other studies simply found that most
students learn comparably no matter the media (Clark, 1983, 1994; Cobb, 1997;
Schramm, 1977).
At the onset of the media argument, Salomon and Gardner (1986) warned
to avoid the sins of the past and made clear their opinion of the Clark versus
Kozma debate.
It is a well-known observation that each new medium of communication begins its life by first adopting the contents and formats of the media it is likely to replace or modify. A similar pattern apparently exists among researchers who often welcome a new medium, technology, or instructional innovation by posing some of the questions addressed at its predecessor, even when those questions have already proved to be unanswerable, naïve, or uninstructive. Some of the current research on computers in education is in danger of falling into this category. It tends to
30
move into the same cul de sacs, to be based on similarly naïve assumptions and to yield the same uninstructive findings as did much of the past research on television and instruction (e.g., Clark, 1985) (p. 13).
Over the years, two camps emerged. One interpretation held that the use
of technology to deliver courses did not harm—meaning face-to-face learning
had no inherent advantage over distance education course delivery. The other
interpretation was that technology did not help—thus if a course could be
delivered without technology, there was no need for technology use at all
(Conger, 2005).
While the Clark/Kozma argument “started to go round in circles,” (Cobb,
1997, p. 21) alternative topics in media studies gained more attention. Morrison
(1994) suggested that efforts would be “more productive to consider the
effectiveness of the whole unit of instruction rather than the individual
components” (p. 42). This echoed Briggs (1977) who proposed that researchers
should compare the final version of instruction with an alternate form if available
to determine its effectiveness.
Salomon, Perkins, and Globerson (1991) wrote the debate should focus
on the effects of learning with technology instead of the effects of technology.
Jonassen et al. (1994) agreed, “This debate should focus less on media
attributes vs. instructional methods and more on the role of media in supporting,
not controlling the learning process” (p. 31).

31
Cobb (1997) took the direct approach, “There are clearly many media for
any instructional job, but this does not mean they all do it at the same level of
efficiency—whether economic, logistic, social, or cognitive” (p. 33).
And Gavriel Salomon (1997) stated that each media brings a unique
experience.
Indeed, daily observations suggest that each form of representation is uniquely capable of selecting, packaging, transmitting, and conveying its own information in its own way, thereby affording a unique experience. Viewing Meryl Streep in the film Out of Africa is a rather different experience from reading the novel, which provides an entirely different experience from, say, listening to an African storyteller or actually wandering through Kenya’s open spaces (p. 378).
Likewise, television scholar Herbert Zettl (2005) found little differentiation
between content and medium.
The well-known communication scholar Marshall McLuhan (1994) proclaimed more than four decades ago that ‘the medium is the message’. With this insightful overstatement, he meant that the medium, such as television or film, occupies an important position not only in distributing the message but also in shaping it.
Despite overwhelming evidence of how important the media are in shaping the message, many prominent communication researchers still remain more interested in analyzing the content of the literal message than in the combined effect of the message and the medium as a structural agent. In their effort to keep anything from contaminating their examination of mass-communicated content, they consider the various media as merely neutral channels through which the all-important messages are distributed (Zettl, 2005, p. 11).
Does instructional technology produce a significant difference in learning
outcomes? Little has been learned recently to alter the writings of past scholars.
“A significant number of criticisms related to media research have
complicated data interpretation and frustrated any attempts to derive broad

32
generalizations useful to practitioners in their classroom use of media” (Dwyer,
1978, p. 59).
In 1977 Schramm wrote, “How a medium is used may therefore be more
important than the choice of media” (p. 273).
While Salomon (1979) lamented, “After more than a half century of
research, our conceptions of media are still fuzzy, and our understanding of their
unique potentialities is still inadequate” (p. 4).
“Technology can make education more productive, individual, and
powerful, making learning more immediate; give instruction a more scientific
base; and make access to education more equal” (To improve learning, 1970, p.
7). “Yet it is an indictment of our present state of knowledge that we know
neither how to assess the psychological effects of these technologies nor how to
adapt them to the purpose of education” (Olson, 1974, p. 6).
Visual Attention
The brain processes visual messages in three ways. Mental messages
are those that you experience from inside your mind—thoughts, dreams,
fantasies. Direct messages are those that are seen because of your experiences
without media intervention. Mediated messages are those which are viewed
through some type of print or screen medium such as television, movies, or
computers. Messages require a strong impression for an image to be
remembered, but if viewed and thought about enough, an image will become
permanently stored in visual memory (Lester, 2006).
33
Viewers are bombarded by such a vast amount of possibilities in every
view, selecting an item for one’s focus is necessary. But focus is not enough to
store a message. Meaning must be associated with what you see, before your
mind has any chance of storing this information for long-term retrieval (Lester,
2006).
Bloomer (1990) identified nine mental activities that can affect visual
perception: memory, projection, expectation, selectivity, habituation, salience,
dissonance, culture and words. Memory is our link with all the images we have
ever seen and should be considered the most important mental activity involved
in accurate visual perception. Projection allows some individuals to see
recognizable forms in the clouds. Expectation would deal with items that do not
“belong,” or fit, into a scene. Most of what people see in a complicated visual
experience is not consciously processed. The mind discards most information
and selects significant details on which to focus. As a defense mechanism
against overstimulation, the mind tends to ignore stimuli that are part of a
person’s everyday, habitual activities. Salience means stimulus will be noticed
more if it has meaning for the viewer. Trying to do too many things at once will
create dissonance for the viewer and cause some areas to be minimized to focus
on others. An example of dissonance would be the version of CNN Headline
News introduced in 2001. It had layers of stock quotes, weather reports,
headlines, and advertising logos all in addition to the traditional newsperson and
the moving images and graphics of the traditional newscast. For many, this
34
created dissonance but many viewers praised the “newer, hipper look” (Lester,
2006, p. 62). Culture is the signs and meanings of the way a particular group of
people live. And although we see with our eyes, our conscious thoughts are
framed as words. “One of the strongest forms of communication is when words
and images are combined in equal proportions” (Lester, 2006, p. 64).
Of all the senses, some consider the visual as the most important (Berger,
1972; Rose, 2007). “Of the five major senses of the human being, vision and
audition are the most developed and critical” (Singer, 1980, p. 36).
Equally important, students of visual culture not only consider how visuals
look, but how they are looked at (Rose, 2007; Sturken & Cartwright, 2001). As
Berger (1972) wrote, “We never look just at one thing; we are always looking at
the relation between things and ourselves” (p. 9). Audience studies have been
accused of investing too much attention to the formal qualities of the visual image
while not fully addressing the ways actual audiences made sense of it (Moorely,
1980; Rose, 2007).
But even if attention is increased, will that also increase information
acquisition (Campbell et al., 1987)? How much of a message an audience
recalls and how to improve understanding of the message is a significant
consideration in the field of visual design. Most creators assume their works
contain clear messages which impact their audience. But research shows various
features affect the degree of impact (Rose, 2007). If the viewer does not
understand the terms employed, follow the logic of the argument, finds the
35
concepts too alien or difficult, or is confused by the narrative, the communication
is not effective and the viewer fails to take the meaning as the creators intend
(Hall, 1980). And it must be remembered that audiences filter, through their own
understandings and experiences, the messages they consume (Moores, 1993).
Humans have an incredible capacity to store and retrieve massive
amounts of information; though it is also true that processing capacity at any
given moment is limited. This is one of the reasons, signaling important
information or otherwise gaining attention is important (Singer, 1980).
While some portray attention as being passive with little cognitive
processing and incidental learning, others assert that formal features act as
guides in understanding content that is attention-worthy (Anderson & Lorch,
1983; Campbell et al., 1987).
Several television studies have concluded that visual attention is
associated, either positively or negatively, through use of formal features (Alwitt
et al., 1980; Anderson & Lorch, 1983; Campbell et al., 1987; Watt & Welch, 1982;
Williams, 1981). Some of the features positively associated with continual
viewing are visual effects, pans, and visual movement. Other features lead the
viewer to disengage visually while still continuing to monitor the presentation on a
superficial level (Anderson et al., 1979). The disengagement in the midst of
monitoring indicates that the meaningfulness or comprehensibility of the
presentation guides the viewer’s visual attention (Anderson, Lorch, Field, &
36
Sanders, 1981). Williams (1981) found that children are not mesmerized by
television, but they actively monitor it.
Specifically, they monitor the content for material they are likely to be able to comprehend, and when an appropriate cue occurs, they attend to the screen. Once viewing, they continue to attend until they cannot comprehend the material, or it becomes redundant or uninteresting, at which point they look away (Williams, 1981, p. 185).
Upon further study, Anderson and Lorch (1983) hypothesized that through
extensive viewing experience; children come to associate the triggering effects
between the formal features typically used in television with the likelihood that the
subsequent content will be meaningful.
While the distinction between form and function may be overlooked by
some, Huston, et al. (1981) found conceptual differences. They identified forms
as attributes which apply to a wide range of “program types, content themes,
story plots, and narrative structures” (p. 32). Formal features of television—
animation, eye contact, high action, scene variability, camera zooms, cuts and
dissolves, special visual effects, music, sound effects—are independent of the
program content.
Huston and Wright (1983) determined that children make feature-content
associations based upon their experiences with the medium to alert them to
upcoming content. These associations act as clues about how much mental
processing effort to exert, which influences storage and recall of content.
Salomon (1979) provided evidence that comprehension is affected by the use of
familiar formal features.

37
In Richard Mayer’s (2009) writings, he referred to this as the signaling
principle. On the desire to focus the learner’s cognitive processing he said, “The
solution is to insert cues that direct the learner’s attention toward the essential
material, which is a technique that can be called signaling” (p. 109). He
concluded, “People learn better from a multimedia message when the text is
signaled rather than nonsignaled” (p. 113). Singer calls this the orientation
reflex.
Another basic mechanism for processing information grows out of our ability to focus our attention on a specific and delimited area of the environment. This can, of course, be sight or sound, or some combination of both, excluding, however, a great many other sources of stimulation that may be occurring simultaneously (Singer, 1980, p. 37).
All viewers follow these cues according to Schmitt, Anderson, and Collins
(1999) who found the formal features of cuts and movement “are positively
related to looking regardless of content type, age, or sex of viewer” (p. 1164).
Formal features are used as clues to future content and how much effort
the viewer should exert (Campbell et al., 1987). Salomon (1983) determined the
amount of mental effort invested (AIME) is affected by the viewer’s perception,
based upon the symbol systems of the medium, of what effort the material
deserves, and the likely payoff of more or less effort (Van Evra, 2004).
This technique of alerting the viewer to important elements of the
presentation has been more successful than efforts to appeal to the viewer’s
emotions or overall arousal (Wetzel, Radtke, & Stern, 1994). “Although form
exists primarily to serve content in production, form may be of interest to

38
audiences independently of content and may communicate information beyond
that explicitly contained in content messages” (Huston et al., 1981, p. 33).
Salomon (1983) stated “It appears that even a change of labels…can
affect students’ perceptions of how worthwhile the expenditure of effort is in
processing presented material” (p. 48). In this specific case, he was addressing
a television program on PBS compared to a commercial network show, but the
correlation is clearly applicable to this comparison between video that appeals to
teachers versus video that appeals to students.
Perception Matters
Salomon’s study (1983) also found that learning “greatly depends on the
way in which sources of information are perceived, for these perceptions
influence the mental effort expended in the learning process” (p. 42). His study
found that perceptions play a “far more important role than is usually assumed”
(p. 43). This is more commonly referred to as a bias where people, who have a
strong expectation concerning the lesson, or any stimulus, may discount it and
fail to examine its merits (Nisbett & Ross, 1980).
In common practice, students sometimes discount a lesson’s value and
never attend to the teacher. Students may rationalize, “this teacher’s tests are all
made from the review sheets” so they won’t listen to the lecture at all. Or they
may have heard, “if you just read the summary to the chapters, you’ll be fine.” So
they skim the chapters and pay attention to the summary. Other biases may be
more subtle, but while “perceivers certainly go beyond the information they are

39
given,…it seems unlikely that they generally invent the information itself”
(Mischel, 1979, p. 748)! “Peoples’ perceptions of a source or task come from
somewhere, thus are not pure fabrications of their own minds” (Salomon, p. 46).
“Exposure to the ‘busy’ forms of today’s television, particularly MTV and its like,
may cultivate a preference for a quick-paced, erratic, even chaotic way of
handling information” (Salomon G. , 1997, p. 384).
Investigators who have studied aggressive behavior and television viewing
have identified arousal, or “level of involvement,” to explain learning from
television (Williams, 1981, p. 181). Watt and Krull (1977) differentiate between
emotional arousal, where the content is the agent of arousal, and the form model,
where characteristics independent of the content make the connection. “The
viewer’s arousal, attention, or involvement with television may be as important as
the content of the material viewed in determining whether learning takes place”
(Williams, 1981, p. 182). Cohen and Salomon’s (1979) study agreed that the
content is important, but learning is influenced by a person’s motivation, or how
he “wants to perceive…the information” (p. 161).
Another aspect of communication concerns the non-verbal actions of the
speaker or subject. Burgoon (1978) estimated that nonverbal language directs
as much as 65 percent of meaning in social interchange. Patterson (1983) noted
16 nonverbal actions typically used in communication. Some of the indentified
actions include, body orientation, hand movement, object or self-manipulation
(tapping fingers), movement and position, and gaze (Sewell, 1994).
40
Studies show systematic and positive relations between the way a source
of information is initially perceived and the amount of effort students report
investing in a particular subsequent presentation of material from that source
(Salomon, 1983).
Baggaley and Duck (1976) found it is more important to be skilled in the
“art of self-projection” (p. 80) than to be expert in the subject matter. More
importantly, “it follows that anyone skilled in the latter art [self-projection] may
give the impression that he is expert in the former sense also, and may acquit the
role of ‘subject specialist’ better than the genuine article” (p. 80).
The influence of self-projection can be clearly seen in the Dr. Fox Lecture.
“A professional actor who looked distinguished and sounded authoritative” (p.
631), was given a distinguished background, and presented to a group of “highly
trained educators” (p. 631). He was coached on a scientific article to “present his
topic and conduct his question and answer period with an excessive use of
double talk, neologisms, non sequiturs, and contradictory statements. All this
was to be interspersed with parenthetical humor and meaningless references to
unrelated topics” (Naftulin et al., 1973, p. 631).
“The results of Dr. Fox studies have been interpreted to mean that an
enthusiastic lecturer can entice or seduce favorable evaluations, even though the
lecture may be devoid of meaningful content” (Marsh, 1987, p. 331).

41
Video as a Learning Tool
Research has proven that Sesame Street, the longest running and most
analyzed television program with an academic curriculum has short-term positive
effects on vocabulary and school readiness, which in turn prove to have long-
term consequences. Numerous studies have also found similar positive effects
from many other curriculum-based programming. “Television that is designed to
teach does so, with long-term positive consequences” (Schmidt & Anderson,
2007, p. 67).
Federal Communication Commissioner Nicholas Johnson is credited with
the statement, “All television is educational television, the only question is, What
is it teaching.” (Liebert, 1973, p. 170)
The goal of a teacher is to help students recall, understand and apply the
material. Toward this end, many methods and technologies have been
incorporated to keep students more interested and engaged, and to improve their
learning experience (Cleveland, 2011). Teachers are currently using video,
graphics and animation not only for their convenience and attention-grabbing
qualities; it also appeals to students with a variety of learning styles while
providing the opportunity for conceptual understanding through visualization
(Fralinger & Owens, 2009). Visualization has been identified as a powerful
cognitive strategy to facilitate learning (West et al., 1991).
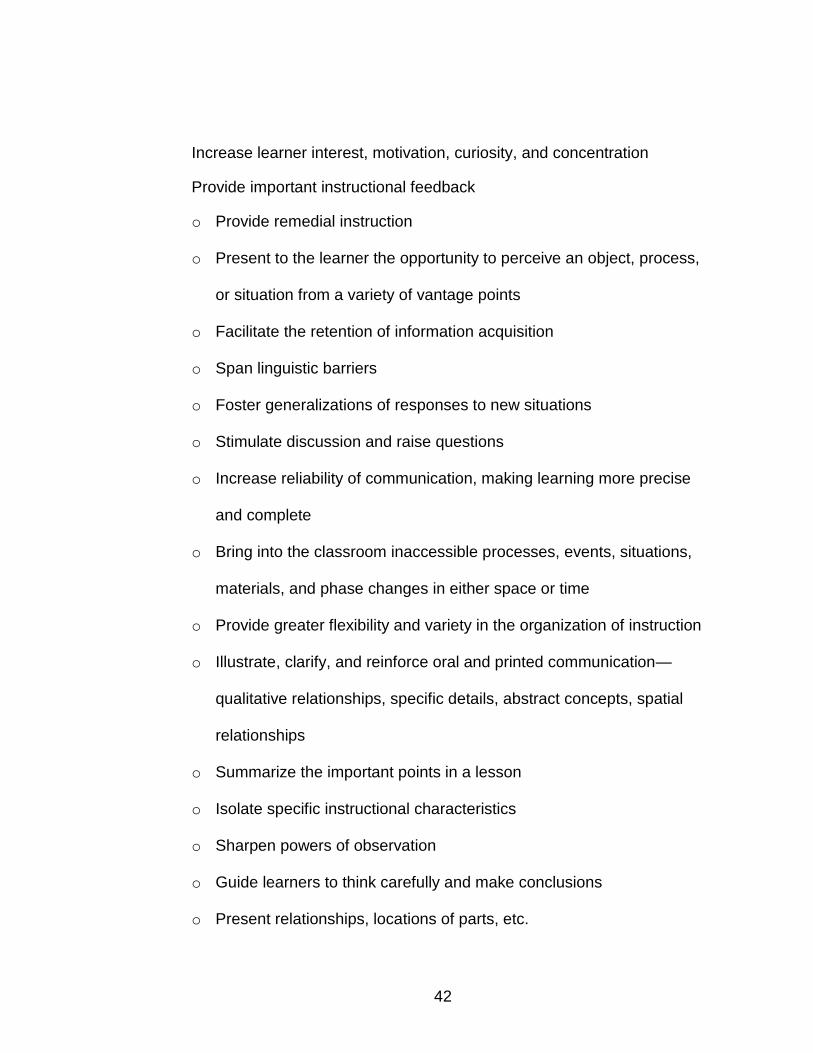
The value of visuals in improving instructional presentations were
characterized by Francis Dwyer (1978) in the following list.
42
Increase learner interest, motivation, curiosity, and concentration
Provide important instructional feedback
o Provide remedial instruction
o Present to the learner the opportunity to perceive an object, process,
or situation from a variety of vantage points
o Facilitate the retention of information acquisition
o Span linguistic barriers
o Foster generalizations of responses to new situations
o Stimulate discussion and raise questions
o Increase reliability of communication, making learning more precise
and complete
o Bring into the classroom inaccessible processes, events, situations,
materials, and phase changes in either space or time
o Provide greater flexibility and variety in the organization of instruction
o Illustrate, clarify, and reinforce oral and printed communication—
qualitative relationships, specific details, abstract concepts, spatial
relationships
o Summarize the important points in a lesson
o Isolate specific instructional characteristics
o Sharpen powers of observation
o Guide learners to think carefully and make conclusions
o Present relationships, locations of parts, etc.
43
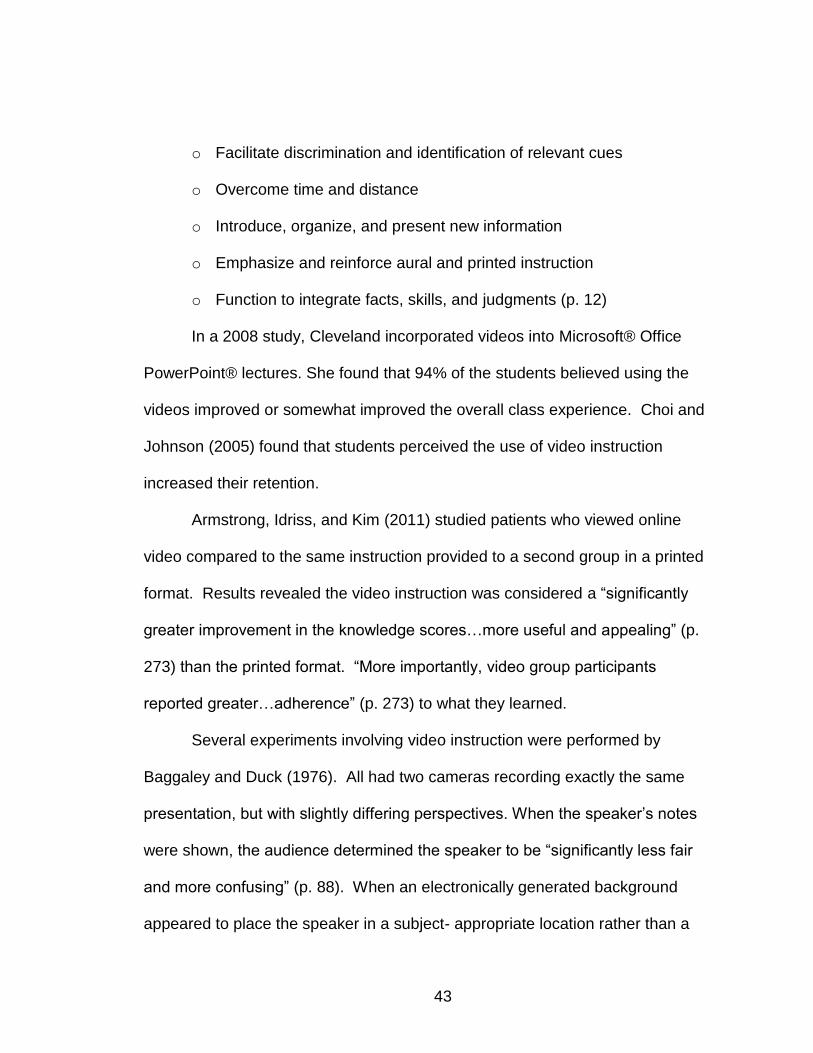
o Facilitate discrimination and identification of relevant cues
o Overcome time and distance
o Introduce, organize, and present new information
o Emphasize and reinforce aural and printed instruction
o Function to integrate facts, skills, and judgments (p. 12)
In a 2008 study, Cleveland incorporated videos into Microsoft® Office
PowerPoint® lectures. She found that 94% of the students believed using the
videos improved or somewhat improved the overall class experience. Choi and
Johnson (2005) found that students perceived the use of video instruction
increased their retention.
Armstrong, Idriss, and Kim (2011) studied patients who viewed online
video compared to the same instruction provided to a second group in a printed
format. Results revealed the video instruction was considered a “significantly
greater improvement in the knowledge scores…more useful and appealing” (p.
273) than the printed format. “More importantly, video group participants
reported greater…adherence” (p. 273) to what they learned.
Several experiments involving video instruction were performed by
Baggaley and Duck (1976). All had two cameras recording exactly the same
presentation, but with slightly differing perspectives. When the speaker’s notes
were shown, the audience determined the speaker to be “significantly less fair
and more confusing” (p. 88). When an electronically generated background
appeared to place the speaker in a subject- appropriate location rather than a
44
plain background setting, the interest in the speaker was unaffected, but the
speaker “was construed as significantly more honest, more profound, more
reliable, and more fair than when seen against the plain background” (p. 90).
Another study captured a speaker looking directly into the camera and another
view from a 45-degree angle as though engaged in a discussion. In the angled
view, “significantly higher ratings of the performer’s reliability and expertise were
obtained” (p. 92). In fact, all questions produced more favorable ratings of the
angled view, even though sometimes not statistically significant.
The most significant results were obtained from a study using audience
reaction shots intercut with the presentation. One group saw students engaged
and attentive. The second saw the same students, but this time expressing
disinterest and doodling. “By far the most significant finding in this respect is that
in the negative tape the lecturer was seen as more confusing, more shallow and
more inexpert.” (Baggaley & Duck, 1976, p. 95). “The effect seems to be specific
to items relating to the lecturer’s ability, competence and effectiveness, rather
than to personal characteristics of general attractiveness” (Duck & Baggaley,
1975, p. 84).
“We can learn something from a source of information, given that it carries
some potentially useful information, if we perceive it to warrant the investment of
effort needed for the learning to take place” (Salomon G. , p. 42).
45
Uses of Classroom Technology
Lecture Capture
Every day, students attempt to capture class content for later review,
sometimes with audio recorders, but typically using paper and pen. The most
obvious problem with this procedure is that students write about 20 words per
minute, while the average lecturer speaks 120 words per minute (McClure, 2008;
Toppin, 2011). Other challenges include:
the communication of difficult…concepts, maintaining students’ attention span, the difficulties of catering for individual students’ needs in a large classroom environment, different paces of student learning, lack in fluency in spoken and/or written English, and students losing continuity due to missed classes. As a result, only a small percentage of students are usually able to grasp the key concepts at the time of the live lecture delivery, while the remaining students are left to develop this critical understanding in their own time, with whatever assistance they can find and comprehend (Ambikairajah, Epps, Sheng, & Celler, 2006, p. 20).
Video recording a class lecture addresses several of these issues.
Primarily, lecture videos may be replayed to better understand concepts covered
in class or take more complete notes; they are an aid when preparing for exams;
and students who are absent may use the videos to remain current with
classwork (Gosper, et al., 2007; Odhabi & Nicks-McCaleb, 2011; Toppin, 2011;
Wieling & Hofman, 2010).
The trend toward lecture capture in the university community “has been
gaining momentum in recent years, but that momentum is being outpaced by
student demand” (Nagel, 2008, para 1). Brown said, “Lecture capture has found
an important and permanent place in education” (McClure, 2008, para 4).

46
While some schools have classrooms setup to automatically record
lectures, and others have video professionals produce the recordings, a recent
study showed faculty could perform the task equally well (Chandra, 2011; Lampi,
Kopf, Benz, & Effelsberg, 2008). “Our experience showed that faculty captured
videos are as effective as videos captured by videographers or by using
automated mechanisms” (Chandra, 2011, p. 273).
Years ago, lecturers recorded an audio track to accompany PowerPoint
presentations for student use, a precursor to current video capture, but today’s
students prefer to see a lecturer explaining concepts on video rather than the still
images with a soundtrack (Ambikairajah et al., 2003). Moreover, “the video
provides a face with expressions, gestures and a human voice to what is usually
‘faceless’ online content, which according to the social-cue hypothesis stimulates
students’ interest and communication, and therefore influences learning in a
positive manner (Dewey, 1913; Rutter, 1984)” (as cited in Soong et al., 2006, p.
790).
Lecture capture research shows students perceive this technology leads
to positive influences on their learning experiences (Gosper et al., 2007; McElroy,
2006; Soong et al., 2006). Studies have also found higher student scores when
using video (Day, Burn, & Gerdes, 2009; Goldbert & McKhann, 2000). Toppin
(2011) found video capture “has tremendous potential for improving student
performance” (p. 391).
47
Supplemental Instruction
A more recent approach is the use of video recordings before a lesson
has been discussed in the classroom—the “flip model.” Day and Foley (2006)
believe, “The most beneficial way to use Web lectures is in addition to normal
classroom time and reading assignments, as a way to augment, not replace the
classroom experience” (p. 422) allowing for more meaningful in-class activities.
This study found the group that viewed a video before class, compared to
the traditional in-class lecture section, scored higher by over eight percent. Class
time, equivalent to the length of the videos, was cancelled in the video recordings
section to prevent additional learning. Obviously, in practice, this technique may
allow even greater gains (Day & Foley, 2006).
In a 2008 study, West Point students were surveyed on their use of video
instruction to supplement a general chemistry course. Sixty percent indicated
they had used the videos before class as a preparation tool, 36% had used
videos after class for review, and 78% acknowledged they watched the videos to
prepare prior to a test (Franciszkowicz, 2008).
Response Systems
“Two thousand four hundred years ago, the Greek philosopher Socrates
realized that people understand more by answering a question, than be being
told an answer” (Abrahamson, 1999, para 4). A century ago, Dewey (1916)
concurred when he wrote people learn by doing and learning should be an active
experience.
48
Response systems—known as audience response systems, classroom
response systems, personal response systems, or 23 other labels—allow
teachers, both in large classroom settings and online, to escape the typical
lecture and maintain student attention (Kay & LeSage, 2009).
The earliest systems of this type consisted of simple response-cards or
signs (Marmolejo, Wilder, & Bradley, 2004). Some instructors used colored
cards, while others used labels on the cards, ex. True/False, or A, B, C, D.
(Kelhum et al., 2001). This technique ensured active student responses, the
opportunity for immediate remediation, and full interaction with the instructor
(Heward, 1978).
Technological advances have allowed many schools to transition to
electronic response systems. While these may vary in architecture and hardware,
most systems currently in use are similar. Response systems, often in a large
lecture hall, allow students to immediately respond to an instructor’s questions
through an electronic sending device (Judson & Sawada, 2002). The questions
presented during a lecture prompt responses from students. “By providing
immediate feedback to students, either from individual electronic feedback
integrated into the system or through the instructor, student responses [are]
confirmed each step of the way” (Judson & Sawada, 2002, p. 170).
The first known electronic response system was installed in a Stanford
University lecture hall in 1966, followed two years later at Cornell University. The
military was also an early adopter of response systems (Abrahamson, 2006).
49
Early studies on the effect of response systems on student achievement showed
no difference over students in classrooms without the technology, but did indicate
overwhelming endorsement from the students (Graham, Tripp, Seawright, &
Joeckell III, 2007; Judson & Sawada, 2002).
More recent evidence indicates students consider the systems useful for
their own understanding of subject matter and enjoy using them (Abrahamson,
1999; Judson & Sawada, 2002). But “beyond discovering that students both
enjoy and value the use of an electronic response system, the issue of academic
achievement remains open” (Judson & Sawada, 2002, p. 175).
Roschelle et al. (2004) summarized 26 studies in math, chemistry and the
humanities.
These range from promoting greater student engagement (16 studies), increasing understanding of complex subject matter (11 studies), increasing interest and enjoyment of class (7 studies), promoting discussion and interactivity (6 studies), helping students gauge their own level of understanding (5 studies), teachers having better awareness of student difficulties (4 studies), extending material to be covered beyond class time (2 studies), improving quality of questions asked (1 study), and overcoming shyness (1 study) (Abrahamson, 2006).
There have been a few recent studies in search of achievement results
that are generally positive but “these studies tend to focus on the process of
interactive engagement, sometimes facilitated by an audience response system,
and do not place the equipment at the focal point of the study” (Judson &
Sawada, 2006, pp. 32-33).
More typically, current studies show a “value for teaching and learning,”
but do not measure achievement (Hinde & Hunt, 2006, p. 142). Conclusions
50
include improved concentration and greater enjoyment, improvements in
attendance, greater engagement and lecture response, and greater participation
(Hinde & Hunt, 2006). Limited studies in the high school environment have
returned similar results (Barnes, 2008).
Bartsch and Murphy (2011) are direct in their assessment that “a majority
of the papers on ECRSs [electronic classroom response systems] either are
conjectures, case studies with little empirical evidence, or measurements of
student attitudes” (p. 26). Fies and Marshall (2006) agree, “Missing from current
CRS [classroom response systems] research reports are tightly controlled
comparisons in which the only difference is the use, or lack of use, of a CRS” (p.
106). In fact, De Gagne (2011) reviewed 15 studies conducted since 2003, but
only labeled one as experimental. The remaining were surveys or comparisons.
Based on several studies, a 2009 article by Kay and LeSage concluded
that use of a response system increases student performance. However, the
methods cited raise questions. El-Rady compared a test given in a general
education course one semester, with the identical exam the following semester
after implementing a response system. The test scores were approximately 10%
higher (El-Rady, 2006). A similar study noted a 2.23% increase in the number of
students receiving a course grade of C or better when compared to grades in the
same course taught a previous semester without the use of a response system
(Kaleta & Joosten, 2007).
51
Some recent studies have shown increased performance using tighter
controls. Morling, McAuliffe, Cohen and DiLorenzo compared four sections of
introductory psychology. Two sections used clickers and two did not. They found
that the use of clickers “resulted in a small, positive effect on exam performance”
(2008, p. 47).
Two medical education studies have similarly linked positive student
achievement to the use of response systems. Pradhan et al. (2005) tested two
groups of residents. One group received a typical lecture while the second group
heard the same lecture utilizing a response system. A pre-test/post-test was
assessed and the improvement from the interactive students was almost 20%
greater than the lecture-only group. The total number of students in both groups
was 17. Schackow and Loya (2004) used similar methodology and found a
similar significant difference. Their conclusion stated, “At least two plausible
explanations for these results exist: (1) improved retention occurs with active
participation in the lecture process and (2) improved retention occurs when key
learning points are highlighted prior to testing” (Schackow & Loya, 2004, p. 503).
Bloom’s Taxonomy Revised
In the late 1940s, Benjamin Bloom initiated the concept of classifying
statements of intended educational results into a framework. This framework
could then be used by faculty across universities to exchange items which would
measure the same objectives. The original taxonomy provided six categories of
mental activity “from simple to complex and from concrete to abstract”
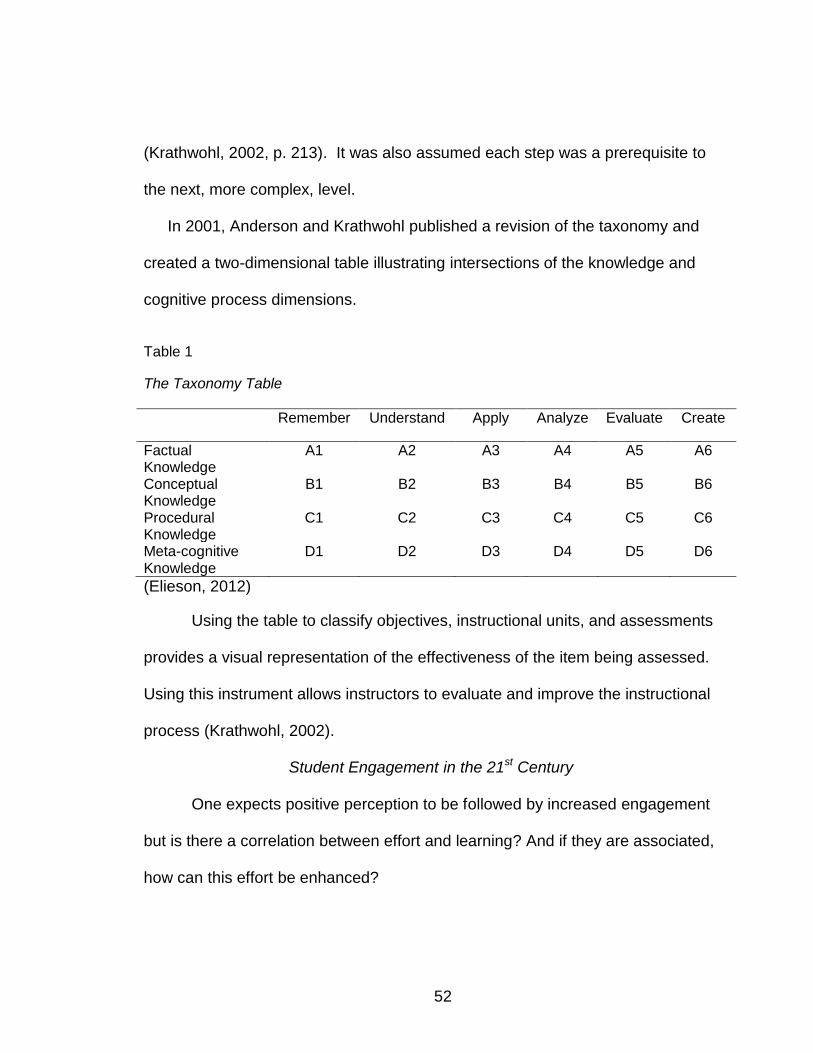
52
(Krathwohl, 2002, p. 213). It was also assumed each step was a prerequisite to
the next, more complex, level.
In 2001, Anderson and Krathwohl published a revision of the taxonomy and
created a two-dimensional table illustrating intersections of the knowledge and
cognitive process dimensions.
Table 1
The Taxonomy Table
Remember Understand Apply Analyze Evaluate Create
Factual Knowledge
A1 A2 A3 A4 A5 A6
Conceptual Knowledge
B1 B2 B3 B4 B5 B6
Procedural Knowledge
C1 C2 C3 C4 C5 C6
Meta-cognitive Knowledge
D1 D2 D3 D4 D5 D6
(Elieson, 2012)
Using the table to classify objectives, instructional units, and assessments
provides a visual representation of the effectiveness of the item being assessed.
Using this instrument allows instructors to evaluate and improve the instructional
process (Krathwohl, 2002).
Student Engagement in the 21st Century
One expects positive perception to be followed by increased engagement
but is there a correlation between effort and learning? And if they are associated,
how can this effort be enhanced?
53
“Student engagement has long been recognized as the core of effective
schooling” (Marzano & Pickering, 2011, p. 3). But do typical modes of teaching
interest today’s students? Clearly, poor attention inhibits learning, given that the
presentation and the received version of the presentation differ, restricting an
accurate transfer of knowledge (Dwyer, 1978).
Schramm identified “one of the teacher’s responsibilities is to feed the
pupil’s motivation” (Schramm, 1973, p. 47). Most would agree that motivating
and engaging students has been recognized as an integral part of a successful
school (Dewey, 1956; National research council, 2004).
In 1977, Sorenson and Hallinan reported that student effort was a factor
that identified a significant variation in student achievement. “We have identified
three basic concepts—ability, effort and opportunities for learning” (p. 276). This
is not a surprise, since educators and psychologists have “long been aware of
the importance of effort for educational attainment” (De Fraja, Oliveira, & Zanchi,
2010, p. 577).
Several studies have linked the amount of student effort with academic
achievement (Finn & Rock, 1997; Marks, 2000; Natriello & McDill, 1986).
Stewart (2008) studied a national sample of high school sophomores and
concluded student effort had a substantially greater influence on student
achievement than school characteristics.
54
However, as Akerlof and Kranton found in 2002, studies in student
engagement have overlooked the role of “the student as the primary decision
maker” (p. 1172).
While lack of student engagement was not born with digital natives, the
dwindling shared experiences with today’s students (see Figure 4.) pose more
significant challenges to addressing this goal.
Lack of motivation has been a recognized problem for decades. Deci and
Ryan (1985) report, “For most children there are significant portions of the
academic curriculum that are not spontaneously compelling or inherently
interesting and most children do not appear to be intrinsically motivated for
[requirements] that are expected of them by the schools” (p. 245).
“Many [students] claim a disconnect between life online after school hours
and methods of learning used in classrooms” (Strom & Strom, 2009, p. 70).
“Schools that continue to teach to an Industrial Age way of life will be
dismissed outright by their clientele of 21st-century digital kids” (Kelly et al.,
2009, p. 21). However, schools that incorporate the technology of today’s teens
will be adapting to the students’ experience base (Williams & Williams, 2011).
“Whether we like it or not, this media culture is our students’ culture”
(National Council for the Social Studies, 2009, para 6). “Make no mistake about
it: using popular culture, mass media, and digital media motivates and engages
students. And students need to be motivated and engaged—genuine learning
simply doesn’t happen without it” (Hobbs, 2011, p. 6).
55
Students are used to their surroundings. Being blasted with multiple
stimuli simultaneously is “normal” for today’s teenagers. Likewise, lessons and
media that do not meet their “normal” will be downgraded in their view (Dewey,
1916).
Recently, The Community Council of Greater Dallas issued a study of
local dropout rates and the Dallas Morning News headline read: “One Word for
Why Students are Quitting School: Boring” (Haag, 2012, p. B1). The story
quoted Bob Wise, president of Alliance for Excellent Education stating, “The
results from that survey are borne out by national surveys” (p. B7). To state the
obvious, John Medina writes, “We don’t pay attention to boring things” (Medina,
2008, p. 71). “The more attention the brain pays to a given stimulus, the more
elaborately the information will be encoded—and retained” (Medina, 2008, p. 73).
“Better attention always equals better learning” (Medina, 2008, p. 73).
We all develop habitual ways of seeing and hearing that allow us to
identify which images warrant our limited attention amid the visual chaos of
everyday life and to ignore everything else. Using selective seeing, we screen
out most of the sensations that reach our eyes and ears so that we are not
overwhelmed by our surroundings. “We also choose to look at things we like to
see and are especially interested in and ignore those that mean little to us” (Zettl,
2005, p. 6).
The key for student engagement is to create learning that appeals to 21st
century kids.
56
Peer Influence
Peer pressure is typically perceived as having a negative influence but it
certainly may trigger positive effects as well.
Actually, research indicates that peer pressure to engage in deviant activities—drinking, drug use, or cheating—is relatively uncommon. Instead, adolescents are most often influenced not by what their peers actually do or say, but by how they think their peers will react to a potential action (Burns & Darling, 2002, p. 4).
This exogenous effect demonstrates how a group’s characteristics may
influence decision-making (Edelman, 2010).
An example of an endogenous effect, when one’s actions affect another’s,
is explained by Deutsch and Gerard (1955)
From birth on, we learn that the perceptions and judgments of others are frequently reliable sources of evidence about reality. Hence it is to be expected that if the perceptions by two or more people of the same objective situation are discrepant, each will tend to re-examine his own view and that of the others to see if they can be reconciled (p. 635).
Studies have shown a significant association between positive peer
influence and academic achievement (De Fraja et al., 2010; Nichols & White,
2001). “As adolescents associate with friends who value education and are
committed to academic pursuits, they create attachments to school and conform
to the ideals associated with it” (Stewart, 2008, p. 197). But the research may
lack specificity.
Although a large number of studies have examined peer pressure and peer conformity, few studies have evaluated the degree to which peer pressure or peer conformity are related to or are different from more general tendencies to conform to authority (Santor, Messervey, & Kusumakar, 2000, p. 164).
57
Studies have shown and described peer influence, but have not
addressed in what way the effects are achieved (Edelman, 2010). Classen and
Brown (1985) agreed, “most research has focused on the product rather than the
process of peer influence” (p. 464).
Other studies have measured peer influence as simply association
between grades of a student’s academic achievement and that of his friends’
(Ide, Parkerson, Haertel, & Walberg, 1981). “It seems doubtful, however, that
such correlations adequately measure peer pressure” (Classen & Brown, 1985,
p. 453).
Immediate Feedback
Many early studies in the field of psychology considered performance
changes when learners were provided with feedback that affirmed or corrected a
response (e.g., (Thorndike, 1927). Early feedback served to reinforce positive
responses while it weakened incorrect answers through nonreinforcement;
however it had no means to provide corrective information (Brosvic, Epstein,
Cook, & Dihoff, 2005). There have been numerous studies that proved the
learning advantages provided by corrective feedback (Butler, Karpicke, &
Roediger, 2007, 2008; Lhyle & Kulhavy, 1987; Metcalfe, Kornell, & Finn, 2009).
The benefits for feedback seem obvious.
If an error is allowed to stand uncorrected, it may be rehearsed, consolidated, and strengthened and may be more likely to recur than if it were immediately corrected. If feedback is given immediately, the correct answer rather than an error can then be rehearsed and consolidated (Metcalfe et al., 2009, p. 1077).
58
There are however, differing viewpoints on the preferable time frame to
provide corrective feedback (Robin, 1978).
Proponents of immediate feedback recommend the correction of errant responses and the acquisition of the correct response before exiting a test problem or test session (Epsein et al, 2001). In comparison, proponents of delayed feedback recommend the imposition of a delay of 24 to 48 hours to facilitate the forgetting of errant responses and the acquisition of correct responses in the absence of the interference that immediate feedback on an item-by-item basis generates (Brosvic et al., 2005, p. 402; Kulhavy & Stock, 1989).
Dihoff, Brosvic, Epstein, & Cook (2004) and Brosvic et al (2005)
conducted a series of experiments and found significantly higher scores for
students provided with immediate feedback over delayed feedback, and both
showed gains over the control group receiving no feedback. “A consistent finding
across our studies is the failure to support the delay-reaction effect” (Dihoff et al.,
2004, p. 229).
In 2009, Metcalf et al. voiced a concern with studies showing delayed
feedback superiority when they pointed out a discrepancy between the “time after
feedback” in the studies. They noted the time between initial test and final test
had remained constant, with the feedback moving from immediately after the
initial test to immediately before the final test. They asserted the time after
feedback should remain constant in the studies.
The Dihoff and Brosvic studies were conducted using an Immediate
Feedback Assessment Technique form, a Scantron-like design with scratch-off
hidden answers for periodic testing. This form allows students to continually
search for the correct answer, until they ultimately scratch off the solution.
59
Generally in today’s high schools, feedback is achieved through remote
control devices referred to as “clickers” or learning management systems,
ubiquitous in higher education, but becoming popular in K-12 learning. Both
would primarily be used for immediate feedback.
Beyond correcting errors, another benefit should not be overlooked.
Butler et al. (2008) found feedback also reinforces correct answers. When
students have low confidence in their answers, even if the answers are correct,
feedback can address the metacognitive error.
For example, students answering multiple questions many not have the
same level of confidence in every answer, leading to the possibility of some low-
confidence correct responses and some high-confidence incorrect responses
(Butler et al., 2008; Butterfield & Metcalfe, 2006; Roediger, Wheeler, & Rajaram,
1993).
Butler, et al. (2008) demonstrated, “that correct responses benefitted from feedback, and this positive effect of feedback was greatest for low-confidence correct responses. Thus, feedback also helps learners correct the metacognitive error that occurs when they are correct on an initial test but lack confidence in their response (p. 925).
Summary
This study originated with an idea that seemed simple. Video use is
growing in education and if educators could economically create videos that are
more appealing to today’s students, should not that be their goal?
There has been little recent study on the effects of media in education.
That may be attributed to the “lack of significant difference” debate over the
60
years. There is also a void of information on learning with television or video
(Huston, Bickham, Lee, & Wright, 2007).
It seems appropriate to revisit Baggaley and Duck’s experiments and
determine what effect video techniques may have on today’s high school
students.
61
CHAPTER 3
METHODOLOGY
Data Source
This study was conducted in a suburban Dallas-Fort Worth, Texas,
middle-class high school. The school is classified in Texas as a 5A high school
with 2288 students at the time of the study. Of the total student population,
48.1% of the students were female and 51.9% were male. The student ethnicity
was 70.0% White, 15.4% Hispanic, 5.5% Black, 1.6% Asian, 0.6% American
Indian, with 6.9% unclassified (Midlothian High School, 2012).
Students were recruited from all grade levels and multiple sections to
produce 155 valid responses. Six responses were excluded due to either a
missing pretest or posttest. Thirteen responses were excluded for non-
participation.
I am a current faculty member at the school.
Research Questions
Two key research questions were evaluated in this study. Each
instrument contains a Part A to assess instructional achievement and a Part B to
assess intrinsic motivation.
62
Video with Audience Feedback
Research Question 1a: Among suburban Texas high school students, is
instructional achievement associated with a video lecture that includes audience
reaction scenes?
Research Question 1b: Among suburban Texas high school students, is
intrinsic motivation associated with a video lecture that includes audience
reaction scenes?
Video with Content Question Interaction
Research Question 2a: Among suburban Texas high school students, is
instructional achievement associated with a video lecture that includes content
question interaction?
Research Question 2b: Among suburban Texas high school students, is
intrinsic motivation associated with a video lecture that includes content question
interaction?
Video with Audience Feedback and Content Question Interaction
Research Question 3a: Among suburban Texas high school students, is
instructional achievement associated with a video lecture that includes audience
feedback scenes and content question interaction?
Research Question 3b: Among suburban Texas high school students, is
intrinsic motivation associated with a video lecture that includes audience
feedback scenes and content question interaction?
63
Hypotheses
The current study uses the following null and research hypotheses for
each of the three conditions studied. The research hypotheses reflect the
expectations of achievement or positive motivation while the null hypotheses
represent the status quo which will remain in the event statistical analyses fail to
confirm associations of magnitude.
Hypotheses 1a—Null
Among suburban Texas high school students, there is no association
between instructional achievement and a video lecture that includes audience
reaction scenes.
Hypotheses 1a—Research
Among suburban Texas high school students, there is positive
instructional achievement associated with a video lecture that includes audience
reaction scenes.
Hypotheses 1b—Null
Among suburban Texas high school students, there is no association
between student motivation and a video lecture that includes audience reaction
scenes.
Hypotheses 1b—Research
Among suburban Texas high school students, there is positive student
motivation associated with a video lecture that includes audience reaction
scenes.
64
Hypotheses 2a—Null
Among suburban Texas high school students, there is no association
between instructional achievement and a video lecture that includes content
question interaction.
Hypotheses 2a—Research
Among suburban Texas high school students, there is positive
instructional achievement associated with a video lecture that includes content
question interaction.
Hypotheses 2b—Null
Among suburban Texas high school students, there is no association
between student motivation and a video lecture that includes content question
interaction.
Hypotheses 2b—Research
Among suburban Texas high school students, there is positive student
motivation associated with a video lecture that includes content question
interaction.
Hypotheses 3a—Null
Among suburban Texas high school students, there is no association
between instructional achievement and a video lecture that includes audience
reaction scenes and content question interaction.

65
Hypotheses 3a—Research
Among suburban Texas high school students, there is positive
instructional achievement associated with a video lecture that includes audience
reaction scenes and content question interaction.
Hypotheses 3b—Null
Among suburban Texas high school students, there is no association
between student motivation and a video lecture that includes audience reaction
scenes and content question interaction.
Hypotheses 3b—Research
Among suburban Texas high school students, there is positive student
motivation associated with a video lecture that includes audience reaction scenes
and content question interaction.
Research Design
Pretest/Posttest
The pretest/posttest consisted of 14 questions with multiple choice and
true/false answers. All questions fell within the remember and understand
cognitive process dimension on the taxonomy table and measured either factual
knowledge or conceptual knowledge.
Intrinsic Motivation Inventory
Deci and Ryan (1985) state, “When highly intrinsically motivated,
organisms will be extremely interested in what they are doing and experience a
66
sense of flow” (p. 34). Flow is described as “that peculiar, dynamic, holistic
sensation of total involvement with the activity itself” (p. 29).
Despite how important intrinsic motivation is to the educational process,
Deci and Ryan (1985) noted how often educators and parents alike ignore the
subject.
The Intrinsic Motivation Inventory (IMI) is a multidimensional instrument
designed to assess participants' subjective experience related to motivation using
seven subscales: Interest/Enjoyment, Perceived Competence, Effort/Importance,
Value/Usefulness, Pressure/Tension, Perceived Choice and Relatedness. It has
been employed in reading, learning, writing, puzzle tasks and sport research
studies (McAuley, Duncan, & Tammen, 1989).
Past research indicates that the order and number of items within each
subscale has negligible effects while the “inclusion or exclusion of specific
subscales appears to have no impact on the others” (Intrinsic Motivation
Inventory, 2012, para 2). In fact, all seven subscales have rarely been used in a
single study (McAuley et al., 1989).
IMI items may be modified slightly to fit a wide variety of activities. Thus
“this activity” may be modified to “this lesson” “without effecting its reliability or
validity” (Intrinsic Motivation Inventory, 2012, para 3). McAuley et al. (1989)
found strong support for IMI’s validity and reliability.
The current study used four subscales: Interest/Enjoyment, Perceived
Competence, Effort/Importance, and Pressure/Tension utilizing 21 items. “The
67
Interest/Enjoyment subscale is considered the self-report measure of intrinsic
motivation” (Intrinsic Motivation Inventory, 2012, para 1). The perceived
competence scale is “theorized to be [a] positive predictor of both self-report and
behavioral measures of intrinsic motivation” (Intrinsic Motivation Inventory, 2012,
para 1). The effort/importance scale represents a variable that is relevant to
some motivation questions while pressure/tension represents a negative
predictor of motivation (Intrinsic Motivation Inventory, 2012).
The respondents scored the items on a scale from 1 to 7, with 1
representing not at all true while 7 represents very true. (R) items are reverse
scored with the response subtracted from eight and used as the item score.
The study also gathered additional items for further research.
Administration
The study was conducted in a school computer lab over a three-day
period. Students took the pre-test in the first session and returned two days later
for the experimental lesson and posttest. Students received no feedback scores
upon completion of the pretest or post-test.
A 12-minute lecture from a high school government course was recorded
and used as the basic recording for this experiment.
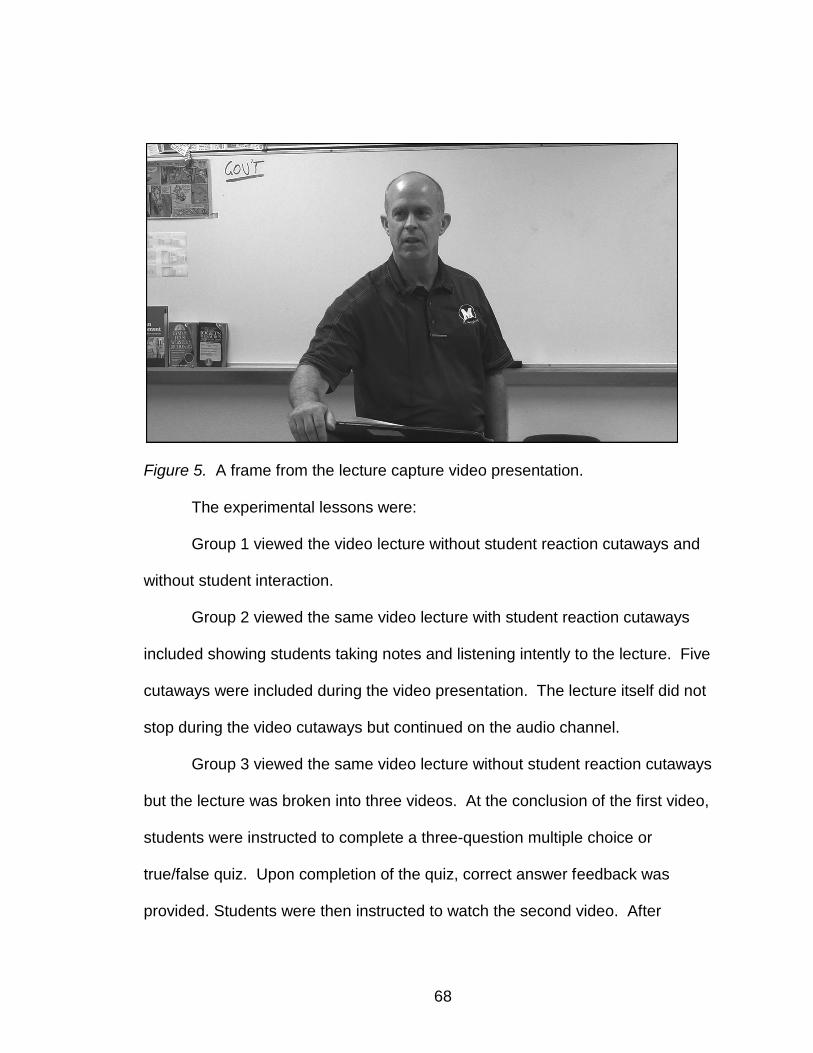
68
Figure 5. A frame from the lecture capture video presentation.
The experimental lessons were:
Group 1 viewed the video lecture without student reaction cutaways and
without student interaction.
Group 2 viewed the same video lecture with student reaction cutaways
included showing students taking notes and listening intently to the lecture. Five
cutaways were included during the video presentation. The lecture itself did not
stop during the video cutaways but continued on the audio channel.
Group 3 viewed the same video lecture without student reaction cutaways
but the lecture was broken into three videos. At the conclusion of the first video,
students were instructed to complete a three-question multiple choice or
true/false quiz. Upon completion of the quiz, correct answer feedback was
provided. Students were then instructed to watch the second video. After
69
viewing was completed, a similar quiz with feedback was provided. Students
were asked to view the third video.
Group 4 viewed the same video lecture as Group 2 including student
reaction cutaways. In addition, the lecture was broken into three videos just as
Group 3 experienced. At the conclusion of the first video, students were
instructed to complete a three-question multiple choice or true/false quiz. Upon
completion of the quiz, correct answer feedback was provided. Students were
then instructed to watch the second video. After viewing the second video, a
similar quiz with feedback was provided. Students were instructed to view the
last video.
Students were advised they could go back and review the video as
needed before indicating they were ready to proceed. Upon completion of the
video instruction, a post-test was administered. Once the post-test had been
accessed, students could no longer view any of the previous instruction.
The school utilizes Blackboard Learn as a course management system
and the participating students were enrolled in a course specifically for this
experiment through Blackboard. This allowed Blackboard to randomly assign
students to one of the four experimental groups. This also allowed the pre-test
and post-test questions and the Intrinsic Motivation Inventory questions to be
randomly ordered for each student.
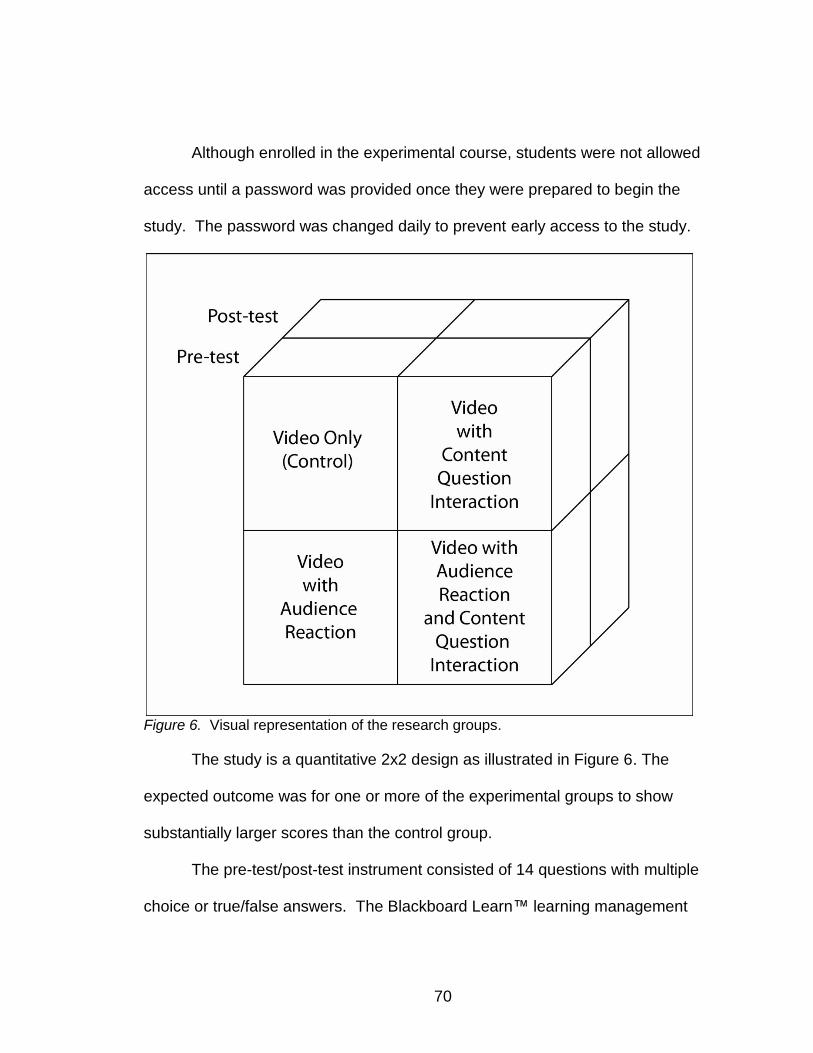
70
Although enrolled in the experimental course, students were not allowed
access until a password was provided once they were prepared to begin the
study. The password was changed daily to prevent early access to the study.
Figure 6. Visual representation of the research groups.
The study is a quantitative 2x2 design as illustrated in Figure 6. The
expected outcome was for one or more of the experimental groups to show
substantially larger scores than the control group.
The pre-test/post-test instrument consisted of 14 questions with multiple
choice or true/false answers. The Blackboard Learn™ learning management
71
system was able to match the Pretest score with the posttest score from each
student.
A repeated measures multivariate analysis of variance (MANOVA)
provided inferential data to check for significant differences of accomplishment
between different instructional units.
A multivariate analysis of variance (MANOVA) provided inferential data to
check for significant difference of motivation between different instructional units.
The study consisted of three dependent variables:
1. A video lecture capture recording including student reaction cutaways
2. A video lecture capture recording including student interaction
3. A video lecture capture recording including student reaction cutaways and
student interaction
The study examined the learning experiences for each group as they
related to two independent variables:
1. The actual instructional achievement
2. The learners’ motivation to learn
72
CHAPTER 4
RESULTS
Data Analysis
Data from each of the four research groups was gathered via the
Blackboard Learning Management System, then compiled and analyzed using
SPSS 20.0 statistical software. Significance was determined using < .05,
utilizing a two-tailed analysis. Partial eta squared was used to determine effect
sizes. “Eta squared is the proportion of total variance explained by a variable,
whereas partial eta squared is the proportion of variance that a variable explains
that is not explained by other variables” (Field, 2009, p. 791). Cohen’s d was
determined for the motivation survey results to confirm the effect size results.
Intrinsic Motivation Inventory
Multi-item scales are preferable for measuring psychological attributes
since “measurement error averages out when individual scores are summed to
obtain a total score” (Nunnally & Bernstein, 1994). This experiment used four
scales in the Intrinsic Motivation Inventory, each scale consisting of multiple
items. As seen in Table 2, the Interest/Enjoyment, Effort/Importance, and
Pressure/Tension scales each contained 5 questions while the Perceived
Competence scale contained 6 questions. Internal consistency between the
items in each scale was measured using Cronbach’s alpha reliability coefficient.
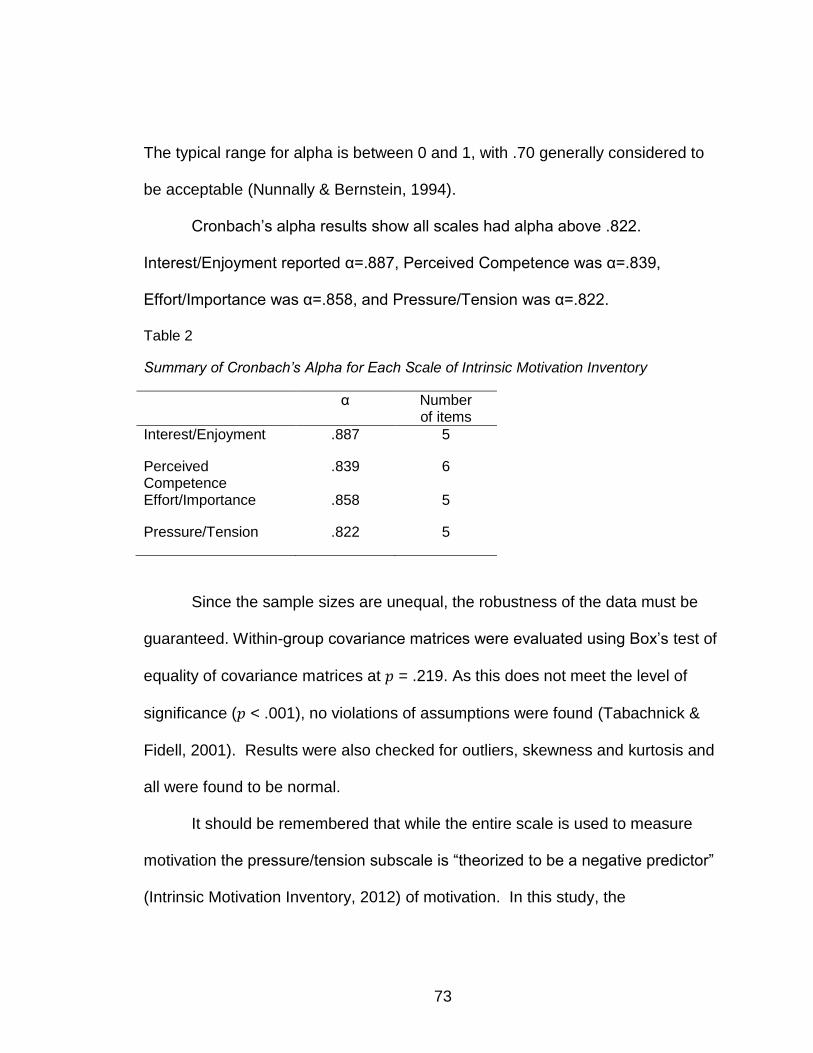
73
The typical range for alpha is between 0 and 1, with .70 generally considered to
be acceptable (Nunnally & Bernstein, 1994).
Cronbach’s alpha results show all scales had alpha above .822.
Interest/Enjoyment reported α=.887, Perceived Competence was α=.839,
Effort/Importance was α=.858, and Pressure/Tension was α=.822.
Table 2
Summary of Cronbach’s Alpha for Each Scale of Intrinsic Motivation Inventory
α Number of items
Interest/Enjoyment .887 5
Perceived Competence
.839 6
Effort/Importance .858 5
Pressure/Tension .822 5
Since the sample sizes are unequal, the robustness of the data must be
guaranteed. Within-group covariance matrices were evaluated using Box’s test of
equality of covariance matrices at = .219. As this does not meet the level of
significance ( < .001), no violations of assumptions were found (Tabachnick &
Fidell, 2001). Results were also checked for outliers, skewness and kurtosis and
all were found to be normal.
It should be remembered that while the entire scale is used to measure
motivation the pressure/tension subscale is “theorized to be a negative predictor”
(Intrinsic Motivation Inventory, 2012) of motivation. In this study, the
74
Pressure/Tension score was consistently low across all groups, indicating no
disassociation with motivation.
Hypothesis Testing
Test of Hypothesis 1a: Association of Instructional Achievement and a Video
with Audience Reaction Scenes
A repeated measures multivariate analysis of variance (MANOVA) was
used to test against the null and research hypotheses. All groups were
compared using Wilks’ lambda which compares the means of the pretest and the
posttest to determine significance identified by the treatments. Combined, the
groups showed no significance ( = .069) indicating no associations were
identified by the experiment. Effect size ( = .046) was determined using a
partial eta squared calculation. Using Cohen guideline values for interpretation
of for studies incorporating the same number of groups and variables, a small
effect size would be reflected by a of .02 and a medium effect size would
show a of .14 (Steyn & Ellis, 2009).
Descriptive statistics showed a mean increase in score for the video with
audience reaction group to be (0.95), while the control group improved (1.21).
Conclusion Regarding Hypothesis 1a
Because significant ( < .05) associations were not found between a video
with audience reaction scenes and instructional achievement, the research
hypothesis of association could not be confirmed so the null hypothesis is
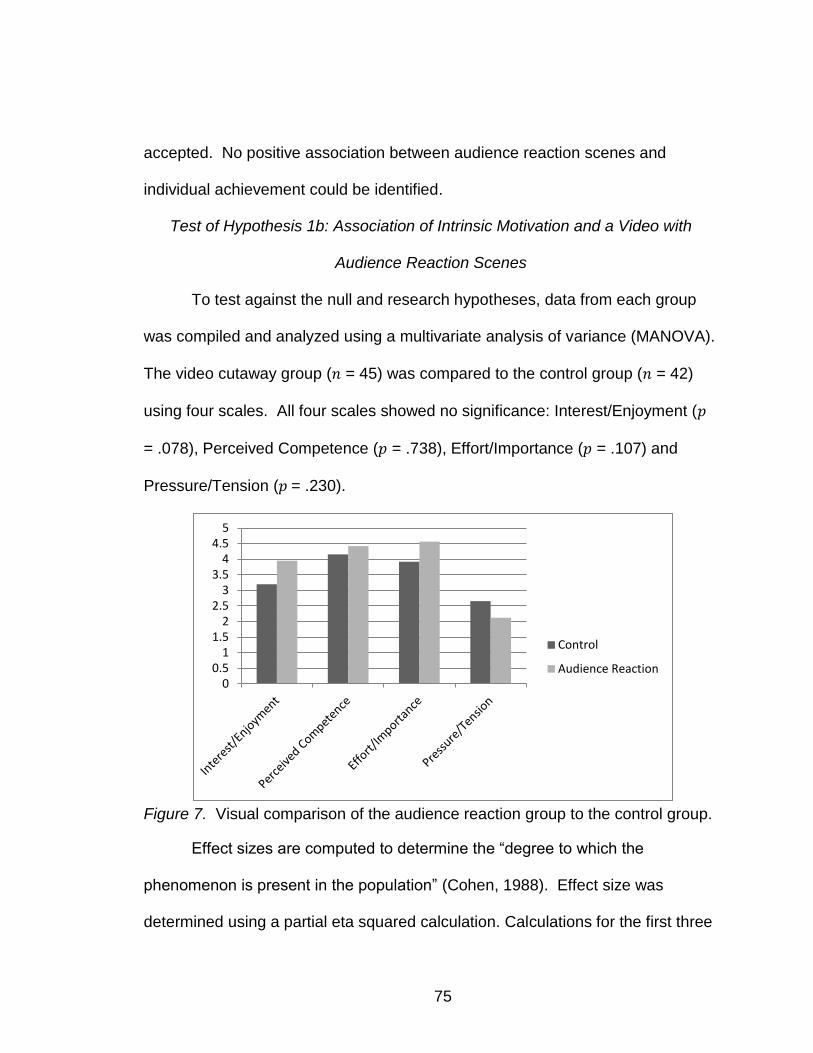
75
accepted. No positive association between audience reaction scenes and
individual achievement could be identified.
Test of Hypothesis 1b: Association of Intrinsic Motivation and a Video with
Audience Reaction Scenes
To test against the null and research hypotheses, data from each group
was compiled and analyzed using a multivariate analysis of variance (MANOVA).
The video cutaway group ( = 45) was compared to the control group ( = 42)
using four scales. All four scales showed no significance: Interest/Enjoyment (
= .078), Perceived Competence ( = .738), Effort/Importance ( = .107) and
Pressure/Tension ( = .230).
Figure 7. Visual comparison of the audience reaction group to the control group.
Effect sizes are computed to determine the “degree to which the
phenomenon is present in the population” (Cohen, 1988). Effect size was
determined using a partial eta squared calculation. Calculations for the first three
0 0.5
1 1.5
2 2.5
3 3.5
4 4.5
5
Control
Audience Reaction
76
subscales in the motivation instrument showed a small to medium effect, while
the Pressure/Tension subscale registered a small effect. The subscales were:
Interest/Enjoyment ( = .072), Perceived Competence (
= .052),
Effort/Importance ( = .055) and Pressure/Tension (
= .028). Utilizing Cohen
Guideline Values for Interpretation of in studies incorporating the same
number of groups and variables, a small effect size would be reflected by a of
.02 and a medium effect size would show a of .14 (Steyn & Ellis, 2009).
In addition, Cohen’s d, the most commonly used effect size estimate
(Effect Size and Clinical/Practical Significance, 2012) was utilized to confirm the
effect size using the Effect Size Calculator from the University of Colorado at
Colorado Springs (Becker, 2000). Cohen’s d indicated a medium effect (see
figure 4) in both the Interest/Enjoyment Scale (d = .543) and the
Effort/Importance Scale (d = .523). The Pressure/Tension Scale (d = .420)
registered a small to medium effect while the Perceived Competence Scale (d =
.204) showed a small effect. Cohen generalized that d = .02 indicated a small
effect, d = .05 showed a medium effect and d = .08 signified a large effect
(Cohen, 1988).
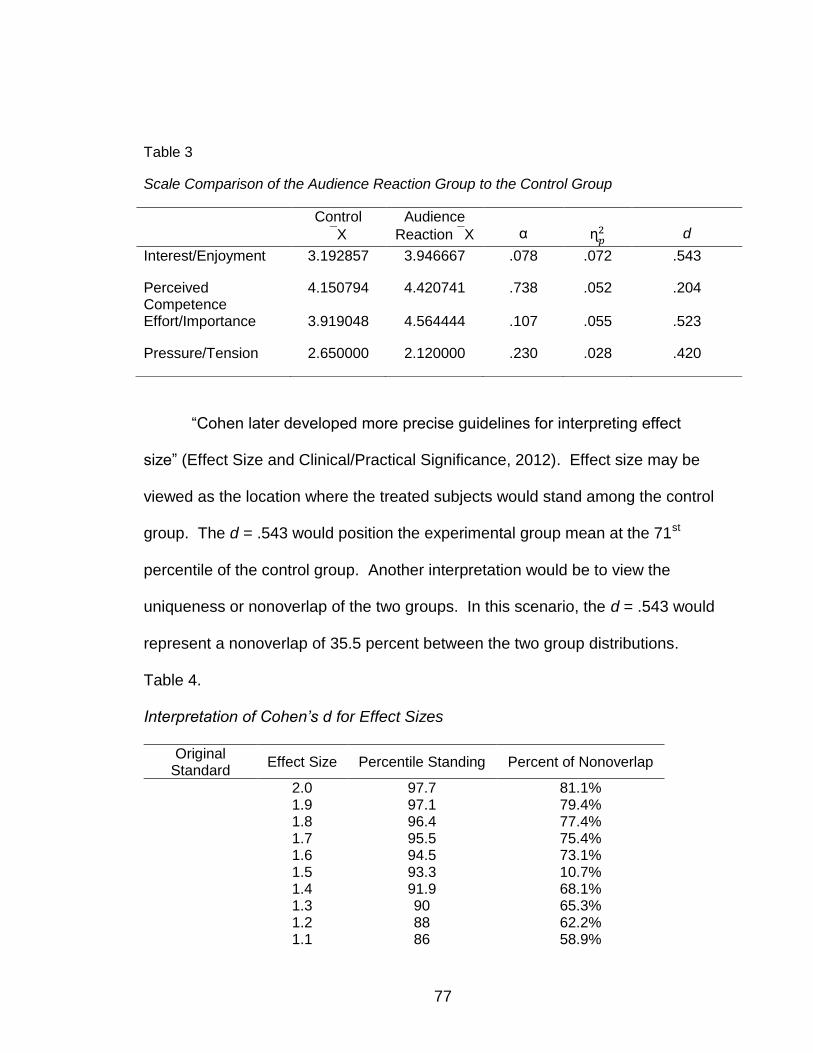
77
“Cohen later developed more precise guidelines for interpreting effect
size” (Effect Size and Clinical/Practical Significance, 2012). Effect size may be
viewed as the location where the treated subjects would stand among the control
group. The d = .543 would position the experimental group mean at the 71st
percentile of the control group. Another interpretation would be to view the
uniqueness or nonoverlap of the two groups. In this scenario, the d = .543 would
represent a nonoverlap of 35.5 percent between the two group distributions.
Table 4.
Interpretation of Cohen’s d for Effect Sizes
Original Standard
Effect Size Percentile Standing Percent of Nonoverlap
2.0 97.7 81.1% 1.9 97.1 79.4% 1.8 96.4 77.4% 1.7 95.5 75.4% 1.6 94.5 73.1% 1.5 93.3 10.7% 1.4 91.9 68.1% 1.3 90 65.3% 1.2 88 62.2% 1.1 86 58.9%
Table 3
Scale Comparison of the Audience Reaction Group to the Control Group
Control
X
Audience
Reaction X
α
d
Interest/Enjoyment 3.192857 3.946667 .078 .072 .543
Perceived Competence
4.150794 4.420741 .738 .052 .204
Effort/Importance 3.919048 4.564444 .107 .055 .523
Pressure/Tension 2.650000 2.120000 .230 .028 .420
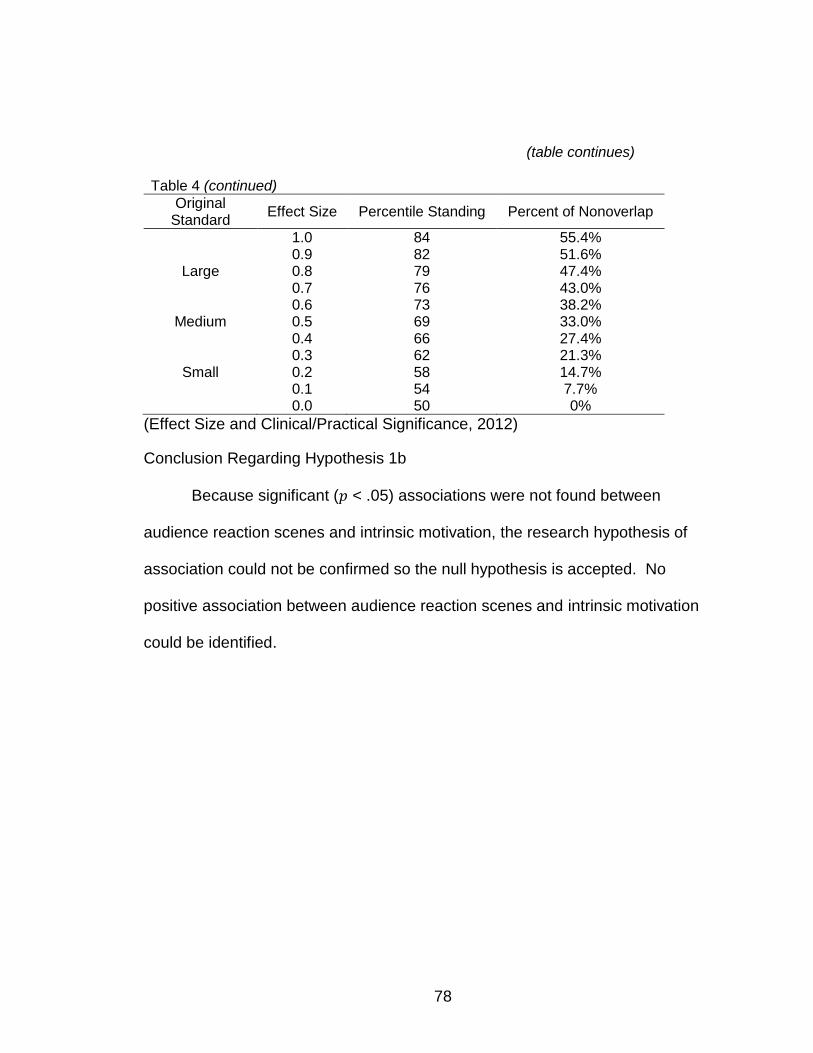
78
(table continues) Table 4 (continued)
Original Standard
Effect Size Percentile Standing Percent of Nonoverlap
1.0 84 55.4% 0.9 82 51.6%
Large 0.8 79 47.4% 0.7 76 43.0% 0.6 73 38.2%
Medium 0.5 69 33.0% 0.4 66 27.4% 0.3 62 21.3%
Small 0.2 58 14.7% 0.1 54 7.7% 0.0 50 0%
(Effect Size and Clinical/Practical Significance, 2012)
Conclusion Regarding Hypothesis 1b
Because significant ( < .05) associations were not found between
audience reaction scenes and intrinsic motivation, the research hypothesis of
association could not be confirmed so the null hypothesis is accepted. No
positive association between audience reaction scenes and intrinsic motivation
could be identified.
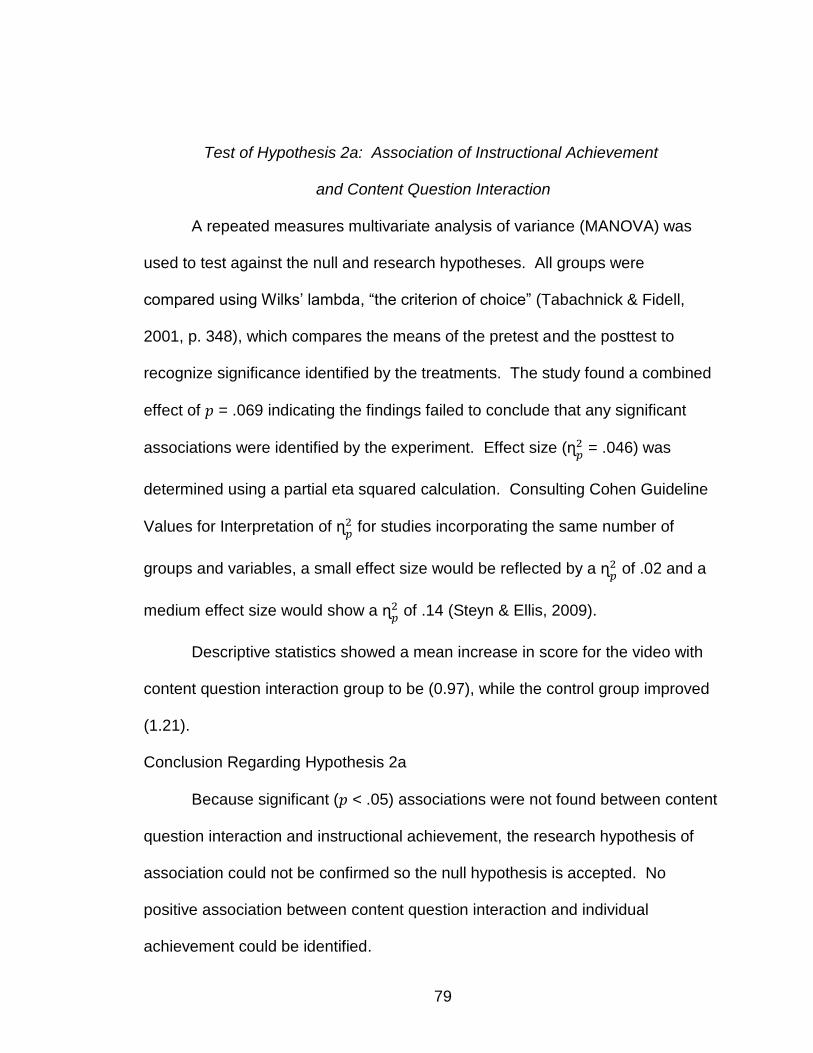
79
Test of Hypothesis 2a: Association of Instructional Achievement
and Content Question Interaction
A repeated measures multivariate analysis of variance (MANOVA) was
used to test against the null and research hypotheses. All groups were
compared using Wilks’ lambda, “the criterion of choice” (Tabachnick & Fidell,
2001, p. 348), which compares the means of the pretest and the posttest to
recognize significance identified by the treatments. The study found a combined
effect of = .069 indicating the findings failed to conclude that any significant
associations were identified by the experiment. Effect size ( = .046) was
determined using a partial eta squared calculation. Consulting Cohen Guideline
Values for Interpretation of for studies incorporating the same number of
groups and variables, a small effect size would be reflected by a of .02 and a
medium effect size would show a of .14 (Steyn & Ellis, 2009).
Descriptive statistics showed a mean increase in score for the video with
content question interaction group to be (0.97), while the control group improved
(1.21).
Conclusion Regarding Hypothesis 2a
Because significant ( < .05) associations were not found between content
question interaction and instructional achievement, the research hypothesis of
association could not be confirmed so the null hypothesis is accepted. No
positive association between content question interaction and individual
achievement could be identified.

80
Test of Hypothesis 2b: Association of Intrinsic Motivation
and Content Question Interaction
To test against the null and research hypotheses, data from each group
was compiled and analyzed using a multivariate analysis of variance (MANOVA).
The video content question interaction group ( = 31) was compared to the
control group ( = 42) using four scales. All four scales showed no significance:
Interest/Enjoyment ( = .250), Perceived Competence ( = .572),
Effort/Importance ( = .673) and Pressure/Tension ( = .512).
Figure 8. Visual comparison of the content question interaction group to the control group.
Effect size was determined using a partial eta squared calculation.
Calculations for the first three subscales in the motivation instrument showed a
small to medium effect, while the Pressure/Tension subscale registered a small
effect. The subscales were: Interest/Enjoyment ( = .072), Perceived
0 0.5
1 1.5
2 2.5
3 3.5
4 4.5
5
Control
Content Question Interaction
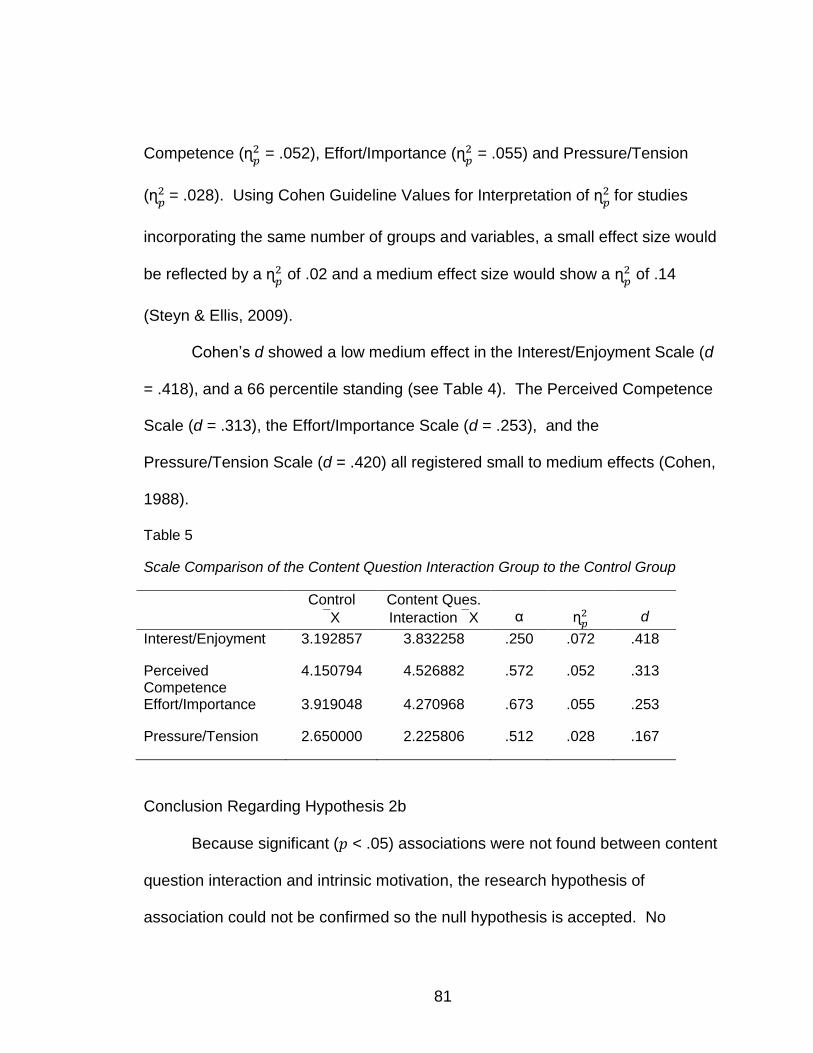
81
Competence ( = .052), Effort/Importance (
= .055) and Pressure/Tension
( = .028). Using Cohen Guideline Values for Interpretation of
for studies
incorporating the same number of groups and variables, a small effect size would
be reflected by a of .02 and a medium effect size would show a
of .14
(Steyn & Ellis, 2009).
Cohen’s d showed a low medium effect in the Interest/Enjoyment Scale (d
= .418), and a 66 percentile standing (see Table 4). The Perceived Competence
Scale (d = .313), the Effort/Importance Scale (d = .253), and the
Pressure/Tension Scale (d = .420) all registered small to medium effects (Cohen,
1988).
Table 5
Scale Comparison of the Content Question Interaction Group to the Control Group
Control
X
Content Ques.
Interaction X
α
d
Interest/Enjoyment 3.192857 3.832258 .250 .072 .418
Perceived Competence
4.150794 4.526882 .572 .052 .313
Effort/Importance 3.919048 4.270968 .673 .055 .253
Pressure/Tension 2.650000 2.225806 .512 .028 .167
Conclusion Regarding Hypothesis 2b
Because significant ( < .05) associations were not found between content
question interaction and intrinsic motivation, the research hypothesis of
association could not be confirmed so the null hypothesis is accepted. No
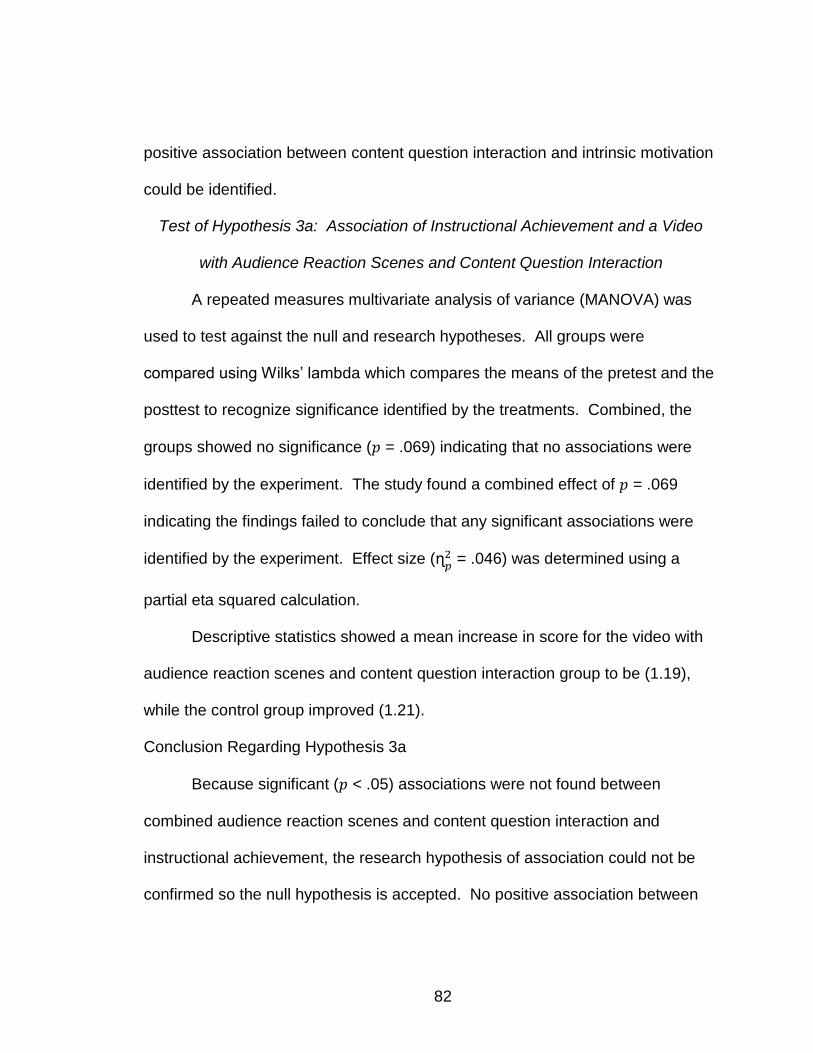
82
positive association between content question interaction and intrinsic motivation
could be identified.
Test of Hypothesis 3a: Association of Instructional Achievement and a Video
with Audience Reaction Scenes and Content Question Interaction
A repeated measures multivariate analysis of variance (MANOVA) was
used to test against the null and research hypotheses. All groups were
compared using Wilks’ lambda which compares the means of the pretest and the
posttest to recognize significance identified by the treatments. Combined, the
groups showed no significance ( = .069) indicating that no associations were
identified by the experiment. The study found a combined effect of = .069
indicating the findings failed to conclude that any significant associations were
identified by the experiment. Effect size ( = .046) was determined using a
partial eta squared calculation.
Descriptive statistics showed a mean increase in score for the video with
audience reaction scenes and content question interaction group to be (1.19),
while the control group improved (1.21).
Conclusion Regarding Hypothesis 3a
Because significant ( < .05) associations were not found between
combined audience reaction scenes and content question interaction and
instructional achievement, the research hypothesis of association could not be
confirmed so the null hypothesis is accepted. No positive association between

83
combined audience reaction scenes and content question interaction and
individual achievement could be identified.
Test of Hypothesis 3b: Association of Intrinsic Motivation and a Video with
Audience Reaction Scenes Content Question Interaction
To test against the null and research hypotheses, data from each group
was compiled and analyzed using a multivariate analysis of variance (MANOVA).
The video cutaway group ( = 37) was compared to the control group ( = 42)
using four scales. Three scales showed significance: Interest/Enjoyment ( =
.007), Perceived Competence ( = .027) and Effort/Importance ( = .035). The
forth scale, Pressure/Tension ( = .384), showed no significance. Since the
pressure/tension scale is used as a “negative predictor of intrinsic motivation”
(Intrinsic Motivation Inventory, 2012, para 1), lack of significance on this scale
was disregarded.

84
Figure 9. Visual comparison of the combination audience reaction and content question interaction group to the control group.
Effect size was determined using a partial eta squared calculation.
Calculations for the first three subscales in the motivation instrument showed a
small to medium effect, while the Pressure/Tension subscale registered a small
effect. The subscales were: Interest/Enjoyment ( = .072), Perceived
Competence ( = .052), Effort/Importance (
= .055) and Pressure/Tension
( = .028). Utilizing Cohen Guideline Values for Interpretation of
for studies
incorporating the same number of groups and variables, a small effect size would
be reflected by a of .02 and a medium effect size would show a
of .14
(Steyn & Ellis, 2009).
Cohen’s d confirmed a medium effect in both the Interest/Enjoyment Scale
(d = .543) and the Effort/Importance Scale (d = .523). Both these scales register
in the 69 percentile standing with a nonoverlap of 33 percent (See Table 4). The
0
1
2
3
4
5
6
Control
Audience Reaction and Content Question Interaction
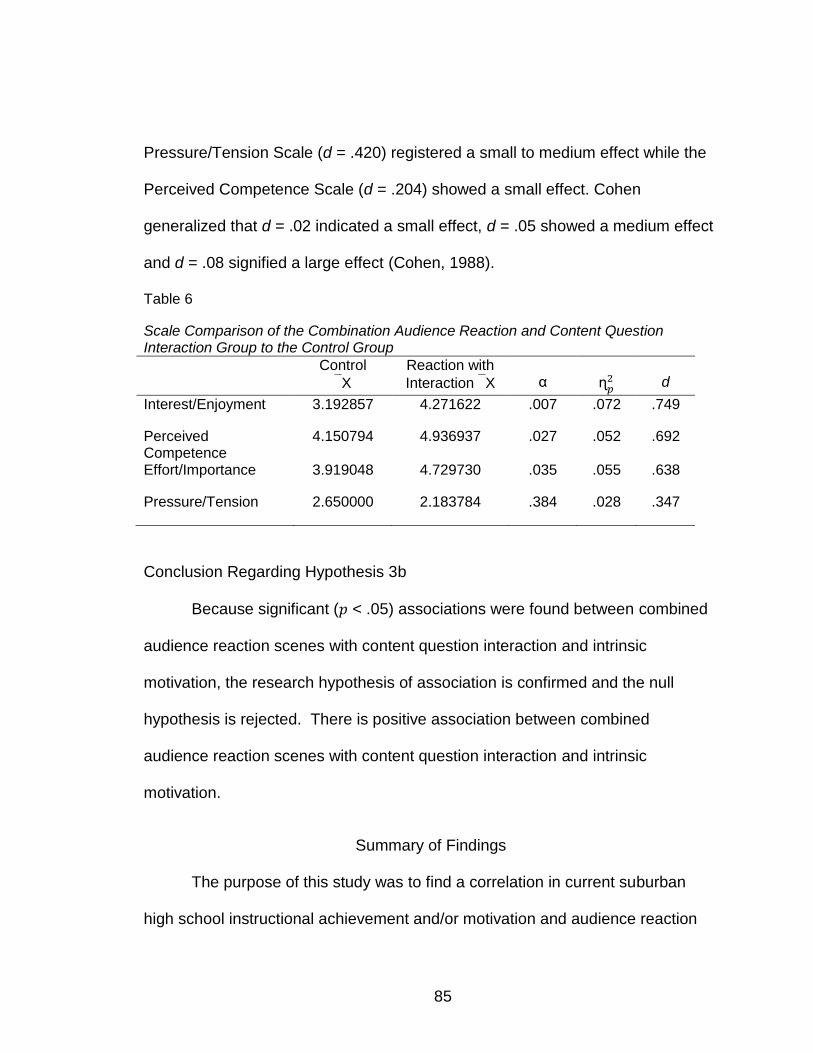
85
Pressure/Tension Scale (d = .420) registered a small to medium effect while the
Perceived Competence Scale (d = .204) showed a small effect. Cohen
generalized that d = .02 indicated a small effect, d = .05 showed a medium effect
and d = .08 signified a large effect (Cohen, 1988).
Table 6
Scale Comparison of the Combination Audience Reaction and Content Question Interaction Group to the Control Group
Control
X
Reaction with
Interaction X
α
d
Interest/Enjoyment 3.192857 4.271622 .007 .072 .749
Perceived Competence
4.150794 4.936937 .027 .052 .692
Effort/Importance 3.919048 4.729730 .035 .055 .638
Pressure/Tension 2.650000 2.183784 .384 .028 .347
Conclusion Regarding Hypothesis 3b
Because significant ( < .05) associations were found between combined
audience reaction scenes with content question interaction and intrinsic
motivation, the research hypothesis of association is confirmed and the null
hypothesis is rejected. There is positive association between combined
audience reaction scenes with content question interaction and intrinsic
motivation.
Summary of Findings
The purpose of this study was to find a correlation in current suburban
high school instructional achievement and/or motivation and audience reaction

86
scenes in a video presentation and/or content question interaction in the
presentation. The experiment found a significant association in student
motivation when combining both techniques, while no association between
instructional achievement and the treatments could be isolated.
The experiment found no significant instructional achievement utilizing any
of the experimental treatments compared to the control group. While limited
differences were found between the scores of the experimental groups, it did
appear from casual observation that male students appeared to be more focused
on the task than female students.
Similarly, no significant differences were found in intrinsic motivation
between the control group and either of the single-factor groups utilizing
audience reaction scenes or content question interaction. While not enough to
signify significance, when comparing both the single factors, audience reaction
scenes in the video showed more association than the content question
interaction factor.
However, combining the two factors triggered a reaction in the students.
Significant differences in intrinsic motivation were found in the group utilizing both
the audience reaction scenes and content question interaction in three of the four
subscales. The interest/enjoyment ( = .007), perceived competence ( = .027)
and effort/importance ( = .035) subscales all measured significant differences.
This finding indicates that students require a significant amount of stimuli
before the threshold can be penetrated to attune motivation to attend to the
87
lesson. If the environment in which the majority of students spend their out-of-
school hours is considered, this conclusion is not surprising.
There appeared to be little difference in the pressure/tension response
among all groups. Each scored extremely low, with a few outliers. The
pressure/tension response low scores indicate that students are quite
comfortable with the use of video instruction as well as the immediate response
system popularized by handheld clickers.
Findings in this scale may be attributed to the role that video occupies in
the lives of today’s teenagers and the comfort level they feel with the medium.
Additionally, handheld response systems have been common in classrooms and
most students have experienced interrupting the lesson to stop and answer
questions.
The major results for the hypotheses listed in Chapter 3 were:
Hypothesis 1: Insufficient evidence was found to accept that video
incorporating audience reaction scenes was associated with instructional
achievement or intrinsic motivation.
Hypothesis 2: Insufficient evidence was found to accept that video
incorporating content question interaction was associated with instructional
achievement or intrinsic motivation.
Hypothesis 3: Confirmed that video incorporating both audience reaction
scenes and content question interaction was associated with intrinsic motivation.
Insufficient evidence was found to accept that video incorporating both audience

88
reaction scenes and content question interaction was associated with
instructional achievement.
89
CHAPTER 5
SUMMARY, DISCUSSION, AND RECOMMENDATIONS
Summary of Hypothesis Testing
Statistically significant ( < .05) association was not found between
positive instructional achievement and a video containing audience reaction
scenes. Therefore, there was insufficient evidence to conclude Research
Hypothesis 1a. In addition, analysis indicated no statistically significant ( < .05)
association between intrinsic motivation and a video containing audience
reaction scenes. Therefore, insufficient evidence was found to accept Research
Hypothesis 1b.
Statistically significant ( < .05) association was not found between
positive instructional achievement and a video with content question interaction,
thus Research Hypothesis 2a was unable to be confirmed. In addition, analysis
indicated no statistically significant ( < .05) association between intrinsic
motivation and a content question interaction. Therefore, the experiment failed to
confirm Research Hypothesis 2b.
No statistically significant ( < .05) association was found between
positive instructional achievement and a video containing combined audience
reaction scenes with content question interaction. Therefore, the experiment
failed to conclude Research Hypothesis 3a.
90
Analysis determined that statistically significant (interest/enjoyment =
.007, perceived competence = .027, effort/importance = .035) associations
were found between a video containing combined audience reaction scenes with
content question interaction and intrinsic motivation. Null Hypothesis 3b was
therefore rejected and the research hypothesis was accepted confirming a
positive association between student motivation and a video lecture than
includes audience reaction scenes and content question interaction.
It should be noted that the Intrinsic Motivation Inventory’s
Pressure/Tension scale was consistently ranked low across all groups indicating
high school students are comfortable with computer use, visual instruction and
interactive technology. The scale is considered a negative predictor of
motivation; therefore low scores indicate high motivation. Even though no
significance was found in this scale, the results do not contradict the finding of
significance in the combined treatment group.
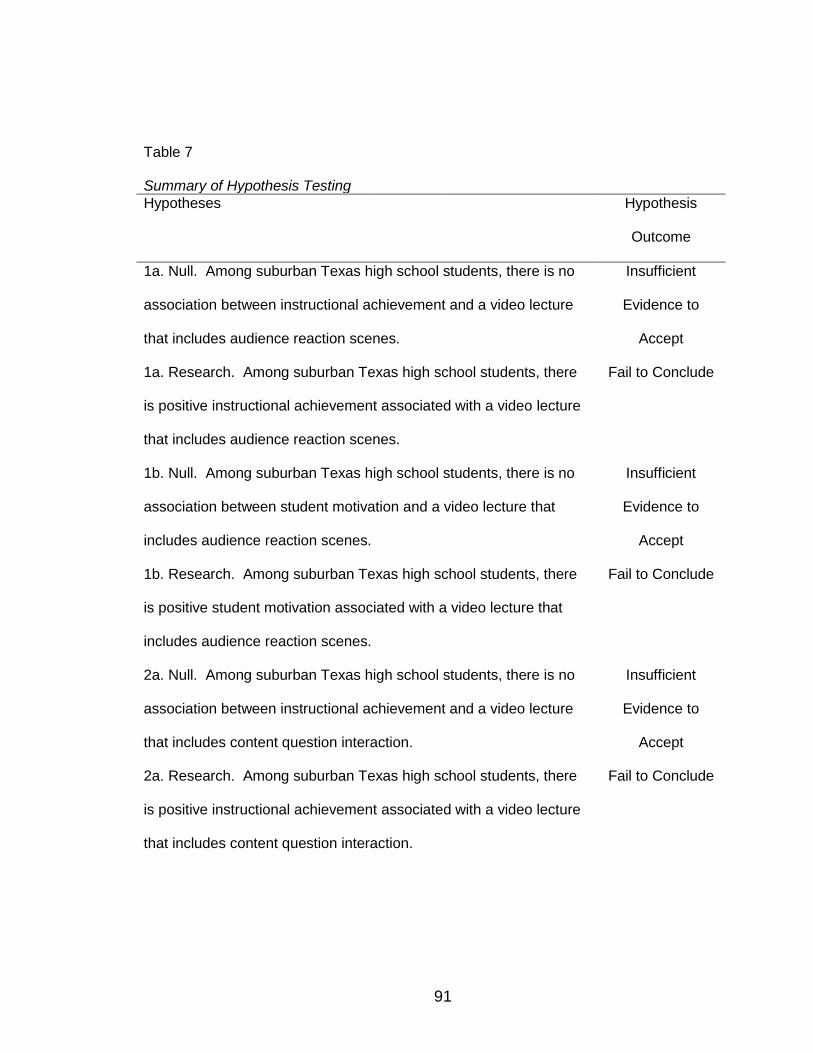
91
Table 7 Summary of Hypothesis Testing
Hypotheses Hypothesis
Outcome
1a. Null. Among suburban Texas high school students, there is no
association between instructional achievement and a video lecture
that includes audience reaction scenes.
Insufficient
Evidence to
Accept
1a. Research. Among suburban Texas high school students, there
is positive instructional achievement associated with a video lecture
that includes audience reaction scenes.
Fail to Conclude
1b. Null. Among suburban Texas high school students, there is no
association between student motivation and a video lecture that
includes audience reaction scenes.
Insufficient
Evidence to
Accept
1b. Research. Among suburban Texas high school students, there
is positive student motivation associated with a video lecture that
includes audience reaction scenes.
Fail to Conclude
2a. Null. Among suburban Texas high school students, there is no
association between instructional achievement and a video lecture
that includes content question interaction.
Insufficient
Evidence to
Accept
2a. Research. Among suburban Texas high school students, there
is positive instructional achievement associated with a video lecture
that includes content question interaction.
Fail to Conclude
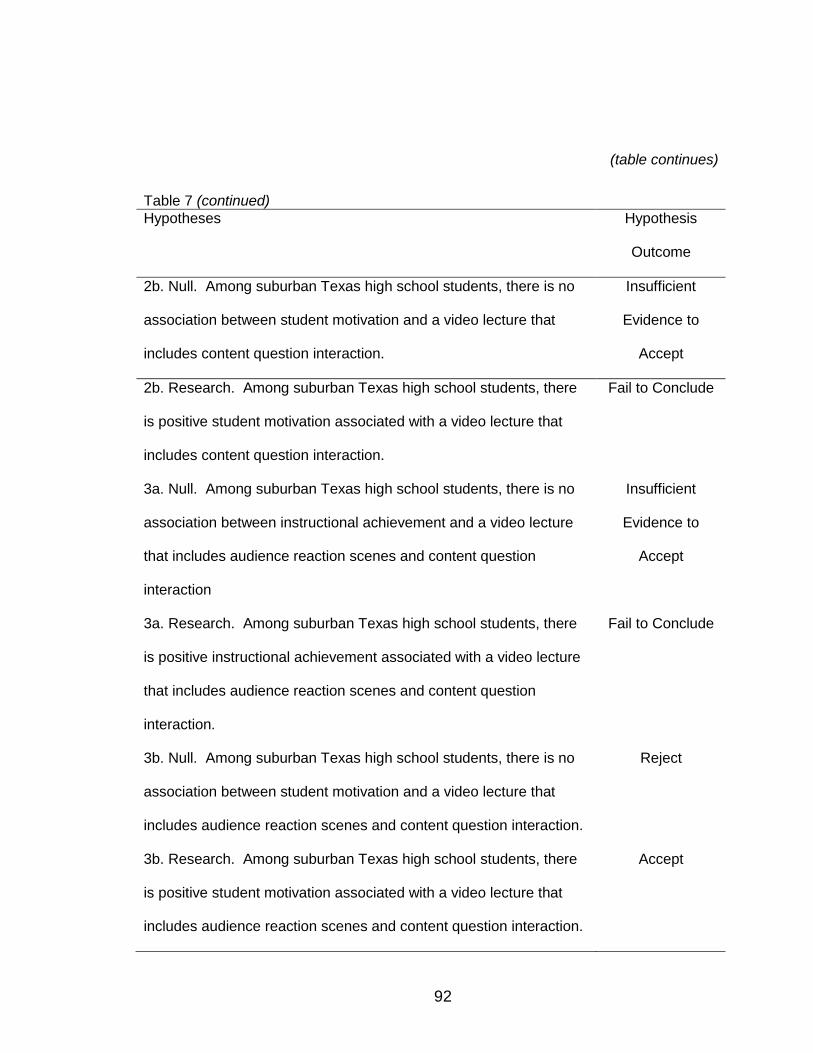
92
(table continues)
Table 7 (continued)
Hypotheses Hypothesis
Outcome
2b. Null. Among suburban Texas high school students, there is no
association between student motivation and a video lecture that
includes content question interaction.
Insufficient
Evidence to
Accept
2b. Research. Among suburban Texas high school students, there
is positive student motivation associated with a video lecture that
includes content question interaction.
Fail to Conclude
3a. Null. Among suburban Texas high school students, there is no
association between instructional achievement and a video lecture
that includes audience reaction scenes and content question
interaction
Insufficient
Evidence to
Accept
3a. Research. Among suburban Texas high school students, there
is positive instructional achievement associated with a video lecture
that includes audience reaction scenes and content question
interaction.
Fail to Conclude
3b. Null. Among suburban Texas high school students, there is no
association between student motivation and a video lecture that
includes audience reaction scenes and content question interaction.
Reject
3b. Research. Among suburban Texas high school students, there
is positive student motivation associated with a video lecture that
includes audience reaction scenes and content question interaction.
Accept

93
From these results we can conclude that individually, neither the visual
interaction represented by the student reaction segments, nor the physical
interaction and engagement of answering questions with feedback at specific
points within the video, are enough to interest high school students to a
motivated state for the lesson. However, when used in concert, the two distinct
elements of visual interaction and physical interaction with feedback trigger
significantly more motivation.
As reported in Chapters 1 and 2, today’s high school students are
surrounded by a constant onslaught of rapid-fire visual stimulation (Healy, 1990;
Lemke, 2010). “It is now clear that as a result of this ubiquitous environment and
the sheer volume of their interaction with it, today’s students think and process
information fundamentally differently from their predecessors” (Prensky, 2001, p.
1). Because of the experiences and the environment which today’s students
bring to the classroom, classroom teachers must overcome greater obstacles to
maintain student attention than in years past. As Medina (2008) observed, “We
don’t pay attention to boring things” (p. 71).
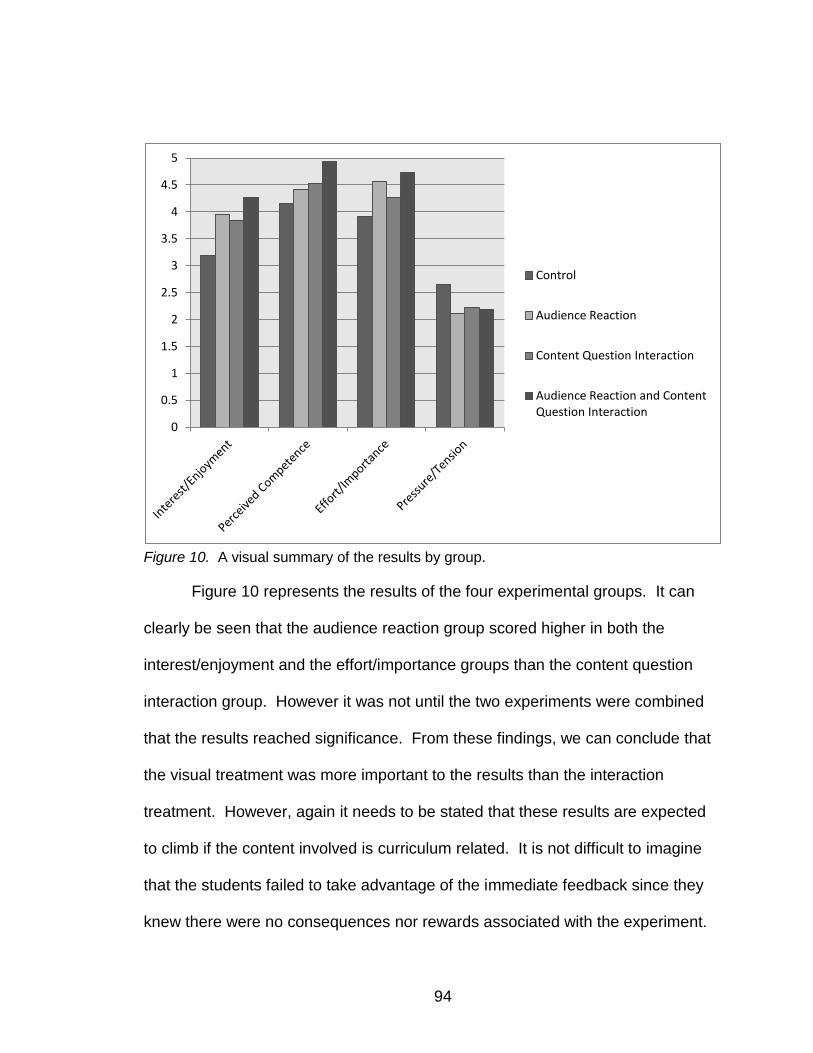
94
Figure 10. A visual summary of the results by group.
Figure 10 represents the results of the four experimental groups. It can
clearly be seen that the audience reaction group scored higher in both the
interest/enjoyment and the effort/importance groups than the content question
interaction group. However it was not until the two experiments were combined
that the results reached significance. From these findings, we can conclude that
the visual treatment was more important to the results than the interaction
treatment. However, again it needs to be stated that these results are expected
to climb if the content involved is curriculum related. It is not difficult to imagine
that the students failed to take advantage of the immediate feedback since they
knew there were no consequences nor rewards associated with the experiment.
0
0.5
1
1.5
2
2.5
3
3.5
4
4.5
5
Control
Audience Reaction
Content Question Interaction
Audience Reaction and Content Question Interaction
95
Another reason the results may not have been as robust as possible is
that the study was conducted during the last two weeks of the school year. In
Texas, state testing is conducted approximately five weeks prior to the end of the
school year. Teachers are understandably reluctant to allow interruptions in their
classes until after testing has been completed. This window was the best
timeframe to obtain access to a broad range of students; however it may have
contributed to below optimum efforts from the students.
Finally, the study was analyzed using a two-tailed design which looks for
results in both the positive and the negative directions. If the assumption that the
video incorporating the experiments would not harm the instruction was utilized,
the area from which to find positive results would have increased. This would
almost certainly have increased the significant findings.
One area which has not been fully addressed is why the combined group
scored higher than all other groups. While the audience reaction group did show
the most gain of the two individual treatments, it was not until the two were
incorporated into one treatment that the current level of significance was
breached. Many theories may be considered.
Today’s students are a sophisticated audience. They constantly view
multimillion dollar television commercials which tell an entire story in less than
one minute. They view sports on television with a dozen cameras and graphics
flying in from every corner of the screen, with statistical information in almost
every quadrant. They have grown up viewing motion pictures containing actors
96
interacting effortlessly and believably with alien creatures, natural disasters, and
all forms of fantasy. Meanwhile, teachers hope to keep them interested in an
almost frozen talking head for fifteen minutes (or longer).
Today’s students live in a saturated world. Students cannot drive down a
roadway without passing billboards for every conceivable product. They cannot
log into a computer without having popup boxes asking for their personal
information or trying to sell them something. Teenagers cannot walk down the
hallway at many schools without seeing TV monitors in the hallways alerting
them to constantly updated information. They cannot sit down to study without
music in their ears and a cellphone nearby constantly buzzing with messages
from their friends. Students have become desensitized to much of what is
attempting to gain their attention. It is in this environment that educational
lessons must attempt to break through the clutter to reach students.
Combined strategy instruction is another concept which may help explain
the results. Studies (see Alfassi, 2004) have shown positive results when
implementing two strategies when teaching. Combining differing strategies
allows teachers to more completely reach students with the strategy most helpful
to the individual student while reinforcing the lesson using independent channels.
In this case, the results may have increased since both the action of watching the
video and the action of taking a brief quiz were two distinct yet reinforcing
actions.
97
Implications of Findings Regarding Instructional Achievement
Even though no scores showed significance among the four experimental
groups, beneficial information was gathered in this experiment. As previously
reported, study participants did not sample material pertinent to the class in
which they were enrolled.
It became clear during the survey process that some students were aware
that this experiment had no relationship to the class through which they were
participating and their effort would not be measured by their teacher. Through
observation, it appeared that some students were not paying close attention and
therefore, those responses in the instructional achievement segment of the
experiment may not have demonstrated the student’s best effort.
Although students were given the opportunity to review and relearn in all
four groups, no one was observed utilizing this opportunity, although this was not
specifically monitored. Considering two groups received immediate feedback
throughout the lecture, it would seem that at least some students would want to
review a segment of the video that they may not have understood properly.
Again, the reality that this activity was not part of their classroom responsibilities
may have influenced to this lack of review and contributed to lower posttest
scores.
It would be desirable to associate the lesson(s) with classroom content
prior to further research concerning the validity of different treatments of lecture
98
capture. Therefore at this time, the results are insufficient to produce any
implications regarding instructional achievement.
Implications of Findings Regarding Intrinsic Motivation
Even though student engagement is an acknowledged key component of
effective learning, many of today’s students are bored, which leads to lack of
attention and effort, which leads to lack of learning (De Fraja et al., 2010; Haag,
2012; Marzano & Pickering, 2011; Medina, 2008).
The findings of this study indicate that more stimulation for students
equates to more motivation. Three treatments were created in addition to the
typical video presentation for the control group. The video containing audience
reaction scenes which should stimulate the students through peer pressure and
positive reinforcement was not sufficient to produce a significant positive result.
Likewise, a video without the audience reaction scenes but containing content
interaction with instructional reinforcement through interruptions of the video to
answer questions via the computer was not enough to achieve a significant
motivational difference. Both treatments independently were not enough to gain
the students’ interest.
However, when the two elements were combined into a video that
incorporated audience reaction scenes and content interaction via computer
responses, the students were significantly motivated to view the lesson. Since
neither the audience reaction scenes nor the content interaction measured
99
significant motivation independently, it must be assumed that today’s students
react favorably to multiple stimuli.
If further studies confirm these findings, the implications seem obvious to
educators. As reported in Chapters 1 and 2, today’s students are different than
those of generations past. Being surrounded by a constant stream of messages,
images, sounds, and interruptions has created a different student than most
teachers were trained to teach. Just as significant, these students are expected
to be aware of stalkers on the Internet, know not to respond to marketers calling
their cell phones, delete messages from overseas strangers promising money,
and not be sucked in by the most sophisticated emotion-laden advertisements in
their television shows and online videos.
These are the consumers of today’s high schools. They have been
trained to tune out things that do not interest them, things that do not stimulate
them, and judge all their media with a critical eye. And herein lies the problem,
students are acclimated to blockbuster movies, network television and expensive
online advertising that seem to have almost limitless tools and budgets with
which to fight for the attention of every eyeball possible. In this environment,
teachers are trying to keep the attention of their students with limited time, tools
and budgets. It is indeed a battle with the odds against educators, before they
even begin.
Great advancements have been made in the area of lecture capture in just
the past few years. Teachers and institutions have realized that not only do
100
students benefit from reviewing material covered in class, but many students
miss class sessions for school activities and or illness. Also, the proliferation of
online learning is penetrating high schools across the country for remediation and
advancement, in addition to the virtual secondary campuses now available.
Blackboard (2012) recently published a video that states, “By the year 2019, half
of the high school courses in America will be delivered online.” Most online
classes rely in varying degrees on video presentations.
If the expansion in the use of online education and video instruction in our
schools continues, we must also carefully understand today’s audience. A few
simple and inexpensive techniques either to help gain and keep student attention
and motivation, or not interrupt the same, should prove beneficial in the
educational process.
Comparison of Findings to Previous Studies
No studies have been identified which measured instructional
achievement based upon the delivery methods of video lecture capture. All
published studies have measured user preference rather than pretest/posttest
scores.
The videos with audience reaction scenes were modeled after a study by
Baggaley and Duck (1976). In their study, a video was integrated with audience
reaction scenes showing positive audience feedback—students taking notes,
attentive, and impressed. A second video carried the identical lecture, however
101
the audience reaction scenes were negative---bored and inattentive,
unimpressed students.
Baggaley and Duck’s (1976) study measured audience reactions to the
lecturer. The audience members did not know the speaker and made judgments
based solely on the video presentation. They found “particularly powerful effects
upon the perceived interest value and popularity” (p. 95) of the instructor.
Utilizing a semantic differential seven-point scale, the
confusing/straightforward scale showed a positive difference ( t = 2.74), as did
the interesting/uninteresting ( t = 2.74), and the expert/inexpert ( t = 1.92). The
popular/unpopular scale was the greatest indicator showing a ( t = 4.35)
difference. The previous research did not test for instructional achievement.
The current experiment did not incorporate negative audience feedback,
instead a video with no feedback at all was utilized, since it is believed that
instructors would not publish a video containing students’ negative reactions.
Also, the typical uses of video instruction in the classroom involve the teacher of
record appearing in the presentations so students would presumably have a
preconceived opinion of the teacher. For that reason, an instrument that
measured student motivation was utilized instead of the previous study which
measured ratings of the speaker.
The present study found student interest, as measured by motivation, to
be significant when the audience reaction scenes are combined with content
102
question interaction, however no significance was found with the audience
reaction scenes independently.
To mirror the effects of the Baggaley and Duck study, results should have
shown significance in both the audience reaction scenes group as well as the
group viewing the combined treatment utilizing both audience reaction scenes
and content interaction, which did show significance. If the current findings are
confirmed in future studies, the conclusion would be that today’s students require
more stimulation to become interested than past generations.
Likewise, as Fies and Marshall (2006) found, studies in classroom
response systems have not examined “tightly controlled comparisons in which
the only difference is the use, or lack of use, of a CRS” (p. 106). In 2008,
Morling, et al. found a small, positive effect on test scores using classroom
response systems but this study compared students in two sections of a course
against students in two other sections. Obviously, many variables were
uncontrollable.
Similarly, Pradhan et al (2005) found significant positive achievement
when a classroom group heard a lecture contrasted to a group hearing the
lecture utilizing a response system. Clearly, this study does not involve video
lecture capture.
Students in any high school classrooms have utilized some type of content
interaction during their educational careers. Classroom clicker systems have
been utilized extensively in K-12 over the years. While the current experiment

103
was accomplished utilizing Blackboard, students still received instantaneous
feedback during the learning process.
Recommendations for Future Studies
Additional studies are planned to recreate the experiment incorporating
class relevant instruction. As mentioned previously, it is believed that all future
studies should be tied specifically to class content with students held responsible
for their learning. A grade to most students would be a motivating factor that was
lacking in the pretest/posttest portion of the current study.
This would require four lectures to be recorded and prepared so that
students may rotate through the sequence of lectures, viewing a differing
treatment each time. To obtain valid data, students would be broken into four
groups with each group viewing a differing treatment of the same lecture. After
all four lectures have been viewed, each student would have experienced each
treatment. Then cumulative scores would reflect the differences between the
four treatments and a more precise understanding could be made of the
relationship between various video presentation techniques and academic
achievement.
With the greater use of video instruction continuing to gain momentum, it
is hoped that more studies in various ways to enhance student engagement and
potentially influence greater learning will once again become commonplace. A
lack of recent studies may be attributed to the “grocery truck debate” between
Clark (1994) and Kozma (1994), but whatever the reason, video instruction is
104
flourishing and finding simple, inexpensive techniques that may enhance the
presentation should be important to all who utilize this medium.
Investigators may also benefit by replicating other studies by Baggaley
and Duck. Although dated, they look at ways that may enhance instruction or
simply identify ways that demotivate students. Essentially they examined how
“visual cues quite irrelevant to a performance may unwittingly affect judgments of
it” (Baggaley & Duck, 1976, p. 86).
A common idea among educators and speakers in general would be that
content carries the day so why worry about video techniques at all, but Baggaley
and Duck concluded after six differing experiments that “the simple visual
imagery of a television production may actually dominate its verbal content,
overriding audience reactions to it in several ways” (Baggaley & Duck, 1976, p.
105).
The first study by Baggaley and Duck (1976) concerned the ramifications
of framing to include the notes the speaker used compared to a tighter framing
showing only the speaker. Two cameras recorded the lecture simultaneously
with the speaker addressing the area between the cameras, so the only
difference in the videos was the framing. Significant differences were found in
both the confusing/straightforward and the fair/unfair scales. If this study was
duplicated and the findings are consistent with the earlier study, most lecture
capture cameras could easily be manipulated to frame the speaker without notes
if necessary. Again, not an overwhelming factor to improve the content, but if it

105
simply removed the perception that the speaker could be confusing, would not
the little effort this technique would require be worth the result?
Another study by Baggaley and Duck (1976) was borrowed from the
common television and motion picture practice of “keying in” or replacing the
background with another. In the study, they recorded a speaker, again with two
cameras to remove any difference in delivery. One version showed the speaker
in front of a plain studio wall while the second recording electronically replaced
the plain wall with a background relevant to the content. Significant differences
were reached in this study in the reliable/unreliable, and expert/inexpert scales.
To update this experiment for today’s situations, one might record the speaker in
a classroom setting compared to a conference room/library setting.
A similar experiment was undertaken more recently in a college classroom
situation. Instructors were recorded giving the same lecture in three different
settings, a college classroom framed to look over the shoulders of students in the
front rows, a studio framed in a head and shoulders, and a studio with a three
quarter framing of the speaker who moved from behind the desk, around, and
eventually sat on the edge of the desk while continuing the presentation.
Students significantly preferred the wider-framed studio recording perceiving the
instructor to be more knowledgeable and accessible (Bland, 2002). Again, if
further studies confirm the significance of the previous two, the effort to record in
one setting instead of another seems insignificant compared to the return of
positive feelings of expertise and reliability that may be generated.
106
Baggaley and Duck’s (1976) third experiment returned results which may
seem surprising. A presentation was recorded with the speaker directly
addressing one camera while another camera simultaneously recorded from a 45
degree angle as though the speaker was participating in a discussion. In all
results, the 45 degree angle condition drew more favorable responses than in the
direct condition. Significance was found in the confusing/straightforward,
profound/shallow, interesting/uninteresting, popular/unpopular and
expert/inexpert scales. If new studies confirm this finding, why would anyone
oppose moving the camera to a position to gain expert, popular, interesting and
profound impressions?
All of these techniques could be used by instructors with little expense or
effort if proceedures can be determined which produce either instructional
achievement or significant student preference.
It will also be desirable to obtain an adequate sample to evaluate for
gender and grade point average to determine if either factor achieves a
significant relationship. Observations during the current experiment indicated
that boys were more attentive to the videos than girls. (This experiment did
measure for gender, but there was no significant difference.)
The results of this study were evaluated using a two-tailed analysis of the
data. As no negative effects were found in any of the treatment groups, a one-
tailed analysis of future studies should be considered. There is some
disagreement among researchers concerning the acceptability of one-tailed
107
analyses, but many consider one-tailed tests acceptable if the researcher’s
hypothesis is directional (Pillemer, 1991).
Using a single-tailed analysis would look for significance in only one
direction instead of the current study which looked in both directions. If only a
positive relationship was sought, significance at 0.05 would be achieved if the
results are identified in the top 5% of its distribution. The current study looked
only in the top 2.5% while also analyzing the bottom 2.5% (Statistical Consulting
Group, 2012).
Another study that would be extremely helpful for today’s teachers would
be based upon work by Mayer for “adding visualizations to verbal instruction”
(Mayer, 2011, p. 441). He writes this is “the promise of multimedia learning”
(Mayer, 2009, p. 1). With the increasing use of lecture capture, it appears
prudent to determine if the addition of graphics on the screen increases student
achievement or interest.
Regarding Instructional Achievement
It is important that future studies consider the issue of instructional
achievement. This study examined a social studies lesson and drew students
from all grade levels and from several classrooms. While presumably all
students were enrolled in a social studies class, the specific lesson presented
was not associated with any classes from which they participated in the
experiment.
108
Observations drawn during the experiment indicated some students may
not have given the lesson their complete attention and effort. Since there was no
consequence (grade) associated with the experiment, some appeared more
distracted than others. While the experiment was intentionally designed to draw
from differing classes so as to obtain responses from all grade levels, the lack of
a consequence associate with the effort is believed to have contributed to less
robust findings.
While this may indeed have been attributable to the lesson itself or the
mode of presentation, to pinpoint the source of these observations, class-related
material with class-related significance should be incorporated in future
experiments.
Regarding Intrinsic Motivation
This portion of the study was designed to address whether altering lesson
packaging has an impact on student learners. As discussed, impact may have
positive or negative outcomes by alerting the students to be more attentive or by
unintentionally causing students to be less engrossed in the presentation.
Results indicate that more activity, in the form of both visual action and learner
interaction, is positively associated with lesson impact, reflected by the student’s
motivation for the lesson.
Future studies should repeat the content packaging used in the current
study with lessons that reflect material covered by the course involved rather
than a lesson sampled by a random audience. It is also believed that the
109
Pressure/Tension scale contributes little to the overall findings as most students
are quite comfortable with technology so omitting this scale is recommended.
Summary
This experiment returned successful results both by finding significance in
one area of the study while also illustrating improvements for the administration
of future studies to obtain more robust results. While no significance could be
identified between different packaging techniques of the video lesson and
instructional achievement, it was determined that a more class-focused
presentation should be incorporated in the future. Since it became clear during
this study that the generic subject matter of the lesson may affect effort and
learning in individual students, further study is warranted using course specific
material.
However, when all students are viewing the same material, even with
differing packaging, the subject matter should not be a variable concerning the
interest or motivation of the students. Therefore the results found in the
motivation instrument when viewing the combined treatment of both audience
reaction scenes and content interaction is significant. Since this is the first study
found to address these issues in recent years, a follow-up study is planned to
confirm the findings.
To find significant student achievement in the form of higher scores on a
pretest/posttest would be ideal. But to simply find a way to more deeply engage
students through motivating factors, or by avoiding demotivating factors, is a
110
significant achievement as well. Frankly, most producers of instructional videos
are teachers themselves who have never been taught or considered the different
positive and negative ramifications that visual cues may have on their
presentations.
And certainly students deserve to have their likes and dislikes considered,
if it is possible with minimal effort and expense. Fair or unfair, classroom videos
are more critically viewed by students than in years past and subtly or overtly
they are compared to network television presentations.
The use of video in the classroom is growing each year and considering
the predictions of the growth of online learning in the future, growth of classroom
video will only accelerate in the future (Blackboard, 2012).
Further study is desired, but the current finding that students are more
motivated to learn from a lesson presented with both audience reaction scenes
and content interaction, than the same lesson without these multiple stimuli
should be considered by all who teach through video presentations.
111
REFERENCES
Abrahamson, A. L. (1999). Teaching with classroom communications system:
What it involves and why it works. Paper presented at international
workshop, New Trends in Physics Teaching, Puebla, Mexico: Retrieved
from http://www.bedu.com/Publications/PueblaFinal2.html
Abrahamson, L. (2006). A brief history of networked classrooms: Effects, cases,
pedagogy, and implications. In D. A. Banks (Ed.), Audience response
systems in higher education: Applications and cases (pp. 1-25). Hershey,
PA: Information Science Publishing.
Akerlof, G., & Kranton, R. (2002). Identity and schooling: Some lessons for the
economics of education. Journal of Economic Literature, 40(4), 1167-
1201.
Alfassi, M. (2004). Reading to learn: Effects of combined strategy instruciton on
high school students. Journal of Educational Research, 97(4), 171-184.
Alwitt, L., Anderson, D., Lorch, E., & Levin, S. (1980). Preschool children's visual
attention to attributes of televsion. Human Communication Research, 7(1),
52-67.
Ambikairajah, E., Epps, J., Sheng, M., & Celler, B. (2003). Evaluation of a virtual
teaching laboratory for signal processing education. Proceedings of the
2003 IEEE International Conference on Acoustics, Speech, and Signal
Processing, Hong Kong. (pp. 757-760).
112
Ambikairajah, E., Epps, J., Sheng, M., & Celler, B. (2006). Revisiting live
lectures: A shift in paradigm? Proceedings of the 2006 International
Conference on Information Technology Based Higher Education and
Training, Sydney, Australia, (pp. 20-24).
Anderson, D., & Lorch, E. (1983). Looking at televison: Action or reaction. In J.
Bryant, & D. Anderson (Eds.), Children's understanding of television (pp.
1-33). New York: Academic Press.
Anderson, D., Alwitt, L., Lorch, E., & Levin, S. (1979). Watching children watch
television. In G. Hale, & M. Lewis (Eds.), Attention and cognitive
development. New York: Plenum.
Anderson, D., Lorch, E., Field, D., & Sanders, J. (1981). The effects of TV
program comprehensibility of preschool children's visual attention. Child
Development, 57, 1024-1033.
Anderson, L., & Krathwohl, D. (2001). A taxonomy for learning, teaching, and
assessing: A revision of Bloom's taxonomy of educational objectives. New
York: Longman.
Armstrong, A., Idriss, N., & Kim, R. (2011). Effects of video-based, online
education on behavioral and knowledge outcomes in sunscreen use: A
randomized controlled trial. Patient Education and Counseling, 83(2), 273-
277.
Baggaley, J., & Duck, S. (1976). Dynamics of television. Westmead,
Farmborough, Hants., England: Saxon House.
113
Bar, M., Neta, M., & Linz, H. (2006). Very first impressions. Emotion, 6(2), 269-
278.
Barnes, J. (2008). Lecture-free high school biology using an audience response
system. American Biology Teacher, 70(9), 531-536.
Bartsch, R., & Murphy, W. (2011). Examining the effects of an electronic
classroom response system on student engagement and performance.
Journal of Educational Computing Research, 44(1), 25-33.
Becker, L. (2000). Effect size calculators. Retrieved from University of Colorado
at Colorado Springs website: http://www.uccs.edu/~lbecker/
Bellanca, J., & Brandt, R. (2010). 21st century skills: Rethinking how students
learn. Blookington, IN: Solution Tree Press.
Bennett, S., Maton, K., & Kervin, L. (2008). The “digital natives" debate: A critical
review of the evidence. British Journal of Educational Technology, 39(5),
775-786.
Berg, C. (2012). The real reason for the tragedy of the Titanic. Wall Street
Journal, p. A13.
Berger, J. (1972). Ways of seeing. London: British Broadcasting Association.
Bertalanffy, L. (1965). On the definition of the symbol. In J. R. Royce (Ed.),
Psychology and the symbol (p. 41). New York: Random House.
Bisplinghoff, G. (1994). Cultural and echnological coding of mass media images.
In D. Moore, & F. Dywer (Eds.), Visual literacy: A spectrum of visual
114
learning (pp. 337-351). Englewood Cliffs, NJ: Educational Technology
Publications.
Blackboard. (2012). The voice of the active learner. Washington, DC. Retrieved
from http://blog.blackboard.com/company/featured/electronic-education-
moves-to-the-head-of-the-class-stats-on-digital-learning/
Bland, R. B. (2002). Visual framing for credibility. Unpublished manuscript,
Department of Communication, University of Texas – Arlington, Arlington,
TX.
Bloomer, C. M. (1990). The principles of visual perception. New York: Design
Press.
Breed, G. (1971). Nonverbal behavior and teacheing effectiveness. Final report.
Washington, DC: Department of Health, Education, and Welfare; Office of
Education.
Briggs, L. (1977). Introduction. In L. Briggs (Ed.), Instructional design (pp. 5-18).
Englewood Cliffs, NJ: Edcuational Technology Publictions.
Brosvic, G., Epstein, M., Cook, M., & Dihoff, R. (2005). Efficacy of error for the
correction of initially incorrect assumptions and of feedback for the
affirmation of correct responding: Learning in the classroom.
Psychological Record, 55(3), 401-418.
Brown, B., Clasen, D., & Eicher, S. (1986). Perceptions of peer pressure, peer
conformity dispositions, and self-reported behavior among adolescents.
Developmental Psychology, 22(4), 521-530.
115
Brumberger, E. (2011). Visual literacy and the digital native: An examination of
the millennial learner. Journal of Visual Literacy, 30(1), 19-47.
Burgoon, J. (1978). Nonverbal communication. In M. Burgoon (Ed.), Human
communication (pp. 129-161). New York: Holt, Rinehart, and Winston.
Burns, A., & Darling, N. (2002). Peer pressure is not peer influence. Educational
Digest, 68(2), 4-6.
Butler, A. (2010). Media education goes to school. New York: Peter Lang
Publishing.
Butler, A., Karpicke, J., & Roediger, H. (2007). Effect of type and timing of
feedback on learning from multiple-choice tests. Journal of Experimental
Psychology: Applied, 13(4), 273-281.
Butler, A., Karpicke, J., & Roediger, H. (2008). Correcting a metacognitive error:
Feedback increases retention of low-confidence correct responses.
Journal of Experimental Psychology: Learning, Memory and Cognition,
34(4), 918-928.
Butterfield, B., & Metcalfe, J. (2006). The correction of errors committed with high
confidence. Metacognition and Learning, 1(1), 69-84.
Campbell, T. A., Wright, J. C., & Huston, A. C. (1987). Form cues and content
difficulty as determinants of chiildren's cognitive processing of televised
educational messages. Journal of Experimental Child Psychology, 43,
311-327.
116
Chandra, S. (2011). Experiences in personal lecture video capture. IEEE
Transactions on Learning Technologies, 4(3), 261-274.
Choi, H., & Johnson, S. (2005). The effect of context-based video instruction on
learning and motivation in online courses. American Journal of Distance
Education, 19(4), 215-227.
Chu, G. C., & Schramm, W. (1967). Learning from television: What the research
says. Washington, DC; Stanford, CA: National Association of Educational
Broadcaters; Institute for Communication Research, ERIC Database No.
ED014900.
Clark, R. (1983). Reconsidering research on learning from media. Review of
Educational Research, 53(4), 445-459.
Clark, R. E. (1994). Media will never influence learning. Educational Technology
Research and Development, 42(2), 21-29.
Classen, D., & Brown, B. (1985). The multidimensionality of peer pressure in
adolescence. Journal of Youth and Adolescensce, 14(6), 451-468.
Cleveland, M. (2008, October). Students' perceptions of the incorporation of
YouTube into classroom lecture. Paper presented at the Getting
Connected: Best Practices in Technology-Enhanced Teaching and
Learning Psychology Conference, Atlanta, GA.
Cleveland, M. (2011). A practical guide to using youtube in the classroom. In D.
S. Dunn, J. H. Wilson, J. E. Freeman, & J. R. Stowell (Eds.), Best
117
practicies for technology-enhanced teaching and learning. (pp. 197-206).
New York: Oxford University Press.
Coats, J. (2007). Generational learning styles. River Falls, WI: LERN Books.
Cobb, T. (1997). Cognitive efficiency: Toward a revised theory of media.
Educational Technology, Research and Development, 45(4), 21-31.
College Board. (2011). 2011 SAT trends. Retrieved from: http://professionals.
collegeboard.com/data-reports-research/sat/cb-seniors-2011/tables
Cohen, A., & Salomon, G. (1979). Children's literate television viewing: Suprises
and possible explinations. Journal of Communication, 29(3), 138-144.
Cohen, J. (1988). Statistical power analysis for the behavioral sciences (2nd ed.).
Hillsdale, NJ: Lawrence Earlbaum Associates.
Conger, S. B. (2005). If there is no significant difference, why should we care?
Journal of Educators Online, 2(2), 1-4.
Darling-Hammond, L., & McCloskey, L. (2012). Assessment for learning around
the world: What would it mean . Pros and cons of controversial issues.
Retrieved from http://standardizedtests.procon.org/sourcefiles/
assessment-for-learning-around-the-world-what-would-it-mean-to-be-
internationally-competitive.pdf.
Day, E., Burn, H., & Gerdes, D. (2009). Bringing the classroom to the web:
Effects of using new technologies to capture and deliver lectures.
Research in Higher Education, 50(4), 377-393.
118
Day, J., & Foley, J. (2006). Evaluating a web lecture intervention in a human-
computer interaction course. IEEE Transactions on Education, 49(4), 420-
431.
De Fraja, G., Oliveira, T., & Zanchi, L. (2010). Must try harder: Evaluating the
role of effort in educational attainment. Review of Economics and
Statistics, 92(3), 577-597.
De Gagne, J. (2011). The impact of clickers in nursing education: A review of
literature. Nurse Education Today, 31(8), e34-e40.
Deci, E., & Ryan, R. (1985). Intrinsic motivatin and self-determination in human
behavior. New York: Plenum Press.
Deutsch, M., & Gerard, H. (1955). A study of normative and informational social
influences upon individual judgment. Journal of Abnormal and Social
Psychology, 51(3), 629-636.
Dewey, J. (1913). Interest and effort in education. Boston: Houghton Mifflin.
Dewey, J. (1916). Democracy and education. New York: Free Pres.
Dewey, J. (1956). The school and society and the child and the curriculum.
Chicago: University of Chicago Press.
Dihoff, R., Brosvic, G., Epstein, M., & Cook, M. (2004). Provision of feedback
during preparation for academic testing: Learning is enhanced by
immediate but not delayed feedback. Psychological Record, 54(2), 207-
231.
Dirksen, J. (2012). Design for how people learn. Berkeley: New Riders.

119
Doyle, J. (2004). Introduction to survey methodology and design. Retrieved from
http://khairul.forsciedu.com/Personal/Pdf/Introduction%20to%20Survey%
20Methodology%20and%20Design.pdf.
Duck, S. W., & Baggaley, J. (1975). Audience reaction and its effect on perceived
expertise. Communication Research, 79-85.
Dwyer, F. (1978). Strategies for improving visual learning. State College, PA:
Learning Services.
Edelman, B. (2010). Classroom peer effects, effort and race (Doctoral
dissertation). Retrieved from ProQuest. UMI Number 3423205.
Effect size and clinical/practical significance. (2012). University of Medicine and
Dentristy of New Jersey. Retrieved from http://www.umdnj.edu/idsweb/
shared/effect_size.htm.
Elieson, B. (2012). Bloom's taxonomy. University of North Texas, Denton, TX.
El-Rady, J. (2006). To click or not to click-that’s the question. Innovative Journal
of Online Education. Retrieved from
http://innovateonline.info/pdf/vol2_issue4/
To_Click_Or_Not_To_Click-__That's_The_Question.pdf.
Fenley, S. (2010). Navigation and visualisation techniques in elearning and
internet research. In M. Ebner, & M. Schiefner (Eds.), Looking toward the
future of technology--Enhanced education (pp. 55-86). Hershey, PA:
Information Science Reference.
120
Field, A. (2009). Discovering statistics using SPSS (3rd ed.). Thousand Oaks:
SAGE Publications.
Fies, C., & Marshall, J. (2006). Classroom response systems: A review of the
literature. Journal of Science Education and Technology, 15(1), 101-109.
Figlio, D., Rush, M., & Yin, L. (2010). Is it live or is it the internet? Experimental
estimates of the effects of online instruction on student learning. National
Bureau of Economic Research. Retrieved from http://www.nber.org/
papers/w16089.
Finn, J., & Rock, D. (1997). Academic success among students at-risk. Journal of
Applied Psychology, 82(2), 141-162.
Fisher, D., & Frey, N. (2010). Preparing students for mastery of 21st century
skills. In J. Bellanca, & R. Brandt (Eds.), 21st century skills: Rethinking
how students learn (pp. 221-240). Bloomington, IN: Solution Tree Press.
Fralinger, B., & Owens, R. (2009). Youtube as a learning tool. Journal of College
Teaching & Learning, 15-29.
Franciszkowicz, M. (2008). Video-based additional instruction. Journal of the
Reserach Center for Educational Technology, 4(2), 5-14.
Fyfe, G., & Law, J. (1988). Introduction: On the invisibility of the visible. In G.
Fyfe, & J. Law (Eds.), Picturing power: Visual depiction and social
relations (pp. 1-14). London: Routledge.
Gagné, R. (1965). The conditions of learning. New York: Holt, Rinehart &
Winston.
121
Gillespie, M. (2005). Media audiences. New York: Open University Press.
Goldbert, H., & McKhann, G. (2000). Student test scores are improved in a virtual
learning environment. Advances in Physoilogy Education, 23(1), 59-66.
Gosper, M., McNeill, M., Woo, K., Phillips, R., Preston, G., & Green, D. (2007).
Web-based lecture recording technologies: Do students learn from them?
Retrieved from Macquarie Universitywebsite: https://www.mq.edu.au/ltc/
altc/wblt/docs/dissemination/Educause_Gosper.pdf
Graham, C., Tripp, T., Seawright, L., & Joeckell III, G. (2007). Empowering or
compelling reluctant participators using audience response systems.
Active Learning in Higher Education, 8(3), 233-258.
Grossman, L. (2012, January 30). The beast with a billion eyes. Time, 38-43.
Gupta, S.(Correspondent), & Cetta, D. S.(Producer). (2012). Teacher to the
world. In J. Fager (Executive Producer), 60 minutes. New York: CBS
Television.
Haag, M. (2012, January 24). One word for why students are quitting school:
Boring. Dallas Morning News, pp. 1B-7B.
Hall, S. (1980). Encoding/decoding. In S. Hall, D. Hobson, A. Lowe, & P. Wills
(Eds.), Culture, media, language: Working papers in cultural studies,
1972-79 (pp. 107-116). New York: Routledge.
Healy, J. M. (1990). Endangered minds. New York: Simon & Shuster.
Heward, W. (1978). Visual response system. Exceptional Children, 44, 466-468.
122
Hinde, K., & Hunt, A. (2006). Using the personal response system to enhance
student learning:Some evidence from teaching economics. In D. Banks
(Eds.), Audience response systems in higher education (pp. 140-154).
Hershey, PA: Information Science Publishing.
Hobbs, R. (2011). Digital and media literacy. Thousand Oaks, CA: Corwin.
Huston, A. C., & C, W. J. (1983). Children's processing of television: The
informative functions of formal features. In J. Bryant, & D. R. Anderson
(Eds.), Children's understanding of television (pp. 35-68). New York:
Academic.
Huston, A. C., Bickham, D. S., Lee, J. H., & Wright, J. C. (2007). From attention
to comprehension: How children watch and learn from television. In N.
Pecora, J. P. Murray, & E. A. Wartella (Eds.), Children and television: Fifty
years of research (pp. 41-63). Mahwah, NJ: Lawrence Erlbaum
Associates.
Huston, A., Wright, J., E, W., Rice, M., Watkins, B., Campbell, T., & Potts, R.
(1981). Communicating more than content: Formal features of children's
television programs. Journal of Communication, 31(3), 32-48.
Huxley, A. (1942). The art of seeing. New York: Harper.
Ide, J., Parkerson, J., Haertel, G., & Walberg, H. (1981). Peer group influences
on educational outcomes: A quantitative synthesis. Journal of Educational
Psychology, 73(4), 472-484.
123
Intrinsic Motivation Inventory. (2012). Retrieved from Self-detemination theory:
An approach to human motivation & personality website: http://www.
psych.rochester.edu/SDT/measures/IMI_description.php
Jonassen, D., Campbell, J., & Davidson, M. (1994). Learning with media:
Restructuring the debate. Educational Technology Research and
Development, 42(2), 31-39.
Judson, E., & Sawada, D. (2002). Learning from past and present: Electronic
response systems in college lecture halls. Journal of Computers in
Mathematics and Science Teaching, 21(2), 167-181.
Judson, E., & Sawada, D. (2006). Audience response systems: Insipid
contrivances or inspriing tools? In D. Banks (Eds.), Audience response
systems in higher education: Applications and cases (pp. 26-39). Hershey,
PA: Information Science Publishing.
Jukes, I., McCain, T., & Crockett, L. (2010). Understanding the digital generation.
Kelowna BC Canada: Dorwin.
Kaleta, R., & Joosten, T. (2007). Student response systems: A University of
Wisconsin system study of clickers. Boulder, CO: EDUCAUSE Research
Bulletin, 2007 (10).
Kay, R., & LeSage, A. (2009). Examining the benefits and challenges of using
audience response systems: A review of the literature. Computers &
Education, 53(3), 819-827.
124
Kelhum, K., Carr, J., & Dozier, C. (2001). Response-card instruction and student
learning in a college classroom. Teaching of Psychology, 28(2), 101-104.
Kelly, F. S., McCain, T., & Jukes, I. (2009). Teaching the digital generation.
Thousand Oaks: Corwin Press.
Kennedy, G., Dalgarno, B., Bennett, S., Gray, K., Waycott, J., Judd, T., Chang,
R. (2009). A handbook of findings for practice and policy. Retrieved from
Educating the Net Generation website: http://www.netgen.unimelb.edu.au/
downloads/handbook/NetGenHandbookAll.pdf
Kluth, A. (2006). Among the Audience. The Economist, 379(8474), pp. 3-5.
Kozma, R. B. (1991). Learning with media. Review of Educational Research,
61(2), 179-212.
Kozma, R. B. (1994). Will media influence learning? Reframing the debate.
Educational Technology Research and Development, 42(2), 7-19.
Krathwohl, D. (2002). A revision of Bloom's taxonomy: An overview. Theory into
Practice, 41(4), 212-218.
Lampi, F., Kopf, S., Benz, M., & Effelsberg, W. (2008). A virtual camera team for
lecture recording. IEEE Multimedia, 15(3), 58-62.
Laswell, H. D. (1948). The structure and function of communication in society. In
L. Bryson (Ed.), The communication of ideas. New York : Harper.
Lemke, C. (2010). Innovation through technology. In J. Bellanca, & R. Brandt
(Eds.), 21st century skills (pp. 243-272). Bloomington, IN: Solution Tree.

125
Lester, P. M. (2006). Visual communication: Images with messages (4th ed.).
Belmont, CA: Wadsworth.
Lhyle, K., & Kulhavy, R. (1987). Feedback processing and error correction.
Journal of Educational Psychology,79(3), 320-322.
Liebert, R. N. (1973). The early window: Effects of television on children and
youth. New York: Pergamon.
Lin, C. A., & Cresswell, K. W. (1989). Effects of televised lecture presentation
styles on student learning. Journal of Educational Television, 15, 37-52.
Marks, H. (2000). Student engagement in instructional activity: Patterns in the
elementary, middle, and high school years. American Eduicational
Research Journal, 37(1), 153-184.
Marmolejo, E., Wilder, D., & Bradley, L. (2004). A preliminary analysis of the
effects of response cards on student performance and participation in an
upper division university course. Journal of Applied Behavior Analysis,
37(3), 405-410.
Marsh, H. (1987). 'Dr Fox' Studies. International Journal of Educational
Research, 11(3), 331-336.
Martin, S. N., & Siry, C. (2012). Using video in science teacher education: An
analysis of the utilization of video-based media by teacher educators and
researchers. In B. J. Fraser, K. Tobin, & J. Campbell (Eds.), Second
International Handbook of Science Education (pp. 417-433). New York,
NY: Springer International Handbooks of Education.
126
Marzano, R. J., & Pickering, D. J. (2011). The highly engaged classroom.
Bloomington, IN: Marzano Research Laboratory.
Mayer, R. (2011). Instruction based on visualizations. In R. Mayer, & P. E.
Alexander (Eds.), Handbook of research on learning and instruction (pp.
427-445). New York, NY: Routledge.
Mayer, R. E. (2009). Multimedia learning (2nd ed.). New York: Cambridge
University Press.
McAuley, E., Duncan, T., & Tammen, V. (1989). Psychometric properties of the
intrinsic motivation inventory in a competitive sport setting: A confirmatory
factor analysis. Research Quarterly for Exercise and Sport, 60(1), 48-58.
McClure, A. (2008). Lecture capture: A fresh look. Retrieved 2012 from
University Business website: http://www.universitybusiness.com/article/
lecture-capture-fresh-look
McCoog, I. (2007). Integrated instruction: Multiple intelligences and technology.
Clearing House, 78(1), 25-29.
McElroy, J. (2006). You, me and ilecture. Proceedings of the 23rd annual
conference of the Austrailian Society for Computers in Learning in Tertiary
Education, Sydney, Australia, 549-558.
McLuhan, M. (1994). Understanding media: The extensions of man. Cambridge,
MA: MIT Press.
Means, B., Toyama, Y., Murphy, R., Bakia, M., Jones, K. (2010). Evaluation of
evidence-based practices in online learning:A meta-analysis and review of
127
online learning studies. U.S. Department of Education. Retrieved from
http://www2.ed.gov/rschstat/eval/tech/evidence-based-
practices/finalreport.pdf
Medina, J. (2008). Brain rules: 12 principles for surviving and thriving at work,
home, and school. Seattle: Pear Press.
Metcalfe, J., Kornell, N., & Finn, B. (2009). Delayed versus immediate feedback
in children's and adults' vocabulary learning. Memory & Cognition, 37(8),
1077-1087.
Midlothian High School. (2012). Student data. Midlothian, TX: Midlothian High
School.
Mindich, D. T. (2005). Tuned out. New York: Oxford University Press.
Mischel, W. (1979). On the interface of cognition and personality. American
Psychologist, 34(9), 740-754.
Moore, D., & Dwyer, F. (1994). Visual literacy: A spectrum of visual learning.
Endlewood Cliffs, NJ: Eductional Technology Publications.
Moorely, D. (1980). The nationwide audience: Structure and decoding. London:
British Film Institute.
Moores, S. (1993). Interpreting audiences: The ethnography of media
consumption. London: Sage.
Morling, B., McAuliffe, M., Cohen, L., & DiLorenzo, T. (2008). Efficacy of personal
response systems ("clickers") in large, introductory psychology classes.
Teaching of Psychology, 35(1), 45-50.

128
Morrison, G. (1994). The media effects question: "Unresolvable" or asking the
right question? Eduational Technology Research and Development, 42(2),
41-44.
Naftulin, D., Ware, J., & Donnelly, F. (1973). The doctor fox lecture: A paradigm
of educational seduction. Academic Medicine, 48(7), 630-635.
Nagel, D. (2008). Lecture capture: No longer optional? Retrieved from Campus
Technology website: http://campustechnology.com/articles/2008/09/
lecture-capture-no-longer-optional.aspx?sc_lang=en.
National Council for the Social Studies. (2009). Media literacy. Retrieved from
National Council for the Social Studies website: http://www.socialstudies.
org/positions/medialiteracy1
National Research Council. (2004). Engaging schools: Fostering high school
students' motivation to learn. Washington, DC: National Academies Press.
Natriello, G., & McDill, E. (1986). Performance standards, student effort on
homework and academic achievement. Sociology of Education, 59(1), 18-
31.
Nichols, J., & White, J. (2001). Impact of peer networks on achievement of high
school algebra students. Journal of Educational Research, 94(5), 267-273.
Nisbett, R., & Ross, L. (1980). Human inference: Strategies and shortcomings of
social judgement. Englewood Cliffs, NJ: Prentice-Hall.
Nunnally, J., & Bernstein, I. (1994). Psychometric theory (3rd ed.). New York,
NY: McGraw-Hill.
129
Oblinger, D. G., & Hawkins, B. L. (2006 November/December). The myth about
no significant difference. Educause Review, 41(6), pp. 14-15.
Odhabi, H., & Nicks-McCaleb, L. (2011). Video recording lectures: Students and
professor perspectives. British Journal of Educational Technology, 42(2),
327-336.
Olson, D. (1974). Introduction. In D. Olsen (Ed.), Media and symbols: The forms
of expression, communication, and education: 73rd NSSE yearbook, Part I
(pp. 1-24). Chicago: National Society for the Study of Education,
University of Chicago Press.
Palfrey, J., & Gasser, U. (2008). Born digital: Understanding the first generation
of digital natives. New York: Basic Books.
Patterson, M. L. (1983). Nonverbal behavion: A functional perspective. New
York: Springer-Verlag.
Perkins, D. N., & Salomon, G. (1988). Teaching for transfer. Educational
Leadership, 22-32.
Pillemer, D. (1991). One- versus two-tailed hypothesis tests in contemporary
educational research. Educational Researcher, 20(13), 13-18.
Pradhan, A., Sparano, D., & Ananth, C. (2005). The influence of an audience
response system on knowledge retention: An application to resident
education. American Journal of Obstetrics and Gynecology, 193(5), 1827-
1830.
130
Prensky, M. (2001). Digital natives, digital immigrants. Retrieved from
MarkPrensky.com website: http://www.marcprensky.com/writing/
Prensky%20-%20Digital%20Natives,%20Digital%20Immigrants%20-
%20Part1.pdf
Prensky, M. (2006). Listen to the natives. Educational Leadership, 8-13.
Reiser, R. A. (2001). A history of Instructional design and technology.
Educational Technology, Research and Development, 49(1), 53-64.
Reiser, R. A., & Gagné, R. M. (1983). Selecting media for instruction. Englewood
Cliffs, NJ: Educational Technology.
Rice, M., Huston, A., Truglio, R., & Wright, J. (1990). Words from Sesame Street:
Learning vocabulary while viewing. Developmental Psychology, 26, 421-
428.
Robin, A. (1978). The timing of feedback in personalized instruction. Journal of
Personalized Instruction, 3, 81-87.
Roediger, H., Wheeler, M., & Rajaram, S. (1993). Remembering, knowing and
reconstructing the past. In D. Medlin (Ed.), The psychology of learing and
motivation: Advances in research and theory, 30, 97-134. New York:
Academic Press.
Roschelle, J., Penuel, W. R., & Abrahamson, L. (2004). Classroom response and
communication systems: Research review and theory. Paper presented at
the American Educational Research Association 2004 Annual Meeting,
San Diego, CA.

131
Rose, G. (2007). Visual methodoligies: An introduction to the interpretation of
visual materials. Thousand Oaks, CA: Sage Publications.
Russell, T. (2001). The no significant difference phenomenon: A comparative
research annotated bibliography on technology for distance education.
Montgomery AL: International Distance Education Certification Center.
Russell, T. (2012). Retrieved from The no significant difference phenomenon
website: http://www.nosignificantdifference.org.
Rutter, D. (1984). Looking and seeing: The role of visual communication in social
interaction. John Wiley & Sons: Suffolk.
Ryan, R., & Deci, E. (2000). Intrinsic and extrinsic motivatorions: Classic
definitions and new directions. Contemporary Educational Psychology,
25(1), 54-67.
Salomon, G. (1974). What is learned and how it is taught: The interaction
between media, message, task and learner. In D. R. Olson (Ed.), Media
and symbols: The forms of expression, communication, and education
(pp. 383-406). Chicago: National Society of the Study of Education.
Salomon, G. (1979). Interaction of media, cognitiion, and learning: An exploration
of how symbolic forms cultivate mental skills and affect knowledge
acquisition. San Francisco: Jossey-Bass.
Salomon, G. (1983). The differential investment of mental effort in learning from
different sources. Educational Psychologist, 18(1), 42-50.
132
Salomon, G. (1997). Of mind and media: How culture's symbolic forms affect
learnig and thinking. Phi Delta Kappan, 78(5), 375-381.
Salomon, G., & Gardner, H. (1986). The comptuer as educator: Lessons for
televison research. Educational Researcher, 13-19.
Salomon, G., Perkins, D., & Globerson, T. (1991). Partners in cognition:
Extending human intelligence with intelligent technologies. Educational
Researcher, 20(3), 2-9.
Santor, D., Messervey, D., & Kusumakar, V. (2000). Measuring peer pressure,
popularity, and conformity in adolescent boys and girls: Predicting school
performance, sexual attitudes, and substance abuse. Journal of Youth and
Adolescence, 29(2), 163-182.
Schackow, T., & Loya, L. (2004). Audience response system: Effect on learning
in family medicing residents. Family Medicine, 36(7), 496-504.
Schmidt, M. E., & Anderson, D. R. (2007). The impact of television on cognitive
development and educational achievement. In N. Pecora, J. Murray, & E.
A. Wartella (Eds.), Children and television: Fifty years of research (pp. 65-
84). Mahwah, NJ: Lawrence Earlbaum Associates.
Schmitt, K. L., Anderson, D. R., & Collins, P. A. (1999). Form and content:
Looking at visual features of television. Developmental Psychology, 35(4),
1156-1167.
Schramm, W. (1973). Men, messages, and media: A look at human
communication. Harper & Row: New York.
133
Schramm, W. (1977). Big media, little media. Beverly Hills: Sage Publications.
Sewell, E. H. (1994). Visual symbols. In D. M. Moore. & D. F.Dwyer (Eds.),
Visual literacy: A spectrum of visual learning (pp. 133-144). Englewood
Cliffs, NJ: Educational Technology Publications.
Shannon, C. E., & Weaver, W. (1949). The mathematical theory of
communication. Urbana, IL: University of Illinois Press.
Sherin, M. G. (2004). New perspectives on the role of video in teacher education.
In J. Brophy (Ed.), Advances in research on teaching, vol 10: Using video
in teacher education, (pp. 1-27). Oxford: Elsevier, Ltd.
Singer, J. L. (1980). The power and limitations of television: A cognitive-affective
analysis. In P. H. Tannenbaum (Ed.), The entertainment functions of
television (pp. 31-65). Nillsdale, NJ: Lawrence Erlbaum Associates.
Small, G., & Vorgon, G. (2008). iBrain: Surviving the technological alteration of
the modern mind. New York: Harper Collins.
Soong, S., Chan, L., Cheers, C., & Hu, C. (2006). Impact of video recorded
lectures among students. Proceedings of the 23rd Annual Conference of
the Austrailian Society for Computers in Learning in Tertiary Education,
Sydney, Australia, 789-793.
Sorenson, A., & Hallinan, M. (1977). A reconceptualization of school effects.
Sociology of Education, 50(4), 273-289.
Sparks, S. D. (2011, September 28). Schools 'flip' for lesson model promoted by
Khan Academy. Education Week, 31(5), pp. 1-2.
134
Statistical Consulting Group. (2012). FAQ: What are the differences between
one-tailed and two-tailed tests? Retrieved from University of California at
Los Angeles: Academic Technology Services website: http://www.ats.ucla.
edu/stat/mult_pkg/faq/general/tail_tests.htm.
Stern, R. C., & Robinson, R. S. (1994). Perception and its role in communication
and learning. In D. M. Moore, & F. M. Dwyer (Eds.), Visual literacy: A
spectrum of visual learning (pp. 31-51). Englewood Cliffs, NJ: Educational
Technology Publications.
Stewart, E. (2008). School structural chaacteristics, student effort, peer
associations, and parental involvement. Education and Urban Society,
40(2), 179-204.
Steyn, Jr, H. S., & Ellis, S. M. (2009). Estimating an effect size in one-way
multivariate analysis of variance. Multvariate Behavioral Research, 44(1),
106-129.
Strom, P., & Strom, R. (2009). Adolescents in the internet age. Charlotte, NC:
Information Age Publishing.
Sturken, M., & Cartwright, L. (2001). Practices of looking: An introduction to
visual culture. Oxford: Oxford University Press.
Tabachnick, B., & Fidell, L. (2001). Using multivariate statistics (4th ed.).
Needham Heights, MA: Allyn and Bacon.
Tapscott, D. (2008). Growing up digital: How the net generation is changing your
world. New York: McGraw Hill.
135
Television. (n.d.). In Merriam-Webster’s online dictionary. Retrieved from
http://www.merriam-webster.com/dictionary.
Thornburg, D. D. (1999). Technology in K-12 education: Envisioning a new
future. Forum on Technology in Education: Envisioning the future.
Washington, DC.
Thorndike, E. (1927). The law of effect. American Journal of Psychology, 39(1/4),
212-222.
Thorndike, E. L. (1912). Education. New York: MacMillan & Company.
Tiemens, R. (2005). A content analysis of political speeches on television. In K.
Smith, S. Moriarty, G. Barbatsis, & K. Kenney (Eds.), Handbook of visual
communication: Theory, methods and media (pp. 385-404). Mahwah, NJ:
Lawrence Erlbaum Associates.
To improve learning. (1970). A report to the President and the Congress of the
United States by the commission on instructional technology. Washington,
DC: U.S. Government Printing Office.
Toppin, I. (2011). Video lecture capture (VLC) system: A comparison of student
versus faculty perceptions. Education and Information Technologies, 16,
383-393.
Pew Research Center, Pew Internet and American Life Project. (2011) Trend
Data for Teens. Retrieved from http://www.pewinternet.org/Trend-Data-
for-Teens/Online-Activites-Total.aspx.
136
Trier, J. (2007). "Cool" engagement with YouTube: Part 1. Journal of Adolescent
& Adult Literacy, 50(5), 408-412.
Valkenburg, P. M. (2004). Children's responses to the screen: A media
psychological approach. Mahwah, NJ: Lawrence Erlbaum Associates.
Van Evra, J. (2004). Television and child development. Mahwaj. NJ: Lawrence
Erlbaum Associates.
Vander Ark, T. (2012). Getting smart how digital learning is changing the world.
San Francisco: John Wiley & Sons.
Watt, A. J. & Welch, J. H. Jr. (1982). Visual complexity and young children’s
learning from television. Human Communication Research, 8(20), 133-45.
Watt, J., & Krull, R. (1977). An examination of three models of television viewing
and agression. Human Communication Research, 3(2), 99-112.
Weigel, M., Straughn, C., & Gardner, H. (2010). New digital media and their
potential cognitive impact on youth learning. In M. Khine, & I. Saleh (Eds.),
New science of learning: Cognition, computers, and collaboration in
education (pp. 3-22). New York: NY: Springer Science+Business Media.
West, C., Farmer, J., & Wolff, P. (1991). Instructional design: Implications from
cognitive science. Englewood Cliffs, NJ: Prentice Hall.
Wetzel, C. D., Radtke, P. H., & Stern, H. W. (1994). Instructional effectiveness of
video media. Hillsdale, NJ: Lawrence Erlbaum Associates.

137
Wieling, M., & Hofman, W. (2010). The impact of online video lecture recordings
and automated feedback on student performance. Computers &
Education, 54(4), 992-998.
Williams, K. C., & Williams, C. C. (2011). Five key ingredients for improving
student motivation. Research in Higher Education Journal, 12, 1-23.
Williams, T. (1981). How and what do children learn from television? Human
Communicaiton Research, 7(2), 180-192.
Wisely, F. (1994). Communication models. In D. Moore, & F. Dwyer (Eds.),
Visual literacy: A spectrum of visual learning (pp. 85-93). Englewood
Cliffs, NJ: Educational Technology Publications.
Wright, J. H., Bickham, D., Scantlin, R., & Kotler, J. (2001). American children's
use of electronic media in 1997: A national survey. Journal of Applied
Developmental Psychology, 22, 31-47.
Yahoo Finance. (2012). Time Inc. study reveals that "digital natives" switch
between devices and platforms every two minutes, use media to regulate
their mood. Retrieved from Yahoo Finance website: http://finance.yahoo.
com/news/time-inc-study-reveals-digital-140500962.html.
Zettl, H. (2005). Sight, sound, motion (4th ed.). Belmont, CA: Thomson
Wadsworth.


![Instructional pulication video [autosaved]](https://img.pdfslide.net/doc/110x75/58f0461a1a28ab8d468b461f/instructional-pulication-video-autosaved.jpg)


