Embed Size (px)
Citation preview

Impact of Wintertime SCR/SNCR Optimization on Visibility Impairing Nitrate Precursor Emissions
August 29, 2017MANE-VU Technical Support Committee
IntroductionDuring the first planning phase for regional haze, programs that were put in place focused on reducing sulfur dioxide (SO2) emissions. The reductions achieved led to vast improvements in visibility at the MANE-VU Federal Class I Areas due to reduced sulfates formed from SO2 emissions. This resulted in nitrates driving the visibility impairment rather than sulfates in some MANE-VU Class I Areas on the 20% most impaired days, in particular, during the winter months. Nitrogen oxide (NOX) emissions are an important precursor to the formation of nitrates.
Despite the progress made in the first planning period, additional progress is needed to continue to improve visibility. While many hazy days continue to be affected by high sulfate concentrations, many of the most impaired days are now dominated by nitrates, particularly on cooler days, when nitrogen emissions are more likely to contribute to the formation of nitrates rather than participating in the formation of ozone. Therefore, in addition to maintaining reductions already achieved, it is necessary to look closely at the sources of nitrates and the effectiveness of potential controls.
Often Electric Generating Units (EGUs) only run NOX emission controls to comply with ozone season trading programs; consequently, emissions of NOX are uncontrolled during the winter. Controlling winter-time NOx emissions at EGUs using existing controls is generally more cost-effective compared to other sectors that would have to install and bear the capital costs of control equipment solely for improving visibility. We will look at the visibility data and observed emission rates from EGUs with installed selective catalytic reduction (SCR) and selective non-catalytic reduction (SNCR) controls, and compare those rates to projected emissions, to show the improvements that can be made to visibility impairment from running existing SCR and SNCR during the winter months.
Current Visibility DataFigure 1 through Figure 5 show the variability in which meteorological seasons contained “20% most impaired days”1 from 2000 to 2015. The Edwin B. Forsythe National Wildlife Refuge (hereafter Brigantine Wilderness) has the strongest increase in winter 20% most impaired days, followed by Acadia National Park and Great Gulf Wilderness Area. The only site that did not see an increase in the number of winter 20% most impaired days was Lye Brook, but this is likely due to the fact that the Lye Brook IMPROVE monitor was moved in 2012 and the 20% most impaired days were not calculated as of this writing for the new site. When you look at 20% most impaired days you also see an upward trend in the
1 20% most impaired days are based on the draft IMPROVE AEROSOL, RHR III methodology used to calculate visibility impairment available in the Federal Land Manager Environmental Database (FED) database as of June 8, 2017 in accordance with the new definitions of impairment in regional haze regulatory framework
1

number of winter days. This shows that emissions that affect visibility during colder months are important to consider when developing control strategies, particularly for Brigantine.
Figure 1: Trends in seasonality of 20% most impaired days at Acadia National Park
2000 2001 2002 2003 2004 2005 2006 2007 2008 2009 2010 2011 2012 2013 2014 201502468
1012141618
Winter Linear (Winter) Spring
Summer Autum
Num
ber
of D
ays
Figure 2: Trends in seasonality of 20% most impaired days at Moosehorn NWR
2000 2001 2002 2003 2004 2005 2006 2007 2008 2009 2010 2011 2012 2013 2014 20150
2
4
6
8
10
12
14
Winter Linear (Winter) Spring
Summer Autum
Num
ber
of D
ays
Figure 3: Trends in seasonality of 20% most impaired days at Lye Brook Wilderness
2000 2001 2002 2003 2004 2005 2006 2007 2009 2010 201102468
1012141618
Winter Linear (Winter) Spring
Summer Autum
Num
ber
of D
ays
2

Figure 4: Trends in seasonality of 20% most impaired days at Great Gulf Wilderness
2001 2002 2003 2004 2005 2006 2007 2008 2011 2012 2013 2014 20150
2
4
6
8
10
12
Winter Linear (Winter) Spring
Summer Autum
Num
ber
of D
ays
Figure 5: Trends in seasonality of 20% most impaired days at Brigantine Wilderness
2000 2001 2002 2003 2004 2005 2006 2007 2009 2010 2011 2012 2013 2014 201502468
1012141618
Winter Linear (Winter) Spring
Summer Autum
Num
ber
of D
ays
Class I area plots were also created showing light extinction speciation for each day for 2002, 2011, and 2015 ( through ). For all the Class I areas, there is a significant decrease in light extinction from 2002 to 2011 (especially from sulfates contribution) and a smaller decrease from 2011 to 2015. At Lye Brook and Brigantine, nitrates contribute to a greater percentage of visibility impairment on certain days.
3

Figure 6: Acadia National Park 2002/2011/2015 Speciation Comparison
Figure 7: Moosehorn Wilderness 2002/2011/2015 Speciation Comparison
4

Figure 8: Great Gulf Wilderness 2002/2011/2015 Speciation Comparison
Figure 9: Lye Brook Wilderness 2011/2015 Speciation Comparison
5

Figure 10: Brigantine Wilderness 2002/2011/2015 Speciation Comparison
Table 1 demonstrates these trends between 2000 and 2015. At Brigantine, starting in 2007, at least half of the 20% most impaired days in each winter has had more extinction from nitrates than sulfates. In 11 winters out of 15 (73%) in the 2000-2015 period, Brigantine had days in which nitrates contributed more than sulfates to light extinction. At Lye Brook, in the same period, 6 winters (i.e., 43%) had some days in which nitrates contributed more than sulfates to light extinction, and more than half of the 20% most impaired days in 4 of these winters had more extinction from nitrates than sulfates. It is rare (less than 5%) for the other three Class I areas to have winter days where there is more extinction from nitrates than sulfates.
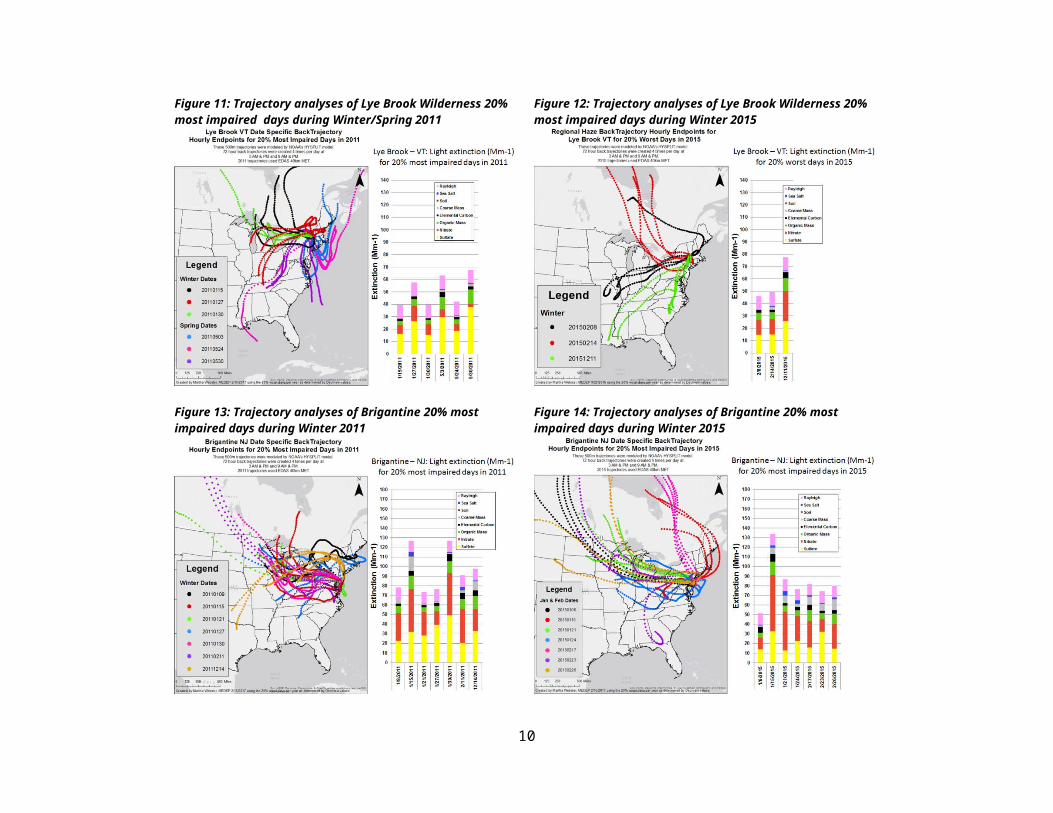
Focusing in on Lye Brook and Brigantine in more detail, one can see in igure 11 and Figure 12 for Lye Brook and Figure 13 and Figure 14 for Brigantine that during the winter months the back trajectories on many of the 20% most impaired days traverse the southwestern states in MANE-VU, the states in LADCO and the northern most states in SESARM. Later we will see how this information compares with the locations of EGUs that could impact MANE-VU Class I Areas.
6

Table 1: Number of 20% most impaired winter days and winter days where nitrate extinction was greater than sulfate at each monitored Class I area*
Site Year Winter Days
NO3 > SO4
% Site Year Winter Days
NO3 > SO4
%
Acadia 2000 3 0 0% Great Gulf 2007 3 0 0%2001 6 0 0% 2008 6 0 0%2002 3 1 33% 2011 7 0 0%2003 3 0 0% 2012 3 0 0%2004 4 0 0% 2013 7 1 14%2005 6 0 0% 2014 6 0 0%2006 6 0 0% 2015 8 0 0%2007 2 0 0% Lye Brook 2000 2 0 0%2008 1 0 0% 2001 2 1 50%2009 3 0 0% 2002 6 3 50%2010 4 0 0% 2003 3 0 0%2011 7 0 0% 2005 0 0 0%2012 5 0 0% 2006 1 0 0%2013 7 0 0% 2007 3 0 0%2014 11 1 9% 2009 1 1 100%2015 10 0 0% 2010 3 0 0%
Brigantine 2000 4 1 25% 2011 6 0 0%2001 6 1 17% 2012W 5 4 80%2002 2 0 0% 2013W 8 1 13%2003 2 1 50% 2014W 7 3 43%2004 1 1 100% 2015W 3 0 0%2005 4 0 0% Moosehor
n2000 4 0 0%
2006 3 0 0% 2001 5 0 0%2007 1 0 0% 2002 3 0 0%2009 9 3 33% 2003 4 1 25%2010 8 5 63% 2004 4 0 0%2011 7 3 43% 2005 7 0 0%2012 7 4 57% 2006 6 0 0%2013 10 5 50% 2007 3 0 0%2014 11 7 64% 2008 3 0 0%2015 10 6 60% 2009 4 0 0%
Great Gulf 2001 4 0 0% 2010 5 0 0%2002 3 0 0% 2011 9 0 0%2003 3 0 0% 2012 5 0 0%2004 2 0 0% 2013 4 0 0%2005 5 0 0% 2014 7 0 0%2006 5 0 0% 2015 8 0 0%
*Notes1. Data was not available for Great Gulf in 2000, 2009, 2010, or at Lye Brook in 20042. The location of the Lye Brook monitor changed from 2011 to 2012, though several months of contemporaneous monitoring results were collected for both sites and the measurements were found to be comparable. Also as a result, 20% most impaired days are not available from 2012 on so 20% worst days were used for those years and are marked with a W.
7

Figure 11: Trajectory analyses of Lye Brook Wilderness 20% most impaired days during Winter/Spring 2011
Figure 12: Trajectory analyses of Lye Brook Wilderness 20% most impaired days during Winter 2015
Figure 13: Trajectory analyses of Brigantine 20% most impaired days during Winter 2011
Figure 14: Trajectory analyses of Brigantine 20% most impaired days during Winter 2015
8

Figure 15: Sources of NOX emissions in the Eastern United States based on 2011 and 2018 Alpha 2 inventory
Onr
oad-
Die
sel/
HDV
EGU
- Coa
l
Non
road
- Non
road
Equ
ip -
Dies
el
Onr
oad-
Gas
olin
e/LD
T1
Onr
oad-
Gas
olin
e/LD
V
Non
road
- Mar
ine
Vess
els
Indu
stria
l Pro
cess
- Oil
& G
as P
rodu
ction
Area
Res
iden
tial-
Nat
ural
Gas
Non
road
- Rai
lroad
Equ
ipm
ent
Onr
oad-
Gas
olin
e/LD
T2
Onr
oad-
Die
sel/
HDV
EGU
- Coa
l
Onr
oad-
Gas
olin
e/LD
T1
Non
road
- Non
road
Equ
ip -
Dies
el
Onr
oad-
Gas
olin
e/LD
V
Non
road
- Rai
lroad
Equ
ipm
ent
Indu
stria
l Pro
cess
- Oil
& G
as P
rodu
ction
Non
road
- Mar
ine
Vess
els
Onr
oad-
Gas
olin
e/LD
T2
ICE-
Nat
ural
Gas
Onr
oad-
Die
sel/
HDV
EGU
- Coa
l
Non
road
- Non
road
Equ
ip -
Dies
el
Onr
oad-
Gas
olin
e/LD
T1
Onr
oad-
Gas
olin
e/LD
V
Non
road
- Rai
lroad
Equ
ipm
ent
Area
Res
iden
tial-
Nat
ural
Gas
Onr
oad-
Gas
olin
e/LD
T2
Indu
stria
l Pro
cess
- Met
al P
rodu
ction
ICE-
Nat
ural
Gas
Onr
oad-
Die
sel/
HDV
Indu
stria
l Pro
cess
- Oil
& G
as P
rodu
ction
EGU
- Coa
l
Non
road
- Rai
lroad
Equ
ipm
ent
ICE-
Nat
ural
Gas
Onr
oad-
Gas
olin
e/LD
T1
Non
road
- Non
road
Equ
ip -
Dies
el
Non
road
- Mar
ine
Vess
els
Onr
oad-
Gas
olin
e/LD
V
Onr
oad-
Gas
olin
e/LD
T2
MANE-VU SESARM LADCO CENSARA
0
100000
200000
300000
400000
500000
600000
2011 2018
9
10

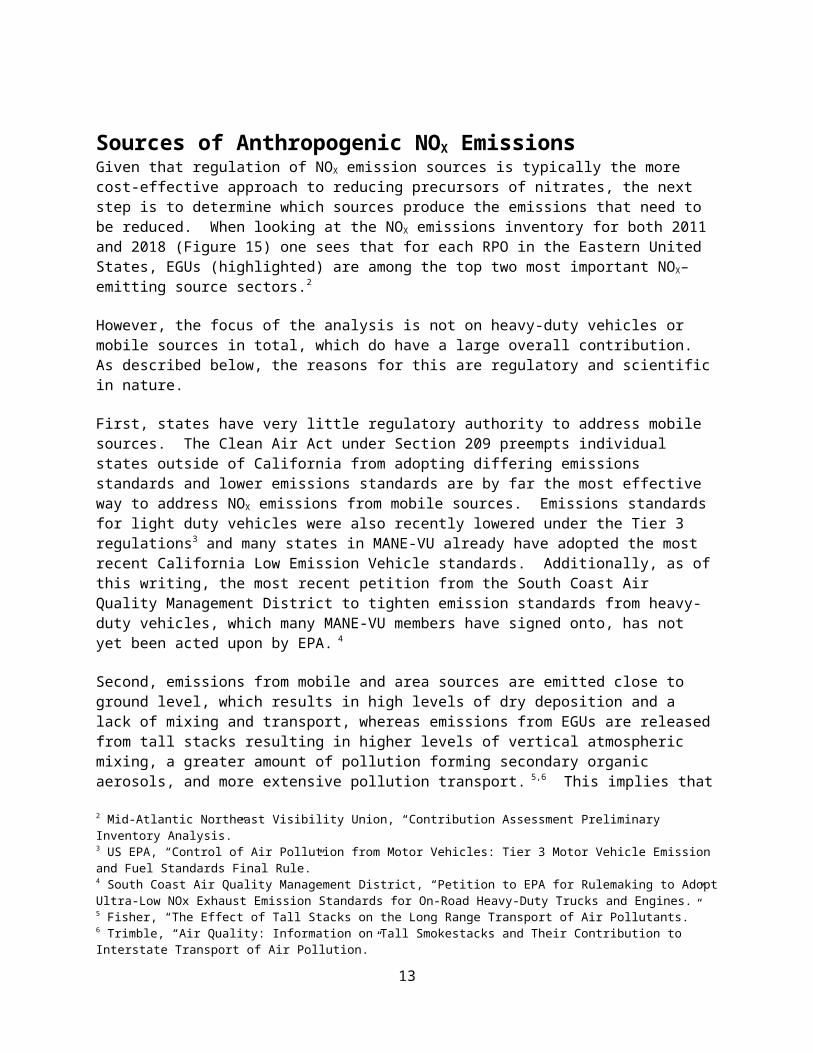
Sources of Anthropogenic NOX EmissionsGiven that regulation of NOX emission sources is typically the more cost-effective approach to reducing precursors of nitrates, the next step is to determine which sources produce the emissions that need to be reduced. When looking at the NOX emissions inventory for both 2011 and 2018 (Figure 15) one sees that for each RPO in the Eastern United States, EGUs (highlighted) are among the top two most important NOX–emitting source sectors.2
However, the focus of the analysis is not on heavy-duty vehicles or mobile sources in total, which do have a large overall contribution. As described below, the reasons for this are regulatory and scientific in nature.
First, states have very little regulatory authority to address mobile sources. The Clean Air Act under Section 209 preempts individual states outside of California from adopting differing emissions standards and lower emissions standards are by far the most effective way to address NOX emissions from mobile sources. Emissions standards for light duty vehicles were also recently lowered under the Tier 3 regulations3 and many states in MANE-VU already have adopted the most recent California Low Emission Vehicle standards. Additionally, as of this writing, the most recent petition from the South Coast Air Quality Management District to tighten emission standards from heavy-duty vehicles, which many MANE-VU members have signed onto, has not yet been acted upon by EPA. 4
Second, emissions from mobile and area sources are emitted close to ground level, which results in high levels of dry deposition and a lack of mixing and transport, whereas emissions from EGUs are released from tall stacks resulting in higher levels of vertical atmospheric mixing, a greater amount of pollution forming secondary organic aerosols, and more extensive pollution transport. 5,6 This implies that NOx emissions from EGUs will likely have a wider range of impact on the formation of visibility impairing particulates in the mostly rural Class I areas in the eastern part of MANE-VU than NOx emissions from other types of distant sources that emit at ground level, such as mobile sources. However, the exclusion of mobile sources in this analysis should not imply that locally emitted NOx from mobile sources, particularly heavy-duty vehicles, should not be considered for analysis and control.
Third, running existing controls on EGUs has been found to be possibly the most cost effective way to control NOX emissions. In particular, EPA found that a reasonable cost to restart an idled SCR on a coal-fired EGU would be $1,400 per ton of NOX removed and $3,400 per ton of NOX removed to restart an idled SNCR. 7,8 EPA found that retrofitting existing coal-fired EGUs with SCR would be $5,000 and SNCR would be $6,400 per ton of NOX removed.9
2 Mid-Atlantic Northeast Visibility Union, “Contribution Assessment Preliminary Inventory Analysis.”3 US EPA, “Control of Air Pollution from Motor Vehicles: Tier 3 Motor Vehicle Emission and Fuel Standards Final Rule.”4 South Coast Air Quality Management District, “Petition to EPA for Rulemaking to Adopt Ultra-Low NOx Exhaust Emission Standards for On-Road Heavy-Duty Trucks and Engines.”5 Fisher, “The Effect of Tall Stacks on the Long Range Transport of Air Pollutants.”6 Trimble, “Air Quality: Information on Tall Smokestacks and Their Contribution to Interstate Transport of Air Pollution.”7 US EPA, “EGU NOx Mitigation Strategies Final Rule TSD.”8 Ibid.9 Ibid.
11

For all of these reasons, focusing on running controls on EGUs to reduce the impact of nitrates on visibility impairment during the colder months is the most reasonable approach that should be considered.
Emission Rate ProcessingMaryland Department of Environment conducted an ozone season analysis in order to determine the emission benefits that could be achieved if coal-fired EGUs ran their already installed NOX controls at the best observed ozone season emission rates found by examining hourly emissions data from CAMD during the period 2005-2012.10 Due to the fact that the primary factor in reducing the effectiveness of NOX emission controls is flue gas temperature rather than the ambient temperature, any properly configured control system would not see a decrease in effectiveness during the winter months. Therefore, the best observed ozone season emission rates were assumed to be achievable during non-ozone season months as well. However, we determined it was not appropriate to use the best observed non-ozone season emissions rates in this analysis because the expectation was that controls would not necessarily be run to the same extent as during the ozone season since the same regulatory drivers, namely the ozone season NOX trading programs, are not in place in the winter time.
States have developed the ERTAC EGU projection tool11 in order to project future year EGU emissions, and this tool is being used in development of base case 2011 and future case 2028 EGU emissions inventories for regional haze planning. ERTAC EGU projection tool requires several sets of inputs, including a file to adjust future emission rates due to changes in operations, installation of controls, etc.
The version of future case regional haze modeling that was completed prior to writing this paper used the Alpha 2 inventory, which included ERTAC EGU v2.3 projections for the sector.12 ERTAC EGU v2.6 projections have become available now, but have not yet been included in a modeling inventory used for regional haze.13
To estimate the impacts of optimizing controls during the winter, the best observed rates were processed for inclusion in the ERTAC EGU control file, and then, ERTAC EGU v2.6 was rerun with the new control file.14 Full details of the creation of the control file and the data in the control file are found in Appendix A.
ResultsNOX emissions were projected using ERTAC and the emissions were compared for the time period from January 1 – April 30 and November 1 – December 31, the time period considered the non-ozone season. Results are being compared for v2.3 and v2.6 base cases to show the impact of recent updates to ERTAC inputs that had not yet been included in regional haze modeling, and then, the original v2.6 results are compared to the run where the best observed rates were applied.
10 Vinciguerra et al., “Expected Ozone Benefits of Reducing Nitrogen Oxide (NOx) Emissions from Coal-Fired Electricity Generating Units in the Eastern United States.”11 AMEC, “Software Technical Documentation for Software to Estimate Future Activity and Air Emissions from Electric Generating Units (EGUs).”12 McDill, McCusker, and Sabo, “Technical Support Document: Emission Inventory Development for 2011, 2018, and 2028 for the Northeastern U.S. Alpha 2 Version,” 2.13 ERTAC Workgroup, “Documentation of ERTAC EGU CONUS Versions 2.6.”14 All versions of the inputs were processed using v1.01 of the ERTAC EGU code.
12
We found that states in the four eastern RPOs would see a drop of NOX emissions from ~680,000 tons to ~570,000 tons (17%) from upgrading the ERTAC inputs to the most recent version and a further drop to ~460,000 tons (19%) when best observed rates were applied during non-ozone season i.e., approximate reductions of 644 and 588 tons per day respectively. Full state level data for the three scenarios are written out in Table 2 and depicted visually in Error: Reference source not found.
Table 2: Total 2028 Projected NOX Emissions from January 1-April 30 and November 1-December 31RPO State v2.3 Base v2.6 Base Non-OS Best Observed Rate Run
Tons % Change Tons % ChangeMANE-VU CT 775.29 461.09 -41% 461.09 0%
DE 502.14 823.25 64% 750.85 -9%MA 1,835.84 732.11 -60% 732.11 0%MD 11,413.70 10,090.07 -12% 5,364.26 -47%ME 221.39 301.93 36% 301.93 0%NH 2,259.36 1,145.80 -49% 744.55 -35%NJ 2,128.34 2,094.81 -2% 1,984.44 -5%NY 8,451.07 5,774.96 -32% 5,774.96 0%PA 53,119.05 33,944.72 -36% 22,983.84 -32%RI 285.15 399.09 40% 399.09 0%VT 0.00 0.00 n/a 0.00 n/aSubTotal
80,991.33 55,767.83 -31% 39,497.13 -29%
LADCO IL 25,278.91 20,513.97 -19% 18,833.81 -8%IN 40,244.31 40,744.75 1% 30,610.74 -25%MI 26,555.70 16,895.08 -36% 14,423.45 -15%MN 11,479.65 10,507.00 -8% 9,783.55 -7%OH 47,677.24 40,322.69 -15% 23,972.69 -41%WI 7,391.24 9,063.61 23% 8,553.87 -6%SubTotal
158,627.06 138,047.09 -13% 106,178.11 -23%
SESARM AL 24,030.43 15,971.11 -34% 9,375.48 -41%FL 23,267.30 19,836.10 -15% 17,400.53 -12%GA 24,124.89 20,838.31 -14% 8,446.12 -59%KY 47,495.97 40,399.53 -15% 34,038.75 -16%MS 11,993.68 8,770.10 -27% 8,770.10 0%NC 23,677.82 15,627.62 -34% 9,342.11 -40%SC 7,846.05 5,179.90 -34% 4,083.11 -21%TN 8,694.57 4,701.55 -46% 3,995.52 -15%VA 11,633.30 8,153.29 -30% 7,223.11 -11%WV 31,772.17 27,911.72 -12% 17,008.50 -39%SubTotal
214,536.17 167,389.23 -22% 119,683.34 -28%
CENSARA AR 24,037.76 23,649.35 -2% 22,785.88 -4%IA 15,515.11 11,339.70 -27% 11,255.79 -1%KS 11,627.70 14,217.40 22% 10,894.90 -23%LA 19,305.77 19,915.40 3% 19,592.73 -2%MO 38,098.39 32,829.95 -14% 28,251.82 -14%NE 23,692.60 21,976.01 -7% 21,854.81 -1%OK 29,303.74 17,253.89 -41% 17,253.89 0%TX 68,748.74 65,509.54 -5% 64,212.87 -2%SubTotal
230,329.82 206,691.25 -10% 196,102.68 -5%
Grand Total 684,484.38 567,895.40 -17% 461,461.26 -19%
13

Figure 16: Total 2028 Projected NOX Emissions from January 1-April 30 and November 1-December 31CT DE MA
MD
ME
NH NJ
NY PA RI VT IL IN MI
MN OH WI
AL FL GA KY MS
NC SC TN VA WV AR IA KS LA MO NE
OK TX
MANE-VU LADCO SESARM CENSARA
0
10,000
20,000
30,000
40,000
50,000
60,000
70,000v2.3 - Base v2.6 - Basev2.6 - Best Observed Ozone Rate Applied During Non-Ozone Season
Figure 17 shows the change in non-ozone season emissions that occur when ERTAC inputs are changed from version 2.3 to 2.6. Figure 18 shows the change in non-ozone season emissions that occur when best observed rates are used during the non-ozone season months.
Figure 18 also shows which back trajectories occurred on days where nitrate impairment outweighs the sulfate impairment at Brigantine. Many of the back trajectories on the 20% most impaired days traverse the locations of the EGUs that are seeing some of the greatest reductions in emissions in the analysis. You can clearly see emission reductions occurring at power plants in Pennsylvania, Michigan, and along the Ohio River valley. Since the emissions from these power plants are released into air masses that are likely to travel to Brigantine, these emissions reductions should have a significant benefit at Brigantine. One should note that the back trajectories were not run at an elevation intended to evaluate against mobile and area sources and were not run for a long enough time period to demonstrate impacts from further away states such as Texas. The complete list of sources is provided in Appendix B.
14

Figure 17: Change in non-OS NOX emissions (tons) due to migration from ERTAC v2.3 to v2.6
15

Figure 18: Change in non-OS NOX emissions (tons) due to optimization of non-OS emission rates and 2011 and 2015 back trajectories on 20% most impaired winter days where nitrates impacted visibility more than sulfates at Brigantine Wilderness
SummaryIn recent years several MANE-VU Class I Areas have seen an increase in the relative visibility impairment from nitrates during the colder months. NOX emissions are one of the main anthropogenic precursors to wintertime nitrate formation. Due to the higher elevation at which EGUs release emissions, NOX emissions from EGUs have more potential to impact distant Class I Areas than other types of NOX emission sources. Running existing installed controls is considered to be one of the most cost-effective ways to control NOX emissions from EGUs. The analysis presented in this report demonstrates that running existing SCRs and SNCRs on EGUs would substantially reduce the NOX emissions that lead to visibility impairment during the winter from nitrates.
16

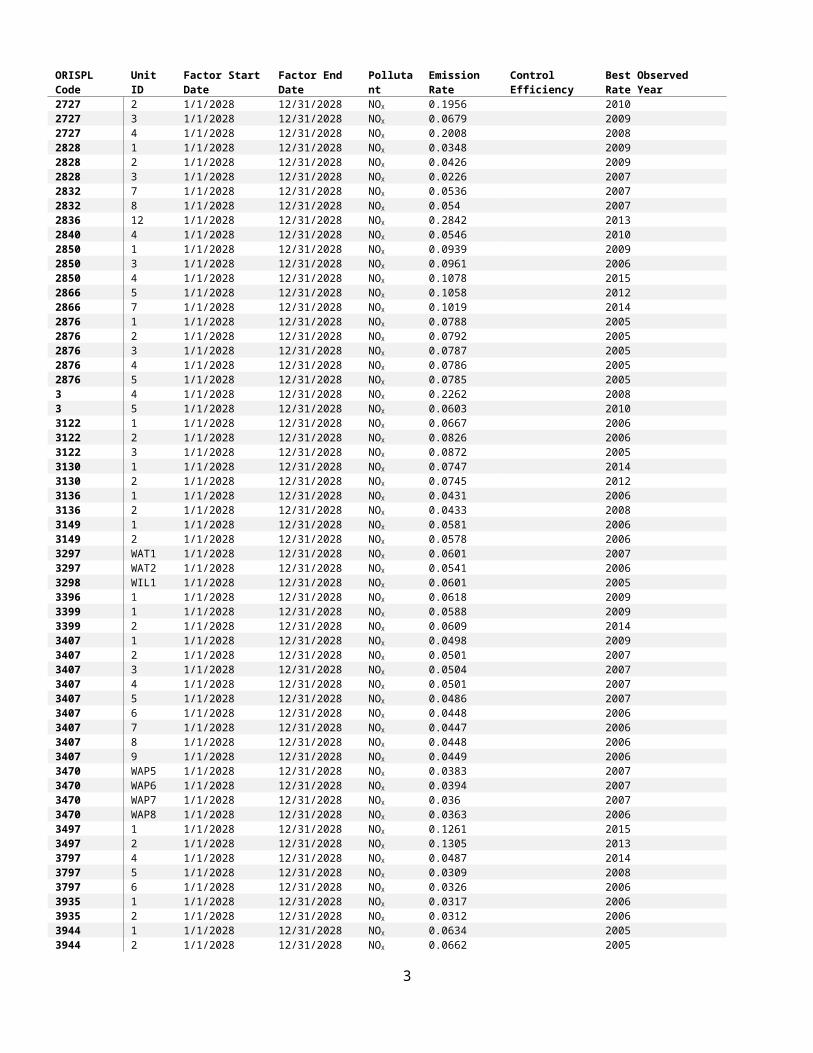
Appendix AIn order to create the control file, the annual summary file and preprocessed control file files from the ERTAC v2.6 and the best observed rate file were imported into Microsoft Access. The preprocessed control file was used since it included already processed seasonal controls, which are in a separate input file. Then, the best ozone season NOX emission rate was compared to the non-ozone season NOX emission rate from the annual summary file. In cases where the best observed ozone season NOX emission rate at a unit with an installed SCR or SNCR was lower than the non-ozone season NOX emission rate found in the annual summary an emission rate entry was added to the control file reflecting the best observed rate. Entries in the existing control emissions file for NOX emissions for units that met the criteria were removed (156 entries) and then new NOX emission rates were appended (291 entries). It should be noted that not all units have a control file entry since many units rely on the base year emission rates solely in ERTAC. The replacement ertac_control_emissions.csv file was then run through ERTAC EGU, using all other inputs directly from the 2028 projections for ERTAC v2.6, except ertac_seasonal_controls.csv, which was not needed for the run due to its inclusion in ertac_control_emissions.csv. The entries added to the final control file are in Table 3 below.
Table 3: Entries added to ERTAC Control FileORISPL Code Unit ID Factor Start Date Factor End Date Pollutant Emission Rate Control Efficiency Best Observed Rate Year1004 CTG1 1/1/2028 12/31/2028 NOX 0.0443 20141004 CTG2 1/1/2028 12/31/2028 NOX 0.0522 201410043 1001 1/1/2028 12/31/2028 NOX 0.1009 201510075 1 1/1/2028 12/31/2028 NOX 0.1172 201410075 2 1/1/2028 12/31/2028 NOX 0.1215 20141012 2 1/1/2028 12/31/2028 NOX 0.1482 20151012 3 1/1/2028 12/31/2028 NOX 0.0885 201510151 1A 1/1/2028 12/31/2028 NOX 0.0721 200510566 1001 1/1/2028 12/31/2028 NOX 0.1218 200910566 1002 1/1/2028 12/31/2028 NOX 0.1143 201110641 1 1/1/2028 12/31/2028 NOX 0.0945 200510641 2 1/1/2028 12/31/2028 NOX 0.0949 200610678 1 1/1/2028 12/31/2028 NOX 0.051 20081082 4 1/1/2028 12/31/2028 NOX 0.0537 20101241 1 1/1/2028 12/31/2028 NOX 0.081 20111241 2 1/1/2028 12/31/2028 NOX 0.0908 2015130 1 1/1/2028 12/31/2028 NOX 0.0664 2014130 2 1/1/2028 12/31/2028 NOX 0.0702 2012130 3 1/1/2028 12/31/2028 NOX 0.059 2012130 4 1/1/2028 12/31/2028 NOX 0.0591 20121356 1 1/1/2028 12/31/2028 NOX 0.0448 20051356 3 1/1/2028 12/31/2028 NOX 0.0272 20051356 4 1/1/2028 12/31/2028 NOX 0.0272 2005136 1 1/1/2028 12/31/2028 NOX 0.0434 2010136 2 1/1/2028 12/31/2028 NOX 0.0404 20111364 3 1/1/2028 12/31/2028 NOX 0.045 20051364 4 1/1/2028 12/31/2028 NOX 0.0374 20071374 1 1/1/2028 12/31/2028 NOX 0.1229 20061374 2 1/1/2028 12/31/2028 NOX 0.2179 20051378 3 1/1/2028 12/31/2028 NOX 0.1001 20051382 H1 1/1/2028 12/31/2028 NOX 0.0606 20071382 H2 1/1/2028 12/31/2028 NOX 0.0666 20091552 1 1/1/2028 12/31/2028 NOX 0.2783 20151552 2 1/1/2028 12/31/2028 NOX 0.2351 20151554 2 1/1/2028 12/31/2028 NOX 0.2222 20151554 3 1/1/2028 12/31/2028 NOX 0.0552 20151571 1 1/1/2028 12/31/2028 NOX 0.104 20141571 2 1/1/2028 12/31/2028 NOX 0.1927 20091572 1 1/1/2028 12/31/2028 NOX 0.2197 20151572 2 1/1/2028 12/31/2028 NOX 0.2212 20151572 3 1/1/2028 12/31/2028 NOX 0.2178 20151573 1 1/1/2028 12/31/2028 NOX 0.0251 2013
1

ORISPL Code Unit ID Factor Start Date Factor End Date Pollutant Emission Rate Control Efficiency Best Observed Rate Year1573 2 1/1/2028 12/31/2028 NOX 0.0309 20111702 1 1/1/2028 12/31/2028 NOX 0.0488 20151702 2 1/1/2028 12/31/2028 NOX 0.0443 20151710 2 1/1/2028 12/31/2028 NOX 0.0366 20151710 3 1/1/2028 12/31/2028 NOX 0.0414 20151733 1 1/1/2028 12/31/2028 NOX 0.038 20141733 3 1/1/2028 12/31/2028 NOX 0.0573 20111733 4 1/1/2028 12/31/2028 NOX 0.0408 20131893 1 1/1/2028 12/31/2028 NOX 0.1708 20141893 2 1/1/2028 12/31/2028 NOX 0.1714 20141893 3 1/1/2028 12/31/2028 NOX 0.05 20101893 4 1/1/2028 12/31/2028 NOX 0.1057 2015207 1 1/1/2028 12/31/2028 NOX 0.1265 2010207 2 1/1/2028 12/31/2028 NOX 0.1274 20102076 1 1/1/2028 12/31/2028 NOX 0.0918 20092079 5A 1/1/2028 12/31/2028 NOX 0.0718 20122094 1 1/1/2028 12/31/2028 NOX 0.3413 20132094 2 1/1/2028 12/31/2028 NOX 0.4161 20132094 3 1/1/2028 12/31/2028 NOX 0.0787 20102167 1 1/1/2028 12/31/2028 NOX 0.0895 20082167 2 1/1/2028 12/31/2028 NOX 0.0941 20092168 MB1 1/1/2028 12/31/2028 NOX 0.0958 20102168 MB2 1/1/2028 12/31/2028 NOX 0.115 20152168 MB3 1/1/2028 12/31/2028 NOX 0.0961 20102364 1 1/1/2028 12/31/2028 NOX 0.1613 20052364 2 1/1/2028 12/31/2028 NOX 0.159 20062367 4 1/1/2028 12/31/2028 NOX 0.1811 20072367 6 1/1/2028 12/31/2028 NOX 0.1896 20072403 2 1/1/2028 12/31/2028 NOX 0.0745 20112408 1 1/1/2028 12/31/2028 NOX 0.0731 20152408 2 1/1/2028 12/31/2028 NOX 0.0544 201526 5 1/1/2028 12/31/2028 NOX 0.076 20072712 1 1/1/2028 12/31/2028 NOX 0.084 20052712 2 1/1/2028 12/31/2028 NOX 0.0575 20112712 3A 1/1/2028 12/31/2028 NOX 0.0742 20052712 3B 1/1/2028 12/31/2028 NOX 0.0756 20052712 4A 1/1/2028 12/31/2028 NOX 0.0793 20092712 4B 1/1/2028 12/31/2028 NOX 0.0793 20092718 4 1/1/2028 12/31/2028 NOX 0.1778 20082718 5 1/1/2028 12/31/2028 NOX 0.1912 20122721 5 1/1/2028 12/31/2028 NOX 0.056 20112721 6 1/1/2028 12/31/2028 NOX 0.0457 20132727 1 1/1/2028 12/31/2028 NOX 0.196 20102727 2 1/1/2028 12/31/2028 NOX 0.1956 20102727 3 1/1/2028 12/31/2028 NOX 0.0679 20092727 4 1/1/2028 12/31/2028 NOX 0.2008 20082828 1 1/1/2028 12/31/2028 NOX 0.0348 20092828 2 1/1/2028 12/31/2028 NOX 0.0426 20092828 3 1/1/2028 12/31/2028 NOX 0.0226 20072832 7 1/1/2028 12/31/2028 NOX 0.0536 20072832 8 1/1/2028 12/31/2028 NOX 0.054 20072836 12 1/1/2028 12/31/2028 NOX 0.2842 20132840 4 1/1/2028 12/31/2028 NOX 0.0546 20102850 1 1/1/2028 12/31/2028 NOX 0.0939 20092850 3 1/1/2028 12/31/2028 NOX 0.0961 20062850 4 1/1/2028 12/31/2028 NOX 0.1078 20152866 5 1/1/2028 12/31/2028 NOX 0.1058 20122866 7 1/1/2028 12/31/2028 NOX 0.1019 20142876 1 1/1/2028 12/31/2028 NOX 0.0788 20052876 2 1/1/2028 12/31/2028 NOX 0.0792 20052876 3 1/1/2028 12/31/2028 NOX 0.0787 20052876 4 1/1/2028 12/31/2028 NOX 0.0786 20052876 5 1/1/2028 12/31/2028 NOX 0.0785 20053 4 1/1/2028 12/31/2028 NOX 0.2262 20083 5 1/1/2028 12/31/2028 NOX 0.0603 20103122 1 1/1/2028 12/31/2028 NOX 0.0667 20063122 2 1/1/2028 12/31/2028 NOX 0.0826 20063122 3 1/1/2028 12/31/2028 NOX 0.0872 2005
2

ORISPL Code Unit ID Factor Start Date Factor End Date Pollutant Emission Rate Control Efficiency Best Observed Rate Year3130 1 1/1/2028 12/31/2028 NOX 0.0747 20143130 2 1/1/2028 12/31/2028 NOX 0.0745 20123136 1 1/1/2028 12/31/2028 NOX 0.0431 20063136 2 1/1/2028 12/31/2028 NOX 0.0433 20083149 1 1/1/2028 12/31/2028 NOX 0.0581 20063149 2 1/1/2028 12/31/2028 NOX 0.0578 20063297 WAT1 1/1/2028 12/31/2028 NOX 0.0601 20073297 WAT2 1/1/2028 12/31/2028 NOX 0.0541 20063298 WIL1 1/1/2028 12/31/2028 NOX 0.0601 20053396 1 1/1/2028 12/31/2028 NOX 0.0618 20093399 1 1/1/2028 12/31/2028 NOX 0.0588 20093399 2 1/1/2028 12/31/2028 NOX 0.0609 20143407 1 1/1/2028 12/31/2028 NOX 0.0498 20093407 2 1/1/2028 12/31/2028 NOX 0.0501 20073407 3 1/1/2028 12/31/2028 NOX 0.0504 20073407 4 1/1/2028 12/31/2028 NOX 0.0501 20073407 5 1/1/2028 12/31/2028 NOX 0.0486 20073407 6 1/1/2028 12/31/2028 NOX 0.0448 20063407 7 1/1/2028 12/31/2028 NOX 0.0447 20063407 8 1/1/2028 12/31/2028 NOX 0.0448 20063407 9 1/1/2028 12/31/2028 NOX 0.0449 20063470 WAP5 1/1/2028 12/31/2028 NOX 0.0383 20073470 WAP6 1/1/2028 12/31/2028 NOX 0.0394 20073470 WAP7 1/1/2028 12/31/2028 NOX 0.036 20073470 WAP8 1/1/2028 12/31/2028 NOX 0.0363 20063497 1 1/1/2028 12/31/2028 NOX 0.1261 20153497 2 1/1/2028 12/31/2028 NOX 0.1305 20133797 4 1/1/2028 12/31/2028 NOX 0.0487 20143797 5 1/1/2028 12/31/2028 NOX 0.0309 20083797 6 1/1/2028 12/31/2028 NOX 0.0326 20063935 1 1/1/2028 12/31/2028 NOX 0.0317 20063935 2 1/1/2028 12/31/2028 NOX 0.0312 20063944 1 1/1/2028 12/31/2028 NOX 0.0634 20053944 2 1/1/2028 12/31/2028 NOX 0.0662 20053944 3 1/1/2028 12/31/2028 NOX 0.0658 20053954 1 1/1/2028 12/31/2028 NOX 0.0539 20063954 2 1/1/2028 12/31/2028 NOX 0.0485 20063954 3 1/1/2028 12/31/2028 NOX 0.0768 20064041 6 1/1/2028 12/31/2028 NOX 0.0681 20134041 7 1/1/2028 12/31/2028 NOX 0.0603 20154041 8 1/1/2028 12/31/2028 NOX 0.0608 20154050 5 1/1/2028 12/31/2028 NOX 0.0361 20144078 4 1/1/2028 12/31/2028 NOX 0.053 20144125 9 1/1/2028 12/31/2028 NOX 0.0368 201550776 1 1/1/2028 12/31/2028 NOX 0.1051 200550776 2 1/1/2028 12/31/2028 NOX 0.1056 201550974 1 1/1/2028 12/31/2028 NOX 0.0573 200550974 2 1/1/2028 12/31/2028 NOX 0.0793 200551 1 1/1/2028 12/31/2028 NOX 0.1917 201452071 5A 1/1/2028 12/31/2028 NOX 0.0618 201152071 5B 1/1/2028 12/31/2028 NOX 0.0626 201154081 BLR01A 1/1/2028 12/31/2028 NOX 0.2608 200554081 BLR01B 1/1/2028 12/31/2028 NOX 0.26 200554081 BLR02A 1/1/2028 12/31/2028 NOX 0.2548 200554081 BLR02B 1/1/2028 12/31/2028 NOX 0.2547 200554081 BLR03A 1/1/2028 12/31/2028 NOX 0.2614 200554081 BLR03B 1/1/2028 12/31/2028 NOX 0.2616 200554081 BLR04A 1/1/2028 12/31/2028 NOX 0.2648 200554081 BLR04B 1/1/2028 12/31/2028 NOX 0.2647 200554304 1 1/1/2028 12/31/2028 NOX 0.0879 200854755 2 1/1/2028 12/31/2028 NOX 0.1316 201556 2 1/1/2028 12/31/2028 NOX 0.164 201156 3 1/1/2028 12/31/2028 NOX 0.0585 201156068 1 1/1/2028 12/31/2028 NOX 0.049 2010564 2 1/1/2028 12/31/2028 NOX 0.1042 201556456 1 1/1/2028 12/31/2028 NOX 0.0641 201256564 SN-01 1/1/2028 12/31/2028 NOX 0.04 201456611 S01 1/1/2028 12/31/2028 NOX 0.0397 2015
3

ORISPL Code Unit ID Factor Start Date Factor End Date Pollutant Emission Rate Control Efficiency Best Observed Rate Year56671 1 1/1/2028 12/31/2028 NOX 0.0648 2013594 4 1/1/2028 12/31/2028 NOX 0.0657 201260 2 1/1/2028 12/31/2028 NOX 0.0619 20126002 1 1/1/2028 12/31/2028 NOX 0.0656 20116002 2 1/1/2028 12/31/2028 NOX 0.0538 20116002 3 1/1/2028 12/31/2028 NOX 0.0634 20066002 4 1/1/2028 12/31/2028 NOX 0.063 20086004 1 1/1/2028 12/31/2028 NOX 0.0394 20056004 2 1/1/2028 12/31/2028 NOX 0.039 20056016 1 1/1/2028 12/31/2028 NOX 0.0736 20096018 2 1/1/2028 12/31/2028 NOX 0.0518 20066019 1 1/1/2028 12/31/2028 NOX 0.0562 2006602 1 1/1/2028 12/31/2028 NOX 0.0589 2007602 2 1/1/2028 12/31/2028 NOX 0.0733 20156031 2 1/1/2028 12/31/2028 NOX 0.0885 20056041 1 1/1/2028 12/31/2028 NOX 0.0829 20086041 2 1/1/2028 12/31/2028 NOX 0.0729 20066041 3 1/1/2028 12/31/2028 NOX 0.0577 20156041 4 1/1/2028 12/31/2028 NOX 0.0604 20126052 1 1/1/2028 12/31/2028 NOX 0.0475 20106052 2 1/1/2028 12/31/2028 NOX 0.0507 20066065 1 1/1/2028 12/31/2028 NOX 0.0613 20156068 2 1/1/2028 12/31/2028 NOX 0.0988 20156068 3 1/1/2028 12/31/2028 NOX 0.1152 20156071 1 1/1/2028 12/31/2028 NOX 0.0309 20056071 2 1/1/2028 12/31/2028 NOX 0.0407 20156085 14 1/1/2028 12/31/2028 NOX 0.0979 20136094 1 1/1/2028 12/31/2028 NOX 0.082 20086094 2 1/1/2028 12/31/2028 NOX 0.0801 20076094 3 1/1/2028 12/31/2028 NOX 0.0744 20056096 2 1/1/2028 12/31/2028 NOX 0.0582 20156113 1 1/1/2028 12/31/2028 NOX 0.0343 20076113 2 1/1/2028 12/31/2028 NOX 0.0672 20066113 3 1/1/2028 12/31/2028 NOX 0.0659 20056113 4 1/1/2028 12/31/2028 NOX 0.0632 20086113 5 1/1/2028 12/31/2028 NOX 0.0597 20076137 1 1/1/2028 12/31/2028 NOX 0.0756 20066137 2 1/1/2028 12/31/2028 NOX 0.1009 20066147 2 1/1/2028 12/31/2028 NOX 0.1187 20146147 3 1/1/2028 12/31/2028 NOX 0.1485 20146170 1 1/1/2028 12/31/2028 NOX 0.0498 20076170 2 1/1/2028 12/31/2028 NOX 0.0601 20076190 2 1/1/2028 12/31/2028 NOX 0.1358 20156190 1-Mar 1/1/2028 12/31/2028 NOX 0.0289 20116190 2-Mar 1/1/2028 12/31/2028 NOX 0.0419 20146195 1 1/1/2028 12/31/2028 NOX 0.0829 20136195 2 1/1/2028 12/31/2028 NOX 0.0596 20146213 1SG1 1/1/2028 12/31/2028 NOX 0.062 20146213 2SG1 1/1/2028 12/31/2028 NOX 0.0587 20156249 1 1/1/2028 12/31/2028 NOX 0.0623 20056249 2 1/1/2028 12/31/2028 NOX 0.0679 20056249 3 1/1/2028 12/31/2028 NOX 0.0812 20156249 4 1/1/2028 12/31/2028 NOX 0.0869 20126250 1A 1/1/2028 12/31/2028 NOX 0.061 20076250 1B 1/1/2028 12/31/2028 NOX 0.0614 20076257 1 1/1/2028 12/31/2028 NOX 0.0613 20146257 2 1/1/2028 12/31/2028 NOX 0.0606 20146257 3 1/1/2028 12/31/2028 NOX 0.0593 20126257 4 1/1/2028 12/31/2028 NOX 0.0627 20136264 1 1/1/2028 12/31/2028 NOX 0.0387 2007628 4 1/1/2028 12/31/2028 NOX 0.0504 2014628 5 1/1/2028 12/31/2028 NOX 0.0446 2010641 5 1/1/2028 12/31/2028 NOX 0.1193 2015641 7 1/1/2028 12/31/2028 NOX 0.0842 2008645 BB01 1/1/2028 12/31/2028 NOX 0.0823 2011645 BB02 1/1/2028 12/31/2028 NOX 0.0809 2010645 BB03 1/1/2028 12/31/2028 NOX 0.0908 2015645 BB04 1/1/2028 12/31/2028 NOX 0.0748 2010
4

ORISPL Code Unit ID Factor Start Date Factor End Date Pollutant Emission Rate Control Efficiency Best Observed Rate Year663 B2 1/1/2028 12/31/2028 NOX 0.0571 2012667 1A 1/1/2028 12/31/2028 NOX 0.0252 2013667 2A 1/1/2028 12/31/2028 NOX 0.042 20126705 4 1/1/2028 12/31/2028 NOX 0.0948 20076768 1 1/1/2028 12/31/2028 NOX 0.1046 20136823 W1 1/1/2028 12/31/2028 NOX 0.0477 2006703 1BLR 1/1/2028 12/31/2028 NOX 0.0547 2008703 2BLR 1/1/2028 12/31/2028 NOX 0.0543 2006703 3BLR 1/1/2028 12/31/2028 NOX 0.0553 2006703 4BLR 1/1/2028 12/31/2028 NOX 0.0525 20137030 U1 1/1/2028 12/31/2028 NOX 0.097 20157030 U2 1/1/2028 12/31/2028 NOX 0.0979 2015708 4 1/1/2028 12/31/2028 NOX 0.0553 20077097 **2 1/1/2028 12/31/2028 NOX 0.0392 20117210 COP1 1/1/2028 12/31/2028 NOX 0.0799 20097213 1 1/1/2028 12/31/2028 NOX 0.2327 20057213 2 1/1/2028 12/31/2028 NOX 0.2428 20077343 4 1/1/2028 12/31/2028 NOX 0.1873 20158 10 1/1/2028 12/31/2028 NOX 0.068 20068042 1 1/1/2028 12/31/2028 NOX 0.028 20078042 2 1/1/2028 12/31/2028 NOX 0.0382 20098102 1 1/1/2028 12/31/2028 NOX 0.0686 20078102 2 1/1/2028 12/31/2028 NOX 0.0553 20058226 1 1/1/2028 12/31/2028 NOX 0.0901 2006861 1 1/1/2028 12/31/2028 NOX 0.0495 2011861 2 1/1/2028 12/31/2028 NOX 0.0524 2008876 1 1/1/2028 12/31/2028 NOX 0.0577 2013876 2 1/1/2028 12/31/2028 NOX 0.06 2009879 51 1/1/2028 12/31/2028 NOX 0.0985 2013879 52 1/1/2028 12/31/2028 NOX 0.0987 2015879 61 1/1/2028 12/31/2028 NOX 0.0973 2013879 62 1/1/2028 12/31/2028 NOX 0.0885 2015889 2 1/1/2028 12/31/2028 NOX 0.0509 2010891 9 1/1/2028 12/31/2028 NOX 0.029 2008963 31 1/1/2028 12/31/2028 NOX 0.0938 2007963 32 1/1/2028 12/31/2028 NOX 0.0846 2008963 33 1/1/2028 12/31/2028 NOX 0.0603 2014976 123 1/1/2028 12/31/2028 NOX 0.0656 2006976 4 1/1/2028 12/31/2028 NOX 0.0785 2015983 1 1/1/2028 12/31/2028 NOX 0.0735 2005983 2 1/1/2028 12/31/2028 NOX 0.075 2005983 3 1/1/2028 12/31/2028 NOX 0.0742 2005994 2 1/1/2028 12/31/2028 NOX 0.051 2005994 3 1/1/2028 12/31/2028 NOX 0.0466 2005997 12 1/1/2028 12/31/2028 NOX 0.092 2005
5

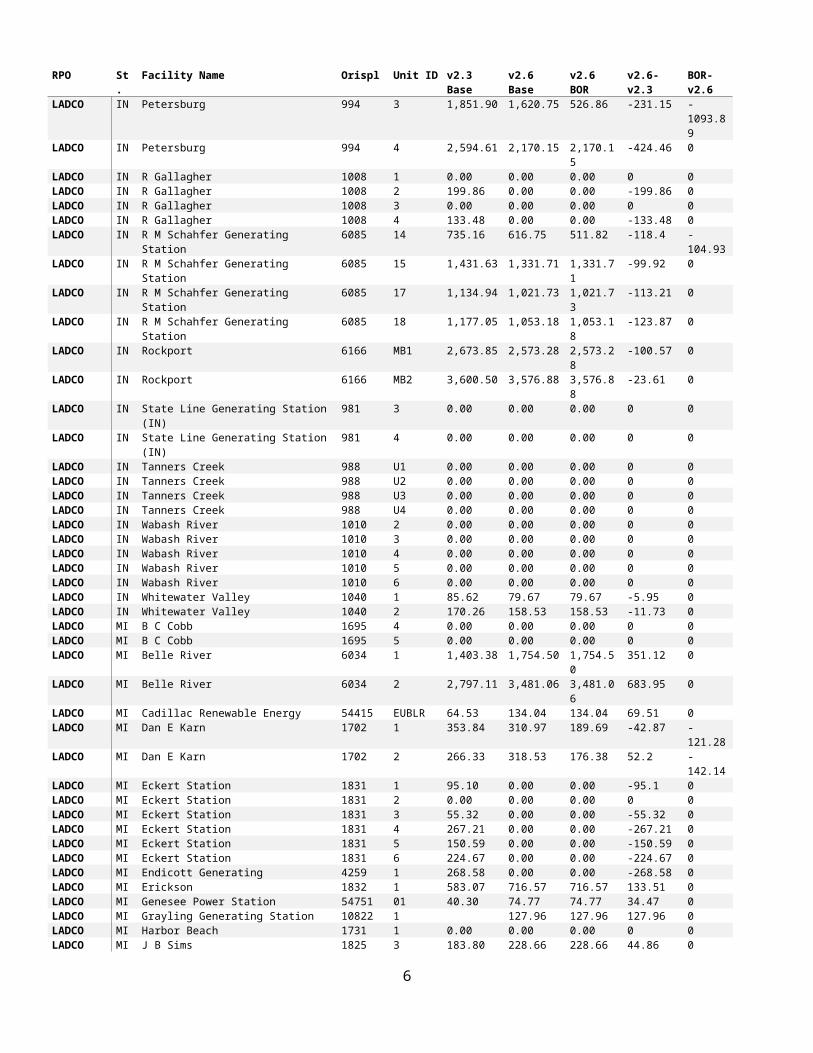
Appendix BTable 4: Unit level results in total tons during non-ozone season from ERTAC v2.3, v2.6, and the best observed rate (BOR) runsRPO St. Facility Name Orispl Unit ID v2.3 Base v2.6 Base v2.6 BOR v2.6-v2.3 BOR-v2.6MANE-VU CT Bridgeport Harbor Station 568 BHB3 191.82 64.02 64.02 -127.8 0MANE-VU CT Bridgeport Harbor Station 568 G09001 255.33 -255.33 0MANE-VU DE Indian River 594 1 0.00 0.00 0.00 0 0MANE-VU DE Indian River 594 3 0.00 0.00 0.00 0 0MANE-VU DE Indian River 594 4 252.47 211.09 138.68 -41.38 -72.4MANE-VU MA Brayton Point 1619 1 0.00 0.00 0.00 0 0MANE-VU MA Brayton Point 1619 2 0.00 0.00 0.00 0 0MANE-VU MA Brayton Point 1619 3 0.00 0.00 0.00 0 0MANE-VU MA Brayton Point 1619 G25001 680.46 -680.46 0MANE-VU MA Mount Tom 1606 1 48.88 0.00 0.00 -48.88 0MANE-VU MA Salem Harbor 1626 1 0.00 0.00 0.00 0 0MANE-VU MA Salem Harbor 1626 2 0.00 0.00 0.00 0 0MANE-VU MA Salem Harbor 1626 3 0.00 0.00 0.00 0 0MANE-VU MA Salem Harbor 1626 G25002 550.83 -550.83 0MANE-VU MD AES Warrior Run 10678 001 783.40 784.39 250.96 0.99 -533.42MANE-VU MD Brandon Shores 602 1 1,875.07 1,633.57 494.94 -241.5 -1138.62MANE-VU MD Brandon Shores 602 2 2,018.61 1,707.75 592.42 -310.87 -1115.33MANE-VU MD C P Crane 1552 1 566.75 468.36 290.11 -98.39 -178.26MANE-VU MD C P Crane 1552 2 562.75 454.28 262.67 -108.48 -191.61MANE-VU MD Herbert A Wagner 1554 2 540.51 454.70 255.66 -85.81 -199.05MANE-VU MD Herbert A Wagner 1554 3 437.27 366.40 128.66 -70.87 -237.74MANE-VU MD Mirant Chalk Point 1571 1 978.60 819.08 446.46 -159.51 -372.62MANE-VU MD Mirant Chalk Point 1571 2 1,728.80 1,598.84 1,218.25 -129.96 -380.58MANE-VU MD Mirant Dickerson 1572 1 275.60 232.61 179.44 -42.99 -53.17MANE-VU MD Mirant Dickerson 1572 2 402.97 347.25 264.60 -55.71 -82.66MANE-VU MD Mirant Dickerson 1572 3 343.85 296.97 224.59 -46.88 -72.39MANE-VU MD Mirant Morgantown 1573 1 432.12 388.58 253.99 -43.54 -134.59MANE-VU MD Mirant Morgantown 1573 2 361.06 342.88 307.10 -18.19 -35.78MANE-VU MD R. Paul Smith Power Station 1570 11 0.00 0.00 0.00 0 0MANE-VU MD R. Paul Smith Power Station 1570 9 0.00 0.00 0.00 0 0MANE-VU NH Merrimack 2364 1 366.58 291.78 166.18 -74.8 -125.6MANE-VU NH Merrimack 2364 2 856.80 545.00 324.68 -311.8 -220.32MANE-VU NH Merrimack 2364 G33001 623.79 -623.79 0MANE-VU NH Schiller 2367 4 140.70 73.12 44.66 -67.58 -28.46MANE-VU NH Schiller 2367 6 143.08 73.95 47.08 -69.12 -26.87MANE-VU NJ B L England 2378 1 0.00 0.00 0 0MANE-VU NJ B L England 2378 2 0.00 0.00 0 0MANE-VU NJ Carneys Point 10566 1001 230.87 194.05 177.35 -36.82 -16.7MANE-VU NJ Carneys Point 10566 1002 232.58 188.24 167.86 -44.34 -20.38MANE-VU NJ Deepwater 2384 8 0.00 0.00 0.00 0 0MANE-VU NJ Hudson Generating Station 2403 2 335.67 130.25 107.82 -205.42 -22.43MANE-VU NJ Logan Generating Plant 10043 1001 165.43 116.54 91.00 -48.89 -25.54MANE-VU NJ Mercer Generating Station 2408 1 89.44 48.11 39.08 -41.33 -9.03MANE-VU NJ Mercer Generating Station 2408 2 78.56 41.16 24.88 -37.4 -16.28MANE-VU NY AES Cayuga, LLC 2535 1 0.00 85.76 85.76 85.76 0MANE-VU NY AES Cayuga, LLC 2535 2 0.00 81.08 81.08 81.08 0MANE-VU NY AES Greenidge 2527 6 0.00 0.00 0.00 0 0MANE-VU NY AES Somerset (Kintigh ) 6082 1 1,026.71 533.17 533.17 -493.54 0MANE-VU NY AES Somerset (Kintigh ) 6082 G36002 1,512.46 -1512.46 0MANE-VU NY AES Westover (Goudey) 2526 13 0.00 0.00 0.00 0 0MANE-VU NY Black River Generation, LLC 10464 E0001 0.00 0.00 0 0MANE-VU NY Black River Generation, LLC 10464 E0002 0.00 0.00 0 0MANE-VU NY Black River Generation, LLC 10464 E0003 0.00 0.00 0 0MANE-VU NY Dunkirk 2554 1 56.29 29.65 29.65 -26.65 0MANE-VU NY Dunkirk 2554 2 85.81 37.83 37.83 -47.97 0MANE-VU NY Dunkirk 2554 3 203.76 107.83 107.83 -95.93 0
1
RPO St. Facility Name Orispl Unit ID v2.3 Base v2.6 Base v2.6 BOR v2.6-v2.3 BOR-v2.6MANE-VU NY Dunkirk 2554 4 175.17 82.39 82.39 -92.78 0MANE-VU NY Dunkirk 2554 G36003 1,292.30 -1292.3 0MANE-VU NY Dynegy Danskammer 2480 3 106.46 -106.46 0MANE-VU NY Dynegy Danskammer 2480 4 187.60 -187.6 0MANE-VU NY Huntley Power 2549 67 206.64 92.49 92.49 -114.15 0MANE-VU NY Huntley Power 2549 68 205.52 88.10 88.10 -117.42 0MANE-VU NY Niagara Generation, LLC 50202 1 0.00 0.00 0.00 0 0MANE-VU NY S A Carlson 2682 10 9.93 -9.93 0MANE-VU NY S A Carlson 2682 12 6.09 0.00 0.00 -6.09 0MANE-VU NY S A Carlson 2682 9 14.74 -14.74 0MANE-VU NY Syracuse Energy Corporation 50651 BLR1 0.00 0.00 0.00 0 0MANE-VU PA AES Beaver Valley LLC 10676 032 0.00 0.00 0.00 0 0MANE-VU PA AES Beaver Valley LLC 10676 033 0.00 0.00 0.00 0 0MANE-VU PA AES Beaver Valley LLC 10676 034 0.00 0.00 0.00 0 0MANE-VU PA AES Beaver Valley LLC 10676 035 0.00 0.00 0.00 0 0MANE-VU PA Armstrong Power Station 3178 1 0.00 0.00 0.00 0 0MANE-VU PA Armstrong Power Station 3178 2 0.00 0.00 0.00 0 0MANE-VU PA Bruce Mansfield 6094 1 2,868.78 2,215.54 1,513.96 -653.24 -701.59MANE-VU PA Bruce Mansfield 6094 2 1,972.34 1,984.86 1,458.82 12.52 -526.05MANE-VU PA Bruce Mansfield 6094 3 3,883.99 3,611.04 1,260.88 -272.95 -2350.16MANE-VU PA Brunner Island 3140 1 2,367.30 496.73 496.73 -1870.57 0MANE-VU PA Brunner Island 3140 2 2,984.35 463.63 463.63 -2520.72 0MANE-VU PA Brunner Island 3140 3 5,851.85 1,018.50 1,018.50 -4833.35 0MANE-VU PA Cambria Cogen 10641 1 229.46 220.52 137.57 -8.95 -82.95MANE-VU PA Cambria Cogen 10641 2 231.71 240.87 146.45 9.17 -94.42MANE-VU PA Cheswick 8226 1 1,891.04 1,783.68 590.25 -107.36 -1193.43MANE-VU PA Colver Power Project 10143 AAB01 415.38 435.98 435.98 20.59 0MANE-VU PA Conemaugh 3118 1 2,880.89 1,488.43 1,488.43 -1392.46 0MANE-VU PA Conemaugh 3118 2 3,458.32 2,231.46 2,231.46 -1226.85 0MANE-VU PA Cromby 3159 1 0.00 0.00 0.00 0 0MANE-VU PA Ebensburg Power Company 10603 031 190.25 196.44 196.44 6.18 0MANE-VU PA Eddystone Generating Station 3161 1 0.00 0.00 0.00 0 0MANE-VU PA Eddystone Generating Station 3161 2 0.00 0.00 0.00 0 0MANE-VU PA Elrama 3098 1 0.00 0.00 0.00 0 0MANE-VU PA Elrama 3098 2 0.00 0.00 0.00 0 0MANE-VU PA Elrama 3098 3 0.00 0.00 0.00 0 0MANE-VU PA Elrama 3098 4 0.00 0.00 0.00 0 0MANE-VU PA Gilberton Power Company 10113 031 55.80 58.58 58.58 2.77 0MANE-VU PA Gilberton Power Company 10113 032 56.33 58.18 58.18 1.85 0MANE-VU PA Hatfields Ferry Power Station 3179 1 0.00 0.00 0.00 0 0MANE-VU PA Hatfields Ferry Power Station 3179 2 0.00 0.00 0.00 0 0MANE-VU PA Hatfields Ferry Power Station 3179 3 0.00 0.00 0.00 0 0MANE-VU PA Homer City 3122 1 1,619.41 886.11 492.53 -733.3 -393.58MANE-VU PA Homer City 3122 2 1,615.99 891.03 613.33 -724.96 -277.71MANE-VU PA Homer City 3122 3 2,744.88 1,487.23 1,080.72 -1257.65 -406.51MANE-VU PA Keystone 3136 1 2,753.58 1,842.58 661.79 -911 -1180.79MANE-VU PA Keystone 3136 2 3,601.94 2,429.89 876.79 -1172.05 -1553.11MANE-VU PA Keystone 3136 G42001 922.83 -922.83 0MANE-VU PA Mitchell Power Station 3181 33 0.00 0.00 0.00 0 0MANE-VU PA Montour 3149 1 2,210.20 1,157.82 560.58 -1052.38 -597.24MANE-VU PA Montour 3149 2 2,656.82 1,664.18 801.58 -992.64 -862.6MANE-VU PA Mt. Carmel Cogeneration 10343 SG-101 216.75 233.07 233.07 16.33 0MANE-VU PA New Castle 3138 3 131.26 40.37 40.37 -90.9 0MANE-VU PA New Castle 3138 4 207.88 64.01 64.01 -143.87 0MANE-VU PA New Castle 3138 5 205.67 47.02 47.02 -158.66 0MANE-VU PA Northampton Generating Plant 50888 NGC01 262.11 267.14 267.14 5.03 0MANE-VU PA Northeastern Power Company 50039 031 88.19 82.04 82.04 -6.15 0MANE-VU PA Panther Creek Energy Facility 50776 1 169.57 172.85 135.78 3.27 -37.07MANE-VU PA Panther Creek Energy Facility 50776 2 155.56 160.19 135.58 4.63 -24.61MANE-VU PA Piney Creek Power Plant 54144 031 0.00 0.00 0.00 0 0MANE-VU PA Portland 3113 1 0.00 0.00 0.00 0 0
2

RPO St. Facility Name Orispl Unit ID v2.3 Base v2.6 Base v2.6 BOR v2.6-v2.3 BOR-v2.6MANE-VU PA Portland 3113 2 0.00 0.00 0.00 0 0MANE-VU PA Scrubgrass Generating Plant 50974 1 232.81 224.19 91.04 -8.62 -133.15MANE-VU PA Scrubgrass Generating Plant 50974 2 246.63 244.69 125.52 -1.94 -119.17MANE-VU PA Seward 3130 1 643.15 735.76 490.57 92.62 -245.19MANE-VU PA Seward 3130 2 570.78 549.88 368.32 -20.9 -181.56MANE-VU PA Shawville 3131 1 0.00 97.86 97.86 97.86 0MANE-VU PA Shawville 3131 2 0.00 104.96 104.96 104.96 0MANE-VU PA Shawville 3131 3 0.00 174.37 174.37 174.37 0MANE-VU PA Shawville 3131 4 0.00 189.64 189.64 189.64 0MANE-VU PA St. Nicholas Cogeneration Project 54634 1 130.34 132.20 132.20 1.86 0MANE-VU PA Sunbury 3152 1A 0.00 0.00 0.00 0 0MANE-VU PA Sunbury 3152 1B 0.00 0.00 0.00 0 0MANE-VU PA Sunbury 3152 2A 0.00 0.00 0.00 0 0MANE-VU PA Sunbury 3152 2B 0.00 0.00 0.00 0 0MANE-VU PA Sunbury 3152 3 0.00 0.00 0.00 0 0MANE-VU PA Sunbury 3152 4 0.00 0.00 0.00 0 0MANE-VU PA Titus 3115 1 0.00 0.00 0.00 0 0MANE-VU PA Titus 3115 2 0.00 0.00 0.00 0 0MANE-VU PA Titus 3115 3 0.00 0.00 0.00 0 0MANE-VU PA Wheelabrator - Frackville 50879 GEN1 255.99 268.66 268.66 12.67 0MANE-VU PA WPS Westwood Generation, LLC 50611 031 168.99 141.09 141.09 -27.9 0LADCO IL Baldwin Energy Complex 889 1 733.16 0.00 0.00 -733.16 0LADCO IL Baldwin Energy Complex 889 2 786.37 786.70 680.37 0.34 -106.33LADCO IL Baldwin Energy Complex 889 3 1,383.98 0.00 0.00 -1383.98 0LADCO IL Coffeen 861 01 336.32 344.49 324.15 8.17 -20.33LADCO IL Coffeen 861 02 476.27 483.82 481.39 7.56 -2.44LADCO IL Crawford 867 7 0.00 0.00 0.00 0 0LADCO IL Crawford 867 8 0.00 0.00 0.00 0 0LADCO IL Dallman 963 31 142.32 148.60 126.72 6.28 -21.88LADCO IL Dallman 963 32 105.68 111.05 85.41 5.38 -25.64LADCO IL Dallman 963 33 190.36 196.00 153.60 5.64 -42.4LADCO IL Dallman 963 4 143.82 149.85 149.85 6.03 0LADCO IL Duck Creek 6016 1 646.11 673.96 504.16 27.86 -169.8LADCO IL E D Edwards 856 1 0.00 0.00 0.00 0 0LADCO IL E D Edwards 856 2 1,252.54 1,307.05 1,307.05 54.52 0LADCO IL E D Edwards 856 3 368.98 385.93 385.93 16.96 0LADCO IL Fisk 886 19 0.00 0.00 0.00 0 0LADCO IL Havana 891 9 646.74 654.80 344.39 8.06 -310.42LADCO IL Hennepin Power Station 892 1 236.67 240.35 240.35 3.68 0LADCO IL Hennepin Power Station 892 2 761.04 770.02 770.02 8.98 0LADCO IL Hutsonville 863 05 0.00 0.00 0.00 0 0LADCO IL Hutsonville 863 06 0.00 0.00 0.00 0 0LADCO IL Joppa Steam 887 1 536.62 563.69 563.69 27.08 0LADCO IL Joppa Steam 887 2 401.47 416.65 416.65 15.18 0LADCO IL Joppa Steam 887 3 469.91 492.88 492.88 22.97 0LADCO IL Joppa Steam 887 4 481.26 504.70 504.70 23.44 0LADCO IL Joppa Steam 887 5 496.98 521.56 521.56 24.58 0LADCO IL Joppa Steam 887 6 498.58 523.34 523.34 24.75 0LADCO IL Kincaid Station 876 1 666.22 615.59 507.42 -50.63 -108.17LADCO IL Kincaid Station 876 2 569.27 505.72 433.47 -63.55 -72.25LADCO IL Marion 976 123 273.02 287.88 182.46 14.86 -105.42LADCO IL Marion 976 4 796.66 823.48 318.46 26.82 -505.02LADCO IL Meredosia 864 05 0.00 0.00 0.00 0 0LADCO IL Newton 6017 1 1,141.90 1,199.55 1,199.55 57.65 0LADCO IL Newton 6017 2 1,111.27 0.00 0.00 -1111.27 0LADCO IL Powerton 879 51 1,018.52 908.82 895.19 -109.7 -13.63LADCO IL Powerton 879 52 1,000.34 885.13 873.63 -115.21 -11.51LADCO IL Powerton 879 61 1,120.51 987.61 951.43 -132.9 -36.18LADCO IL Powerton 879 62 1,132.10 1,040.14 911.41 -91.96 -128.73LADCO IL Prairie State Generating Company 55856 01 755.24 928.00 928.00 172.77 0LADCO IL Prairie State Generating Company 55856 02 651.78 698.62 698.62 46.84 0
3

RPO St. Facility Name Orispl Unit ID v2.3 Base v2.6 Base v2.6 BOR v2.6-v2.3 BOR-v2.6LADCO IL Vermilion Power Station 897 1 0.00 0.00 0.00 0 0LADCO IL Vermilion Power Station 897 2 0.00 0.00 0.00 0 0LADCO IL Waukegan 883 7 586.91 545.11 545.11 -41.8 0LADCO IL Waukegan 883 8 1,009.30 875.74 875.74 -133.55 0LADCO IL Will County 884 4 540.35 501.70 501.70 -38.65 0LADCO IL Wood River Power Station 898 4 277.27 0.00 0.00 -277.27 0LADCO IL Wood River Power Station 898 5 1,208.76 0.00 0.00 -1208.76 0LADCO IN A B Brown Generating Station 6137 1 466.02 428.05 226.34 -37.97 -201.7LADCO IN A B Brown Generating Station 6137 2 674.47 617.22 449.37 -57.25 -167.85LADCO IN Alcoa Allowance Management Inc 6705 4 1,144.40 1,042.32 708.51 -102.07 -333.81LADCO IN Bailly Generating Station 995 7 504.78 0.00 0.00 -504.78 0LADCO IN Bailly Generating Station 995 8 868.42 0.00 0.00 -868.42 0LADCO IN Cayuga 1001 1 401.68 1,981.33 1,981.33 1579.65 0LADCO IN Cayuga 1001 2 465.72 2,390.54 2,390.54 1924.82 0LADCO IN Clifty Creek 983 1 457.12 455.79 335.01 -1.33 -120.79LADCO IN Clifty Creek 983 2 459.49 446.77 335.08 -12.71 -111.69LADCO IN Clifty Creek 983 3 462.98 439.93 326.43 -23.05 -113.5LADCO IN Clifty Creek 983 4 492.03 450.34 450.34 -41.69 0LADCO IN Clifty Creek 983 5 328.69 296.60 296.60 -32.09 0LADCO IN Clifty Creek 983 6 1,785.65 1,530.41 1,530.41 -255.23 0LADCO IN Edwardsport 1004 7-1 0.00 0.00 0.00 0 0LADCO IN Edwardsport 1004 7-2 0.00 0.00 0.00 0 0LADCO IN Edwardsport 1004 8-1 0.00 0.00 0.00 0 0LADCO IN Edwardsport 1004 CTG1 553.47 556.42 253.14 2.94 -303.28LADCO IN Edwardsport 1004 CTG2 561.92 540.95 289.99 -20.97 -250.96LADCO IN F B Culley Generating Station 1012 2 62.19 57.30 47.30 -4.9 -9.99LADCO IN F B Culley Generating Station 1012 3 531.84 491.92 475.43 -39.92 -16.49LADCO IN Frank E Ratts 1043 1SG1 0.00 0.00 0.00 0 0LADCO IN Frank E Ratts 1043 2SG1 0.00 0.00 0.00 0 0LADCO IN Gibson 6113 1 1,300.80 1,364.43 334.28 63.62 -1030.14LADCO IN Gibson 6113 2 1,253.49 1,106.13 571.78 -147.36 -534.35LADCO IN Gibson 6113 3 1,516.78 967.39 531.26 -549.39 -436.13LADCO IN Gibson 6113 4 1,678.18 1,734.94 843.45 56.76 -891.49LADCO IN Gibson 6113 5 1,432.81 3,296.54 615.01 1863.73 -2681.53LADCO IN IPL Eagle Valley Generating Station 991 3 0.00 0.00 0.00 0 0LADCO IN IPL Eagle Valley Generating Station 991 4 0.00 0.00 0.00 0 0LADCO IN IPL Eagle Valley Generating Station 991 5 0.00 0.00 0.00 0 0LADCO IN IPL Eagle Valley Generating Station 991 6 0.00 0.00 0.00 0 0LADCO IN Merom 6213 1SG1 1,200.08 1,092.10 745.00 -107.98 -347.1LADCO IN Merom 6213 2SG1 1,296.80 1,173.86 720.80 -122.94 -453.06LADCO IN Michigan City Generating Station 997 12 1,087.84 958.83 882.12 -129.01 -76.71LADCO IN New Energy Corp 880087 U-4000 0.00 0.00 0.00 0 0LADCO IN Petersburg 994 1 1,103.46 990.11 990.11 -113.35 0LADCO IN Petersburg 994 2 1,482.04 1,335.20 480.58 -146.84 -854.62LADCO IN Petersburg 994 3 1,851.90 1,620.75 526.86 -231.15 -1093.89LADCO IN Petersburg 994 4 2,594.61 2,170.15 2,170.15 -424.46 0LADCO IN R Gallagher 1008 1 0.00 0.00 0.00 0 0LADCO IN R Gallagher 1008 2 199.86 0.00 0.00 -199.86 0LADCO IN R Gallagher 1008 3 0.00 0.00 0.00 0 0LADCO IN R Gallagher 1008 4 133.48 0.00 0.00 -133.48 0LADCO IN R M Schahfer Generating Station 6085 14 735.16 616.75 511.82 -118.4 -104.93LADCO IN R M Schahfer Generating Station 6085 15 1,431.63 1,331.71 1,331.71 -99.92 0LADCO IN R M Schahfer Generating Station 6085 17 1,134.94 1,021.73 1,021.73 -113.21 0LADCO IN R M Schahfer Generating Station 6085 18 1,177.05 1,053.18 1,053.18 -123.87 0LADCO IN Rockport 6166 MB1 2,673.85 2,573.28 2,573.28 -100.57 0LADCO IN Rockport 6166 MB2 3,600.50 3,576.88 3,576.88 -23.61 0LADCO IN State Line Generating Station (IN) 981 3 0.00 0.00 0.00 0 0LADCO IN State Line Generating Station (IN) 981 4 0.00 0.00 0.00 0 0LADCO IN Tanners Creek 988 U1 0.00 0.00 0.00 0 0LADCO IN Tanners Creek 988 U2 0.00 0.00 0.00 0 0LADCO IN Tanners Creek 988 U3 0.00 0.00 0.00 0 0
4

RPO St. Facility Name Orispl Unit ID v2.3 Base v2.6 Base v2.6 BOR v2.6-v2.3 BOR-v2.6LADCO IN Tanners Creek 988 U4 0.00 0.00 0.00 0 0LADCO IN Wabash River 1010 2 0.00 0.00 0.00 0 0LADCO IN Wabash River 1010 3 0.00 0.00 0.00 0 0LADCO IN Wabash River 1010 4 0.00 0.00 0.00 0 0LADCO IN Wabash River 1010 5 0.00 0.00 0.00 0 0LADCO IN Wabash River 1010 6 0.00 0.00 0.00 0 0LADCO IN Whitewater Valley 1040 1 85.62 79.67 79.67 -5.95 0LADCO IN Whitewater Valley 1040 2 170.26 158.53 158.53 -11.73 0LADCO MI B C Cobb 1695 4 0.00 0.00 0.00 0 0LADCO MI B C Cobb 1695 5 0.00 0.00 0.00 0 0LADCO MI Belle River 6034 1 1,403.38 1,754.50 1,754.50 351.12 0LADCO MI Belle River 6034 2 2,797.11 3,481.06 3,481.06 683.95 0LADCO MI Cadillac Renewable Energy 54415 EUBLR 64.53 134.04 134.04 69.51 0LADCO MI Dan E Karn 1702 1 353.84 310.97 189.69 -42.87 -121.28LADCO MI Dan E Karn 1702 2 266.33 318.53 176.38 52.2 -142.14LADCO MI Eckert Station 1831 1 95.10 0.00 0.00 -95.1 0LADCO MI Eckert Station 1831 2 0.00 0.00 0.00 0 0LADCO MI Eckert Station 1831 3 55.32 0.00 0.00 -55.32 0LADCO MI Eckert Station 1831 4 267.21 0.00 0.00 -267.21 0LADCO MI Eckert Station 1831 5 150.59 0.00 0.00 -150.59 0LADCO MI Eckert Station 1831 6 224.67 0.00 0.00 -224.67 0LADCO MI Endicott Generating 4259 1 268.58 0.00 0.00 -268.58 0LADCO MI Erickson 1832 1 583.07 716.57 716.57 133.51 0LADCO MI Genesee Power Station 54751 01 40.30 74.77 74.77 34.47 0LADCO MI Grayling Generating Station 10822 1 127.96 127.96 127.96 0LADCO MI Harbor Beach 1731 1 0.00 0.00 0.00 0 0LADCO MI J B Sims 1825 3 183.80 228.66 228.66 44.86 0LADCO MI J C Weadock 1720 7 0.00 0.00 0.00 0 0LADCO MI J C Weadock 1720 8 0.00 0.00 0.00 0 0LADCO MI J H Campbell 1710 1 473.13 623.45 623.45 150.32 0LADCO MI J H Campbell 1710 2 262.26 319.84 146.33 57.59 -173.51LADCO MI J H Campbell 1710 3 1,560.60 1,447.94 749.31 -112.66 -698.63LADCO MI J R Whiting 1723 1 0.00 0.00 0.00 0 0LADCO MI J R Whiting 1723 2 0.00 0.00 0.00 0 0LADCO MI J R Whiting 1723 3 0.00 0.00 0.00 0 0LADCO MI James De Young 1830 5 0.00 0.00 0.00 0 0LADCO MI Monroe 1733 1 3,341.41 1,158.27 550.18 -2183.14 -608.09LADCO MI Monroe 1733 2 824.04 1,025.20 1,025.20 201.16 0LADCO MI Monroe 1733 3 478.15 596.44 486.72 118.29 -109.72LADCO MI Monroe 1733 4 930.09 1,163.38 545.12 233.29 -618.26LADCO MI Presque Isle 1769 5 276.03 0.00 0.00 -276.03 0LADCO MI Presque Isle 1769 6 356.29 0.00 0.00 -356.29 0LADCO MI Presque Isle 1769 7 578.10 0.00 0.00 -578.1 0LADCO MI Presque Isle 1769 8 481.34 0.00 0.00 -481.34 0LADCO MI Presque Isle 1769 9 579.30 0.00 0.00 -579.3 0LADCO MI River Rouge 1740 2 630.00 0.00 0.00 -630 0LADCO MI River Rouge 1740 3 651.84 0.00 0.00 -651.84 0LADCO MI Shiras 1843 3 128.66 169.48 169.48 40.82 0LADCO MI St. Clair 1743 1 437.46 0.00 0.00 -437.46 0LADCO MI St. Clair 1743 2 674.85 0.00 0.00 -674.85 0LADCO MI St. Clair 1743 3 716.17 0.00 0.00 -716.17 0LADCO MI St. Clair 1743 4 603.35 0.00 0.00 -603.35 0LADCO MI St. Clair 1743 6 646.42 0.00 0.00 -646.42 0LADCO MI St. Clair 1743 7 749.66 0.00 0.00 -749.66 0LADCO MI TES Filer City Station 50835 1 269.19 349.32 349.32 80.13 0LADCO MI TES Filer City Station 50835 2 264.62 341.14 341.14 76.52 0LADCO MI Trenton Channel 1745 16 0.00 0.00 0.00 0 0LADCO MI Trenton Channel 1745 17 0.00 0.00 0.00 0 0LADCO MI Trenton Channel 1745 18 0.00 0.00 0.00 0 0LADCO MI Trenton Channel 1745 19 0.00 0.00 0.00 0 0LADCO MI Trenton Channel 1745 9A 1,157.63 0.00 0.00 -1157.63 0
5

RPO St. Facility Name Orispl Unit ID v2.3 Base v2.6 Base v2.6 BOR v2.6-v2.3 BOR-v2.6LADCO MI Wyandotte 1866 7 70.96 88.01 88.01 17.05 0LADCO MI Wyandotte 1866 8 97.07 120.76 120.76 23.69 0LADCO MN Allen S King 1915 1 886.97 835.71 835.71 -51.26 0LADCO MN Black Dog 1904 3 0.00 0.00 0.00 0 0LADCO MN Black Dog 1904 4 0.00 0.00 0.00 0 0LADCO MN Boswell Energy Center 1893 1 359.50 343.05 266.18 -16.46 -76.87LADCO MN Boswell Energy Center 1893 2 404.05 380.81 292.22 -23.24 -88.59LADCO MN Boswell Energy Center 1893 3 475.15 453.92 428.11 -21.23 -25.82LADCO MN Boswell Energy Center 1893 4 1,992.56 1,940.93 1,464.21 -51.63 -476.72LADCO MN Hoot Lake 1943 2 0.00 0.00 0.00 0 0LADCO MN Hoot Lake 1943 3 0.00 0.00 0.00 0 0LADCO MN Northeast Station 1961 NEPP 0.00 0.00 0.00 0 0LADCO MN Sherburne County 6090 1 2,486.82 2,278.17 2,278.17 -208.65 0LADCO MN Sherburne County 6090 2 2,378.65 2,189.06 2,189.06 -189.59 0LADCO MN Sherburne County 6090 3 1,660.23 1,524.25 1,524.25 -135.98 0LADCO MN Silver Lake 2008 4 0.00 0.00 0.00 0 0LADCO MN Taconite Harbor Energy Center 10075 1 239.22 223.21 193.50 -16.01 -29.71LADCO MN Taconite Harbor Energy Center 10075 2 189.14 176.61 150.87 -12.53 -25.74LADCO MN Taconite Harbor Energy Center 10075 3 0.00 0.00 0.00 0 0LADCO OH Ashtabula 2835 7 757.86 0.00 0.00 -757.86 0LADCO OH Avon Lake Power Plant 2836 10 6.64 6.01 6.01 -0.63 0LADCO OH Avon Lake Power Plant 2836 12 2,750.14 2,585.61 1,789.32 -164.53 -796.29LADCO OH Bay Shore 2878 1 568.21 569.87 569.87 1.66 0LADCO OH Bay Shore 2878 2 0.00 0.00 0.00 0 0LADCO OH Bay Shore 2878 3 0.00 0.00 0.00 0 0LADCO OH Bay Shore 2878 4 0.00 0.00 0.00 0 0LADCO OH Cardinal 2828 1 365.75 361.50 248.97 -4.26 -112.53LADCO OH Cardinal 2828 2 104.96 99.62 65.89 -5.34 -33.73LADCO OH Cardinal 2828 3 602.92 512.59 179.60 -90.34 -332.99LADCO OH Conesville 2840 3 0.00 0.00 0.00 0 0LADCO OH Conesville 2840 4 684.49 648.42 480.92 -36.07 -167.5LADCO OH Conesville 2840 5 2,069.72 1,906.61 1,906.61 -163.1 0LADCO OH Conesville 2840 6 2,921.05 2,519.01 2,519.01 -402.04 0LADCO OH Eastlake 2837 1 0.00 0.00 0.00 0 0LADCO OH Eastlake 2837 2 0.00 0.00 0.00 0 0LADCO OH Eastlake 2837 3 0.00 0.00 0.00 0 0LADCO OH Eastlake 2837 4 0.00 0.00 0.00 0 0LADCO OH Eastlake 2837 5 0.00 0.00 0.00 0 0LADCO OH Gen J M Gavin 8102 1 2,489.38 2,198.76 1,986.77 -290.62 -212LADCO OH Gen J M Gavin 8102 2 2,595.20 2,433.49 1,800.34 -161.7 -633.15LADCO OH Hamilton Municipal Power Plant 2917 9 3.91 3.62 3.62 -0.29 0LADCO OH J M Stuart 2850 1 1,319.25 1,257.84 1,243.52 -61.42 -14.32LADCO OH J M Stuart 2850 2 1,156.61 1,067.38 1,067.38 -89.23 0LADCO OH J M Stuart 2850 3 1,495.57 1,453.48 1,246.48 -42.09 -207LADCO OH J M Stuart 2850 4 1,573.66 1,304.76 1,091.41 -268.9 -213.35LADCO OH Killen Station 6031 2 2,761.67 2,511.35 1,063.75 -250.32 -1447.6LADCO OH Kyger Creek 2876 1 831.81 817.06 375.56 -14.74 -441.5LADCO OH Kyger Creek 2876 2 818.99 803.45 374.41 -15.54 -429.04LADCO OH Kyger Creek 2876 3 2,764.74 2,530.75 387.39 -233.99 -2143.36LADCO OH Kyger Creek 2876 4 687.66 538.28 248.11 -149.37 -290.17LADCO OH Kyger Creek 2876 5 3,000.02 2,747.08 387.66 -252.94 -2359.42LADCO OH Lake Shore 2838 18 0.00 0.00 0.00 0 0LADCO OH Miami Fort Generating Station 2832 6 0.00 0.00 0.00 0 0LADCO OH Miami Fort Generating Station 2832 7 2,058.30 1,847.47 609.81 -210.83 -1237.65LADCO OH Miami Fort Generating Station 2832 8 1,582.85 1,312.47 520.22 -270.38 -792.25LADCO OH Muskingum River 2872 1 0.00 0.00 0.00 0 0LADCO OH Muskingum River 2872 2 0.00 0.00 0.00 0 0LADCO OH Muskingum River 2872 3 0.00 0.00 0.00 0 0LADCO OH Muskingum River 2872 4 0.00 0.00 0.00 0 0LADCO OH Muskingum River 2872 5 0.00 0.00 0.00 0 0LADCO OH Niles 2861 1 0.00 0.00 0.00 0 0
6

RPO St. Facility Name Orispl Unit ID v2.3 Base v2.6 Base v2.6 BOR v2.6-v2.3 BOR-v2.6LADCO OH Niles 2861 2 0.00 0.00 0.00 0 0LADCO OH O H Hutchings 2848 H-1 0.00 0.00 0.00 0 0LADCO OH O H Hutchings 2848 H-2 0.00 0.00 0.00 0 0LADCO OH O H Hutchings 2848 H-3 1.95 0.00 0.00 -1.95 0LADCO OH O H Hutchings 2848 H-4 0.00 0.00 0.00 0 0LADCO OH O H Hutchings 2848 H-5 34.91 0.00 0.00 -34.91 0LADCO OH O H Hutchings 2848 H-6 14.33 0.00 0.00 -14.33 0LADCO OH Picway 2843 9 0.00 0.00 0.00 0 0LADCO OH W H Sammis 2866 1 606.72 0.00 0.00 -606.72 0LADCO OH W H Sammis 2866 2 531.56 0.00 0.00 -531.56 0LADCO OH W H Sammis 2866 3 640.96 0.00 0.00 -640.96 0LADCO OH W H Sammis 2866 4 822.24 0.00 0.00 -822.24 0LADCO OH W H Sammis 2866 5 519.61 488.55 355.18 -31.06 -133.37LADCO OH W H Sammis 2866 6 414.51 400.81 400.81 -13.69 0LADCO OH W H Sammis 2866 7 1,505.76 1,367.73 1,299.56 -138.03 -68.16LADCO OH W H Zimmer Generating Station 6019 1 5,866.68 5,326.49 1,041.88 -540.19 -4284.61LADCO OH Walter C Beckjord Generating Station 2830 1 0.00 0.00 0.00 0 0LADCO OH Walter C Beckjord Generating Station 2830 2 0.00 0.00 0.00 0 0LADCO OH Walter C Beckjord Generating Station 2830 3 0.00 0.00 0.00 0 0LADCO OH Walter C Beckjord Generating Station 2830 4 0.00 0.00 0.00 0 0LADCO OH Walter C Beckjord Generating Station 2830 5 0.00 0.00 0.00 0 0LADCO OH Walter C Beckjord Generating Station 2830 6 0.00 0.00 0.00 0 0LADCO WI Alma 4140 B4 0.00 0.00 0.00 0 0LADCO WI Alma 4140 B5 0.00 0.00 0.00 0 0LADCO WI Bay Front 3982 1 70.02 65.49 65.49 -4.53 0LADCO WI Bay Front 3982 2 72.62 67.91 67.91 -4.71 0LADCO WI Blount Street 3992 7 0.00 0.00 0.00 0 0LADCO WI Columbia 8023 1 537.98 1,241.74 1,241.74 703.76 0LADCO WI Columbia 8023 2 651.44 735.85 735.85 84.41 0LADCO WI Edgewater (4050) 4050 3 0.00 0.00 0.00 0 0LADCO WI Edgewater (4050) 4050 5 392.85 371.90 268.51 -20.95 -103.39LADCO WI Elm Road Generating Station 56068 1 216.29 280.88 254.81 64.59 -26.07LADCO WI Elm Road Generating Station 56068 2 341.93 436.79 436.79 94.86 0LADCO WI Genoa 4143 1 337.62 349.66 349.66 12.04 0LADCO WI J P Madgett 4271 B1 515.50 463.04 463.04 -52.46 0LADCO WI Manitowoc 4125 8 11.71 15.06 15.06 3.35 0LADCO WI Manitowoc 4125 9 70.34 91.40 26.58 21.06 -64.81LADCO WI Nelson Dewey 4054 1 0.00 0.00 0.00 0 0LADCO WI Nelson Dewey 4054 2 0.00 0.00 0.00 0 0LADCO WI Pleasant Prairie 6170 1 729.86 938.57 712.52 208.72 -226.06LADCO WI Pleasant Prairie 6170 2 443.28 575.33 521.24 132.05 -54.09LADCO WI Pulliam 4072 5 0.00 0.00 0.00 0 0LADCO WI Pulliam 4072 6 0.00 0.00 0.00 0 0LADCO WI Pulliam 4072 7 134.10 177.79 177.79 43.68 0LADCO WI Pulliam 4072 8 344.44 455.52 455.52 111.08 0LADCO WI South Oak Creek 4041 5 191.79 245.82 245.82 54.03 0LADCO WI South Oak Creek 4041 6 175.37 227.80 221.62 52.43 -6.18LADCO WI South Oak Creek 4041 7 268.53 314.94 306.30 46.41 -8.64LADCO WI South Oak Creek 4041 8 299.97 351.17 344.37 51.2 -6.8LADCO WI Weston 4078 1 0.00 0.00 0.00 0 0LADCO WI Weston 4078 2 0.00 0 0LADCO WI Weston 4078 3 452.89 588.87 588.87 135.98 0LADCO WI Weston 4078 4 425.32 561.11 547.40 135.79 -13.7SESARM AL Barry 3 3 0.00 0.00 0 0SESARM AL Barry 3 4 647.00 512.46 360.76 -134.54 -151.71SESARM AL Barry 3 5 462.26 365.12 266.82 -97.14 -98.3SESARM AL Charles R Lowman 56 1 311.64 250.51 250.51 -61.12 0SESARM AL Charles R Lowman 56 2 1,854.45 1,463.25 696.17 -391.19 -767.08SESARM AL Charles R Lowman 56 3 401.69 323.29 251.17 -78.4 -72.12SESARM AL Colbert 47 1 0.00 0.00 0.00 0 0SESARM AL Colbert 47 2 0.00 0.00 0.00 0 0
7

RPO St. Facility Name Orispl Unit ID v2.3 Base v2.6 Base v2.6 BOR v2.6-v2.3 BOR-v2.6SESARM AL Colbert 47 3 0.00 0.00 0.00 0 0SESARM AL Colbert 47 4 0.00 0.00 0.00 0 0SESARM AL Colbert 47 5 0.00 0.00 0.00 0 0SESARM AL E C Gaston 26 5 2,066.34 1,604.78 927.73 -461.56 -677.05SESARM AL Gorgas 8 10 2,255.12 1,768.99 498.20 -486.13 -1270.79SESARM AL Gorgas 8 6 270.56 0.00 0.00 -270.56 0SESARM AL Gorgas 8 7 356.36 0.00 0.00 -356.36 0SESARM AL Gorgas 8 8 458.15 356.87 356.87 -101.28 0SESARM AL Gorgas 8 9 616.53 484.85 484.85 -131.68 0SESARM AL Greene County 10 1 1,814.11 -1814.11 0SESARM AL Greene County 10 2 888.23 -888.23 0SESARM AL James H Miller Jr 6002 1 1,950.30 1,514.93 994.69 -435.37 -520.24SESARM AL James H Miller Jr 6002 2 2,821.75 2,209.13 797.80 -612.62 -1411.33SESARM AL James H Miller Jr 6002 3 3,003.08 2,346.58 970.73 -656.5 -1375.85SESARM AL James H Miller Jr 6002 4 1,631.72 1,282.85 1,031.69 -348.87 -251.17SESARM AL James H Miller Jr 6002 G01001 603.26 -603.26 0SESARM AL Widows Creek 50 1 0.00 0.00 0.00 0 0SESARM AL Widows Creek 50 2 0.00 0.00 0.00 0 0SESARM AL Widows Creek 50 3 0.00 0.00 0.00 0 0SESARM AL Widows Creek 50 4 0.00 0.00 0.00 0 0SESARM AL Widows Creek 50 5 0.00 0.00 0.00 0 0SESARM AL Widows Creek 50 6 0.00 0.00 0.00 0 0SESARM AL Widows Creek 50 7 625.05 0.00 0.00 -625.05 0SESARM AL Widows Creek 50 8 0.00 0.00 0.00 0 0SESARM FL Big Bend 645 BB01 638.51 658.49 634.44 19.97 -24.05SESARM FL Big Bend 645 BB02 285.36 294.33 273.65 8.98 -20.68SESARM FL Big Bend 645 BB03 643.94 664.67 627.76 20.73 -36.91SESARM FL Big Bend 645 BB04 649.99 669.38 652.67 19.39 -16.71SESARM FL C D McIntosh Jr Power Plant 676 3 519.42 537.84 537.84 18.42 0SESARM FL Cedar Bay Generating Co. 10672 CBA 249.95 0.00 0.00 -249.95 0SESARM FL Cedar Bay Generating Co. 10672 CBB 245.89 0.00 0.00 -245.89 0SESARM FL Cedar Bay Generating Co. 10672 CBC 243.19 0.00 0.00 -243.19 0SESARM FL Central Power & Lime 10333 1 0.00 0 0SESARM FL Crist Electric Generating Plant 641 4 42.98 33.52 33.52 -9.46 0SESARM FL Crist Electric Generating Plant 641 5 310.17 246.12 135.60 -64.05 -110.52SESARM FL Crist Electric Generating Plant 641 6 110.48 180.30 180.30 69.82 0SESARM FL Crist Electric Generating Plant 641 7 1,535.81 1,162.80 651.15 -373.01 -511.65SESARM FL Crystal River 628 1 0.00 0.00 0.00 0 0SESARM FL Crystal River 628 2 0.00 0.00 0.00 0 0SESARM FL Crystal River 628 4 469.28 483.54 460.45 14.26 -23.09SESARM FL Crystal River 628 5 596.08 612.21 593.59 16.13 -18.62SESARM FL Curtis H. Stanton Energy Center 564 1 1,374.19 1,418.02 1,418.02 43.83 0SESARM FL Curtis H. Stanton Energy Center 564 2 998.75 1,028.55 697.95 29.8 -330.59SESARM FL Deerhaven 663 B2 145.30 149.55 139.13 4.25 -10.42SESARM FL Indiantown Cogeneration Facility 50976 01 472.92 486.72 486.72 13.81 0SESARM FL Lansing Smith Generating Plant 643 1 583.09 0.00 0.00 -583.09 0SESARM FL Lansing Smith Generating Plant 643 2 644.73 0.00 0.00 -644.73 0SESARM FL Northside 667 1A 106.35 110.07 57.40 3.72 -52.68SESARM FL Northside 667 2A 172.84 177.93 135.63 5.08 -42.29SESARM FL Polk 7242 **1 183.15 183.15 183.15 0SESARM FL Scholz Electric Generating Plant 642 1 0.00 0.00 0.00 0 0SESARM FL Scholz Electric Generating Plant 642 2 0.00 0.00 0.00 0 0SESARM FL Seminole (136) 136 1 536.22 553.49 429.70 17.27 -123.79SESARM FL Seminole (136) 136 2 536.21 552.17 428.29 15.96 -123.88SESARM FL St. Johns River Power 207 1 1,667.14 1,720.55 1,041.80 53.41 -678.75SESARM FL St. Johns River Power 207 2 1,477.86 1,520.27 1,209.33 42.42 -310.94SESARM GA Bowen 703 1BLR 2,531.48 1,990.02 618.49 -541.46 -1371.53SESARM GA Bowen 703 2BLR 1,603.59 1,275.94 380.68 -327.65 -895.26SESARM GA Bowen 703 3BLR 1,112.25 898.38 552.01 -213.87 -346.38SESARM GA Bowen 703 4BLR 1,515.07 1,218.05 524.16 -297.01 -693.89SESARM GA Bowen 703 G13002 283.46 -283.46 0
8

RPO St. Facility Name Orispl Unit ID v2.3 Base v2.6 Base v2.6 BOR v2.6-v2.3 BOR-v2.6SESARM GA Hammond 708 1 167.15 133.00 133.00 -34.16 0SESARM GA Hammond 708 2 260.48 205.78 205.78 -54.7 0SESARM GA Hammond 708 3 170.29 134.03 134.03 -36.26 0SESARM GA Hammond 708 4 1,346.97 1,072.42 353.00 -274.55 -719.41SESARM GA Harllee Branch 709 1 0.00 0.00 0.00 0 0SESARM GA Harllee Branch 709 2 0.00 0.00 0.00 0 0SESARM GA Harllee Branch 709 3 0.00 0.00 0.00 0 0SESARM GA Harllee Branch 709 4 0.00 0.00 0.00 0 0SESARM GA Jack McDonough 710 MB1 0.00 0.00 0.00 0 0SESARM GA Jack McDonough 710 MB2 0.00 0.00 0.00 0 0SESARM GA Kraft 733 1 0.00 0.00 0.00 0 0SESARM GA Kraft 733 2 0.00 0.00 0.00 0 0SESARM GA Kraft 733 3 0.00 0.00 0.00 0 0SESARM GA McIntosh (6124) 6124 1 69.85 57.10 57.10 -12.76 0SESARM GA Mitchell (GA) 727 3 0.00 0.00 0.00 0 0SESARM GA Scherer 6257 1 2,206.82 2,085.13 639.09 -121.69 -1446.04SESARM GA Scherer 6257 2 2,317.24 2,167.89 656.87 -149.35 -1511.02SESARM GA Scherer 6257 3 3,794.94 3,751.97 1,112.46 -42.98 -2639.51SESARM GA Scherer 6257 4 3,635.50 3,493.04 1,095.07 -142.45 -2397.97SESARM GA Scherer 6257 G13001 640.21 -640.21 0SESARM GA Wansley (6052) 6052 1 916.28 728.49 461.38 -187.79 -267.11SESARM GA Wansley (6052) 6052 2 531.90 427.71 323.65 -104.19 -104.05SESARM GA Yates 728 Y1BR 0.00 0.00 0.00 0 0SESARM GA Yates 728 Y2BR 0.00 0.00 0.00 0 0SESARM GA Yates 728 Y3BR 0.00 0.00 0.00 0 0SESARM GA Yates 728 Y4BR 0.00 0.00 0.00 0 0SESARM GA Yates 728 Y5BR 0.00 0.00 0.00 0 0SESARM KY Big Sandy 1353 BSU2 0.00 0.00 0.00 0 0SESARM KY Cane Run 1363 4 0.00 0.00 0.00 0 0SESARM KY Cane Run 1363 5 0.00 0.00 0.00 0 0SESARM KY Cane Run 1363 6 0.00 0.00 0.00 0 0SESARM KY Coleman 1381 C1 1,578.30 1,499.38 1,499.38 -78.93 0SESARM KY Coleman 1381 C2 1,490.84 1,472.01 1,472.01 -18.83 0SESARM KY Coleman 1381 C3 1,682.79 1,465.23 1,465.23 -217.56 0SESARM KY D B Wilson 6823 W1 848.26 748.52 565.07 -99.74 -183.45SESARM KY E W Brown 1355 1 482.37 404.87 404.87 -77.5 0SESARM KY E W Brown 1355 2 798.55 711.06 711.06 -87.49 0SESARM KY E W Brown 1355 3 377.26 337.47 337.47 -39.79 0SESARM KY East Bend 6018 2 1,915.82 1,711.35 763.30 -204.47 -948.05SESARM KY Elmer Smith 1374 1 849.60 754.89 410.23 -94.71 -344.66SESARM KY Elmer Smith 1374 2 2,057.47 1,797.93 1,415.72 -259.54 -382.22SESARM KY Ghent 1356 1 1,017.96 904.15 492.05 -113.81 -412.11SESARM KY Ghent 1356 2 2,360.46 2,091.05 2,091.05 -269.41 0SESARM KY Ghent 1356 3 1,550.13 1,373.02 228.21 -177.11 -1144.81SESARM KY Ghent 1356 4 863.12 753.18 243.67 -109.94 -509.51SESARM KY Green River 1357 4 0.00 0.00 0.00 0 0SESARM KY Green River 1357 5 0.00 0.00 0.00 0 0SESARM KY H L Spurlock 6041 1 570.18 502.81 469.20 -67.37 -33.61SESARM KY H L Spurlock 6041 2 973.15 983.73 897.26 10.58 -86.47SESARM KY H L Spurlock 6041 3 452.19 337.75 250.96 -114.43 -86.79SESARM KY H L Spurlock 6041 4 445.86 443.59 410.14 -2.27 -33.45SESARM KY HMP&L Station 2 1382 H1 324.19 291.20 238.76 -32.98 -52.44SESARM KY HMP&L Station 2 1382 H2 341.22 298.78 259.22 -42.44 -39.56SESARM KY John S. Cooper 1384 1 1,022.09 903.49 903.49 -118.6 0SESARM KY John S. Cooper 1384 2 350.29 176.86 176.86 -173.43 0SESARM KY Mill Creek 1364 1 2,040.75 1,874.70 1,874.70 -166.05 0SESARM KY Mill Creek 1364 2 2,180.97 2,167.97 2,167.97 -12.99 0SESARM KY Mill Creek 1364 3 411.58 381.03 290.60 -30.55 -90.43SESARM KY Mill Creek 1364 4 1,196.60 1,043.95 383.03 -152.65 -660.92SESARM KY Paradise 1378 1 0.00 0.00 0.00 0 0SESARM KY Paradise 1378 2 0.00 0.00 0.00 0 0
9

RPO St. Facility Name Orispl Unit ID v2.3 Base v2.6 Base v2.6 BOR v2.6-v2.3 BOR-v2.6SESARM KY Paradise 1378 3 2,655.82 2,277.86 1,364.90 -377.96 -912.96SESARM KY R D Green 6639 G1 1,348.22 1,330.21 1,330.21 -18.01 0SESARM KY R D Green 6639 G2 1,214.06 1,228.80 1,228.80 14.74 0SESARM KY Robert Reid 1383 R1 0.00 0.00 0.00 0 0SESARM KY Shawnee 1379 1 1,354.98 119.65 119.65 -1235.34 0SESARM KY Shawnee 1379 10 0.00 0.00 0.00 0 0SESARM KY Shawnee 1379 2 1,366.91 1,210.19 1,210.19 -156.72 0SESARM KY Shawnee 1379 3 1,358.37 1,204.93 1,204.93 -153.45 0SESARM KY Shawnee 1379 4 1,336.99 118.13 118.13 -1218.85 0SESARM KY Shawnee 1379 5 1,515.39 1,342.73 1,342.73 -172.66 0SESARM KY Shawnee 1379 6 1,083.76 944.43 944.43 -139.34 0SESARM KY Shawnee 1379 7 1,163.31 1,031.39 1,031.39 -131.92 0SESARM KY Shawnee 1379 8 1,138.16 1,010.25 1,010.25 -127.91 0SESARM KY Shawnee 1379 9 1,022.13 903.44 903.44 -118.68 0SESARM KY Trimble County 6071 1 849.01 676.00 283.36 -173.01 -392.64SESARM KY Trimble County 6071 2 712.76 580.40 533.71 -132.36 -46.69SESARM KY Tyrone 1361 5 0.00 0.00 0.00 0 0SESARM KY William C. Dale 1385 1 63.17 0.00 0.00 -63.17 0SESARM KY William C. Dale 1385 2 59.87 0.00 0.00 -59.87 0SESARM KY William C. Dale 1385 3 455.20 401.81 401.81 -53.39 0SESARM KY William C. Dale 1385 4 486.49 431.03 431.03 -55.46 0SESARM MS Daniel Electric Generating Plant 6073 1 1,072.43 932.38 932.38 -140.04 0SESARM MS Daniel Electric Generating Plant 6073 2 442.42 353.20 353.20 -89.22 0SESARM MS R D Morrow Senior Generating Plant 6061 1 999.94 793.68 793.68 -206.27 0SESARM MS R D Morrow Senior Generating Plant 6061 2 1,387.03 1,093.98 1,093.98 -293.05 0SESARM MS Red Hills Generation Facility 55076 AA001 667.09 540.49 540.49 -126.6 0SESARM MS Red Hills Generation Facility 55076 AA002 791.53 686.14 686.14 -105.39 0SESARM MS Watson Electric Generating Plant 2049 4 1,274.50 -1274.5 0SESARM MS Watson Electric Generating Plant 2049 5 1,578.15 -1578.15 0SESARM NC Asheville 2706 1 308.39 0.00 0.00 -308.39 0SESARM NC Asheville 2706 2 267.91 0.00 0.00 -267.91 0SESARM NC Belews Creek 8042 1 1,630.21 1,344.66 342.28 -285.55 -1002.38SESARM NC Belews Creek 8042 2 1,734.67 1,506.84 523.29 -227.83 -983.56SESARM NC Buck 2720 8 0.00 0.00 0.00 0 0SESARM NC Buck 2720 9 0.00 0.00 0.00 0 0SESARM NC Cape Fear 2708 5 0.00 0.00 0 0SESARM NC Cape Fear 2708 6 0.00 0.00 0 0SESARM NC Cliffside 2721 5 362.25 197.31 78.92 -164.95 -118.39SESARM NC Cliffside 2721 6 649.73 522.84 477.88 -126.89 -44.96SESARM NC Dan River 2723 1 0.00 0.00 0.00 0 0SESARM NC Dan River 2723 2 0.00 0.00 0.00 0 0SESARM NC Dan River 2723 3 0.00 0.00 0.00 0 0SESARM NC Elizabethtown Power 10380 UNIT1 0.00 0.00 0.00 0 0SESARM NC Elizabethtown Power 10380 UNIT2 0.00 0.00 0.00 0 0SESARM NC G G Allen 2718 1 47.14 0.00 0.00 -47.14 0SESARM NC G G Allen 2718 2 48.05 0.00 0.00 -48.05 0SESARM NC G G Allen 2718 3 107.39 0.00 0.00 -107.39 0SESARM NC G G Allen 2718 4 106.19 180.69 91.79 74.5 -88.9SESARM NC G G Allen 2718 5 94.98 136.58 87.05 41.61 -49.53SESARM NC H F Lee Steam Electric Plant 2709 1 0.00 0.00 0.00 0 0SESARM NC H F Lee Steam Electric Plant 2709 2 0.00 0.00 0.00 0 0SESARM NC H F Lee Steam Electric Plant 2709 3 0.00 0.00 0.00 0 0SESARM NC L V Sutton 2713 1 0.00 0.00 0.00 0 0SESARM NC L V Sutton 2713 2 0.00 0.00 0.00 0 0SESARM NC L V Sutton 2713 3 0.00 0.00 0.00 0 0SESARM NC Lumberton Power 10382 UNIT1 0.00 0.00 0.00 0 0SESARM NC Lumberton Power 10382 UNIT2 0.00 0.00 0.00 0 0SESARM NC Marshall 2727 1 732.46 483.28 378.89 -249.18 -104.39SESARM NC Marshall 2727 2 1,079.60 741.75 580.34 -337.86 -161.4SESARM NC Marshall 2727 3 1,548.97 1,031.08 500.08 -517.89 -531.01SESARM NC Marshall 2727 4 3,739.99 2,253.27 1,413.93 -1486.72 -839.34
10
RPO St. Facility Name Orispl Unit ID v2.3 Base v2.6 Base v2.6 BOR v2.6-v2.3 BOR-v2.6SESARM NC Mayo 6250 1A 927.87 451.66 153.06 -476.21 -298.6SESARM NC Mayo 6250 1B 867.17 409.55 139.70 -457.63 -269.85SESARM NC Riverbend 2732 10 0.00 0.00 0.00 0 0SESARM NC Riverbend 2732 7 0.00 0.00 0.00 0 0SESARM NC Riverbend 2732 8 0.00 0.00 0.00 0 0SESARM NC Riverbend 2732 9 0.00 0.00 0.00 0 0SESARM NC Roxboro 2712 1 819.46 513.85 253.90 -305.61 -259.95SESARM NC Roxboro 2712 2 1,330.58 749.40 253.47 -581.18 -495.92SESARM NC Roxboro 2712 3A 1,160.23 491.25 172.75 -668.99 -318.5SESARM NC Roxboro 2712 3B 1,080.96 459.48 165.41 -621.48 -294.07SESARM NC Roxboro 2712 4A 1,141.07 411.00 191.72 -730.06 -219.28SESARM NC Roxboro 2712 4B 1,043.97 370.54 172.85 -673.43 -197.69SESARM NC W H Weatherspoon 2716 1 0.00 0.00 0.00 0 0SESARM NC W H Weatherspoon 2716 2 0.00 0.00 0.00 0 0SESARM NC W H Weatherspoon 2716 3 0.00 0.00 0.00 0 0SESARM NC Westmoreland Partners Roanoke Valley II 54755 2 179.06 38.26 30.47 -140.81 -7.79SESARM NC Westmoreland-LG&E Roanoke Valley I 54035 1 1,088.28 744.75 744.75 -343.54 0SESARM SC Canadys Steam 3280 CAN1 0.00 0.00 0.00 0 0SESARM SC Canadys Steam 3280 CAN2 0.00 0.00 0.00 0 0SESARM SC Canadys Steam 3280 CAN3 0.00 0.00 0.00 0 0SESARM SC Cope Station 7210 COP1 579.26 342.88 284.80 -236.38 -58.08SESARM SC Cross 130 1 1,117.56 941.69 759.09 -175.87 -182.6SESARM SC Cross 130 2 576.06 368.52 316.18 -207.53 -52.34SESARM SC Cross 130 3 855.72 489.64 459.87 -366.09 -29.77SESARM SC Cross 130 4 857.79 416.67 393.19 -441.12 -23.48SESARM SC Dolphus M Grainger 3317 1 0.00 0.00 0.00 0 0SESARM SC Dolphus M Grainger 3317 2 0.00 0.00 0.00 0 0SESARM SC H B Robinson 3251 1 0.00 0.00 0.00 0 0SESARM SC Jefferies 3319 3 0.00 0.00 0.00 0 0SESARM SC Jefferies 3319 4 0.00 0.00 0.00 0 0SESARM SC McMeekin 3287 MCM1 0.00 0.00 0.00 0 0SESARM SC McMeekin 3287 MCM2 0.00 0.00 0.00 0 0SESARM SC W S Lee 3264 1 0.00 0.00 0.00 0 0SESARM SC W S Lee 3264 2 0.00 0.00 0.00 0 0SESARM SC Wateree 3297 WAT1 585.73 351.14 210.94 -234.59 -140.2SESARM SC Wateree 3297 WAT2 618.67 345.97 199.49 -272.7 -146.48SESARM SC Williams 3298 WIL1 755.49 480.33 235.50 -275.16 -244.83SESARM SC Winyah 6249 1 399.71 246.03 177.87 -153.68 -68.17SESARM SC Winyah 6249 2 349.22 212.72 138.19 -136.5 -74.53SESARM SC Winyah 6249 3 342.25 207.75 174.11 -134.5 -33.64SESARM SC Winyah 6249 4 419.36 257.84 215.17 -161.51 -42.67SESARM TN Allen 3393 1 706.62 0.00 0.00 -706.62 0SESARM TN Allen 3393 2 688.57 0.00 0.00 -688.57 0SESARM TN Allen 3393 3 754.55 0.00 0.00 -754.55 0SESARM TN Bull Run 3396 1 257.17 171.40 124.26 -85.77 -47.14SESARM TN Cumberland 3399 1 1,141.53 982.86 934.79 -158.67 -48.06SESARM TN Cumberland 3399 2 2,098.42 1,844.65 1,412.56 -253.77 -432.09SESARM TN Gallatin 3403 1 449.82 170.96 170.96 -278.86 0SESARM TN Gallatin 3403 2 445.94 167.64 167.64 -278.3 0SESARM TN Gallatin 3403 3 539.44 204.66 204.66 -334.77 0SESARM TN Gallatin 3403 4 544.91 206.18 206.18 -338.73 0SESARM TN John Sevier 3405 1 0.00 0.00 0.00 0 0SESARM TN John Sevier 3405 2 0.00 0.00 0.00 0 0SESARM TN John Sevier 3405 3 0.00 0.00 0.00 0 0SESARM TN John Sevier 3405 4 0.00 0.00 0.00 0 0SESARM TN Johnsonville 3406 1 0.00 0.00 0.00 0 0SESARM TN Johnsonville 3406 10 0.00 0.00 0.00 0 0SESARM TN Johnsonville 3406 2 0.00 0.00 0.00 0 0SESARM TN Johnsonville 3406 3 0.00 0.00 0.00 0 0SESARM TN Johnsonville 3406 4 0.00 0.00 0.00 0 0SESARM TN Johnsonville 3406 5 0.00 0.00 0.00 0 0
11

RPO St. Facility Name Orispl Unit ID v2.3 Base v2.6 Base v2.6 BOR v2.6-v2.3 BOR-v2.6SESARM TN Johnsonville 3406 6 0.00 0.00 0.00 0 0SESARM TN Johnsonville 3406 7 0.00 0.00 0.00 0 0SESARM TN Johnsonville 3406 8 0.00 0.00 0.00 0 0SESARM TN Johnsonville 3406 9 0.00 0.00 0.00 0 0SESARM TN Kingston 3407 1 138.71 120.94 87.96 -17.76 -32.98SESARM TN Kingston 3407 2 61.43 51.46 41.79 -9.97 -9.67SESARM TN Kingston 3407 3 132.81 116.20 85.78 -16.61 -30.42SESARM TN Kingston 3407 4 130.59 114.54 89.93 -16.05 -24.61SESARM TN Kingston 3407 5 124.66 103.43 81.94 -21.24 -21.48SESARM TN Kingston 3407 6 58.90 46.81 37.49 -12.08 -9.32SESARM TN Kingston 3407 7 105.52 91.13 68.62 -14.39 -22.51SESARM TN Kingston 3407 8 56.48 45.81 37.23 -10.66 -8.58SESARM TN Kingston 3407 9 93.92 80.58 61.44 -13.33 -19.15SESARM VA Altavista Power Station 10773 1 0.00 0.00 0.00 0 0SESARM VA Altavista Power Station 10773 2 0.00 0.00 0.00 0 0SESARM VA Birchwood Power Facility 54304 001 143.26 93.45 86.09 -49.81 -7.36SESARM VA Chesapeake Energy Center 3803 1 0.00 0.00 0.00 0 0SESARM VA Chesapeake Energy Center 3803 2 0.00 0.00 0.00 0 0SESARM VA Chesapeake Energy Center 3803 3 0.00 0.00 0.00 0 0SESARM VA Chesapeake Energy Center 3803 4 0.00 0.00 0.00 0 0SESARM VA Chesterfield Power Station 3797 3 157.80 109.99 109.99 -47.81 0SESARM VA Chesterfield Power Station 3797 4 156.08 101.00 49.19 -55.08 -51.81SESARM VA Chesterfield Power Station 3797 5 242.28 158.04 48.84 -84.23 -109.21SESARM VA Chesterfield Power Station 3797 6 473.77 291.37 178.21 -182.41 -113.16SESARM VA Clinch River 3775 3 0.00 0.00 0.00 0 0SESARM VA Clover Power Station 7213 1 2,579.04 1,528.54 1,309.68 -1050.5 -218.86SESARM VA Clover Power Station 7213 2 2,649.96 1,615.27 1,305.32 -1034.69 -309.94SESARM VA Cogentrix-Hopewell 10377 BLR01A 141.63 86.94 86.94 -54.69 0SESARM VA Cogentrix-Hopewell 10377 BLR01B 106.99 65.57 65.57 -41.41 0SESARM VA Cogentrix-Hopewell 10377 BLR01C 143.29 86.26 86.26 -57.03 0SESARM VA Cogentrix-Hopewell 10377 BLR02A 124.72 75.54 75.54 -49.18 0SESARM VA Cogentrix-Hopewell 10377 BLR02B 83.28 51.39 51.39 -31.89 0SESARM VA Cogentrix-Hopewell 10377 BLR02C 80.90 51.13 51.13 -29.78 0SESARM VA Cogentrix-Portsmouth 10071 BLR01A 32.91 0.00 0.00 -32.91 0SESARM VA Cogentrix-Portsmouth 10071 BLR01B 29.42 0.00 0.00 -29.42 0SESARM VA Cogentrix-Portsmouth 10071 BLR01C 30.15 0.00 0.00 -30.15 0SESARM VA Cogentrix-Portsmouth 10071 BLR02A 32.18 0.00 0.00 -32.18 0SESARM VA Cogentrix-Portsmouth 10071 BLR02B 27.83 0.00 0.00 -27.83 0SESARM VA Cogentrix-Portsmouth 10071 BLR02C 27.69 0.00 0.00 -27.69 0SESARM VA Glen Lyn 3776 51 0.00 0.00 0.00 0 0SESARM VA Glen Lyn 3776 52 0.00 0.00 0.00 0 0SESARM VA Glen Lyn 3776 6 0.00 0.00 0.00 0 0SESARM VA Hopewell Power Station 10771 1 0.00 0.00 0.00 0 0SESARM VA Hopewell Power Station 10771 2 0.00 0.00 0.00 0 0SESARM VA Mecklenburg Power Station 52007 1 90.10 61.11 61.11 -28.99 0SESARM VA Mecklenburg Power Station 52007 2 93.46 64.59 64.59 -28.87 0SESARM VA Mirant Potomac River 3788 1 0.00 0.00 0.00 0 0SESARM VA Mirant Potomac River 3788 2 0.00 0.00 0.00 0 0SESARM VA Mirant Potomac River 3788 3 0.00 0.00 0.00 0 0SESARM VA Mirant Potomac River 3788 4 0.00 0.00 0.00 0 0SESARM VA Mirant Potomac River 3788 5 0.00 0.00 0.00 0 0SESARM VA Southampton Power Station 10774 1 0.00 0.00 0.00 0 0SESARM VA Southampton Power Station 10774 2 0.00 0.00 0.00 0 0SESARM VA Spruance Genco, LLC 54081 BLR01A 199.75 125.22 107.19 -74.53 -18.03SESARM VA Spruance Genco, LLC 54081 BLR01B 219.23 134.72 115.09 -84.52 -19.63SESARM VA Spruance Genco, LLC 54081 BLR02A 223.93 136.90 115.33 -87.02 -21.57SESARM VA Spruance Genco, LLC 54081 BLR02B 223.00 135.22 114.04 -87.78 -21.18SESARM VA Spruance Genco, LLC 54081 BLR03A 213.66 132.90 118.09 -80.76 -14.81SESARM VA Spruance Genco, LLC 54081 BLR03B 224.51 135.70 121.01 -88.81 -14.69SESARM VA Spruance Genco, LLC 54081 BLR04A 183.11 112.31 106.67 -70.8 -5.64SESARM VA Spruance Genco, LLC 54081 BLR04B 172.24 106.28 102.00 -65.95 -4.28
12

RPO St. Facility Name Orispl Unit ID v2.3 Base v2.6 Base v2.6 BOR v2.6-v2.3 BOR-v2.6SESARM VA Virginia City Hybrid Energy Center 56808 1 454.85 391.13 391.13 -63.73 0SESARM VA Virginia City Hybrid Energy Center 56808 2 474.21 395.07 395.07 -79.13 0SESARM VA Yorktown Power Station 3809 1 0.00 0.00 0.00 0 0SESARM VA Yorktown Power Station 3809 2 0.00 0.00 0.00 0 0SESARM WV Albright Power Station 3942 1 0.00 0.00 0.00 0 0SESARM WV Albright Power Station 3942 2 0.00 0.00 0.00 0 0SESARM WV Albright Power Station 3942 3 0.00 0.00 0.00 0 0SESARM WV Fort Martin Power Station 3943 1 3,949.04 3,397.71 3,397.71 -551.33 0SESARM WV Fort Martin Power Station 3943 2 4,015.95 3,643.97 3,643.97 -371.98 0SESARM WV Grant Town Power Plant 10151 1A 495.62 496.39 113.81 0.77 -382.58SESARM WV Grant Town Power Plant 10151 1B 484.20 486.92 486.92 2.72 0SESARM WV Harrison Power Station 3944 1 3,306.02 2,995.54 728.24 -310.48 -2267.29SESARM WV Harrison Power Station 3944 2 3,362.78 2,967.34 798.93 -395.44 -2168.41SESARM WV Harrison Power Station 3944 3 3,322.18 3,015.58 640.10 -306.6 -2375.48SESARM WV John E Amos 3935 1 766.18 630.45 446.68 -135.73 -183.77SESARM WV John E Amos 3935 2 869.31 692.51 431.61 -176.8 -260.9SESARM WV John E Amos 3935 3 1,033.59 979.33 979.33 -54.26 0SESARM WV Kammer 3947 1 0.00 0.00 0.00 0 0SESARM WV Kammer 3947 2 0.00 0.00 0.00 0 0SESARM WV Kammer 3947 3 0.00 0.00 0.00 0 0SESARM WV Kanawha River 3936 1 0.00 0.00 0.00 0 0SESARM WV Kanawha River 3936 2 0.00 0.00 0.00 0 0SESARM WV Longview Power 56671 001 930.30 844.91 842.31 -85.39 -2.6SESARM WV Mitchell (WV) 3948 1 635.98 601.13 601.13 -34.86 0SESARM WV Mitchell (WV) 3948 2 939.43 876.58 876.58 -62.86 0SESARM WV Mount Storm Power Station 3954 1 771.17 451.35 328.95 -319.82 -122.4SESARM WV Mount Storm Power Station 3954 2 628.09 375.45 227.05 -252.65 -148.39SESARM WV Mount Storm Power Station 3954 3 644.17 388.21 345.20 -255.96 -43.01SESARM WV Mountaineer (1301) 6264 1 1,425.37 1,439.80 1,040.68 14.43 -399.12SESARM WV Phil Sporn 3938 11 0.00 0.00 0.00 0 0SESARM WV Phil Sporn 3938 21 0.00 0.00 0.00 0 0SESARM WV Phil Sporn 3938 31 0.00 0.00 0.00 0 0SESARM WV Phil Sporn 3938 41 0.00 0.00 0.00 0 0SESARM WV Phil Sporn 3938 51 0.00 0.00 0.00 0 0SESARM WV Pleasants Power Station 6004 1 2,341.15 2,086.79 588.54 -254.37 -1498.24SESARM WV Pleasants Power Station 6004 2 1,836.10 1,525.39 474.37 -310.71 -1051.02SESARM WV Rivesville Power Station 3945 7 0.00 0.00 0.00 0 0SESARM WV Rivesville Power Station 3945 8 0.00 0.00 0.00 0 0SESARM WV Willow Island Power Station 3946 1 0.00 0.00 0.00 0 0SESARM WV Willow Island Power Station 3946 2 0.00 0.00 0.00 0 0CENSARA AR Flint Creek Power Plant 6138 1 2,735.72 3,265.34 3,265.34 529.62 0CENSARA AR Independence 6641 1 4,022.55 3,990.19 3,990.19 -32.36 0CENSARA AR Independence 6641 2 4,350.52 4,248.96 4,248.96 -101.56 0CENSARA AR Independence 6641 G05001 680.18 -680.18 0CENSARA AR John W. Turk Jr. Power Plant 56564 SN-01 492.06 1,308.91 534.87 816.86 -774.05CENSARA AR Plum Point Energy Station 56456 1 1,085.63 986.50 897.08 -99.13 -89.43CENSARA AR White Bluff 6009 1 3,795.37 3,650.93 3,650.93 -144.44 0CENSARA AR White Bluff 6009 2 5,516.12 5,424.70 5,424.70 -91.42 0CENSARA AR White Bluff 6009 G05002 592.89 -592.89 0CENSARA IA Burlington (IA) 1104 1 754.52 -754.52 0CENSARA IA Dubuque 1046 1 0.00 0.00 0.00 0 0CENSARA IA Dubuque 1046 5 0.00 0.00 0.00 0 0CENSARA IA Dubuque 1046 6 0.00 0.00 0.00 0 0CENSARA IA Fair Station 1218 2 0.00 0.00 0.00 0 0CENSARA IA George Neal North 1091 1 0.00 0.00 0.00 0 0CENSARA IA George Neal North 1091 2 0.00 0.00 0.00 0 0CENSARA IA George Neal North 1091 3 2,093.38 1,982.31 1,982.31 -111.07 0CENSARA IA George Neal South 7343 4 2,851.96 2,659.45 2,621.66 -192.51 -37.79CENSARA IA Lansing 1047 3 0.00 0.00 0.00 0 0CENSARA IA Lansing 1047 4 185.77 261.63 261.63 75.85 0CENSARA IA Louisa 6664 101 1,988.44 1,835.42 1,835.42 -153.02 0
13

RPO St. Facility Name Orispl Unit ID v2.3 Base v2.6 Base v2.6 BOR v2.6-v2.3 BOR-v2.6CENSARA IA Muscatine 1167 8 1,414.62 1,301.80 1,301.80 -112.82 0CENSARA IA Muscatine 1167 9 263.95 217.18 217.18 -46.77 0CENSARA IA Ottumwa 6254 1 1,816.14 757.99 757.99 -1058.15 0CENSARA IA Pella 1175 6 0.00 0.00 0.00 0 0CENSARA IA Pella 1175 7 0.00 0.00 0.00 0 0CENSARA IA Prairie Creek 1073 3 191.68 -191.68 0CENSARA IA Prairie Creek 1073 4 930.39 -930.39 0CENSARA IA Sutherland 1077 1 0.00 0.00 0 0CENSARA IA Sutherland 1077 3 0.00 0.00 0 0CENSARA IA Walter Scott Jr. Energy Center 1082 1 0.00 0.00 0.00 0 0CENSARA IA Walter Scott Jr. Energy Center 1082 2 0.00 0.00 0.00 0 0CENSARA IA Walter Scott Jr. Energy Center 1082 3 1,760.39 1,254.03 1,254.03 -506.35 0CENSARA IA Walter Scott Jr. Energy Center 1082 4 973.25 885.84 839.72 -87.41 -46.12CENSARA KS Holcomb 108 SGU1 2,453.26 1,278.98 1,278.98 -1174.29 0CENSARA KS Jeffrey Energy Center 6068 1 114.66 865.59 865.59 750.93 0CENSARA KS Jeffrey Energy Center 6068 2 413.88 1,213.20 958.91 799.31 -254.29CENSARA KS Jeffrey Energy Center 6068 3 627.82 2,192.42 2,020.53 1564.6 -171.89CENSARA KS La Cygne 1241 1 848.86 1,102.73 930.43 253.87 -172.3CENSARA KS La Cygne 1241 2 557.41 4,119.87 1,395.84 3562.45 -2724.03CENSARA KS Lawrence Energy Center 1250 3 159.84 0.00 0.00 -159.84 0CENSARA KS Lawrence Energy Center 1250 4 757.29 462.55 462.55 -294.74 0CENSARA KS Lawrence Energy Center 1250 5 1,669.62 1,353.02 1,353.02 -316.6 0CENSARA KS Nearman Creek 6064 N1 2,254.85 131.95 131.95 -2122.9 0CENSARA KS Quindaro 1295 1 0.00 0.00 0 0CENSARA KS Quindaro 1295 2 0.00 0.00 0 0CENSARA KS Riverton 1239 39 0.00 0.00 0.00 0 0CENSARA KS Riverton 1239 40 0.00 0.00 0.00 0 0CENSARA KS Tecumseh Energy Center 1252 10 382.71 0.00 0.00 -382.71 0CENSARA KS Tecumseh Energy Center 1252 9 220.47 263.58 263.58 43.11 0CENSARA LA Big Cajun 2 6055 2B1 0.00 0.00 0 0CENSARA LA Big Cajun 2 6055 2B2 0.00 0.00 0 0CENSARA LA Big Cajun 2 6055 2B3 0.00 0.00 0 0CENSARA LA Big Cajun 2 6055 G22001 780.23 -780.23 0CENSARA LA Dolet Hills Power Station 51 1 2,576.22 3,113.79 2,994.53 537.57 -119.26CENSARA LA Nelson Industrial Steam Company 50030 1A 438.13 445.79 445.79 7.66 0CENSARA LA Nelson Industrial Steam Company 50030 2A 454.07 465.49 465.49 11.42 0CENSARA LA R S Nelson 1393 6 1,986.38 1,995.91 1,995.91 9.53 0CENSARA LA R S Nelson 1393 G22002 269.91 -269.91 0CENSARA LA Rodemacher Power Station (6190) 6190 2 1,216.14 1,448.43 1,362.68 232.29 -85.75CENSARA LA Rodemacher Power Station (6190) 6190 3-1 183.08 219.37 157.35 36.29 -62.02CENSARA LA Rodemacher Power Station (6190) 6190 3-2 238.31 285.07 229.43 46.76 -55.64CENSARA MO Asbury 2076 1 686.15 1,638.21 375.97 952.05 -1262.24CENSARA MO Blue Valley 2132 3 36.31 42.66 42.66 6.36 0CENSARA MO Chamois Power Plant 2169 2 0.00 0.00 0.00 0 0CENSARA MO Columbia 2123 6 64.16 67.43 67.43 3.27 0CENSARA MO Columbia 2123 7 80.90 85.41 85.41 4.51 0CENSARA MO Hawthorn 2079 5A 718.61 868.65 854.37 150.04 -14.28CENSARA MO Iatan 6065 1 774.75 898.60 813.80 123.85 -84.8CENSARA MO Iatan 6065 2 655.81 688.76 688.76 32.95 0CENSARA MO James River 2161 3 72.53 40.53 40.53 -32 0CENSARA MO James River 2161 4 98.69 155.71 155.71 57.01 0CENSARA MO James River 2161 5 246.38 303.79 303.79 57.41 0CENSARA MO John Twitty Energy Center 6195 1 309.81 367.30 317.52 57.49 -49.78CENSARA MO John Twitty Energy Center 6195 2 273.32 388.87 289.71 115.55 -99.16CENSARA MO Labadie 2103 1 1,408.52 1,439.45 1,439.45 30.93 0CENSARA MO Labadie 2103 2 1,549.90 1,613.54 1,613.54 63.64 0CENSARA MO Labadie 2103 3 1,465.24 1,495.96 1,495.96 30.72 0CENSARA MO Labadie 2103 4 1,577.54 1,573.73 1,573.73 -3.81 0CENSARA MO Lake Road 2098 6 719.03 850.18 850.18 131.15 0CENSARA MO Meramec 2104 1 268.13 278.97 278.97 10.84 0CENSARA MO Meramec 2104 2 315.36 330.01 330.01 14.65 0
14

RPO St. Facility Name Orispl Unit ID v2.3 Base v2.6 Base v2.6 BOR v2.6-v2.3 BOR-v2.6CENSARA MO Meramec 2104 3 927.96 973.32 973.32 45.35 0CENSARA MO Meramec 2104 4 1,347.72 1,378.53 1,378.53 30.81 0CENSARA MO Montrose 2080 1 731.11 786.01 786.01 54.9 0CENSARA MO Montrose 2080 2 491.62 358.36 358.36 -133.25 0CENSARA MO Montrose 2080 3 955.92 758.18 758.18 -197.74 0CENSARA MO New Madrid Power Plant 2167 1 5,500.34 1,862.73 1,111.43 -3637.61 -751.3CENSARA MO New Madrid Power Plant 2167 2 2,337.76 1,437.15 901.57 -900.61 -535.58CENSARA MO Rush Island 6155 1 968.48 1,001.64 1,001.64 33.16 0CENSARA MO Rush Island 6155 2 1,118.01 1,147.47 1,147.47 29.46 0CENSARA MO Sibley 2094 1 328.92 313.60 277.28 -15.32 -36.32CENSARA MO Sibley 2094 2 218.57 236.26 223.42 17.68 -12.83CENSARA MO Sibley 2094 3 753.99 1,012.64 517.50 258.65 -495.14CENSARA MO Sikeston 6768 1 1,159.98 1,304.30 623.77 144.32 -680.53CENSARA MO Sioux 2107 1 1,589.98 1,498.66 1,498.66 -91.32 0CENSARA MO Sioux 2107 2 2,162.81 2,155.35 2,155.35 -7.47 0CENSARA MO Thomas Hill Energy Center 2168 MB1 853.65 551.00 439.88 -302.65 -111.12CENSARA MO Thomas Hill Energy Center 2168 MB2 3,029.93 685.58 657.02 -2344.35 -28.57CENSARA MO Thomas Hill Energy Center 2168 MB3 2,204.14 2,091.19 1,674.70 -112.95 -416.5CENSARA NE Gerald Gentleman Station 6077 1 3,373.24 3,155.26 3,155.26 -217.97 0CENSARA NE Gerald Gentleman Station 6077 2 6,031.98 5,595.27 5,595.27 -436.71 0CENSARA NE Gerald Whelan Energy Center 60 1 588.35 544.07 544.07 -44.28 0CENSARA NE Gerald Whelan Energy Center 60 2 147.74 140.00 124.85 -7.74 -15.15CENSARA NE Lon D Wright Power Plant 2240 8 296.18 277.37 277.37 -18.81 0CENSARA NE Nebraska City Station 6096 1 3,059.06 2,850.10 2,850.10 -208.96 0CENSARA NE Nebraska City Station 6096 2 955.61 884.89 778.84 -70.72 -106.05CENSARA NE North Omaha Station 2291 1 568.82 532.33 532.33 -36.49 0CENSARA NE North Omaha Station 2291 2 618.00 579.93 579.93 -38.07 0CENSARA NE North Omaha Station 2291 3 656.02 614.68 614.68 -41.34 0CENSARA NE North Omaha Station 2291 4 793.15 742.09 742.09 -51.06 0CENSARA NE North Omaha Station 2291 5 1,548.40 1,395.24 1,395.24 -153.16 0CENSARA NE Platte 59 1 745.21 698.32 698.32 -46.89 0CENSARA NE Sheldon 2277 1 2,507.86 2,334.45 2,334.45 -173.41 0CENSARA NE Sheldon 2277 2 1,765.64 1,622.47 1,622.47 -143.16 0CENSARA OK AES Shady Point 10671 1A 264.57 264.57 264.57 0CENSARA OK AES Shady Point 10671 1B 220.13 220.13 220.13 0CENSARA OK AES Shady Point 10671 2A 244.41 244.41 244.41 0CENSARA OK AES Shady Point 10671 2B 249.38 249.38 249.38 0CENSARA OK Grand River Dam Authority 165 1 3,895.39 0.00 0.00 -3895.39 0CENSARA OK Grand River Dam Authority 165 2 4,211.51 2,132.23 2,132.23 -2079.29 0CENSARA OK Hugo 6772 1 1,358.68 1,611.72 1,611.72 253.04 0CENSARA OK Muskogee 2952 4 3,258.29 0.00 0.00 -3258.29 0CENSARA OK Muskogee 2952 5 2,821.75 0.00 0.00 -2821.75 0CENSARA OK Muskogee 2952 6 2,542.99 2,948.76 2,948.76 405.77 0CENSARA OK Northeastern 2963 3313 0.00 0.00 0.00 0 0CENSARA OK Northeastern 2963 3314 0.00 0.00 0.00 0 0CENSARA OK Sooner 6095 1 3,039.04 1,331.39 1,331.39 -1707.65 0CENSARA OK Sooner 6095 2 2,871.75 1,430.31 1,430.31 -1441.44 0CENSARA TX AES Deepwater, Inc. 10670 01001 0.00 0.00 0.00 0 0CENSARA TX Big Brown 3497 1 1,323.14 1,138.53 1,085.87 -184.61 -52.67CENSARA TX Big Brown 3497 2 1,596.60 1,373.94 1,332.99 -222.66 -40.95CENSARA TX Coleto Creek 6178 1 1,140.00 981.04 981.04 -158.95 0CENSARA TX Gibbons Creek Steam Electric Station 6136 1 1,017.53 875.64 875.64 -141.89 0CENSARA TX H W Pirkey Power Plant 7902 1 2,143.03 2,564.90 2,564.90 421.87 0CENSARA TX Harrington Station 6193 061B 756.80 903.25 903.25 146.45 0CENSARA TX Harrington Station 6193 062B 728.86 870.88 870.88 142.02 0CENSARA TX Harrington Station 6193 063B 723.24 863.52 863.52 140.28 0CENSARA TX J K Spruce 7097 **1 1,425.63 1,226.64 1,226.64 -198.98 0CENSARA TX J K Spruce 7097 **2 659.92 567.88 538.03 -92.04 -29.85CENSARA TX J T Deely 6181 1 0.00 0.00 0.00 0 0CENSARA TX J T Deely 6181 2 0.00 0.00 0.00 0 0CENSARA TX Limestone 298 LIM1 3,469.44 2,985.51 2,985.51 -483.93 0
15

RPO St. Facility Name Orispl Unit ID v2.3 Base v2.6 Base v2.6 BOR v2.6-v2.3 BOR-v2.6CENSARA TX Limestone 298 LIM2 3,930.06 3,381.80 3,381.80 -548.26 0CENSARA TX Martin Lake 6146 1 2,905.19 2,500.00 2,500.00 -405.18 0CENSARA TX Martin Lake 6146 2 2,679.07 2,305.38 2,305.38 -373.69 0CENSARA TX Martin Lake 6146 3 2,606.57 2,242.89 2,242.89 -363.68 0CENSARA TX Monticello 6147 1 1,428.28 1,229.09 1,229.09 -199.19 0CENSARA TX Monticello 6147 2 1,046.25 900.34 873.72 -145.91 -26.62CENSARA TX Monticello 6147 3 2,272.29 1,955.56 1,661.60 -316.74 -293.96CENSARA TX Oak Grove 1 6180 1 1,217.23 1,047.42 1,047.42 -169.81 0CENSARA TX Oak Grove 2 6180 2 949.45 816.89 816.89 -132.56 0CENSARA TX Oklaunion Power Station 127 1 2,864.17 2,464.84 2,464.84 -399.32 0CENSARA TX Sam Seymour 6179 1 1,290.91 1,110.90 1,110.90 -180.01 0CENSARA TX Sam Seymour 6179 2 1,297.39 1,116.53 1,116.53 -180.86 0CENSARA TX Sam Seymour 6179 3 892.87 768.38 768.38 -124.49 0CENSARA TX San Miguel 6183 SM-1 1,631.06 1,403.50 1,403.50 -227.56 0CENSARA TX Sandow 6648 4 684.10 588.64 588.64 -95.46 0CENSARA TX Sandow 5 52071 5A 362.43 311.85 289.91 -50.58 -21.94CENSARA TX Sandow 5 52071 5B 275.44 237.00 223.35 -38.43 -13.65CENSARA TX Sandy Creek 56611 S01 728.79 468.51 413.33 -260.28 -55.18CENSARA TX Tolk Station 6194 171B 2,146.47 2,566.55 2,566.55 420.08 0CENSARA TX Tolk Station 6194 172B 1,254.63 1,494.98 1,494.98 240.34 0CENSARA TX Twin Oaks Power, LP 7030 U1 379.69 326.71 211.12 -52.98 -115.6CENSARA TX Twin Oaks Power, LP 7030 U2 525.66 452.33 272.94 -73.33 -179.39CENSARA TX W A Parish 3470 WAP5 533.41 459.04 327.23 -74.37 -131.82CENSARA TX W A Parish 3470 WAP6 732.56 630.43 441.40 -102.13 -189.03CENSARA TX W A Parish 3470 WAP7 403.27 347.04 280.05 -56.23 -66.99CENSARA TX W A Parish 3470 WAP8 535.84 461.11 382.07 -74.72 -79.04CENSARA TX Welsh Power Plant 6139 1 2,229.21 2,664.53 2,664.53 435.32 0CENSARA TX Welsh Power Plant 6139 2 0.00 0.00 0.00 0 0CENSARA TX Welsh Power Plant 6139 3 1,986.22 2,377.26 2,377.26 391.04 0
16