Embed Size (px)
Citation preview
IMPACT STUDY ON INTELLIGENT
MOBILITY
April 2013
A sustainability impact framework and case analysis of energy and environment
innovITS Impact Study on Intelligent Mobility
2013 Page 1 of 47
Foreword For many years, the industry and its detractors have identified the need for objective evidence of the benefits and economic impact of Intelligent Transport Systems (ITS). Specific projects have assessed the benefits for particular schemes or technologies. There has been a long term international collaboration, in the form of IBEC, to assess methods for understanding and evaluating benefits. In Europe, the POLIS project has done much to characterise benefits for local decisions when choosing solutions to local traffic problems. None of this work to date has satisfied the more general call for a comprehensive understanding of the actual and potential benefits that can be gained from applying telematics in a vehicle and road traffic environment.
In commissioning this study, innovITS intends to progress the debate with a comprehensive and objective analysis of the impact derived from ITS The first challenge stems from what scope should be proscribed for the analysis and for this the key source has been the Intelligent Mobility report recently published by the UK Automotive Council. The authors are Transport economists based at Oxford University, not individuals drawn from the ITS community, and this provides a greater objectivity and independence to what is produced.
This report should be regarded as a starting point. The analysis is comprehensive but there is much scope for more detailed analysis within the framework it provides. Although innovITS is closing and cannot do so, it is hoped that this study can form the basis of more detailed, informed and objective examination of the impact of ITS and also inform decisions about investment in this area of innovation.
David Pearson Chairman, innovITS.
April 2013
innovITS Impact Study on Intelligent Mobility
2013 Page 2 of 47
Executive Summary Governments and industry around the world are beginning to recognize the potential of intelligent
transport systems (ITS) to transform the future of mobility across all modes and infrastructures. This
report builds on the idea of intelligent mobility. Achieving intelligent or ‘smart mobility’ where travellers
are able to plan and execute their journeys seamlessly and optimize the full range of mobility services
has become enabled by ITS technologies that provide a set of strategies for advancing transportation
safety, mobility, and environmental sustainability.
It is anticipated that ITS technologies have the potential to revolutionize surface transportation by
connecting vehicles, infrastructure, and passengers. This will allow drivers, operators and commuters
to send and receive real-time information about transport options, potential hazards, road conditions
and all other means of information to optimize mobility services. Despite recent advancements in ITS
technologies there is a lack of a comprehensive framework to evaluate the full range of potential
impacts from widespread deployment of ITS.
This report develops a novel sustainability impact framework to assess the potential benefits from
widespread deployment of ITS technologies. The framework has identified the following 4 key impact
domains that ITS can positively impact including 1) energy and environment, 2) mobility and efficiency,
2) productivity, and 3) safety. Each of these domains is multidimensional and interdependent. ITS can
be applied to each of these domains with interconnected and beneficial impacts such as reduced
congestion and emissions, while improving safety and time savings.
Given the global and UK policy agenda to reduce the energy and environmental impacts from
transport an in-depth case analysis of the potential for ITS to address these challenges is undertaken.
Based on empirical case studies and evaluations around the world it was found that the deployment
of ITS can have positive impacts on transport systems across a range of modes, infrastructure and
activities. For measures related to network efficiency there are reductions in carbon (CO2) emissions
of 10 - 15%; reductions in other environmental emissions (CO, NOx, PM10) ranged from 2 – 20%; fuel
consumption decreased 5 – 15%; traffic congestion reduced from 12 – 30% and average vehicle
speeds increased 5 – 25%.
ITS measures related to fleet operations and management were found to reduce vehicle emissions
from 5 – 20%, improve travel time 2 – 15% and reduce fuel consumption 8 – 18%. ITS also influenced
driver behaviour and was found to improve fuel efficiency by 8 – 18% through ecodriving. The review
of the evidence base therefore indicates that the deployment of ITS technologies can make a positive
contribution to transitioning to a more sustainable transport system in accordance with UK and global
policy goals. The sustainability framework developed could be further used to assess the
multidimensional and interconnected impacts from current and next generation ITS, and provide a
comprehensive and integrated way of thinking about the future evolution and progress of ITS enabled
intelligent mobility.
innovITS Impact Study on Intelligent Mobility
2013 Page 3 of 47
Table of Contents
1 Introduction ..................................................................................................................................... 7
1.1 Background ............................................................................................................................... 7
1.2 Objectives and Scope .............................................................................................................. 8
1.3 Methods ..................................................................................................................................... 9
2 Sustainability Impact Framework ........................................................................................... 11
2.1 Theoretical Background ......................................................................................................... 11
2.2 Analytical Framework ............................................................................................................. 13
2.3 Sustainability Assessment of Intelligent Mobility ............................................................... 16
2.3.1 Energy and Environment ................................................................................................ 16
2.3.2 Mobility and Efficiency .................................................................................................... 17
2.3.3 Productivity ....................................................................................................................... 18
2.3.4 Safety ................................................................................................................................ 19
2.4 Summary .................................................................................................................................. 20
3 Assessing ITS Impacts on Energy & Environment ........................................................... 23
3.1 Policy Context ......................................................................................................................... 23
3.2 Measuring Energy and Intelligent Transport Technologies .............................................. 24
4 Evidence of ITS Impacts on Energy & Environment ........................................................ 28
4.1 Network Efficiency Impacts ................................................................................................... 28
4.1.1 Congestion Charging ...................................................................................................... 28
4.1.2 Traffic Signal Control ...................................................................................................... 31
4.1.3 Speed Control Systems .................................................................................................. 34
4.2 Management and Operations Impacts ................................................................................ 35
4.2.1 Integrated Traffic and Mobility Management ............................................................... 36
4.2.2 Transit Signal Priority ...................................................................................................... 37
4.2.3 Trip Planning Systems .................................................................................................... 38
4.2.4 Incident Management ..................................................................................................... 39
4.3 Driver Behaviour Impacts ...................................................................................................... 40
4.3.1 Eco-driving ....................................................................................................................... 40
4.3.2 Intelligent Speed Control ................................................................................................ 42
4.3.3 Driver Information Systems ........................................................................................... 42
5. Summary & Next Steps ........................................................................................................... 43
6. References .................................................................................................................................. 44
innovITS Impact Study on Intelligent Mobility
2013 Page 4 of 47
List of Figures
Figure 1. Increase in ITS impact evaluations by technology area (2008 - 2011).. ................................. 7
Figure 2. Growth in ITS impact evaluations by application area (2008 – 2011).. .................................. 8
Figure 3. Externalities from transport ................................................................................................... 12
Figure 4. Sustainability impact framework for ITS deployment and related benefits. .......................... 15
Figure 5. Technologies reported to have the most energy and environmental benefits from 1992 – 2012. .................................................................................................................................................... 17
Figure 6. Technologies reported to have the most mobility and efficiency benefits from 1991 – 2012. ............................................................................................................................................................. 18
Figure 7. Technologies reported to have the most productivity benefits from 1990 – 2012.. .............. 19
Figure 8. Technologies reported to have the most safety benefits from 1993 – 2012.. ....................... 20
Figure 9. Breakdown of benefit categories by proportion of total evaluations reported over the period: Energy and Environment, 1992 – 2012; Mobility and Efficiency, 1991 – 2012; Productivity, 1990 - 2012; Safety, 1993 – 2012. .................................................................................................................. 21
Figure 10. Change in global final energy consumption by sector from 2008 and 2035. Excludes electricity and heat; Buildings include residential and service sectors; other includes agriculture and non-energy use .................................................................................................................................... 24
Figure 11. Global CO2 emissions by sector in 2008. Buildings include residential and service sectors; other includes agriculture and non-energy use .................................................................................... 25
Figure 12. Road transport CO2 emissions by mode across selected countries in 2005 ...................... 25
Figure 13. Key parameters in transport influencing vehicle energy consumption and related emissions. ............................................................................................................................................................. 26
Figure 14. Smart mobility ITS application areas .................................................................................. 26
Figure 15. Reported decrease in carbon (CO2), nitrous oxides (NOx) and particulate matter (PM10) emissions from ITS enabled charging schemes. Each of the impacts is based on the immediate area where the charging scheme was implemented. No emissions data available for Singapore. ............. 30
Figure 16. Average percentage reductions in traffic vehicle kilometres within restricted areas based on monitoring and reporting over 10-12 months ....................................................................................... 31
Figure 17. Improvements in traffic network mean speed and estimated reductions in CO2 emissions from traffic signal control implementation. CO2 emission reduction estimates assume half of the speed improvement percentages because of fewer stops, shorter acceleration periods. Evaluations are based on 2nd generation urban traffic control (UTC) systems and optimised fixed time non-dynamic UTC systems ....................................................................................................................................... 32
innovITS Impact Study on Intelligent Mobility
2013 Page 5 of 47
Figure 18. Reductions in fuel consumption, carbon monoxide (CO) and hydrocarbon emissions (HC) from traffic signal control implementation in North America. Note: Abilene, Texas; Oakland County, Michigan. Los Angeles and Richmond, Virginia reported 14% and 5-22% reductions in vehicle emissions but no break down for CO and HC given. ........................................................................... 33
Figure 19. Percentage reduction in number of stops with implementation of traffic signal light coordination in Canada and US. Note: average values are used for Richmond, VA and Syracuse, NY. ............................................................................................................................................................. 33
Figure 20. Impacts of automated urban speed control in Torino, Italy showing percentage reductions in fuel consumption (Fuel), nitrous oxides (NOx), hydrocarbon (HC) and carbon dioxide (CO2) emissions ............................................................................................................................................. 35
Figure 21. Reductions in vehicle emissions from deployment of various integrated traffic and mobility systems. Note: Reported vehicle emissions for Cincinnati include HC (3.7%), CO (3.7%), NOx (4.6%) average value of 4.1% used. Tuscon based on modelled results reporting 10-16% reductions for HC, CO, NOx, median value of 13% used. Rome only reported emissions without breakdown of compounds. Nagoya only reported CO2 emission reductions. Here we aggregate these emissions into a common vehicle emissions category. ............................................................................................... 36
Figure 22. Travel time reduction benefits with transit signal priority implementation across various countries. Note: specific EU and Chinese cities not provided from data source, it is assumed that the figures given represent a median case scenario across the cities/city involved. ................................. 38
Figure 23. Average reduction in incident duration after deploying range of ITS technologies to assist incident, monitoring, response time and management. ....................................................................... 40
Figure 24. Short-term fuel consumption improvements from eco-driving programmes in Japan and Europe. Average values are used from reported sources. Results are for cars, buses and trucks ..... 41
innovITS Impact Study on Intelligent Mobility
2013 Page 6 of 47
List of Tables
Table 1. Summary of global impact evaluations for ITS ...................................................................... 10
Table 2. Sustainability themes and relation to transport systems ........................................................ 13
Table 3. Sustainability challenges and opportunities for transport systems ........................................ 14
Table 4. European Union greenhouse gas (GHG) reduction targets for the transport sector .............. 23
Table 5. ITS applications for congestion charging ............................................................................... 29
Table 6. Fuel consumption and journey distance reduction from trip departure planning systems across various companies. .................................................................................................................. 39
Table 7. Fuel efficiency impacts of eco-driving programmes over the short and mid-term and the scope of the initiative across different countries. ................................................................................. 41
innovITS Impact Study on Intelligent Mobility
2013 Page 7 of 47
1 Introduction 1.1 Background Governments and industry around the world are beginning to recognize the potential of intelligent
transport systems (ITS) to transform mobility across modes and infrastructures. This report builds on
the idea of intelligent mobility where travellers are able to plan and execute their journeys seamlessly
and optimize the full range of mobility services. Achieving intelligent or ‘smart mobility’ is enabled by
intelligent transportation systems that provide a set of strategies for advancing transportation safety,
mobility, and environmental sustainability. This is possible by the rapid advancement and integration
of information and communication technologies (ICT) into the management and operation of the
transportation system across all modes.
Intelligent transport systems can be broadly categorized into different technology areas including:
intelligent vehicles, management and operations, transit, roadway operations and freight. There is
now increasing global evidence of the impact of ITS deployment based on evaluations that have
measured cost and benefits and a variety of other indicators that are discussed in detail in the
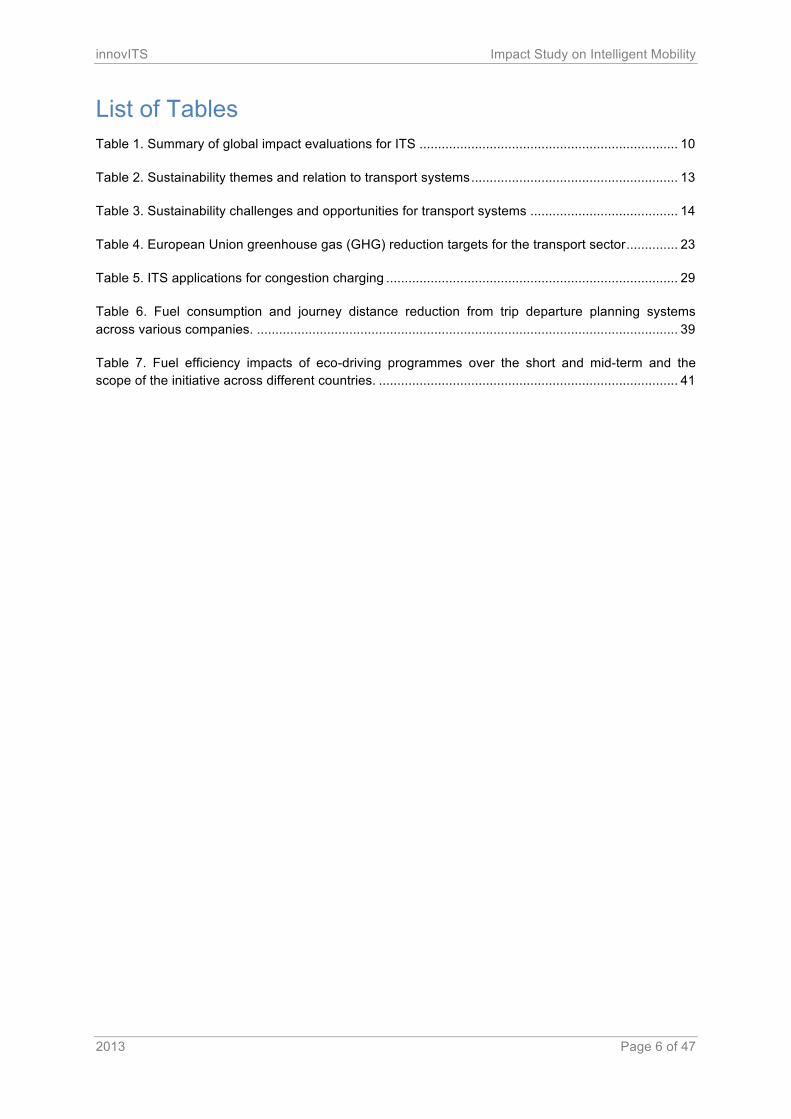
following sections. Figure 1 shows the growth in global ITS evaluations from 2008 to 2011, which
gives an indication of recent deployment across broad technology categories. The highest growth has
occurred in the area of intelligent vehicles (42%), followed by transit (37%), management and
operations (29%), freight (23%), and roadway operations (21%).
Figure 1. Increase in ITS impact evaluations by technology area (2008 - 2011). Data from USDOT, 2013.
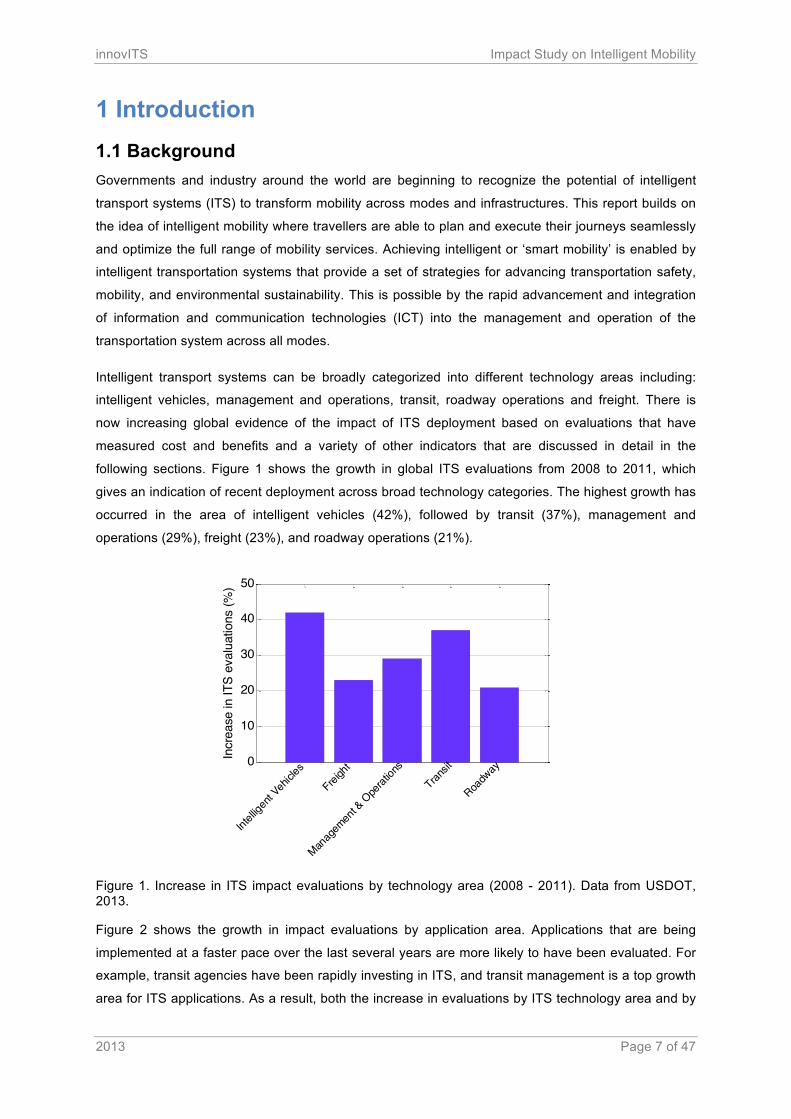
Figure 2 shows the growth in impact evaluations by application area. Applications that are being
implemented at a faster pace over the last several years are more likely to have been evaluated. For
example, transit agencies have been rapidly investing in ITS, and transit management is a top growth
area for ITS applications. As a result, both the increase in evaluations by ITS technology area and by
0
10
20
30
40
50
Intelli
gent
Vehicle
s
Freigh
t
Manag
emen
t & O
perat
ions
Transit
Roadw
ay
Incr
ease
in IT
S ev
alua
tions
(%)
innovITS Impact Study on Intelligent Mobility
2013 Page 8 of 47
specific application can be used as proxies to give an indication of the recent growth in ITS
deployment around the world.
Figure 2. Growth in ITS impact evaluations by application area (2008 – 2011). Data from USDOT, 2013.
1.2 Objectives and Scope It is anticipated that ITS technologies have the potential to revolutionize surface transportation by
connecting vehicles, infrastructure, and passengers via wireless devices and other real-time
information dissemination applications. This will allow drivers, operators and commuters to send and
receive real-time information about transport options, potential hazards, road conditions and all other
means of information to optimize mobility services. Despite the potential of ITS and recent
advancements in specific technological applications there is a lack of a comprehensive framework to
evaluate the full range of potential impacts from widespread deployment of ITS technologies. This
report aims to address this gap by achieving the following objectives:
• To develop an innovative sustainability based framework to quantitatively evaluate the
multidimensional impacts from widespread deployment of Intelligent Transport Systems (ITS)
in the UK and around the world.
• To apply the framework to a detailed case study of energy and environment given the
increasing UK and global policy agenda to reduce transport impacts on climate change and
environment, and the general lack of analysis in this increasingly important area.
• To integrate the sustainability framework, case study and other relevant global evidence in
order to provide a comprehensive state of the art assessment of ITS impacts, and take the
debate forward in terms of potential ITS benefits, opportunities and challenges.
0 10 20 30 40 50 60
Crash Prevention & SafetyRoadway Operations & Maintenance
Road Weather ManagementFreeway Management
Arterial ManagementTransit Management
Transportation Management CentersEmergency Management
Traffic Incident ManagementInformation Management
Traveler InformationElectronic Payment & Pricing
Commerical Vehicle OperationsIntermodal FreightDriver Assistance
Collision AvoidanceCollision Notification
Increase in ITS evaluations by application (%)
innovITS Impact Study on Intelligent Mobility
2013 Page 9 of 47
In terms of scope, we build upon the Intelligent Mobility Report (ACUK, 2010). However this report
draws upon global evidence to develop a flexible evaluation framework and provides a preliminary
assessment focusing on the interconnections between different impact areas from ITS deployment
including energy and environment, mobility and efficiency, productivity and safety. This report then
provides a detailed case analysis of ITS impacts on energy and environment, in the context of
meeting EU and UK energy and climate change policy goals. This report therefore draws upon global
case evidence but focuses on the recent UK policy agenda to reduce the impact of transport on
energy and environment. While we case analyse energy and environment, the sustainability
framework aims to be flexible enough to pursue further analysis of the role of ITS enabled smart
mobility across a number of other impact domains including economic productivity or health and
society.
1.3 Methods We use a combination of methods to develop this report including:
• Development of Analytical Framework - This involved identification and development of
relevant economic, social, and environmental indicators based on an assessment of relevant
theoretical and policy based literature on sustainability. A sustainability based framework has
been selected because it is able to address the multidimensional impacts related to ITS. The
framework has drawn upon authoritative work from national (UK, US, etc.), international
(United Nations) and intergovernmental (European Commission, International Energy Agency,
etc.) bodies as well as academic literature.
• Review of Global Empirical Evidence - This included a review of global case studies based on
government and industry sources publically available (US, Singapore, Japan, South Korea,
Europe) based on academic, technical, industry and policy related literature. The objective
was to assess the potential benefits, opportunities and constraints for widespread ITS
deployment based on empirical evidence reported from case sites.
• Assessing Global Evaluation Data - Among the largest databases reporting on the impacts of
ITS deployment is The US Department of Transport which contains over fifteen years of
summaries of the benefits, costs, lessons learned, and deployment status of specific ITS
implementations. This data is drawn primarily from written sources such as ITS evaluation
studies, research syntheses, handbooks, journal articles, and conference papers. The
reported findings include both empirical and modelled results.
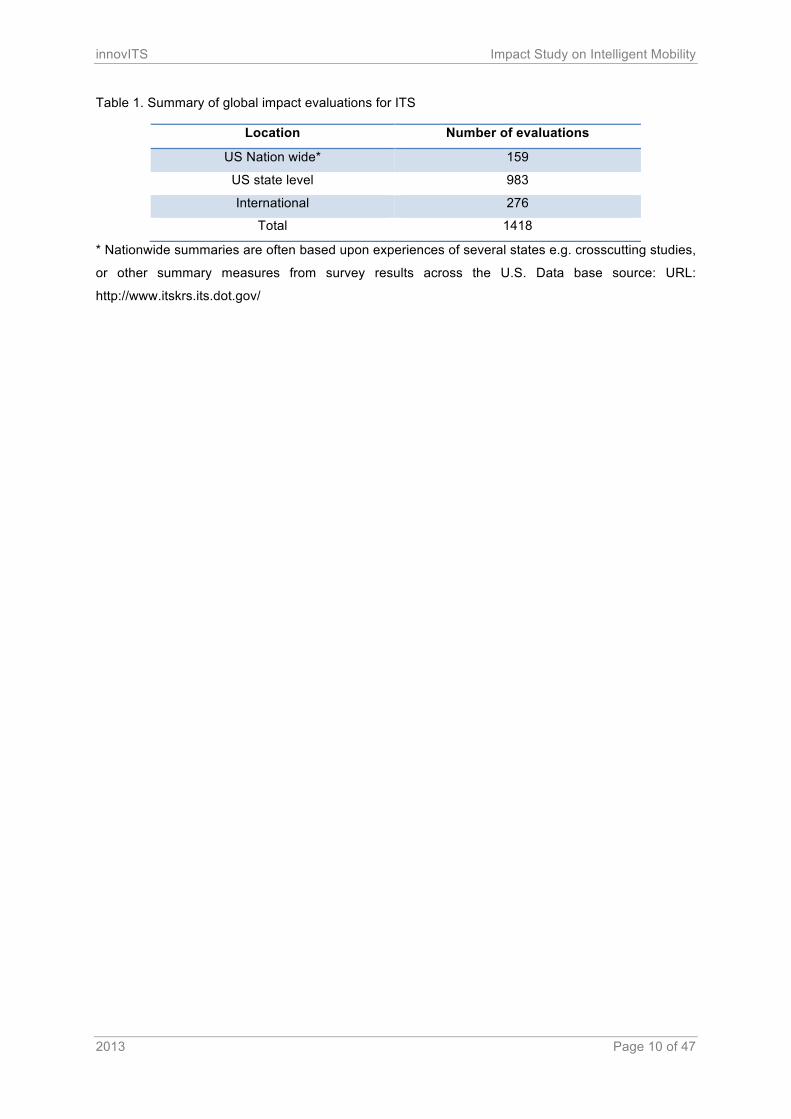
As of August 1, 2011, there were a total of 1418 impact evaluations for ITS benefits, costs,
and lessons learned and around the world, as shown in Table 1.
innovITS Impact Study on Intelligent Mobility
2013 Page 10 of 47
Table 1. Summary of global impact evaluations for ITS
Location Number of evaluations
US Nation wide* 159
US state level 983
International 276
Total 1418
* Nationwide summaries are often based upon experiences of several states e.g. crosscutting studies,
or other summary measures from survey results across the U.S. Data base source: URL:
http://www.itskrs.its.dot.gov/
innovITS Impact Study on Intelligent Mobility
2013 Page 11 of 47
2 Sustainability Impact Framework 2.1 Theoretical Background Transport plays a fundamental role in nearly all social and economic activities of modern society. The
transport sector currently contributes around 7% to GDP and 5% to employment in the European
Union. Transport demand is being driven by a variety of factors including urbanization, globalization,
domestic trade and the international division of labour. Freight volumes for example are expected to
increase 70% by 2020. Between 2001 and 2006 air, water and land transport services grew 5.4% per
annum, which was the fastest growing nonfinancial sector (EC, 2008).
When transport systems are efficient they can benefit the development and welfare of the population
but when they are inefficient they can incur tremendous economic and environmental costs. In the EU,
over 60% of the population now lives in urban areas. Throughout Europe and the world, increased
traffic in cities has caused chronic congestion with negative impacts including lost productivity, time
delays and congestion costing EUR100 billion per year. Health and safety issues are also related to
this where 33% of fatal road accidents occur in urban areas. Environmental problems are also linked
to health and safety. Urban traffic for example is responsible for 40% of carbon dioxide (CO2)
emissions and 70% of other pollutant emissions. Importantly, these local problems scale up impacting
the global system including global warming, pollution, productivity and health (EC, 2007).
From a theoretical perspective, the central problem is that in contrast to the benefits from transport
services gained by individuals and firms, the costs of the negative impacts are borne by society and
environment at large, which are called external costs (Hickson, 2006). In general the division of costs
in transport can be classified as:
• Internal costs – are the private expenses paid by the traveller for transport activities, and by
service providers and their customers;
• External costs – are the expenses generated by the user but paid by all of society. These
costs generally relate to adverse environmental impacts including pollution, which also effects
population health (Mikulski and Kwasny, 2010).
The use of taxes for example to reduce emissions is based on the argument that emissions are an
externality created by private consumption of transportation services. The increase of Greenhouse
Gas (GHG) emissions and the potential costs of climate change are absorbed by the public and
therefore privately negotiated solutions are not feasible. Thus, government intervention is necessary
(Myles and Uyduranoglu, 2002; Hickson, 2006).
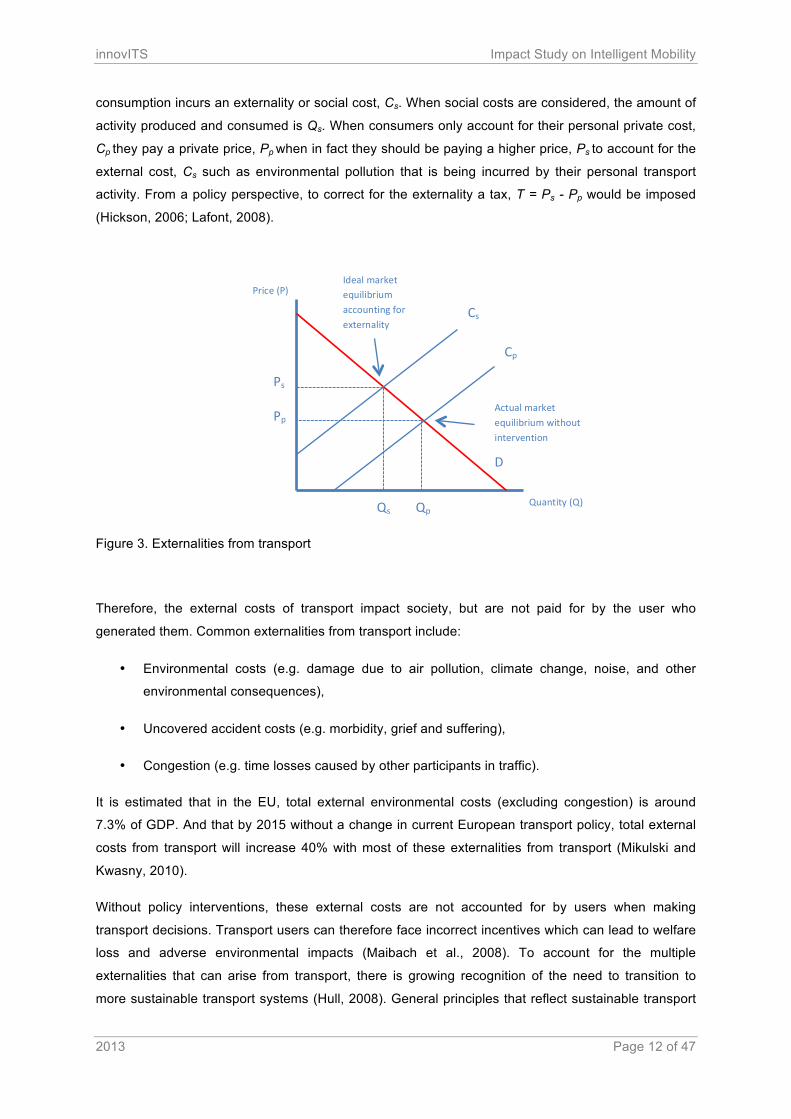
Figure 3 illustrates the actual versus ideal market equilibrium when accounting transport externalities
such as vehicle emissions. The demand curve faced by the consumer of transport services is, D. The
supply curve is the private cost, Cp to the consumer for the transport service. Assuming only private
costs are considered, the quantity of transport activity produced and consumed is, Qp. But that private
innovITS Impact Study on Intelligent Mobility
2013 Page 12 of 47
consumption incurs an externality or social cost, Cs. When social costs are considered, the amount of
activity produced and consumed is Qs. When consumers only account for their personal private cost,
Cp they pay a private price, Pp when in fact they should be paying a higher price, Ps to account for the
external cost, Cs such as environmental pollution that is being incurred by their personal transport
activity. From a policy perspective, to correct for the externality a tax, T = Ps - Pp would be imposed
(Hickson, 2006; Lafont, 2008).
Figure 3. Externalities from transport
Therefore, the external costs of transport impact society, but are not paid for by the user who
generated them. Common externalities from transport include:
• Environmental costs (e.g. damage due to air pollution, climate change, noise, and other
environmental consequences),
• Uncovered accident costs (e.g. morbidity, grief and suffering),
• Congestion (e.g. time losses caused by other participants in traffic).
It is estimated that in the EU, total external environmental costs (excluding congestion) is around
7.3% of GDP. And that by 2015 without a change in current European transport policy, total external
costs from transport will increase 40% with most of these externalities from transport (Mikulski and
Kwasny, 2010).
Without policy interventions, these external costs are not accounted for by users when making
transport decisions. Transport users can therefore face incorrect incentives which can lead to welfare
loss and adverse environmental impacts (Maibach et al., 2008). To account for the multiple
externalities that can arise from transport, there is growing recognition of the need to transition to
more sustainable transport systems (Hull, 2008). General principles that reflect sustainable transport
D
Cp
Ps
Pp
Qp
Cs
Qs
Actual market equilibrium without intervention
Ideal market equilibrium accounting for externality
Quantity (Q)
Price (P)
innovITS Impact Study on Intelligent Mobility
2013 Page 13 of 47
is to allow for basic access and needs of individuals and societies to be met safely and in a manner
consistent with human and ecosystem health; and to ensure equity within and between generations
(Richardson, 2005). The goal of sustainable transportation is therefore to ensure that environment,
social and economic considerations are factored into decisions affecting transport services (Litman,
2007).
2.2 Analytical Framework Rather than imposing a tax, ITS have the potential to reduce the negative externalities associated
with transport. The widespead deployment of ITS has the potential to shape future transport systems
(Hilty et al., 2006). ITS are becoming viewed as an important measure towards the sustainable
transport system approach and an effective instrument for addressing the growth of freight transport
and an increasing demand for seamless mobility (Maciulis et al., 2009). ITS technologies operate
across a variety of modes, infrastructures and functions, and therefore require a multidimensional
approach to assess its impacts calling for a sustainability approach (UN, 2009). Achieving
sustainability is multidimensional and based on a variety indicators rather than relying on a single
criterion such as GDP. Sustainability indicators are based on broad thematic areas which can be
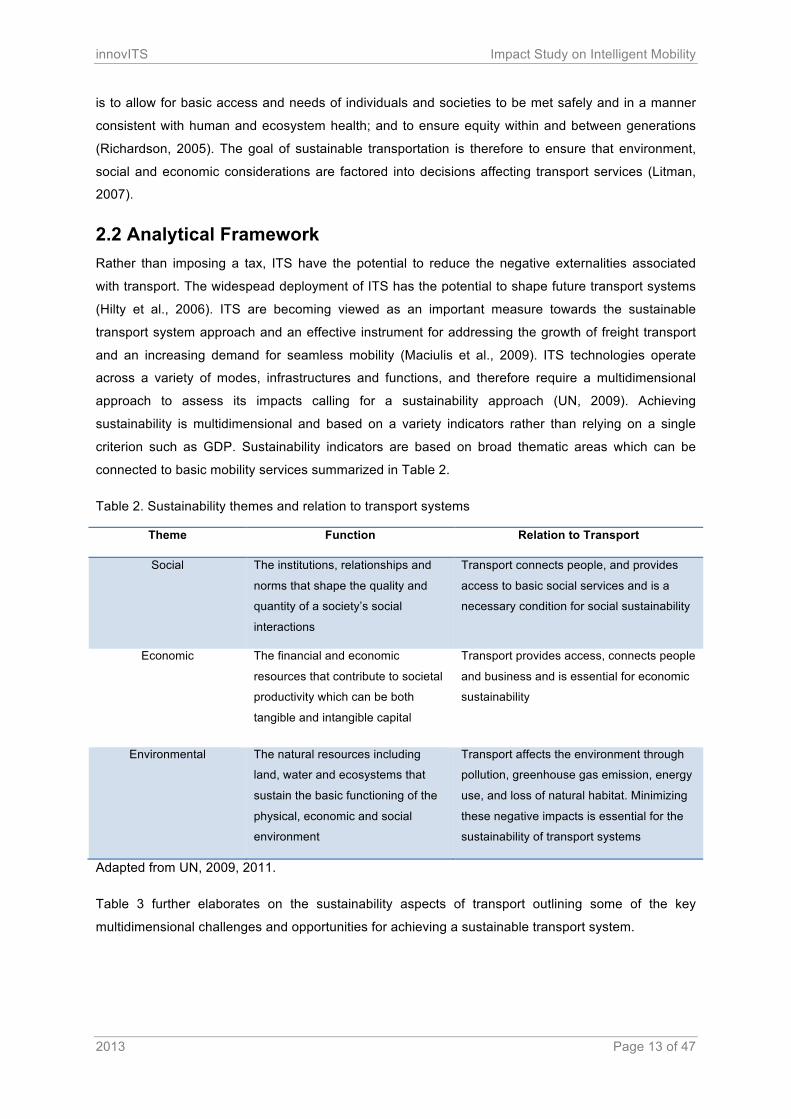
connected to basic mobility services summarized in Table 2.
Table 2. Sustainability themes and relation to transport systems
Theme Function Relation to Transport
Social The institutions, relationships and
norms that shape the quality and
quantity of a society’s social
interactions
Transport connects people, and provides
access to basic social services and is a
necessary condition for social sustainability
Economic The financial and economic
resources that contribute to societal
productivity which can be both
tangible and intangible capital
Transport provides access, connects people
and business and is essential for economic
sustainability
Environmental The natural resources including
land, water and ecosystems that
sustain the basic functioning of the
physical, economic and social
environment
Transport affects the environment through
pollution, greenhouse gas emission, energy
use, and loss of natural habitat. Minimizing
these negative impacts is essential for the
sustainability of transport systems
Adapted from UN, 2009, 2011.
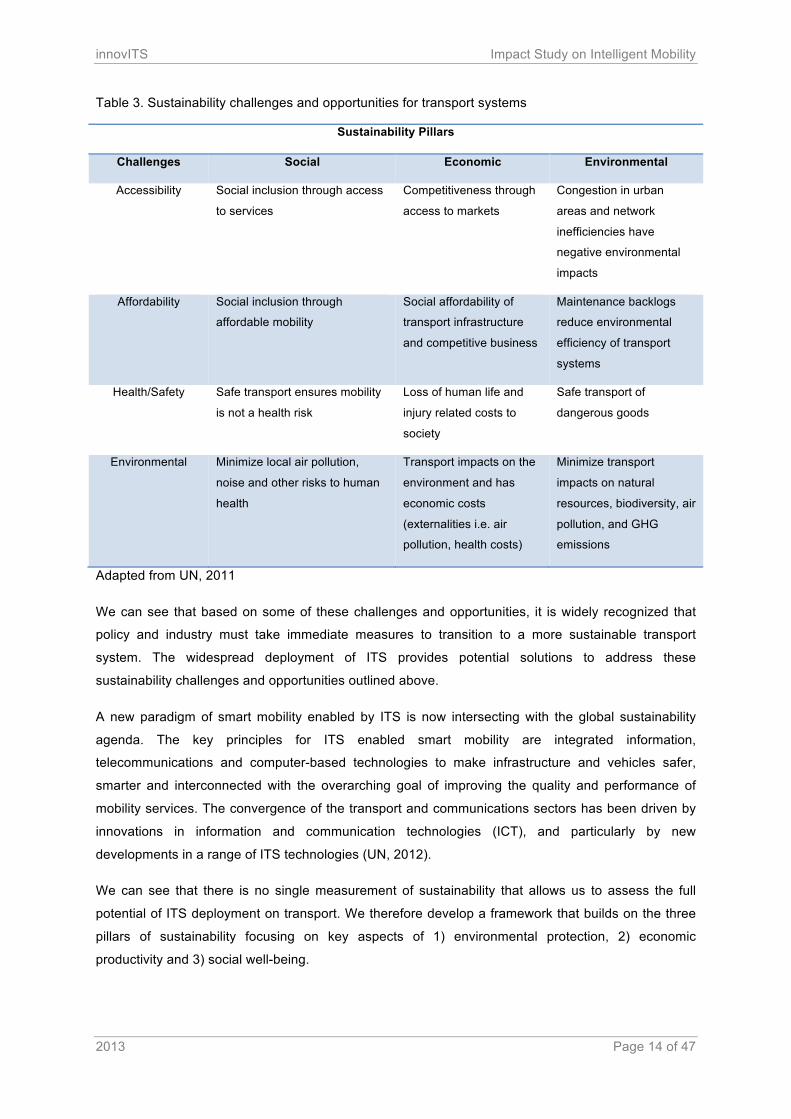
Table 3 further elaborates on the sustainability aspects of transport outlining some of the key
multidimensional challenges and opportunities for achieving a sustainable transport system.
innovITS Impact Study on Intelligent Mobility
2013 Page 14 of 47
Table 3. Sustainability challenges and opportunities for transport systems
Sustainability Pillars
Challenges Social Economic Environmental
Accessibility Social inclusion through access
to services
Competitiveness through
access to markets
Congestion in urban
areas and network
inefficiencies have
negative environmental
impacts
Affordability Social inclusion through
affordable mobility
Social affordability of
transport infrastructure
and competitive business
Maintenance backlogs
reduce environmental
efficiency of transport
systems
Health/Safety Safe transport ensures mobility
is not a health risk
Loss of human life and
injury related costs to
society
Safe transport of
dangerous goods
Environmental Minimize local air pollution,
noise and other risks to human
health
Transport impacts on the
environment and has
economic costs
(externalities i.e. air
pollution, health costs)
Minimize transport
impacts on natural
resources, biodiversity, air
pollution, and GHG
emissions
Adapted from UN, 2011
We can see that based on some of these challenges and opportunities, it is widely recognized that
policy and industry must take immediate measures to transition to a more sustainable transport
system. The widespread deployment of ITS provides potential solutions to address these
sustainability challenges and opportunities outlined above.
A new paradigm of smart mobility enabled by ITS is now intersecting with the global sustainability
agenda. The key principles for ITS enabled smart mobility are integrated information,
telecommunications and computer-based technologies to make infrastructure and vehicles safer,
smarter and interconnected with the overarching goal of improving the quality and performance of
mobility services. The convergence of the transport and communications sectors has been driven by
innovations in information and communication technologies (ICT), and particularly by new
developments in a range of ITS technologies (UN, 2012).
We can see that there is no single measurement of sustainability that allows us to assess the full
potential of ITS deployment on transport. We therefore develop a framework that builds on the three
pillars of sustainability focusing on key aspects of 1) environmental protection, 2) economic
productivity and 3) social well-being.
innovITS Impact Study on Intelligent Mobility
2013 Page 15 of 47
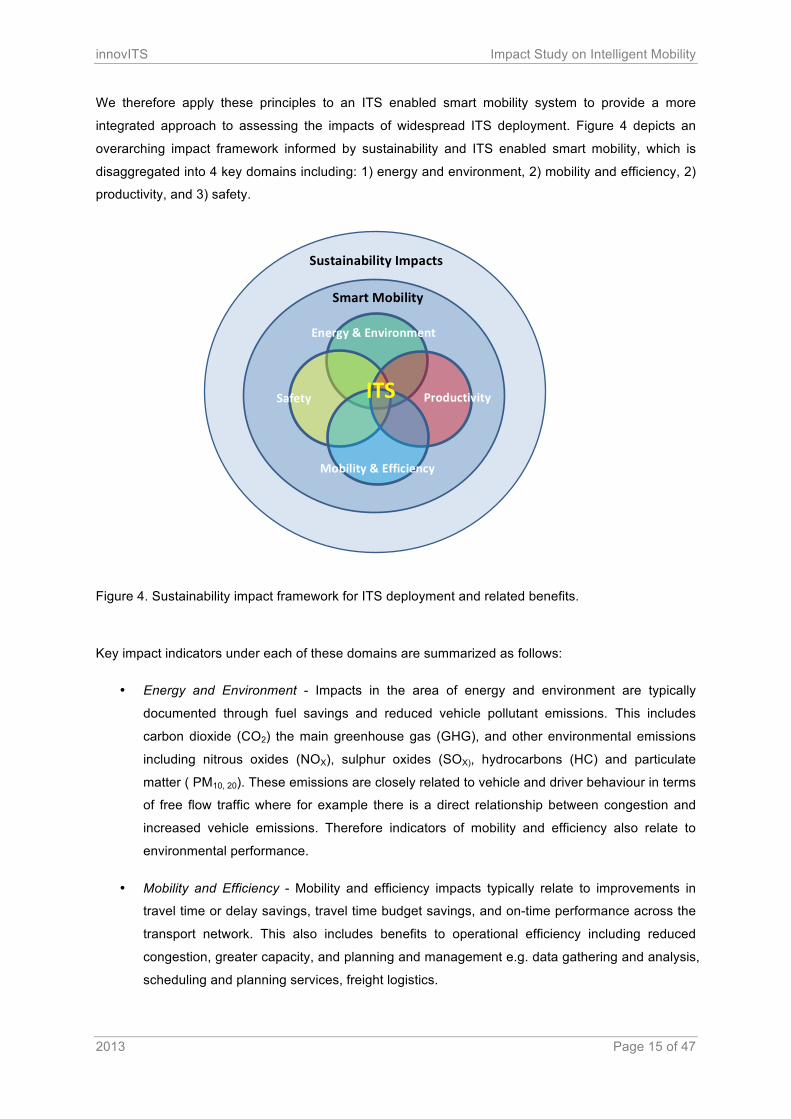
We therefore apply these principles to an ITS enabled smart mobility system to provide a more
integrated approach to assessing the impacts of widespread ITS deployment. Figure 4 depicts an
overarching impact framework informed by sustainability and ITS enabled smart mobility, which is
disaggregated into 4 key domains including: 1) energy and environment, 2) mobility and efficiency, 2)
productivity, and 3) safety.
Figure 4. Sustainability impact framework for ITS deployment and related benefits.
Key impact indicators under each of these domains are summarized as follows:
• Energy and Environment - Impacts in the area of energy and environment are typically
documented through fuel savings and reduced vehicle pollutant emissions. This includes
carbon dioxide (CO2) the main greenhouse gas (GHG), and other environmental emissions
including nitrous oxides (NOX), sulphur oxides (SOX), hydrocarbons (HC) and particulate
matter ( PM10, 20). These emissions are closely related to vehicle and driver behaviour in terms
of free flow traffic where for example there is a direct relationship between congestion and
increased vehicle emissions. Therefore indicators of mobility and efficiency also relate to
environmental performance.
• Mobility and Efficiency - Mobility and efficiency impacts typically relate to improvements in
travel time or delay savings, travel time budget savings, and on-time performance across the
transport network. This also includes benefits to operational efficiency including reduced
congestion, greater capacity, and planning and management e.g. data gathering and analysis,
scheduling and planning services, freight logistics.
Sustainability Impacts
Smart Mobility
Energy & Environment
ITS
Mobility & Efficiency
Productivity Safety
innovITS Impact Study on Intelligent Mobility
2013 Page 16 of 47
• Productivity – These impacts are typically related to improvements in cost savings to
transportation providers, travellers, or shippers. This includes positive benefit-to-cost ratios for
freight management, passenger vehicle safety, corridor management, decision support
systems, and a wide variety of other application areas.
• Safety – These impacts are related to a reduction in accidents, injuries, incident management
and response time, reduced fatalities and overall improved passenger safety, across a wide
variety of transport modes and infrastructure use.
2.3 Sustainability Assessment of Intelligent Mobility There is currently a strong initiative at the global level to deploy ITS to address sustainability issues.
For example, EU transport policies are aimed at halving traffic-related casualties by 2010, transport
network efficiency is also a major priority, leading the way to more cost-effective transportation. The
UN also foresees that improvements in environmental protection and the potential beneficial effects
on society and health could be directly linked to the EU’s action plan for ITS and the EU directive on
ITS which was adopted on 7 July 2010 (UN, 2012).
We now apply the sustainability framework by assessing global evaluation data and other government
and academic literature on the impacts of ITS deployment on the four main impact categories energy
and environment, mobility and efficiency, productivity and safety emphasizing the interconnections
between each domain.
2.3.1 Energy and Environment
Vehicle transportation is a major cause of greenhouse gas emissions (GHG) which are the main
contributors to global warming. Vehicles are also a major source of other environmentally harmful
emissions including carbon monoxide (CO), nitrogen oxide (NO) and hydrocarbons (HC). In England,
the transport sector contributes about 25% of the country’s CO2 emissions (which is the central GHG),
and 93% comes from road transport. In France, 31% of final energy consumption and 26% of GHG
emissions are from transport, and in the US, 33% of final energy consumption and nearly 30% of CO2
emissions are from road transport. Globally, transportation accounts for 25% of worldwide GHG
emissions (Ezell, 2010).
There is also a strong link between the economic and environmental impacts of congestion in the
transportation system. Traffic congestion causes extensive CO2 emissions. For example, vehicles
traveling at 60 km/hr. emit 40% less carbon emissions than vehicles traveling at 20 km/hr. (Haynes
and Li, 2004). Intelligent transportation systems can deliver environmental benefits by reducing
congestion, enabling more efficient and smooth traffic, and by reducing the need to build additional
roadways through maximizing existing capacity. Importantly, ITS can also influence driver behaviour
by coaching motorists how to drive more efficiently, reducing fuel consumption, cost and vehicle
emissions. Various studies show on average ITS can influence driver behaviour resulting in 5-15%
reductions in vehicle emissions through ecodriving (IEA, 2010).
innovITS Impact Study on Intelligent Mobility
2013 Page 17 of 47
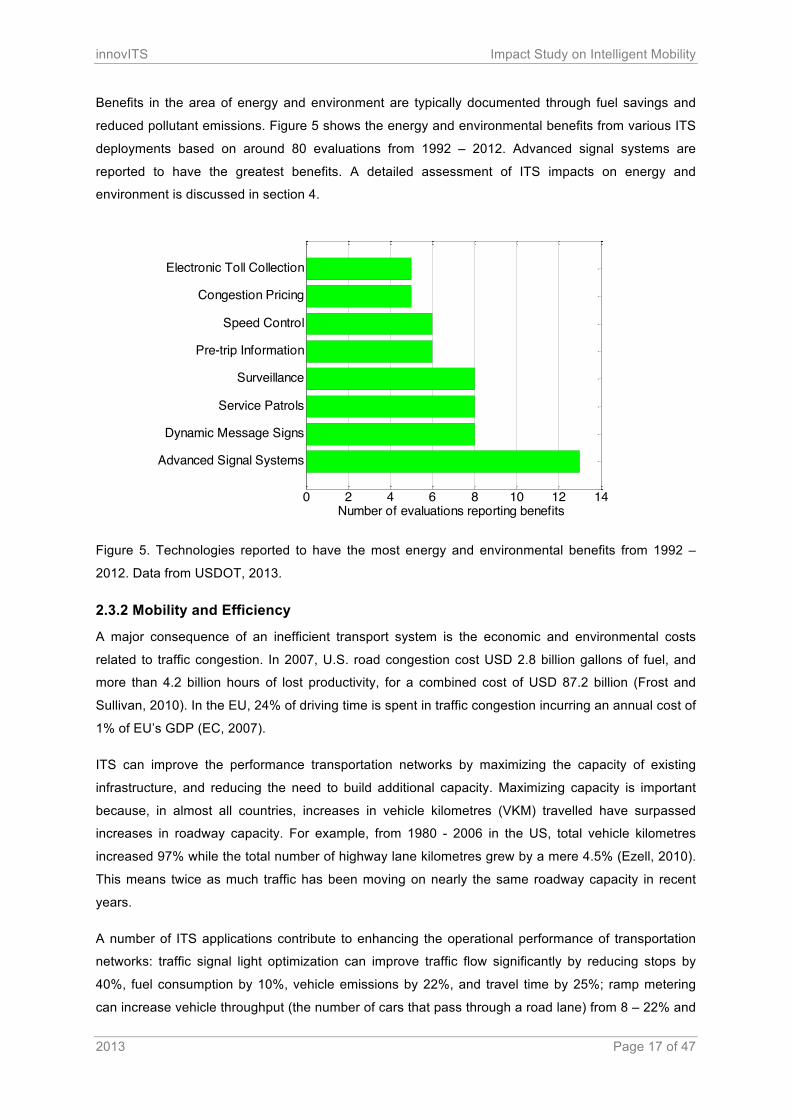
Benefits in the area of energy and environment are typically documented through fuel savings and
reduced pollutant emissions. Figure 5 shows the energy and environmental benefits from various ITS
deployments based on around 80 evaluations from 1992 – 2012. Advanced signal systems are
reported to have the greatest benefits. A detailed assessment of ITS impacts on energy and
environment is discussed in section 4.
Figure 5. Technologies reported to have the most energy and environmental benefits from 1992 –
2012. Data from USDOT, 2013.
2.3.2 Mobility and Efficiency
A major consequence of an inefficient transport system is the economic and environmental costs
related to traffic congestion. In 2007, U.S. road congestion cost USD 2.8 billion gallons of fuel, and
more than 4.2 billion hours of lost productivity, for a combined cost of USD 87.2 billion (Frost and
Sullivan, 2010). In the EU, 24% of driving time is spent in traffic congestion incurring an annual cost of
1% of EU’s GDP (EC, 2007).
ITS can improve the performance transportation networks by maximizing the capacity of existing
infrastructure, and reducing the need to build additional capacity. Maximizing capacity is important
because, in almost all countries, increases in vehicle kilometres (VKM) travelled have surpassed
increases in roadway capacity. For example, from 1980 - 2006 in the US, total vehicle kilometres
increased 97% while the total number of highway lane kilometres grew by a mere 4.5% (Ezell, 2010).
This means twice as much traffic has been moving on nearly the same roadway capacity in recent
years.
A number of ITS applications contribute to enhancing the operational performance of transportation
networks: traffic signal light optimization can improve traffic flow significantly by reducing stops by
40%, fuel consumption by 10%, vehicle emissions by 22%, and travel time by 25%; ramp metering
can increase vehicle throughput (the number of cars that pass through a road lane) from 8 – 22% and
0 2 4 6 8 10 12 14
Advanced Signal Systems
Dynamic Message Signs
Service Patrols
Surveillance
Pre-trip Information
Speed Control
Congestion Pricing
Electronic Toll Collection
Number of evaluations reporting benefits
innovITS Impact Study on Intelligent Mobility
2013 Page 18 of 47
increase road speeds from 8 – 60%. Additionally, up to 30% of highway congestion occurs at toll
stops, deploying electronic toll collection systems have been found to reduce vehicle emissions by 16
– 60% (USDOT, 2008). Assessing the impact of ITS including ramp metering, incident management,
traffic signal coordination, and arterial access management, the US government found a reduction in
urban delays of 9% (336 million hours) led to a further reduction in annual costs of USD 5.6 billion due
to reduced fuel consumption and hours of delay (GAO, 2005).
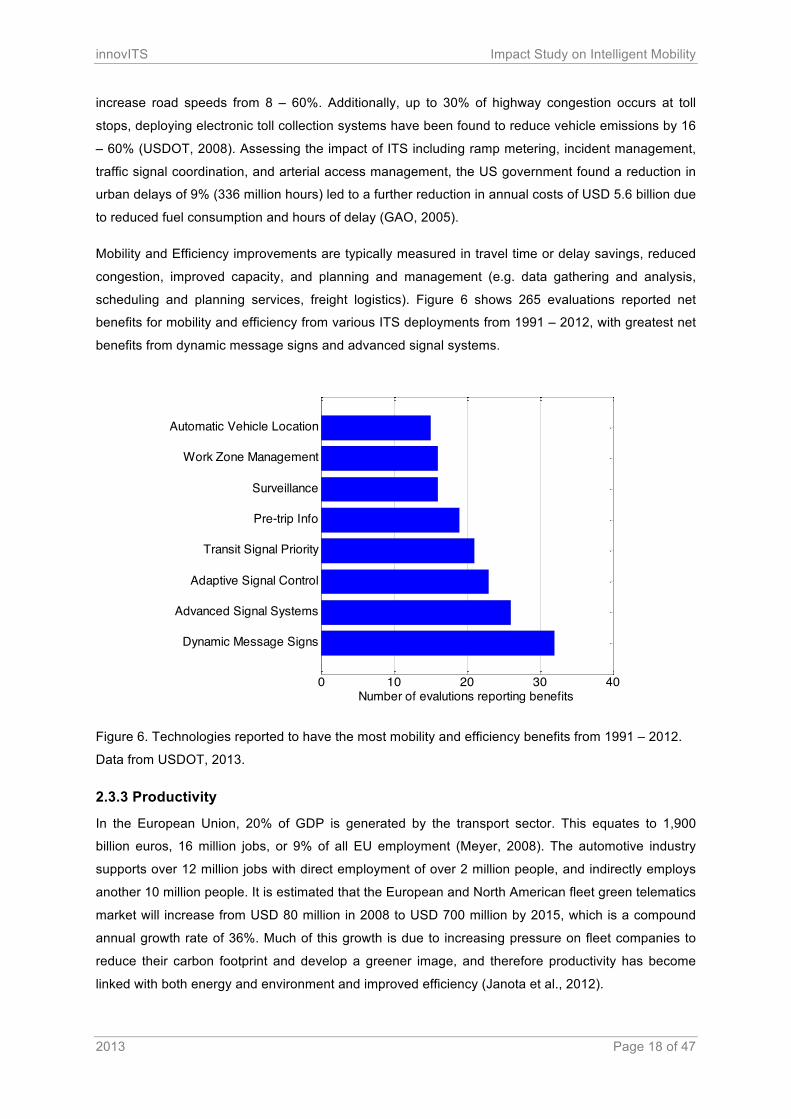
Mobility and Efficiency improvements are typically measured in travel time or delay savings, reduced
congestion, improved capacity, and planning and management (e.g. data gathering and analysis,
scheduling and planning services, freight logistics). Figure 6 shows 265 evaluations reported net
benefits for mobility and efficiency from various ITS deployments from 1991 – 2012, with greatest net
benefits from dynamic message signs and advanced signal systems.
Figure 6. Technologies reported to have the most mobility and efficiency benefits from 1991 – 2012.
Data from USDOT, 2013.
2.3.3 Productivity
In the European Union, 20% of GDP is generated by the transport sector. This equates to 1,900
billion euros, 16 million jobs, or 9% of all EU employment (Meyer, 2008). The automotive industry
supports over 12 million jobs with direct employment of over 2 million people, and indirectly employs
another 10 million people. It is estimated that the European and North American fleet green telematics
market will increase from USD 80 million in 2008 to USD 700 million by 2015, which is a compound
annual growth rate of 36%. Much of this growth is due to increasing pressure on fleet companies to
reduce their carbon footprint and develop a greener image, and therefore productivity has become
linked with both energy and environment and improved efficiency (Janota et al., 2012).
0 10 20 30 40
Dynamic Message Signs
Advanced Signal Systems
Adaptive Signal Control
Transit Signal Priority
Pre-trip Info
Surveillance
Work Zone Management
Automatic Vehicle Location
Number of evalutions reporting benefits
innovITS Impact Study on Intelligent Mobility
2013 Page 19 of 47
Productivity improvements related to ITS deployment are typically documented in cost savings to
transportation providers, travellers, or shippers. This includes positive benefit-to-cost ratios for freight
management, passenger vehicle safety, corridor management, decision support systems, and a wide
variety of other application areas. Intelligent transport systems can deliver positive benefit-cost returns
when compared to conventional investments in highway capacity. The benefit-cost ratio of systems-
operations measures enabled by ITS systems has been estimated at about 9 to1 compared to
conventional highway capacity expansion with a typical benefit-cost ratio of 2.7 to 1. It is estimated
that if the US were to implement a national real-time traffic information program, the present value
cost of deploying and operating the program would be USD 1.2 billion, but could deliver present value
benefits of USD 30.2 billion, a 25 to 1 benefit-cost ratio (Ezell, 2010).
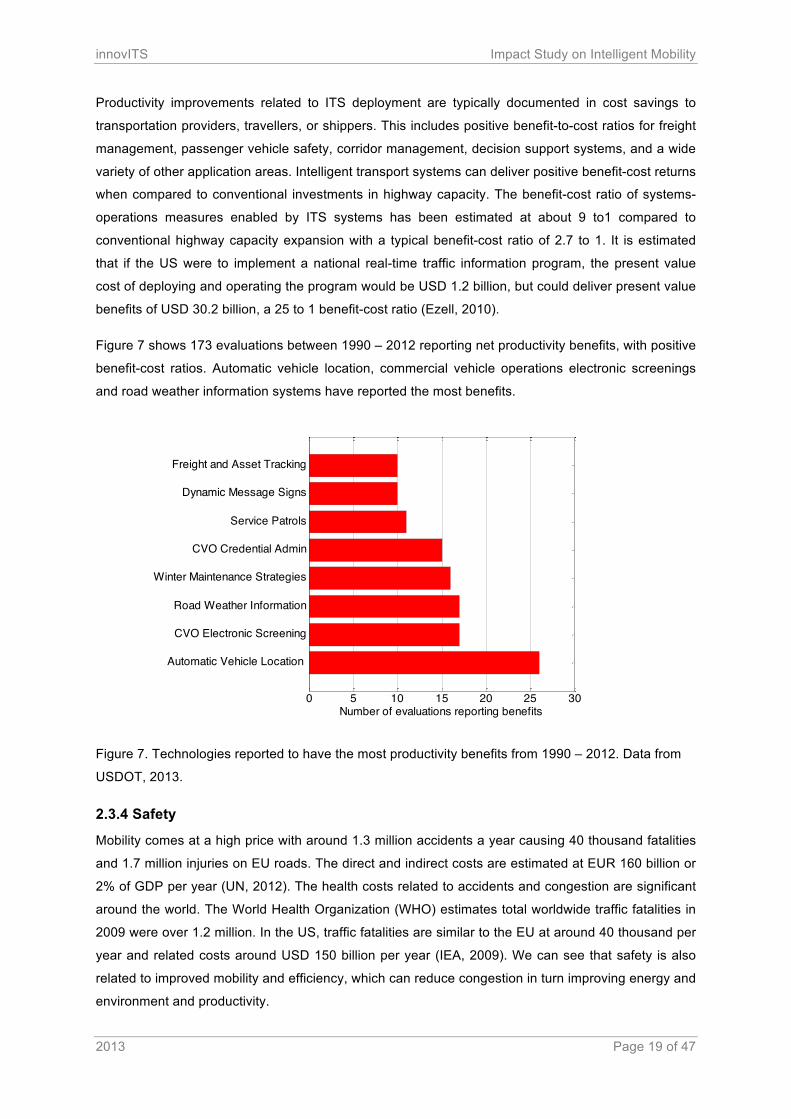
Figure 7 shows 173 evaluations between 1990 – 2012 reporting net productivity benefits, with positive
benefit-cost ratios. Automatic vehicle location, commercial vehicle operations electronic screenings
and road weather information systems have reported the most benefits.
Figure 7. Technologies reported to have the most productivity benefits from 1990 – 2012. Data from
USDOT, 2013.
2.3.4 Safety
Mobility comes at a high price with around 1.3 million accidents a year causing 40 thousand fatalities
and 1.7 million injuries on EU roads. The direct and indirect costs are estimated at EUR 160 billion or
2% of GDP per year (UN, 2012). The health costs related to accidents and congestion are significant
around the world. The World Health Organization (WHO) estimates total worldwide traffic fatalities in
2009 were over 1.2 million. In the US, traffic fatalities are similar to the EU at around 40 thousand per
year and related costs around USD 150 billion per year (IEA, 2009). We can see that safety is also
related to improved mobility and efficiency, which can reduce congestion in turn improving energy and
environment and productivity.
0 5 10 15 20 25 30
Automatic Vehicle Location
CVO Electronic Screening
Road Weather Information
Winter Maintenance Strategies
CVO Credential Admin
Service Patrols
Dynamic Message Signs
Freight and Asset Tracking
Number of evaluations reporting benefits
innovITS Impact Study on Intelligent Mobility
2013 Page 20 of 47
ITS technologies can have important safety impacts. A wide range of ITS applications including real-
time traffic alerts, intersection collision avoidance, on-vehicle systems such as anti-lock braking, lane
departure, collision avoidance, and crash notification systems have been developed to enhance
transportation safety. For example, a study of ramp metering in the US found that metering reduced
total crashes on area roadways between 15 – 50% (USDOT, 2003). Various traffic incident
management programs have also demonstrated success. One of the most important findings is the
ability to reduce the duration of traffic incidents from around 15 – 65%, with the majority of
programmes reporting 30 – 40% improvements (Bunch et al., 2011).
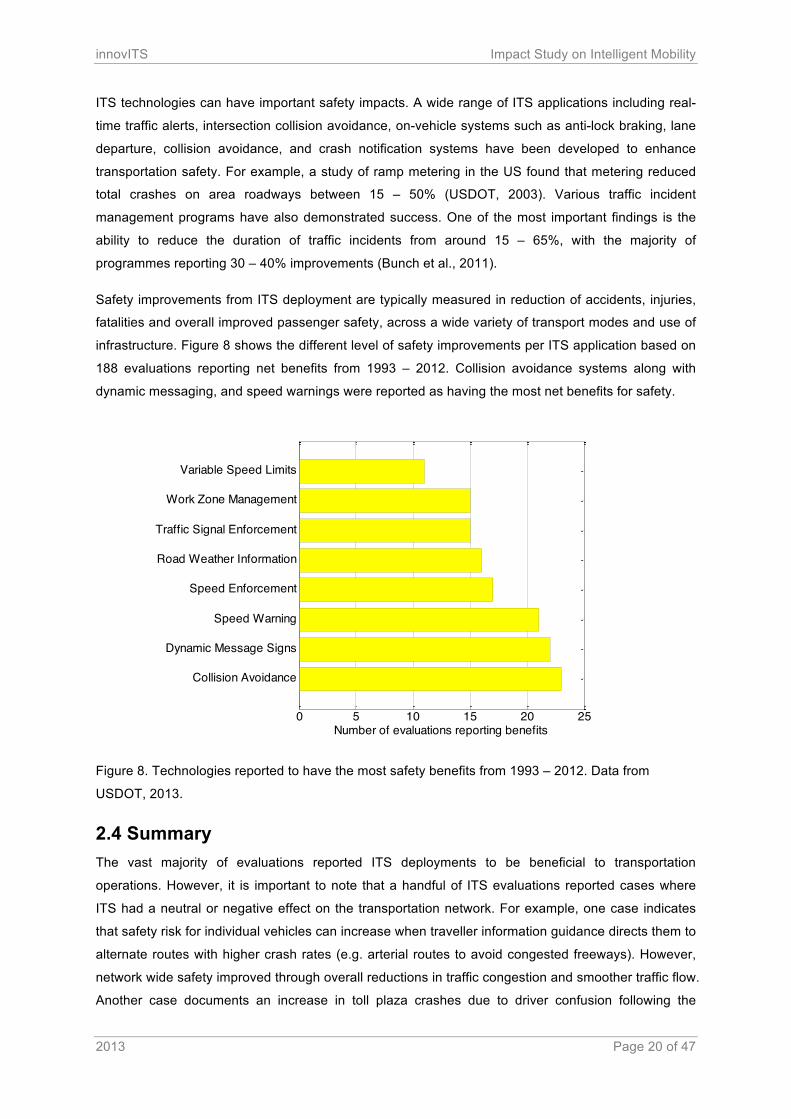
Safety improvements from ITS deployment are typically measured in reduction of accidents, injuries,
fatalities and overall improved passenger safety, across a wide variety of transport modes and use of
infrastructure. Figure 8 shows the different level of safety improvements per ITS application based on
188 evaluations reporting net benefits from 1993 – 2012. Collision avoidance systems along with
dynamic messaging, and speed warnings were reported as having the most net benefits for safety.
Figure 8. Technologies reported to have the most safety benefits from 1993 – 2012. Data from
USDOT, 2013.
2.4 Summary The vast majority of evaluations reported ITS deployments to be beneficial to transportation
operations. However, it is important to note that a handful of ITS evaluations reported cases where
ITS had a neutral or negative effect on the transportation network. For example, one case indicates
that safety risk for individual vehicles can increase when traveller information guidance directs them to
alternate routes with higher crash rates (e.g. arterial routes to avoid congested freeways). However,
network wide safety improved through overall reductions in traffic congestion and smoother traffic flow.
Another case documents an increase in toll plaza crashes due to driver confusion following the
0 5 10 15 20 25
Collision Avoidance
Dynamic Message Signs
Speed Warning
Speed Enforcement
Road Weather Information
Traffic Signal Enforcement
Work Zone Management
Variable Speed Limits
Number of evaluations reporting benefits
innovITS Impact Study on Intelligent Mobility
2013 Page 21 of 47
deployment of electronic toll collection, emphasizing the need for appropriate signage and guidance
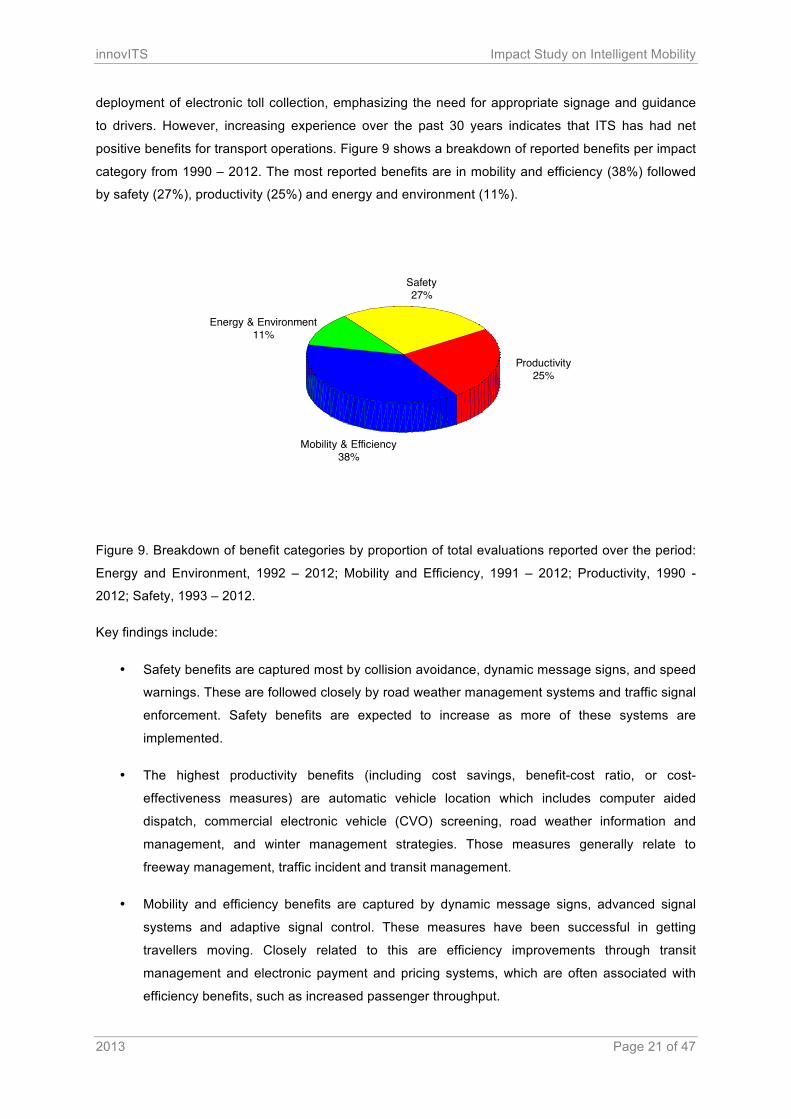
to drivers. However, increasing experience over the past 30 years indicates that ITS has had net
positive benefits for transport operations. Figure 9 shows a breakdown of reported benefits per impact
category from 1990 – 2012. The most reported benefits are in mobility and efficiency (38%) followed
by safety (27%), productivity (25%) and energy and environment (11%).
Figure 9. Breakdown of benefit categories by proportion of total evaluations reported over the period:
Energy and Environment, 1992 – 2012; Mobility and Efficiency, 1991 – 2012; Productivity, 1990 -
2012; Safety, 1993 – 2012.
Key findings include:
• Safety benefits are captured most by collision avoidance, dynamic message signs, and speed
warnings. These are followed closely by road weather management systems and traffic signal
enforcement. Safety benefits are expected to increase as more of these systems are
implemented.
• The highest productivity benefits (including cost savings, benefit-cost ratio, or cost-
effectiveness measures) are automatic vehicle location which includes computer aided
dispatch, commercial electronic vehicle (CVO) screening, road weather information and
management, and winter management strategies. Those measures generally relate to
freeway management, traffic incident and transit management.
• Mobility and efficiency benefits are captured by dynamic message signs, advanced signal
systems and adaptive signal control. These measures have been successful in getting
travellers moving. Closely related to this are efficiency improvements through transit
management and electronic payment and pricing systems, which are often associated with
efficiency benefits, such as increased passenger throughput.
Productivity25%
Safety27%
Mobility & Efficiency38%
Energy & Environment11%
innovITS Impact Study on Intelligent Mobility
2013 Page 22 of 47
• The sustainability framework indicates that there are interconnected impacts between all
areas. For example, there are co-benefits from energy and environment such as improved
passenger and environmental health, which is also related to improving mobility and efficiency
through reduction of congestion, all of which positively impact upon the economic productivity
of transport systems. These interdependencies are difficult to monetize, but it is clear that
taking a more integrated approach to assessing the potential benefits of ITS technologies is
important to ensure long term deployment and viability.
• Although a substantial number of evaluations capture energy and environmental impacts,
many ITS evaluations are still not addressing this important goal area. Recent trends indicate
that traveller information systems, driver assistance, and freeway management applications
are more likely to be evaluated for environmental benefits. Given the global and UK policy
agenda to reduce energy demand, carbon emissions and mitigate environmental impacts, the
potential energy and environment benefits from ITS have to be better evaluated and reported.
We now seek to address this important gap by focusing the sustainability framework on the
potential ITS impacts upon energy and environment as a detailed case study.
innovITS Impact Study on Intelligent Mobility
2013 Page 23 of 47
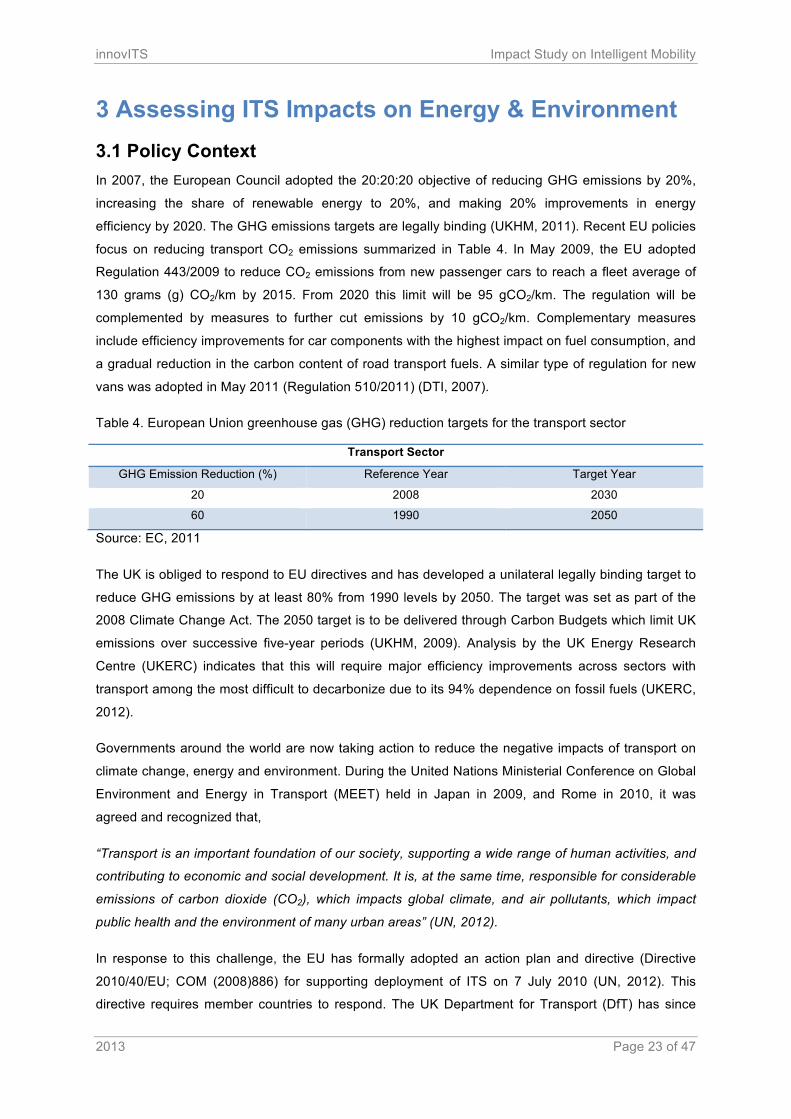
3 Assessing ITS Impacts on Energy & Environment 3.1 Policy Context In 2007, the European Council adopted the 20:20:20 objective of reducing GHG emissions by 20%,
increasing the share of renewable energy to 20%, and making 20% improvements in energy
efficiency by 2020. The GHG emissions targets are legally binding (UKHM, 2011). Recent EU policies
focus on reducing transport CO2 emissions summarized in Table 4. In May 2009, the EU adopted
Regulation 443/2009 to reduce CO2 emissions from new passenger cars to reach a fleet average of
130 grams (g) CO2/km by 2015. From 2020 this limit will be 95 gCO2/km. The regulation will be
complemented by measures to further cut emissions by 10 gCO2/km. Complementary measures
include efficiency improvements for car components with the highest impact on fuel consumption, and
a gradual reduction in the carbon content of road transport fuels. A similar type of regulation for new
vans was adopted in May 2011 (Regulation 510/2011) (DTI, 2007).
Table 4. European Union greenhouse gas (GHG) reduction targets for the transport sector
Transport Sector
GHG Emission Reduction (%) Reference Year Target Year
20 2008 2030
60 1990 2050
Source: EC, 2011
The UK is obliged to respond to EU directives and has developed a unilateral legally binding target to
reduce GHG emissions by at least 80% from 1990 levels by 2050. The target was set as part of the
2008 Climate Change Act. The 2050 target is to be delivered through Carbon Budgets which limit UK
emissions over successive five-year periods (UKHM, 2009). Analysis by the UK Energy Research
Centre (UKERC) indicates that this will require major efficiency improvements across sectors with
transport among the most difficult to decarbonize due to its 94% dependence on fossil fuels (UKERC,
2012).
Governments around the world are now taking action to reduce the negative impacts of transport on
climate change, energy and environment. During the United Nations Ministerial Conference on Global
Environment and Energy in Transport (MEET) held in Japan in 2009, and Rome in 2010, it was
agreed and recognized that,
“Transport is an important foundation of our society, supporting a wide range of human activities, and
contributing to economic and social development. It is, at the same time, responsible for considerable
emissions of carbon dioxide (CO2), which impacts global climate, and air pollutants, which impact
public health and the environment of many urban areas” (UN, 2012).
In response to this challenge, the EU has formally adopted an action plan and directive (Directive
2010/40/EU; COM (2008)886) for supporting deployment of ITS on 7 July 2010 (UN, 2012). This
directive requires member countries to respond. The UK Department for Transport (DfT) has since
innovITS Impact Study on Intelligent Mobility
2013 Page 24 of 47
submitted a report on ITS activities in the UK in August, 2011 but does not currently have any
overarching policy framework for ITS deployment (DfT, 2011). However, the DfT report does state,
‘The future deployment of ITS must therefore be not only policy led but backed by rigorous cost-
benefit analysis and sound business cases focussing on value for money and the effectiveness of the
ITS applications concerned. This represents a clear and distinct move away from the previous top-
down model’ (DfT, 2011).
Given the global and UK policy emphasis on reducing the impacts of transport on energy and
environment we explore the case evidence for the potential role of ITS for addressing these
challenges. While the focus here is on energy and environmental impacts, we also saw from the
sustainability framework that energy and environmental impacts are closely linked with improved
mobility and efficiency, economic productivity and health. Therefore the impact that ITS has on energy
and environment will have co-benefits in the other domains, which could be the focus of future
research.
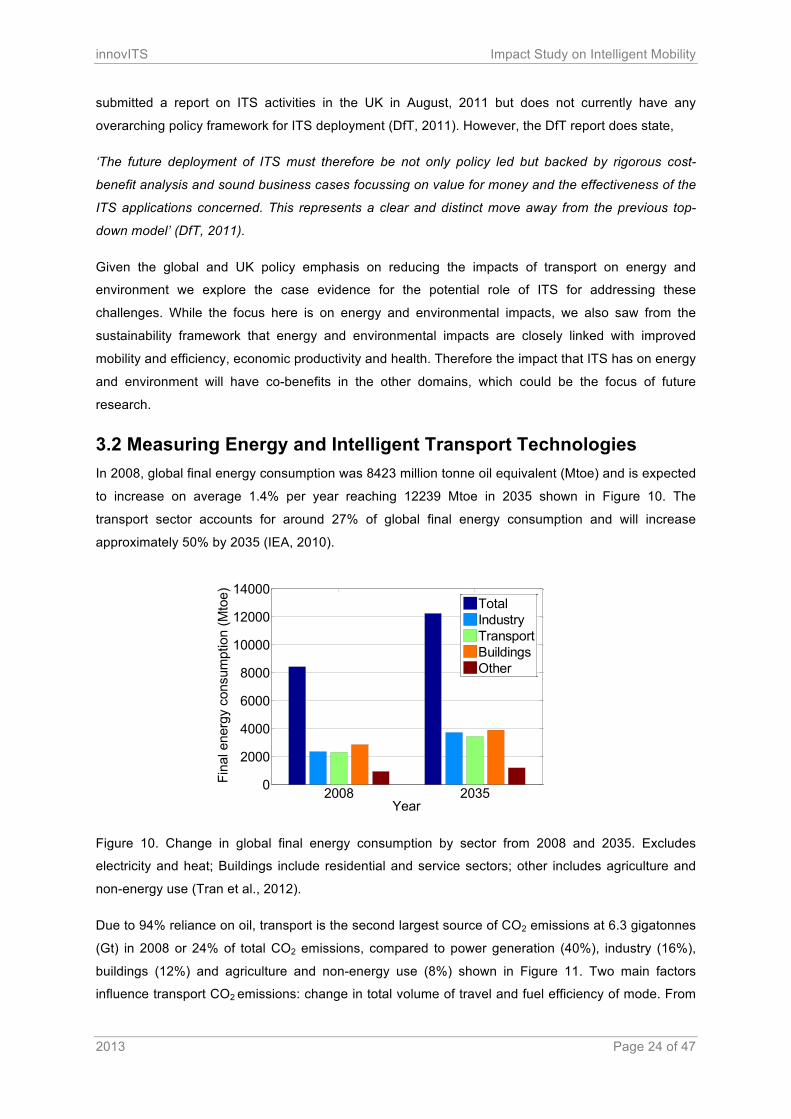
3.2 Measuring Energy and Intelligent Transport Technologies In 2008, global final energy consumption was 8423 million tonne oil equivalent (Mtoe) and is expected
to increase on average 1.4% per year reaching 12239 Mtoe in 2035 shown in Figure 10. The
transport sector accounts for around 27% of global final energy consumption and will increase
approximately 50% by 2035 (IEA, 2010).
Figure 10. Change in global final energy consumption by sector from 2008 and 2035. Excludes
electricity and heat; Buildings include residential and service sectors; other includes agriculture and
non-energy use (Tran et al., 2012).
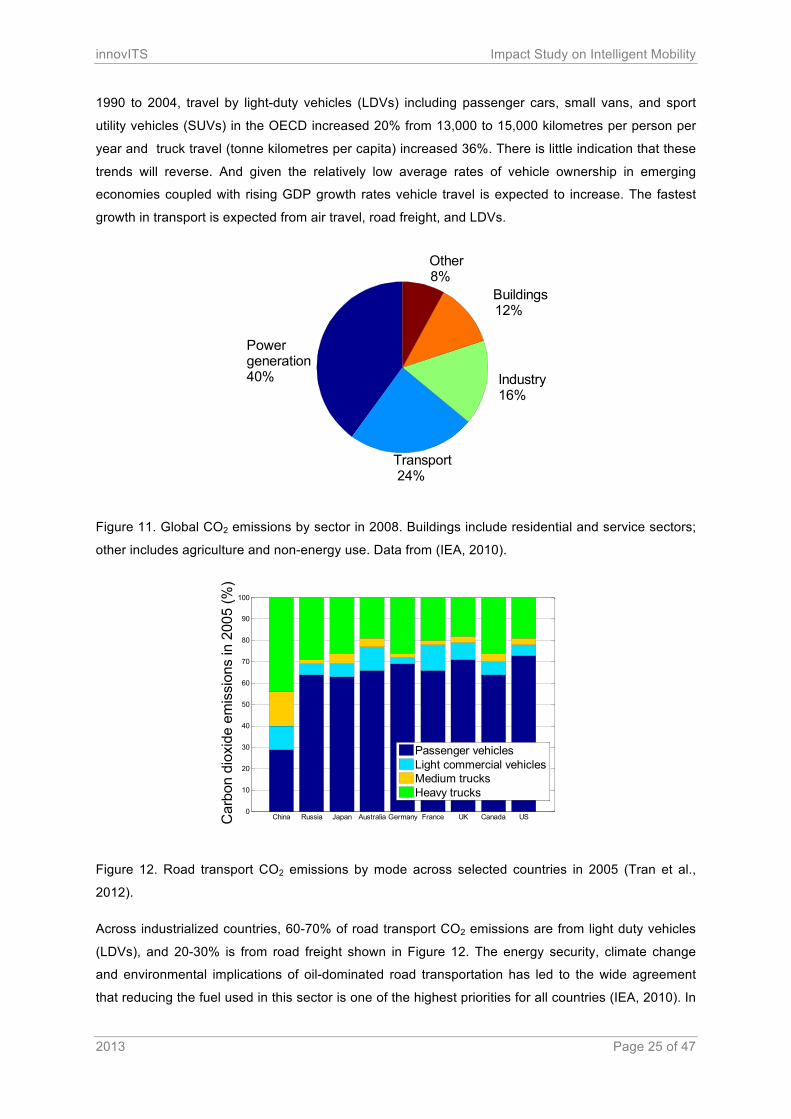
Due to 94% reliance on oil, transport is the second largest source of CO2 emissions at 6.3 gigatonnes
(Gt) in 2008 or 24% of total CO2 emissions, compared to power generation (40%), industry (16%),
buildings (12%) and agriculture and non-energy use (8%) shown in Figure 11. Two main factors
influence transport CO2 emissions: change in total volume of travel and fuel efficiency of mode. From
2008 20350
2000
4000
6000
8000
10000
12000
14000
Year
Fina
l ene
rgy
cons
umpt
ion
(Mto
e)
TotalIndustryTransportBuildingsOther
innovITS Impact Study on Intelligent Mobility
2013 Page 25 of 47
1990 to 2004, travel by light-duty vehicles (LDVs) including passenger cars, small vans, and sport
utility vehicles (SUVs) in the OECD increased 20% from 13,000 to 15,000 kilometres per person per
year and truck travel (tonne kilometres per capita) increased 36%. There is little indication that these
trends will reverse. And given the relatively low average rates of vehicle ownership in emerging
economies coupled with rising GDP growth rates vehicle travel is expected to increase. The fastest
growth in transport is expected from air travel, road freight, and LDVs.
Figure 11. Global CO2 emissions by sector in 2008. Buildings include residential and service sectors;
other includes agriculture and non-energy use. Data from (IEA, 2010).
Figure 12. Road transport CO2 emissions by mode across selected countries in 2005 (Tran et al.,
2012).
Across industrialized countries, 60-70% of road transport CO2 emissions are from light duty vehicles
(LDVs), and 20-30% is from road freight shown in Figure 12. The energy security, climate change
and environmental implications of oil-dominated road transportation has led to the wide agreement
that reducing the fuel used in this sector is one of the highest priorities for all countries (IEA, 2010). In
Power generation40%
Transport24%
Industry16%
Buildings12%
Other8%
China Russia Japan Australia Germany France UK Canada US0
10
20
30
40
50
60
70
80
90
100
Car
bon
diox
ide
emis
sion
s in
200
5 (%
)
Passenger vehiclesLight commercial vehiclesMedium trucksHeavy trucks
innovITS Impact Study on Intelligent Mobility
2013 Page 26 of 47
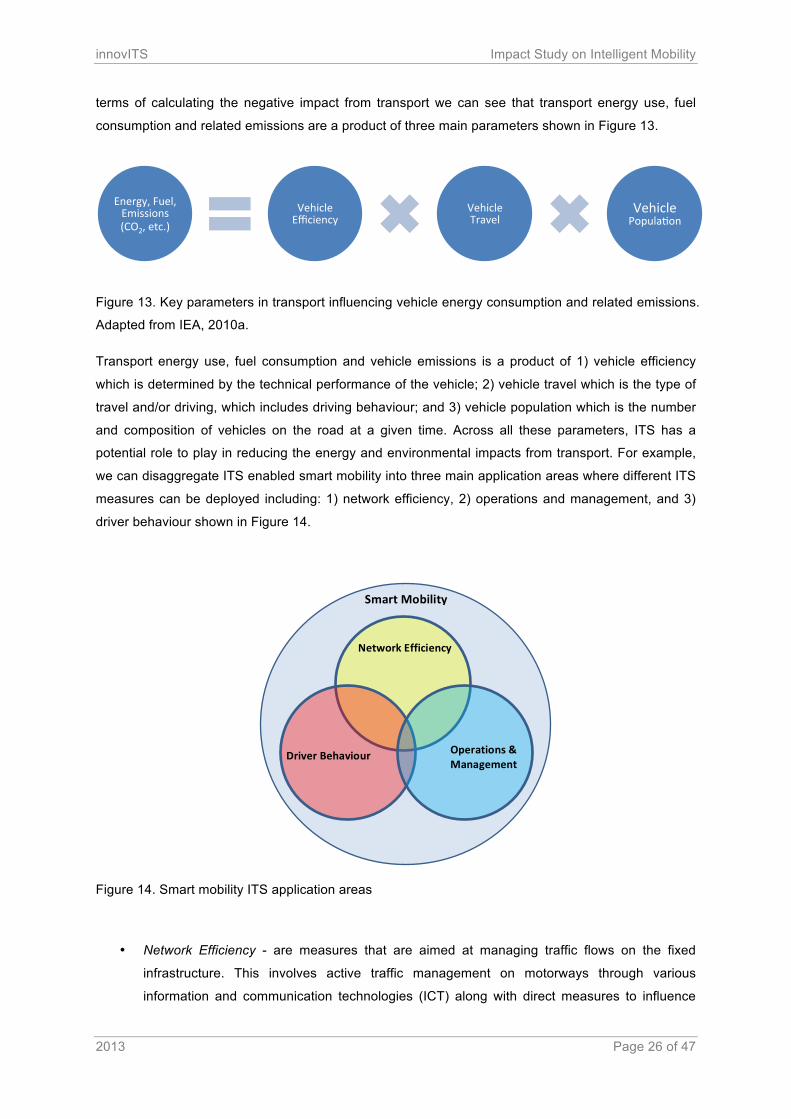
terms of calculating the negative impact from transport we can see that transport energy use, fuel
consumption and related emissions are a product of three main parameters shown in Figure 13.
Figure 13. Key parameters in transport influencing vehicle energy consumption and related emissions.
Adapted from IEA, 2010a.
Transport energy use, fuel consumption and vehicle emissions is a product of 1) vehicle efficiency
which is determined by the technical performance of the vehicle; 2) vehicle travel which is the type of
travel and/or driving, which includes driving behaviour; and 3) vehicle population which is the number
and composition of vehicles on the road at a given time. Across all these parameters, ITS has a
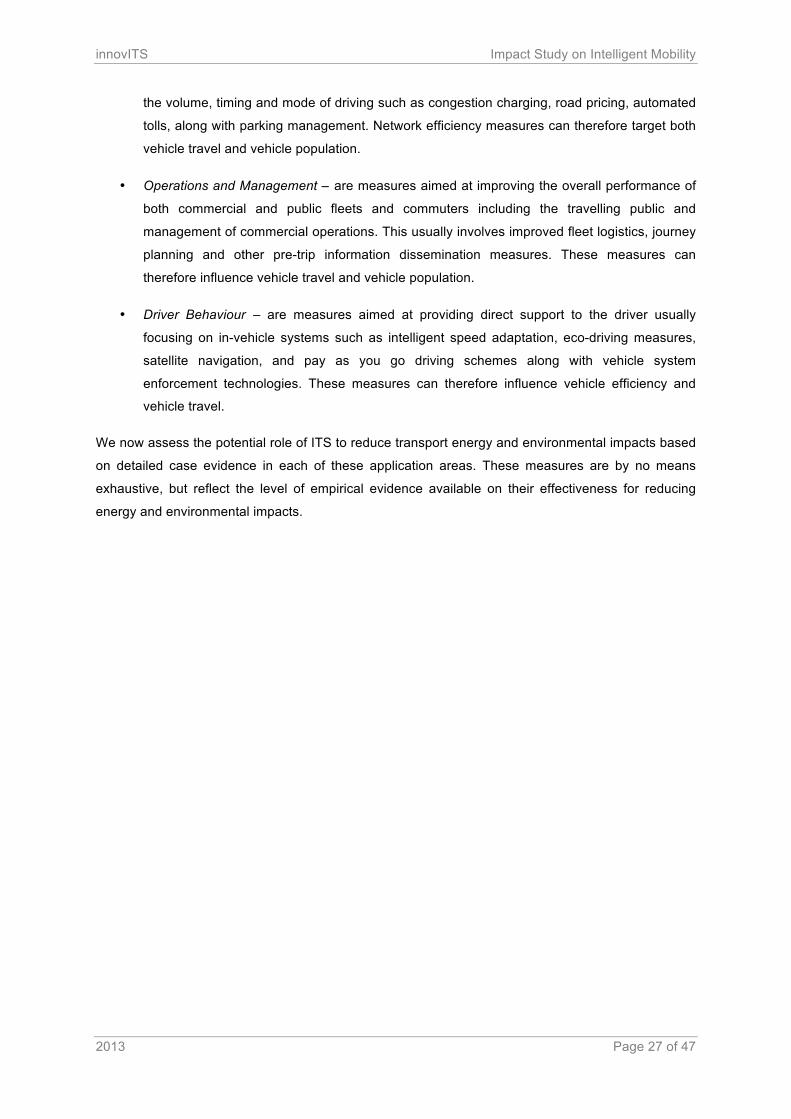
potential role to play in reducing the energy and environmental impacts from transport. For example,
we can disaggregate ITS enabled smart mobility into three main application areas where different ITS
measures can be deployed including: 1) network efficiency, 2) operations and management, and 3)
driver behaviour shown in Figure 14.
Figure 14. Smart mobility ITS application areas
• Network Efficiency - are measures that are aimed at managing traffic flows on the fixed
infrastructure. This involves active traffic management on motorways through various
information and communication technologies (ICT) along with direct measures to influence
Energy, Fuel, Emissions (CO2, etc.)
Vehicle Efficiency
Vehicle Travel
Vehicle PopulaTon
Smart Mobility
Network Efficiency
Operations & Management
Driver Behaviour
innovITS Impact Study on Intelligent Mobility
2013 Page 27 of 47
the volume, timing and mode of driving such as congestion charging, road pricing, automated
tolls, along with parking management. Network efficiency measures can therefore target both
vehicle travel and vehicle population.
• Operations and Management – are measures aimed at improving the overall performance of
both commercial and public fleets and commuters including the travelling public and
management of commercial operations. This usually involves improved fleet logistics, journey
planning and other pre-trip information dissemination measures. These measures can
therefore influence vehicle travel and vehicle population.
• Driver Behaviour – are measures aimed at providing direct support to the driver usually
focusing on in-vehicle systems such as intelligent speed adaptation, eco-driving measures,
satellite navigation, and pay as you go driving schemes along with vehicle system
enforcement technologies. These measures can therefore influence vehicle efficiency and
vehicle travel.
We now assess the potential role of ITS to reduce transport energy and environmental impacts based
on detailed case evidence in each of these application areas. These measures are by no means
exhaustive, but reflect the level of empirical evidence available on their effectiveness for reducing
energy and environmental impacts.
innovITS Impact Study on Intelligent Mobility
2013 Page 28 of 47
4 Evidence of ITS Impacts on Energy & Environment 4.1 Network Efficiency Impacts Improving the flow of traffic in urban areas and highways significantly improves fuel economy. This is
especially true for freight and other heavy vehicles. Therefore, ITS technologies that can directly
influence the flow of traffic on transport networks such as adjusting the timing of traffic lights can save
energy and reduce emissions by creating a steadier speed profile and less idling. Integrating real-time
monitoring infrastructure into the road network can provide valuable information to traffic management
systems. Eventually, the use of wireless internet technology and GPS systems may further help to
automate directing traffic to avoid congestion. Such systems are being implemented in some
countries, but can be deployed more since some technologies are widely available and costs are
affordable, especially when accounting for the fuel savings (IEA, 2009).
However, it is also important that measures to improve traffic flow do not induce greater demand
through more frequent driving. It is important to manage the demand for car driving in coordination
with available road space. Therefore different combinations of measures should be assessed to
achieve optimal network performance. For example, congestion-based road pricing has been viewed
as an effective measure as part of a broader ITS implementation strategy (IEA, 2009).
4.1.1 Congestion Charging
When vehicles are fully stopped for periods of time, this is known as a traffic jam. Within the US alone,
the annual cost of congestion is estimated to be USD 63 billion, caused by 3.7 billion hours of delays
and 8.7 billion litres of wasted fuel (USDOT, 2010). In EU, congestion costs 1% of its GDP around
€100 billion per year. There are around 300 million drivers in the EU today, while in the past 30 years
the distance travelled by road has tripled and is set to increase further. Wasted fuel increases air
pollution and carbon dioxide emissions owing to increased idling, acceleration and braking (Bani et al.,
2009).
Congestion pricing, also known as road pricing utilizes ITS technologies to charge, monitor and
enforce variable costs for drivers to use a transport facility or network based on demand or the time of
day. Pricing strategies include: cordon charging, area-wide charging, variable priced lanes, variable
tolls on entire roadways or roadway segments, and fast and intertwined regular lanes among other
measures (Bunch et al., 2011).
Road charging on urban road networks has been deployed in London, Stockholm, Singapore, and
Milan summarized in Table 5. Four general types of congestion charging in these cities are utilized
including: a cordon area around a city centre, which charges for passing the cordon line; area wide
congestion pricing, which charges for being inside an area; a city centre toll ring, with toll collection
surrounding the city; and corridor or single facility congestion pricing, where access to a lane or a
innovITS Impact Study on Intelligent Mobility
2013 Page 29 of 47
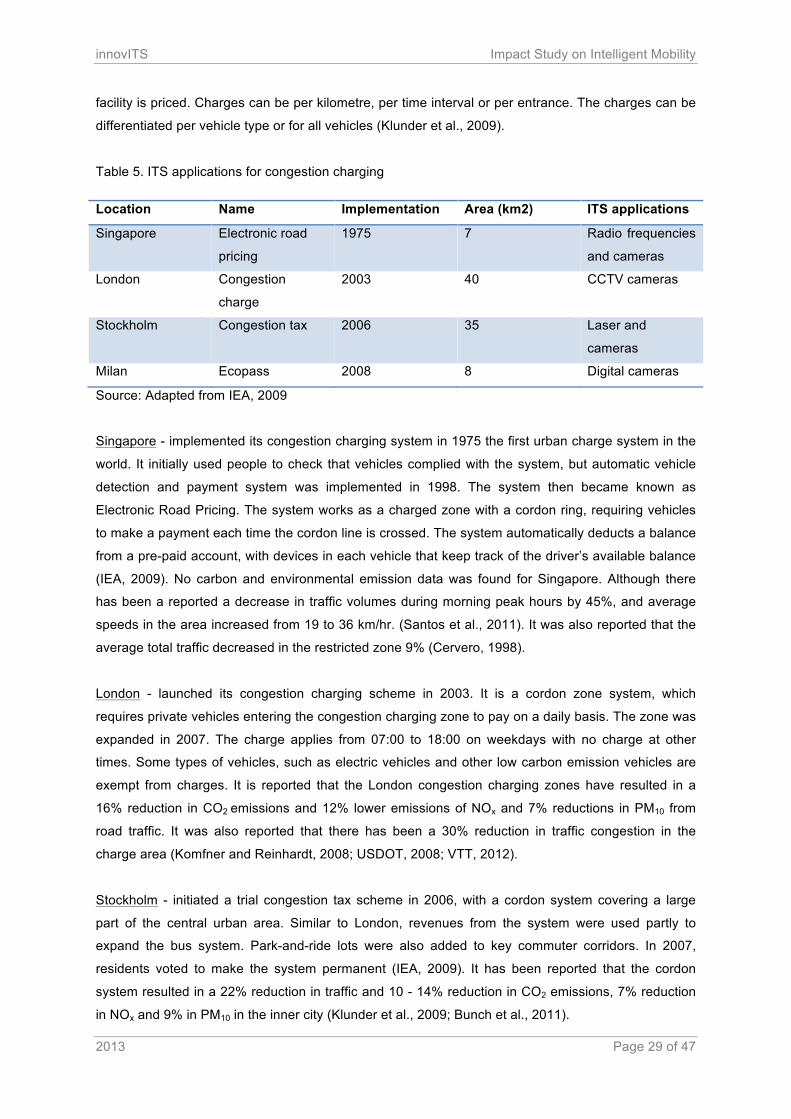
facility is priced. Charges can be per kilometre, per time interval or per entrance. The charges can be
differentiated per vehicle type or for all vehicles (Klunder et al., 2009).
Table 5. ITS applications for congestion charging
Location Name Implementation Area (km2) ITS applications
Singapore Electronic road
pricing
1975 7 Radio frequencies
and cameras
London Congestion
charge
2003 40 CCTV cameras
Stockholm Congestion tax 2006 35 Laser and
cameras
Milan Ecopass 2008 8 Digital cameras
Source: Adapted from IEA, 2009
Singapore - implemented its congestion charging system in 1975 the first urban charge system in the
world. It initially used people to check that vehicles complied with the system, but automatic vehicle
detection and payment system was implemented in 1998. The system then became known as
Electronic Road Pricing. The system works as a charged zone with a cordon ring, requiring vehicles
to make a payment each time the cordon line is crossed. The system automatically deducts a balance
from a pre-paid account, with devices in each vehicle that keep track of the driver’s available balance
(IEA, 2009). No carbon and environmental emission data was found for Singapore. Although there
has been a reported a decrease in traffic volumes during morning peak hours by 45%, and average
speeds in the area increased from 19 to 36 km/hr. (Santos et al., 2011). It was also reported that the
average total traffic decreased in the restricted zone 9% (Cervero, 1998).
London - launched its congestion charging scheme in 2003. It is a cordon zone system, which
requires private vehicles entering the congestion charging zone to pay on a daily basis. The zone was
expanded in 2007. The charge applies from 07:00 to 18:00 on weekdays with no charge at other
times. Some types of vehicles, such as electric vehicles and other low carbon emission vehicles are
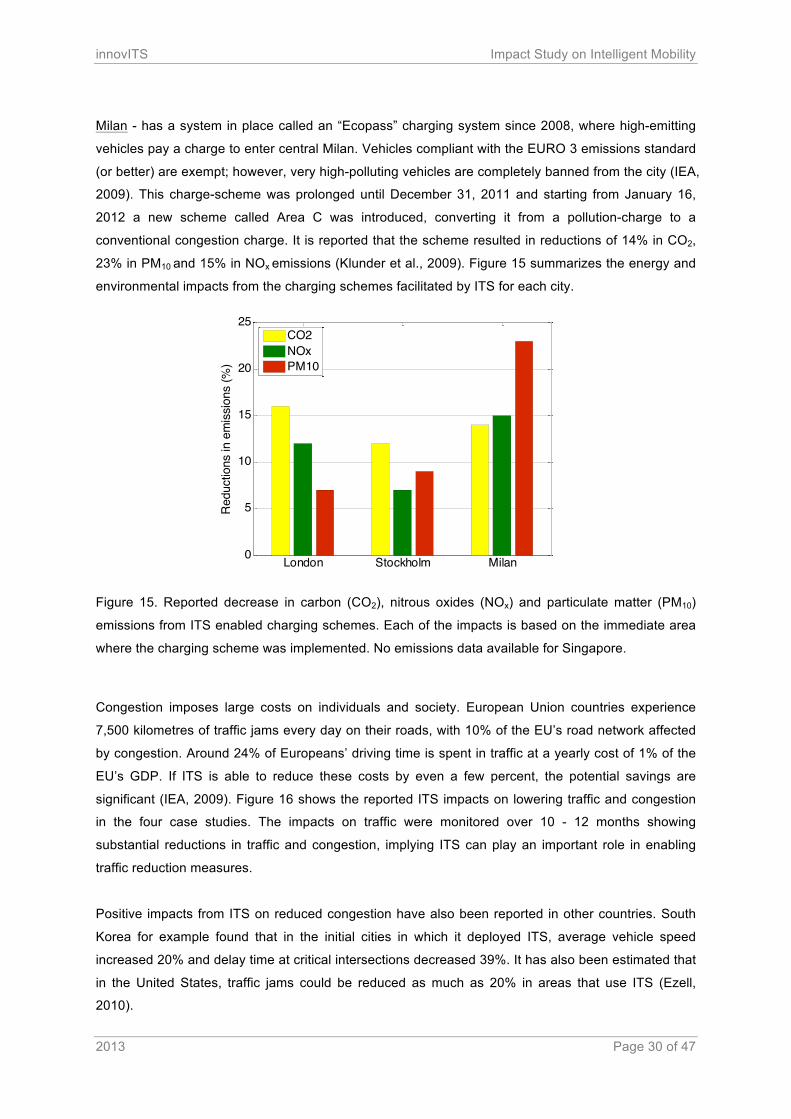
exempt from charges. It is reported that the London congestion charging zones have resulted in a
16% reduction in CO2 emissions and 12% lower emissions of NOx and 7% reductions in PM10 from
road traffic. It was also reported that there has been a 30% reduction in traffic congestion in the
charge area (Komfner and Reinhardt, 2008; USDOT, 2008; VTT, 2012).
Stockholm - initiated a trial congestion tax scheme in 2006, with a cordon system covering a large
part of the central urban area. Similar to London, revenues from the system were used partly to
expand the bus system. Park-and-ride lots were also added to key commuter corridors. In 2007,
residents voted to make the system permanent (IEA, 2009). It has been reported that the cordon
system resulted in a 22% reduction in traffic and 10 - 14% reduction in CO2 emissions, 7% reduction
in NOx and 9% in PM10 in the inner city (Klunder et al., 2009; Bunch et al., 2011).
innovITS Impact Study on Intelligent Mobility
2013 Page 30 of 47
Milan - has a system in place called an “Ecopass” charging system since 2008, where high-emitting
vehicles pay a charge to enter central Milan. Vehicles compliant with the EURO 3 emissions standard
(or better) are exempt; however, very high-polluting vehicles are completely banned from the city (IEA,
2009). This charge-scheme was prolonged until December 31, 2011 and starting from January 16,
2012 a new scheme called Area C was introduced, converting it from a pollution-charge to a
conventional congestion charge. It is reported that the scheme resulted in reductions of 14% in CO2,
23% in PM10 and 15% in NOx emissions (Klunder et al., 2009). Figure 15 summarizes the energy and
environmental impacts from the charging schemes facilitated by ITS for each city.
Figure 15. Reported decrease in carbon (CO2), nitrous oxides (NOx) and particulate matter (PM10)
emissions from ITS enabled charging schemes. Each of the impacts is based on the immediate area
where the charging scheme was implemented. No emissions data available for Singapore.
Congestion imposes large costs on individuals and society. European Union countries experience
7,500 kilometres of traffic jams every day on their roads, with 10% of the EU’s road network affected
by congestion. Around 24% of Europeans’ driving time is spent in traffic at a yearly cost of 1% of the
EU’s GDP. If ITS is able to reduce these costs by even a few percent, the potential savings are
significant (IEA, 2009). Figure 16 shows the reported ITS impacts on lowering traffic and congestion
in the four case studies. The impacts on traffic were monitored over 10 - 12 months showing
substantial reductions in traffic and congestion, implying ITS can play an important role in enabling
traffic reduction measures.
Positive impacts from ITS on reduced congestion have also been reported in other countries. South
Korea for example found that in the initial cities in which it deployed ITS, average vehicle speed
increased 20% and delay time at critical intersections decreased 39%. It has also been estimated that
in the United States, traffic jams could be reduced as much as 20% in areas that use ITS (Ezell,
2010).
London Stockholm Milan0
5
10
15
20
25
Red
uctio
ns in
em
issi
ons
(%)
CO2NOxPM10

innovITS Impact Study on Intelligent Mobility
2013 Page 31 of 47
Figure 16. Average percentage reductions in traffic vehicle kilometres within restricted areas based on
monitoring and reporting over 10-12 months Sources: Cervero, 1998; Komfner and Reinhardt, 2008;
Klunder et al., 2009.
4.1.2 Traffic Signal Control
Advanced signal control systems coordinate traffic signals across a signal network, adjusting the
lengths of signal phases based on current traffic conditions. The objective of dynamic traffic light
synchronization based on actual traffic conditions is to optimise journey times and delays in urban
areas. This is done by controlling in real-time the green-times, cycle times and offsets (green waves)
of the network’s junctions (Klunder et al., 2009). Advanced signal systems can include coordinated
signal operations across neighbouring jurisdictions, as well as centralized control of traffic signals,
which may include technologies for the later development of adaptive signal control.
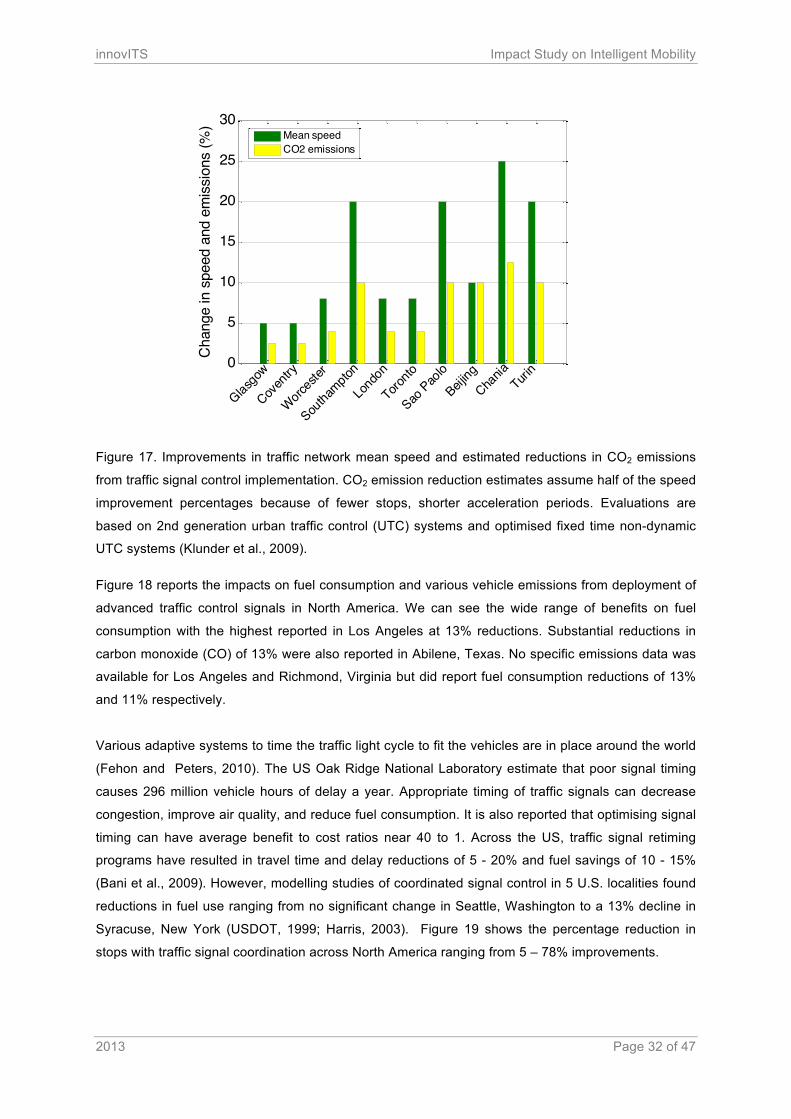
Figure 17 provides comparative evaluation data for advanced traffic light control systems across
Europe, North and South America and Asia showing improvement in mean vehicle speed and the
estimated reduction in CO2 emissions. It is assumed that the reduction of CO2 emissions equals half
of the speed improvement percentages because of fewer stops and shorter acceleration periods. We
can see that there are improvements in mean speed of approximately 5 - 25% and estimated
reductions in CO2 emissions of around 2 - 12%. However, similar evaluations were also done for
Nijmegen, Netherlands and Anaheim, US where no improvements were found. Another study
estimates that across the EU27, wide spread deployment of advanced signal control could reduce
road traffic CO2 emissions by 5 – 15% (Klunder et al., 2009).
Singapore London Stockholm Milan0
5
10
15
20
25
30
35
Aver
age
redu
ctio
n in
traf
fic v
ehic
le k
ilom
eter
s (%
)
innovITS Impact Study on Intelligent Mobility
2013 Page 32 of 47
Figure 17. Improvements in traffic network mean speed and estimated reductions in CO2 emissions
from traffic signal control implementation. CO2 emission reduction estimates assume half of the speed
improvement percentages because of fewer stops, shorter acceleration periods. Evaluations are
based on 2nd generation urban traffic control (UTC) systems and optimised fixed time non-dynamic
UTC systems (Klunder et al., 2009).
Figure 18 reports the impacts on fuel consumption and various vehicle emissions from deployment of
advanced traffic control signals in North America. We can see the wide range of benefits on fuel
consumption with the highest reported in Los Angeles at 13% reductions. Substantial reductions in
carbon monoxide (CO) of 13% were also reported in Abilene, Texas. No specific emissions data was
available for Los Angeles and Richmond, Virginia but did report fuel consumption reductions of 13%
and 11% respectively.
Various adaptive systems to time the traffic light cycle to fit the vehicles are in place around the world
(Fehon and Peters, 2010). The US Oak Ridge National Laboratory estimate that poor signal timing
causes 296 million vehicle hours of delay a year. Appropriate timing of traffic signals can decrease
congestion, improve air quality, and reduce fuel consumption. It is also reported that optimising signal
timing can have average benefit to cost ratios near 40 to 1. Across the US, traffic signal retiming
programs have resulted in travel time and delay reductions of 5 - 20% and fuel savings of 10 - 15%
(Bani et al., 2009). However, modelling studies of coordinated signal control in 5 U.S. localities found
reductions in fuel use ranging from no significant change in Seattle, Washington to a 13% decline in
Syracuse, New York (USDOT, 1999; Harris, 2003). Figure 19 shows the percentage reduction in
stops with traffic signal coordination across North America ranging from 5 – 78% improvements.
0
5
10
15
20
25
30
Glasgo
w
Coven
try
Worces
ter
Southa
mpton
Lond
on
Toronto
Sao Pao
lo
Beijing
Chania
Turin
Cha
nge
in s
peed
and
em
issi
ons
(%)
Mean speedCO2 emissions
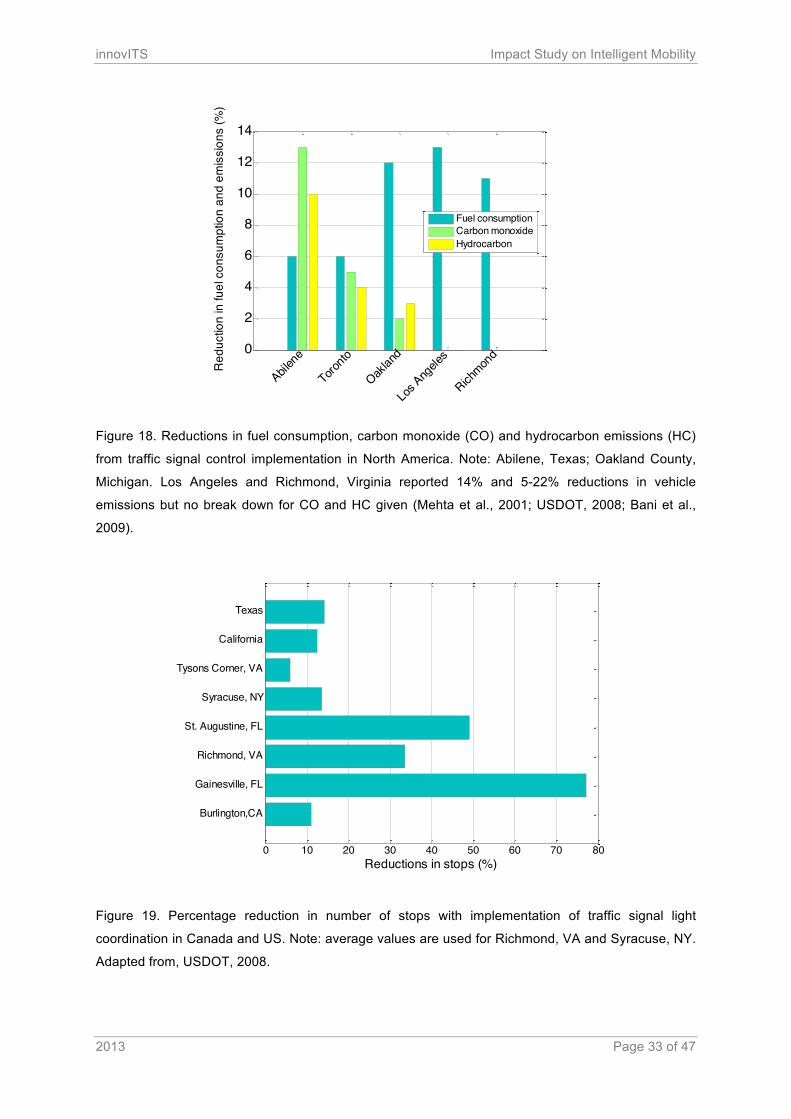
innovITS Impact Study on Intelligent Mobility
2013 Page 33 of 47
Figure 18. Reductions in fuel consumption, carbon monoxide (CO) and hydrocarbon emissions (HC)
from traffic signal control implementation in North America. Note: Abilene, Texas; Oakland County,
Michigan. Los Angeles and Richmond, Virginia reported 14% and 5-22% reductions in vehicle
emissions but no break down for CO and HC given (Mehta et al., 2001; USDOT, 2008; Bani et al.,
2009).
Figure 19. Percentage reduction in number of stops with implementation of traffic signal light
coordination in Canada and US. Note: average values are used for Richmond, VA and Syracuse, NY.
Adapted from, USDOT, 2008.
0
2
4
6
8
10
12
14
Abilene
Toronto
Oaklan
d
Los A
ngele
s
Richmon
d
Red
uctio
n in
fuel
con
sum
ptio
n an
d em
issi
ons
(%)
Fuel consumptionCarbon monoxideHydrocarbon
0 10 20 30 40 50 60 70 80
Burlington,CA
Gainesville, FL
Richmond, VA
St. Augustine, FL
Syracuse, NY
Tysons Corner, VA
California
Texas
Reductions in stops (%)
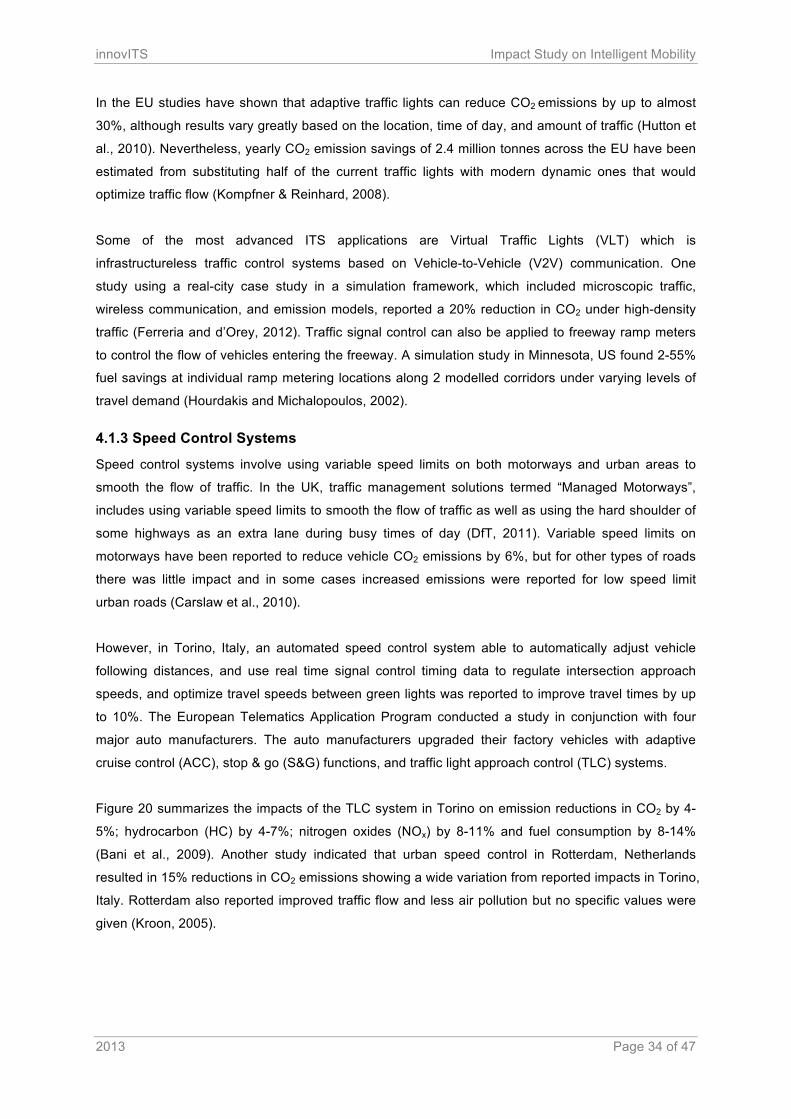
innovITS Impact Study on Intelligent Mobility
2013 Page 34 of 47
In the EU studies have shown that adaptive traffic lights can reduce CO2 emissions by up to almost
30%, although results vary greatly based on the location, time of day, and amount of traffic (Hutton et
al., 2010). Nevertheless, yearly CO2 emission savings of 2.4 million tonnes across the EU have been
estimated from substituting half of the current traffic lights with modern dynamic ones that would
optimize traffic flow (Kompfner & Reinhard, 2008).
Some of the most advanced ITS applications are Virtual Traffic Lights (VLT) which is
infrastructureless traffic control systems based on Vehicle-to-Vehicle (V2V) communication. One
study using a real-city case study in a simulation framework, which included microscopic traffic,
wireless communication, and emission models, reported a 20% reduction in CO2 under high-density
traffic (Ferreria and d’Orey, 2012). Traffic signal control can also be applied to freeway ramp meters
to control the flow of vehicles entering the freeway. A simulation study in Minnesota, US found 2-55%
fuel savings at individual ramp metering locations along 2 modelled corridors under varying levels of
travel demand (Hourdakis and Michalopoulos, 2002).
4.1.3 Speed Control Systems
Speed control systems involve using variable speed limits on both motorways and urban areas to
smooth the flow of traffic. In the UK, traffic management solutions termed “Managed Motorways”,
includes using variable speed limits to smooth the flow of traffic as well as using the hard shoulder of
some highways as an extra lane during busy times of day (DfT, 2011). Variable speed limits on
motorways have been reported to reduce vehicle CO2 emissions by 6%, but for other types of roads
there was little impact and in some cases increased emissions were reported for low speed limit
urban roads (Carslaw et al., 2010).
However, in Torino, Italy, an automated speed control system able to automatically adjust vehicle
following distances, and use real time signal control timing data to regulate intersection approach
speeds, and optimize travel speeds between green lights was reported to improve travel times by up
to 10%. The European Telematics Application Program conducted a study in conjunction with four
major auto manufacturers. The auto manufacturers upgraded their factory vehicles with adaptive
cruise control (ACC), stop & go (S&G) functions, and traffic light approach control (TLC) systems.
Figure 20 summarizes the impacts of the TLC system in Torino on emission reductions in CO2 by 4-
5%; hydrocarbon (HC) by 4-7%; nitrogen oxides (NOx) by 8-11% and fuel consumption by 8-14%
(Bani et al., 2009). Another study indicated that urban speed control in Rotterdam, Netherlands
resulted in 15% reductions in CO2 emissions showing a wide variation from reported impacts in Torino,
Italy. Rotterdam also reported improved traffic flow and less air pollution but no specific values were
given (Kroon, 2005).
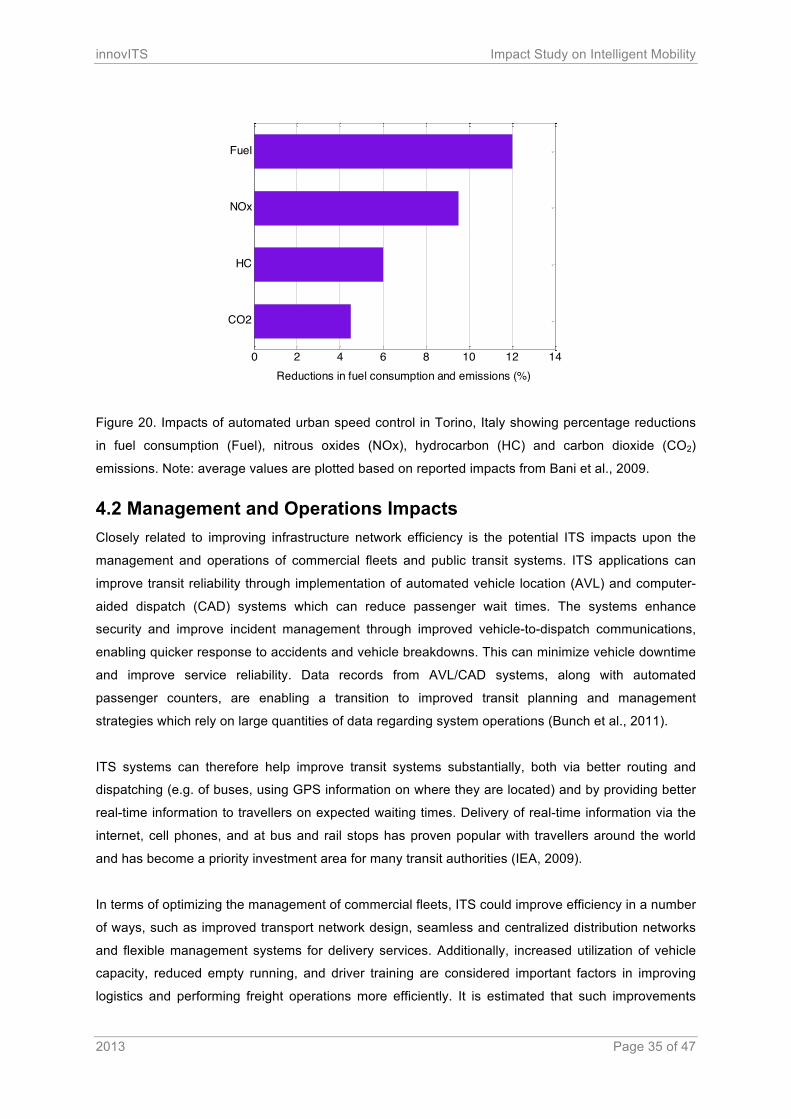
innovITS Impact Study on Intelligent Mobility
2013 Page 35 of 47
Figure 20. Impacts of automated urban speed control in Torino, Italy showing percentage reductions
in fuel consumption (Fuel), nitrous oxides (NOx), hydrocarbon (HC) and carbon dioxide (CO2)
emissions. Note: average values are plotted based on reported impacts from Bani et al., 2009.
4.2 Management and Operations Impacts Closely related to improving infrastructure network efficiency is the potential ITS impacts upon the
management and operations of commercial fleets and public transit systems. ITS applications can
improve transit reliability through implementation of automated vehicle location (AVL) and computer-
aided dispatch (CAD) systems which can reduce passenger wait times. The systems enhance
security and improve incident management through improved vehicle-to-dispatch communications,
enabling quicker response to accidents and vehicle breakdowns. This can minimize vehicle downtime
and improve service reliability. Data records from AVL/CAD systems, along with automated
passenger counters, are enabling a transition to improved transit planning and management
strategies which rely on large quantities of data regarding system operations (Bunch et al., 2011).
ITS systems can therefore help improve transit systems substantially, both via better routing and
dispatching (e.g. of buses, using GPS information on where they are located) and by providing better
real-time information to travellers on expected waiting times. Delivery of real-time information via the
internet, cell phones, and at bus and rail stops has proven popular with travellers around the world
and has become a priority investment area for many transit authorities (IEA, 2009).
In terms of optimizing the management of commercial fleets, ITS could improve efficiency in a number
of ways, such as improved transport network design, seamless and centralized distribution networks
and flexible management systems for delivery services. Additionally, increased utilization of vehicle
capacity, reduced empty running, and driver training are considered important factors in improving
logistics and performing freight operations more efficiently. It is estimated that such improvements
0 2 4 6 8 10 12 14
CO2
HC
NOx
Fuel
Reductions in fuel consumption and emissions (%)
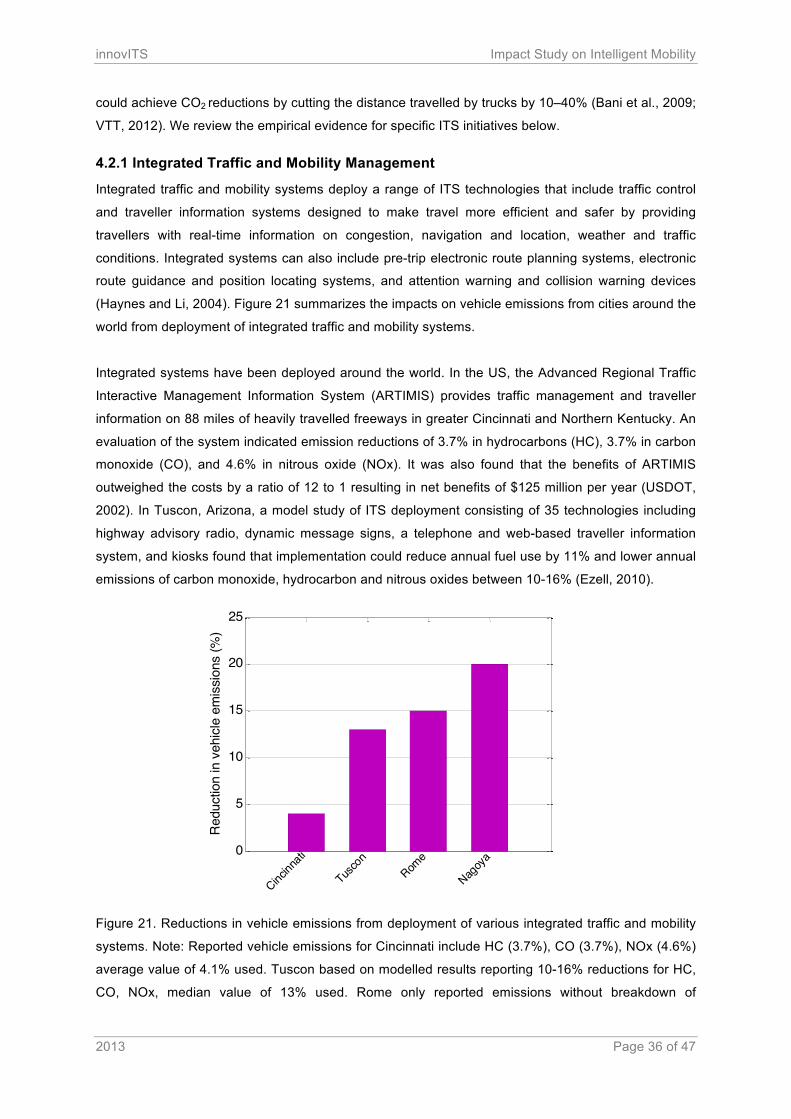
innovITS Impact Study on Intelligent Mobility
2013 Page 36 of 47
could achieve CO2 reductions by cutting the distance travelled by trucks by 10–40% (Bani et al., 2009;
VTT, 2012). We review the empirical evidence for specific ITS initiatives below.
4.2.1 Integrated Traffic and Mobility Management
Integrated traffic and mobility systems deploy a range of ITS technologies that include traffic control
and traveller information systems designed to make travel more efficient and safer by providing
travellers with real-time information on congestion, navigation and location, weather and traffic
conditions. Integrated systems can also include pre-trip electronic route planning systems, electronic
route guidance and position locating systems, and attention warning and collision warning devices
(Haynes and Li, 2004). Figure 21 summarizes the impacts on vehicle emissions from cities around the
world from deployment of integrated traffic and mobility systems.
Integrated systems have been deployed around the world. In the US, the Advanced Regional Traffic
Interactive Management Information System (ARTIMIS) provides traffic management and traveller
information on 88 miles of heavily travelled freeways in greater Cincinnati and Northern Kentucky. An
evaluation of the system indicated emission reductions of 3.7% in hydrocarbons (HC), 3.7% in carbon
monoxide (CO), and 4.6% in nitrous oxide (NOx). It was also found that the benefits of ARTIMIS
outweighed the costs by a ratio of 12 to 1 resulting in net benefits of $125 million per year (USDOT,
2002). In Tuscon, Arizona, a model study of ITS deployment consisting of 35 technologies including
highway advisory radio, dynamic message signs, a telephone and web-based traveller information
system, and kiosks found that implementation could reduce annual fuel use by 11% and lower annual
emissions of carbon monoxide, hydrocarbon and nitrous oxides between 10-16% (Ezell, 2010).
Figure 21. Reductions in vehicle emissions from deployment of various integrated traffic and mobility
systems. Note: Reported vehicle emissions for Cincinnati include HC (3.7%), CO (3.7%), NOx (4.6%)
average value of 4.1% used. Tuscon based on modelled results reporting 10-16% reductions for HC,
CO, NOx, median value of 13% used. Rome only reported emissions without breakdown of
0
5
10
15
20
25
Cincinn
ati
Tusco
nRom
e
Nagoy
a
Red
uctio
n in
veh
icle
em
issi
ons
(%)
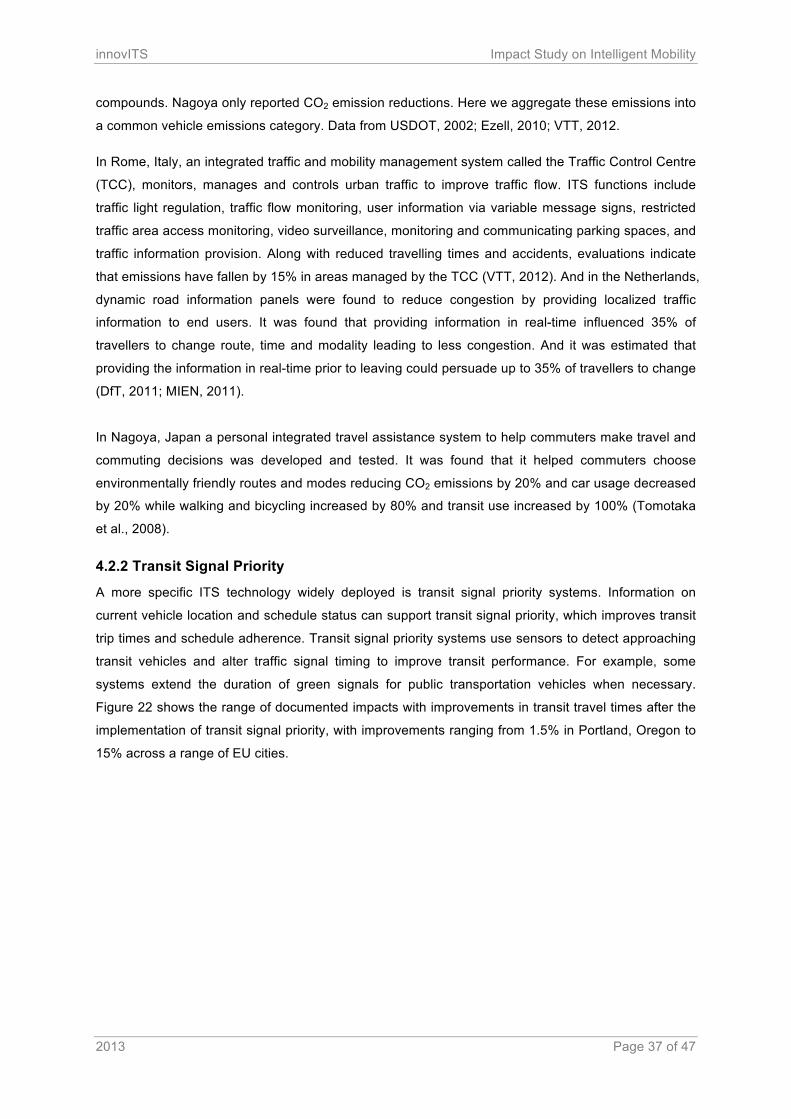
innovITS Impact Study on Intelligent Mobility
2013 Page 37 of 47
compounds. Nagoya only reported CO2 emission reductions. Here we aggregate these emissions into
a common vehicle emissions category. Data from USDOT, 2002; Ezell, 2010; VTT, 2012.
In Rome, Italy, an integrated traffic and mobility management system called the Traffic Control Centre
(TCC), monitors, manages and controls urban traffic to improve traffic flow. ITS functions include
traffic light regulation, traffic flow monitoring, user information via variable message signs, restricted
traffic area access monitoring, video surveillance, monitoring and communicating parking spaces, and
traffic information provision. Along with reduced travelling times and accidents, evaluations indicate
that emissions have fallen by 15% in areas managed by the TCC (VTT, 2012). And in the Netherlands,
dynamic road information panels were found to reduce congestion by providing localized traffic
information to end users. It was found that providing information in real-time influenced 35% of
travellers to change route, time and modality leading to less congestion. And it was estimated that
providing the information in real-time prior to leaving could persuade up to 35% of travellers to change
(DfT, 2011; MIEN, 2011).
In Nagoya, Japan a personal integrated travel assistance system to help commuters make travel and
commuting decisions was developed and tested. It was found that it helped commuters choose
environmentally friendly routes and modes reducing CO2 emissions by 20% and car usage decreased
by 20% while walking and bicycling increased by 80% and transit use increased by 100% (Tomotaka
et al., 2008).
4.2.2 Transit Signal Priority
A more specific ITS technology widely deployed is transit signal priority systems. Information on
current vehicle location and schedule status can support transit signal priority, which improves transit
trip times and schedule adherence. Transit signal priority systems use sensors to detect approaching
transit vehicles and alter traffic signal timing to improve transit performance. For example, some
systems extend the duration of green signals for public transportation vehicles when necessary.
Figure 22 shows the range of documented impacts with improvements in transit travel times after the
implementation of transit signal priority, with improvements ranging from 1.5% in Portland, Oregon to
15% across a range of EU cities.
innovITS Impact Study on Intelligent Mobility
2013 Page 38 of 47
Figure 22. Travel time reduction benefits with transit signal priority implementation across various
countries. Note: specific EU and Chinese cities not provided from data source, it is assumed that the
figures given represent a median case scenario across the cities/city involved. Data from (Maccubin
et al., 2008; Bunch et al., 2011)
4.2.3 Trip Planning Systems
ITS enabled trip departure planning systems can optimize commercial fleet scheduling based on real-
time and predicted traffic conditions. This has the potential to reduce the overall fleet journey time
saving fuel and reducing emissions. These systems rely on a number of telematics which use remote
devices on freight vehicles, real-time traffic data and communication links between the vehicles, and a
control centre to manage and monitor freight operations. These systems also have the capability to
present a large amount of data in a useable format to inform freight managers. This can lead to
improvements in fleet efficiency and productivity due to reductions in fleet mileage and reduced
operational costs (Klunder et al., 2009).
Vendors claim these systems can result in 30% improvements in journey times and fuel consumption.
Table 6 summarizes real world evaluations of these systems showing lower improvements than 30%
but substantial gains nonetheless ranging from 8 – 16% reductions in fuel consumption after
deploying trip planning systems.
0 2 4 6 8 10 12 14 16
EU Cities
Toronto
Sapporo
Helsinki
China
Los Angeles
Seattle
Portland
Arlington
Ann Arbour
Travel time reduction (%)
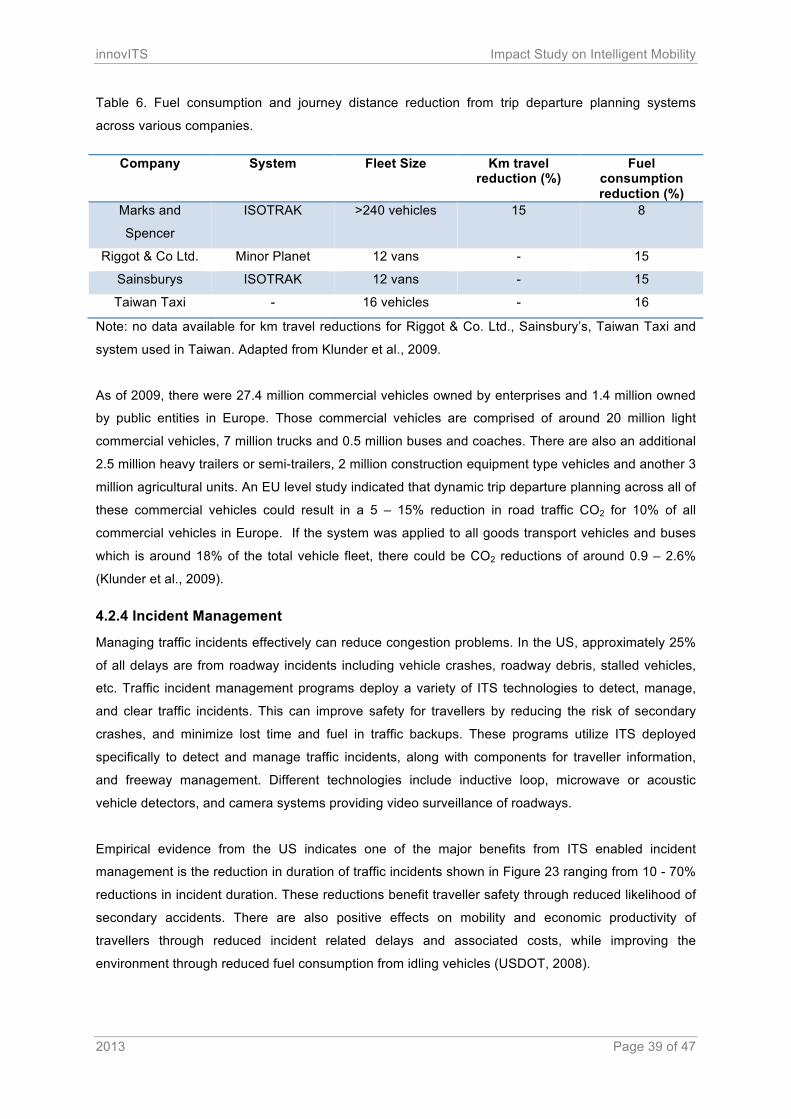
innovITS Impact Study on Intelligent Mobility
2013 Page 39 of 47
Table 6. Fuel consumption and journey distance reduction from trip departure planning systems
across various companies.
Company System Fleet Size Km travel reduction (%)
Fuel consumption reduction (%)
Marks and
Spencer
ISOTRAK >240 vehicles 15 8
Riggot & Co Ltd. Minor Planet 12 vans - 15
Sainsburys ISOTRAK 12 vans - 15
Taiwan Taxi - 16 vehicles - 16
Note: no data available for km travel reductions for Riggot & Co. Ltd., Sainsbury’s, Taiwan Taxi and
system used in Taiwan. Adapted from Klunder et al., 2009.
As of 2009, there were 27.4 million commercial vehicles owned by enterprises and 1.4 million owned
by public entities in Europe. Those commercial vehicles are comprised of around 20 million light
commercial vehicles, 7 million trucks and 0.5 million buses and coaches. There are also an additional
2.5 million heavy trailers or semi-trailers, 2 million construction equipment type vehicles and another 3
million agricultural units. An EU level study indicated that dynamic trip departure planning across all of
these commercial vehicles could result in a 5 – 15% reduction in road traffic CO2 for 10% of all
commercial vehicles in Europe. If the system was applied to all goods transport vehicles and buses
which is around 18% of the total vehicle fleet, there could be CO2 reductions of around 0.9 – 2.6%
(Klunder et al., 2009).
4.2.4 Incident Management
Managing traffic incidents effectively can reduce congestion problems. In the US, approximately 25%
of all delays are from roadway incidents including vehicle crashes, roadway debris, stalled vehicles,
etc. Traffic incident management programs deploy a variety of ITS technologies to detect, manage,
and clear traffic incidents. This can improve safety for travellers by reducing the risk of secondary
crashes, and minimize lost time and fuel in traffic backups. These programs utilize ITS deployed
specifically to detect and manage traffic incidents, along with components for traveller information,
and freeway management. Different technologies include inductive loop, microwave or acoustic
vehicle detectors, and camera systems providing video surveillance of roadways.
Empirical evidence from the US indicates one of the major benefits from ITS enabled incident
management is the reduction in duration of traffic incidents shown in Figure 23 ranging from 10 - 70%
reductions in incident duration. These reductions benefit traveller safety through reduced likelihood of
secondary accidents. There are also positive effects on mobility and economic productivity of
travellers through reduced incident related delays and associated costs, while improving the
environment through reduced fuel consumption from idling vehicles (USDOT, 2008).
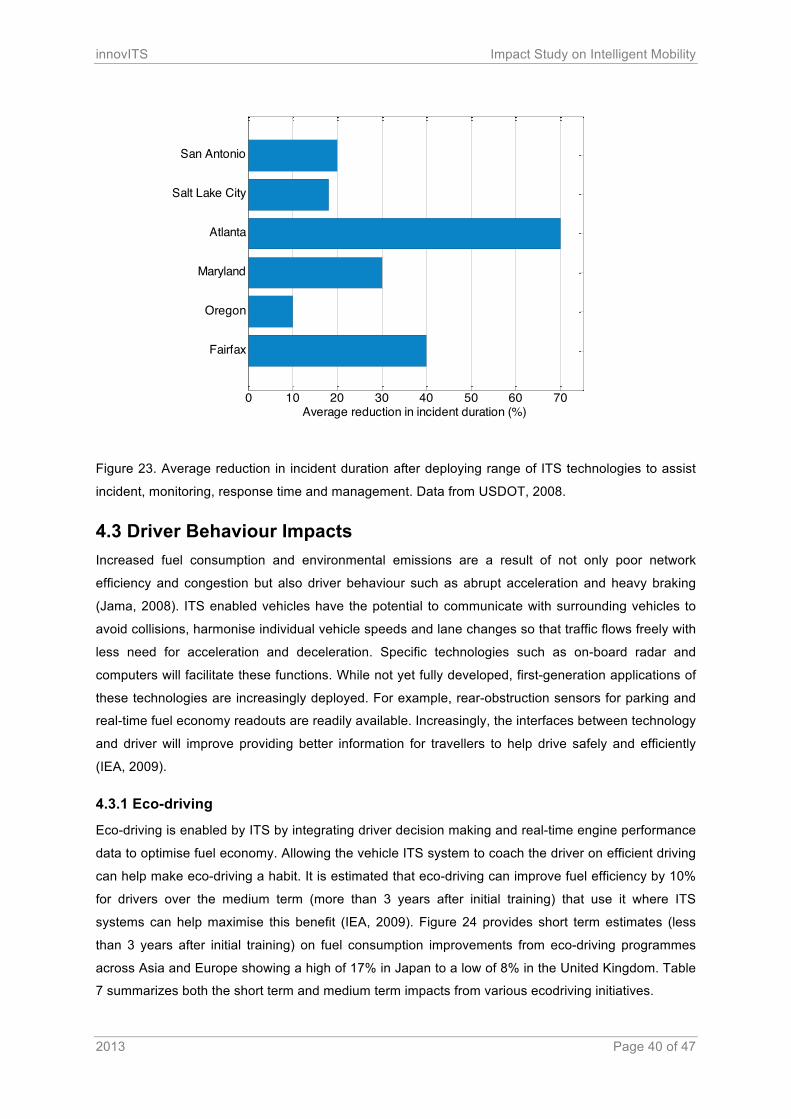
innovITS Impact Study on Intelligent Mobility
2013 Page 40 of 47
Figure 23. Average reduction in incident duration after deploying range of ITS technologies to assist
incident, monitoring, response time and management. Data from USDOT, 2008.
4.3 Driver Behaviour Impacts Increased fuel consumption and environmental emissions are a result of not only poor network
efficiency and congestion but also driver behaviour such as abrupt acceleration and heavy braking
(Jama, 2008). ITS enabled vehicles have the potential to communicate with surrounding vehicles to
avoid collisions, harmonise individual vehicle speeds and lane changes so that traffic flows freely with
less need for acceleration and deceleration. Specific technologies such as on-board radar and
computers will facilitate these functions. While not yet fully developed, first-generation applications of
these technologies are increasingly deployed. For example, rear-obstruction sensors for parking and
real-time fuel economy readouts are readily available. Increasingly, the interfaces between technology
and driver will improve providing better information for travellers to help drive safely and efficiently
(IEA, 2009).
4.3.1 Eco-driving
Eco-driving is enabled by ITS by integrating driver decision making and real-time engine performance
data to optimise fuel economy. Allowing the vehicle ITS system to coach the driver on efficient driving
can help make eco-driving a habit. It is estimated that eco-driving can improve fuel efficiency by 10%
for drivers over the medium term (more than 3 years after initial training) that use it where ITS
systems can help maximise this benefit (IEA, 2009). Figure 24 provides short term estimates (less
than 3 years after initial training) on fuel consumption improvements from eco-driving programmes
across Asia and Europe showing a high of 17% in Japan to a low of 8% in the United Kingdom. Table
7 summarizes both the short term and medium term impacts from various ecodriving initiatives.
0 10 20 30 40 50 60 70
Fairfax
Oregon
Maryland
Atlanta
Salt Lake City
San Antonio
Average reduction in incident duration (%)
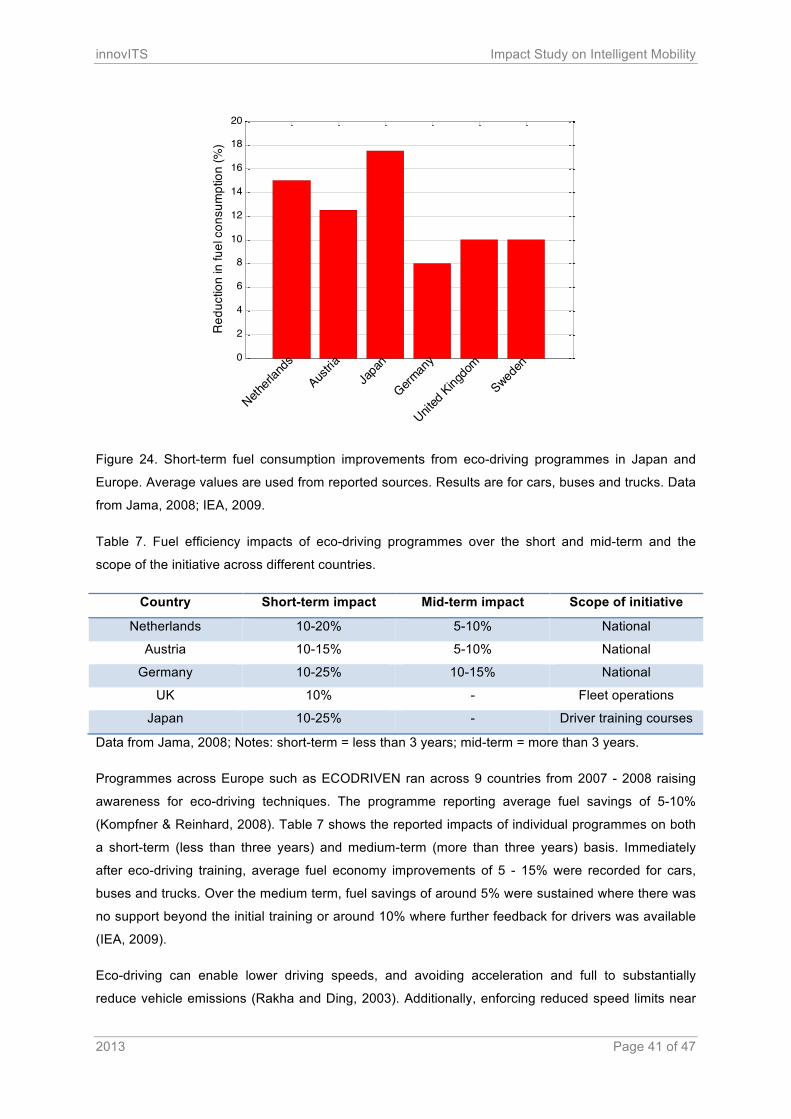
innovITS Impact Study on Intelligent Mobility
2013 Page 41 of 47
Figure 24. Short-term fuel consumption improvements from eco-driving programmes in Japan and
Europe. Average values are used from reported sources. Results are for cars, buses and trucks. Data
from Jama, 2008; IEA, 2009.
Table 7. Fuel efficiency impacts of eco-driving programmes over the short and mid-term and the
scope of the initiative across different countries.
Country Short-term impact Mid-term impact Scope of initiative
Netherlands 10-20% 5-10% National
Austria 10-15% 5-10% National
Germany 10-25% 10-15% National
UK 10% - Fleet operations
Japan 10-25% - Driver training courses
Data from Jama, 2008; Notes: short-term = less than 3 years; mid-term = more than 3 years.
Programmes across Europe such as ECODRIVEN ran across 9 countries from 2007 - 2008 raising
awareness for eco-driving techniques. The programme reporting average fuel savings of 5-10%
(Kompfner & Reinhard, 2008). Table 7 shows the reported impacts of individual programmes on both
a short-term (less than three years) and medium-term (more than three years) basis. Immediately
after eco-driving training, average fuel economy improvements of 5 - 15% were recorded for cars,
buses and trucks. Over the medium term, fuel savings of around 5% were sustained where there was
no support beyond the initial training or around 10% where further feedback for drivers was available
(IEA, 2009).
Eco-driving can enable lower driving speeds, and avoiding acceleration and full to substantially
reduce vehicle emissions (Rakha and Ding, 2003). Additionally, enforcing reduced speed limits near
0
2
4
6
8
10
12
14
16
18
20
Netherl
ands
Austria
Japa
n
German
y
United
Kingdo
m
Sweden
Red
uctio
n in
fuel
con
sum
ptio
n (%
)
innovITS Impact Study on Intelligent Mobility
2013 Page 42 of 47
urban areas by the use of ITS enabled automatic number plate recognition can reduce the
environmental impact from vehicle emissions (MIEN, 2011).
4.3.2 Intelligent Speed Control
Closely related to eco-driving initiatives are intelligent speed control systems that can limit maximum
vehicle speed via a signal from the infrastructure to a vehicle. An overview of studies conducted in the
United Kingdom, Finland, the Netherlands, Sweden, Denmark, and Australia reported that when all
vehicles are equipped, mandatory dynamic automatic controlling could reduce fuel consumption and
harmful emissions by 4-11% (Morsink et al., 2008). Additionally, in Los Angeles, California, a
simulation study transmitted optimal speed values to an in-vehicle display and drivers were able to
limit vehicle speeds to those recommended by the system servers. To control the study a second
vehicle was operated in the same traffic except the recommended speed information was not
provided. The study found that eco-driving with dynamic speed recommendations can reduce fuel
consumption by 10 – 20% without increasing freeway travel times (Barth and Boriboonsomsin, 2009).
In the Netherlands, a dynamically adjusting speed suggestion system involving dynamic road signs
and in-car display for reaching traffic lights when they are green was implemented on some roads
(MIEN, 2011). The system gives the end-user speed advice based on the time of day, car in front,
place in queue, place on road, and possible congestion at an upcoming intersection. Carbon dioxide
emissions were reported to have been reduced by 17% compared to vehicle-adaptive cycle time
controllers in a limited number of emission measurements (VTT, 2012).
4.3.3 Driver Information Systems
Advanced communications have improved the dissemination of information to the driving public.
Drivers are now able to receive relevant information on location-specific traffic conditions in a number
of ways including in-vehicle displays and other specialized information transmitted to individual
vehicles. Simulation models show that real-time on-board driver assistance systems that recommend
proper following distances can improve fuel economy by approximately 10%. However, the system
would be more suitable for urban roadways where traffic signals and congestion are more frequent
(Kamal, 2009).
Additionally, pre-trip traveller information provided via internet web sites, and other wireless devices,
including mobile telephone services, television, radio, or kiosks can assist drivers to make more
informed decisions for trip departure, route choice, and mode of travel. In Boston, Massachusetts, a
modelling study estimated that changes in travel behaviour due to better traveller information could
result in a 25% reduction in volatile organic compounds, a 1.5% decline in nitrogen oxides (NOx), and
a 33% decrease in carbon monoxide (CO) (USDOT, 2008). However, it should be noted that these
impacts are based on modelling studies since it would be difficult to determine the specific impact of
these systems since they are supporting measures. Nevertheless, as these technologies are
improved and the interface with drivers becomes more effective, they could have a range of benefits
including driver safety along with improved fuel consumption and lower emissions.
innovITS Impact Study on Intelligent Mobility
2013 Page 43 of 47
5. Summary & Next Steps This report developed a novel sustainability impact framework to assess the potential impacts from
widespread deployment of ITS technologies. The framework is multidimensional and sufficiently
flexible encompassing the interdependencies between 1) energy and environment, 2) mobility and
efficiency, 2) productivity, and 3) safety. Each of these domains intersects with intelligent mobility and
the potential role of ITS for meeting broader UK and international policy to improve the performance
of transport systems.
Given the global and UK policy agenda to reduce energy demand, carbon emissions and mitigate
environmental impacts, the potential energy and environment impacts from ITS were assessed in
depth based on detailed case analysis drawing from empirical studies around the world. It was found
that the deployment of ITS can have positive impacts on transport systems across a range of modes,
infrastructure and activities. For measures related to network efficiency there are reductions in CO2
emissions of 10 - 15%; other reductions in environmental emissions including CO, NOx HC, PM10
ranged from 2 – 20%; fuel consumption decreased from 5 – 15%; traffic reduced from 12 – 30% and
average vehicle speeds increased from 5 – 25%.
ITS measures related to operations and management were found to reduce vehicle emissions from 5
– 20%, improve travel time from 2 – 15% and reduce fuel consumption 8 – 18%. Technologies related
to influencing driver behaviour primarily focused on eco-driving initiatives where substantial case
evidence indicates fuel efficiency improvements of 8 – 18%. All of these findings are based on
reported results documented in industry, government and academic literature, and so should be taken
with some precaution since access to the original data and methodological detail was not available.
But despite this shortcoming, based on a range of literature, what can be concluded with some
certainty is that the deployment of ITS technologies has substantial potential to positively contribute to
achieving a more sustainable transport system in accordance with UK and global policy initiatives.
The framework developed in this report could be further used as a benchmark in the future to assess
progress in the field, or a methodological approach to lead integrated analysis of the interconnections
between each impact domain, or used to pursue more detailed analysis in any one of the domains.
The quantitative data reported here can also serve as the basis for more detailed modelling work, or
other forecasting approaches to assess the future impacts of widespread ITS deployment across a
range of geographical and temporal scales. The framework also highlights the important
interconnection between sustainability impacts and an emerging paradigm of intelligent or smart
mobility, which will have important implications for optimizing urban growth and development. In this
regard, the sustainability framework provides a comprehensive and integrated way of thinking about
the future evolution and impact of intelligent mobility enabled by specific ITS initiatives.
innovITS Impact Study on Intelligent Mobility
2013 Page 44 of 47
6. References 1. ACUK (2010) Intelligent Mobility – A National Need? Automotive Council, UK. 2. Bani, J., Lopez, V., Dapena, P. (2000) The potential of Intelligent Transport Systems for
reducing road transport related greenhouse gas emissions. European Commission, DG Enterprise & Industry, No. 02/2009
3. Barth, M., Boriboonsomsin, K. (2009) Energy and emissions impacts of a freeway-based dynamic eco-driving system. Transportation Research Part D: Transport and Environment, Vol. 14, No. 6.
4. Bunch et al., (2011) Intelligent transportations systems – Benefits, costs, deployment and lessons learned: 2011 Update. US Department of Transportation, Research and Innovative Technology Administration, Washington, DC.
5. Carslaw, D. C., et al., (2010) Comprehensive analysis of the carbon impacts of vehicle intelligent speed control. Atmospheric Environment, 44, 2674 – 2680.
6. Cervero, R. (1998) The Transit Metropolis, Island Press, Washington, D.C., p. 169, ISBN 1-55963-591-6 Chapter 6/The Master Planned Transit Metropolis: Singapore
7. DfT (2011). Intelligent Transport Systems in the United Kingdom: Initial Report – as required by European Union Directive 2010/40/EU. Department for Transport, UK.
8. DTI (2007) Meeting the Challenge – A White Paper on Energy. Department of Trade and Industry, UK.
9. EC (2007) Green Paper: Towards a New Culture for Urban Mobility. European Commission, URL: http://eur-lex.europa.eu/LexUriServ/site/en/com/2007/ com2007_0551en01.pdf.
10. EC (2008) European Energy and Transport: Trends to 2030. URL: http:// ec.europa.eu/dgs/energy_transport/figures/trends_2030_update_2007/energy_transport_trends_2030_update_2007_en.pdf.
11. EC (2011). Roadmap to a Single European Transport Area – Towards a competitive and resource efficient transport system. European Commission. URL: http://eur-lex.europa.eu/LexUriServ/Lex UriServ.do?uri=COM:2011:0144:FIN:EN:PDF.
12. Ezell, S. (2010). Intelligent transport systems. The Information Technology and Innovation Fund. Washington, USA.
13. Fehon, K., Peters, J. (2010). Adaptive Traffic Signals, Comparison and Case Studies. Western ITE Annual Meeting, San Francisco, US.
14. Ferreira, M., d’Orey, P. M. (2012) On the impact of virtual traffic lights on carbon emissions mitigation. IEEE Transactions on Intelligent Transportation Systems, 13, 284 - 295.
15. Frost and Sullivan (2010). A Smarter transportation system for the 21st century. Frost and Sullivan White Paper.
16. GAO (2005) Highway Congestion: Intelligent Transportation Systems, Promise for Managing Congestion Falls Short. US Government Accountability Office. GAO-05-943 URL: http://www.gao.gov/new.items/d05943.pdf.
17. Harris (2003) Syracuse Signal Interconnect Project: Before and After Analysis Final Report, Prepared by DMJM Harris for the New York State DOT. Syracuse, NY. September 2003. Benefits ID: 2004-00273
18. Haynes, K. E., Li, M. (2004) Analytical alternatives in intelligent transportation system (ITS) evaluation. Economic Impacts of Intelligent Transportation Systems: Innovations and Case Studies. Research in Transportation Economics, Volume 8, 127–149.
19. Hickson, A. (2006) Motor vehicle insurance rating with pseudo emissions coverage. Ecological Economics 58, 146– 159.
20. Hilty, L. M., et al., (2006) The relevance of information and communication technologies for environmental sustainability - A prospective simulation study. Environmental Modelling & Software, 21: 1618 – 1629.
innovITS Impact Study on Intelligent Mobility
2013 Page 45 of 47
21. Hourdakis, J., Michalopoulos, P. (2002). Evaluation of Ramp Meter Control Effectiveness in Two Twin Cities Freeways. Transportation Research Board. Washington, DC. 13–17 January 2002. Benefits ID: 2002-00237
22. Hutton, J. M., Bokenkroger, C. D., Meyer, M. M. (2010). Evaluation of an Adaptive Traffic Signal System: Route 291 in Lee's Summit, Missouri. URL: http://rhythmtraffic.com/wp-content/uploads/2010/05/route-291-study.pdf.
23. Hull, A. (2008) Policy integration: What will it take to achieve more sustainable transport solutions in cities? Transport Policy, 15: 94–103
24. IEA (2008) Energy Technology Perspectives (International Energy Agency, 2008). 25. IEA (2009) Transport, Energy and CO2 – Moving Towards Sustainability. International Energy
Agency, Paris, France. 26. IEA (2010) World Energy Outlook. International Energy Agency, Paris, France. 27. IEA (2010a) Transport Energy Efficiency – Implementation of IEA Recommendations since
2009 and Next Steps. Paris, France. 28. Jama (2008) Reducing CO2 emissions in the global road transport sector. Japan Automobile
Manufacturers Association, Inc. Tokyo, Japan. 29. Janota, A., Dado, M., Spalek, J. (2012) Greening dimension of intelligent transport. Journal of
Green Engineering, 55–66. 30. Kamal, M.A.S., et al. (2009) Development of Ecological Driving Assist System: Model
Predictive Approach in Vehicle Control. Paper Presented at the 16th ITS World Congress. Stockholm, Sweden.
31. 21–25 September 2009. Benefit ID: 2010-00645 32. Kennedy, C., et al., (2005) The Four Pillars of Sustainable Urban Transportation, Transport
Reviews, 25: 393–414. 33. Klunder, J., et al., (2009) Impact of Information and Communication Technologies on Energy
Efficiency in Road Transport - Final Report. European Commission, No. 034.20498. 34. Kompfner, P., Reinhard, W. (2008). ICT for clean and efficient mobility. eSafety Forum
Working Group ICT for Clean and Efficient Mobility, Brussels, Belgium. 35. Kroon, M. (2005). Rotterdam speed control zone. UK Department for Environment, Food and
Rural Affairs, London, UK. 36. Laffont, J. J. (2008). Externalities. The New Palgrave Dictionary of Economics, 2nd Ed. (Eds.
Durlauf, S. N., Blume, L. E.) Palgrave Macmillan. 37. Litman, T. (2007) “Developing Indicators For Comprehensive And Sustainable Transport
Planning,” Transportation Research Record 2017, TRB, pp. 10-15. 38. Maciulis, A., Vasiliauskas, A.V., Jakubauskas, G. (2009) The impact of transport on the
competitiveness of national economy. Transport, 24: 93 – 99. 39. Maibach, M. et al., (2008) Handbook on Estimation of External Costs in the Transport Sector.
European Commission, Internalisation Measures and Policies for All external Cost of Transport. URL: http://ec.europa. eu/transport/sustainable/doc/2008_costs_handbook.pdf.
40. Mehta, T., Mahmassani, H. S., Bhat, C. (2001) Methodologies for evaluating environmental benefits of intelligent transport systems. Centre for Transportation Research, University of Austin, Texas.
41. Meyer, H. (2008) Cooperative mobility is our common vision. ERTICO – ITS Europe. Intelligent Transport Systems. Your roadmap for accelerated deployment, Logica Document IDT/ITS/Ab/0308/B, 22 pp., 2008.
42. MIEN (2011) ITS in the Netherlands. Ministry of Infrastructure and the Environment the Netherlands. (2011). URL: http://www.connekt.nl/uploads/2011/09/its-in-the-netherlands.pdf.
43. Mikulski, J., Kwasny, A. (2010) Role of telematics in reducing the negative environmental impact of transport. CCIS 104, pp. 11 – 29. J. Mikulski (Ed.) Springer-Verlag Berlin Heidelberg
innovITS Impact Study on Intelligent Mobility
2013 Page 46 of 47
44. Morsink, P. et al., (2008) In-Car Speed Assistance to Improve Speed Management, Paper Presented at the 15th World Congress on ITS, New York, NY. November 2008. Benefit ID: 2011-00674
45. Myles, G.D., Uyduranoglu, A. (2002) Product Quality and Environmental Taxation. Journal of Transport Economics and Policy, 36: 233 – 266.
46. Rakha, H. P., Ding, Y. (2003). Impact of Stops on Vehicle Fuel Consumption. Journal of Transportation Engineering, 129, 23–32.
47. Richardson, B. C. (2005) Sustainable transport: analysis frameworks. Journal of Transport Geography, 13: 29–39.
48. Santos, G. et al. 2010. Part I: Externalities and economic policies in road transport. Research in Transportation Economics, 28: 2 - 45.
49. Tran, M., et al., (2012) Realizing the electric-vehicle revolution. Nature Climate Change, 2: 328-333.
50. Tomotaka, U., et al., (2008). Development and Validation of Internet-Based Personalized Travel Assistance System for Mobility Management, Paper Presented at the 15th ITS Word Congress. New York City, NY, 16-20 November 2008. Benefit ID: 2010-00644
51. UKERC (2050) Energy 2050: the transition to a secure low carbon energy system for the UK. (Eds. Skea, J., Winskel, M. edited, Ekins, P.) Earthscan, London.
52. UKHM (2011) The Carbon Plan: Delivering our low carbon future. HM Government, London. 53. UKHM (2009) The UK Renewable Energy Strategy. HM Government, London. 54. United Nations (2009) Measuring sustainable development. United Nations Economic
Commission for Europe, Geneva, Switzerland. 55. United Nations (2011) Transport for Sustainable Development in the ECE Region. United
Nations Economic Commission for Europe, Geneva, Switzerland. 56. United Nations (2012) Intelligent transport systems (ITS) for sustainable mobility. United
Nations Economic Commission for Europe, Geneva, Switzerland. 57. USDOT (1999) ITS Impacts Assessment for Seattle MMDI Evaluation: Modeling Methodology
and Results. U.S DOT, EDL No. 11323. September 1999. Benefits ID: 2007-00358 58. USDOT (2002) Ohio-Kentucky-Indiana Regional Council of Governments’ Evaluation of
ARTIMIS and ITS Program Plan. U.S. Department of Transportation, Federal Highway Administration.
59. USDOT (2003) U.S. Department of Transportation, Federal Highway Administration Highway Traffic Operations and Freeway 32. Management: State-of-the-Practice Final Report, URL: http://www.itsdocs.fhwa.dot.gov/jpodocs/repts_te/13801.html.
60. USDOT (2008) Intelligent transportations systems – Benefits, costs, deployment and lessons learned: 2008 Update. US Department of Transportation, Research and Innovative Technology Administration, Washington, DC.
61. USDOT (2010) 2010 ITS Deployment Tracking National Survey: Summary Report - Arterial Management, U.S. DOT Federal Highway Administration. 10 February 2011
62. USDOT (2013) Intelligent Transportation Systems Joint Programme Office Data base. URL: http://www.itsbenefits.its.dot.gov/its/benecost.nsf/ByLink/BenefitsAbout
63. VTT (2012) Low carbon smart mobility and green logistics. VTT Technical Research Centre of Finland, Julkaisija Utgivare Publisher, ISBN 978-951-38-7855-0.
innovITS Impact Study on Intelligent Mobility
2013 Page 47 of 47
About the Author
Dr. Martino Tran is a Senior Research Fellow at the University of Oxford specializing in energy and
transport systems analysis. He is an international expert on technological innovation, energy and
transport and has published widely in these fields. He has advised industry, government and
academia including UNDP, UNEP and the UK Engineering and Physical Science Research Council
on energy, environment and transport and is an expert reviewer for leading academic journals.
Dr. Tran also lectures at the University of Oxford on Sustainable Urban Development and Global
Challenges in Transport. He holds a Doctorate in Environmental Science and Applied Mathematics
from the University of Oxford.
![Intelligent Hybrid Cheapest Cost and Mobility Optimization ...proposed intelligent mobility optimization approach in [14] and propose an intelligent hybrid cheapest cost RAT selection](https://img.pdfslide.net/doc/110x75/5e7abd3443e36f103908bff7/intelligent-hybrid-cheapest-cost-and-mobility-optimization-proposed-intelligent.jpg)