Embed Size (px)
Citation preview

IMPACTS OF CONTAMINATED SEDIMENT REMEDIATION ON
EARLY LIFE STAGES OF RAINBOW TROUT
By
JOHN RICHARD FOLTZ
A thesis submitted in partial fulfillment of the requirements for the degree of
MASTER OF SCIENCE IN ENGINEERING
WASHINGTON STATE UNIVERSITY
College of Engineering and Architecture
DECEMBER 2009

ii
To the faculty of Washington State University:
The members of the Committee appointed to examine the thesis of JOHN FOLTZ find it satisfactory and recommend that it be accepted.
______________________________ Jeffery L. Ullman, Ph.D., Chair
______________________________
Marvin J. Pitts, Ph.D. ______________________________
Jeremy A. Rentz, Ph.D. ______________________________
Gary H. Thorgaard, Ph.D.

iii
ACKNOWLEDGEMENTS
I would like to thank Dr. Jeffery Ullman for giving me the opportunity to conduct
research at WSU for my master’s degree and for his guidance and support throughout the
process. Additionally, I would like to thank Dr. Jeremy Rentz for his above and beyond support
and understanding. I would also like to thank the rest of my committee members, Dr. Gary
Thorgaard and Dr. Marvin Pitts for their understanding and support throughout my time at this
institution.
I would also like to thank Katherine Schaffnit for her guidance and help on the project. I
give Scott Economu a great deal of thanks for his long hours spent with me on the HPLC and
GC-MS. Thank you to Dr. Richard Alldredge for his statistical assistance, expertise and
understanding of timeliness. I would also like to thank Wayne Chang for his helping hand as
well as the rest of the Ullman and Rentz Lab Groups.
Finally, I would like to thank my friends and family for all of their love and support
through this process. I cannot thank these valued people in my life enough.

iv
IMPACTS OF CONTAMINATED SEDIMENT REMEDIATION ON
EARLY LIFE STAGES OF RAINBOW TROUT
Abstract
By John Richard Foltz, M.S. Washington State University
December 2009
Chair: Jeffrey L. Ullman
Fish in the salmonid family are of particular importance economically, socially, and
ecologically. Consequently, a great deal of interest has been given to researching
environmental impacts on salmonid health to better protect these valued species. Sediment
contamination is vast and poses a potential ecological risk in watersheds across the United
States. Contaminated sediments may directly or indirectly affect fish populations. Current
sediment remediation practices primarily involve capping, dredging or monitored natural
attenuation approaches – each has its own drawbacks in relation to the aquatic ecosystem. An
innovative remedial approach, using solid peroxide within the sediment to increase available
oxygen for microbial degradation of organic contaminants, was examined in this study.
Sediments are low oxygen environments; increasing the oxygen available to be used as the
terminal electron acceptor during microbial degradation may facilitate this process.
The effects of this unique remediation method on rainbow trout at two different life
stages were evaluated in relation to environmental parameters and fish condition. Remediated
and non-remediated contaminated sediment impacts on yolk-sac fry and juvenile trout were

v
evaluated following 29 and 30 day exposures, respectively. Contaminant uptake,
environmental condition and fish condition were evaluated. Results suggest that dissolved
oxygen within the water was significantly increased in aquaria undergoing the remediation
treatment. The contaminant used in this study, phenanthrene, was degraded in both
remediated and un-remediated treatments and was not significantly increased by the
remediation treatment. This may be a result of the experimental set-up, and given more time
significant differences might be observed. Fish condition factor, a relationship between length
and weight, varied across treatment types. However, all fish condition factors were relatively
close to 1.0, a value suggesting good fish condition. Fish were observed to uptake
phenanthrene during Phase I, but not Phase II – likely a result of lower sediment phenanthrene
concentrations during Phase II. This suggests the remediation treatment resulted in an
observable impact on environmental parameters, specifically dissolved oxygen, and fish
condition.

vi
TABLE OF CONTENTS
ACKNOWLEDGEMENTS……….…………………………………………………………………………………………………… iii
ABSTRACT………………………….………………………………………………………………………………………………….… iv
LIST OF FIGURES ..……………………………………………………………………………………………………………........ vii
1.0 Introduction and Literature Review …………………………………………………………………………………… 1
1.1 Background ..…………………………………………………………………………………………………………. 2
1.2 Fish response to contaminant uptake and accumulation .……..………………….…………… 3
1.3 Effects of organic contaminants at critical life stages .………………………………….………… 6
1.4 Methods of contaminant exposure ..…………………………………………………………….……….. 8
1.5 Traditional remediation of contaminated sediments and impacts on fish .…………… 11
1.6 Oxygen and biodegradation of PAHs in sediment ..….…………………………………………… 12
1.7 Summary ..……………………………………………………………………………………………………….….. 13
1.8 Objectives .……………………………………………………………….……………………………………….… 14
1.9 Significance ..……………………………………………………………………………………………………….. 14
2.0 Impacts of contaminated sediment remediation on early life stages of rainbow trout ……. 16
2.1 Introduction ..…………………………………………………………………………………………………….… 16
2.2 Materials and Methods ..……………………………………………………………………………………... 17
2.3 Results ..………………………………………………………………………………………………………………. 24
2.3.1 Environmental Conditions ..………………………………………………………………... 24
2.3.2 Fish Condition ..…………………………………………………………………………………… 30
2.4 Discussion ……………………………………………………………………………………………………………. 38
3.0 Conclusions and Recommendations for Future Research ……………………………………………….. 47
4.0 Literature Cited .……………………………………………………………………………………………………………….50
5.0 Appendix A ……………………………………………………………………………………………………………………… 56
6.0 Appendix B ……………………………………………………………………………………………………………………… 57

vii
LIST OF FIGURES
Figure 1. Rainbow trout at embryonic, yolk-sac, and juvenile life stages………………………………….. 2
Figure 2. Dissolved Oxygen vs Temperature between replicates…………………………………………….. 27
Figure 3. Water pH in aquaria with sediment…........................................................................... 28
Figure 4. Phenanthrene degradation in sediment…………………………………………………………………… 29
Figure 5. Phase I Fish Condition Factors……………………………………………………………………………….... 32
Figure 6. Phase II Fish Condition Factors………………………………………………………………………………... 33
Figure 7. Phenanthrene concentration in fish tissue………………………………………………………………. 35
Figure 8. Phenanthrene HPLC Standard Curve………………………………………………………………………... 56
Figure 9. Sediment Phenanthrene concentration HPLC Chromatogram…………………………………. 56
Figure 10. Phenanthrene GC-MS Standard Curve…………………………………………………………………… 57
Figure 11. Fish Tissue Phenanthrene concentration GC-MS Chromatogram…………………………… 57

1
CHAPTER ONE
1.0 INTRODUCTION AND LITERATURE REVIEW
Fish in the salmonid family are of particular importance economically, socially, and
ecologically. Consequently, a great deal of interest has been given to researching
environmental impacts on salmonid health to better protect these valued species. Fish are
exposed to any pollutants that enter aquatic ecosystems, including organic legacy contaminants
from anthropogenic origins. Incorporating salmonids in toxicological research helps elucidate
contaminant impacts on fish considering their relative sensitivity and unique life history.
Many scientific studies have examined effects of organic contaminants, often through
waterborne exposure, on different life stages of aquatic organisms and fish (Chen and White,
2004; Honkanen et al., 2001; Koponen et al., 1998 and 2000; Milston et al., 2003; Petersen and
Kristensen, 1998; Walker et al., 1996). The embryonic stage may be the most sensitive and
important of all the salmonid life stages, and represents an important period for evaluating the
effects of contaminants (Hendricks et al., 1980; von Westernhagen, 1988). In addition, the
embryonic and post-hatch periods maintain a close association with the substrate and
sediment, because these are benthic life stages prior to absorption of the yolk-sac and swim-up
(Figure 1). Although contaminant uptake may be sub-lethal, other detrimental impacts may
arise later in life, including increased disease susceptibility and decreased reproductive success
(Cachot et al., 2007; Milston et al., 2003; Talmage et al., 1999). Due to the hydrophobic nature
of organic contaminants and issues surrounding bioavailability, examining early fish life stages
exposed to sediment-borne contaminants presents an ecologically relevant approach for
evaluating detrimental effects.

2
Figure 1. Photograph of the embryonic (left), yolk-sac (middle) and juvenile (right) stages of rainbow trout.
1.1 Background
Anthropogenic impacts on the natural environment are vast and often detrimental.
Sediments contaminated as a result of human activity may have a direct negative affect on
aquatic biota or present a source of contaminants that can bioaccumulate in the food chain.
Contaminated sediments pose a potential ecological risk in watersheds across the United
States, including water bodies where chemical water quality criteria are at or below acceptable
levels. According to the United States Environmental Protection Agency (USEPA), there are
2,800 fish advisories in the United States for the types of contaminants often found in sediment
(USEPA, 2004). These advisories affect more than 544,000 river miles, 71% of the National
coast and more than 95,000 lakes including all 5 of the Great Lakes (USEPA, 2004).
Contaminated sediment impacts may directly or indirectly affect aquatic ecosystems, human
health and economics. Past studies have examined numerous contaminant impacts to different
aquatic species (Cachot et al., 2007; Hankanen et al., 2001; Koponen et al., 1998, 2000; Oliver
and Niimi, 1988; Petersen and Kristensen, 1998; Pruell et al., 1993; Sundberg et al., 2006;
Walker et al., 1996). Still, there is much left to understand concerning contaminated sediment
impacts on aquatic life.

3
Sediments in aquatic ecosystems provide a contaminant sink, which adversely affect
both benthic and pelagic organisms (Chen and White, 2004). Many organic chemicals, such as
chlorinated compounds, have high partitioning coefficients, which suggests that the distribution
of these compounds are likely to associate with the sediment and organic matter rather than
with the water. Low concentrations may be found in the water column while the sediment may
have orders of magnitude higher concentrations.
The Clean Water Act has established 126 priority pollutants based upon toxicity,
persistence and degradation potential (FWPCA, 2008). The list includes heavy metals which
tend to be highly toxic and bioaccumulate, pesticides and herbicides that encompass many
diverse compounds, polychlorinated biphenyls (PCBs) which are extremely persistent and
bioconcentrate, and polycyclic aromatic hydrocarbons (PAHs). Of the 16 PAHs listed as priority
pollutants, phenanthrene was used as the contaminant of interest in this study.
1.2 Fish Response to Contaminant Uptake and Accumulation
In order to understand the potential impact of a particular compound on an organism,
one must recognize the primary exposure routes, which are typically dictated by where the
organism resides. The potential for the compound to be transferred from the environment to
the organism depends not only on the morphological, physiological and biochemical attributes
of the organism (Giulio and Hinton, 2008), but also on the bioavailability of the chemical. Since
many chemicals tend to partition into the sediments, pollutant uptake is typically limited in the
water column and relatively high in non-aqueous parts of the ecosystem (i.e. the substrate and
sediment). For an organism to be greatly impacted by a hydrophobic contaminant, it typically

4
must have some association with the substrate and sediment – most fish species receive
contaminant loads through the food chain. If an organism has a direct association with
contaminated sediment, an additional opportunity for pollutant uptake is presented.
Contaminant uptake can occur via several exposure routes depending on organism
characteristics. These pathways can include absorption through membranes and ingestion.
Generally, bioconcentration refers to chemical accumulation by non-dietary means. The term
bioaccumulation refers to chemical accumulation within an organism by all potential pathways,
including dietary intake. Biomagnification is the result of elevated contaminant concentrations
in organisms with an increase in trophic level. Once the contaminant has entered the organism
it can be eliminated, transformed into another compound or concentrated within the organism
(Giulio and Hinton, 2008).
The bioconcentration factor (BCF), which is the relation of the chemical concentration in
the environment to that in the fish under steady state conditions, is used to quantify the
magnitude of accumulation in aquatic systems. This term has the units of water volume/tissue
weight. Variations in BCF between species or life stages are thought to be accounted for by
differences in lipid content (Giulio and Hinton, 2008). Simlarly to the BCF, an organism has an
elimination rate. A compound can be excreted, metabolized or otherwise eliminated, in
addition to being concentrated within an organism. These possible mechanisms can cause a
response by the organism to a specific compound. Responses in fish can possibly be observed
in the form of stress, a change in osmoregulation, changes in liver enzyme production, behavior
changes, effects on the nervous, endocrine or immune systems or cancer development (Giulio
and Hinton, 2008).
5
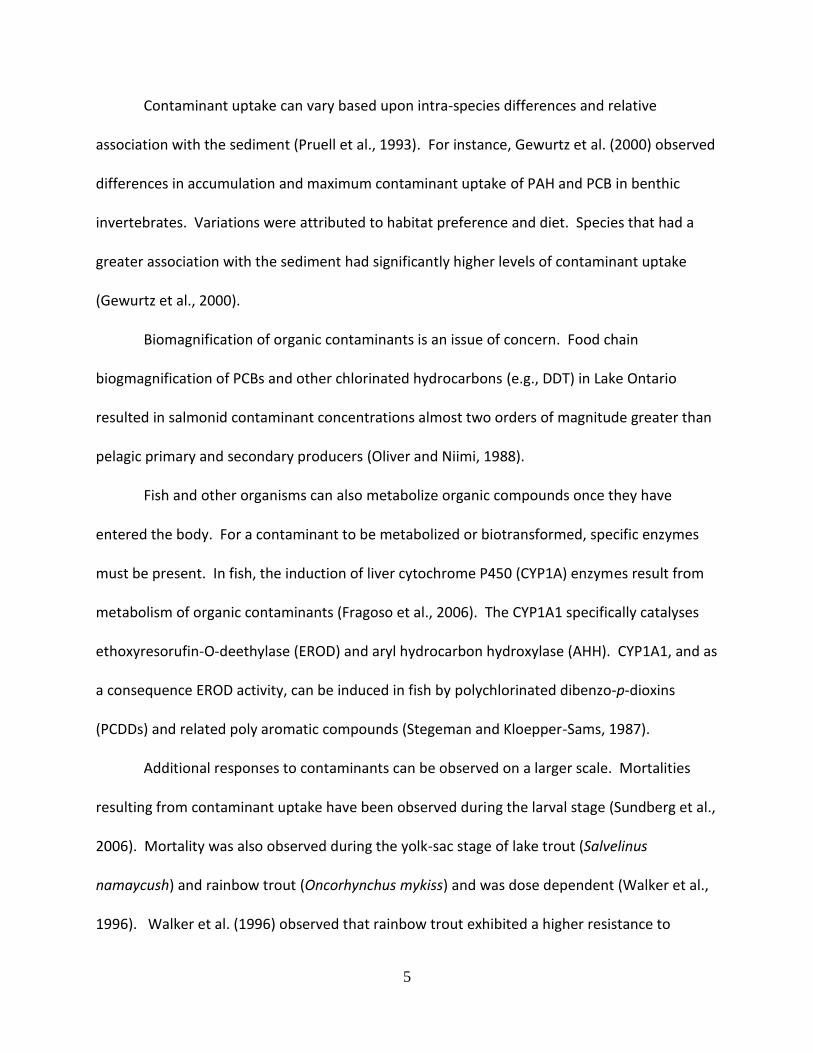
Contaminant uptake can vary based upon intra-species differences and relative
association with the sediment (Pruell et al., 1993). For instance, Gewurtz et al. (2000) observed
differences in accumulation and maximum contaminant uptake of PAH and PCB in benthic
invertebrates. Variations were attributed to habitat preference and diet. Species that had a
greater association with the sediment had significantly higher levels of contaminant uptake
(Gewurtz et al., 2000).
Biomagnification of organic contaminants is an issue of concern. Food chain
biogmagnification of PCBs and other chlorinated hydrocarbons (e.g., DDT) in Lake Ontario
resulted in salmonid contaminant concentrations almost two orders of magnitude greater than
pelagic primary and secondary producers (Oliver and Niimi, 1988).
Fish and other organisms can also metabolize organic compounds once they have
entered the body. For a contaminant to be metabolized or biotransformed, specific enzymes
must be present. In fish, the induction of liver cytochrome P450 (CYP1A) enzymes result from
metabolism of organic contaminants (Fragoso et al., 2006). The CYP1A1 specifically catalyses
ethoxyresorufin-O-deethylase (EROD) and aryl hydrocarbon hydroxylase (AHH). CYP1A1, and as
a consequence EROD activity, can be induced in fish by polychlorinated dibenzo-p-dioxins
(PCDDs) and related poly aromatic compounds (Stegeman and Kloepper-Sams, 1987).
Additional responses to contaminants can be observed on a larger scale. Mortalities
resulting from contaminant uptake have been observed during the larval stage (Sundberg et al.,
2006). Mortality was also observed during the yolk-sac stage of lake trout (Salvelinus
namaycush) and rainbow trout (Oncorhynchus mykiss) and was dose dependent (Walker et al.,
1996). Walker et al. (1996) observed that rainbow trout exhibited a higher resistance to

6
contaminants than lake trout. Hollert et al. (2003) observed mortality of zebrafish (Danio rerio)
embryos as a result of contact with native sediment with unknown contaminants. Differences
in hatching time and sublethal development abnormalities also arose (Hollert et al., 2003).
Cachot et al. (2007) found similar results when medaka (Oryzias latipes) exposed to PAHs and
PCBs extracted from field sediment showed higher mortality in the embryo-larval stages and an
increase in spinal deformities. Additionally, mutations in the liver, transverting
Guanine:Cytosine and Thymine:Adenine, were observed (Cachot et al., 2007).
1.3 Effects of Organic Contaminants at Critical Life Stages
Fish toxicity and bioaccumulation experiments are usually performed on juveniles
(Connell, 1990). Although this does not represent a particularly sensitive life state, it provides
feasibility and practicability in the laboratory. On the other hand, early fish life stages are
commonly considered the most sensitive periods to environmental stress, particularly the yolk-
sac stage and the embryonic stage prior to completion of gastrulation (Hendricks et al., 1980;
von Westernhagen, 1988). There are limited possible routes through which a developing fish
embryo or a post-hatch fish can accumulate a contaminant. Due to limited mobility and no
exogenous feeding, these two life stages must passively uptake a contaminant. Therefore, the
contaminant must be passed from the parent fish or acquired upon being deposited in the
substrate.
Salmonids in particular may be impacted at early life stages by contaminated sediment.
Petersen and Kristensen (1998) proclaimed that for fish species having a long embryonic stage,
such as salmon, it is important to include this period when examining lipophilic chemicals.

7
Salmonids have large lipid-rich yolk reserves that make the egg/embryonic stage a good
candidate to accumulate large amounts of lipophilic organic chemicals. This, in addition to
other salmonid life history characteristics of relatively large eggs and long developmental time,
suggests that salmonid embryos may accumulate chemicals readily (Honkanen et al., 2001).
Differences in uptake and response to contaminants are linked to specific life stages.
Peterson and Kristensen (1998) observed that the capability of embryonic fish to eliminate or
metabolize a contaminant is reduced as compared to a fish at a more developed life stage.
PAHs in particular are metabolized at a slower rate in embryonic cod (Gadus morhua), herring
(Clupea harengus) and zebrafish (Peterson and Kristensen, 1998). Van der Oost et al. (2003)
observed that limited biotransformation and elimination of contaminants takes place during life
stages prior to the eyed-stage in rainbow trout. Kopenen et al. (2000) found that the no
observable affect concentration of PCB-77 was lower for yolk-sac fry than for eyed embryos
(Kopenen et al., 2000). Kopenen et al. (1998) showed rapid uptake (3 days to steady state) of
PCB-77 at three concentrations in rainbow trout at the eyed stage. The fish microsomal CYP1A
monooxygenase system was shown to be sensitive at the lowest concentration (1µg L-1 PCB-77
per 10ng embryo-1)(Kopenen et al., 1998).
Observable differences in mortality and toxic effects have also been shown between life
stages. Sundberg et al. (2006) observed a difference in mortality and toxic effects between
rainbow trout at the larval and the embryonic stages. Walker et al. (1996) observed that
mortality did not significantly increase for either rainbow or lake trout eggs when exposed to
contaminants (2,3,7,8-tetrachlorodibenzo-p-dioxins (TCDDs), polychlorinated dibenzo-p-dioxins

8
and dibenzofurans (PCDDs and PCDFs) and PCBs); rather mortality increased in a dose-response
pattern during the yolk-sac stage (Walker et al., 1996).
Contaminant exposure at the embryonic or yolk-sac stages may not always cause
mortality, but can cause problems later in life. Even a brief exposure to pollutants can cause
fish health concerns. Exposure to low waterborne concentrations of DDE (10 ppm) for one hour
at fertilization and two hours at hatch caused immune-suppression in Chinook salmon
(Oncorhynchus tshawytscha) one year post-hatch even though no differences in length, weight,
sex ratio, gonadal development and mortality were observed (Milston et al., 2003). This
suggests that exposure to contaminants at ecologically relevant levels may decrease fish fitness
by increasing the likelihood of health problems during its life. Hollert et al. (2003) observed
differences in hatching time and sub-lethal development abnormalities in zebrafish exposed to
contaminated sediment (Hollert et al., 2003). Fish that develop abnormally may not die as a
result of contamination, but are less fit to survive to reproduction. Cachot et al. (2007) also
observed spinal mutations and mortality in medaka exposed to PAH and PCB contaminated
sediment extracts. Fish that did survive were placed in a contaminant free environment for 35
weeks, after which detrimental effects were observed in the form of liver and gonadal tumors
(Cachot et al., 2007).
1.4 Methods of Contaminant Exposure
There are four basic ways to expose fish and aquatic species to contaminants in a
laboratory setting: waterborne, injection, feed, and sediment-borne. Each method has

9
advantages and disadvantages. Method selection depends on what is trying to be tested and
observed.
A waterborne exposure method is a quick method that eliminates complex interactions
with the sediment and likely results in quick uptake in fish as a result of the hydrophobic nature
of organic contaminants. Petersen and Kristensen (1998) evaluated PAH metabolism at
different life stages in zebrafish, cod, herring and turbot (Scophthalmus maximus) using a
waterborne exposure. Koponen et al. (1998 and 2000) utilized a waterborne exposure method
when comparing PCB-77 effects on two different life stages of rainbow trout, sub-lethal stress
and the induction of liver cytochrome P450. Milston et al. (2003) employed a waterborne
exposure of TCDD, in this case to expose Chinook salmon embryos for a quick period, and
observed immune-suppression one year post hatch. Walker et al. (1996) utilized a waterborne
exposure when using lake trout embryos, instead of other contaminant exposure methods,
citing the sensitivity of the species life stage. Waterborne exposure is relevant when evaluating
contaminants with that are highly soluble, such as bisphenol A (BPA). Honkanen et al. (2001)
exposed salmonids to BPA (120-300 mg/L) using a waterborne exposure to evaluate
biotransformation rates with variation in water temperature. Despite its widespread use, the
waterborne exposure method is not ecologically relevant as water concentrations are usually
low relative to sediment concentrations. Solubility of a contaminant may also pose a problem
as high aqueous concentration of contaminants may not be achieved.
The contaminant injection method is an exposure technique that ensures that the
contaminant of interest enters the fish body. This method has been shown to claim less than
1% mortality of fish embryos due to the injection itself (Åkerman and Balk, 1995). Sundberg et

10
al. (2006) first extracted contaminants from natural sediment then injected them into rainbow
trout embryos post-fertilization. Walker et al. (1996) utilized the injection method when
evaluating intra-species response differences when comparing lake and rainbow trout. This
method is useful in guaranteeing the contaminants will be in the fish, but it is not a natural
pathway. This method may cause additional stress due to handling and the physical injection,
which may confound observed effects. This method also does not reveal any information
regarding uptake or bioaccumulation.
Exposing fish to contaminants through feed is a method that is ecologically relevant, as
it mimics a natural contaminant exposure pathway. However, this method is irrelevant for fish
not feeding, such as during the yolk-sac stage. When trying to evaluate effects of fish at life
stages before full digestive tract development, other methods must be used. This method may
also present complications, as the desired level of pollutant uptake may not be achieved or
occur at all due to palatability issues with contaminated feed.
The final method reviewed here is a sediment-borne exposure. This method is
ecologically relevant, as sediments are where contaminants are generally found at higher
levels. This method is also acceptable for exposure at early fish life stages due to their close
association with the substrate. Hollert et al. (2003) exposed embryonic zebrafish to
contaminated field sediments to evaluate the potential of a sediment contact assay for
toxicological evaluation. Contaminants were observed to be bioavailable and accumulated in
the embryos, causing mortality and sub-lethal impacts (Hollert et al., 2003). Embryonic medaka
were evaluated by Cachot et al. (2007) using the same sediment-borne contaminant exposure
method to evaluate if the contaminants were bioavailable and were taken up. Mortality and

11
spinal deformities were observed in addition to liver mutations and liver and gonadal tumor
formation 35 weeks after exposure (Cachot et al., 2007). Sediment-borne exposure of
contaminants is ecologically relevant, although it does not guarantee contaminant uptake.
Depending on what specific parameter is being evaluated in a study, a method should be
selected based upon that methods advantages and drawbacks. In this study, the sediment-
borne method is relevant, because the research examined the impacts of a sediment
remediation technique on fish.
1.5 Traditional Remediation of Contaminated Sediments and Impacts on Fish
Traditional PAH-contaminated sediment remediation generally involves removal with
offsite treatment, capping, or monitored natural recovery. Contaminated sediment removal is
accomplished by dredging, which is expensive and controversial. Dredging results in sediment
resuspension in the aquatic ecosystem, which is a major aquatic health risk on its own and also
increases potential PAH exposure (Palermo, 2001). In-situ remediation is possible by capping
or monitored natural recovery. Capping employs a clean isolating material placed over the
contaminated sediment which can be simple or complex. The goal of the cap is to physically
isolate the contaminated area from aquatic organisms and limit contaminated sediment
resuspension. This method is similar in cost to dredging, but leaves the pollutant on site. Re-
exposure of the contaminated sediment due to damage to the cap would render the
remediation technique invalid (Palermo, 2001). Monitored natural recovery (MNR) is a
remediation option that lets natural processes reduce PAH concentrations. This remediation
approach implements a program to monitor contamination levels to ensure that degradation is
12
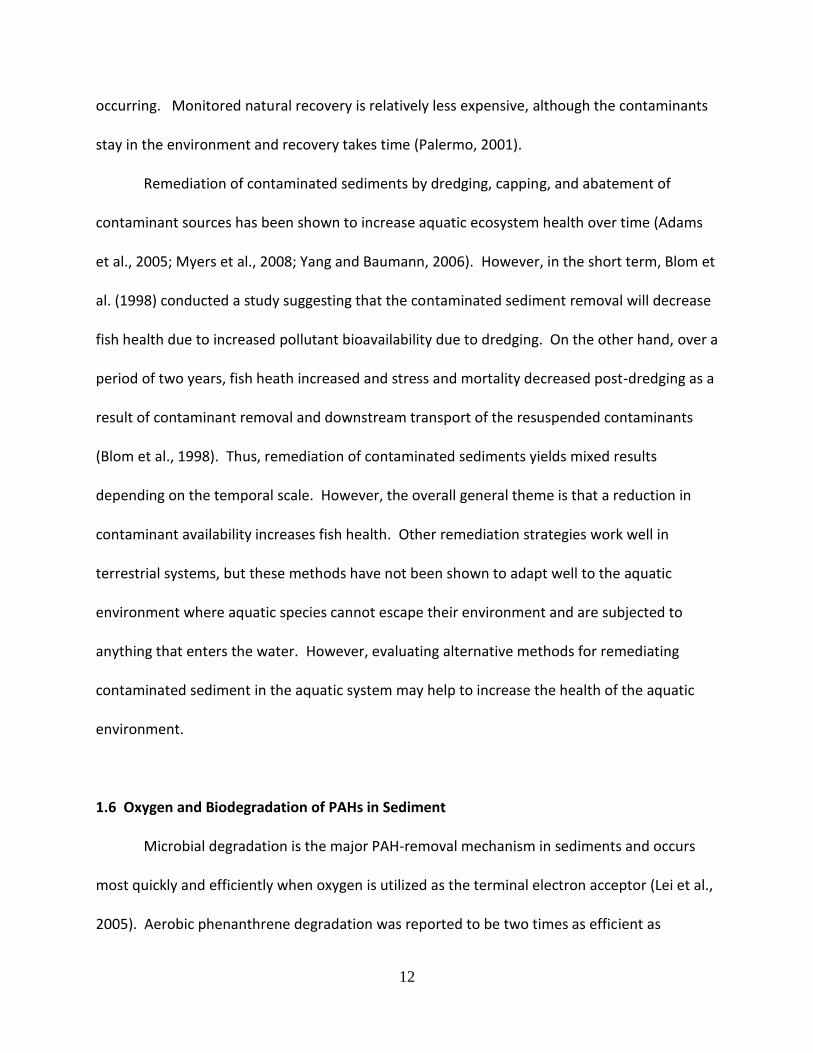
occurring. Monitored natural recovery is relatively less expensive, although the contaminants
stay in the environment and recovery takes time (Palermo, 2001).
Remediation of contaminated sediments by dredging, capping, and abatement of
contaminant sources has been shown to increase aquatic ecosystem health over time (Adams
et al., 2005; Myers et al., 2008; Yang and Baumann, 2006). However, in the short term, Blom et
al. (1998) conducted a study suggesting that the contaminated sediment removal will decrease
fish health due to increased pollutant bioavailability due to dredging. On the other hand, over a
period of two years, fish heath increased and stress and mortality decreased post-dredging as a
result of contaminant removal and downstream transport of the resuspended contaminants
(Blom et al., 1998). Thus, remediation of contaminated sediments yields mixed results
depending on the temporal scale. However, the overall general theme is that a reduction in
contaminant availability increases fish health. Other remediation strategies work well in
terrestrial systems, but these methods have not been shown to adapt well to the aquatic
environment where aquatic species cannot escape their environment and are subjected to
anything that enters the water. However, evaluating alternative methods for remediating
contaminated sediment in the aquatic system may help to increase the health of the aquatic
environment.
1.6 Oxygen and Biodegradation of PAHs in Sediment
Microbial degradation is the major PAH-removal mechanism in sediments and occurs
most quickly and efficiently when oxygen is utilized as the terminal electron acceptor (Lei et al.,
2005). Aerobic phenanthrene degradation was reported to be two times as efficient as

13
anaerobic degradation (Tang et al., 2006). Additionally, PAHs are reduced compounds that
generally degrade via oxidation (Cerniglia, 1992). Generally sediments, except for at the water
interface, are depleted of oxygen and anaerobic degradation occurs at a relatively slower rate
as compared to aerobic degradation.
The methods developed and used in this study utilize the knowledge that sediments are
depleted of oxygen. If oxygen, the terminal electron acceptor used in PAH microbial
degradation, is artificially added to sediment, bioremediation may be enhanced. Oxygen
additions to contaminated sediment have been observed to increase microbial degradation in
laboratory mesocosms (Schaffnit, 2009). However, the impact of this remediation technique on
aquatic life has not been evaluated.
1.7 Summary
Organic contaminants in the aquatic ecosystem are a significant issue of concern. Many
scientific studies have addressed the plethora of organic contaminants, often through
waterborne exposure, on different life stages of aquatic organisms and fish. The embryonic
stage may be the most sensitive of all the life stages and represents an important period for
evaluation of the effects of contaminants. Due to the hydrophobic nature of organic
contaminants and issues surrounding bioavailability, sediment-borne contaminant exposure to
embryonic fish may be the most ecologically relevant method to determine detrimental effects.
Furthermore, the incorporation of salmonids in toxicological research can contribute to the
understanding of contaminant uptake and impacts, as their sensitivity and life history are
unique and important.

14
1.8 Objectives
The primary objective of this research was to investigate the toxicological effects of
sediment-bound contaminants and remediation on the early life stages of fish, specifically to:
1. Design an experiment that evaluates the impact of contaminated sediment on
rainbow trout at different life stages; and
2. Evaluate the impact of contaminated sediment remediation upon rainbow trout.
Our hypothesis was that there will be a negative impact of contaminated sediment upon the
fish as compared to the non-contaminated sediment. Additionally, we hypothesized that the
remediation will not significantly change environmental parameters or negatively impact fish as
compared to those not remediated.
1.9 Significance
Innovative research was proposed and funded to evaluate a novel remedial method,
specifically on creosote (composed of PAHs) contaminated sediment in an attempt to improve
fish and wildlife habitat. The remedial method presented provides an alternative to the
established approaches of dredging, capping and monitored natural recovery that applies
reactive solids comprised of chemical oxidants to improve biological degradation. This method
will attempt to degrade contaminants in situ to eliminate the potential of increasing
bioavailability and sedimentation resuspension by dredging and increase degradation rates
compared to capping or monitored natural recovery. In laboratory experiments, Schaffnit
(2009) observed enhanced degradation of phenanthrene (a PAH component of creosote) using
these reactive solids compared to degradation rates in control groups.

15
Wildlife and ecosystem health implications associated with the proposed remediation
technique are a potential concern. While the initial study has shown that the proposed reactive
solid treatment can degrade phenanthrene, the potential effects on fish are unknown. The
surrounding concern lies within degradation byproducts. The aim of this research was to assess
whether sediments undergoing treatment with reactive solids impact biota. To accomplish this,
comparisons were made using rainbow trout reared in the presence of untreated toxic
sediment, the same sediment undergoing treatment and uncontaminated sediment undergoing
treatment. Two life stages were evaluated, yolk-sac and juvenile, to evaluate the direct and
indirect impacts of contaminated sediment exposure. In this manner, the benthic yolk-sac
stage served as a surrogate for bottom dwelling biota while the juvenile life stage represented
free swimming pelagic organisms.
The significance of this work will be to better understand the impact of contaminated
sediments on salmonids by providing general toxicological data on contact exposure to
sediments. Additionally, this study aims to evaluate the effects of the potential remedial
practices presented in this study on rainbow trout. Furthermore, this study aims to improve
toxicology studies by adding a method for examining toxicity and potentially establishing a
quick toxicological examination method for early fish life stage exposure. We also expect this
sediment-borne contaminant exposure method to be useful in other toxicological tests, as it
may provide a more ecologically relevant method of examination compared to waterborne
experiments.
16
CHAPTER 2
2.0 IMPACTS OF CONTAMINATED SEDIMENT REMEDIATION ON EARLY LIFE STAGES OF RAINBOW TROUT
2.1 Introduction
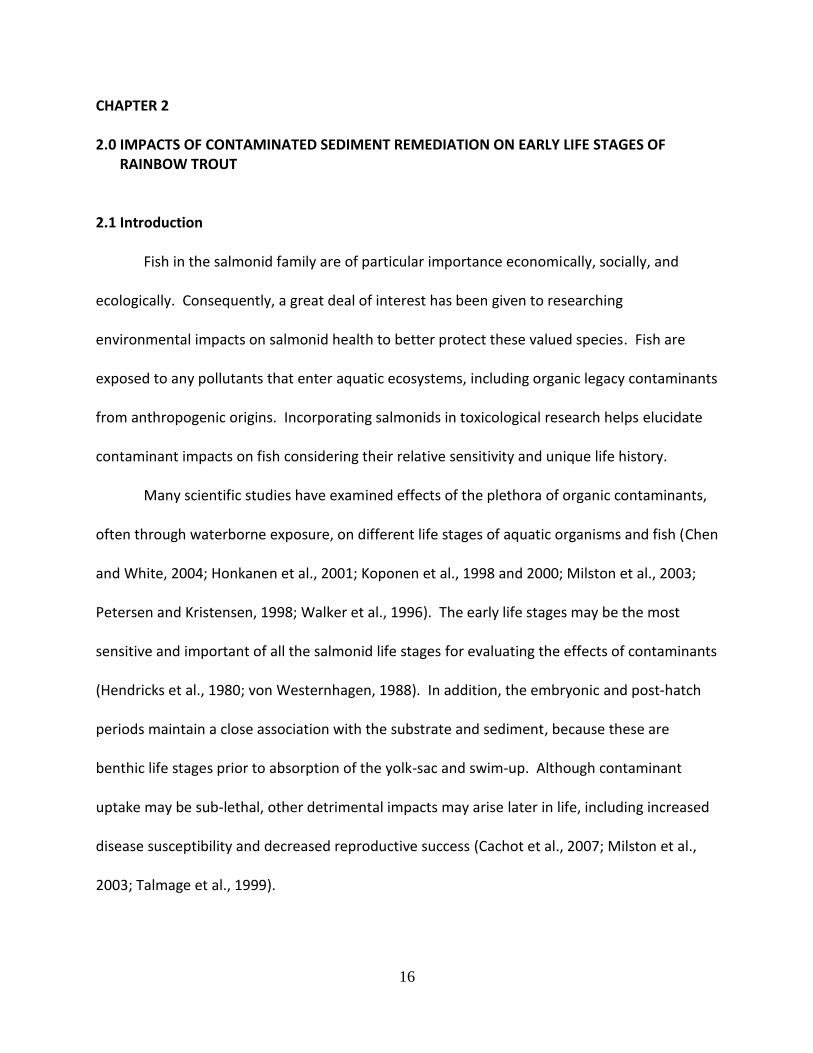
Fish in the salmonid family are of particular importance economically, socially, and
ecologically. Consequently, a great deal of interest has been given to researching
environmental impacts on salmonid health to better protect these valued species. Fish are
exposed to any pollutants that enter aquatic ecosystems, including organic legacy contaminants
from anthropogenic origins. Incorporating salmonids in toxicological research helps elucidate
contaminant impacts on fish considering their relative sensitivity and unique life history.
Many scientific studies have examined effects of the plethora of organic contaminants,
often through waterborne exposure, on different life stages of aquatic organisms and fish (Chen
and White, 2004; Honkanen et al., 2001; Koponen et al., 1998 and 2000; Milston et al., 2003;
Petersen and Kristensen, 1998; Walker et al., 1996). The early life stages may be the most
sensitive and important of all the salmonid life stages for evaluating the effects of contaminants
(Hendricks et al., 1980; von Westernhagen, 1988). In addition, the embryonic and post-hatch
periods maintain a close association with the substrate and sediment, because these are
benthic life stages prior to absorption of the yolk-sac and swim-up. Although contaminant
uptake may be sub-lethal, other detrimental impacts may arise later in life, including increased
disease susceptibility and decreased reproductive success (Cachot et al., 2007; Milston et al.,
2003; Talmage et al., 1999).

17
Due to the hydrophobic nature of organic contaminants and issues surrounding
bioavailability, examining early fish life stages exposed to sediment-borne contaminants
presents an ecologically relevant approach for evaluating detrimental effects. Additionally, the
remediation of these sediments is an area of interest. This study examined the impact of
sediment-borne contamination and a novel remediation method upon the post-hatch and
juvenile stages of rainbow trout, using the polyaromatic hydrocarbon (PAH) phenanthrene as a
surrogate contaminant. The proposed remediation method utilizes reactive solids comprised of
chemical oxidants to enhance biological degradation. Sediments are low oxygen environments,
and increasing the oxygen available to be used as the terminal electron acceptor during
microbial degradation may facilitate this process. This technique will potentially allow for
degradation to occur in situ at a quicker rate than methods such as capping or monitored
natural attenuation and decrease the amount of sediment perturbation associated with
dredging. The impact of the proposed sediment remediation technique upon environmental
parameters and fish condition were evaluated.
2.2 Materials and Methods
Fish
Rainbow trout gametes were obtained from Troutlodge®, Sumner, Washington. Eggs
were fertilized in the presence of an activation fluid (8.75 g Sodium Chloride, 1.2 g TrisBase, 1.5
g Glycine/1 L water), and were subsequently washed with reverse osmosis (RO) purified water
amended with RO Right Salts® to yield a total dissolved solids concentration of 200mg/L, pH
8.0. This water formulation was used during incubation in a heath tray incubator at 15°C±2°.

18
Post-hatch fish were kept in re-circulating holding tanks (15°C±2°) and fed
approximately 1.5% of their body weight daily upon the start of exogenous feeding prior to the
experiments. During the first phase of the experiment, juvenile fish were used. During the
second phase of the experiment, rainbow trout two days post-hatch were used.
Sediment Substrate and Chemicals
Natural stream sediment (3.4% organic matter) was collected from Paradise Creek,
Pullman, Washington. This sediment was used as collected or artificially contaminated.
Phenanthrene (C14H10) was used as a model contaminant to examine the effectiveness of the
chemical oxidant as a remediation method and its potential subsequent impacts on rainbow
trout. Contaminated sediments were spiked with phenanthrene (95% purity), acquired from
Sigma-Aldrich (St. Louis, MO), using a shell-coating method modified from Ke et al. (2003).
Three grams of phenanthrene were dissolved in 200 mL of acetone in a 500-mL glass bottle.
The phenanthrene/acetone mixture was poured over 1 L clean, dry sand and mixed in an
aluminum pan and left under a hood for two hours to allow for acetone evaporation. The
mixture was then mixed again and poured into a 4-L amber glass bottle and left uncapped
under a hood to ensure volatilization of all the acetone. Sand was then transferred to a 1-L
amber plastic Nalgene® bottle and stored in the freezer until the time of use. The dry sand was
then poured into a 5-gallon bucket containing 24 kg of Paradise Creek sediment and
homogenized for 20 min with an electric paint mixer. Homogenized sediment was left in the
bucket for 24 hours after mixing to allow phenanthrene adsorption to sediment organic matter.
The estimated phenanthrene concentration was 117 mg/kg wet weight. Sediment,

19
contaminated or uncontaminated, was then added in one of three treatment types to aquaria
at a depth of approximately 40 mm; a fourth treatment utilized water only to serve as a control.
Solid magnesium peroxide cubes were made and utilized as the potential remediation
method tested in this study. Solid cubes consisting of magnesium peroxide (Mg02), magnesium
oxide (MgO) and magnesium hydroxide (Mg(OH)2) marketed as Oxygen Release Compound
(ORC® Regenesis Bioremediation Products, San Clemente, CA) were created by mixing 150 g
ORC® powder with 81 mL of deionized water in a glass beaker. The resulting slurry was
approximately 65% ORC®, within the range recommended by the manufacturer. The slurry was
poured into plastic ice cube trays (90 cubes, 0.5 inch per side, per tray) and set out overnight to
dry at room temperature. Once dry, the cubes were removed and sorted to ensure cubes were
similar in size.
Experimental Design
Contaminated sediment and sediment remediation impacts upon rainbow trout were
determined using two fish age classes under four experimental treatments replicated thrice.
Phase I utilized juvenile fish (mean fork length, nose to the fork in tail, 46.5mm, sd=4.2). Phase
II utilized rainbow trout two days post-hatch. Fish were exposed to one of three treatments: 1)
phenanthrene contaminated sediment, 2) phenanthrene contaminated sediment with
remediation, 3) non-contaminated sediment with remediation, and 4) a control of water
without sediment. During Phase II, pebbles were added to the surface of the sediment to
minimize sediment related mortality of the newly hatched rainbow trout.

20
The experiment was conducted in an environmental chamber where the temperature
remained constant within each replicate. During Phase I the photoperiod was kept on a 12
hour light/12 hour dark cycle. During Phase II, the newly hatched fish were reared under
continuous dark conditions until exogenous feeding began, at which point the photoperiod was
changed to the same conditions as Phase I. The water solution used was as described
previously and aerated via an air stone in 5-gallon aquaria. Aquaria were non-filtered static
systems with the exception of a daily water change during Phase I and every other day during
Phase II. The water change consisted of removing approximately 50% of the water (2.5
gallons). This was accomplished by drawing the water down using a siphon to the top of a 100-
mL beaker placed inside the aquaria. Water was then added back in the aquarium by allowing
the water to flow into the 100-mL beaker, which acted as a water flow barrier to minimize
sediment re-suspension. Water removed from each aquarium was run through a 1-L column of
granulated activated carbon (GAC). Each aquarium was populated with 10 juvenile fish and
approximately 40 yolk-sac fish for Phase I and II, respectively.
Aquaria were maintained for a total of 68 days. The same aquaria and sediment were
used in both Phase I and Phase II. Fish were present for 30 and 29 days for Phase I and II,
respectively. A six day hiatus occurred between phase one and two as a result of waiting for
rainbow trout embryonic development. During each phase, a daily record of each aquarium
was made to document fish mortality, dissolved oxygen, pH, and temperature prior to the
water change. A YSI Professional Plus® (Yellow Springs, OH) instrument with dissolved oxygen,
pH, and temperature probes, calibrated to manufacturer specifications, was used to monitor
the aquaria daily.

21
Sediment Sampling, Extraction, and Analysis
Sediment grab samples were taken from each tank at three time intervals, the start of
the experiment, at the end of Phase I and at the end of Phase II. Sediment samples were
frozen until analysis. Phenanthrene was extracted from the sediment using a 48-h solvent
extraction. Prior to extraction, samples were dried overnight (105°C) and powdered using an
acetone-rinsed mortar and pestle. Approximately 20 g was transferred to a clean 60-mL vial to
which 50 mL methlyene chloride was added. The extraction vials were vortexed every 12 h.
After 48 h, 25 mL of the supernatant was removed from each sample and transferred to a clean
30-mL vial. A solvent exchange was then conducted, evaporating the methylene chloride via
nitrogen gas while heated in a water bath at 50°C and reconstituting the extracted
phenanthrene in 20 mL methanol.
Phenanthrene concentrations in the extracts were determined using high pressure
liquid chromatography (HPLC) on an Agilent HP 1100 HPLC equipped with an Agilent 1100 diode
array detector. Compound separation was achieved using a Supelco Supelcosil LC-PAH 5 µm
column (15 cm x 4.6 mm; Sigma-Aldrich, St. Louis, MO), operated at a 26°C column
temperature, a 1 mL/min flow rate, and a 50 µL injection volume. A phenanthrene standard
curve was created using the following concentrations: 100, 50, 10, 5, and 1 mg/L in methanol
(8, Appendix A).
Water Sampling, Extraction, and Analysis
The water removed daily from each aquarium was passed through a 1-L column of GAC
to capture any phenanthrene in the water. GAC samples for each aquarium were then frozen

22
and saved until extraction. Phenanthrene was extracted from the GAC in 1-gallon glass jars
using a 400:200 mL solvent ratio of acetone:methlyene chloride. The jars were shaken by hand
every 12 h for 48 h. A 50-mL subsample was then extracted into a 65-mL vial. A solvent
exchange was then conducted, evaporating the methylene chloride via nitrogen gas while
heated in a water bath at 50°C and reconstituting the extracted phenanthrene in 20 mL
methanol.
A positive control GAC sample spiked with 0.3 mg phenanthrene was prepared to
evaluate the efficiency of the extraction method. This sample was extracted in the same
manner as the aquaria GAC samples. Phenanthrene concentrations in all extracts were
determined using HPLC with the same parameters as the sediment sample extracts.
Fish Tissue Sampling, Extraction, and Analysis
At the end of each experimental phase, fish were weighed and measured after being
euthanized by a lethal dose of tricaine methanesulfonate (MS-222). The livers were removed
from five fish in each replicate from Phase I, weighed and frozen. Whole fish were freeze dried
in a Multi-Dry® dryer (FTS Systems Inc., Stone Ridge, NY) for five days and frozen at -80°C prior
to extraction; liver samples were not freeze dried.
Phenanthrene present in the fish tissue samples was extracted using a Dionex ASE 200
Accelerated Solvent Extractor (ASE). Prior to extraction, samples were dried overnight (105°C)
and ground using an acetone-rinsed mortar and pestle. The sample was transferred to clean
22-mL stainless steel extraction cells (Dionex Corporation, Sunnyvale, CA) and topped off with
clean sand to minimize solvent waste. Extraction was performed according to the

23
manufacturer’s instructions at the recommended system conditions, using a system pressure of
1,500 psi, oven temperature of 100°C, oven heat-up and static time of 5 min, with a 1:1 solvent
ratio of dichloromethane and acetone. The extraction cell was flushed with 60% of the cell
volume and purged with nitrogen at 150 psi for 1 min. Extract was collected in clean 60-mL
vials. A solvent exchange was then conducted, evaporating the methylene chloride/acetone via
nitrogen gas while heated in a water bath at 50°C and reconstituting the extracted
phenanthrene in 20 mL methlyene chloride prior to gas chromatography-mass spectrometry
(GC-MS) analysis
A positive control to examine the efficiency of the ASE extraction of phenanthrene from
fish tissue was performed. Eight rainbow trout not previously exposed to phenanthrene were
sacrificed by applying a lethal dose of MS-222. Four fish were injected with 20 µg of
phenanthrene and split into two replicates and all eight were dried overnight (105°C). These
fish were prepared and extracted in the same method described previously.
For these fish extracts, an Agilent 7890A GC and Agilent 5975C MS was used.
Compound separation was achieved using a J & W Scientific DB5-MS column (30 cm x 250 µm x
0.5 µm; Agilent Tech., Santa Clara, CA) with a sample injection of 1 µL. The inlet temperature
was 280°C and the oven temperature was set at 80°C for 2 min, 12°C for 1 min, and then 280°C
for 1 min with constant helium flow at 1.5 mL/min. MS parameters included a 320°C transfer
temperature, a 230°C source temperature and a 150°C quadrupole temperature. Acquisition
was made using the selective ion monitoring (SIM) mode with the primary mass 178 and
confirming masses of 152 and 76 for phenanthrene. A phenanthrene standard curve was

24
created using the following concentrations: 100, 50, 10, 5, and 1 mg/L in methanol (Figure 10,
Appendix B).
Statistical Analysis
T-tests, ANOVA and Tukeys tests (significance t<0.05) were used to evaluated statistical
significance. Statistical comparisons, using a t-test, were made between contaminated
sediment treatments with and without remediation in water dissolved oxygen levels. ANOVA
and Tukeys tests were utilized to make statistical comparisons of fish condition factors as a
result of treatment type and the environmental parameters pH, dissolved oxygen, and
temperature, as well as to compare phenanthrene concentration in the fish. Statistical
comparisons, using a t-test, were also made between fish condition factor for each of the
treatment means for treatments with sediment.
2.3 Results
2.3.1 Environmental Conditions
Temperature during Phases 1 and 2
The temperature within each aquarium was similar throughout each phase of the
experiment (Figure 2). Variation occurred between replicates within the treatments based
upon their location in the environmental chamber. Aquaria located near the bottom of the
environmental chamber were colder than those located at the top; each treatment had a
replicate at each level in the environmental chamber. Replicates located on the top shelf of the
environmental chambers had the highest temperatures with a range of 13.5—15.3°C for Phase I

25
and 14.7—15.3°C for Phase II. Replicates located at the bottom of the environmental chambers
had the lowest relative temperatures with a temperature range of 2.0—9.9°C for Phase I and
3.3—13.3°C for Phase II. Replicates located in the middle had a temperature range of 12.4—
14.4°C for Phase I and 12.9—15.4°C for Phase II. Treatments 1 (contaminated sediment) and 2
(contaminated sediment with remediation) were in one environmental chamber and
treatments 3 (non-contaminated sediment with remediation) and 4 (water only) in another.
Dissolved Oxygen during Phases 1 and 2
Dissolved oxygen was also constant within a given aquarium (Figure 2). As dissolved
oxygen saturation is a function of temperature, the observed dissolved oxygen level varied
between replicates based on the location each treatment replicate with in the environmental
chamber. Aquaria with lower temperatures had higher dissolved oxygen levels. Again,
replicates located in the upper part of the environmental chamber had the lowest relative
dissolved oxygen concentration. Water dissolved oxygen was greater than 7.66 mg/L in all
replicates. Replicates located in the lower part of the environmental chamber had the highest
relative dissolved oxygen concentration and lowest relative temperatures.
Although temperatures were comparable between replicates located in similar sections
of the environmental chamber, there was a statistical difference observed between dissolved
oxygen levels in the contaminated sediments with and without remediation. During Phase I,
replicates of treatment 1 and 2 in the top of the environmental chamber had statistically
different dissolved oxygen levels (t<0.0001), as did replicates of treatment 1 and 2 in the middle
of the environmental chamber (t=0.0022) and replicates of treatment 1 and 2 located in the

26
bottom of the environmental chamber (t=0.0242). During Phase II, replicates of treatment 1
and 2 located at the top of the environmental chamber were statistically different (t<0.0001),
as were replicates of treatment 1 and 2 located in the bottom of the environmental chamber
(t<0.0001).
pH during Phases 1 and 2
The pH of the water was consistent in replicates over time (Figure 3). Phase II had a
higher pH in the corresponding aquaria for each replicate. Contaminated sediment replicates
had a similar mean pH as the contaminated sediment with remediation replicates; mean pH
ranged from 8.29 to 8.68 in all aquaria. The greatest error (standard deviation/mean) for pH
was less than 1.5% in all aquaria with sediment (treatments 1, 2 and 3) for both phases.

27
Figure 2. Temperature (°C) plotted against dissolved oxygen (mg/L) for contaminated sediment replicates (closed circles) and contaminated sediment with remediation replicates (open circles with x’s). The differences in color represent different replicates, warm (red), mid (green) and blue (cool).
12
11
10
9
8
7
Phase 1
12
11
10
9
8
7
1614121086
Phase 2
Dis
so
lve
d O
xyg
en
(m
g/L
)
Temperature (Degrees Celcius)

28
Figure 3. Daily water pH values for aquaria with the three sediment treatments.
8.8
8.4
8.0
7.6
Contaminated with RemediationCool
8.8
8.4
8.0
7.6
Contaminated with RemediationMid-Temp
8.8
8.4
8.0
7.6
Contaminated with RemediationWarm
8.8
8.4
8.0
7.6
Contaminated Sediment Mid-Temp
8.8
8.4
8.0
7.6
Contaminated SedimentCool
8.8
8.4
8.0
7.6
5/19/2009 6/3/2009 6/18/2009 7/3/2009 7/18/2009
Date
Non-Contaminated with RemediationCool
8.8
8.4
8.0
7.6
Non-Contaminated with RemediationMid-Temp
8.8
8.4
8.0
7.6
Non-Contaminated with RemediationWarm
8.8
8.4
8.0
7.6
Contaminated SedimentWarm
pH

29
Sediment Phenanthrene Degradation
Sediment phenanthrene concentrations decreased significantly from initial levels under
both the remediation and non-remediation treatments (Figure 4). The highest decrease in
phenanthrene concentration during Phase I was observed in the contaminated sediment
treatments with a total decline of 92%. During Phase II, the highest level of degradation was
observed in the contaminated sediments without remediation; however, the aquarium with the
greatest decrease in phenanthrene concentration was observed in a sediment replicate
undergoing the remediation treatment. Phenanthrene degradation byproducts were seen at
relatively low levels in relationship to phenanthrene (Figure 9, Appendix A).
Figure 4. Phenanthrene concentration (mg/kg sediment) during the start of Phase I (Initial), the end of Phase I (Mid), and the end of Phase II (Final). Lighter colored bars on the left represent the mean value of the contaminated sediment treatment and the darker bars on the right represent the mean values of the contaminated sediment with remediation treatment. Error bars represent standard deviation.
100
80
60
40
20
0
Phenanth
rene (
mg/k
g s
edim
ent)
Initial Mid Final
Sampling Time

30
2.3.2 Fish Condition
Length-Weight Relationships
The condition factor, “k”, was used in this study to normalize the length and weight of
fish between replicates due to possible differences in growth as a result of temperature. The
condition factor is a relative measurement of the robustness or well being of a fish; a healthy
fish should have a condition factor close to 1.0. The condition factor was determined by the
equation:
where k = condition factor, W = weight in grams, and L= length in millimeters. During Phase I,
condition factors were highest in the contaminated sediment undergoing the remediation
treatment (mean k=0.99, sd=0.05), followed by the non-remediated contaminated sediment
treatment (mean k=0.96, sd=0.06), and finally the non-contaminated sediment with
remediation and the water only treatments (mean k=0.94, sd=0.06 and 0.07 respectively)
(Figure 5). Condition factors were relatively close to 1.0 for all treatments. Statistical
differences in fish condition factor were observed between fish in the contaminated sediment
with remediation treatment and the non-contaminated sediment with remediation treatment
(t=0.0013) as well as between fish in the contaminated sediment with remediation treatment
and the water only treatment (t=0.0034). The survival in all aquaria in Phase I was 100%.
In Phase II condition factors were highest in the non-contaminated sediment with
remediation (k=1.06, sd=0.25), followed by the non-remediation contaminated sediment
31
treatment (k=0.99, sd=0.19), then the water only treatment (k=0.97, sd=0.20) and finally the
contaminated sediment undergoing remediation (k=0.94, sd=0.19) (Figure 6). All condition
factors were relatively close to 1.0 as in Phase I. Statistical differences in fish condition factor
were observed between fish in the contaminated sediment treatment and the contaminated
sediment with remediation (t=0.0280), the contaminated sediment undergoing remediation
treatment and the non-contaminated sediment undergoing remediation treatment (t=0.0003),
and the non-contaminated sediment undergoing remediation treatment and the water only
treatment (t=0.0117). However, the contaminated sediment undergoing remediation
treatment had the highest survival (90%) followed by the contaminated sediment (89%), and
then the non-contaminated sediment undergoing remediation (88%) with the water only
treatment having the lowest survival (81%). The only significant difference, using a t-test to
compare treatment survival means, was observed between treatment 2 and 4 (t=0.0496).

32
Figure 5. Fish condition factor (k) for Phase I (juvenile). Each treatment has three replicates. The change in color within the box represents the median fish k, the lower half of the box represents the 1st quartile, the top the 3rd quartile. The bottom whisker represents the lower of the minimum k value or 1.5 X * (3rd quartile – 1st quartile). “x” represents an outlier as determined by a k value less than or greater than 1.5 * (3rd quartile – 1st quartile). Mean k values were significantly different between treatments 2 and 3 (denoted by *).
Treatment 1 Treatment 2 Treatment 3

33
Figure 6. Fish condition factor (k) for Phase II (yolk-sac stage). The change in color within the box represents the median fish k, the lower half of the box represents the 1st quartile, the top the 3rd quartile. The bottom whisker represents the lower of the minimum k value or 1.5 X * (3rd quartile – 1st quartile). “x” represents an outlier as determined by a k value less than or greater than 1.5 (3rd quartile – 1st quartile). Mean k values were significantly different between treatments 1 and 2 (denoted by *) and treatments 2 and 3 (denoted by **).
Treatment 1 Treatment 2 Treatment 3

34
The hepatosomatic index (HSI), the ratio of liver weight to body weight, was measured
and varied across treatments. Increases in HSI have been linked to fish exposure to PAH
contamination (Pinkney et al., 2001). The lowest mean HSI value was observed in the
contaminated sediment undergoing remediation treatment (mean HSI=1.08, sd=0.25). The
highest mean HSI was observed in the water only treatment (mean HSI=1.38, sd=0.50), with the
contaminated sediment (mean HSI=1.21, sd=0.40) and non-contaminated sediment undergoing
remediation (mean HSI=1.14, sd=0.33) yielding intermediate HSI values. Variation in HSI values
was large as indicated by the standard deviation. Only treatments 2 and 4 were statistically
different (t=0.0464).
Fish Accumulation of Phenanthrene
Phase I of the experiment showed that phenanthrene accumulated in the rainbow trout
tissue. In the contaminated sediment treatment, phenanthrene values ranged from 26.0 to
34.7 mg per kg of fish tissue, with a mean value of 31.8 mg per kg fish tissue (sd=5.1 mg/kg)
(Figure 7). In the contaminated sediment with remediation, phenanthrene ranged from 4.4 to
114.0 mg per kg of fish tissue, with a mean value of 67.7 mg per kg of fish tissue (SD=56.7
mg/kg). No statistical difference in fish uptake of phenanthrene was observed between
treatment 1 and 2 (ANOVA, F=0.337). Phenanthrene degradation byproducts were not seen in
large amounts relative to phenanthrene in the fish tissue (Figure 11, Appendix B).
Phase II of the experiment showed that phenanthrene accumulation in the yolk-sac
rainbow trout was not detected. The two positive control samples of fish injected with
phenanthrene yielded phenanthrene recoveries from fish tissue of 79% and 84%.

35
Figure 7. Mean phenanthrene concentrations in fish tissue for Phase 1 (mg phenanthrene/kg fish tissue). Error bars represent the standard deviation.
120
100
80
60
40
20
0
Phenanth
rene (
mg/k
g fis
h tis
sue)
Contaminated Sediment Treatment Contaminated Sediment with Remediation

36
Impacts of Treatment and Environmental Conditions upon Fish Condition Factors
Phase 1
Results of ANOVA analysis comparing the mean fish condition factor between
treatments 1, 2 and 3 (treatments with sediment present) in Phase I suggests that there are
differences when comparing the treatments together, although it is not significant at the 0.05
level (F=0.087). However, this suggests that there are differences between fish condition
factors between individual treatments. Using the Tukey method to compare individual
treatments showed that treatments 2 (contaminated sediment undergoing remediation,) and 3
(non-contaminated sediment undergoing remediation) exhibited a statistical difference
(P=0.077). No statistical differences were observed in fish condition factors between
treatments 1 and 2, or 1 and 3 (P=0.282 and 0.589, respectively).
When comparing fish condition factors between treatment types after adjusting these
values for temperature, dissolved oxygen and pH variation, no significant impacts was
observed. ANOVA analysis when taking temperature into account yielded F=0.064 as compared
to F=0.087 before adjusting for temperature. ANOVA analysis when accounting for dissolved
oxygen and pH yielded F=0.072 and F=0.119, respectively, as compared to the F=0.087 value
when comparing fish condition factor with just the treatment type. Tukey analysis between
each individual treatment, suggests that temperature, dissolved oxygen and pH do not have an
effect on condition factor by treatment type, as similar P values are found when accounting for
the three variables as when just comparing fish condition factor with treatment type. All
statistical results were checked for normality using the Shapiro-Wilk test and variability of

37
normal distribution. Variability in normal distribution was adjusted as needed using the Kendal
Roger method.
Phase II
Results of ANOVA analysis comparing the mean fish condition factor between
treatments 1, 2 and 3 (treatments with sediment present) in Phase II suggests that there are
differences when comparing the treatments together, although it is not significant at the 0.05
level (F=0.139). However, this suggests that there are differences between fish condition
factors between individual treatments. Using the Tukey method to compare individual
treatments showed that treatments 2 (contaminated sediment undergoing remediation) and 3
(non-contaminated sediment undergoing remediation) exhibited a statistical difference
(P=0.122). No statistical differences were observed in fish condition factor between treatments
1 and 2, or 1 and 3 (P=0.503 and 0.509 respectively).
When comparing fish condition factors between treatment types after adjusting these
values for temperature, dissolved oxygen and pH variation, no significant impacts was
observed. ANOVA analysis taking temperature into account yielded F=0.184 as compared to
F=0.139 before adjusting for temperature. ANOVA values when accounting for dissolved
oxygen and pH are F=0.221 and F=0.111 respectively as compared to the F=0.139 value when
comparing fish condition factor with just the treatment type. Tukey analysis between each
individual treatment suggests that temperature, dissolved oxygen and pH do not have an effect
on condition factor by treatment type. P values are lower when comparing just the treatment
and the fish condition factor than when accounting for the three variables. All statistical results

38
were checked for normality using the Shapiro-Wilk test and variability of normal distribution.
Variability in normal distribution was adjusted as needed using the Kendal Roger method.
2.4 Discussion
Environmental Condition
Within the non-static aquaria, which received daily or every other day water changes,
the sediment remediation did not have an impact on temperature. The temperature, regulated
by the environmental chamber, was considerably stable within each aquarium. Differences
within treatments were observed based upon the location within the environmental chamber –
those closer to the refrigeration output were relatively cooler than those located further away.
A remedial impact upon temperature was not observed.
Dissolved oxygen saturation in water is highly correlated with temperature, but was
significantly higher in replicates undergoing remediation. Within the range of temperatures
observed during this experiment, a higher dissolved oxygen concentration would be expected
in aquaria with lower temperatures. This trend was observed, however, there was a significant
difference between dissolved oxygen levels between aquaria with contaminated sediment not
undergoing remediation and those undergoing remediation. The goal of the remediation
method utilized in this experiment was to add oxygen to the sediment to increase microbial
degradation of phenanthrene. It seems that additional oxygen was added to the water as well.
Even with the constant water changes, dissolved oxygen was significantly greater in the
remediated replicates, suggesting that oxygen release was rapid within the aquaria. Water

39
changes did remove the top portion of the water column, but aeration via pump and air stone
resulted in constant water mixing within aquaria.
The statistical increase in dissolved oxygen in the water as a result of remediation could
potentially be useful in scenarios other than contaminant remediation. During this experiment,
daily water dissolved oxygen concentrations were all above 7 mg/L, most likely a result of
constant aeration. At or above this level, no detrimental impacts should be observed to aquatic
life due to oxygen limitations. However, in a situation where aquatic dissolved oxygen levels
are at concentrations that may be detrimental to aquatic life, a similar remedial strategy could
be beneficial. Highly polluted or anthropogenically influenced eutrophic bodies of water can
result in high biological oxygen demand that create “dead zones.” Utilizing the novel
remediation proposed in this experiment could increase dissolved oxygen levels in the
sediment and/or closely associated bottom water strata.
Water pH levels were also stable during the experiment, most likely a result of water
changes. This would suggest that the remediation proposed in this experiment would not
significantly alter the pH in a dynamic system. In a different complementary study investigating
the application of ORC® as a sediment remediation method that used static systems without
fish, pH significantly increased in the remediation treatments (Schaffnit, 2009). Thus in a lentic
system (e.g. a lake) without flow, pH may be of concern.
Phenanthrene degradation occurred in both the remediated and non-remediated
treatments with contaminated sediment, but no statistical difference was observed. The large
decrease in phenanthrene in these two treatments could have resulted from the prevalence of
the newly added, bioavailable phenanthrene used as an energy source by microorganisms. The

40
method in which the sediment was prepared and mixed prior to the study may also help explain
the similar phenathrene degradation rates, even in the absence of the remediation treatment.
Oxygen was likely added into the sediment during sediment phenanthrene mixing, such that it
was not initially anoxic. In addition, other phenanthrene degradation mechanisms were likely
occurring within the sediment enhancing degradation, even without oxygen additions. These
mechanisms are physical, chemical and biological, even though this study aimed to enhance
microbial biodegradation using reactive solids to increase oxygen levels.
An unexpected increase in the sediment phenanthrene concentration was observed
from the middle sampling point to the end sampling point in the remediated sediment. Grab
samples were used to evaluate phenanthrene concentrations in the sediments, and a non-
uniform spatial distribution of this compound may have created an experimental error that
accounts for this phenomenon. Degradation is likely not occurring in a uniform fashion within
the sediment and a degree of spatial variation is expected.
Given additional time, differences in the sediment phenanthrene concentrations may
have been observed such that the remediated sediment had a lower level than the un-
remediated sediment. This is because the readily bioavailable phenanthrene, nutrients and
oxygen would be used relatively quickly by microbial degraders. As nutrients and oxygen are
used in both sediments, oxygen would continue to be supplied via the solid peroxide blocks in
the remediated sediment. Given time to reach a steady state, the sediment without
remediation would reach low dissolved oxygen concentrations.
Thresholds for sediment PAH concentrations proposed by Johnson et al. (2002) are less
than 1 ppm dry weight of sediment. This level is based upon a significant increase in liver

41
lesions and diminished indicators of reproductive function in fish above this level (Johnson et
al., 2002). In this study, although the sediment was artificially spiked, phenanthrene levels
were much higher than the 1 ppm threshold in both the remediated and un-remediated
treatments. This suggests that the sediment phenanthrene levels observed during this
experiment were at a level that may impart liver lesions and affect reproductive function,
especially if given adequate exposure time.
The release of degradation byproducts or an increase in bioavailability is possible during
contaminant degradation. Byproducts are also an issue of concern in addition to the initial
contamination. Degradation byproducts should be considered when conducting future
remediation experiments of this type.
Fish Condition
During Phase I the juvenile fish condition factors were highest in the contaminated
sediment undergoing remediation, followed by the contaminated sediment and then the non-
contaminated sediment with remediation. This is the opposite of what was expected, as the
contaminated sediment would be expected to have a negative impact upon fish condition.
However, during this phase no mortality was observed and condition factors were close to 1
and all were above 0.8. This suggests that neither the contamination in the sediment, nor the
remediation, nor the degradation byproducts had a large impact upon fish condition. It is
possible that because the juvenile fish had a relatively low association with the sediment, little
impact would be observed and therefore minimal differences would be observed in fish
condition factors. This might suggest that phenanthrene and degradation byproduct levels in

42
the water were insignificant in affecting fish condition factor. Fish at this point in their lives are
heartier than during earlier life stages. Further examination into sediment byproducts and fish
metabolism of phenanthrene is needed.
During Phase II, fish condition factors for the yolk-sac stage trout were the opposite of
those observed in Phase I. The non-contaminated sediment undergoing the remediation
treatment had the highest fish condition factors, followed by the contaminated sediment
treatment and then the contaminated sediment with remediation treatment. This was
expected as a result of both the initial contamination and potential degradation byproducts
from the contaminated sediment undergoing remediation having an impact upon fish
condition. The non-contaminated sediment with remediation was expected to have the highest
fish condition factor as a result of no contamination. The association between the yolk-sac fry
and the sediment is large, as physical contact occurs between the fish and the sediment during
this stage. Physical contact with the contaminant or degradation byproducts could have
resulted in the observed differences in fish condition factors between treatments. The
treatment undergoing remediation could potentially be making the contaminant and
degradation byproducts more bioavailabe.
Mortality was observed during the second phase of the experiment. Even though
observed fish condition factors were lowest in the contaminated sediment with remediation
treatment of the three sediment treatments, survival was the highest in this treatment (90%).
Fish condition factor did not account for mortalities, thus this specific treatment could have
been lowered by fish that were in poor condition but did not die as they may have in other
treatments. Overall, all the sediment treatments provided a higher survivorship (90%, 89%,

43
88%) of fish than the water only treatment (81%). Fish mortality specifically due to PAH
contamination has been observed in previous studies (Fragoso et al., 2006; Jonsson et al.,
2004). Although this experiment utilized just phenanthrene instead of a group of PAHs that
would be found in naturally contaminated sediment, exposure to the single contaminant could
help explain mortality in contaminated treatments. Differences in mortality between
treatments in this experiment could be a result of the sediment acting as a sink and buffer to
the fish waste or that the remedial practice had a positive impact upon fish survivorship.
Differences in condition factors could be attributed to unmeasured environmental
differences between replicates. Potential differences within aquaria could have resulted from
the preparation method or variations in sediment composition even after homogenization.
Other factors could include fish density in aquaria and resulting fish waste products. Fish
behavior, as a result of density and relative differences in fish size, could also impact both
condition factor and survivorship. Other un-realized environmental condition impacts may also
be influencing fish condition.
The hepatosomatic index, which was only evaluated during the first phase of the
experiment, revealed convoluted results. The water only treatment provided the highest HSI,
followed by the contaminated sediment treatment, non-contaminated sediment with
remediation, and finally the contaminated sediment with remediation. Expected results would
have been to see both contaminated sediment treatments to have the highest HSI as this value
has been shown to positively correlate with a contaminated environment, specifically in regards
to elevated PAH metabolite levels in fish (Pinkney et al., 2003). Although this study did not
examine PAH metabolites, this premise suggests that these metabolites were either limited in

44
the contaminated sediment treatments or did not affect HSI. However, Yang and Baumann
(2006) observed little correlation between HSI and PAH contamination when examining brown
bullhead (Ameiurus nebulosus), but concluded this was due to low PAH exposure
concentrations. In this study, HSI correlation with contaminated sediment may not have been
high as a result of human error while dissecting the fish to remove the liver or other
environment effects within the aquaria, in addition to insufficient exposure to phenanthrene
and its metabolites.
Accumulation of phenanthrene in fish tissue was observed in Phase I of this study.
There was a greater mean phenanthrene accumulation in fish tissue within the contaminated
sediment undergoing remediation than in the contaminated sediment treatment only. This
may indicate that the remediation method tested increased the phenanthrene bioavailability to
the fish. When comparing the extracted phenanthrene concentration (mg/kg) in the sediment
with the extracted phenanthrene concentration in the fish tissue, there was approximately a
1:1 ratio in the contaminated sediment with remediation treatment versus a 2:1 ratio in the
contaminated sediment treatment. However, the lowest amount of accumulation detected
was observed in one of the treated sediment replicates. The standard deviation was higher in
the contaminated sediment with remediation compared to the contaminated sediment
treatment (sd=5.1 vs 56.7 mg/kg). The large phenanthrene concentration difference observed
in the sediment undergoing remediation could have non-uniform distribution of phenanthrene
in the sediment due to degradation rates being higher near the reactive solids, and the random
selection of sediment samples for analysis.

45
In comparison to other sediment remediation techniques, the novel method tested in
this study may have a similar or lesser impact upon fish than the established methods. Cohen
et al. (2001) observed higher stress levels, as measured by oxygen consumption, in fish exposed
to remediated crude oil as compared to control groups. Two remediation techniques were
used: a water accommodated fraction and a chemically dispersed crude oil water
accommodated fraction (Cohen et al., 2001). When dredging contaminated sediment, Blom et
al. (1998) observed an increase in histopathological damage of rainbow trout immediately after
and up to two years after remediation (Blom et al., 1998). Pending minimal disturbance of the
sediment when implementing the novel remediation tested here, the solid peroxide method
could potentially increase contaminant degradation while limiting fish health impacts.
Phenanthrene levels accumulated in fish during Phase II were below detection levels.
The relative phenanthrene abundance in the sediment was less during Phase II than during
Phase I, which may account for in the negligible uptake by the fish even though there was a
closer physical association with the sediment compared to Phase I. Fragoso et al. (2006)
showed that direct physical contact of fish with contaminated sediment results in less
contaminant uptake by fish, but not significantly so, than indirect fish to sediment contact
based upon EROD activity associated with contaminant breakdown in fish (Fragoso et al., 2006).
In summary, the remediation proposed in this study did not appear to negatively affect
the environmental parameters measured or fish condition, even though contaminant uptake
was observed during Phase I. Over the time period of this study, no significant difference was
observed between the amount of phenanthrene degradation in the non-remediated and
remediated treatments. However, treatments undergoing remediation increased water

46
dissolved oxygen significantly, but did not greatly affect pH. There were significant differences
observed in fish condition factors during Phase I between treatments 2 (contaminated
sediment undergoing remediation) and 1 (contaminated sediment). Significant differences
were also observed in condition factors between treatments 3 (contaminated sediment
undergoing remediation) and 2 and treatments 2 and 3 in Phase II. However, fish condition
factors were still close to 1 in all treatments.

47
CHAPTER 3
3.0 CONCLUSIONS AND RECOMMENDATIONS FOR FUTURE RESEARCH
Practical Remediation Implementation
In this experiment the proposed remediation method did not significantly improve
phenanthrene degradation. However, in a complementary study examining the same
remediation method under different conditions did yield a significant reduction in sediment
phenanthrene levels (Schaffnit, 2009). There were several variations between the two
experimental designs, as the other study utilized a static system without bioturbation from fish,
water changes, and water circulation. Additionally, the sizes of the mesocosms used were
much smaller in scale and the entire sediment undergoing treatment was analyzed rather than
smaller sub-samples. It may be the case that the extent of degradation was underestimated in
the sediment undergoing remediation due to the selection of sub-samples from a non-uniform
sediment. Finally, the temperature under which this study was conducted was lower than that
maintained in Schaffnit (2009) in order to provide adequate conditions for the trout, although
the durations over which the studies were conducted were the same. This decrease in
temperature could have slowed biological activity, and thus decreased degradation rates.
Evaluating the effectiveness of this remediation method using different sediment types
is something that should be evaluated. Sediment characteristics, such as particle size and
organic matter content, may help dictate the remediation potential. Experimentation on other
contaminant types may also prove to be advantageous. Additionally, a field or pilot study may
be beneficial in determining the remediation effectiveness under real-world conditions. In this
scenario, a method must be determined to get the reactive solids into the sediment. Injection

48
of a peroxide slurry, solid spikes, or another method must be utilized to minimize sediment re-
suspension and an increase in turbidity.
Fish Related Aspects
If additional laboratory studies are to be performed based upon the experimental
design used in this study, additional parameters could be evaluated and modifications could be
made in the design. Contaminant metabolite analysis in the sediment, water and fish tissue
would provide greater insight into the degree of degradation in the sediment, what the
metabolite pathways are, and if metabolites are a concern in regards to fish health. This
additional analysis would also help to evaluate how much degradation is occurring and if it is
indeed the result of microbial activity. Furthermore, determining the contaminant metabolites
in fish would be beneficial to assess how much of the contaminant is actually affecting the fish.
Fish liver enzyme activity could similarly be evaluated to determine if fish are metabolizing
contaminants.
If conducting this study again, evaluating more fish parameters would be beneficial.
Within the aquaria, measurements of ammonia, nitrate and nitrite should be measured to
evaluate if fish waste products affect fish condition factor values under the conditions
examined. With more funding, fish behavior could also be evaluated, via video camera,
examining the interaction between fish and the sediments.
Changing the feeding regime from a surface feed to one that includes food grown in the
sediment, such as invertebrates, may also give a better estimate of contaminant uptake and
accumulation within fish. Contaminant accumulation also occurs via the food chain (Oliver and
49
Niimi, 1988) where salmonids have significantly higher pollutant concentrations than species at
lower trophic levels. Either incorporating a food source that lives within the sediment or
providing feed with the chemical in question could help mimic natural contaminant pathways.
Muirhead et al. (2006) utilized such a method by feeding brine shrimp bio-encapsulated with
PBDE-47 to medaka.
A comparison of this study and one conducted in the field examining all fish species
present could provide practical information on how this remediation method effects on the
local biota. Including other fish species would be constructive, as each has its own niche and
association with sediment. This would also provide a more robust dataset, depending on how
long the contamination has been in the environment.
Other Remediation Uses
The novel remediation method proposed in this study may also be beneficial outside the
realm of contaminant remediation. Dissolved oxygen levels observed in the contaminated
sediment with remediation were significantly higher than those in the non-remediated
sediment. Implementing this remediation in a system with a high biological oxygen demand
could possibly improve environmental quality and ecosystem function.

50
4.0 LITERATURE CITED
Adams, S.M., Ryon, M.G., and Smith, J.G. 2005. Recovery in diversity of fish and invertebrate
communities following remediation of a polluted stream: investigating causal
relationships. Hydrobiologia. 542:77—93.
Åkerman, G. and Balk, L. 1995. A reliable and improved methodology to expose fish in the
early embryonic stage. Marine Environmental Research. 39:155—158.
Blom, S., Norrgren, L., and Förlin, L. 1998. Sublethal effects in caged rainbow trout during
remedial activities in Lake Järnsjön. Ambio. 5:411—418.
Cachot, J., Law, M., Pottier, D., Peluhet, L., Norris, M., Budzinski, H., and Winn, R. 2007.
Characterization of toxic effects of sediment-associated organic pollutants using the λ
transgenic medaka. Environmental Science and Technology. 41:7830--7836.
Cerniglia, C.E. 1992. Biodegredation of polycyclic aromatic hydrocarbons. Current Opinion in
Biotechnology. 4:331—338.
Chen, G., and White, P.A. 2004. The mutagenic hazards of aquatic sediments: a review.
Mutation Research. 567:151--225.
Cohen, A., Nugegoda, D., and Gagnon, M.M. 2001. Metabolic responses of fish following
exposure to two different oil spill remediation techniques. Ecotoxicology and
Environmental Safety. 48:306—310.
Connell, D.W. 1990. Bioaccumulation of Xenobiotic Compounds. CRC, Boca Raton, FL, USA.
Fragoso, N.M., Hodson, P.V., and Zambon, S. 2006. Evaluation of exposure assay to measure
uptake of sediment PAH by fish. Environmental Monitoring and Assessment. 116:481—
511.
51
Gewurtz, S. B, Rodica, L., and Haffner, G.D. 2000. Comparison of polycyclic aromatic
hydrocarbon and polychlorinated biphenyl dynamics in benthic intertebrates of Lake
Erie, USA. Environmental Toxicology and Chemistry. 19(12):2943--2950.
Giulio and Hinton. 2008. The toxicology of fishes. CRC. Boca Raton, FL. USA.
Hankanen, J.O., Heinonen, J., and Kukkonen, J.V.K. 2001. Toxicokinetics of waterborne
bisphenol a in landlocked salmon (Salmo Salar M. sebago) eggs at various temperatures.
Environmental Toxicology and Chemistry. 20(10)2296--2302.
Hendricks, J.D., Wales, J.H., Sinnhuber, R.O., Nixon, J.E., Loveland, P.M., and Scanlan, R.A. 1980.
Rainbow trout (Salmo gairdneri) embryos: a sensitive animal model for experimental
carcinogenesis. Federation Proceedings. 39(14):3222-3229.
Hollert, H., Keiter, S., Konig, N., Rudolf, M., Ulrich, M., and Braunbeck, T. 2003. A new
sediment contact assay to assess particle-bound pollutants using zebrafish (Danio rerio)
embryos. Journal of Soils and Sediments. 3(3):197--207.
Johnson, L.L., Collier, T.K., and Stein, J.E. 2002. An analysis in support of sediment quality
thresholds for polycyclic aromatic hydrocarbons (PAHs) to protect estuarine fish.
Aquatic Conservation: Marine and Freshwater Ecosystems. 12:517—538.
Jonsson, G., Bechmann, R.K., Bamber, S.D., and Baussant, T. 2004. Bioconcentration,
biotransformation, and elimination of polycyclic aromatic hydrocarbons in sheepshead
minnows (Cyprinodon variegates) exposed to contaminated seawater. 2004.
Environmental Toxicology and Chemistry. 23(6):1538—1548.
Ke, L., Wang, W.Q., Wong, T.W.Y., Wong, Y.S., and Tam, N.F.Y. 2003. Removal of pyrene from
contaminated sediments by mangrove microcosms. Chemosphere. 51(1):25—34.

52
Koponen, K., Kukkonen, J.V.K., and Lindstrom-Seppa, P. 1998. Chemical accumulation and
biotransformation enzyme activities of rainbow trout embryos in waterborne exposure
to PCB-77. Marine Environmenta Research. 46(1—5)475-478.
Koponen, K., Lindstrom-Seppa, P., Kukkonen, J.V.K. 2000. Accumulation pattern and
biotransformation enzyme induction in rainbow trout embryos exposed to sublethal
aqueous concentrations of 3,3’,4,4’-tetrachlorobiphenyl. Chemosphere. 40:245--253.
Lei, L., Khodadoust, A.P., Suidan, M.T., and Tabak, H.H. 2005. Biodegradation of sediment-
bound PAHs in field-contaminated sediment. Water Research. 39:349—361.
Milston, R.H., Fitzpatrick, M.S., Vella, A.T., Clements, S., Gundersen, D., Feist, G., Crippen, T.L.,
Leong, J., and Schreck, C.B. 2003. Short-term exposure of Chinook salmon
(Oncoryhnchus tshawytscha) to o,p’-DDE or DMSO during early life-history stages causes
long-term humoral immunosuppression. Environmental Health Perspectives.
111(13):1601:-1607.
Muirhead, E.K., Skillman, A.D., Hook, S.E., and Schultz, I.R. 2006. Oral exposure of PBDE-47 in
fish: Toxocokinetics and reproductive effects in Japanese medaka (Oryzias latipes) and
fathead minnows (Pimephales promelas). Environmental Science and Technology.
40(2):523—528.
Myers, M.S., Anulacion, B.F., French, B.L., Reichert, W.L., Laetz, C.A., Buzitis, J., Olson, O.P., Sol,
S., Collier, T.K. 2008. Improved flatfish health following remediation of a PAH-
contaminated site in Eagle Harbor, Washington. Aquatic Toxicology. 88:277—288.

53
Oliver, B.G., and Niimi, A.J. 1988. Trophodynamic analysis of polychlorinated biphenyl
congeners and other chlorinated hydrocarbons in the Lake Ontario ecosystem.
Environmental Science and Technology. 22(4):388—397.
Palermo, M.R. 2001. A state of the art overview of contaminated sediment remediation in the
United States, International Conference on Remediation of Contaminated Sediments,
Venice, Italy.
Petersen, G.I. and Kristensen, P. 1998. Bioaccumulation of lipophilic substances in fish early life
stages. Environmental Toixicology and Chemistry. 17(7):1385—1395.
Pinkney, A.E., Harshbarger, J.C., May, E.B., and Melancon, M.J. 2001. Tumor prevalence and
biomarkers of exposure in brown bullheads (Ameiurus nebulosus) from the tidal
Patomac River, USA, Watershed. Environmental Toxicology and Chemistry. 20:1196—
1205.
Pruell, R.J., Rubinstein, N.I., Taplin, B.K., LiVolsi, J.A., and Bowen, R.D. 1993. Accumulation of
polycholorinated organic contaminants from sediment by three benthic marine species.
Archives of Environmental Contamination and Toxicology. 24:290—297.
Schaffnit, K.S. 2009. Solid peroxide stimulated phenanthrene removal from contaminated river
sediment. Master’s Thesis, Washington State University, Pullman, WA.
Stegeman, J.J. and Kloepper-Sams, P.J. 1987. Cytochrome P-450 isozymes and monooxygenase
activity in aquatic animals. Environmental Health Perspectives. 71:87—95.
Sundberg, H., Ishaq, R., Tjarnlund, U., Åkerman, G., Grunder, K., Bandh, C., Broman, D., and
Balk, L. 2006. Contribution of commonly analyzed polycyclin aromatic hydrocarbons

54
(PAHs) to potential toxicity in early life stages of rainbow trout (Oncorhynchus mykiss).
Canadian Journal of Fisheries and Aquatic Sciences. 63:1320—1333.
Talmage, S.S., Opresko, D.M., Maxwell, C.J., Welsh, C.J.E., Cretella, F.M., Reno, P.H., and Daniel,
F.B. 1999. Nitroaromatic munition compounds: environmental effects and screening
values. In Reviews on Environmental Contamination and Toxicology Vol. 161. Ware,
G.W., Nigg, H.N. and Doerge, D.R., eds. Springer-Verlay, New York, NY. 1—157.
Tank, Y.J., Carpenter, S.D. and Deming, J.W. 2006. Depth-related influences on biodegradation
rates of phenanthrene in polluted marine sediments of Puget Sound, WA. Marine
Pollution Bulletin. 52:1431—1440.
United States Environmental Protection Agency. 2004. The incidence and severity of sediment
contamination in surface waters of the United States, national sediment quality survey:
Second Edition. United States Environmental Protection Agency. EPA-823-R-04-007.
U.S. Federal Water Pollution Control Act. 2008. Title 33, Chapter 26, Section 307.
Van der Oost, R., Beyer, J., and Vermeulen, N.P.E. 2003. Fish bioaccumulation and biomarkers
in environmental risk assessment: a review. Environmental Toxicology and
Pharmacology. 13:57—149.
Von Westernhagen, H. 1988. Fish Physiology XIA, 253—346
Walker, M.K., Cook, P.M., Butterworth, B.C., Zabel, E.W.,and Peterson, R.E. 1996. Potency of a
complex mixture of polychlorinated dibenzo-p-dioxin, dibenzofuran, and biphenyl
congeners compared to 2,3,7,8-tetrachlorodibenzo-p-dioxin in causing fish early life
stage mortality. Fundamental and Applied Toxicology. 30:178--186.
55
Yang, X. and Baumann, P.C. 2006. Biliary PAH metabolites and the hepatosomatic index of
brown bullheads from Lake Erie tributaries. Ecological Indicators. 6:567—574.

56
5.0 APPENDIX A: HPLC STANDARD CURVES AND SAMPLE CHROMATOGRAM
Figure 8. Phenanthrene standard curve using HPLC. Values were 1, 5, 10, 50, 100-mg/L phenanthrene in methanol, calculated R2=0.999.
Figure 9. HPLC chromatogram output of phenanthrene extracted from a sediment sample.

57
6.0 APPENDIX B: GC-MS STANDARD CURVE AND POSITIVE CONTROL CHROMATOGRAM
Figure 10. Phenanthrene standard curve using GC-MS. Values were 1, 5, 10, 50, 100-mg/L phenanthrene in methanol, calculated R2=0.999.
Figure 11. GC-MS chromatogram output of phenanthrene extracted from a fish tissue sample.