Embed Size (px)
Citation preview
Impacts of Czech brown coal mines enlargement: assessment by energy model TIMES-CZ
1st AIEE Energy Symposium
Current and Future Challenges to Energy Security
Lukáš Rečka [email protected]
Milan Ščasný
Milan, 1st December, 2016
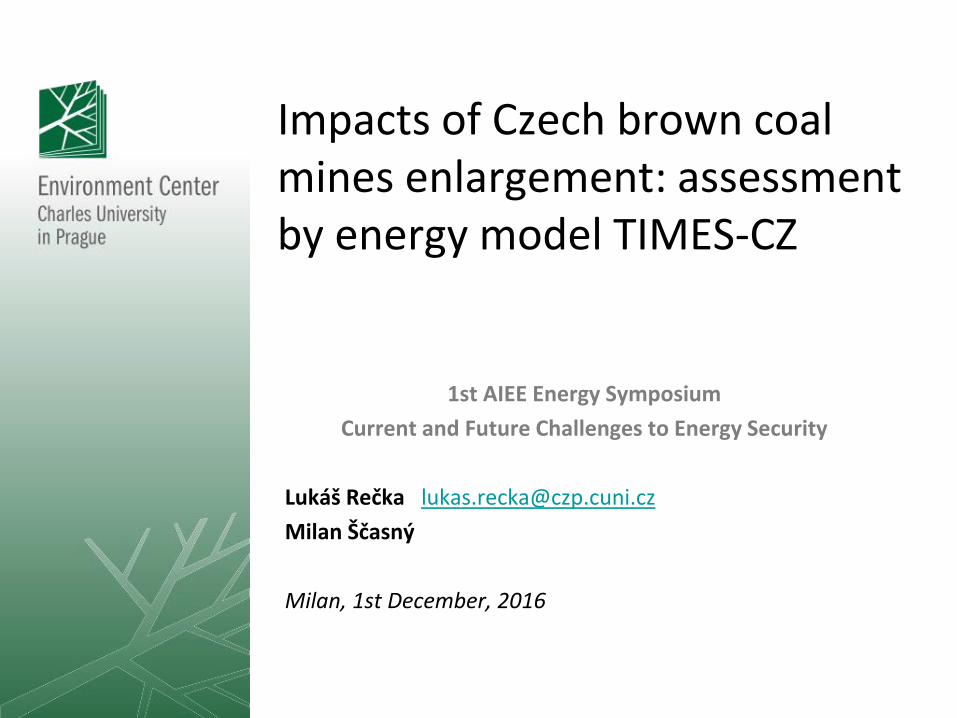
Motivation
Gross electricity production by resource and gross electricity consumption in
the Czech Republic in 1993-2013
0
10
20
30
40
50
60
70
80
90
100
19
93
19
94
19
95
19
96
19
97
19
98
19
99
20
00
20
01
20
02
20
03
20
04
20
05
20
06
20
07
20
08
20
09
20
10
20
11
20
12
20
13
TW
h
Wind
Biogas
Solar
Hydro
Biomass
Oil
Natural gas
Nuclear
Other
Brown coal/lignite
Hard coal
Gross electricity consumption
Source: Eurostat
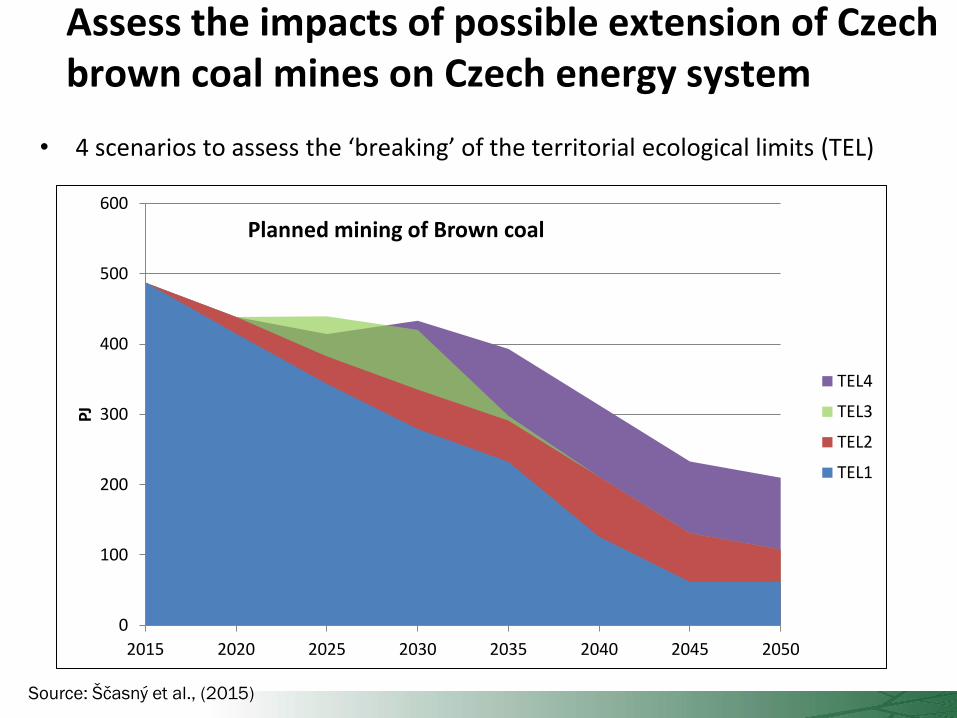
Assess the impacts of possible extension of Czech brown coal mines on Czech energy system
• 4 scenarios to assess the ‘breaking’ of the territorial ecological limits (TEL)
0
100
200
300
400
500
600
2015 2020 2025 2030 2035 2040 2045 2050
PJ
Planned mining of Brown coal
TEL4
TEL3
TEL2
TEL1
Source: Ščasný et al., (2015)
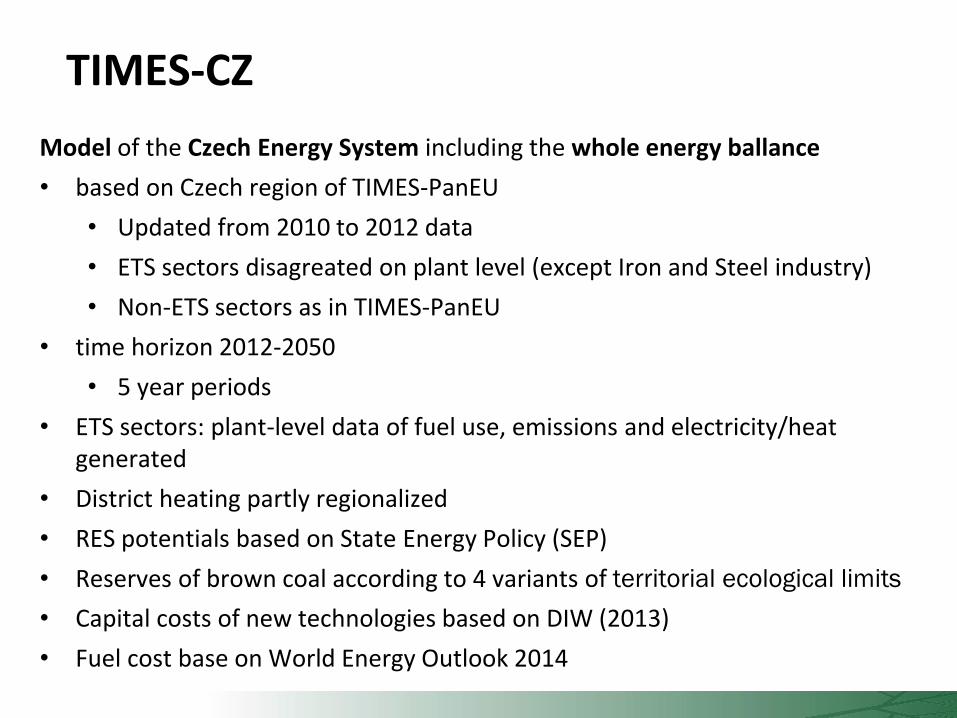
TIMES-CZ
Model of the Czech Energy System including the whole energy ballance
• based on Czech region of TIMES-PanEU
• Updated from 2010 to 2012 data
• ETS sectors disagreated on plant level (except Iron and Steel industry)
• Non-ETS sectors as in TIMES-PanEU
• time horizon 2012-2050
• 5 year periods
• ETS sectors: plant-level data of fuel use, emissions and electricity/heat generated
• District heating partly regionalized
• RES potentials based on State Energy Policy (SEP)
• Reserves of brown coal according to 4 variants of territorial ecological limits
• Capital costs of new technologies based on DIW (2013)
• Fuel cost base on World Energy Outlook 2014
PES
BC reserves
BC Imp./Exp.
Ele
ctr
icit
y
Co
ke
Dis
tric
t h
ea
t
Naft
a
Ga
so
lin
e
Ga
s
Ste
am
Households
BC heating
Gas heating
BM heating
ELC heating
Gas water boiler
District heating
Elc. water boiler
Elc. heat pump
Oil reserves
Oil Import
HC reserves
HC Imp./Exp.
Gas reserves
Gas Import
Biomass
potential
PV, CSP &
thermosolar
potential
Conversion
Sector
Coal processing
Refinery
Heat & Power
generation
Individual ETS sources
Residual heat plants
Nuclear power plants
Residual autoproducers
RES
Electrolysis
Gasisfication Liquefication
Gas processing
Ga
s
Bio
ma
ss
HC
BC
Oil
Win
d
Wa
rm w
ate
r
Ro
om
he
at
Wa
rm w
ate
r
Ro
om
he
at
Pro
ce
s. h
ea
t
LH
2
Commercial Room heat boilers
Process heat boilers
Warm water boilers
Industry
Transport Road
Road - freight
Rail - passanger
Rail - freight
Wind
potential
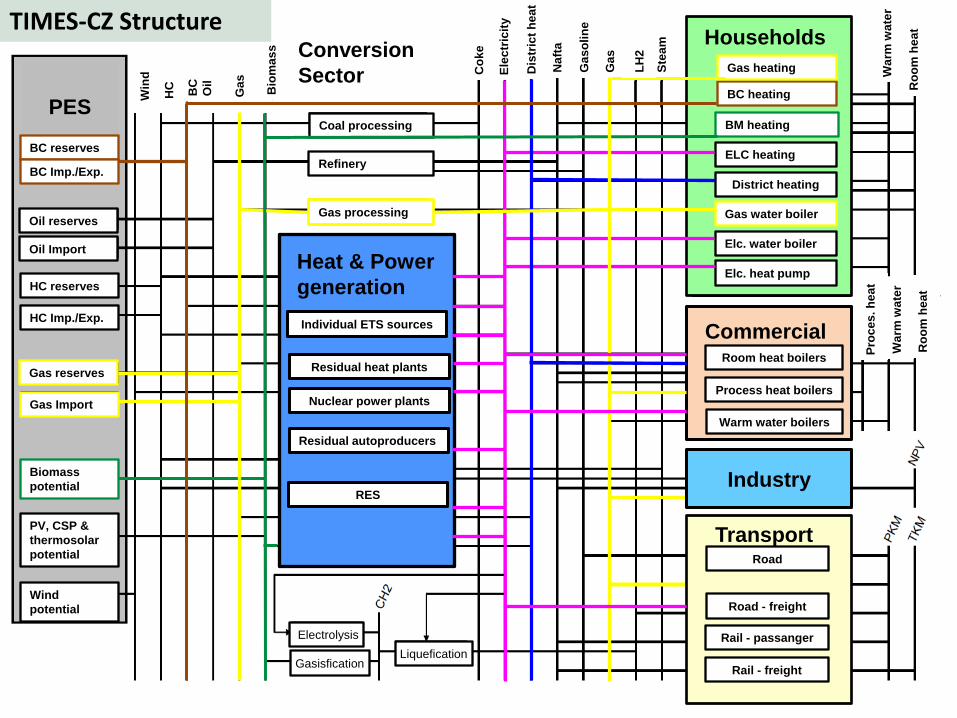
TIMES-CZ Structure
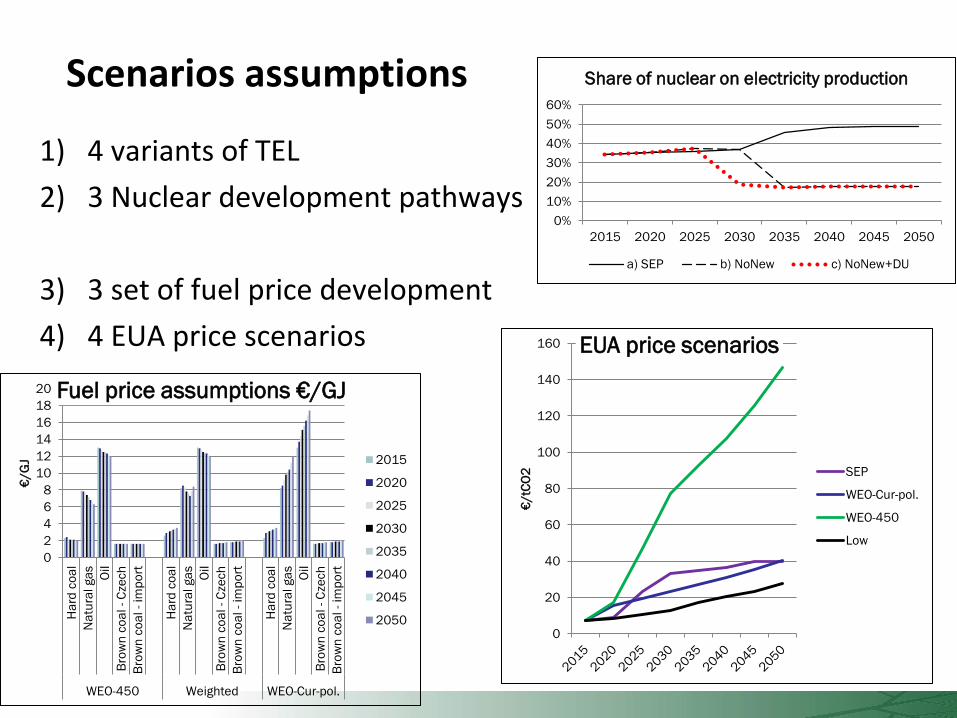
Scenarios assumptions
1) 4 variants of TEL
2) 3 Nuclear development pathways
3) 3 set of fuel price development
4) 4 EUA price scenarios
0%
10%
20%
30%
40%
50%
60%
2015 2020 2025 2030 2035 2040 2045 2050
Share of nuclear on electricity production
a) SEP b) NoNew c) NoNew+DU
0
2
4
6
8
10
12
14
16
18
20
Ha
rd c
oa
l
Na
tura
l ga
s
Oil
Bro
wn
co
al - C
zech
Bro
wn
co
al - im
po
rt
Ha
rd c
oa
l
Na
tura
l ga
s
Oil
Bro
wn
co
al - C
zech
Bro
wn
co
al - im
po
rt
Ha
rd c
oa
l
Na
tura
l ga
s
Oil
Bro
wn
co
al - C
zech
Bro
wn
co
al - im
po
rt
WEO-450 Weighted WEO-Cur-pol.
€/G
J
Fuel price assumptions €/GJ
2015
2020
2025
2030
2035
2040
2045
20500
20
40
60
80
100
120
140
160
€/tC
O2
EUA price scenarios
SEP
WEO-Cur-pol.
WEO-450
Low
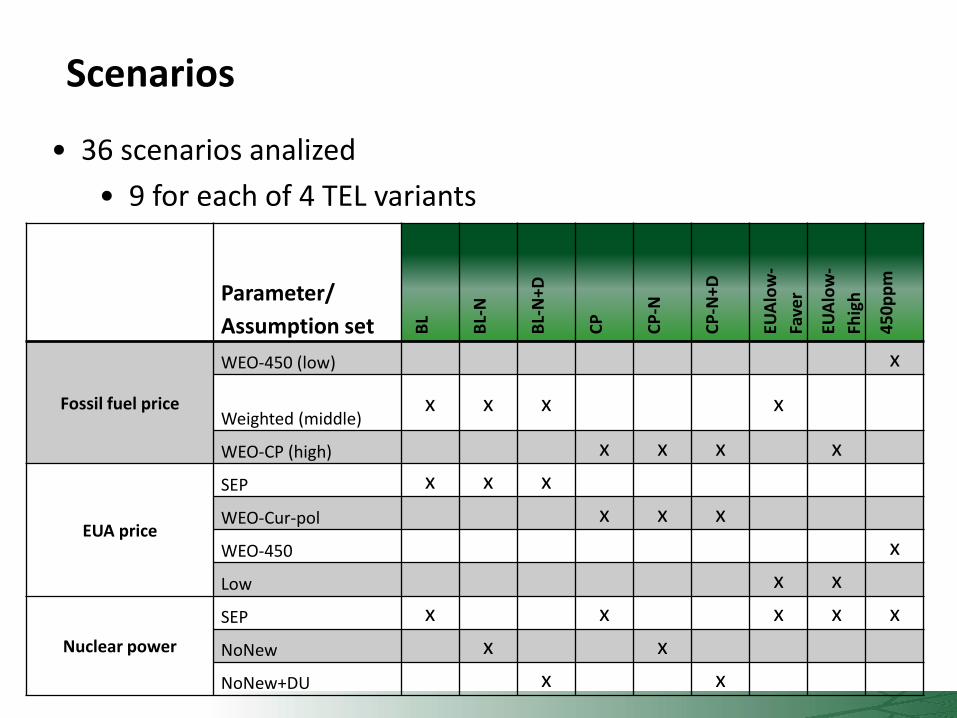
Scenarios
• 36 scenarios analized
• 9 for each of 4 TEL variants
Parameter/
Assumption set BL
BL-
N
BL-
N+D
CP
CP
-N
CP
-N+D
EUA
low
-
Fave
r
EUA
low
-
Fhig
h
45
0p
pm
Fossil fuel price
WEO-450 (low) x
Weighted (middle) x x x x
WEO-CP (high) x x x x
EUA price
SEP x x x
WEO-Cur-pol x x x
WEO-450 x
Low x x
Nuclear power
SEP x x x x x
NoNew x x
NoNew+DU x x
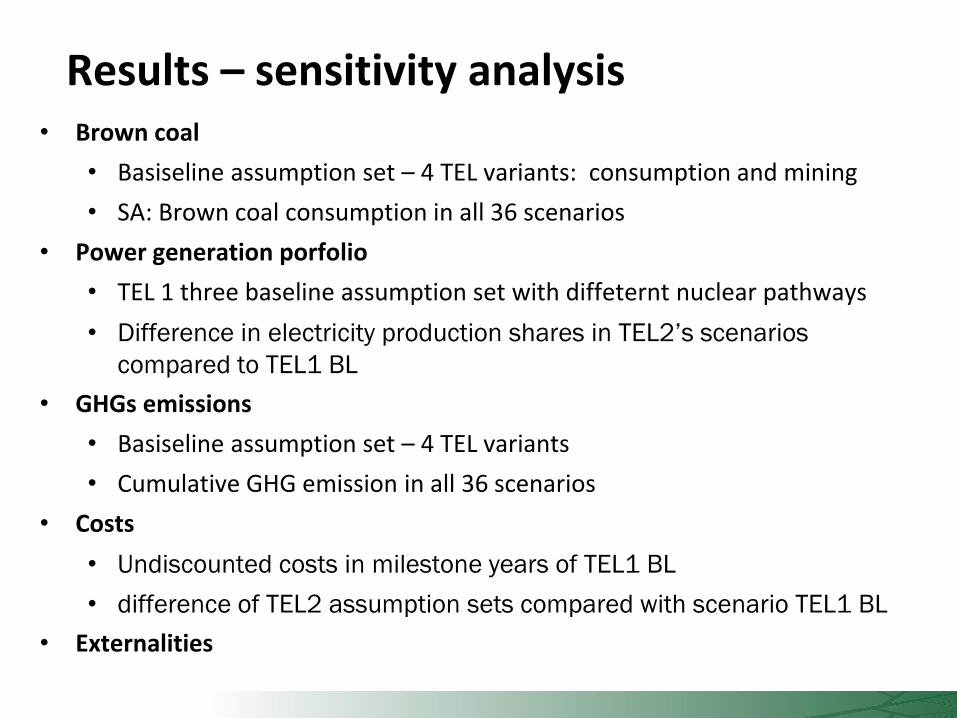
Results – sensitivity analysis • Brown coal
• Basiseline assumption set – 4 TEL variants: consumption and mining
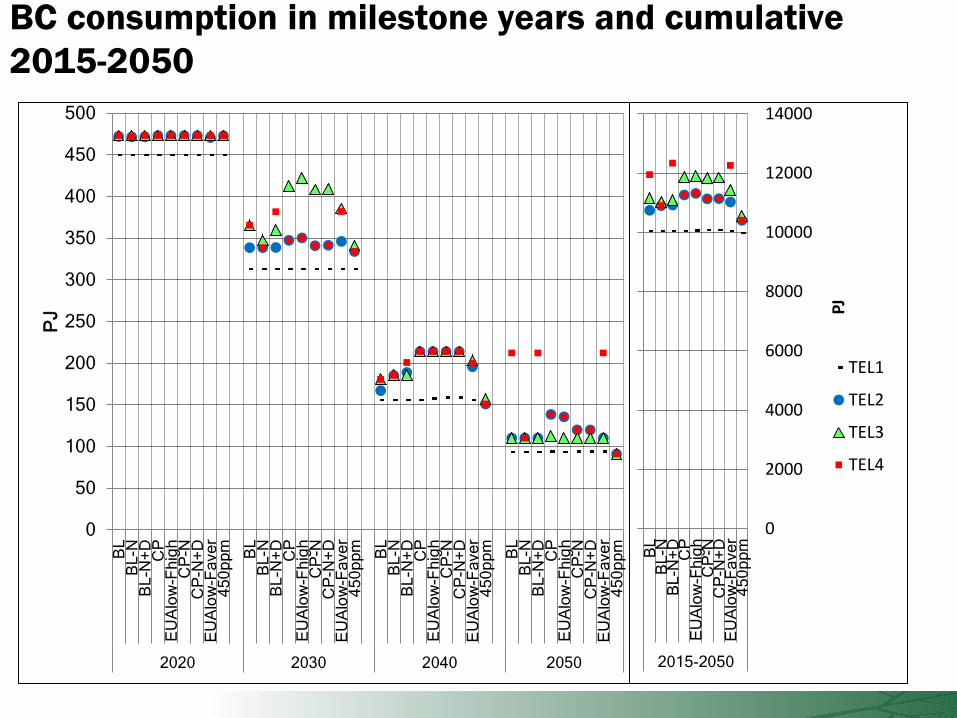
• SA: Brown coal consumption in all 36 scenarios
• Power generation porfolio
• TEL 1 three baseline assumption set with diffeternt nuclear pathways
• Difference in electricity production shares in TEL2’s scenarios
compared to TEL1 BL
• GHGs emissions
• Basiseline assumption set – 4 TEL variants
• Cumulative GHG emission in all 36 scenarios
• Costs
• Undiscounted costs in milestone years of TEL1 BL
• difference of TEL2 assumption sets compared with scenario TEL1 BL
• Externalities
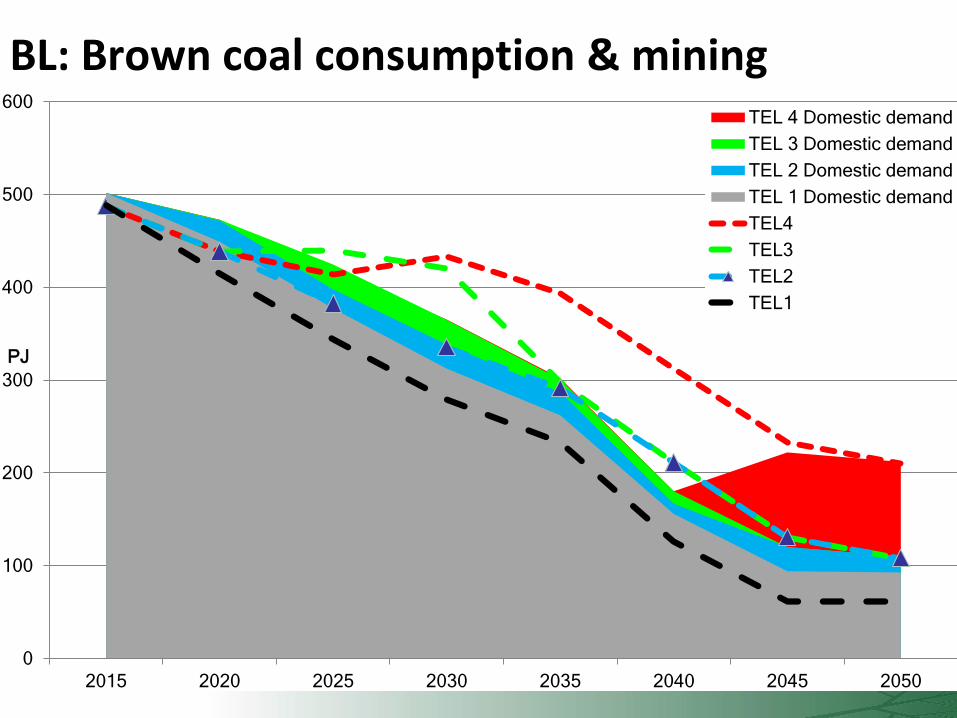
BL: Brown coal consumption & mining
0
100
200
300
400
500
600
2015 2020 2025 2030 2035 2040 2045 2050
PJ
TEL 4 Domestic demand
TEL 3 Domestic demand
TEL 2 Domestic demand
TEL 1 Domestic demand
TEL4
TEL3
TEL2
TEL1
0
50
100
150
200
250
300
350
400
450
500B
LB
L-N
BL
-N+
DC
PE
UA
low
-Fh
igh
CP
-NC
P-N
+D
EU
Alo
w-F
ave
r4
50
pp
m BL
BL
-NB
L-N
+D
CP
EU
Alo
w-F
hig
hC
P-N
CP
-N+
DE
UA
low
-Fa
ve
r4
50
pp
m BL
BL
-NB
L-N
+D
CP
EU
Alo
w-F
hig
hC
P-N
CP
-N+
DE
UA
low
-Fa
ve
r4
50
pp
m BL
BL
-NB
L-N
+D
CP
EU
Alo
w-F
hig
hC
P-N
CP
-N+
DE
UA
low
-Fa
ve
r4
50
pp
m
2020 2030 2040 2050
PJ
BC consumption in milestone years and cumulative
2015-2050
0
2000
4000
6000
8000
10000
12000
14000
BL
BL
-NB
L-N
+D
CP
EU
Alo
w-F
hig
hC
P-N
CP
-N+
DE
UA
low
-Fa
ve
r4
50
pp
m
2015-2050
PJ
TEL1
TEL2
TEL3
TEL4
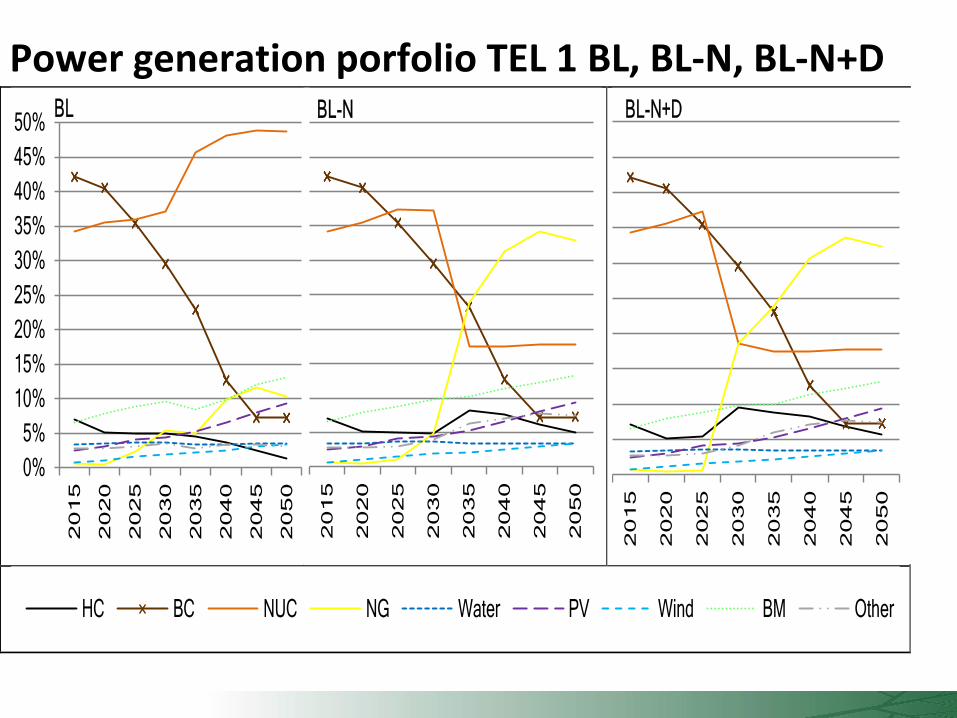
Power generation porfolio TEL 1 BL, BL-N, BL-N+D
0%
5%
10%
15%
20%
25%
30%
35%
40%
45%
50%
20
15
20
20
20
25
20
30
20
35
20
40
20
45
20
50
BL
20
15
20
20
20
25
20
30
20
35
20
40
20
45
20
50
BL-N
20
15
20
20
20
25
20
30
20
35
20
40
20
45
20
50
BL-N+D
HC BC NUC NG Water PV Wind BM Other
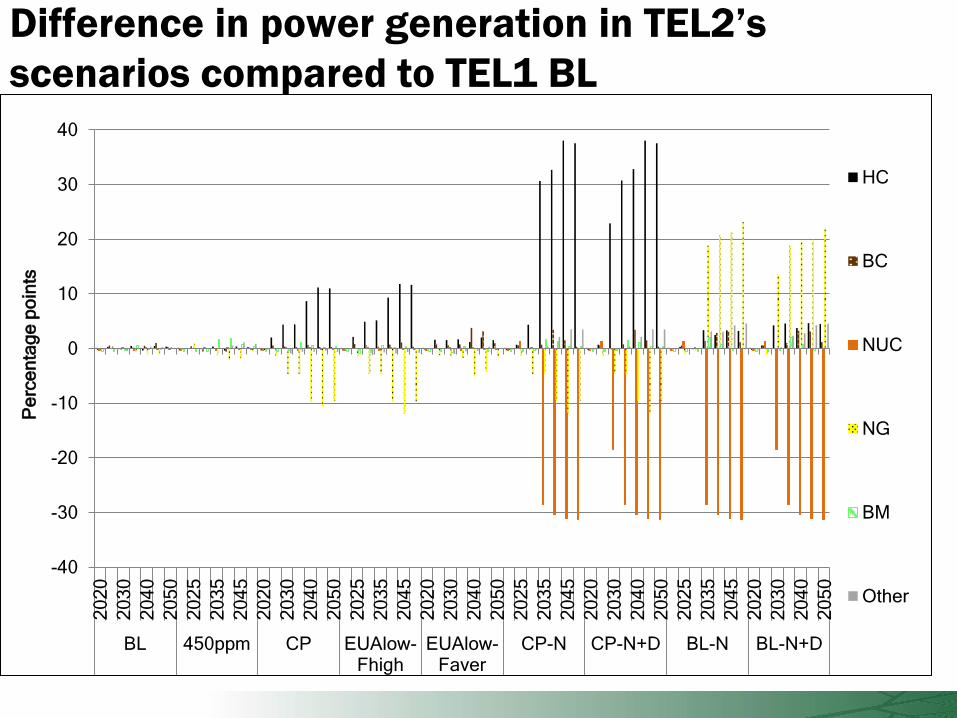
Difference in power generation in TEL2’s
scenarios compared to TEL1 BL
-40
-30
-20
-10
0
10
20
30
40
20
20
20
30
20
40
20
50
20
25
20
35
20
45
20
20
20
30
20
40
20
50
20
25
20
35
20
45
20
20
20
30
20
40
20
50
20
25
20
35
20
45
20
20
20
30
20
40
20
50
20
25
20
35
20
45
20
20
20
30
20
40
20
50
BL 450ppm CP EUAlow-Fhigh
EUAlow-Faver
CP-N CP-N+D BL-N BL-N+D
Pe
rce
nta
ge
po
ints
HC
BC
NUC
NG
BM
Other
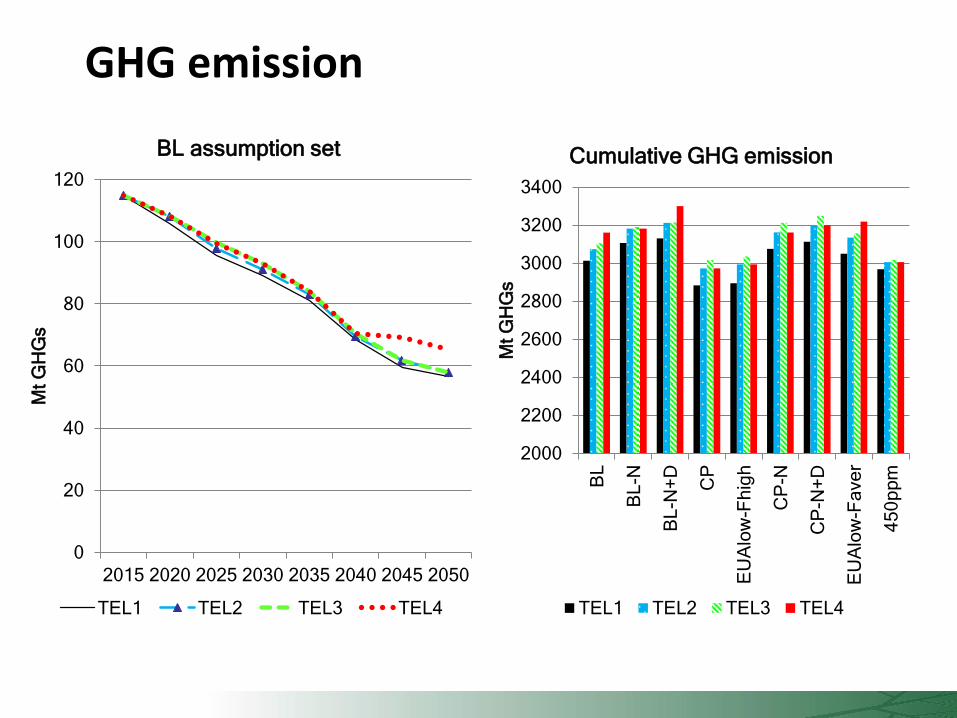
GHG emission
0
20
40
60
80
100
120
2015 2020 2025 2030 2035 2040 2045 2050
Mt
GH
Gs
BL assumption set
TEL1 TEL2 TEL3 TEL4
2000
2200
2400
2600
2800
3000
3200
3400
BL
BL
-N
BL
-N+
D
CP
EU
Alo
w-F
hig
h
CP
-N
CP
-N+
D
EU
Alo
w-F
ave
r
45
0p
pm
Mt
GH
Gs
Cumulative GHG emission
TEL1 TEL2 TEL3 TEL4
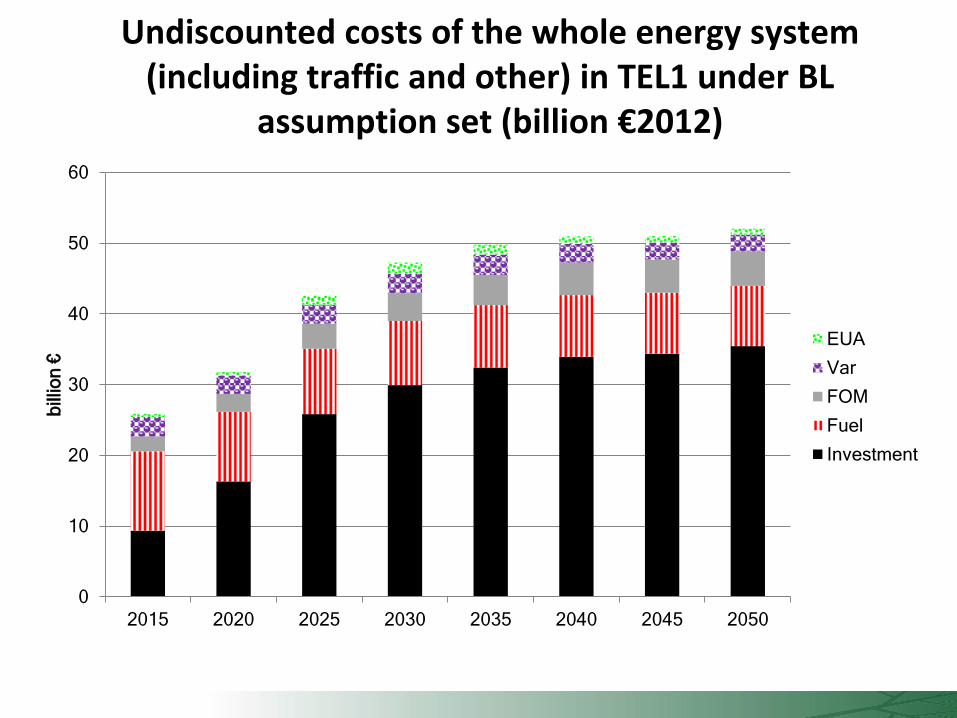
Undiscounted costs of the whole energy system (including traffic and other) in TEL1 under BL
assumption set (billion €2012)
0
10
20
30
40
50
60
2015 2020 2025 2030 2035 2040 2045 2050
bill
ion
€ EUA
Var
FOM
Fuel
Investment
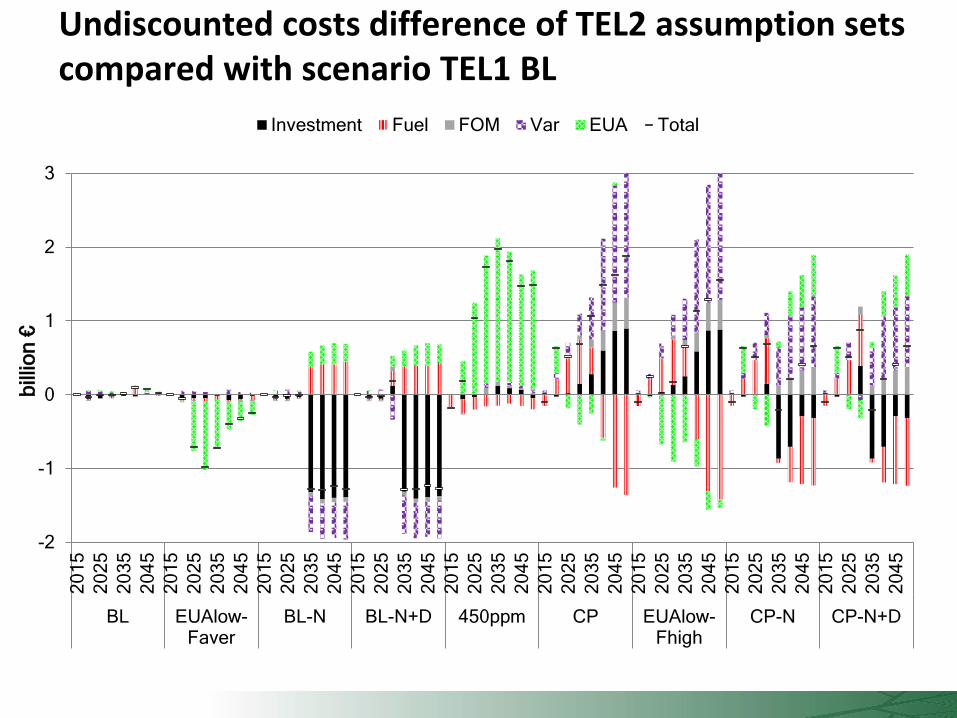
Undiscounted costs difference of TEL2 assumption sets compared with scenario TEL1 BL
-2
-1
0
1
2
3
20
15
20
25
20
35
20
45
20
15
20
25
20
35
20
45
20
15
20
25
20
35
20
45
20
15
20
25
20
35
20
45
20
15
20
25
20
35
20
45
20
15
20
25
20
35
20
45
20
15
20
25
20
35
20
45
20
15
20
25
20
35
20
45
20
15
20
25
20
35
20
45
BL EUAlow-Faver
BL-N BL-N+D 450ppm CP EUAlow-Fhigh
CP-N CP-N+D
bill
ion
€
Investment Fuel FOM Var EUA Total
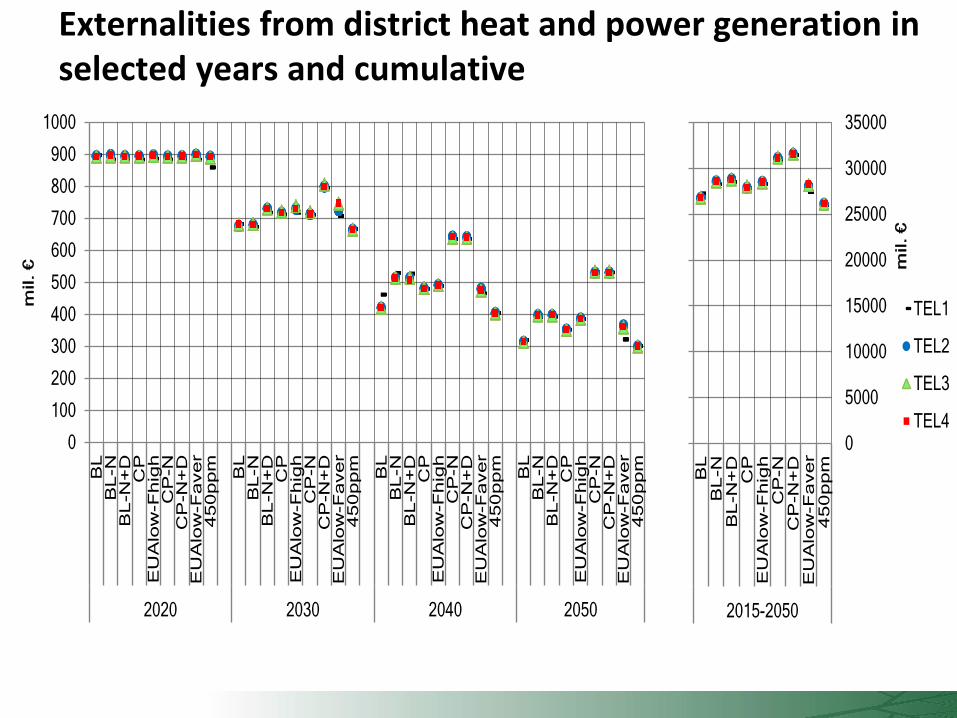
Externalities from district heat and power generation in selected years and cumulative
0
100
200
300
400
500
600
700
800
900
1000
BL
BL
-NB
L-N
+D
CP
EU
Alo
w-F
hig
hC
P-N
CP
-N+
DE
UA
low
-Fa
ve
r4
50
pp
m
BL
BL
-NB
L-N
+D
CP
EU
Alo
w-F
hig
hC
P-N
CP
-N+
DE
UA
low
-Fa
ve
r4
50
pp
m
BL
BL
-NB
L-N
+D
CP
EU
Alo
w-F
hig
hC
P-N
CP
-N+
DE
UA
low
-Fa
ve
r4
50
pp
m
BL
BL
-NB
L-N
+D
CP
EU
Alo
w-F
hig
hC
P-N
CP
-N+
DE
UA
low
-Fa
ve
r4
50
pp
m
2020 2030 2040 2050
mil. €
0
5000
10000
15000
20000
25000
30000
35000
BL
BL
-NB
L-N
+D
CP
EU
Alo
w-F
hig
hC
P-N
CP
-N+
DE
UA
low
-Fa
ve
r4
50
pp
m
2015-2050
mil. €
TEL1
TEL2
TEL3
TEL4
Conclusions
• ‘breaking’ of the territorial ecological limits does not have significant affect of Czech energy system under most of assumption sets
• Fuel and EUA prices have higher impacts on Czech energy systém than availability of bronw coal
• Approximately 3 mil. t of brown coal would need to be
imported in case of not ‘breaking’ of the territorial ecological limits
• RES are at least competetive with nuclear sources at EUA price at 40€
• Sensitivity analysis shows fuel switch btw Hard coal and Natural gas

Thank you for your attention and comments!
Acknowledgement
The research has been supported by Technology Agency of the Czech Republic grant
number TD03000319.