Embed Size (px)
Citation preview
IMPACTS OF MAIZE BASED CONSERVATION AGRICULTURE PRODUCTION SYSTEM ON SOIL PROPERTIES IN NORTH CENTRAL PLATEAU
ZONE OF ODISHA
A
THESIS SUBMITTED TO
THE ORISSA UNIVERSITY OF AGRICULTURE AND TECHNOLOGY, BHUBANESWAR
IN PARTIAL FULFILMENT OF THE REQUIREMENTS FOR THE DEGREE OF
MASTER OF SCIENCE IN AGRICULTURE (SOIL SCIENCE AND AGRICULTURAL CHEMISTRY)
BY
BHAGINI NABANITA
DEPARTMENT OF SOIL SCIENCE AND AGRICULTURAL CHEMISTRY
COLLEGE OF AGRICULTURE
ORISSA UNIVERSITY OF AGRICULTURE AND TECHNOLOGY BHUBANESWAR
2012 THESIS ADVISOR: DR.R.K.NAYAK

DEDICATED TO MY BELOVED
PARENTS
Orissa University of Agriculture & Technology Bhubaneswar-751003
Dr. R.K. NAYAK Associate Professor OIC, LTFE Department of Soil Science & Agricultural Chemistry College of Agriculture, OUAT, Bhubaneswar – 751003, Odisha
CERTIFICATE This is to certify that the thesis entitled “Impacts of maize based
conservation agriculture production system on soil properties in
North central plateau zone of Odisha” submitted in partial fulfilment of
the requirements for the award of the Degree of MASTER OF SCIENCE IN
AGRICULTURE (SOIL SCIENCE AND AGRICULTURAL CHEMISTRY) of the
Orissa University of Agriculture and Technology, Bhubaneswar is an
authentic record of bona fide research work carried out by BHAGINI
NABANITA under my guidance and supervision. No part of the thesis has
been submitted for any other degree or diploma.
It is further certified that the help and information availed during the
investigation have been duly acknowledged by her.
R.K NAYAK Place: Bhubaneswar Chairman Date: Advisory Committee
CERTIFICATE OF APPROVAL
IMPACTS OF MAIZE BASED CONSERVATION AGRICULTURE
PRODUCTION SYSTEM ON SOIL PROPERTIES IN NORTH
CENTRAL PLATEAU ZONE OF ODISHA
A THESIS SUBMITTED TO
ORISSA UNIVERSITY OF AGRICULTURE AND TECHNOLOGY, BHUBANESWAR
IN PARTIAL FULFILLMENT OF THE REQUIREMENTS FOR THE DEGREE OF
MASTER OF SCIENCE IN AGRICULTURE (SOIL SCIENCE & AGRICULTURAL CHEMISTRY)
2012
BY
BHAGINI NABANITA APPROVED BY ADVISORY COMMITTEE
CHAIRMAN : Dr. R.K.Nayak Associate Professor OIC, LTFE Department of Soil Science & Agricultural Chemistry College of Agriculture, OUAT, Bhubaneswar. _________________________
MEMBER : Dr. D.Jena Professor and Head Department of Soil Science & Agricultural Chemistry College of Agriculture, OUAT, Bhubaneswar. _________________________
MEMBER : Dr. M. Kar Dean, College of Agriculture, OUAT, Bhubaneswar. ‐‐‐‐‐‐‐‐‐‐‐‐‐‐‐‐‐‐‐‐‐‐‐‐‐‐‐‐‐‐‐‐‐‐‐‐‐‐‐‐‐‐‐
EXTERNAL EXAMINER : ‐‐‐‐‐‐‐‐‐‐‐‐‐‐‐‐‐‐‐‐‐‐‐‐‐‐‐‐‐‐‐‐‐‐‐

ACKNOWLEDGEMENT
This perspicuous piece of acknowledgement gives an opportunity and profound privilege to express my deep sense of gratitude and indebtedness to my guide and chairman of advisory committee Dr. Rabindra Kumar Nayak, Associate Professor (OIC, LTFE), department of Soil Science and Agricultural chemistry, OUAT, Bhubaneswar, for his scholastic guidance, valuable suggestion, keen interest, precious advice, vigilant, constructive criticism, whole hearted co-operation, ceaseless encouragement and painstaking efforts as well as compassion and patience throughout the course of investigation to make this endeavour a possibility.
Availing this unique privilege i would like to express my abysmal sense of reverence gratitude and obligation to Dr. D.Jena, professor and Head of of the Department for his immaculate guidance, unflagging interest, cooperation and encouragement during the course of investigation and preparation of his manuscript.
I deem it proper to express my profound sense of reverence to Dr. M.Kar, Dean, College of Agriculture, the co-guide of my advisory committee for his valuable advice and suggestion during my thesis work.
I acknowledge with sincerity the fellowship awarded to me by the OUAT-University of Hawaii collaborative research project “Sustainable Management of Agro-ecological Resources for Tribal Societies (SMARTS)” for my research and study. In this context, I fell elated to express my deepest sense of regards and infinitum gratitude to the members of SMARTS Project Scientific team comprising Dr. P. K. Roul, Associate Director of Research; Dr. K.N. Mishra, Sr. Scientist (Soil Science); Dr. S.N. Dash, Associate Professor (Fruit Science) from OUAT and Dr. C. Chan Halbrendt, Professor (NREM); Dr.T.W.Idol, Associate professor (NREM); Dr. C. Ray, Interim Director Water Resource Research Centre, from University of Hawaii, USA for their immense patronage and valuable suggestions during the course of my investigation.
It is my pleasure to convey my deepest sense of reverence and gratitude to Dr.M.R.Pattanayak, Dr.S.K Pattanayak, Dr.K.K.Rout, Dr.G.H.Santra, Dr.A.K.Pal, Dr.A.Mishra, Dr. S.K.Mohanty, Dr.K.C.Pradhan, Dr.P.K.Das, Miss B.Jena, Mr.M.Behera and all faculty members of my department for their timely suggestion and necessary guidance throughout my postgraduate studies.
My heartfelt gratefulness and special thanks to Prof.Dr.B.K.Mishra, former Head of the Department of Soil Science and Agricultural Chemistry for his sincere suggestion, selfless help and guidance during the course of formulation of research topic.
My deep sense of obligation goes to Dr. P.N.Pradhan, Asso.Professor, Department of Agricultural Statistics for his assistance in carrying out statistical analysis.

Words run short to deliver my irreversible thanks to Mohanty babu for his painstaking help at need. I wish to express my sincere thank to Pradipta bhai, Sonal didi, snigdha didi, Nirmal Bhaina, Ujwal bhaina for their cordial co-operation during my research study.
I gradually acknowledge the assistant and help render by Jitendra sir during my thesis work.
I am very much thankful to my friends Plabita, Sunanda, Madhu, Sunita, Raji, Jyoti, Niharika and my juniors Lusi, Rajashree for their whole hearted help and support rendered to me. Their loving, friendly and compassionate words are the synergy to arrive at this zenith of work.
I would like to acknowledge my deep sense of regards to my elder sister for her constant encouragement and valuable friendly guidance.
Last but not least I bow down my head before my beloved parents with all veneration and devotion for their blissful blessing, selfless sacrifices and eternal benediction which has been instrumental in every success in my career. I still pray their blessing to be bestowed upon me on the every sphere of my life.
I solicit the benediction of “LORD JAGANNATH ” for my progress and prosperity.
Bhagini Nabanita
Name of the student : Bhagini Nabanita Adm.no. : 11Ac/10 Title of the Thesis : Impacts of maize based conservation
agriculture production system on soil properties in North central plateau zone of Odisha.
Degree for which submitted : M.Sc. (Ag) Name of the department : Soil Science and Agricultural chemistry Year of submission : 2012 Name of the guide : Dr. R.K. Nayak Assoc. professor
ABSTRACT
Natural resources and environmental quality in agriculture are
subjected to degradation, warrant for immediate and long term solutions.
Conservation agriculture systems with suitable crop and soil management
packages have been identified as one of the solution. The North central plateau
zone of Odisha has an undulating topography and the soils of these areas are
facing various types of losses. Maize is a major crop in this agroclimatic zone.
To study the impact of maize based cropping system under conventional and
minimum tillage practice a field experiment was conducted at Regional Research
and Technology Transfer Station (RRTTS), O.U.A.T, Kendujhar during Kharif
and subsequent Rabi season (2011-2012).
Conventional and minimum tillage with maize and maize+cowpea
intercrop were taken during kharif and each treatment plot was divided into 3
subplot treatments like horsegram, mustard and fallow during Rabi. Soil sample
were collected before Kharif and after Kharif and Rabi season to study the
impact of treatments on soil bulk density, texture, pH, organic carbon, available
N, P, K, Ca, Mg following the standard procedure. Nutrient dynamics was
studied by resin bag technique. Yield and nutrient uptake by crop were also
recorded.
From the above study it was revealed that minimum tillage improved the
bulk density of soil by reducing its value 0.007 Mgm-3 than conventional tillage
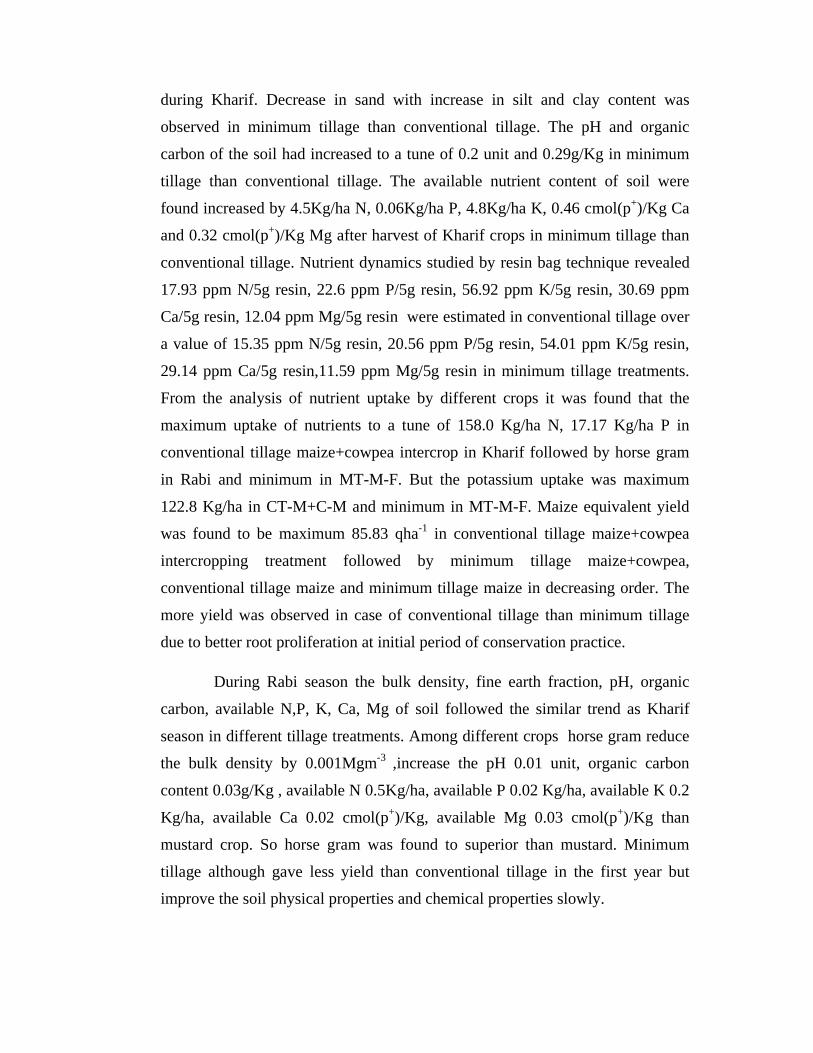
during Kharif. Decrease in sand with increase in silt and clay content was
observed in minimum tillage than conventional tillage. The pH and organic
carbon of the soil had increased to a tune of 0.2 unit and 0.29g/Kg in minimum
tillage than conventional tillage. The available nutrient content of soil were
found increased by 4.5Kg/ha N, 0.06Kg/ha P, 4.8Kg/ha K, 0.46 cmol(p+)/Kg Ca
and 0.32 cmol(p+)/Kg Mg after harvest of Kharif crops in minimum tillage than
conventional tillage. Nutrient dynamics studied by resin bag technique revealed
17.93 ppm N/5g resin, 22.6 ppm P/5g resin, 56.92 ppm K/5g resin, 30.69 ppm
Ca/5g resin, 12.04 ppm Mg/5g resin were estimated in conventional tillage over
a value of 15.35 ppm N/5g resin, 20.56 ppm P/5g resin, 54.01 ppm K/5g resin,
29.14 ppm Ca/5g resin,11.59 ppm Mg/5g resin in minimum tillage treatments.
From the analysis of nutrient uptake by different crops it was found that the
maximum uptake of nutrients to a tune of 158.0 Kg/ha N, 17.17 Kg/ha P in
conventional tillage maize+cowpea intercrop in Kharif followed by horse gram
in Rabi and minimum in MT-M-F. But the potassium uptake was maximum
122.8 Kg/ha in CT-M+C-M and minimum in MT-M-F. Maize equivalent yield
was found to be maximum 85.83 qha-1 in conventional tillage maize+cowpea
intercropping treatment followed by minimum tillage maize+cowpea,
conventional tillage maize and minimum tillage maize in decreasing order. The
more yield was observed in case of conventional tillage than minimum tillage
due to better root proliferation at initial period of conservation practice.
During Rabi season the bulk density, fine earth fraction, pH, organic
carbon, available N,P, K, Ca, Mg of soil followed the similar trend as Kharif
season in different tillage treatments. Among different crops horse gram reduce
the bulk density by 0.001Mgm-3 ,increase the pH 0.01 unit, organic carbon
content 0.03g/Kg , available N 0.5Kg/ha, available P 0.02 Kg/ha, available K 0.2
Kg/ha, available Ca 0.02 cmol(p+)/Kg, available Mg 0.03 cmol(p+)/Kg than
mustard crop. So horse gram was found to superior than mustard. Minimum
tillage although gave less yield than conventional tillage in the first year but
improve the soil physical properties and chemical properties slowly.
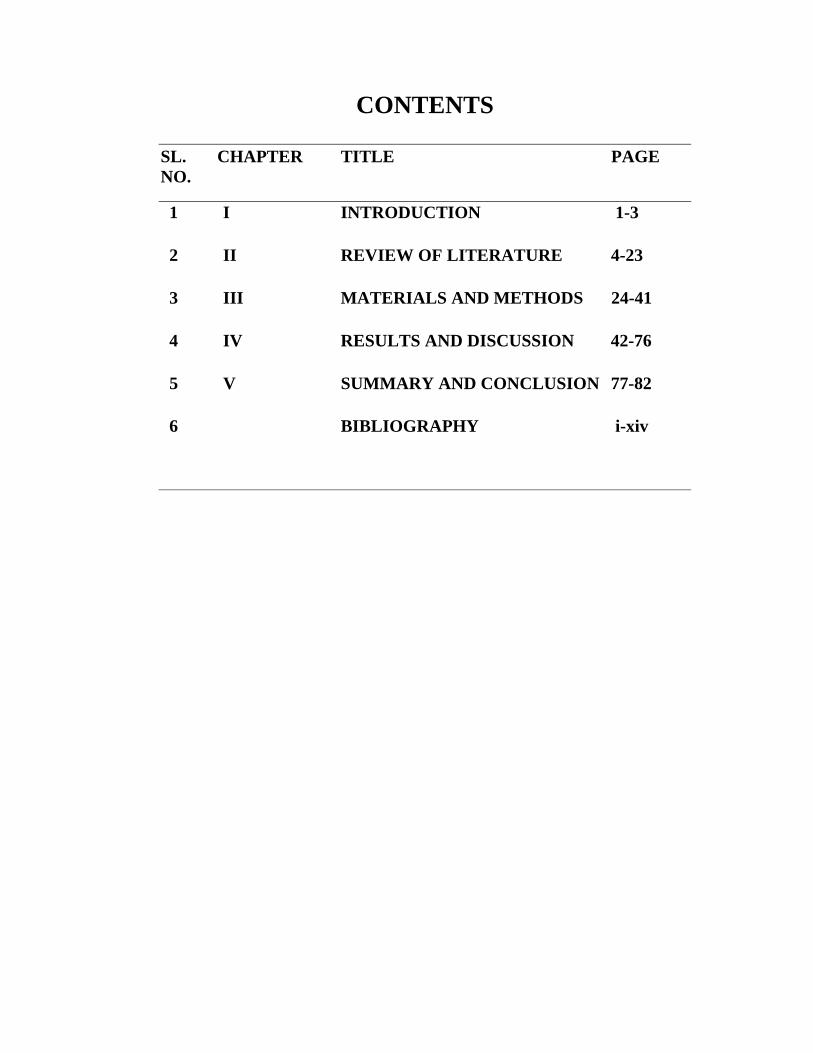
CONTENTS
SL. CHAPTER TITLE PAGE NO.
1 I INTRODUCTION 1-3
2 II REVIEW OF LITERATURE 4-23
3 III MATERIALS AND METHODS 24-41
4 IV RESULTS AND DISCUSSION 42-76
5 V SUMMARY AND CONCLUSION 77-82
6 BIBLIOGRAPHY i-xiv

LIST OF TABLES
TABLE NO. PARTICULARS PAGE
NO 3.1 Mean monthly meteorological data (2001-2010) at Kendujhar 25
3.2 (a) Mean monthly meteorological data during the cropping season (june 2011- february 2012)
25
3.2 (b) Mean weekly meteorological data during the cropping session (june 2011- february 2012)
26
3.3 Cropping history of the experimental plot 27
3.4 Description of treatments of Kharif season 29
3.5 Description of treatments of Rabi season 29
3.6 Initial soil physical and chemical properties 32
3.7 Calendar of operations 33
3.8 Fertilizer dose for different experimental crops grown 35
4.1 Effect of tillage and crop on bulk density (Mgm-3) of soil (0-20cm) after harvest of Kharif and Rabi crops
43
4.2 Effect of tillage and crop on fine earth fraction of soil (0-20cm) after harvest of Kharif crops
45
4.3 Effect of tillage and crop on fine earth fraction of soil (0-20cm) after harvest of Rabi crops
46
4.4 Effect of tillage and crop on pH (1:2) of soil (0-20cm) after harvest of Kharif and Rabi crops
47
4.5 Effect of tillage and crop on Organic carbon (g/Kg) of soil (0-20cm) after harvest of Kharif and Rabi crops
48
4.6 Effect of tillage and crop on available N (Kg/ha) of soil (0-20cm) after harvest of Kharif and Rabi crops
51
4.7 Effect of tillage and crop on available P (Kg/ha) of soil (0-20cm) after harvest of Kharif and Rabi crops
54
4.8 Effect of tillage and crop on available K(Kg/ha) of soil (0-20cm) after harvest of Kharif and Rabi crops
57
4.9 Mean value of soil properties influenced by different tillage and crops in Kharif and Rabi season
59
4.10 Effect of tillage and crop on available Ca [cmol (p+)/Kg] of soil (0-20cm) after harvest of Kharif and Rabi crops
60
4.11 Effect of tillage and crop on available Mg [cmol (p+)/Kg] of soil (0-20cm) after harvest of Kharif and Rabi crops
62
4.12 Nutrient dynamics (ppm/5g resin) through resin bag in different tillage treatments
65
4.13 Nutrient uptake (Kg/ha) of maize crop influenced by different treatments
66
4.14
Nutrient uptake (Kg/ha) of cowpea crop influenced by different treatments
66
4.15 Nutrient uptake (Kg/ha) of horse gram crop influenced by different treatments
67
4.16 Nutrient uptake (Kg/ha) of mustard crop influenced by different treatments
68
4.17 Total nutrient uptake (Kg/ha) by crops in the system 68
4.18 Yield (qha-1) of maize and cowpea influenced by different tillage 69
4.19 Yield (qha-1) of horse gram and mustard influenced by different tillage
70
4.20 System productivity in terms of maize equivalent yield (MEY) influenced by different treatments
72
4.21 Interaction effect of Kharif season treatments (main plot) and Rabi treatments (sub plot) on system productivity (MEY) as influenced by different tillage and crops
73
LIST OF FIGURES
SL. NO. TITLE PAGE
NO
3.1 Mean monthly rainfall data during the cropping season (june 2011- february 2012)
28
3.2 Mean monthly temerature data during the cropping season (june 2011- february 2012)
28
3.3(a) Layout plan of the experiment during Kharif season 30
3.3(b) Layout plan of the experiment during Rabi season 31
4.1(a) Effect of tillage and crop on Organic carbon (g/Kg) of soil after harvest of Kharif crops
49
4.1(b) Effect of tillage and crop on Organic carbon (g/Kg) of soil after harvest of Rabi crops
49
4.2(a) Effect of tillage and crop on available N (Kg/ha) of soil after harvest of Kharif crops
53
4.2(b) Effect of tillage and crop on available N (Kg/ha) of soil after harvest of Rabi crops
53
4.3(a) Effect of tillage and crop on available P (Kg/ha) of soil after harvest of Kharif crop
55
4.3(b) Effect of tillage and crop on available P (Kg/ha) of soil after harvest of Rabi crops
55
4.4(a) Effect of tillage and crop on available K (Kg/ha) of soil after harvest of Kharif crops
58
4.4(b) Effect of tillage and crop on available K (Kg/ha) of soil after harvest of Rabi crops
58
4.5(a) Effect of tillage and crop on available Ca [cmol(p+)/Kg]of soil after harvest of Kharif crops
61
4.5(b) Effect of tillage and crop on available Ca [cmol(p+)/Kg]of soil after harvest of Rabi crops
61
4.6(a) Effect of tillage and crop on available Mg [cmol(p+)/Kg]of soil after harvest of Kharif crops
63
4.6(b) Effect of tillage and crop on available Mg [cmol(p+)/Kg]of soil after harvest of Rabi crops
63
4.7(a) Yield (qha-1) of maize and cowpea influenced by different tillage 69
4.7(b) Yield (qha-1) of horse gram influenced by different tillage 71
4.7(c ) Yield (qha-1) of mustard influenced by different tillage 71
4.8 System productivity influenced by different tillage and crop 74

LIST OF PLATES
SL. NO. TITLE AFTER PAGE
NO 1 Agro-climatic zones of Odisha 24
2 Resin bag 36
3 Resin bag installed in the field for study of nutrient dynamics
36

1
INTRODUCTION
Persistent use of conventional farming practices based on extensive
tillage combined with in situ burning of crop residues have magnified soil
erosion losses and degradation of soil resource base steadily. Dust bowl of 1930s
in the U.S Great Plains due to exposure of soil to wind erosion causing loss of
about 91 million hectares of land is one of the famous results of poor tillage
practice (Utz et al. 1938). Many soils have been worn down to their nadir for
most of the soil physical, chemical and biological parameters which are essential
for effective, stable and sustainable crop production. Therefore in spite of the
availability of improved varieties with high yield potential, the potential increase
in production is not attained due to poor soil and crop management (Reynolds
and Tuberosa, 2008). But there is a demand of rising food production by 70%
until the year 2050 to meet the food security of growing world population of
more than 9 million people.
In India, growing population of the country may stabilize around 1.4
billion by 2025 and 1.6 billion in the year 2050 calling for 380 and 480 metric
tonne food grain production per annum respectively. Rising population per
capita income are pushing up demand which needs to be met through enhancing
productivity per unit area input and time. Although green revolution was highly
successful and resulted in dramatic yield increase, conservation efforts to protect
soil resources were not always given appropriate attention.
As soil is the most vital resource for providing food to the ever
increasing population, it is mandatory that wide spread soil degradation is
brought to a halt. Soil should be used rationally and conserved properly for
realizing agricultural productivity on a sustainable basis. So to achieve this
sustainable production without any degradation of natural resource base and
environment a set of crop-nutrient-water-landscape system management practice

2
popularly known as conservation agriculture production system has been
identified as one of the immediate and long term solutions.
Conservation agriculture is nothing but a concept of resource saving
agriculture crop production that strives to achieve acceptable profits together
with high and sustained production levels simultaneously conserving the
environment (FAO). It is not based on maximizing yields by exploiting soil and
agro ecosystem. Instead of that it is based on optimizing yields and profits, to
stabilize agricultural, economic and environmental benefits. It advocates that the
combined social and economic benefits gained from combined production and
protecting the environment, including reduced input and labour costs are greater
than those from production alone. Conservation agriculture is the integration of
ecological management with modern, scientific, agricultural production. It
employs all modern technologies combined with traditional knowledge of soil
husbandry that enhance the soil quality and ecological integrity of the soil.
Conservation agriculture emphasizes that the soil is a living body,
having a great importance for sustenance of life on the planet. It promotes
minimum disturbance of soil through minimum tillage or conservation tillage,
maintain permanent organic soil cover and a healthy and living soil through crop
rotation. Conservation tillage includes no tillage, direct tillage, minimum tillage
or ridge tillage. Conservation tillage is a set of practice that promotes retention
of at least 30% surface cover by residues, conserve soil water, soil structure,
nutrients, soil biota and save time (Baker et al.2002). Permanent organic cover
can be a growing crop or dead mulch. Conservation tillage with surface mulch or
residues provide protection to soil from wind erosion, reduces surface soil
crusting, increases water infiltration, reduces water loss by runoff and
evaporation, promotes biological activity which enhances nitrogen
mineralization and accumulate organic matter (Cassel et al. 1995). Crop rotation
increases diversity in plant production, reduce risk of pest and weed infestation
and enhances efficient use of water and available nutrients.
3
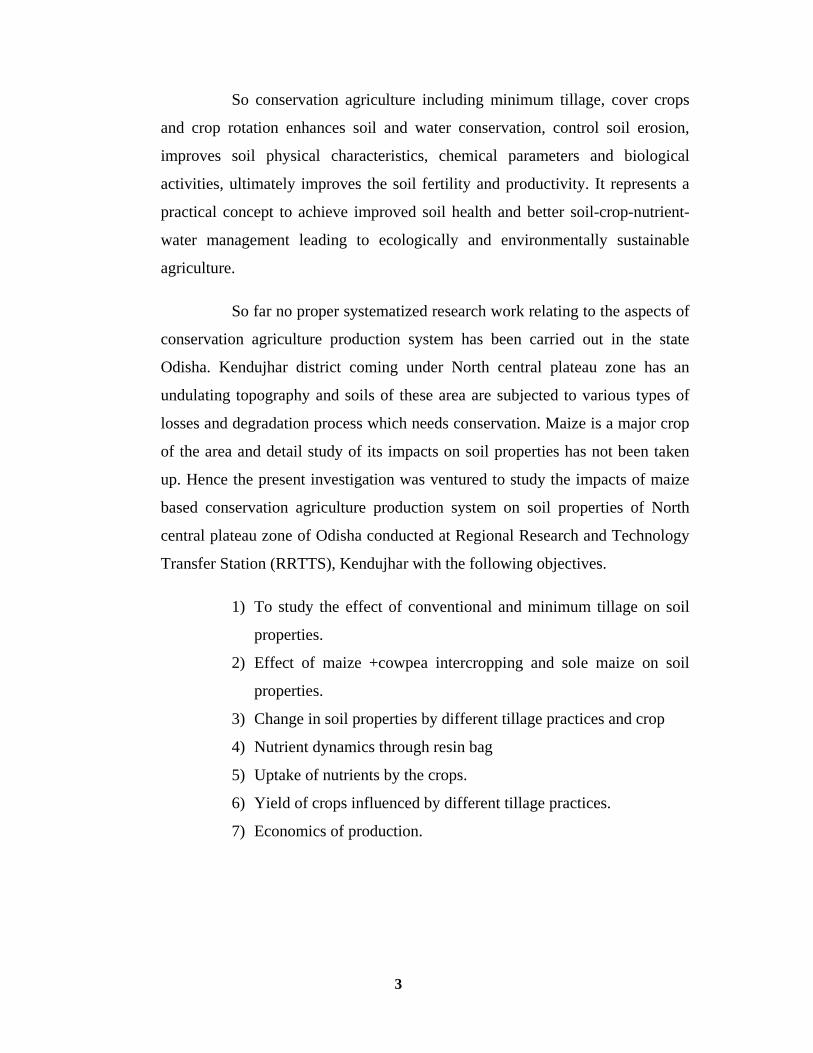
So conservation agriculture including minimum tillage, cover crops
and crop rotation enhances soil and water conservation, control soil erosion,
improves soil physical characteristics, chemical parameters and biological
activities, ultimately improves the soil fertility and productivity. It represents a
practical concept to achieve improved soil health and better soil-crop-nutrient-
water management leading to ecologically and environmentally sustainable
agriculture.
So far no proper systematized research work relating to the aspects of
conservation agriculture production system has been carried out in the state
Odisha. Kendujhar district coming under North central plateau zone has an
undulating topography and soils of these area are subjected to various types of
losses and degradation process which needs conservation. Maize is a major crop
of the area and detail study of its impacts on soil properties has not been taken
up. Hence the present investigation was ventured to study the impacts of maize
based conservation agriculture production system on soil properties of North
central plateau zone of Odisha conducted at Regional Research and Technology
Transfer Station (RRTTS), Kendujhar with the following objectives.
1) To study the effect of conventional and minimum tillage on soil
properties.
2) Effect of maize +cowpea intercropping and sole maize on soil
properties.
3) Change in soil properties by different tillage practices and crop
4) Nutrient dynamics through resin bag
5) Uptake of nutrients by the crops.
6) Yield of crops influenced by different tillage practices.
7) Economics of production.

4
REVIEW OF LITERATURE
The research work on conservation agriculture at different places of
the world has been carried out by different workers. Although the work in
Odisha is meagre keeping the objectives of present investigation “Impacts of
maize based conservation agriculture production system on soil properties in
North Central Plateau Zone of Odisha” in view attempt has been made to
present a brief account of previous research findings in the form of review on
the following heads.
2.1 Definition of conservation agriculture
2.2 Principles of conservation agriculture
2.3 Importance of conservation agriculture
2.4 Conservation tillage
2.5 Impacts of conservation practices on soil properties
2.5.a soil physical properties like bulk density
2.5.b Soil chemical properties like
i) Soil reaction (pH)
ii) Organic carbon
iii) Available nitrogen
iv) Available phosphorus
v) Available potassium
vi) Available calcium, magnesium
2.6 Nutrient dynamics through resin bag
2.7 Intercropping
2.7.a crop compatibility
2.7.b Benefits of intercropping
5
2.8 Conservation agriculture production system-yield
2.9 Conservation agriculture production system-benefit:cost ratio
2.1 DEFINITION OF CONSERVATION AGRICULTURE:
“Conservation Agriculture” refers to a general set of practices that are
focused an three main concepts:- minimum tillage to reduce soil disturbance;
continuous soil cover to reduce rainfall impact, suppers weeds and conserve
organic mattes and optimal crop rotation to maintain soil fertility and provide
nutritional self-efficiency (FAO, 2000).
Conservation agriculture [CA] can be defined by a statement given
by the (Food and Agricultural Organization of the United Nations) as
“a concept for resource-saving agricultural crop production that
strives to achieve acceptable profits together with high and sustained
production levels while concurrently conserving the environment” (FAO
2007).
Conservation agriculture (CA) aims to conserve, improve and make
more efficient use of natural resources through integrated management of
available soil, water and biological resources combined with external inputs. It
contributes to environmental conservation as well as to enhanced and sustained
agricultural production. It can also be referred to as resource efficient or resource
effective agriculture” (FAO)
“Conservation Agriculture maintains a permanent or semi-permanent
organic soil cover. This can be a growing crop or dead mulch. Its function is to
protect the soil physically from sun, rain and wind and to feed soil biota. The
soil micro-organisms and soil fauna take over the tillage function and soil
nutrient balancing. Mechanical tillage disturbs this process. Therefore, zero or
minimum tillage and direct seeding are important elements of CA. A varied crop
rotation is also important to avoid disease and pest problems” (FAO website)
6
2.2 PRINCIPLES OF CONSERVATION AGRICULTURE:
Conservation agriculture is characterized by three principles which are
linked to each other (FAO, 2010), namely:
1. Continuous minimum mechanical soil disturbance = No-tillage
2. Permanent organic soil cover = mulching and Cover cropping
3. Diversification of crop species grown in sequence or associations =
Rotation
2.3 IMPORTANCE OF CONSERVATION AGRICULTURE:
Conservation Agriculture can support intensification of agricultural
production in the face of a shrinking land base without compromising soil
quality reducing production per until of available water (FAO, 2008).
Conservation agriculture production system are recommended as a
general solution to the problems of rural communities facing poor agricultural
productivity and declining natural resource quality (Fowler and Rockstrom;
2001; Derpsch 2003, Hubbs 2007, Hubbs et al., 2008, Kienzele 2009).
Hubber 2007 noted that conservation agriculture advocates the
combined social and economic benefits gained from combining production
and protecting the environment, hence it becomes in integration of ecology
management with modern scientific agricultural production. This is
compounded by the fact that yield improvement under farming takes a few
years to be manifested.
Compared to conventional tillage there are several benefits from
conservation tillage such as economic benefits by labour, cost and time saved,
erosion protection, soil water conservation and increases of soil organic matter
(Uri et al.1998, wang and Gao 2004)
7
2.4 CONSERVATION TILLAGE:
“Conservation tillage is the collective umbrella term commonly given
to no-tillage, direct-drilling, minimum-tillage and/or ridge-tillage, to denote that
the specific practice has a conservation goal of some nature. Usually, the
retention of 30% surface cover by residues characterizes the lower limit of
classification for conservation-tillage, but other conservation objectives for the
practice include conservation of time, fuel, earthworms, soil water, soil structure
and nutrients. Thus residue levels alone do not adequately describe all
conservation tillage practices.” (Baker et al. 2002)
Conservation tillage is a widely-used terminology to denote soil
management systems that result in at least 30% of the soil surface being covered
with crop residues after seeding of the subsequent crop (Jarecki and Lal 2003).
2.5 IMPACTS OF CONSERVATION PRACTICES ON SOIL
PROPERTIES:
Reducing tillage affects several aspects of the soil. With time,
conservation tillage improves soil quality indices (Dick, 1983; Lal et al., 1998),
including soil organic C storage (Dick, 1983; Lamb et al., 1985; Dao, 1991;
Unger, 1991; Edwards et al., 1992; Eghball et al., 1994; Bruce et al., 1995;
Potter et al., 1998).
Conservation tillage is an effective practice to control soil degradation
on intensively farmed cropland (Larney and Kladivko, 1989; Grant and Lafond,
1993) and to increase soil water storage (Gantzer and Blake, 1978; Dao, 1993).
Unger (1991) and Bruce et al. (1995) reported that soil nutrients
become stratified when no-till management is employed.
8
Karlen et al. (1994) showed that normal rates of residue combined
with zero-tillage resulted in better soil surface aggregation, and that this could be
increased by adding more residues.
Conservation tillage can usually lead to greater accumulation of
surface nutrients, compared to traditional tillage, with soil ploughing
(Franzluebbers and Hons, 1996; Holanda et al., 1998).
surface (0–30 cm) soil in a no-till system was shown to contain more
moisture and to be cooler than a comparable plough tillage soil (Doran et al.,
1998).
Residue retention and direct seeding have a major influence on
improving water infiltration, organic matter content and fertility of a soil (Wall,
1999).
No-Tillage (NT) plus mulch reduces surface soil crusting, increases
water infiltration, reduces run-off and gives higher yield than tilled soils (Cassel
et al. 1995; Thierfelder et al. 2005).
Bissett & O’Leary (1996) showed that infiltration of water under long
term (8–10 years) conservation tillage (zero and subsurface tillage with residue
retention) was higher compared to conventional tillage (frequent ploughing plus
no residue retention) on a grey cracking clay and a sandy loam soil in south-
eastern Australia.
Kumar & Goh (2000) reviewed that crop residues of cultivated crops
are a significant factor for crop production through their effects on soil physical,
chemical and biological functions as well as water and soil quality.
No-tillage practices featuring residue cover and less soil disturbance
have been shown to reduce runoff by 52.5% and reduce erosion by 80.2%
compared to traditional tillage (Wang, 2000). Landers (2001) concluded an
improvement of the infiltration capacity under NT farming.
9
Hatfield et al. (2001) reported a 34-50% reduction in soil water
evaporation as a result of crop residue mulching.
Trials conducted in the higher potential areas of Zimbabwe between
1988 and 1995 indicated that mulching significantly reduced surface runoff and
hence soil loss (Erenstein, 2002).
Roldan et al. (2003) showed that after 5 years of NT maize in Mexico,
soil wet aggregate stability had increased over conventional tillage (TT) as had
soil enzymes, soil organic carban (SOC) and microbial biomass (MBM). They
conclude that NT is a sustainable technology.
Experiments conducted by Liu (2004) showed that conservation tillage
systems can increase organic matter, nitrogen, phosphorus, and potassium in the
topsoil layer.
Luo et al.(2005) reported that conservation tillage can improve soil
physical properties and soil fertility in northern China.
Madari et al. (2005) showed that NT with residue cover had higher
aggregate stability, higher aggregate size values and total organic carbon in soil
aggregates than TT in Brazil.
Bescanca et al. (2006) reported that Conservation tillage leads to
positive changes in the physical, chemical properties of a soil.
Bolliger et al. (2006) observed that positive changes on soil physical
and chemical properties occur only after several years of practicing conservation
agriculture. NT has positive effects on soil properties, yields and prevents
erosion (Derpsch, 2006).
Conservation agriculture improve soil quality such as improved
sequestration of organic carbon(Coprbeels et al,2006) and improved soil fertility
reported by Hobbs and Gupta (2004).

10
2.5.a soil physical property like bulk density:
Bautista et al.(1996) found that minimum tillage plus mulch reduces
soil bulk density.
Ekeberge and Riley (1997) found that bulk density was lower with
minimum tillage than with conventional tillage at a depth of 3-7cm in a loam soil
in Southeast Norway.
Hussein et al.(1998) reported that bulk density was lower with
minimum tillage than with conventional tillage in the top 8cm of an eroded silt
loam in Southern Illinois.
Yang and Wander (1999) lower bulk density values with minimum
tillage than mouldboard plough in the 0-5cm and 20-30cm soil layer.
Hernanz et al.(2002) found significantly lower bulk density under
minimum tillage than conventional tillage from 0-10cm with cereal monoculture
and from 0-15cm in a wheat-vetch(vicia sativa l.) rotation. But the more
compacted top soil with minimum tillage had no adverse effect on crop yield
with either rotation.
Kay and Vanden Bygaart (2002) observed that bulk density was lower
under minimum tillage than mouldboard plough in the top 20cm of the soil
profile with the greatest difference at 5-10cm. This was probably due to organic
matter content at 0-5cm was greater under minimum tillage than mouldboard
plough. Similar results were obtained by Deen and Kataki in 2003.
Soil physical properties like bulk density influenced by conservation
tillage (Osunbitan et al., 2004).
Blanco-Canqui et al.(2006) reported that maize residue retention at 5
and 10Mg/ha for a period of one year reduced bulk density in 0-5cm layer from
11
1.42 Mg/m3 control) to 1.26 Mg/m3 and 1.22 Mg/m3 respectively in minimum
tillage system in a silt loam soil.
Dolan et al (2006) conducted an experiment taking conventional
tillage, chisel tillage and minimum tillage treatments on a silt loam soil with a
maize-soyabean rotation in Minnesota. They found that the treatments where
residues were harvested had 6% higher bulk density in 0-5cm and 5-10cm soil
depth than the treatments with residues returned.
Blanco-Canqui and Lal (2007) measured bulk density in minimum
tillage plots that had been uncropped and receiving 3 levels of wheat straw
mulch (0,8, 16 Mg ha-1 yr-1 ). The bulk density under higher mulch treatment
was 58% lower and that under the low mulch treatment was 19% lower than the
bulk density under the unmulched treatment for 0-3cm depth. In the 3-10cm
depth bulk density under higher mulch treatment was 36% lower and that under
the low mulch treatment was 9% lower than under the control.
Gal et al. (2007) observed lower bulk density in 0-30cm layer under
minimum tillage than conventional.
Thomas et al. (2007) reported that bulk density was lower with
minimum tillage than with conventional tillage in the top 10cm of a Luvisol in
Southern Queensland.
D’Haene et al.(2008) reported that bulk density was lower in 5-10cm
soil layer under minimum tillage than conventional tillage on silt loam soils with
crop rotations in Belgium.
2.5.b Soil chemical properties
i)Soil reaction (pH):
Compared to conventional tillage under minimum tillage higher value
of pH was measured (Crovetto,1996).

12
ii) Organic carbon:
There is a marked stratification of soil organic matter with soil depth
under no-tillage system (Blevins et al.1984)
Schultz (1988) showed that soil organic carbon content increased by
1% with stubble retention.
Havlin et al. (1990) determined that reducing tillage and maintaining
surface residues in a long-term study increased soil organic carbon content. He
conducted an experiment having three crop rotation-continuous soybean,
continuous sorghum, sorghum –soybean. These were managed for 12 years
under conventional and no tillage systems (o and 100%surface residue cover
respectively). Under no tillage soil organic matter increased up to 45% as the
level of residue increased from 1 to 3 t/ha/yr.
No-till promotes conservation of mineralizable C from crop residues
(Franzluebbers et al., 1994a).
Karlen et al.(1994) revealed that the low bulk density in minimum
tillage with straw cover attributed to the increased soil organic carbon after long
term minimum tillage practice.
Bruce et al.(1995) and Potter et al.(1998) reported that conservation
tillage improves soil quality indices including soil organic carbon storage with
time.
Campbell et al.(1996a.) and Lal (2005) reported that minimum tillage
combined with permanent soil cover increased organic carbon in the surface
layer.
Studdert et al. (1997) showed that Soil organic C loss with tillage and
continuous cropping may be minimized by proper residue management and crop
selection.
13
A study in eastern Paraguay about ‘changes in soil organic matter
after land use change’ showed that no tillage practices had a significant higher
organic matter content compared with conventional tillage practices (Riezebos
and Loerts, 1998).
Freitas et al.(1999) reported an increase in organic matter of soil after
4 years of minimum tillage in clayey cerrado oxisol.
Wall (1999) reported that residue retention and direct seeding have a
major influence on organic carbon content of a soil.
Bayer et al. (2000) stated that minimum tillage is a promising strategy
to maintain or even increase soil organic carbon by minimizing loss of organic
matter.
Clapp et al. (2000) reported that when corn Stover was returned to soil
organic carbon increase 14% in the top 15cm layer.
Motta et al. (2002) showed that conservation tillage increase soil
organic carbon. In Texas Zibilske et al.(2002) recorded that no tillage resulted in
soil organic matter increase up to 58% in the top 4cm of soil for no till treatment.
Six et al. (2002) concluded that there is an increase in soil organic
matter after doing a literature review about soil organic matter dynamics in
tropical and temperate countries under the NT system. He concluded that in the
upper 40 cm the soil organic matter increases after 6-8 years.
Roldan et al. (2003) showed that after 5 years of minimum tillage
maize in Mexico, soil organic carbon had increased over conventional tillage.
Cover crops contribute to the accumulation of organic matter in the
surface soil horizon (Roldan et al. 2003; Alvear et al. 2005; Diekow et al. 2005;
Madari et al. 2005; Riley et al. 2005), and this effect is increased when
combined with no tillage.

14
Balota et al. (2004) showed that in Brazil in a 20-year experiment
residue retention and minimum tillage increased organic carbon by 45% at 0-
50cm depth compared with traditional tillage.
Heenan et al.(2004) in Australia showed that soil organic carbon
increased 3.8 t/ha where stubble was retained and soil no tilled and if a legume
included in the rotation then soil organic carbon accumulation was the highest.
Alvear et al.(2005) and Diekow et al.(2005) revealed that conservation
agriculture produces more soil organic carbon than when soils are tilled.
Madari et al. (2005) and Riley et al. (2005) showed that conservation
tillage with residue cover had higher total organic carbon in soil aggregates than
traditional tillage in Brazil.
Roldan et al. (2005) recorded that no-tillage resulted in soil organic
matter increase of up to 33% in the 0–5 cm layer in Mexico.
Vagen et al. (2005) reported that addition of crop residues in
combination with minimum tillage can yield attainable carbon accumulation
rates up to 0.36Mg C ha-1 yr-1.
Koch and Stockfisch (2006) reported that conservation tillage
concentrated soil organic matter and carbon in the top soil layer (0-10cm) in
Germany.
Li et al. (2006) conducted a 4 years no-tillage experiment and showed
that active C and total organic C down to 10 cm depth were up to 5% higher in
no-tillage than traditional tillage systems.
Liang et al. (2007) demonstrated that no tillage significantly increased
the concentration of soil organic C in 5–20 cm soil layer by 5.6–5.9% on the
clay loam soils after 3 years in the humid north eastern China.

15
iii) Available nitrogen:
Schultz (1988) showed that N content increased by 1% with stubble
retention.
Havlin et al. (1990) determined that reducing tillage and maintaining
surface residues in a long-term study increased soil N content in the surface
2.5cm layer.
Dao (1993) stated that surface mulch reduce water losses from the soil
by evaporation and also helps moderate soil temperature. This enhances
available N especially in the surface layers.
Campbell et al. (1995,1996a) reported more nitrogen content under no
tillage and conservation tillage compared with traditional tillage.
Crovetto (1996) reported higher value of nitrogen under minimum
tillage compared to conventional tillage.
Larney et al. (1997) reported that minimum tillage had a greater
effect on mineralizable nitrogen than total nitrogen.
Wienhold and Halvorson (1999) found that nitrogen mineralization
generally increased in the 0-5cm soil layer as the intensity of tillage decreased.
Bayer et al. (2000) stated that minimum tillage is a promising strategy
to maintain or even increase soil nitrogen content.
Graham et al. (2002) measured significant increase in nitrogen content
with increasing additions of crop residues. Similar result was obtained by
Govaerts et al. (2007c).
Astier et al.(2006) and Govaerts et al. (2007c) observed a significantly
higher total nitrogen under minimum tillage than conventional tillage in the
16
highlands of Mexico. Similar results were obtained by Borie et al. (2005) and
Atreya et al. (2006) in other agro-ecological regions.
Thomas et al. (2007) recorded that the total nitrogen to 10 cm depth
under no-tillage was 21% higher than for traditional tillage.
iv) Available Phosphorus:
Sidiras and Pavan (1985) observed higher values of phosphorus under
minimum tillage compared to conventional tillage.
Unger (1991) and Matowo et al. (1999) found higher extractable
phosphorus levels in minimum tillage compared to tilled soil in the top soil.
Ismail et al. (1994) observed after 20 years of minimum tillage
extractable phosphorus was 42% greater at 0-5 cm depth compared to
conventional tillage in a silt loam.
Franzluebbers and Hons (1996) revealed that accumulation of
phosphorus at the surface layer of minimum tillage.
Franzluebbers and Hons (1996), Du Preez et al. (2001) reported higher
extractable phosphorus levels in minimum tillage than in tilled soil largely due to
reduced mixing of the phosphorus fertilizer with the soil leading to lower P-
fixation.
Ohno and erich (1997) reported that where crop residues are returned
to the soil phosphorus availability increase may be due to the adsorption of
phosphorus to mineral surface.
Duiker and Beegle (2006) suggested there may be less need for
phosphorus stater fertilizer in long term minimum tillage due to high available P
levels in the top soil where the seed is placed.
17
v) Available potassium:
Follett and Peterson (1988) observed either higher or similar
extractable potassium levels in minimum tillage compared to mouldboard
tillage.
Standley et al. (1990) also observed higher extractable potassium
levels in top soil when sorghum stubble was retained than when the stubble was
removed.
Lal (1990),Unger (1991) and Ismail et al.(1994) found that higher
extractable potassium levels at the soil surface as tillage intensity decreases.
Franzluebbers and Hons (1996) reported that minimum tillage
conserves and increases availability of nutrients like potassium near the soil
surface where crop roots proliferate.
Du preeze et al.(2001)observed increased levels of potassium in
minimum tillage compared to conventional tillage.
vi) Available Calcium, Magnesium:
Sidiras and Pavan (1985) found increased available Calcium,
Magnesium concentrations to 60cm depth in both oxisol and Alfisol in Brazil
under minimum tillage.
Edwards et al. (1992) observed higher extractable Calcium
concentration with zero tillage than with conventional tillage.
Motta et al. (2002) showed that conservation tillage had higher value
of surface Calcium contents compared to traditional tillage.
18
2.6 NUTRIENT DYNAMICS THROUGH RESIN BAG:
Ion exchange resin (IER) bags technique pioneered by Binkley and
Matson (1983).
Weil et al (1988) found increased resin phosphorus in the upper 5cm
of no tilled soil. Surface area is also known to play an important role in ion
capture by IER devices (Skogley and Dobermann, 1996)
IER bags in many ways work similarly to plant roots: they are exposed
to ambient conditions, are in intimate contact with the rhizosphere, and cause
minimal disturbance to the soil (Arnone, 1997). There are, however, some
important differences: unlike soil organisms, resin bags have no active uptake
mechanisms, so nutrient transport processes are relatively more important to
resin bags than to plants or microbes (Stark, 2000). It is not known how
effectively IER bags compete with plants and microbes for nutrients (Stark,
2000).
Ion flux could not be calculated per weight (or volume) of soil,
because the ions that were transported into the resin bag originated from an
unknown volume of soil (Stark, 2000).
The validity of data from resin bags may partly depend on their depth
in the soil. Resin bags at the same depth as the majority of root biomass are
likely to experience a nutrient environment similar to that of the plants, while
resin bags located below most root biomass may only receive nutrients that have
been lost by leaching (Niklaus et al., 2001).
2.7 INTERCROPPING:
Intercropping can be defined as the growing of two or more crops
simultaneously in alternate rows or otherwise in the same area (Willey, 1979).It
19
is an insurance against failure of crops in aberrant weather conditions and a
means for utilization of natural resources in time and space.
2.7.a Crop Compatibility:
Choice of compatible crops plays a vital role in the success of any
intercropping system. Crop combinations differ with geographical location, these
may be intercropping of tree crops, intercropping of tree and field crops or
intercropping of field crops. Intercropping is a potentially beneficial system. It
shows substantial yield advantages over sole cropping and reduces risk of
drought. This advantage can be achieved not only by means of costly inputs but
by simple expedient of growing crops together (Willey, 1979). To find out the
best crop combination for higher monetary return benefiting to production
technology for intercropping system is required.
On the basis of morphology and growth duration, a variety of crop
combinations: consisting of cereals and legumes such as maize and cowpea were
identified. Combination of early maturing and drought tolerant crops such as
millet and sorghum dominate the areas with annual rainfall of less than 600 mm
in Nigeria, in areas with annual rainfall greater than 600 mm, cereals and
legumes of varying maturity are used to ensure efficient utilization of above and
underground resources (Ofori & Stern, 1987). Maize seems to dominate as the
cereal component and it is combined with many different legumes like cowpea
(Ruthenberg, 1980),
In high rainfall areas of West Africa, a common crop combination is
maize and cowpea (Okigbo and Greenland, 1976) whereas in South and Central
America, maize and different types of beans dominate the system (Francis,
1986).
Crop compatibility is an essential ingredient of sound intercropping
system. The crop not competing with each other by pattern of differences in
growth rhythm, duration, nutrient and water requirements have better temporal
20
use of resources. The combined crop canopy may utilize solar radiation better
and the combined root system may explore nutrients and moisture from more
soil volume resulting in spatial complementarily (Ruthenberg, 1980).
2.7.b Benefits of intercropping:
Pandey and Singh (1985) obtained maximum dry matter (27.3 q/ha)
from cowpea when it was sown with maize in 1:1 row ratio.
Das and Chaterjee, (1977) reported that maize and cowpea produced
75q of dry matter per hectare when grown together.
Several benefits are derived from intercropping. These include stability
of production, insurance against crop failure, better resource use and income,
meet the needs of small farmers and employment generation (Rao and Willey,
1980, Roy Sharma et a., 1981; Chatterjee and Maiti, 1984; Tomar., 1984; Koshta
and Karanjkar, 1986).
Improvement in nitrogen nutrition of maize by intercropping with
cowpea was reported by Eaglesham et al (1981).
Cowpea not only maintains the soil fertility but also utilizes
more phosphorus from the applied source (Reddy and Saxena, 1983).
According to Pandey el al.(1999) paired planting of maize at 30 cm
and using the inter space for growing soybean with paired row at 30 cm
significantly increased the maize-equivalent yield.
Gill and Tripathy (1986) reported that mixed cropping of maize and
cowpea had higher dry matter yield (67.4 q/ha) than any of the sole crops
indicating its superiority over pure crops.
Rout et al (1989) from their intercropping trial involving maize,
sorghum, cowpea and rice bean in different row proportions concluded that

21
highest dry fodder yield (48.7 q/ha) was obtained from maize + cowpea (2:1) as
compared to other combinations as well as their pure stands.
Raja and Reddy (1990) concluded that cowpea could increase the
maize productivity by 52% compared to sole maize under moderate dose of
fertilizer application. Adiku et al. (1998) reported similar findings from Ghana
(Africa).
Cowpea being a legume, fixes the atmospheric nitrogen and improves
the soil fertility. Phosphorus fertilization in legumes is of great importance as it
affects nodulation, growth and yield (Thakuria, 1991).
Gangwar et al. (1994) reported that maize+cowpea in the proportion of
50:50 gave higher yield than their counterparts in monoculture system.
Alim (1996) reported that among the different intercropping systems,
maize +cowpea (1:1) had more number of active leaves than the others. Maize +
cowpea (2:2) produced the highest dry matter yield of 92.88 q/ha. Where as sole
cowpea gave an yield of 61.43 q/ha .
Tripathy et al, (1997) indicated that maize + cowpea intercropping
system (2:2) recorded higher dry fodder yield than that grown in 1:1 ratio.
Jena and Saren (1998) observed that the yield and its attributes of
intercrop maize was not so much different from sole maize. Cobs/plant ranged
from 0.72 to 0.77 and remained unaffected.
Krishna et al. (1998) obtained linear response to nitrogen by maize +
cowpea intercropping. The dry matter yield was 5.13 t/ha at higher level of
nitrogen application (180 kg N/ha). Sharma (1993) reported similar results.
22
2.8 CONSERVATION AGRICULTURE PRODUCTION SYSTEM-
YIELD:
Lal (1991) reported from two studies of 8 yr or more that larger maize
grain yields were maintained with a mulch based no tillage system than with a
plough based system.
Yields in the rice-wheat (RW) systems of the Indo-Gangetic Plains
in South Asia are higher with no-till because of timelier planting and better
stands. Yields of 200-500 kg/ha are found with no-till wheat in this system
(Hobbs and Gupta 2004). Yield gains are also reported in other systems.
In recent year, there has been demonstrations evidence of the
merit of practicing conservation agricultural production system (CAPS) in
enhancing food and livelihood securities (Timsina et al., 2006).
2.9 CONSERVATION AGRICULTURE PRODUCTION SYSTEM
BENIFIT: COST RATIO:
One of the major benefits of Conservation agriculture, which makes
it popular with farmers. is it costs less in terms of money but also time. Once
again in the rice wheat (RW) systems of South Asia (Hobbs and Gupta 2004),
no-till wheat significantly reduced the costs of production; farmers estimate
this at about 1500 rupees/ha (US$ 60/ha), mostly due to using less diesel fuel,
less labour, and less pumping of water. Since planting can be accomplished in
one pass of the seed drill, time for planting was also reduced, thus, freeing
farmers to do other productive work.
No-till uses less diesel fuel and thus results in lower carbon dioxide
emissions, one of the gases responsible for global warming. In RW systems,
40-60 litters of diesel fuel are saved because farmers can forego the practice
of ploughing many times to get a good seedbed after harvesting rice planted
after puddle rice in degraded soils (Hobbs and Gupta 2004).
23
Weeds have been shown to germinate less in conservation agriculture
in RW systems (50-60%less) because the soil is less disturbed and less grassy
weeds (Phalaris minor) germinate than in tilled soils. There is also evidence of
allelopathic properties of cereal residues in respect to inhibiting surface weed
seed germination (Lodhi and Malik 1987; Steinsiek et al. 1982: Jung et al.
2004). Weeds will also be controlled when the cover crop is cut, rolled flat, or
killed by herbicides.
The review of literature presented in this section shows that studies in
respect to conservation agriculture influencing soil properties are very scanty
and suggest for more soil specific study in order to evolve a suitable
management strategy.

24
MATERIALS AND METHODS
In order to fulfil the objectives of the present study” Impacts of
Maize based conservation agriculture production system on soil properties in
North Central Plateau Zone of Odisha” an experiment was conducted under
SMARTS (Sustainable Management of Agricultural Resources For Tribal
Societies) project at Regional Research and Technology Transfer Station
(RRTTS), O.U.A.T, Kendujhar. The materials used and methods followed in this
study are discussed under the following heads.
3.1 Materials
3.1.1 Experimental Site:
The regional Research and Technology transfer Station, O.U.A.T,
Kendujhar is situated at 21° 55’N latitude and 85° 37’E longitude in the district
of Kendujhar at an altitude of 615m above the MSL. It comes under North
Central Plateau zone of odisha.
3.1.2 Climate and Weather condition:
The experimental site experiences a hot and sub humid climate.
Metrological data (mean of 10 years) from the period 2001-2010 presented in
Table 3.1 revealed that the mean annual rainfall at the centre is 1527.26mm. The
rainfall is monsoonic and unimodal. August is the rainiest month and January the
driest month with the mean rainfall of 286.96 and 4.36mm, respectively. April is
the hottest (37.500C) and January is the coolest (11.730C) month. The relative
humidity varies from the minimum of 34.72% in March to 87.53% in
September.
25
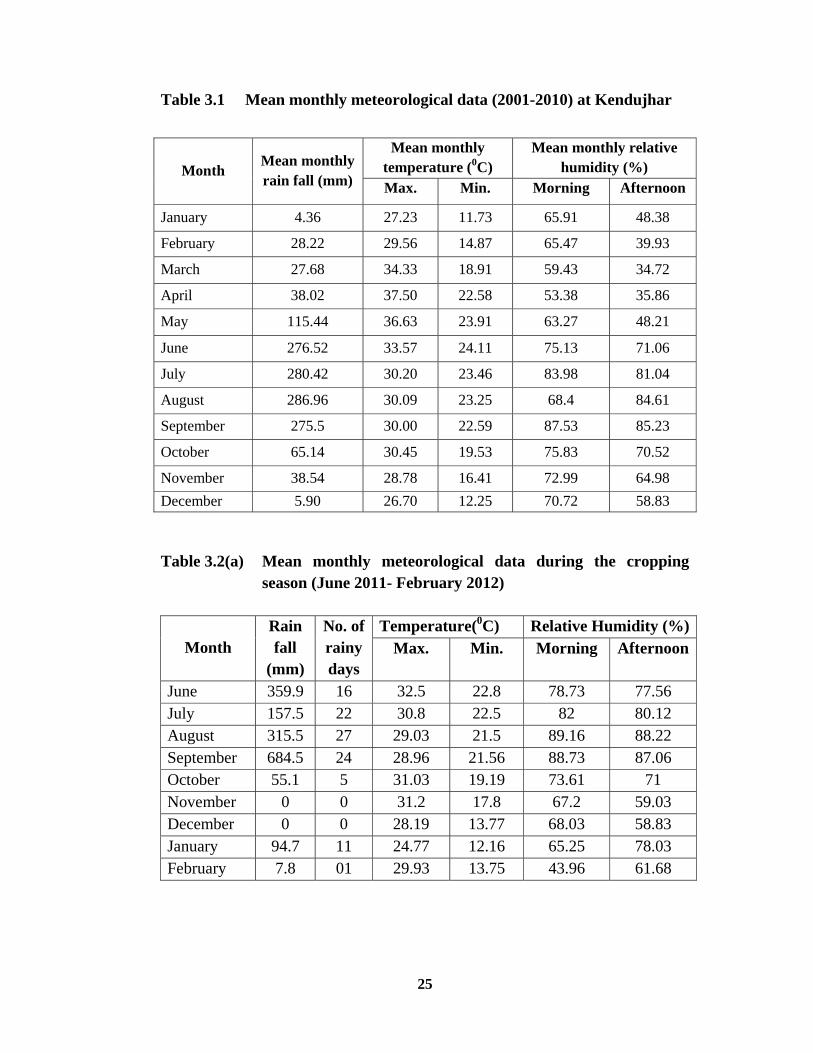
Table 3.1 Mean monthly meteorological data (2001-2010) at Kendujhar
Table 3.2(a) Mean monthly meteorological data during the cropping season (June 2011- February 2012)
Month Mean monthly rain fall (mm)
Mean monthly temperature (0C)
Mean monthly relative humidity (%)
Max. Min. Morning Afternoon
January 4.36 27.23 11.73 65.91 48.38
February 28.22 29.56 14.87 65.47 39.93
March 27.68 34.33 18.91 59.43 34.72
April 38.02 37.50 22.58 53.38 35.86
May 115.44 36.63 23.91 63.27 48.21
June 276.52 33.57 24.11 75.13 71.06
July 280.42 30.20 23.46 83.98 81.04
August 286.96 30.09 23.25 68.4 84.61
September 275.5 30.00 22.59 87.53 85.23
October 65.14 30.45 19.53 75.83 70.52
November 38.54 28.78 16.41 72.99 64.98 December 5.90 26.70 12.25 70.72 58.83
Month Rain fall
(mm)
No. of rainy days
Temperature(0C) Relative Humidity (%)Max. Min. Morning Afternoon
June 359.9 16 32.5 22.8 78.73 77.56 July 157.5 22 30.8 22.5 82 80.12 August 315.5 27 29.03 21.5 89.16 88.22 September 684.5 24 28.96 21.56 88.73 87.06 October 55.1 5 31.03 19.19 73.61 71 November 0 0 31.2 17.8 67.2 59.03 December 0 0 28.19 13.77 68.03 58.83 January 94.7 11 24.77 12.16 65.25 78.03 February 7.8 01 29.93 13.75 43.96 61.68

26
Table 3.2(b) Mean weekly meteorological data during the cropping season (June 2011- February 2012)
Month
Met. Week
Rain fall
(mm)
Rainy
days
Temp (0C) Relative Humidity (%)Mean Max.
Mean Min. (Morning) (Afternoon)
June
23 34.50 2 35.00 23.12 73.71 69.2824 219.10 6 31.45 22.15 81.71 89.8525 29.80 3 31.10 23.48 78.85 76.1426 35.10 6 30.41 22.85 84.28 79.57
July
27 45.00 5 30.75 22.31 81.14 76.7128 31.90 5 31.95 23.11 81.85 83.4229 48.30 7 29.04 22.81 84.85 85.7130 20.90 4 27.59 21.67 81.14 76.00
August
31 26.30 3 32.01 22.98 83.00 85.1432 34.50 6 28.44 22.45 90.71 88.7133 105.80 7 28.81 21.77 89.14 87.2834 73.90 6 30.97 21.95 88.42 85.5735 127.49 7 28.33 21.88 93.42 92.85
September
36 125.70 7 27.52 21.67 92.00 91.42 37 146.00 5 30.07 21.98 91.71 86.2838 345.90 7 28.17 21.54 91.57 89.28 39 5.20 3 30.70 21.08 77.85 79.00
October
40 0.00 0 32.24 20.42 69.85 68.14 41 9.20 2 31.75 21.70 85.71 81.2842 0.20 1 31.07 19.72 71.40 72.4243 36.20 1 28.52 17.42 72.85 66.28
November
44 0.00 0 29.3 14.64 63.42 60.4245 0.00 0 29.82 14.77 60.57 57.0046 0.00 0 29.25 15.42 73.00 59.1447 0.00 0 27.81 13.95 68.28 60.57
December
48 0.00 0 27.57 13.45 70.28 60.57 49 0.00 0 28.38 13.12 70.00 62.0050 0.00 0 26.77 12.07 79.28 61.8551 0.00 0 25.64 7.70 61.14 46.5752 0.00 0 25.4 12.87 69.71 71.71
January
01 4.20 2 26.85 16.28 86.00 71.2802 77.30 4 21.14 10.57 73.42 65.4203 0 0 26.57 10.85 71.85 53.4204 1.6 1 25.57 12.16 80.14 69.57
February
05 116 2 24.14 10.57 68.28 57.1406 0.00 1 29.28 13.42 58.85 46.8507 7.80 0 28.71 15.14 82.00 58.42 08 0.00 0 32.00 13.57 53.57 32.1430 24.00 4 33.00 23.81 84.90 82.70
27
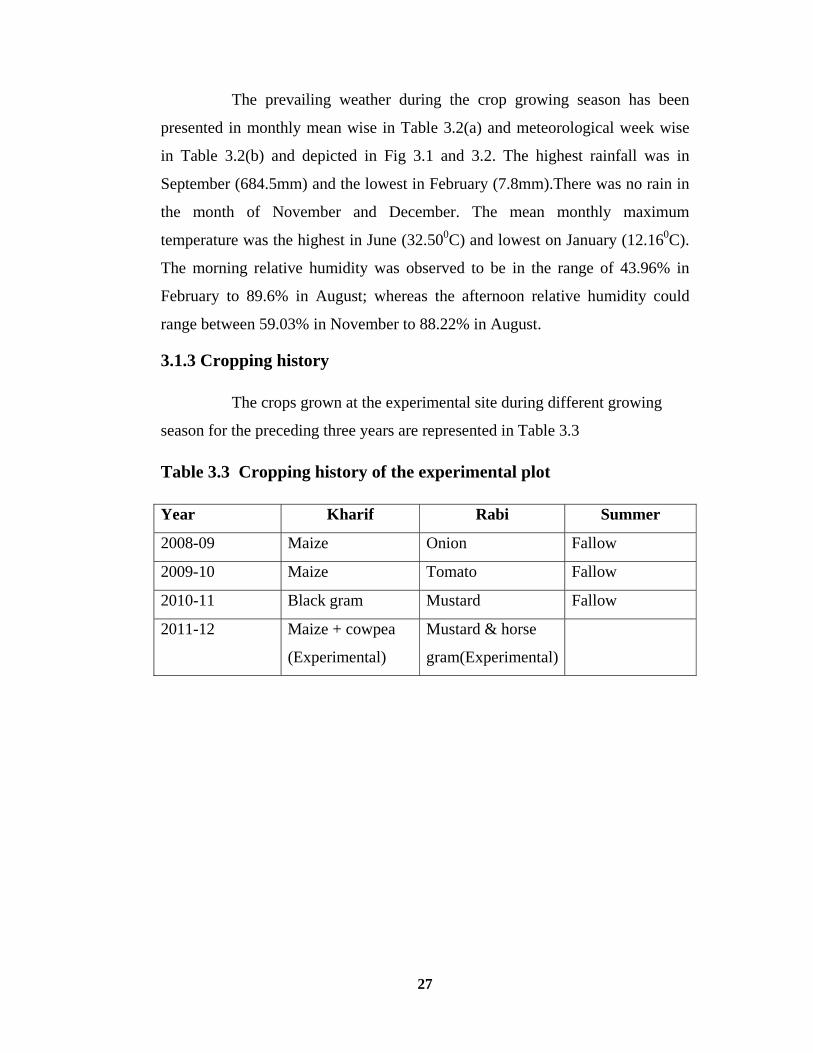
The prevailing weather during the crop growing season has been
presented in monthly mean wise in Table 3.2(a) and meteorological week wise
in Table 3.2(b) and depicted in Fig 3.1 and 3.2. The highest rainfall was in
September (684.5mm) and the lowest in February (7.8mm).There was no rain in
the month of November and December. The mean monthly maximum
temperature was the highest in June (32.500C) and lowest on January (12.160C).
The morning relative humidity was observed to be in the range of 43.96% in
February to 89.6% in August; whereas the afternoon relative humidity could
range between 59.03% in November to 88.22% in August.
3.1.3 Cropping history
The crops grown at the experimental site during different growing
season for the preceding three years are represented in Table 3.3
Table 3.3 Cropping history of the experimental plot
Year Kharif Rabi Summer
2008-09 Maize Onion Fallow
2009-10 Maize Tomato Fallow
2010-11 Black gram Mustard Fallow
2011-12 Maize + cowpea
(Experimental)
Mustard & horse
gram(Experimental)

Fig
Fig
g.3.1: Me
201
g.3.2: Me(Ju
0
100
200
300
400
500
600
700
Rai
nfal
l (m
m)
0
5
10
15
20
25
30
35
Tempe
rature
ean month
11-Februar
ean monthlune 2011-Fe
hly rainfall
ry 2012)
ly temperatebruary 20
28
l data dur
ture data d012).
Mon
Month
ring the cr
during the
nth
Maximu
ropping se
cropping s
Rain fall (
m Mi
eason (Jun
season
(mm)
nimum
ne
29
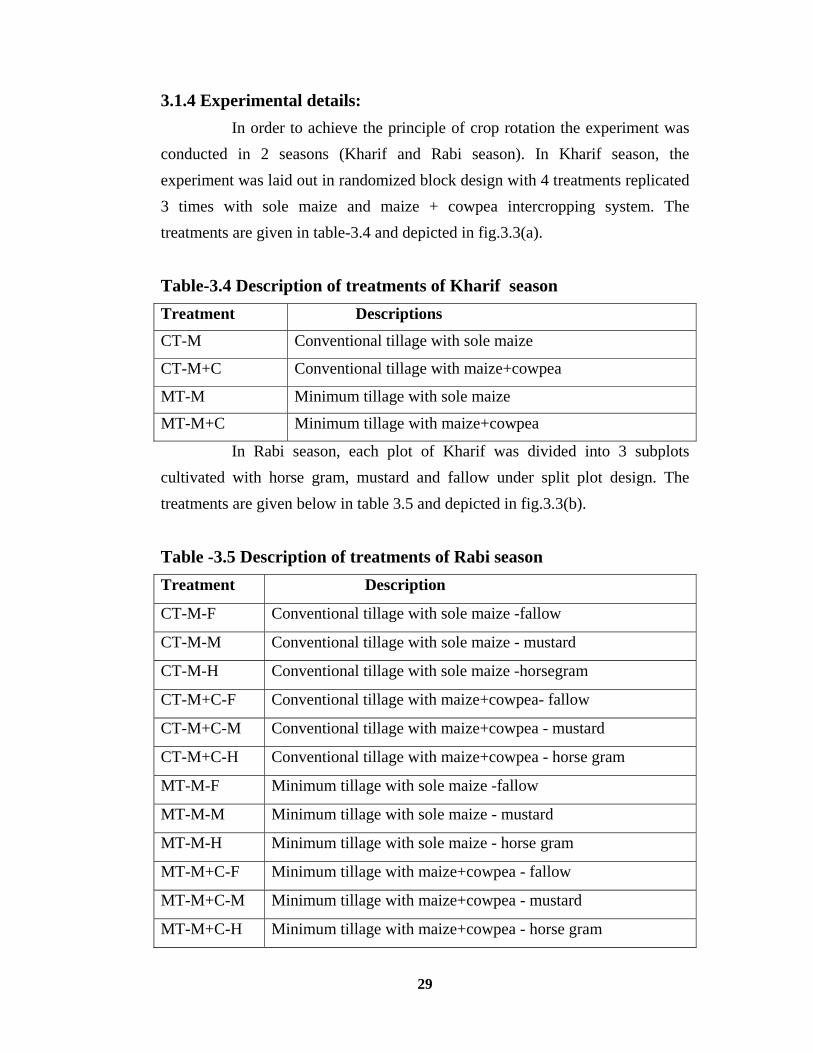
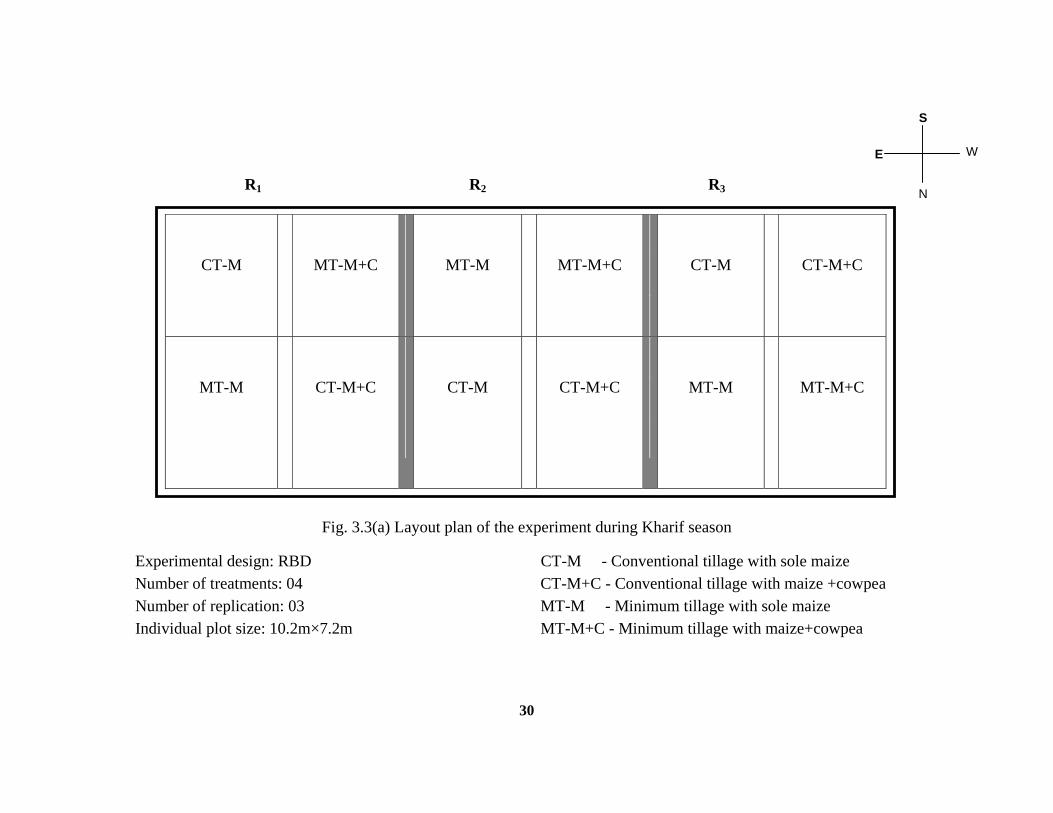
3.1.4 Experimental details: In order to achieve the principle of crop rotation the experiment was
conducted in 2 seasons (Kharif and Rabi season). In Kharif season, the experiment was laid out in randomized block design with 4 treatments replicated 3 times with sole maize and maize + cowpea intercropping system. The treatments are given in table-3.4 and depicted in fig.3.3(a).
Table-3.4 Description of treatments of Kharif season Treatment Descriptions
CT-M Conventional tillage with sole maize
CT-M+C Conventional tillage with maize+cowpea
MT-M Minimum tillage with sole maize
MT-M+C Minimum tillage with maize+cowpea
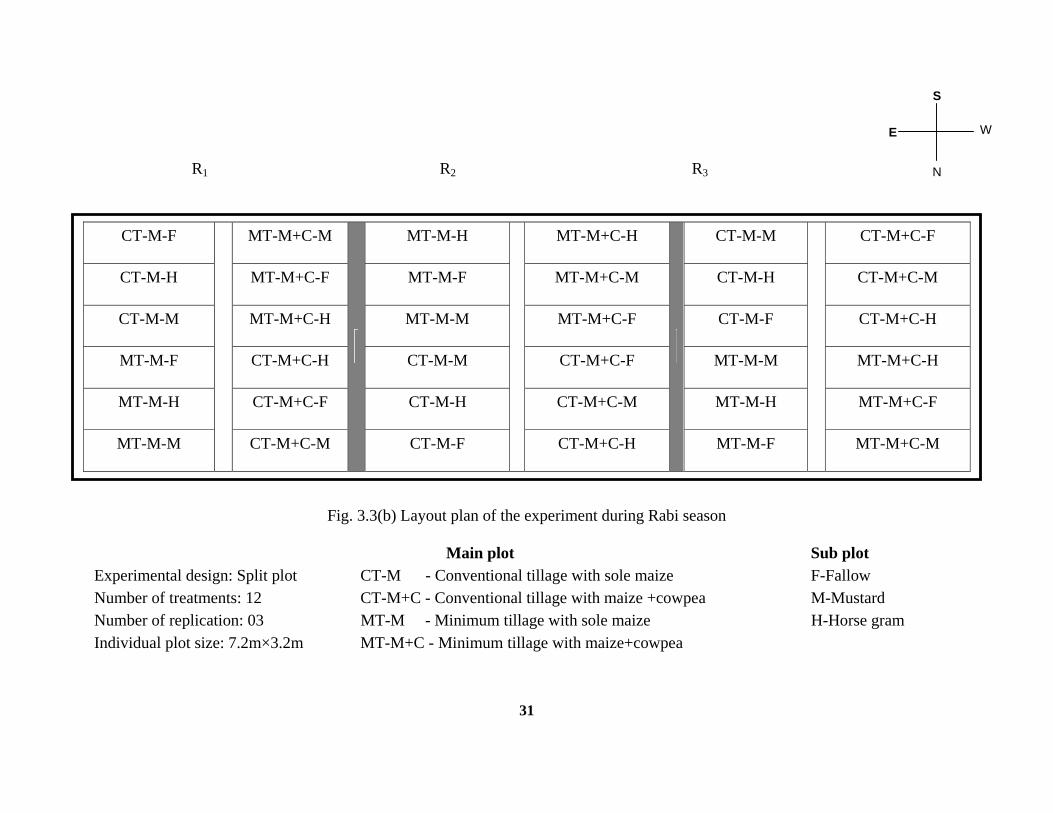
In Rabi season, each plot of Kharif was divided into 3 subplots cultivated with horse gram, mustard and fallow under split plot design. The treatments are given below in table 3.5 and depicted in fig.3.3(b).
Table -3.5 Description of treatments of Rabi season Treatment Description
CT-M-F Conventional tillage with sole maize -fallow
CT-M-M Conventional tillage with sole maize - mustard
CT-M-H Conventional tillage with sole maize -horsegram
CT-M+C-F Conventional tillage with maize+cowpea- fallow
CT-M+C-M Conventional tillage with maize+cowpea - mustard
CT-M+C-H Conventional tillage with maize+cowpea - horse gram
MT-M-F Minimum tillage with sole maize -fallow
MT-M-M Minimum tillage with sole maize - mustard
MT-M-H Minimum tillage with sole maize - horse gram
MT-M+C-F Minimum tillage with maize+cowpea - fallow
MT-M+C-M Minimum tillage with maize+cowpea - mustard
MT-M+C-H Minimum tillage with maize+cowpea - horse gram
30
CT-M
MT-M+C
MT-M
MT-M+C
CT-M
CT-M+C
MT-M
CT-M+C
CT-M
CT-M+C
MT-M
MT-M+C
R1 R2 R3
Fig. 3.3(a) Layout plan of the experiment during Kharif season
Experimental design: RBD CT-M - Conventional tillage with sole maize Number of treatments: 04 CT-M+C - Conventional tillage with maize +cowpea Number of replication: 03 MT-M - Minimum tillage with sole maize Individual plot size: 10.2m×7.2m MT-M+C - Minimum tillage with maize+cowpea
E
S
W
N
31
R1 R2 R3
Fig. 3.3(b) Layout plan of the experiment during Rabi season
Main plot Sub plot Experimental design: Split plot CT-M - Conventional tillage with sole maize F-Fallow Number of treatments: 12 CT-M+C - Conventional tillage with maize +cowpea M-Mustard Number of replication: 03 MT-M - Minimum tillage with sole maize H-Horse gram Individual plot size: 7.2m×3.2m MT-M+C - Minimum tillage with maize+cowpea
CT-M-F
MT-M+C-M
MT-M-H MT-M+C-H CT-M-M
CT-M+C-F
CT-M-H MT-M+C-F MT-M-F MT-M+C-M CT-M-H CT-M+C-M
CT-M-M MT-M+C-H MT-M-M MT-M+C-F CT-M-F CT-M+C-H
MT-M-F CT-M+C-H CT-M-M CT-M+C-F MT-M-M MT-M+C-H
MT-M-H CT-M+C-F CT-M-H CT-M+C-M MT-M-H MT-M+C-F
MT-M-M CT-M+C-M CT-M-F CT-M+C-H MT-M-F MT-M+C-M
E
S
W
N

32
3.1.5 Soil characteristics:
The soil of the experimental field belongs to moderately well drained
mixed red and black soil (Vertic Haplaquepts). The initial soil properties are
listed in and table-3.6
Table-3.6 Initial physical and chemical properties of the soil
Particulars Values Bulk density 1.34 Texture Clay loam
Sand 54.6% Silt 15.2% Clay 30.2%
pH 7.33 Organic carbon (g/kg) 6.60 Available N(Kg/ha) 259.3 Available Phosphorous (Kg/ha) 15.45 Available Potassium (kg/ha) 328.6 Ca[cmol (p+)/kg] 17.00 Mg [cmol (p+)/kg] 6.00
3.1.6 Description of crop varieties
3.1.6.1 Maize (CV.Nilesh) :- It is a maize hybrid developed by Nirmala
hybrids, Hyderabad having a duration of 100-110 days suitable for Kharif, Rabi
and Summer season. The hybrid is well acclimatised to agro-climatic situation of
North central plateau zone of Odisha by virtue of its genetic make up.
3.1.6.2 Cowpea (CV.Hariyally Bush) :- Hariyally Bush is a cowpea variety
developed from screening of elite cowpea germ plasm of west Bengal. The
variety has shown promising performance in the kendujhar through front line
demonstration and on farm testing conducted by KVK, kendujhar.
3.1.6.3 Mustard (CV.Parvati) :- The Variety was released from AICRP on
Rapeseed and Mustard, OUAT, Bhubaneswar, Odisha. It matures within 75 days
33
and is suitable for both rained and irrigated condition throughout Odisha. The
plant height is 97-110cm. The oil content is 41-50%. The seeds are semi bold,
round, light brown in colour and test weight is 5-25g. The siliqua is medium,
long, flat, slightly flat and brawn red colour. The variety yields 15qha-1. It
tolerates soil moisture stress.
3.1.6.4 Horse gram (CV.Athagada local) :- Athagada local was the test variety
for horse gram. It is a farmer’s variety of 100 days duration. It suits well to
rainfed situations of Odisha and tolerates winter too.
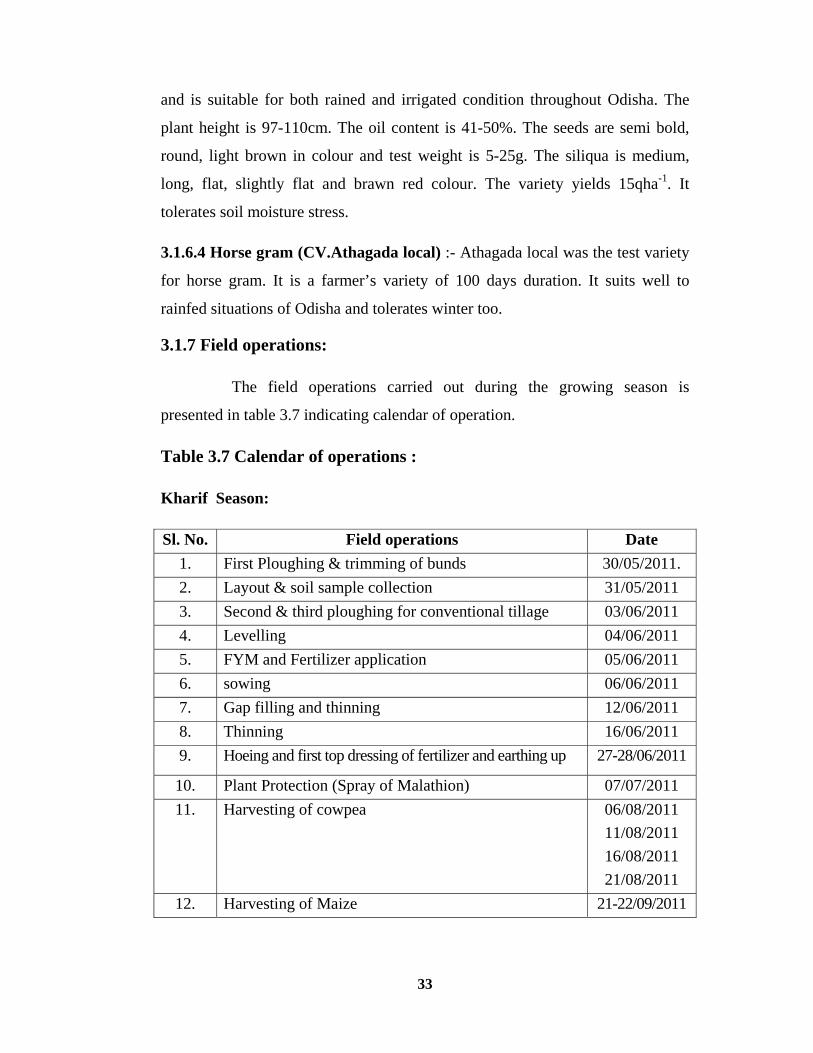
3.1.7 Field operations:
The field operations carried out during the growing season is
presented in table 3.7 indicating calendar of operation.
Table 3.7 Calendar of operations :
Kharif Season:
Sl. No. Field operations Date 1. First Ploughing & trimming of bunds 30/05/2011. 2. Layout & soil sample collection 31/05/2011 3. Second & third ploughing for conventional tillage 03/06/2011 4. Levelling 04/06/2011 5. FYM and Fertilizer application 05/06/2011 6. sowing 06/06/2011 7. Gap filling and thinning 12/06/2011 8. Thinning 16/06/2011 9. Hoeing and first top dressing of fertilizer and earthing up 27-28/06/2011
10. Plant Protection (Spray of Malathion) 07/07/2011 11. Harvesting of cowpea 06/08/2011
11/08/2011 16/08/2011 21/08/2011
12. Harvesting of Maize 21-22/09/2011
34
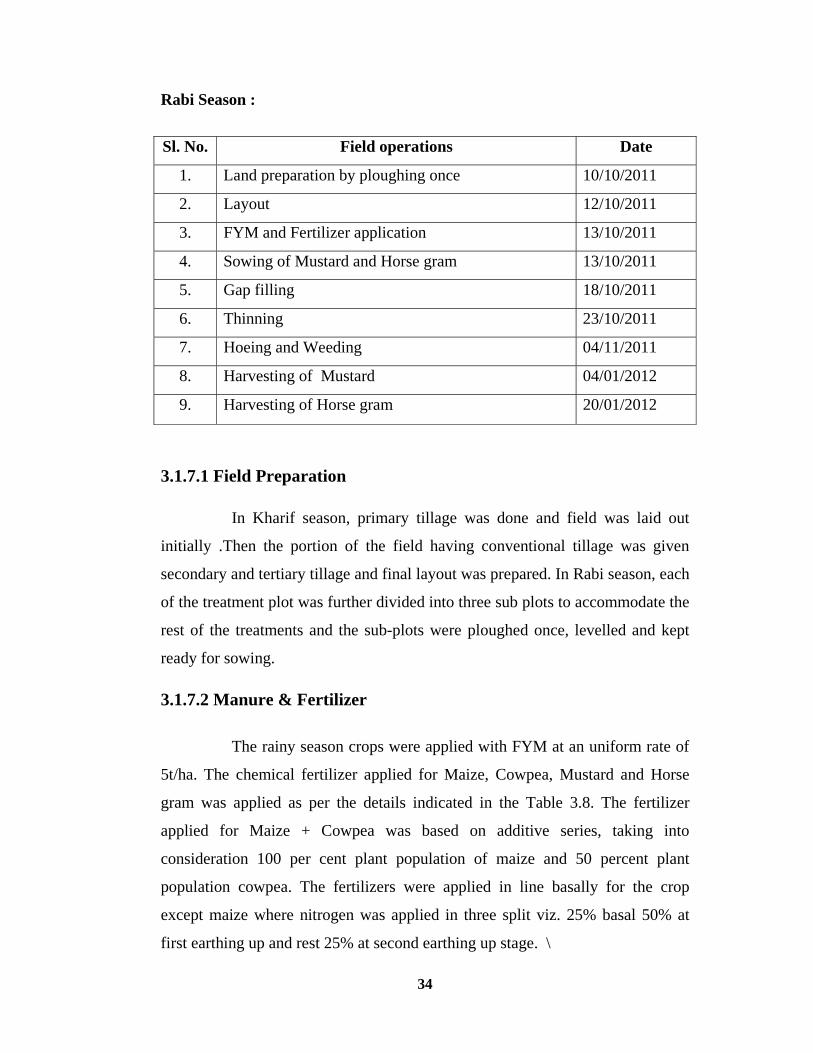
Rabi Season :
3.1.7.1 Field Preparation
In Kharif season, primary tillage was done and field was laid out
initially .Then the portion of the field having conventional tillage was given
secondary and tertiary tillage and final layout was prepared. In Rabi season, each
of the treatment plot was further divided into three sub plots to accommodate the
rest of the treatments and the sub-plots were ploughed once, levelled and kept
ready for sowing.
3.1.7.2 Manure & Fertilizer
The rainy season crops were applied with FYM at an uniform rate of
5t/ha. The chemical fertilizer applied for Maize, Cowpea, Mustard and Horse
gram was applied as per the details indicated in the Table 3.8. The fertilizer
applied for Maize + Cowpea was based on additive series, taking into
consideration 100 per cent plant population of maize and 50 percent plant
population cowpea. The fertilizers were applied in line basally for the crop
except maize where nitrogen was applied in three split viz. 25% basal 50% at
first earthing up and rest 25% at second earthing up stage. \
Sl. No. Field operations Date
1. Land preparation by ploughing once 10/10/2011
2. Layout 12/10/2011
3. FYM and Fertilizer application 13/10/2011
4. Sowing of Mustard and Horse gram 13/10/2011
5. Gap filling 18/10/2011
6. Thinning 23/10/2011
7. Hoeing and Weeding 04/11/2011
8. Harvesting of Mustard 04/01/2012
9. Harvesting of Horse gram 20/01/2012
35
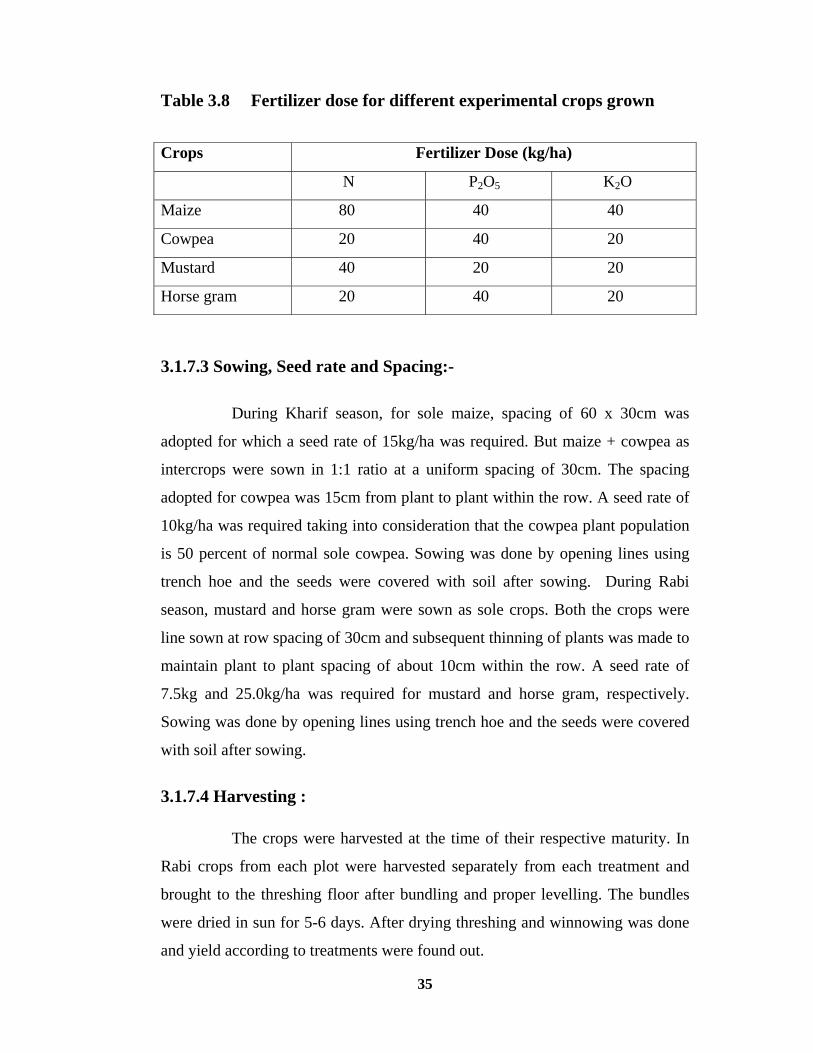
Table 3.8 Fertilizer dose for different experimental crops grown
3.1.7.3 Sowing, Seed rate and Spacing:-
During Kharif season, for sole maize, spacing of 60 x 30cm was
adopted for which a seed rate of 15kg/ha was required. But maize + cowpea as
intercrops were sown in 1:1 ratio at a uniform spacing of 30cm. The spacing
adopted for cowpea was 15cm from plant to plant within the row. A seed rate of
10kg/ha was required taking into consideration that the cowpea plant population
is 50 percent of normal sole cowpea. Sowing was done by opening lines using
trench hoe and the seeds were covered with soil after sowing. During Rabi
season, mustard and horse gram were sown as sole crops. Both the crops were
line sown at row spacing of 30cm and subsequent thinning of plants was made to
maintain plant to plant spacing of about 10cm within the row. A seed rate of
7.5kg and 25.0kg/ha was required for mustard and horse gram, respectively.
Sowing was done by opening lines using trench hoe and the seeds were covered
with soil after sowing.
3.1.7.4 Harvesting :
The crops were harvested at the time of their respective maturity. In
Rabi crops from each plot were harvested separately from each treatment and
brought to the threshing floor after bundling and proper levelling. The bundles
were dried in sun for 5-6 days. After drying threshing and winnowing was done
and yield according to treatments were found out.
Crops Fertilizer Dose (kg/ha)
N P2O5 K2O
Maize 80 40 40
Cowpea 20 40 20
Mustard 40 20 20
Horse gram 20 40 20
36
3.1.8 Installing resin bags in the field:
Five resin bags were placed in inter row space of each treatment plot
at the RRTTS, Kendujhar at a depth of 15cm below the soil surface. They were
incubated for a period of four weeks.
Procedure:
A hole of 15cm depth was created and the soil was removed by
khurpi. The resin bag was placed in the hole and a bamboo stick tied with ribbon
flag (30cm long) was inserted to mark the placement of resin bags. The soil was
filled and was tapped down to ensure good contact with the resin bags.
3.2 Methods
3.2.1 Collection and processing of soil samples:
The initial soil samples were collected before imposing any
treatments by following the method of composite random sampling. The samples
were dried under shade and crushed and sieved through 2mm sieve. Then the
samples were preserved in polythene with proper label for analysis. The soil
sample after harvest of maize and cowpea (in Kharif season) and mustard, horse
gram (in Rabi season) were also collected in the same way and kept in polythene
with proper labelling.
3.2.2 Plant samples:
The plant samples of maize, cowpea, horse gram and mustard were
collected treatment wise, dried and grinded. Then the samples were kept in
polythene with proper label for analysis.
3.2.3 Record of field:
After harvest of Kharif crops, yield were recorded in terms of seed
and pod Kg/plot for maize and cowpea respectively. For horse gram and mustard
yields were in terms of Kg seeds per plot. Then the data were converted to qha-1.
37
3.2.4 Method of analysis:
3.2.4.1 Soil analysis: The soil samples were analysed for different
physicochemical properties following the standard methods given.
3.2.4.1.1 Bulk density:
The bulk density of soil samples was determined by core method as
described by Black(1965).
3.2.4.1.2 Soil texture:
The percentage of sand, silt, clay were determined with the help of
Bouyoucos hydrometer following the standard procedure (Piper, 1950) after
Kharif and Rabi. After Rabi equal quantity (50g) of soil sample from each sub
plots were taken, mixed thoroughly and the composite soil sample was taken for
analysis.
50g of soil sample was taken in a beaker and 15ml of 10%
sodium hexametaphosphate was added followed by 200ml of distilled water and
was stirred for 15 minutes with a mechanical stirrer. The content were
transferred to a 1000ml measuring cylinder and the volume was made up to 1
litre. At 5 minutes and 5 hours the temperature and hydrometer reading were
taken. Percentage sand, silt, clay were calculated and the textural class was
determined using international triangular diagram.
3.2.4.1.3 Soil pH:
As suggested by Jackson (1973) the pH of soil samples was
determined in 1:2 soil:water suspension after equilibration for half an hour with
intermittent stirring using the glass electrode pH meter.
3.2.4.1.4 Organic carbon:
Organic carbon of the soils were determined by wet oxidation method
of Walkley and Black as outlined in soil chemical analysis (Page et al.,1982).
38
3.2.4.1.5 Available nitrogen:
Available nitrogen was determined by using alkaline potassium
permanganate (KMnO4) method (subbiah and Asija, 1956).
5g of soil sample was taken in a 800ml kjeldahl flask and
then 25ml of 0.32% KMnO4 and 25ml of 2.5% NaOH solution was added with
some distilled water. Distillation was done by Kelplus Nitrogen Auto Analyzer
and the distillate was collected at receiver tube in the 250ml conical flask
containing 20ml boric acid (2%) with mixed indicator. The distillate was titrated
against 0.02N H2SO4 to a pink colour end point. From the amount of H2SO4
consumed the amount of available nitrogen was calculated.
3.2.4.1.6 Available phosphorus:
Available phosphorus in the soil samples was determined
spectrophotometrically by Olsen’s method (Olsen et al.,1954).
2.5g of soil was added with 50ml of Olsen’s extractant (0.5N
NaHCO3) and was shaken for 30 minutes and filtered through Whatman No.1
filter paper. 5ml of aliquot was transferred to 25ml volumetric flask and was
acidified to pH 5.0 with 5N H2SO4 followed by addition of 4ml of ascorbic acid
solution. Then the volume was made up to 25ml with distilled water and was
shaken. Phosphorus concentration was determined by the help of
spectrophotometer at 882nm. Phosphorus concentration was calculated from
standard graph prepared by taking known phosphorus concentration.
3.2.4.1.7 Available potassium:
Available potassium of soil was determined by extracting the soil
with neutral normal ammonium acetate solution and estimated by flame
photometer.
5g of soil sample was equilibrated with 25ml of neutral normal
ammonium acetate by shaking for 5minutes. Then it was filtered by the help of
39
Whatman No.1 filter paper and the potassium concentration in the filtrate was
measured in a flame photometer after necessary dilution as described by Page et
al.(1982).
3.2.4.1.8 Available calcium and magnesium:
Available calcium and magnesium of soil sample were determined by
method described by Page et al.1982.
2.5g of soil along with 20ml of neutral normal ammonium acetate
solution was shaken for 30 minutes in a horizontal shaker. Then the sample was
filtered and volume was made up to 50ml.
5ml of extract was taken and 3ml of 10% NaOH, 10 drops of each of
Hydroxyl amine hydrochloride, TEA (Triethanol amine) and Calcon indicator
was added. Then the content was titrated against standard 0.01N
EDTA(Ethylene Diamine Tetra Acetic Acid) as described by Jackson(1973).
Then % Ca was determined from the quantities of EDTA consumed during
titration.
First (Ca+Mg)% was determined by taking 5ml of aliquot. Then little
distilled water, 15ml of NH4Cl-NH4OH buffer and 10 drops of each of the
Hydroxyl amine hydrochloride, TEA, Potassium ferrocyanide were added. The
content was gently heated and was made cool. Then 10 drops of EBT
(Eriochrome Black-T) was added and titrated against standard 0.01N EDTA to
turquoise blue end point as described by Jackson(1973). % Mg was calculated
by deducting Ca% from (Ca+Mg)%.
3.2.4.2 Determination of captured nutrient in resin bag:
After four weeks of incubation period the resin bags were removed
carefully not to damage and were kept in plastic bags for each plot. The resin
bags were washed in deionised water to remove the soil particles. Then the
cleaned resin bags were placed in 500ml conical flask and 50ml of 0.5 molar
HCl was added to each resin bag in the flask. In this way the resin bags were
40
kept for two hours for complete conversion of bicarbonate to carbon dioxide.
Then the resin bags in the flask were shaken for one hour on a shaker. After that
the solution was filtered and was stored in storage bottle for nutrient (N, P, K,
Ca, Mg) analysis. The nutrients were analysed following the standard analytical
procedure.
3.2.4.3 plant analysis:
3.2.4.3.1 Analysis of nitrogen: Nitrogen in the plant sample(leaves) was
estimated by Micro kjeldahl method (Jackson,1973).
3.2.4.3.2 Analysis of Phosphorus:
The plant samples were digested following prescribed method. 0.5g
of leaves sample was taken in a 100ml conical flask and was pre-digested with
10ml concentrated HNO3. Then 5ml of diacid (HNO3:HClO4=3:2) was added
and the digestion was continued in a hot plate until dense white fumes evolved.
Then the flask was allowed to slightly cool and filtered through Whatman No-1
filter paper by washing the content 5 times each with little distilled water. The
content was transferred to 50ml volumetric flask and the volume was made up to
50ml by adding distilled water. The content was mixed thoroughly.
Phosphorus was analysed by Vanado-Molybdo-Phosphoric acid
yellow colour method as described by Jackson (1973) at 470nm by the help of
spectrophotometer.
3.2.4.3.3 Analysis of Potassium:
The plant samples were digested following the method same as
phosphorus. 5ml of aliquot was diluted with distilled water to 25ml and
potassium concentration was estimated as described by Jackson (1973) by the
help of Flame photometer.

41
3.2.5 Maize-equivalent yield
Maize-equivalent yield (MEY) was calculated by the formula as
follows:
MEY (qha-1) )q(RsgrainmaizeofPrice
)q(Rsproducethatofprice)ha(qproducecropotherof Yield1
11
−
−− ×=
The maize equivalent yield of the cropping system was found out by
addition of yield of maize component and the maize equivalent yield of other
component crop taken in intercropping and the Rabi crop if any (mustard and
horse gram).
3.2.6 Economics of production
Studies on economics of production was made by keeping a record
on operations carried out, labour engaged power, input utilized for production
and the return from the output. The cost of cultivation for each treatment was
worked out for component crops in the system. The gross were calculated taking
to account the prevailing price of outputs. Net return per hectare and return per
rupee invested were also worked out as per the following formula.
Net return = Gross return – Cost of cultivation
ncultivatioofcost Total
return Grossinvested rupeeper Return =
3.2.7 Statistical Analysis:
Data in respect of soil physical and chemical properties for various
treatments were subjected to analysis of variance following standard statistical
procedure (Gomez and Gomez, 1984).

42
RESULTS AND DISCUSSION
In order to investigate the effect of conservation agricultural production
system on soil physical characteristics, chemical properties, nutrient uptake and
yield of crops in a maize based cropping system an experiment was conducted at
Regional Research and Technology Transfer Station (RRTTS), Kendujhar on an
alkaline soil. The experimental results of the field experiment and laboratory
analyses carried out during the period of investigation are reported and discussed
in this chapter under the following heads.
4.1 Effect of different tillage and crops on some physical properties of soil
4.1.1 Bulk density
4.1.2 Texture
4.2 Effect of different tillage and crops on some chemical properties of soil
4.2.1 Soil reaction (pH)
4.2.2 Soil organic carbon
4.2.3 Available nitrogen
4.2.4 Available phosphorus
4.2.5 Available potassium
4.2.6 Available calcium
4.2.7 Available magnesium
4.3 Nutrient dynamics through resin bag
4.4 Effect of different treatments on nutrient uptake by crops
4.4.1 Nutrient uptake by maize
4.4.2 Nutrient uptake by cowpea
4.4.3 Nutrient uptake by horse gram
4.4.4 Nutrient uptake by mustard
4.5 Effect of different treatments on crop yield
4.5.1 Yields of maize and cowpea
4.5.2 Yields of horse gram and mustard
4.6 Economics of production
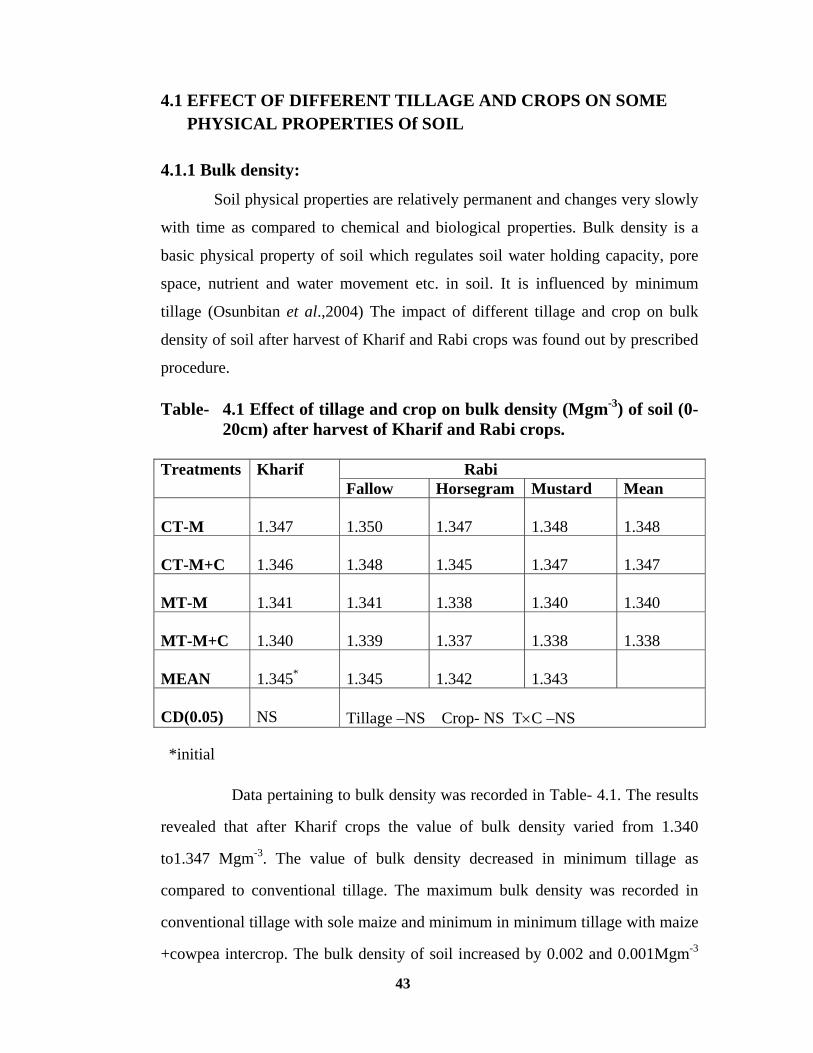
43
4.1 EFFECT OF DIFFERENT TILLAGE AND CROPS ON SOME PHYSICAL PROPERTIES Of SOIL 4.1.1 Bulk density:
Soil physical properties are relatively permanent and changes very slowly
with time as compared to chemical and biological properties. Bulk density is a
basic physical property of soil which regulates soil water holding capacity, pore
space, nutrient and water movement etc. in soil. It is influenced by minimum
tillage (Osunbitan et al.,2004) The impact of different tillage and crop on bulk
density of soil after harvest of Kharif and Rabi crops was found out by prescribed
procedure.
Table- 4.1 Effect of tillage and crop on bulk density (Mgm-3) of soil (0-20cm) after harvest of Kharif and Rabi crops.
Treatments Kharif Rabi
Fallow Horsegram Mustard Mean CT-M
1.347
1.350
1.347
1.348
1.348
CT-M+C
1.346
1.348
1.345
1.347
1.347
MT-M
1.341
1.341
1.338
1.340
1.340
MT-M+C
1.340
1.339
1.337
1.338
1.338
MEAN
1.345* 1.345
1.342
1.343
CD(0.05)
NS
Tillage –NS Crop- NS T×C –NS
*initial
Data pertaining to bulk density was recorded in Table- 4.1. The results
revealed that after Kharif crops the value of bulk density varied from 1.340
to1.347 Mgm-3. The value of bulk density decreased in minimum tillage as
compared to conventional tillage. The maximum bulk density was recorded in
conventional tillage with sole maize and minimum in minimum tillage with maize
+cowpea intercrop. The bulk density of soil increased by 0.002 and 0.001Mgm-3

44
in case of CT-M and CT-M+C respectively over initial bulk density of 1.345
Mgm-3 whereas reduced by 0.004 and 0.005 Mgm-3 in case of MT-M and MT-
M+C respectively. Minimum tillage reduced the bulk density of soil though non
significant than the conventional tillage. After harvest of Rabi crops the bulk
density varied from 1.348 Mgm-3 in CT-M to 1.338 Mgm-3 in MT-M+C. Among
different crops grown in Rabi season the bulk density varied from 1.342 to 1.345
Mgm-3. The minimum value was recorded in case of horse gram plot and
maximum in fallow.
The minimum tillage helped in increasing the organic matter content
and porosity of the soil which reduced the bulk density of soil than initial. Similar
result was found by Kay and Vanden Bygaart (2002) and Deen and Kataki in
2003.
This conditions favour plant growth and maintenance of soil health. In
comparison to sole maize with maize+cowpea intercropping showed better
performance than the former. The latter one had showed a reduction in bulk
density than the former one. In case of sole maize crop the bulk density remained
almost same as initial but in maize +cowpea intercropping bulk density reduced.
This showed maize +cowpea not only conserve the soil but also improves the
porosity and adds more organic matter to the soil resulting in reduction of bulk
density.
After harvest of Rabi crops the bulk density of soil was decreased in horse
gram .This was due to the effect of horse gram which is a leguminous crop as well
as its phyllotaxy acts as an umbrella to protect the soil. It not only adds nitrogen
but also improves the porosity. These effects were not found from mustard crop
which is a non leguminous crop and tall in morphology.

45
4.1.2 Texture:
Texture is another important physical property of soil. It directly
influences the plant growth by regulating many physical and chemical
characteristics. Surface area, ion exchange, porosity, nutrient holding capacity,
water air movement are directly or indirectly influenced by texture. It is relatively
sTable because change is very slow by different weathering and pedogenic
process. Clay is finer than silt and sand which influences more in regulating
nutrient and water holding capacity of soil. The proportion of clay opt to be
maintain or increase to some extent for better growth of crop. In the other hand
drastic reduction in clay and increase in the sand content in the soil is an
indication of soil degradation.
Table 4.2 Effect of tillage and crop on fine earth fraction of soil (0-20cm) Kharif crops.
Treatment Sand (%) Silt (%) Clay(%)
CT-M 54.6 15.0 30.4
CT-M+C 53.6 15.6 30.8
MT-M 53.8 14.8 31.4
MT-M+C 52.6 15.8 31.6
INITIAL 54.6 15.2 30.2
The effect of tillage and crop on sand, silt and clay content of the soil
were determined and presented in Table 4.2. After Kharif season the sand content
of soil varied from 52.6 to 54.2%. Maximum sand content was found in treatment
CT-M whereas minimum in MT-M+C. In comparison to initial sand content of
soil (54.6%) in all the treatments sand content was decreased. The maximum
decrease of 2.0% in MT-M+C. The silt content varied from 14.8 to 15.8% in
comparison to initial value 15.2%. The clay content varied from 30.4 to 31.6% in
comparison to initial of 30.2%the minimum value was observed in CT-m

46
followed by CT-M+C, MT-M and MT-M+C in an increasing order. The value of
silt and clay increased from conventional tillage to minimum tillage. Maize
+cowpea intercrop helped in increasing the silt and clay content than sole maize
crop.
Table 4.3 Effect of tillage and crop on fine earth fraction of soil (0-20cm) after Rabi crops.
Treatment Sand (%) Silt (%) Clay(%)
CT-M 53.8 15.4 30.8
CT-M+C 52.6 16.2 31.2
MT-M 52.8 15.4 31.8
MT-M+C 52.2 15.6 32.2
After Rabi crops taking composite soil sample sand, silt and clay %
were determined and recorded in Table 4.3. The sand content varied from 52.2 to
53.8%, silt content varied from 14.6 to 15.6 %and clay content varied from 30.8
to32.2 %. The sand content slightly increased in conventional tillage than its
initial value whereas a decreasing value was observed in case of minimum tillage.
But a reverse trend was observed in case of silt and clay content in their respective
treatments. Maize + cowpea intercropping showed greater decreasing effect on
content of sand over sole maize crop and a reverse trend in case of silt and clay.
In case of conventional tillage the reduction in sand content after
Kharif is less than minimum tillage which was due to increase in clay and silt
content. This showed silt and clay fraction of soil was conserved by minimum
tillage as compared to conventional tillage. In maize +cowpea intercrop, cowpea
being a cover crop had influenced physically and biologically in protecting the
losses of clay and silt more than sole maize crop.

47
4.2 EFFECT OF DIFFERENT TILLAGE AND CROPS ON SOME CHEMICAL PROPERTIES Of SOIL 4.2.1 Soil reaction (pH) :
Soil reaction is one of the most important fundamental physicochemical
characteristics of soil. It influences most of the soil properties. The availability of
most of the nutrients, microbial growth and soil health basically depends on it.
Table 4.4 Effect of tillage and crop on pH (1:2) of soil (0-20cm) after harvest of Kharif and Rabi crops.
Treatments Kharif Rabi Fallow Horsegram Mustard Mean
CT-M
7.32
7.31
7.32
7.31
7.31
CT-M+C
7.33
7.32
7.33
7.33
7.32
MT-M
7.34
7.35
7.36
7.35
7.35
MT-M+C
7.36
7.36
7.38
7.37
7.37
MEAN
7.33*
7.34
7.35
7.34
CD(0.05)
NS
Tillage -NS Crop -NS T×C - NS
*initial
Results pertaining to soil pH measured after Kharif and Rabi crops
recorded in Table 4.4. The data showed that the pH of soils varied from 7.32 to
7.36 unit after Kharif. Maximum pH was found in treatment MT-M+C where as
minimum in CT-M. In comparison to initial pH of soil the pH of minimum tillage
was increased (Sidiras and Pavan, 1985) and that of in conventional tillage
remained same. The increase in pH of soil in MT-M+C was by 0.03 unit than the
initial.
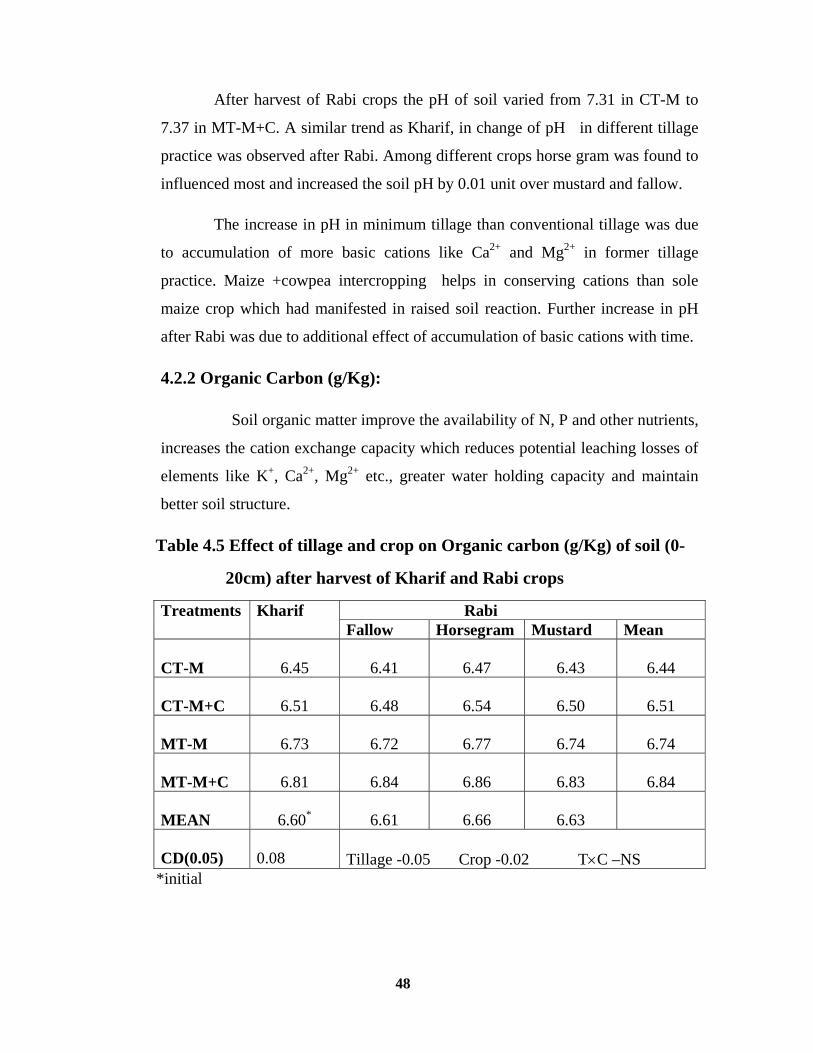
48
After harvest of Rabi crops the pH of soil varied from 7.31 in CT-M to
7.37 in MT-M+C. A similar trend as Kharif, in change of pH in different tillage
practice was observed after Rabi. Among different crops horse gram was found to
influenced most and increased the soil pH by 0.01 unit over mustard and fallow.
The increase in pH in minimum tillage than conventional tillage was due
to accumulation of more basic cations like Ca2+ and Mg2+ in former tillage
practice. Maize +cowpea intercropping helps in conserving cations than sole
maize crop which had manifested in raised soil reaction. Further increase in pH
after Rabi was due to additional effect of accumulation of basic cations with time.
4.2.2 Organic Carbon (g/Kg):
Soil organic matter improve the availability of N, P and other nutrients,
increases the cation exchange capacity which reduces potential leaching losses of
elements like K+, Ca2+, Mg2+ etc., greater water holding capacity and maintain
better soil structure.
Table 4.5 Effect of tillage and crop on Organic carbon (g/Kg) of soil (0-
20cm) after harvest of Kharif and Rabi crops
Treatments Kharif Rabi Fallow Horsegram Mustard Mean
CT-M
6.45
6.41
6.47
6.43
6.44
CT-M+C
6.51
6.48
6.54
6.50
6.51
MT-M
6.73
6.72
6.77
6.74
6.74
MT-M+C
6.81
6.84
6.86
6.83
6.84
MEAN
6.60*
6.61
6.66
6.63
CD(0.05)
0.08
Tillage -0.05 Crop -0.02 T×C –NS
*initial
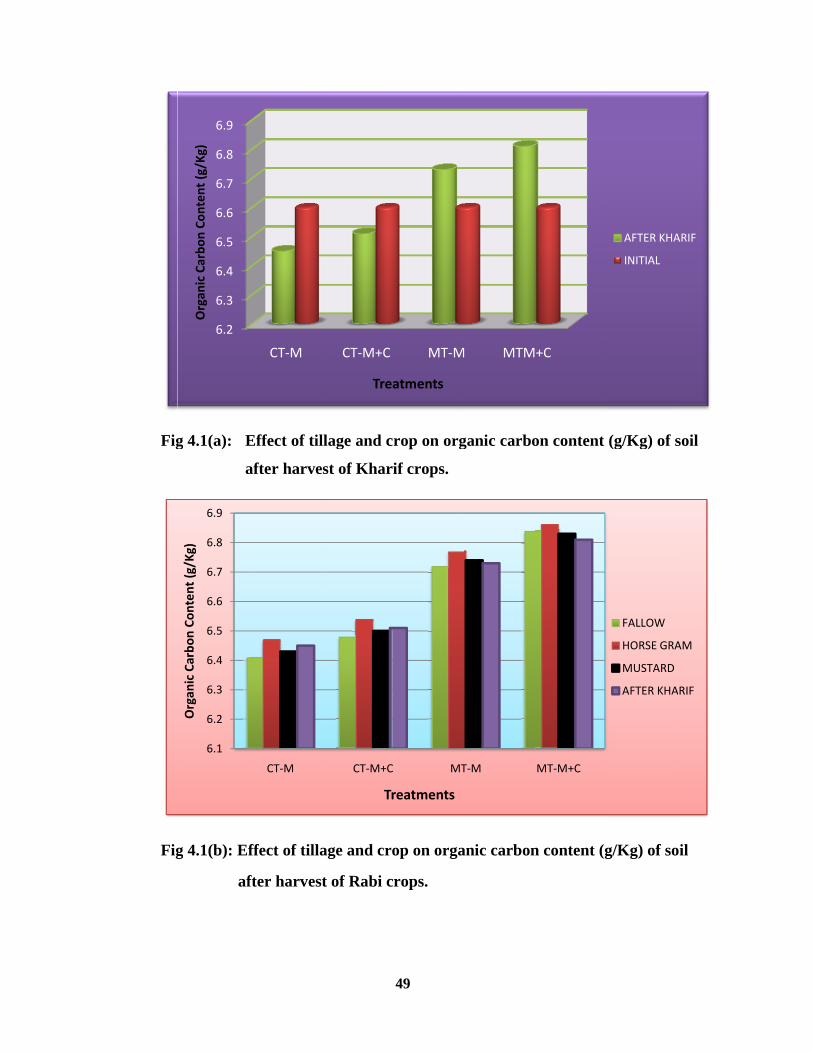
Fig
Fig
g 4.1(a): E
a
g 4.1(b): Ef
af
6.2
6.3
6.4
6.5
6.6
6.7
6.8
6.9
Organ
ic Carbo
n Co
nten
t (g/Kg)
6.1
6.2
6.3
6.4
6.5
6.6
6.7
6.8
6.9
Organ
ic Carbo
n Co
nten
t (g/Kg)
Effect of til
after harve
ffect of tilla
fter harves
CT‐M
CT‐M
llage and c
est of Khar
age and cro
st of Rabi c
CT‐M+C
Tre
CT‐M+C
Tr
49
crop on org
rif crops.
op on orga
crops.
MT‐M
atments
C MT
reatments
ganic carbo
anic carbon
M MTM
T‐M
on content
n content (g
+C
MT‐M+C
(g/Kg) of s
g/Kg) of so
AFTER KHA
INITIAL
FALLOW
HORSE GRA
MUSTARD
AFTER KHA
soil
oil
ARIF
AM
RIF
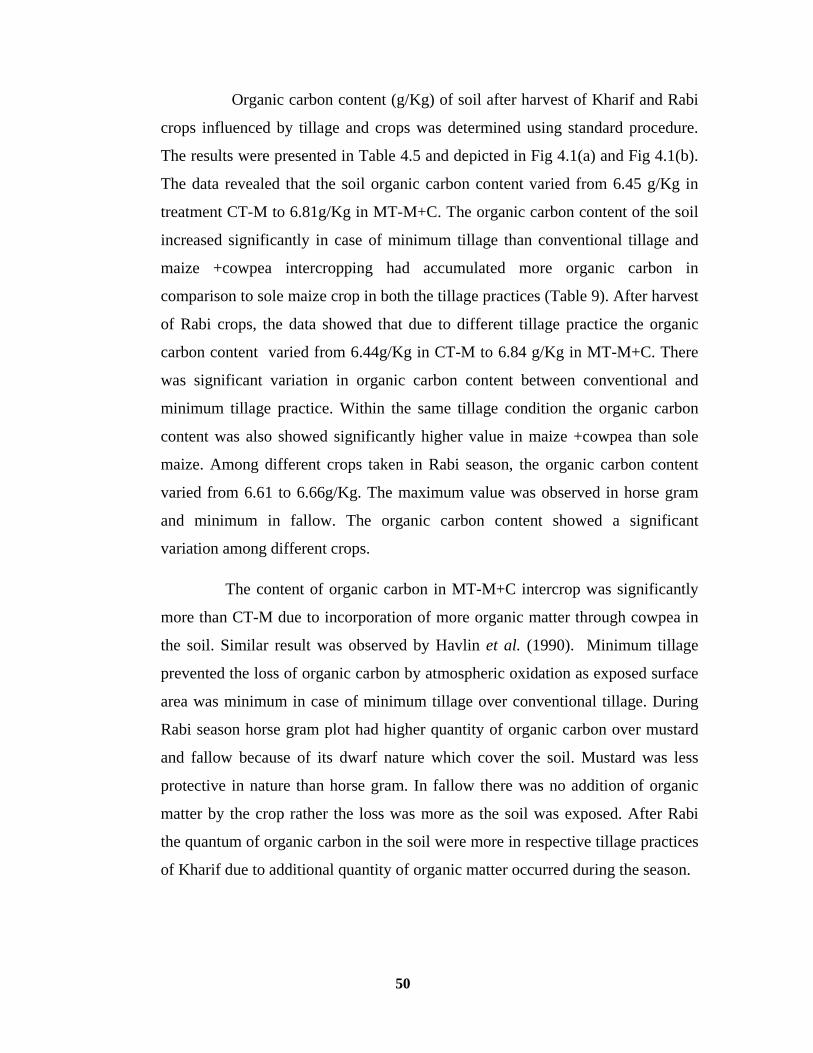
50
Organic carbon content (g/Kg) of soil after harvest of Kharif and Rabi
crops influenced by tillage and crops was determined using standard procedure.
The results were presented in Table 4.5 and depicted in Fig 4.1(a) and Fig 4.1(b).
The data revealed that the soil organic carbon content varied from 6.45 g/Kg in
treatment CT-M to 6.81g/Kg in MT-M+C. The organic carbon content of the soil
increased significantly in case of minimum tillage than conventional tillage and
maize +cowpea intercropping had accumulated more organic carbon in
comparison to sole maize crop in both the tillage practices (Table 9). After harvest
of Rabi crops, the data showed that due to different tillage practice the organic
carbon content varied from 6.44g/Kg in CT-M to 6.84 g/Kg in MT-M+C. There
was significant variation in organic carbon content between conventional and
minimum tillage practice. Within the same tillage condition the organic carbon
content was also showed significantly higher value in maize +cowpea than sole
maize. Among different crops taken in Rabi season, the organic carbon content
varied from 6.61 to 6.66g/Kg. The maximum value was observed in horse gram
and minimum in fallow. The organic carbon content showed a significant
variation among different crops.
The content of organic carbon in MT-M+C intercrop was significantly
more than CT-M due to incorporation of more organic matter through cowpea in
the soil. Similar result was observed by Havlin et al. (1990). Minimum tillage
prevented the loss of organic carbon by atmospheric oxidation as exposed surface
area was minimum in case of minimum tillage over conventional tillage. During
Rabi season horse gram plot had higher quantity of organic carbon over mustard
and fallow because of its dwarf nature which cover the soil. Mustard was less
protective in nature than horse gram. In fallow there was no addition of organic
matter by the crop rather the loss was more as the soil was exposed. After Rabi
the quantum of organic carbon in the soil were more in respective tillage practices
of Kharif due to additional quantity of organic matter occurred during the season.
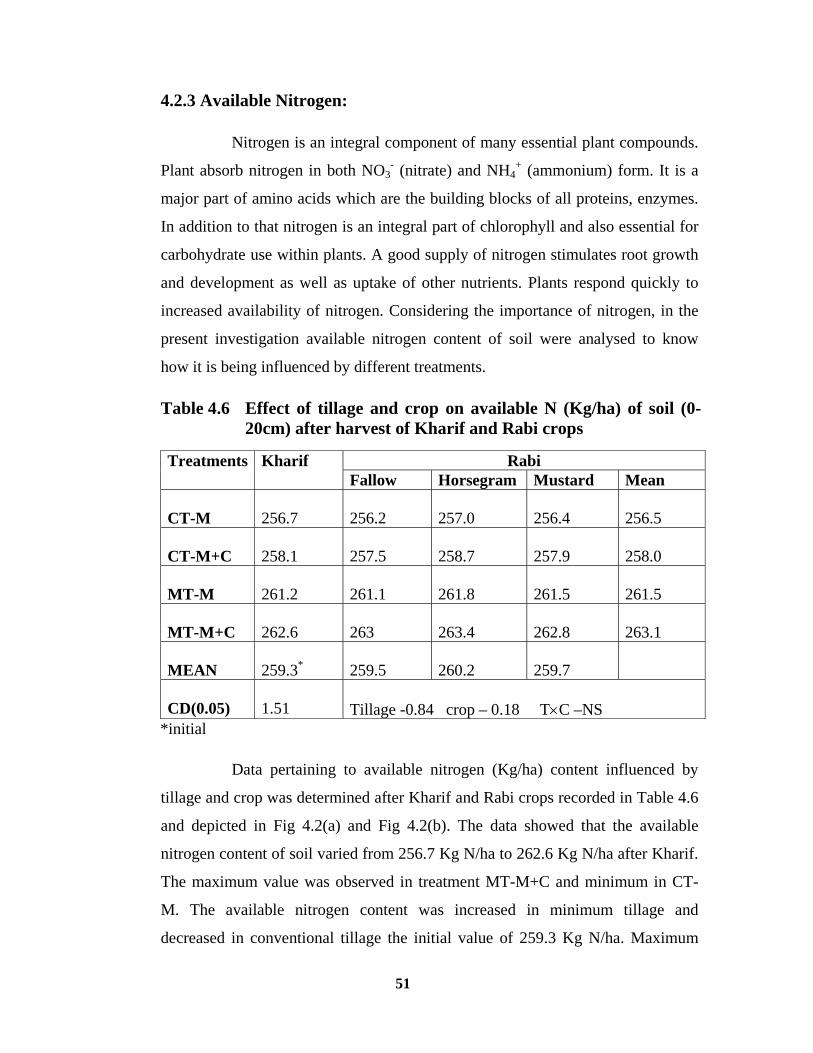
51
4.2.3 Available Nitrogen:
Nitrogen is an integral component of many essential plant compounds.
Plant absorb nitrogen in both NO3- (nitrate) and NH4
+ (ammonium) form. It is a
major part of amino acids which are the building blocks of all proteins, enzymes.
In addition to that nitrogen is an integral part of chlorophyll and also essential for
carbohydrate use within plants. A good supply of nitrogen stimulates root growth
and development as well as uptake of other nutrients. Plants respond quickly to
increased availability of nitrogen. Considering the importance of nitrogen, in the
present investigation available nitrogen content of soil were analysed to know
how it is being influenced by different treatments.
Table 4.6 Effect of tillage and crop on available N (Kg/ha) of soil (0-20cm) after harvest of Kharif and Rabi crops
Treatments Kharif Rabi Fallow Horsegram Mustard Mean
CT-M
256.7
256.2
257.0
256.4
256.5
CT-M+C
258.1
257.5
258.7
257.9
258.0
MT-M
261.2
261.1
261.8
261.5
261.5
MT-M+C
262.6
263
263.4
262.8
263.1
MEAN
259.3* 259.5
260.2
259.7
CD(0.05)
1.51
Tillage -0.84 crop – 0.18 T×C –NS
*initial
Data pertaining to available nitrogen (Kg/ha) content influenced by
tillage and crop was determined after Kharif and Rabi crops recorded in Table 4.6
and depicted in Fig 4.2(a) and Fig 4.2(b). The data showed that the available
nitrogen content of soil varied from 256.7 Kg N/ha to 262.6 Kg N/ha after Kharif.
The maximum value was observed in treatment MT-M+C and minimum in CT-
M. The available nitrogen content was increased in minimum tillage and
decreased in conventional tillage the initial value of 259.3 Kg N/ha. Maximum
52
increase to a tune of 3.3 Kg N/ha was found in MT-M+C treatment. The data
showed that there was significant variation in available nitrogen content between
conventional tillage and minimum tillage. Maize+ cowpea intercrop had
accumulated more available nitrogen (260.4KgN/ha) than sole maize crop
(259.0KgN/ha).
After Rabi crops the available nitrogen content varied from 256.5Kg
N/ha in CT-M to 263.1 Kg N/ha in MT-M+C. The available nitrogen content in
MT-M+C, MT-M, CT-M+C and CT-M were found to be in a decreasing order.
The value of available nitrogen in MT-M+C was significantly higher than CT-M
and CT-M+C and statistically at par with MT-M. Among different crops available
nitrogen content varied between 259.5 Kg N/ha to 260.2 Kg N/ha. The maximum
value was shown in horse gram plot which was statistically significant than
mustard and fallow.
The higher value of available nitrogen in MT-M+C over other
treatments was due to incorporation of cowpea biomass and by preventing the
volatilization loss of nitrogen in an alkaline soil due to less exposure of soil with
the help of minimum tillage. Similar result was observed by Graham et al. (2002).
Secondly minimum tillage produced less yield. Hence less uptake than
conventional tillage.
Maize +cowpea intercropping though consume more nitrogen than
sole maize crop but saved more nitrogen due to nitrogen fixation by cowpea.
Similar result was found by Thakuria in 1991. Secondly cowpea being a
leguminous crop, by incorporation of its biomass enriched the soil by nitrogen,
resulting in a net positive balance after Kharif. During Rabi season more quantity
of nitrogen was found in horse gram plot than mustard and fallow because extra
gain of nitrogen through biological nitrogen fixation and its soil covering nature.
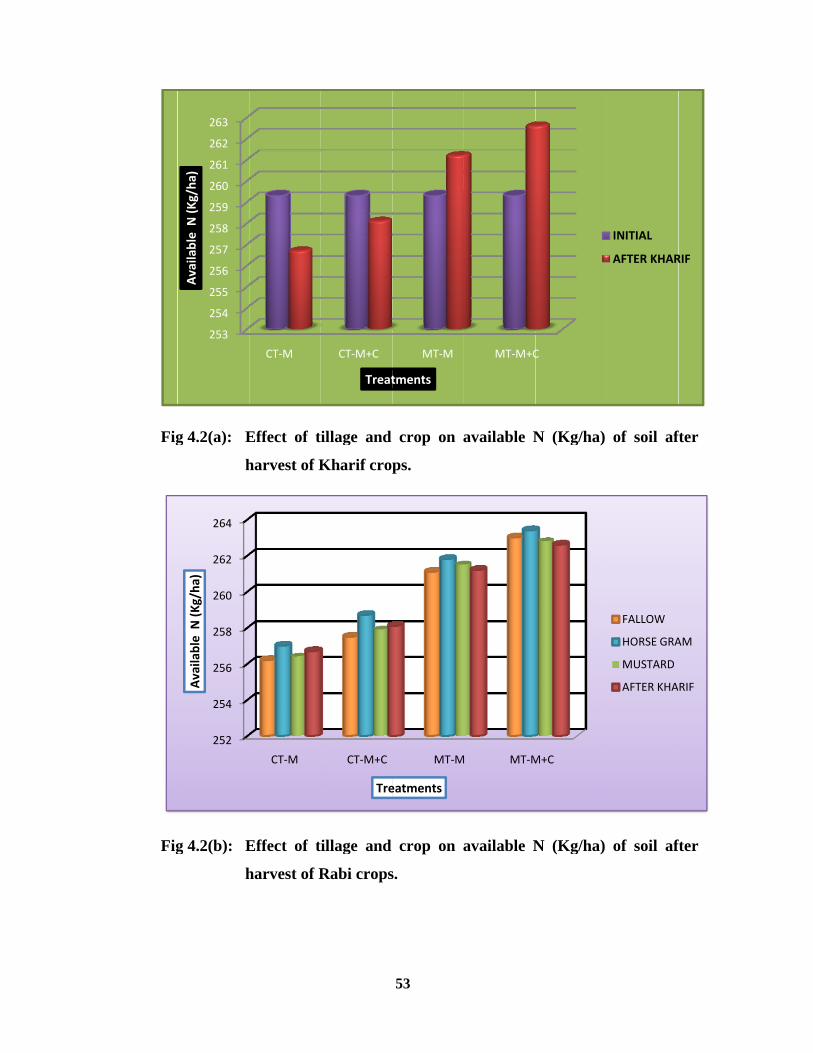
Fig
Fig
g 4.2(a): E
h
g 4.2(b): E
h
253
254
255
256
257
258
259
260
261
262
263
Available N (K
g/ha
)
252
254
256
258
260
262
264
Available N (K
g/ha
)
Effect of t
harvest of K
Effect of t
harvest of R
CT‐M
CT‐M
illage and
Kharif crop
illage and
Rabi crops
CT‐M+C
Treat
CT‐M+C
Tre
53
crop on a
ps.
crop on a
s.
MT‐M
tments
MT‐M
eatments
available N
available N
MT‐M+C
M MT‐M
N (Kg/ha)
N (Kg/ha)
C
M+C
of soil af
of soil af
INITIAL
AFTER KHAR
FALLOW
HORSE GRA
MUSTARD
AFTER KHA
fter
fter
RIF
AM
RIF

54
4.2.4 Available phosphorus:
Phosphorus is an essential nutrient for plant, next to nitrogen. Plant
absorbs phosphorus dissolved in the soil solution as phosphate ions (HPO42-,
H2PO4-). Adequate phosphorus nutrition enhances many aspects of plant
physiology, including photosynthesis, nitrogen fixation, root growth, flowering,
fruiting and maturation.
Table 4.7 Effect of tillage and crop on available P (Kg/ha) of soil (0-20cm) after harvest of Kharif and Rabi crops
Treatments Kharif Rabi Fallow Horse
gram Mustard Mean
CT-M
15.41
15.36
15.38
15.37
15.37
CT-M+C
15.43
15.37
15.40
15.39
15.39
MT-M
15.47
15.45
15.50
15.48
15.48
MT-M+C
15.49
15.51
15.54
15.53
15.53
MEAN
15.45* 15.42
15.46
15.44
CD(0.05)
0.03
Tillage -0.09 crop – 0.02 T×C -NS
*initial
Available phosphorus content of soil after harvest of Kharif crops
influenced by maize and maize +cowpea taken in conventional and minimum
tillage practice after Kharif crops was analysed and presented in Table 4.7 and
depicted in Fig 4.3(a). The data showed that the available phosphorus content of
soil varied between 15.41 Kg P/ha to 15.49 Kg P/ha . The maximum value was
observed in MT-M+C and minimum in treatment CT-M. The available
phosphorus content increased in minimum tillage than conventional tillage (Table
9). Significant variation was observed between the treatments.
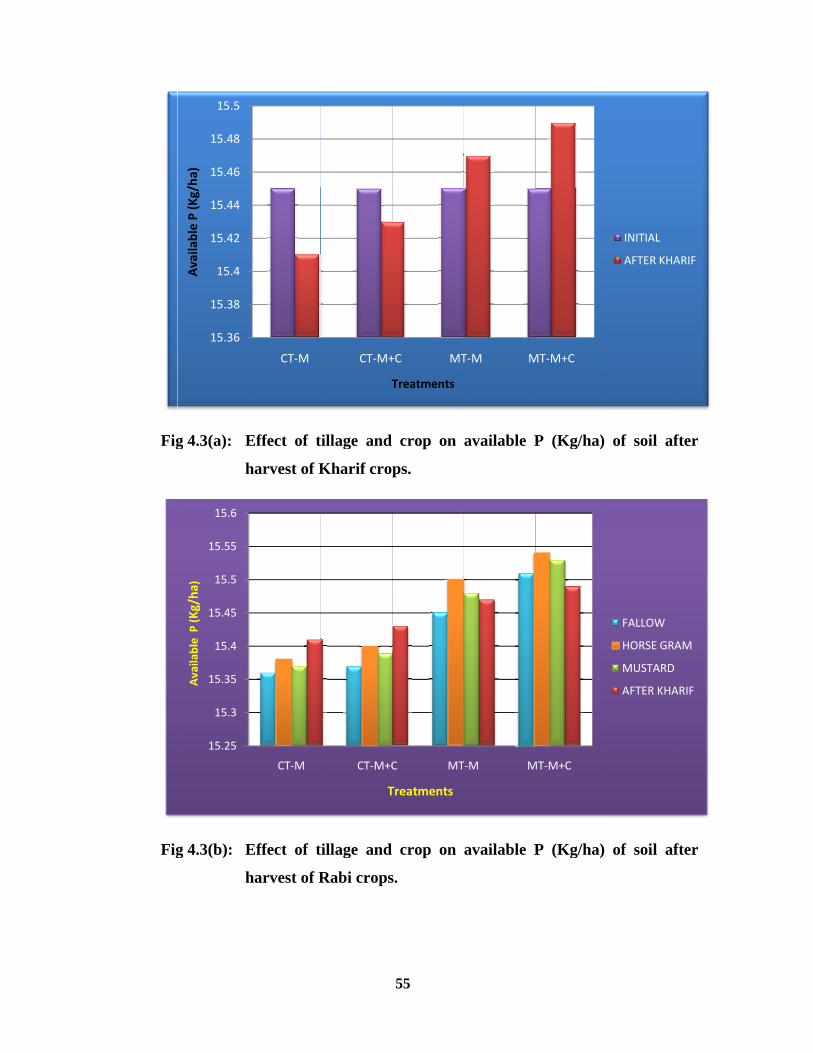
Fig
Fig
g 4.3(a): E
h
g 4.3(b): E
h
15.36
15.38
15.4
15.42
15.44
15.46
15.48
15.5
Available P (Kg/ha
)
15.25
15.3
15.35
15.4
15.45
15.5
15.55
15.6
Available P (K
g/ha
)
Effect of t
harvest of K
Effect of t
harvest of R
CT‐M
CT‐M
tillage and
Kharif crop
tillage and
Rabi crops
CT‐M+
T
CT‐M+C
T
55
crop on
ps.
crop on
s.
+C MT
Treatments
C MT
Treatments
available P
available P
T‐M M
T‐M M
P (Kg/ha)
P (Kg/ha)
MT‐M+C
MT‐M+C
of soil af
of soil af
INITIAL
AFTER KHA
FALLOW
HORSE GRA
MUSTARD
AFTER KHA
fter
fter
ARIF
AM
RIF

56
Results pertaining to the available phosphorus content influenced by
different treatments after Rabi crops were recorded in Table 4.7 and shown in Fig
4.3(b). The value of available phosphorus varied from 15.37 Kg P/ha in CT-M to
15.53 Kg P/ha in treatment MT-M+C. Among different crops the value varied
from 15.42 Kg P/ha to 15.46 Kg P/ha. The available phosphorus content of soil
was increased in horse gram than mustard and fallow but they were statistically at
par. In case of minimum tillage available phosphorus although increased than
conventional tillage they were statistically at par.
The phosphorus content in MT-M+C intercropping was found more
over other treatments because phosphorus was added through incorporation of
cowpea biomass and loss was minimum. The uptake of phosphorus was less in
minimum tillage than conventional tillage. Hence more phosphorus was found in
minimum tillage than conventional tillage. This type of result was obtained by
Ohno and erich (1997). In case of maize + cowpea intercrop phosphorus
accumulation is more than sole maize crop because more quantity of soil bound
phosphorus were released to available form by root activity of crops particularly a
legume cover crop as cowpea. In Rabi season horse gram being a legume crop
secreted more organic acids which dissolved more Ca bound phosphorus than
mustard crop in an alkaline soil like Kendujhar. As the fallow has no root activity
much phosphorus was not released.
4.2.5 Available potassium:
Potassium present in the soil solution only as a positively charged
cation - k+. Its behaviour in the soil influences primarily by soil cation exchange
properties and mineral weathering. Potassium plays numerous roles in plant and
remains in the ionic form (K+) in the cell or acts as an activator for cellular
enzymes.
Data pertaining to available potassium content (Kg/ha) influenced by
tillage determined after Kharif and Rabi was recorded in Table 4.8 and depicted in
Fig 4.4(a) and Fig 4.4(b). The result showed that the value of available potassium
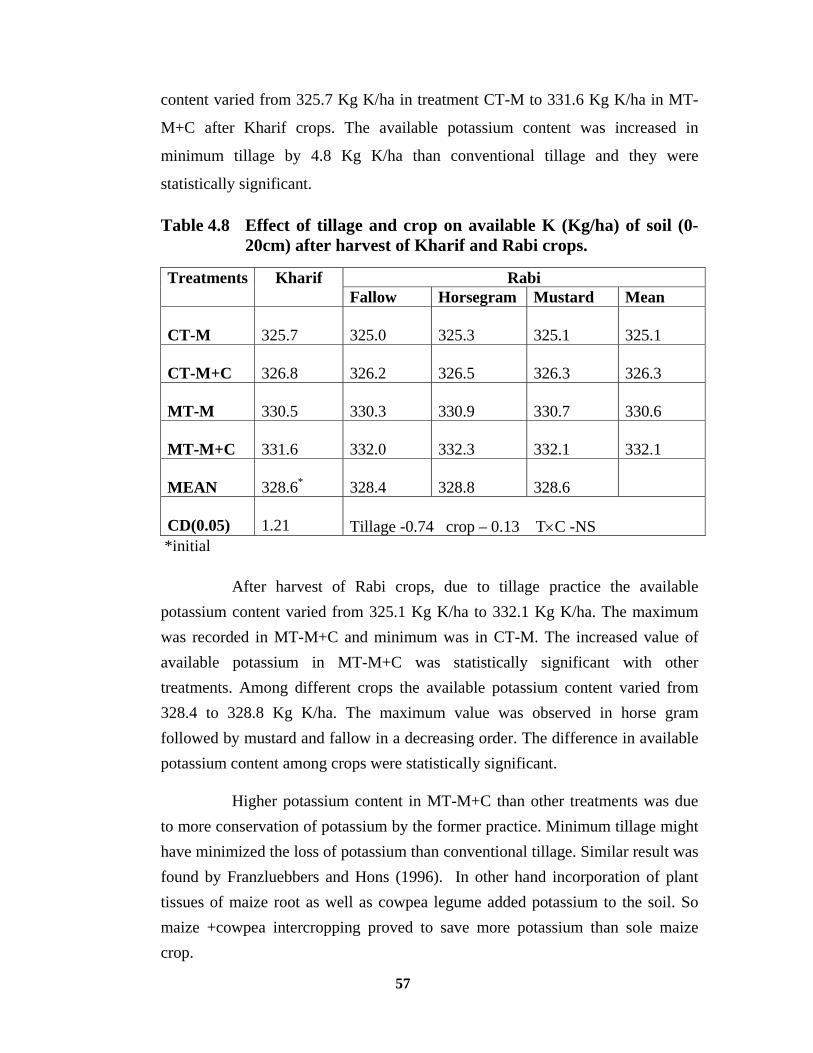
57
content varied from 325.7 Kg K/ha in treatment CT-M to 331.6 Kg K/ha in MT-
M+C after Kharif crops. The available potassium content was increased in
minimum tillage by 4.8 Kg K/ha than conventional tillage and they were
statistically significant.
Table 4.8 Effect of tillage and crop on available K (Kg/ha) of soil (0-20cm) after harvest of Kharif and Rabi crops.
Treatments Kharif Rabi Fallow Horsegram Mustard Mean
CT-M
325.7
325.0
325.3
325.1
325.1
CT-M+C
326.8
326.2
326.5
326.3
326.3
MT-M
330.5
330.3
330.9
330.7
330.6
MT-M+C
331.6
332.0
332.3
332.1
332.1
MEAN
328.6*
328.4
328.8
328.6
CD(0.05)
1.21
Tillage -0.74 crop – 0.13 T×C -NS
*initial
After harvest of Rabi crops, due to tillage practice the available potassium content varied from 325.1 Kg K/ha to 332.1 Kg K/ha. The maximum was recorded in MT-M+C and minimum was in CT-M. The increased value of available potassium in MT-M+C was statistically significant with other treatments. Among different crops the available potassium content varied from 328.4 to 328.8 Kg K/ha. The maximum value was observed in horse gram followed by mustard and fallow in a decreasing order. The difference in available potassium content among crops were statistically significant.
Higher potassium content in MT-M+C than other treatments was due to more conservation of potassium by the former practice. Minimum tillage might have minimized the loss of potassium than conventional tillage. Similar result was found by Franzluebbers and Hons (1996). In other hand incorporation of plant tissues of maize root as well as cowpea legume added potassium to the soil. So maize +cowpea intercropping proved to save more potassium than sole maize crop.

falhorsamnut
Fig
Fig
Thlow becausrse gram. Tme trend astrients than
g 4.4(a): E
h
g 4.4(b): E
h
322
324
326
328
330
332
Available K (Kg/ha
)
320
322
324
326
328
330
332
334
Available K (Kg/ha
)
he residual pse it is a covThe potassiu Kharif con
n convention
Effect of ti
arvest of K
Effect of ti
arvest of R
CT‐M
CT‐M
potassium over crop. Uum status innfirming thenal tillage.
llage and
Kharif cro
illage and
Rabi crop
CT‐M+C
Trea
CT‐M+C
TRE
58
of horse graUptake of pon different te beneficial
crop on av
ops.
crop on a
s..
MT‐M
atments
MT‐M
EATMENTS
am plot waotassium wtillage pracl effect of m
vailable K
vailable K
MT‐M+
M MT‐M
s more thanwas more byctices in Rabminimum til
K (Kg/ha) o
K (Kg/ha)
+C
M+C
n mustard ay mustard thbi showed llage in savi
of soil afte
of soil afte
INITIAL
AFTER KHA
AFTER KHA
FALLOW
HORSE GRA
MUSTARD
and han the ing
er
er
RIF
ARIF
AM
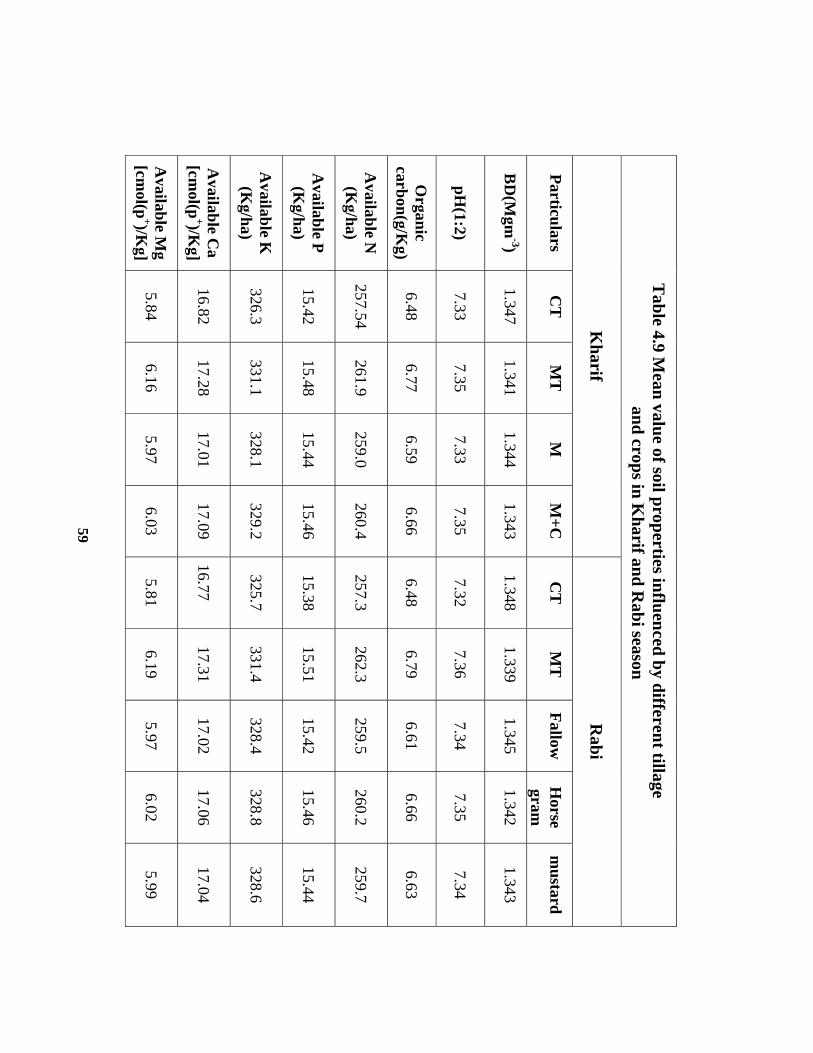
59
Available M
g [cm
ol(p+)/K
g]
Available C
a [cm
ol(p+)/K
g]
Available K
(K
g/ha)
Available P (K
g/ha)
Available N
(K
g/ha)
Organic
carbon(g/Kg)
pH(1:2)
BD
(Mgm
-3)
Particulars
Kharif
Table 4.9 M
ean value of soil properties influenced by different tillage and crops in K
harif and Rabi season
5.84
16.82
326.3
15.42
257.54
6.48
7.33
1.347
CT
6.16
17.28
331.1
15.48
261.9
6.77
7.35
1.341
MT
5.97
17.01
328.1
15.44
259.0
6.59
7.33
1.344
M
6.03
17.09
329.2
15.46
260.4
6.66
7.35
1.343
M+C
5.81
16.77
325.7
15.38
257.3
6.48
7.32
1.348
CT
Rabi
6.19
17.31
331.4
15.51
262.3
6.79
7.36
1.339
MT
5.97
17.02
328.4
15.42
259.5
6.61
7.34
1.345
Fallow
6.02
17.06
328.8
15.46
260.2
6.66
7.35
1.342
Horse
gram
5.99
17.04
328.6
15.44
259.7
6.63
7.34
1.343
mustard
59
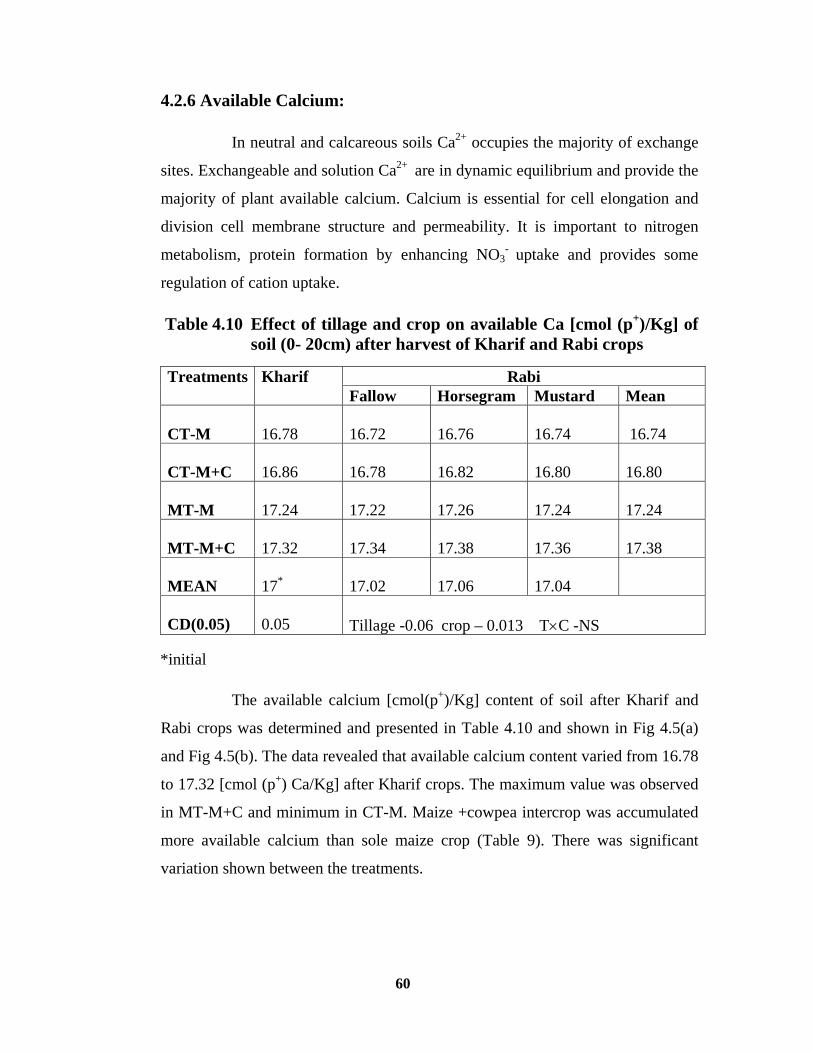
60
4.2.6 Available Calcium:
In neutral and calcareous soils Ca2+ occupies the majority of exchange
sites. Exchangeable and solution Ca2+ are in dynamic equilibrium and provide the
majority of plant available calcium. Calcium is essential for cell elongation and
division cell membrane structure and permeability. It is important to nitrogen
metabolism, protein formation by enhancing NO3- uptake and provides some
regulation of cation uptake.
Table 4.10 Effect of tillage and crop on available Ca [cmol (p+)/Kg] of soil (0- 20cm) after harvest of Kharif and Rabi crops
Treatments Kharif Rabi Fallow Horsegram Mustard Mean
CT-M
16.78
16.72
16.76
16.74
16.74
CT-M+C
16.86
16.78
16.82
16.80
16.80
MT-M
17.24
17.22
17.26
17.24
17.24
MT-M+C
17.32
17.34
17.38
17.36
17.38
MEAN
17*
17.02
17.06
17.04
CD(0.05)
0.05
Tillage -0.06 crop – 0.013 T×C -NS
*initial
The available calcium [cmol(p+)/Kg] content of soil after Kharif and
Rabi crops was determined and presented in Table 4.10 and shown in Fig 4.5(a)
and Fig 4.5(b). The data revealed that available calcium content varied from 16.78
to 17.32 [cmol (p+) Ca/Kg] after Kharif crops. The maximum value was observed
in MT-M+C and minimum in CT-M. Maize +cowpea intercrop was accumulated
more available calcium than sole maize crop (Table 9). There was significant
variation shown between the treatments.
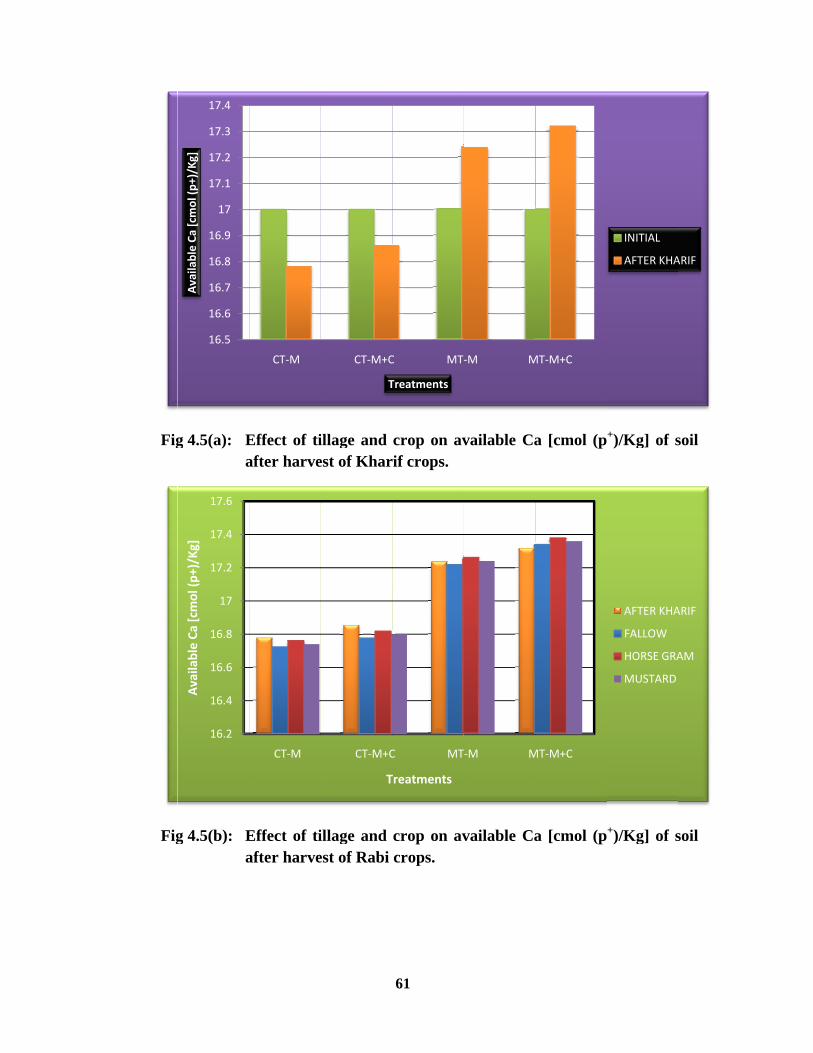
Fig
Fig
g 4.5(a): Ea
g 4.5(b): Ea
16.5
16.6
16.7
16.8
16.9
17
17.1
17.2
17.3
17.4
Available Ca
[cmol (p
+)/Kg]
16.2
16.4
16.6
16.8
17
17.2
17.4
17.6
Available Ca
[cmol (p
+)/Kg]
Effect of tiafter harve
Effect of tiafter harve
CT‐M
CT‐M
illage and est of Khar
illage and est of Rabi
CT‐M+C
T
CT‐M+C
T
61
crop on avrif crops.
crop on avcrops.
C MT‐
Treatments
C MT
Treatments
vailable Ca
vailable Ca
‐M M
T‐M M
a [cmol (p
a [cmol (p
MT‐M+C
MT‐M+C
+)/Kg] of s
+)/Kg] of s
INITIAL
AFTER KHA
AFTER KHA
FALLOW
HORSE GRA
MUSTARD
soil
soil
ARIF
ARIF
AM

62
After Rabi crops the available calcium varied from 16.74 [cmol(p+)
Ca/Kg] in CT-M to 17.38 [cmol(p+) Ca/Kg] in MT-M+C. The available
Calcium increased significantly in minimum tillage than conventional tillage.
Among the crops taken in Rabi, available calcium varied from 17.02 to 17.06
[cmol(p+) Ca/Kg]. Although the available calcium was maximum in horse gram
the value was statistically at par with mustard and fallow.
4.2.7 Available magnesium:
Soil magnesium originates from weathering of several magnesium
bearing minerals. Mg2+ ion content of soil is less than Ca2+ because they are not
adsorbed as strongly by clay and organic matter as Ca2+ ion and further Mg2+ ions
are more susceptible to leaching than Ca2+. Plant absorb magnesium as Mg2+ ion.
It is a constituent in chlorophyll, activates many enzymes, promotes uptake and
translocation of phosphorus and movement of sugar in the plants.
Table 4.11 Effect of tillage and crop on available Mg [cmol (p+)/Kg] of
soil (0-20cm) after harvest of Kharif and Rabi crops
Treatments Kharif Rabi Fallow Horsegram Mustard Mean
CT-M
5.80
5.74
5.78
5.76
5.76
CT-M+C
5.88
5.82
5.86
5.84
5.85
MT-M
6.14
6.12
6.18
6.16
6.15
MT-M+C
6.18
6.20
6.24
6.22
6.22
MEAN
6.0*
5.97
6.02
5.99
CD(0.05)
0.04
Tillage -0.83 crop – NS T×C -NS
*initial
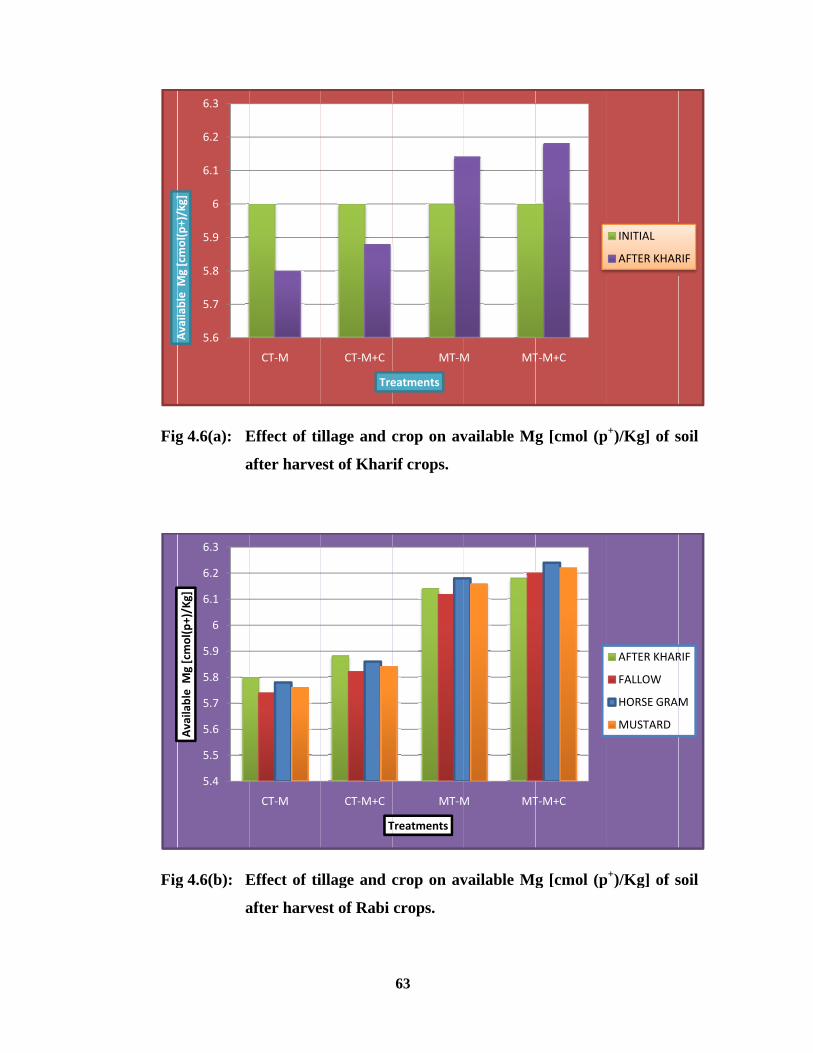
Fig
Fig
Ailbl
M[
l()/k]
g 4.6(a): E
a
g 4.6(b): E
a
5.6
5.7
5.8
5.9
6
6.1
6.2
6.3
Available M
g [cmol(p+)/kg]
5.4
5.5
5.6
5.7
5.8
5.9
6
6.1
6.2
6.3
Available M
g [cmol(p+)/Kg]
Effect of ti
after harve
Effect of ti
after harve
CT‐M
CT‐M
illage and c
est of Khar
illage and c
est of Rabi
CT‐M+C
Tre
CT‐M+C
T
63
crop on av
rif crops.
crop on av
crops.
MT‐M
eatments
MT‐M
Treatments
vailable M
vailable M
M MT
M MT
g [cmol (p
g [cmol (p
T‐M+C
T‐M+C
p+)/Kg] of s
p+)/Kg] of s
INITIAL
AFTER KHAR
AFTER KHAR
FALLOW
HORSE GRA
MUSTARD
soil
soil
RIF
RIF
M
64
Results pertaining to available Magnesium [cmol(p+) /Kg] content of
soil after Kharif and Rabi crops were recorded in Table 4.11 and depicted in Fig
4.6(a) and Fig 4.6(b). After Kharif crops the available magnesium varied from
5.80 to 6.18 [cmol(p+)Mg /Kg] . The maximum value was observed in MT-M+C
and minimum in CT-M. There was significant variation observed between the
treatments. Maize+ cowpea intercrop was accumulated more available magnesium
than sole maize crop (Table 9).
The data showed that after harvest of Rabi crops available magnesium
varied from 5.76 [cmol(p+)Mg /Kg] in CT-M to 6.22[cmol(p+)Mg /Kg] in MT-
M+C. The available magnesium content though increased in minimum tillage it
was statistically at par with conventional tillage. The value of available
magnesium varied from 5.97 to 6.02 [cmol(p+)Mg /Kg] among different crops
taken during Rabi crops.
Increased quantity of Ca2+ and Mg2+ in MT-M+C was found over other
treatments during Kharif season because more Ca2+ might have been solubilised
by acidic root exudates in an alkaline soil. The released Ca2+ and Mg2+ were
conserved more by minimum tillage than conventional tillage because of less
disturbance in the former tillage practice. Similar result was obtained by Sidiras
and Pavan (1985) in both Oxisols and Alfisols in Brazil under minimum tillage.
Secondly, less uptake of nutrient in minimum tillage. Maize +cowpea
intercropping saved more Ca2+ and Mg2+ over sole maize not only because of
more solubilisation but also addition of these nutrients through incorporation of
cowpea biomass. After Rabi season, horse gram plot contained more Ca2+ and
Mg2+ than mustard and fallow indicated that legume crop is more potential in
increasing the availability of these nutrients than the mustard crop.

65
4.3 NUTRIENT DYNAMICS THROUGH RESIN BAG:
Ion exchange resins are polymers with weak electrical charge either
positive or negative. They act similarly to soil colloids, exchanging ions on the
resin surface with ions in the surrounding medium. Ion exchange resin bags
integrate the supply of nutrients over a period of time and even stimulates the
effect of plant roots on removal and replacement of nutrients in solution.
Table 4.12 Nutrient dynamics (ppm/5g resin) through resin bag in different tillage treatments.
Treatments
N
P
K
Ca
Mg
CT-M
15.85
21.89
56.57
30.39
11.96
CT-M+C
20.00
23.31
57.27
30.98
12.12
MT-M
15.07
20.00
53.09
29.09
11.71
MT-M+C
15.64
21.12
54.93
29.19
11.46
Nutrient dynamics through resin bag was determined by prescribed
procedure and recorded in Table 4.12. The data revealed that the value of nitrogen
varied from a minimum of 15.07 ppm N/5g resin in MT-M to 20.00 ppm N/5g
resin in CT-M+C. The phosphorus content varied from 20.00 ppm to 23.31 ppm
P/5g of resin, potassium varied from 53.09 ppm to 57.27 ppm K/ 5g of resin and
calcium, magnesium value varied from 29.09 ppm to 30.98 ppm Ca/5g of resin
and 11.71 ppm to 12.12 ppm Mg respectively. The maximum value was observed
in CT-M+C and minimum in MT-M.
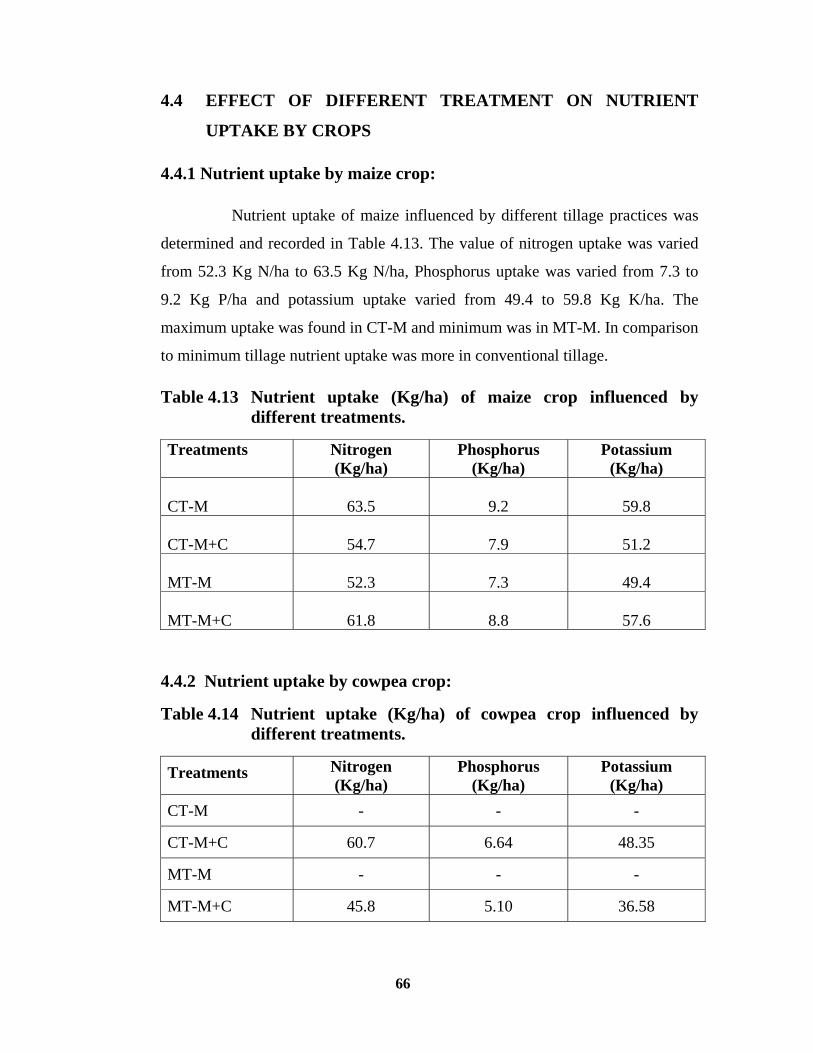
66
4.4 EFFECT OF DIFFERENT TREATMENT ON NUTRIENT
UPTAKE BY CROPS
4.4.1 Nutrient uptake by maize crop:
Nutrient uptake of maize influenced by different tillage practices was
determined and recorded in Table 4.13. The value of nitrogen uptake was varied
from 52.3 Kg N/ha to 63.5 Kg N/ha, Phosphorus uptake was varied from 7.3 to
9.2 Kg P/ha and potassium uptake varied from 49.4 to 59.8 Kg K/ha. The
maximum uptake was found in CT-M and minimum was in MT-M. In comparison
to minimum tillage nutrient uptake was more in conventional tillage.
Table 4.13 Nutrient uptake (Kg/ha) of maize crop influenced by different treatments.
Treatments Nitrogen (Kg/ha)
Phosphorus (Kg/ha)
Potassium (Kg/ha)
CT-M
63.5
9.2
59.8
CT-M+C
54.7
7.9
51.2
MT-M
52.3
7.3
49.4
MT-M+C
61.8
8.8
57.6
4.4.2 Nutrient uptake by cowpea crop:
Table 4.14 Nutrient uptake (Kg/ha) of cowpea crop influenced by different treatments.
Treatments Nitrogen (Kg/ha)
Phosphorus (Kg/ha)
Potassium (Kg/ha)
CT-M - - -
CT-M+C 60.7 6.64 48.35
MT-M - - -
MT-M+C 45.8 5.10 36.58

67
The nutrient uptake by cowpea crop influenced by tillage practices was
presented in Table 4.14. The nitrogen uptake was maximum 60.7 Kg N/ha in
CT-M+C and minimum 45.8 Kg N/ha in MT-M+C. The phosphorus uptake was
more in CT-M+C i.e 6.64 Kg P/ha and less in MT-M+C i.e 5.1 Kg P/ha. The
potassium uptake was 48.35 Kg K/ha in CT-M+C and 36.58 Kg K/ha in MT-
M+C.
4.4.3 Nutrient uptake by horse gram:
Table 4.15 Nutrient uptake (Kg/ha) of horse gram crop influenced by
different treatments.
Treatments Nitrogen (Kg/ha)
Phosphorus (Kg/ha)
Potassium (Kg/ha)
CT-M 26.5 1.58 8.36
CT-M+C 42.6 2.63 13.92
MT-M 25.8 1.52 8.10
MT-M+C 29.2 1.88 10.53
Nutrient uptake of horse gram influenced by different tillage practices
was determined and recorded in Table 4.15. The value of nitrogen uptake was
varied from 25.8 Kg N/ha to 42.6 Kg N/ha, Phosphorus uptake was varied from
1.52 to 2.63 Kg P/ha and potassium uptake varied from 8.10 to 13.92 Kg K/ha.
The maximum uptake was found in CT-M+C and minimum was in MT-M. In
comparison to minimum tillage nutrient uptake was more in conventional tillage.

68
4.4.4 Nutrient uptake by mustard:
Table 4.16 Nutrient uptake (Kg/ha) of mustard crop influenced by different treatments.
Treatments Nitrogen (Kg/ha)
Phosphorus (Kg/ha)
Potassium (Kg/ha)
CT-M 10.82 1.35 19.43
CT-M+C 13.45 1.66 23.25
MT-M 9.32 1.15 16.56
MT-M+C 12.95 1.58 22.84
Nutrient uptake of mustard influenced by different tillage practices was
determined and recorded in Table 4.16. The value of nitrogen uptake was varied
from 9.32 Kg N/ha to 13.45 Kg N/ha, Phosphorus uptake was varied from 1.15 to
1.66 Kg P/ha and potassium uptake varied from 16.56 to 23.25 Kg K/ha. The
maximum uptake was found in CT-M+C and minimum was in MT-M. In
comparison to minimum tillage nutrient uptake was more in conventional tillage.
Table 4.17 Total nutrient uptake (Kg/ha) by crops in the system
Treatment Nitrogen (Kg/ha)
Phosphorus (Kg/ha)
Potassium (Kg/ha)
CT-M-F 63.50 9.20 59.8 CT-M-H 90.00 10.78 68.16 CT-M-M 74.32 10.55 79.23 CT-M+C-F 115.40 14.54 99.55 CT-M+C-H 158.00 17.17 113.47 CT-M+C-M 128.85 16.20 122.8 MT-M-F 52.30 7.30 49.4 MT-M-H 78.10 8.82 57.5 MT-M-M 61.62 8.45 65.96 MT-M+C-F 197.60 13.90 94.18 MT-M+C-H 136.80 15.78 104.71 MT-M+C-M 120.55 15.48 117.02

4.5
4.5
Ta
Fi
we
ma
dec
mi
5 EFFECT
5.1 Yield o
able 4.18
ig 4.7(a): Y
Yie
ere recorded
aximum 52
creasing or
nimum 12.4
0
10
20
30
40
50
60
Yields (q
ha‐1)
Treatme
CT-M
CT-M+C
MT-M
MT-M+C
T OF DIFF
of maize a
Yield (qh
tillage.
Yield (qha-1
eld of maiz
d in Table 4
2.1 qha-1 in
der. The yi
4 qha-1 in M
CT‐M
ents
C
C
FERENT
nd cowpea
ha-1) of ma
1) of maize
ze and cow
4.18 and de
CT-M foll
ield of cowp
MT-M+C.
CT‐M+C
Tra
69
TREATM
a:
aize and c
and cowpe
wpea influe
epicted in F
lowed by M
pea was ma
MT‐M
atments
Maize y(qha-
52.1
44.4
43.0
50.2
MENTS O
cowpea in
ea influenc
enced by d
Fig 4.7(a).
MT-M+C, C
aximum 16
MT‐M
yield 1 )
1
4
0
2
N CROP Y
nfluenced
ed by diffe
different till
The yield
CT-M+C an
6.4 qha-1 in
M+C
Cowpea (qh
-
16
-
12
YIELD
by differe
erent tillage
lage practic
of maize w
nd MT-M in
CT-M+C a
MAIZE YIELD
COWPEA YIEL
pod yielda-1 )
-
6.4
-
2.4
ent
e.
ces
was
n a
and
LD
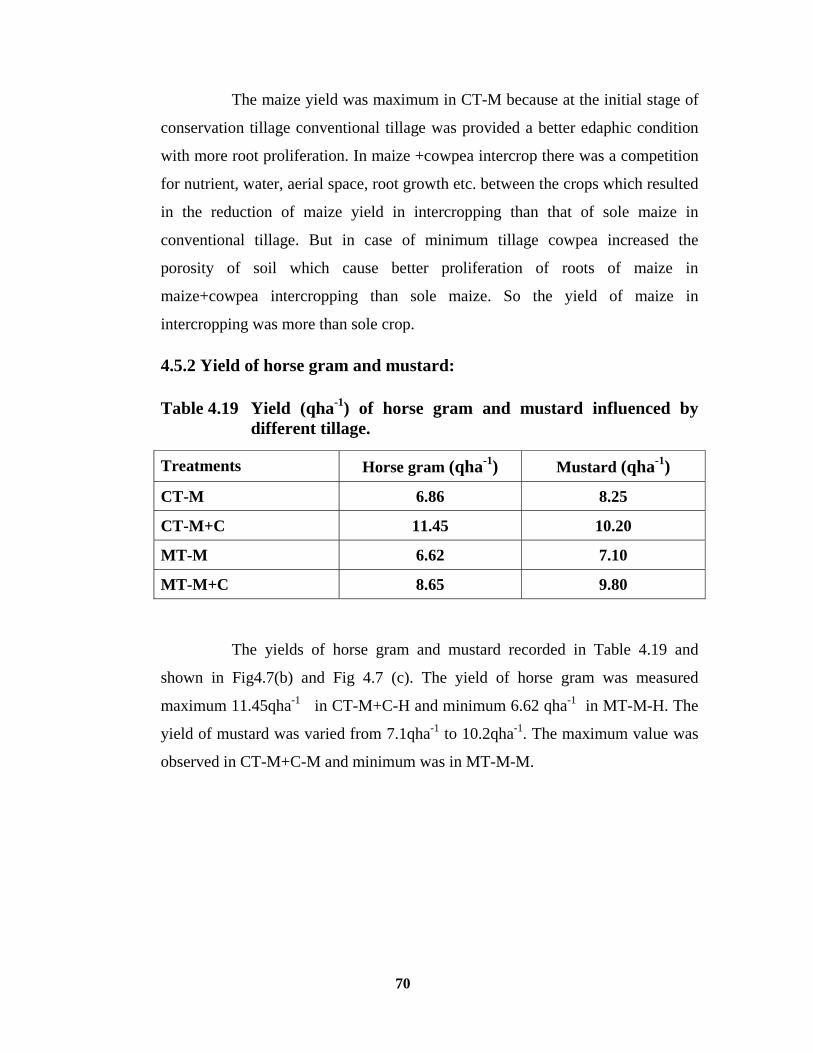
70
The maize yield was maximum in CT-M because at the initial stage of
conservation tillage conventional tillage was provided a better edaphic condition
with more root proliferation. In maize +cowpea intercrop there was a competition
for nutrient, water, aerial space, root growth etc. between the crops which resulted
in the reduction of maize yield in intercropping than that of sole maize in
conventional tillage. But in case of minimum tillage cowpea increased the
porosity of soil which cause better proliferation of roots of maize in
maize+cowpea intercropping than sole maize. So the yield of maize in
intercropping was more than sole crop.
4.5.2 Yield of horse gram and mustard:
Table 4.19 Yield (qha-1) of horse gram and mustard influenced by different tillage.
Treatments Horse gram (qha-1) Mustard (qha-1)
CT-M 6.86 8.25
CT-M+C 11.45 10.20
MT-M 6.62 7.10
MT-M+C 8.65 9.80
The yields of horse gram and mustard recorded in Table 4.19 and
shown in Fig4.7(b) and Fig 4.7 (c). The yield of horse gram was measured
maximum 11.45qha-1 in CT-M+C-H and minimum 6.62 qha-1 in MT-M-H. The
yield of mustard was varied from 7.1qha-1 to 10.2qha-1. The maximum value was
observed in CT-M+C-M and minimum was in MT-M-M.

Fi
Fig
ig 4.7(b): Y
g 4.7(c): Yi
0
2
4
6
8
10
12
14
Yield (qha
‐1)
0
2
4
6
8
10
12
yield (qha
‐1)
Yield (qha-1
ield (qha-1)
CT‐M
CT‐M
1) of horse
) of mustar
CT
C
71
gram influ
rd influence
T‐M+C
Treatm
CT‐M+C
Treatm
uenced by d
ed by diffe
MT‐M
ments
MT‐M
ments
different til
erent tillage
M
llage.
e.
MT‐M+C
MT‐M+C
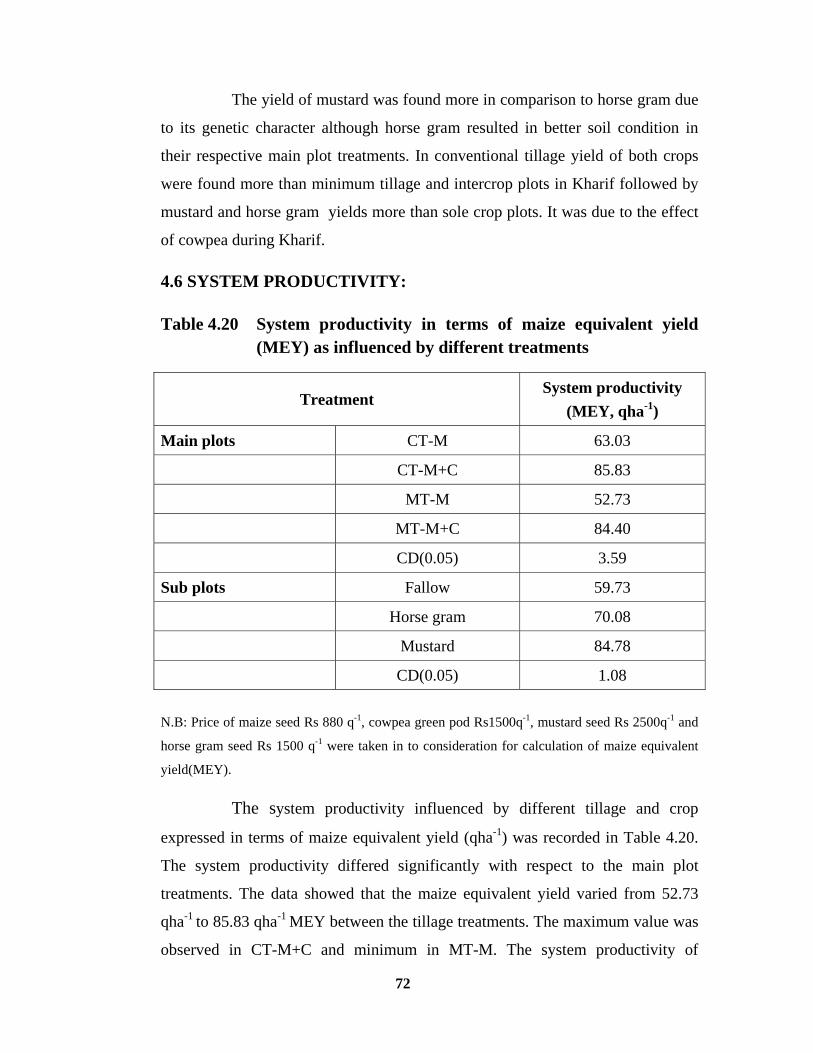
72
The yield of mustard was found more in comparison to horse gram due
to its genetic character although horse gram resulted in better soil condition in
their respective main plot treatments. In conventional tillage yield of both crops
were found more than minimum tillage and intercrop plots in Kharif followed by
mustard and horse gram yields more than sole crop plots. It was due to the effect
of cowpea during Kharif.
4.6 SYSTEM PRODUCTIVITY:
Table 4.20 System productivity in terms of maize equivalent yield (MEY) as influenced by different treatments
Treatment System productivity
(MEY, qha-1)
Main plots CT-M 63.03
CT-M+C 85.83
MT-M 52.73
MT-M+C 84.40
CD(0.05) 3.59
Sub plots Fallow 59.73
Horse gram 70.08
Mustard 84.78
CD(0.05) 1.08
N.B: Price of maize seed Rs 880 q-1, cowpea green pod Rs1500q-1, mustard seed Rs 2500q-1 and
horse gram seed Rs 1500 q-1 were taken in to consideration for calculation of maize equivalent
yield(MEY).
The system productivity influenced by different tillage and crop
expressed in terms of maize equivalent yield (qha-1) was recorded in Table 4.20.
The system productivity differed significantly with respect to the main plot
treatments. The data showed that the maize equivalent yield varied from 52.73
qha-1 to 85.83 qha-1 MEY between the tillage treatments. The maximum value was
observed in CT-M+C and minimum in MT-M. The system productivity of

73
growing maize+cowpea under conventional tillage closely followed by growing
maize+cowpea under minimum tillage (84.40 qha-1 MEY) and they remain at par
with each other. But these two treatments were significantly superior than
growing sole maize under conventional tillage (63.03 qha-1 MEY) and minimum
tillage (52.73 qha-1 MEY).
Table 4.21 Interaction effect of Kharif season treatments (main plot ) and Rabi treatments (sub plot) on system productivity (MEY) as Influenced by different tillage and crops
Main plot (Kharif season
treatments)
Sub plot (Rabi season treatments)
Fallow Mustard Horse gram
CT-M 52.10 75.54 61.45
CT-M+C 73.35 101.33 83.80
MT-M 43.00 63.17 52.03
MT-M+C 71.04 99.08 83.04
CD(0.05) T×C 2.16
The interaction effect of main plot and sub plot treatments were found
significant and presented in Table 4.21 and depicted in Fig 4.8. The Kharif season
treatment CT-M+C followed by growing of mustard during the Rabi recorded the
highest system productivity of 101.33qha-1 MEY. This was significantly superior
to all other treatments except the Kharif season treatment MT-M+C followed by
the Rabi season treatment growing of mustard (99.08 qha-1 MEY), which was
comparable to the former treatment. However, minimum tillage-maize followed
by fallow recorded the least system productivity (43.00 qha-1 MEY).
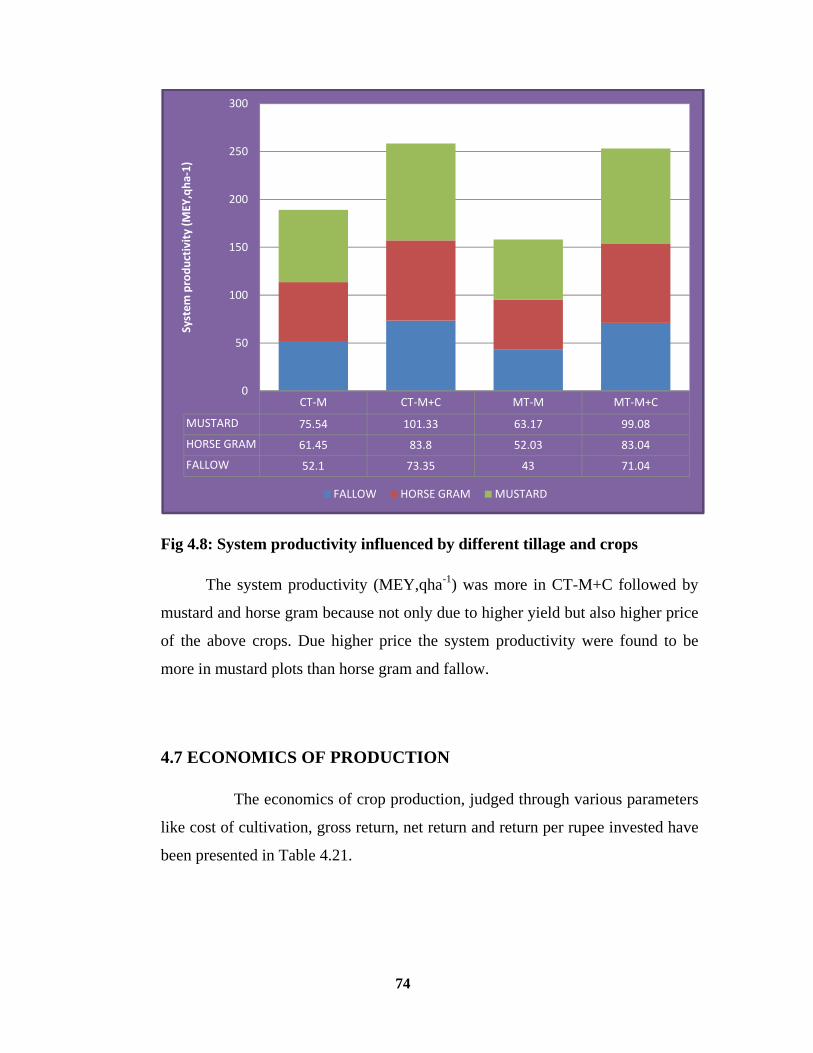
74
Fig 4.8: System productivity influenced by different tillage and crops
The system productivity (MEY,qha-1) was more in CT-M+C followed by
mustard and horse gram because not only due to higher yield but also higher price
of the above crops. Due higher price the system productivity were found to be
more in mustard plots than horse gram and fallow.
4.7 ECONOMICS OF PRODUCTION
The economics of crop production, judged through various parameters
like cost of cultivation, gross return, net return and return per rupee invested have
been presented in Table 4.21.
CT‐M CT‐M+C MT‐M MT‐M+C
MUSTARD 75.54 101.33 63.17 99.08
HORSE GRAM 61.45 83.8 52.03 83.04
FALLOW 52.1 73.35 43 71.04
0
50
100
150
200
250
300
System
produ
ctivity (M
EY,qha
‐1)
FALLOW HORSE GRAM MUSTARD
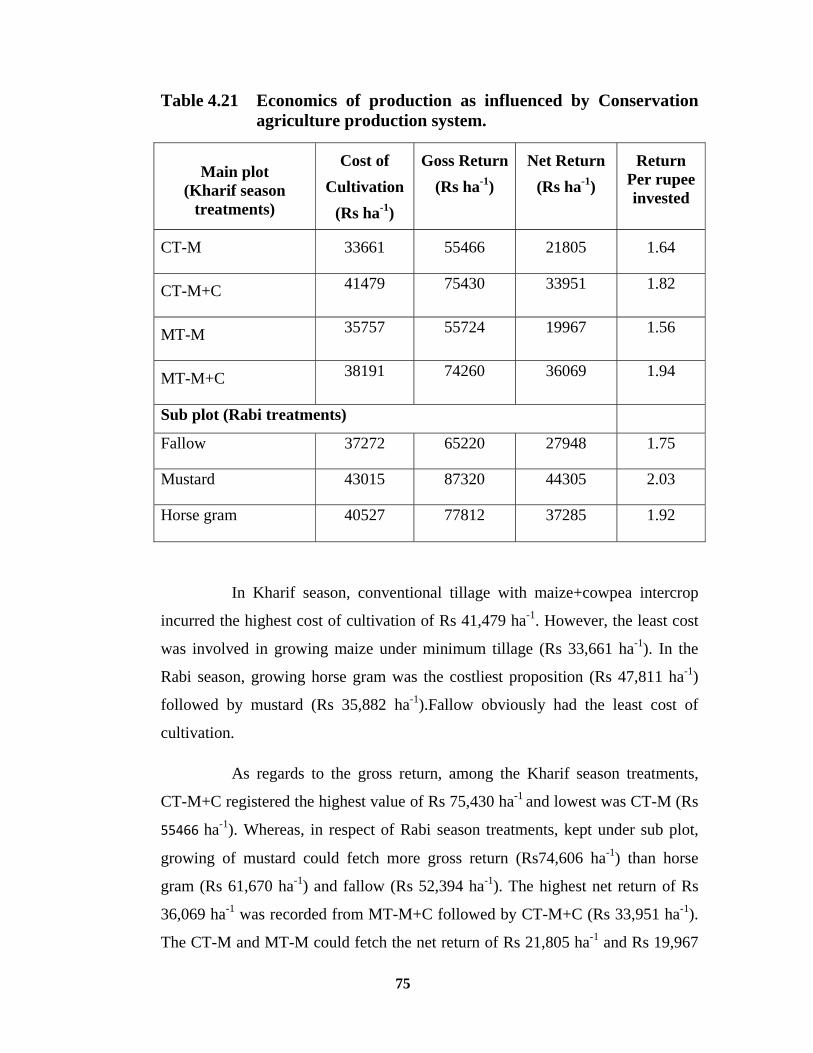
75
Table 4.21 Economics of production as influenced by Conservation agriculture production system.
Main plot
(Kharif season treatments)
Cost of Cultivation
(Rs ha-1)
Goss Return(Rs ha-1)
Net Return (Rs ha-1)
Return Per rupee invested
CT-M 33661 55466 21805 1.64
CT-M+C 41479 75430 33951 1.82
MT-M 35757 55724 19967 1.56
MT-M+C 38191 74260 36069 1.94
Sub plot (Rabi treatments)
Fallow 37272 65220 27948 1.75
Mustard 43015 87320 44305 2.03
Horse gram 40527 77812 37285 1.92
In Kharif season, conventional tillage with maize+cowpea intercrop
incurred the highest cost of cultivation of Rs 41,479 ha-1. However, the least cost
was involved in growing maize under minimum tillage (Rs 33,661 ha-1). In the
Rabi season, growing horse gram was the costliest proposition (Rs 47,811 ha-1)
followed by mustard (Rs 35,882 ha-1).Fallow obviously had the least cost of
cultivation.
As regards to the gross return, among the Kharif season treatments,
CT-M+C registered the highest value of Rs 75,430 ha-1 and lowest was CT-M (Rs
55466 ha-1). Whereas, in respect of Rabi season treatments, kept under sub plot,
growing of mustard could fetch more gross return (Rs74,606 ha-1) than horse
gram (Rs 61,670 ha-1) and fallow (Rs 52,394 ha-1). The highest net return of Rs
36,069 ha-1 was recorded from MT-M+C followed by CT-M+C (Rs 33,951 ha-1).
The CT-M and MT-M could fetch the net return of Rs 21,805 ha-1 and Rs 19,967

76
ha-1, respectively. Among the Rabi season crops, mustard could bring in a net
return of Rs 44,305 ha-1 as compared to Rs 37, 285 ha-1 under horse gram and Rs
27,948 ha-1 under fallow.
The return per rupee invested was the highest (1.94) for MT-M+C
imposed during Kharif season, closely followed by CT-M+C (1.82). The other
two treatments following these two were CT-M (1.64) and MT-M (1.56). In Rabi
season sub plot treatments it was highest (2.03) when mustard was grown,
followed by horse gram (1.92) and fallow (1.75).

77
SUMMARY AND CONCLUSION
Conventional agriculture production practices based on excessive soil
tillage causes degradation of soil physical make up, soil fertility status and
increase soil erosion. To counter these challenges the concept of resource saving
agricultural production system popularly known as conservation agriculture
arises.
In order to investigate the effect of conservation agricultural
production system on soil physical, chemical properties, nutrient uptake and
yield of crops in a maize based cropping system an experiment was conducted at
Regional Research And Technology Transfer Station (RRTTS),Kendujhar on an
alkaline soil. The experiment was conducted during Kharif and subsequent Rabi
2011-12. The experiment was laid out in randomized block design in Kharif
having 4 treatments namely CT-M, CT-M+C, MT-M, MT-M+C and during
Rabi season each plot was divided into 3 subplots cultivated with horse gram,
mustard and fallow under split plot design.
The soil samples from the treatment plot after harvest of Kharif and
Rabi crops were collected and used for this study. Soil were analysed for
physical and chemical properties like bulk density, texture, pH, soil organic
carbon , available nitrogen, available phosphorus, available potassium, available
calcium and available magnesium. Nutrient dynamics was measured through
resin bag technique. The plant samples were analysed for nutrient uptake. Yield
was recorded for both Kharif 2011 and Rabi 2011-12. The data were statistically
analysed following the procedure as prescribed by Gomez and Gomez (1984).
The salient findings of the study are summarized below:
Effect of tillage practices and different crops on various soil physical
and chemical properties showed that conventional and minimum tillage practices
adopted in this experiment did not have any significant influence on bulk density
of soil, fine earth fraction and pH. But organic carbon, available nitrogen,
78
available phosphorus, available potassium, available calcium and available
magnesium were significantly influenced.
Tillage practice with different crops did not have any significant
influence on soil bulk density which varied from 1.347 Mgm-3 in CT-M to 1.340
Mgm-3 in MT-M+C after Kharif season. After Rabi crops bulk density varied
between 1.348 Mgm-3 to 1.338 Mgm-3. After both Kharif and Rabi minimum
tillage reduced the bulk density due to addition of organic matter. Bulk density
was decreased in horse gram and no change was found in mustard and fallow.
This was due to horse gram being a leguminous crop it covers the soil and not
only adds nitrogen but also improves porosity.
Soil pH changed by different treatments varied from 7.32 to 7.36 unit
after Kharif. The maximum was in MT-M+C and minimum in CT-M. After
Rabi, soil pH varied from 7.31 in CT-M to 7.37 in MT-M+C treatment. The
increase in pH in minimum tillage than conventional tillage was due to
accumulation of more basic cations Ca2+, Mg2+ in former tillage practice. Among
different crops taken in Rabi season horse gram was found to increase the soil
pH by 0.01 unit over mustard and fallow.
Tillage and crops influencing soil organic carbon content was varied
from a minimum value of 6.45 g/Kg in CT-M to a maximum value of 6.81 g/Kg
in MT-M+C after Kharif crops. After Rabi the value varied from 6.44 g/Kg in
CT-M to 6.84 g/Kg in MT-M+C. The content of organic carbon in MT-M+C
was significantly higher than other because of incorporation of more organic
matter through cowpea. Minimum tillage also prevented the loss of organic
carbon as exposed surface area was less than conventional tillage. After Rabi,
horse gram plot had higher organic carbon than mustard and cowpea because of
its dwarf nature which covers the soil better.
Results on available nitrogen (Kg/ha) content in conventional and
minimum tillage showed a significant variation. The value varied from 256.7 Kg
N/ha to 262.6 Kg N /ha in CT-M and MT-M+C respectively after Kharif. Maize

79
+cowpea intercrop had accumulated more available nitrogen than sole maize
crop. After Rabi the available nitrogen content varied from a minimum value of
256.5 Kg N/ha in CT-M to a maximum value of 263.1 Kg N/ha in MT-M+C.
Among crops horse gram showed a higher value of available nitrogen 260.2 Kg
N/ha than mustard and fallow. The increase of available nitrogen in MT-M+C
due to incorporation of cowpea biomass and preventing volatilization loss of
nitrogen by less exposure of soil in minimum tillage. In M+C intercropping
cowpea fixed nitrogen and its incorporation enriched the soil by more nitrogen.
After Rabi horse gram cause extra gain of nitrogen by biological nitrogen
fixation showed a higher value of available nitrogen content.
Available phosphorus influenced by tillage and crop showed a
significant variation between conventional and minimum tillage. The value of
available phosphorus varied from 15.41 Kg P/ha to 15.49 Kg P/ha after Kharif.
The maximum value was observed in MT-M+C and minimum in CT-M. Maize
+cowpea intercrop had more available phosphorus than sole maize crop. After
Rabi the value varied from a minimum of 15.37 Kg P/ha in CT-M to a maximum
of 15.53 Kg P/ha in MT-M+C. Among different crops in Rabi horse gram
showed a higher value of available phosphorus than mustard and fallow. The
available phosphorus was more in MT-M+C because of incorporation of cowpea
biomass and uptake was less. In maize +cowpea intercrop and horse gram plot
more soil bound phosphorus released to available form by acid secreted from
root activity of cowpea and horse gram being legume crop.
The available potassium content of soil influenced significantly by
tillage and crop. After Kharif the value of available potassium varied from 325.7
Kg K/ha to 331.6 Kg K/ha in CT-M and MT-M+C respectively. The available
potassium content varied from a minimum of 325.1 Kg K/ha in CT-M to 332.1
Kg K/ha in MT-M+C after Rabi. Among crops horse gram plot showed a
significantly higher value of available potassium than mustard and fallow.
Minimum tillage increased the available potassium content than conventional

80
tillage might be because of minimization of loss and more conservation due to
incorporation of crop residues.
Available Ca2+ and Mg2+ significantly influenced by different
treatments. The values were varied from 16.74 to 17.38 cmol(p+) Ca/Kg and
5.80 to 6.18 cmol(p+) Mg/Kg in CT-M and MT-M+C respectively. Increased
Ca2+ and Mg2+ in MT-M+C might have been due to solubilisation of these
elements by acidic root exudates in an alkaline soil. Minimum tillage may
conserve more Ca2+ and Mg2+ than conventional tillage. Among different crops
taken in Rabi crops horse gram showed a higher value of Ca2+ and Mg2+ than
mustard and fallow.
Results on nutrient dynamics through resin bag showed that
maximum nutrient captured by resin bag in treatment CT-M+C i.e 20.00 ppm N,
23.31 ppm P, 57.27 ppm K, 30.98 ppm Ca, 12.12 ppm Mg and minimum in MT-
M i.e 15.07 ppm N, 20.00 ppm P, 53.09 ppm K, 29.09 ppm Ca, 11.71 ppm Mg.
Nutrient uptake by maize crop showed that nitrogen uptake varied
from 52.3 to 63.5 Kg/ha, phosphorus varied from 7.3 to 9.2 Kg/ha, potassium
varied from 49.4 to 59.8 Kg/ha in MT-M and CT-M respectively. The nutrient
uptake by cowpea was more in CT-M+C than MT-M+C.
In mustard the nitrogen uptake was varied from 9.32 to 13.45 Kg/ha,
phosphorus varied from 1.15 to 1.66 Kg/ha, potassium varied from 16.56 to
23.25 Kg/ha in MT-M-M and CT-M-M respectively. In horse gram the
maximum nutrient uptake of 42.6 Kg N/ha, 2.63 Kg P/ha, 13.92 Kg K/ha were
observed in CT-M+C-H and minimum of 25.8 Kg N/ha, 1.52 Kg P/ha, 8.10 Kg
K/ha, were seen in MT-M-H.
The yield of maize was varied from a maximum 52.1 qha-1 in CT-M
to a minimum 43.0 qha-1 in MT-M. The yield of cowpea was more in CT-M+C
i.e 16.4 qha-1 and less in MT-M+C i.e 12.4 qha-1 . The maximum yield of horse
gram was in CT-M+C-H and minimum in MT-M-H. The yield of mustard was
varied from 7.1qha-1 to 10.2qha-1. The maximum was observed in CT-M+C-M
81
and minimum in MT-M-M. The yields were more in conventional tillage than
minimum tillage because of more root proliferation in case of former than latter.
The system productivity was varied from 52.73 qha-1 to 85.83 qha-1
between the main plot treatments. The maximum value was observed in CT-
M+C and minimum was in MT-M. In Rabi season CT-M+C-M was maximum
system productivity than others because of higher yield and price. The benefit
over the cost incurred for different treatments after Kharif was found to be 1.94,
1.82, 1.64, 1.56 in MT-M+C, CT-M+C, CT-M, MT-M respectively. The benefit
cost ratio (B:C) of the system at the end was found to be 2.03, 1.92 and 1.75 in
case of mustard, horsegram and fallow respectively. Minimum tillage maize +
cowpea and mustard in Rabi season were found to be most beneficial from
economic point of view.
CONCLUSION
From the study “Impacts of Maize based conservation agriculture
production system on soil properties in North Central Plateau Zone of Odisha”
conducted at RRTTS, Kendujhar salient findings in the form of conclusion can
be made as follows.
1. Although different tillage practice and crops had not shown any
significant changes in soil BD, fine earth fraction and pH but the BD was
reduce by minimum tillage than conventional tillage which was ascribed
due to less compaction and less exposure of soil, addition of more organic
matter and better conservation of soil.
2. The above factors also helped in increasing the relative clay fraction and
pH of the soil.
3. The availability of nitrogen, phosphorus, potassium ,calcium, magnesium
significantly increased by MT-M+C intercropping in Kharif followed by
horse gram in Rabi due to better conservation by minimum tillage, more
82
nitrogen fixation and recycling by legume and cover crops taken in
sequence.
4. pH of soil increased by 0.03 unit in MT-M+C which was reduced by 0.01
unit in CT-M than initial pH after one season. The range was further
wider after Rabi season. Similar trend was observed for organic carbon of
the soil.
5. The increase in pH and organic carbon was due to more conservation of
basic cations like Ca2+, Mg2+ and organic matter in minimum tillage than
conventional tillage. Also maize +cowpea intercrop followed by horse
gram solubilises more basic cations present in soil.
6. Conservation effect by minimum tillage on nutrient solubilisation and
recycling maize +cowpea intercropping followed by horse gram crops
helped in enhancing the availability of N, P, K, Ca, Mg.
7. The nutrient dynamics by resin bag study showed that CT-M+C captured
maximum nutrient like N, P, K, Ca, Mg than MT-M.
8. Maximum nutrient uptake was observed in CT-M+C in Kharif followed
by mustard in Rabi than the others because more yield in former
treatment.
9. The system productivity at the end of the sequence was highest in CT-
M+C-M than the other sequence.
10. During Rabi season farmers are advised to cultivate mustard and horse
gram in a sloping terrain of North central plateau zone of Odisha.
11. Minimum tillage is better over conventional tillage from soil health point
of view which improved the soil characteristics.
12. Maize +cowpea intercropping is better than sole maize because of better
residual effect on subsequent season.
i
BIBLIOGRAPHY
Adiku, S.G., Rose, C.W., Gabric, A., Braddock, P..D., Corberry, P.S. and
Mecown, R.L. 1998. An evaluation of the performance of maize and
cowpea in sole and intercropping systems at two savannah zones of
Ghana ; a simulation study. Proc. Int. Symp. on applications, modelling
as an innovative technology in the agri-food Chaim Model - It,
Wageningen, The Netherlands, 29 Nov,-2 Dec. 1998. L.M.M Tijskens
and M.L.A.T.M. Hertog, (eds.) Accra, Ghana.
Alim, A. 1996, Studies on cereal-legume intercropping for higher forage yield
and quality. Unpublished M.Sc. (Ag.) Thesis, Orissa University of
Agriculture and Technology, Bhubaneswar.
Alvear, M., Rosas, A., Rouanet, J. L. & Borie, F. 2005 Effects of three soil
tillage systems on some biological activities in an Ultisol from southern
Chile. Soil Tillage Res. 82: 195–202.
Astier, M., Maass, J.M., Etchevers-Barra, J.D., Pena, J.J., and Gonzalez, F.D.
2006. Short-term green manure and tillage management effects on maize
yield and soil quality in an Andisol. Soil Till. Res. 88:153-159.
Atreya, K., Sharma, S., Bajracharya, R.M., and Rajbhandari, N.P. 2006.
Applications of reduced tillage in hills of central Nepal. Soil Till. Res.
88:16-29.
Baker,C.J.,K.E.Saxton and W.R. Ritchie.2002. No-tillage seeding: science and
Practice. 2nd
Edition. Oxford, UK: CAB International.
Balota, E. L., Filho, A. C., Andrade, D. S. & Dick, R. P. 2004 Long-term tillage
and crop rotation effects on microbial biomasa and C and N
mineralization in a Brazilian Oxisol. Soil Tillage Res. 77: 137–145.
Bayer, C., Mielniczuk, J., Amado, T. J. C., Martin-Neto, L. & Fernandes, S.
V.2000 Organic matter storage in a sandy loam Acrisol affected by tillage
and cropping systems in southern Brazil. Soil Tillage Res. 54, 101–109.
ii
Bescansa, P., Imaz, M. J., Virto, I., Enrique, A., Hoogmoed, W. B., 2006. Soil
water retention as affected by tillage and residue management in semi-
arid Spain. Soil and Tillage, 87: 19-27
Binkley, D., and Matson, P. (1983). “Ion exchange resin bag method for
assessing forest soil nitrogen availability.” Soil Science Society of
America Journal 47: 1050 - 1052.
Bissett, M. J. & O’Leary, G. J. 1996 Effects of conservation tillage on water
infiltration in two soils in south-eastern Australia. Aust. J. Soil Res. 34:
299–308.
Black, C.A.(1965). Methods of soil analysis, American Society of Agronomy,
Inc.publishers (Madison, Wisconsin,USA)
Blanco-Canqui, H., Lal, R., Post, W.M., Izaurralde, R.C., and Owens, L.B. 2006.
Rapid changes in soil carbon and structural properties due to stover
removal from no-till corn plots. Soil Sci. 171:468-482.
Blanco-Canqui, H. and Lal, R. 2007. Impacts of long-term wheat straw
management on soil hydraulic properties under no-tillage. Soil Sci. Soc.
Am. J. 71:1166-1173.
Blevins, R.L., Smith, M.S., Thomas, G.W., 1984. Changes in soil properties
under no-tillage. In: Phillips, R.E., Phillips, S.H. (Eds.), No-tillage
Agriculture: Principles and Practices. Van Nostrand Reinhold, New York,
pp. 190–230. Bowman, R.A., Reeder, J.D., Lober, R.W., 1990.
Bollinger, (2006). Taking stock of the Brazilian ‘zero till revolution’ a review of
landmark research and farmers practice. Adavances in Agronomy 91:47-
110
Borie, F., Rubio, R., Rouanet, J.L., Morales, A., Borie, G., and Rojas, C. 2006.
Effects of tillage systems on soil characteristics, glomalin and
mycorrhizal propagules in a Chilean Ultisol. Soil Till. Res. 88:253- 261.
iii
Bruce, R.R., Langdale, G.W., West, L.T., Miller, W.P., 1995. Surface soil
degradation and soil productivity restoration and maintenance. Soil Sci.
Soc. Am. J. 59: 654–660.
Campbell, C. A., McConkey, B. G., Zentner, R. P., Dyck, F. B., Selles, F. &
Curtin,D. 1995 Carbon sequestration in a Brown Chernozem as affected
by tillage and rotation. Can. J. Soil Sci. 75:449–458.
Campbell, C. A., McConkey, B. G., Zentner, R. P., Selles, F. & Curtin, D. 1996a
Long-term effects of tillage and crop rotations on soil organic C and N in
a clay soil in southwestern Saskatchewan. Can. J. Soil Sci. 76:395–401.
Cassel, D. K., Raczkowski, C. W. & Denton, H. P. 1995 Tillage effects on corn
production and soil physical conditions. Soil Sci. Soc. Am. J. 59: 1436–
1443.
Chatterjee, B.N, and Maiti, S. 1984. Cropping system : Theory and practices.
Oxford and IBH Pub. New Delhi, India.
Clapp, C.E., Allmaras, R.R., Layese, M.F., Linden, D.R., Dowdy, R.H., 2000.
Soil organic carbon abundance as related to tillage, crop residue, and
nitrogen fertilization under continuous corn management in Minnesota.
Soil Till. Res. 55: 127–142.
Dao, H., 1993. Tillage and winter wheat residue management effects on water
infiltration and storage. Soil Sci. Soc. Am. J. 57: 1586-1595.
Derpsch, R. and McGarry, D., 2003. The current status and future growth
potential of CA in the world context. Proc. on CD of ISTRO 16 Conf.
Soil Management for Sustainability, 13-19 July 2003, Brisbane, Australia
p 118-129.
Derpsch, R. Retrieved July 2006 from: http://www.rolf-derpsch.
D'Haene, K., Vermang, J., Cornelis, W.M., Leroy, B.L.M., Schiettecatte, W., De
Neve, S., Gabriels, D., and Hofman, G. 2008. Reduced tillage effects on
iv
physical properties of silt loam soils growing root crops. Soil Till. Res.
99:279-290.
Dick, W.A., 1983. Organic carbon, nitrogen, and phosphorus concentrations and
pH in soil profiles as affected by tillage intensity. Soil Sci. Soc. Am. J. 47;
102–107.
Diekow,J., J. Mielniczuk, H. Knicker, C. Bayer, D.P. Dick, and I. Kogel-
Knabner. 2005 Soil C and N stocks as affected by cropping systems and
nitrogen fertilization in a southern Brazil Acrisol managed under no-
tillage for 17 years. Soil and Tillage 81: 87-95.
Dolan, M.S., Clapp, C.E., Allmaras, R.R., Baker, J.M., and Molina, J.A.E. 2006.
Soil organic carbon and nitrogen in a Minnesota soil as related to tillage,
residue and nitrogen management. Soil Till. Res. 89:221-231.
Doran, J.W., Smith, M.S., 1987. Organic matter management and utilization of
soil and fertilizer nutrients. In: Follett, R.F., Stewart, J.W.B., Cole, C.V.
(Eds.), Soil Fertility and Organic Matter as Critical Components of
Production Systems. Soil Science Society of America Special Publication
No. 19. American Society of Agronomy, Madison, WI, pp. 53–72.
Doran, J.W., Elliott, E.T., Paustain, K., 1998. Soil microbial activity, nitrogen
cycling, and long-term changes in organic carbon pools as related to
fallow tillage management. Soil Till. Res. 49: 3–18.
Duiker, S.W. and Beegle, D.B. 2006. Soil fertility distributions in long-term no-
till, chisel/disk and moldboard plow/disk systems. Soil Till. Res. 88:30-
41.
Du Preez, C.C., Steyn, J.T., and Kotze, E. 2001. Long-term effects of wheat
residue management on some fertility indicators of a semi-arid Plinthosol.
Soil Till. Res. 63:25-33.

v
Eaglesham, A.R.J., Ayanaba, A., Rao, V.R.and Esked, D.L. 1981. Improving the
nitrogen nutrition of maize by intercropping with cowpea. Soil Biol. &
Biochein. 13(2) : P.P. 169-171.
Ekeberg, E. and Riley, H.C.F. 1997. Tillage intensity effects on soil properties
and crop yields in a longterm trial on morainic loam soil in southeast
Norway. Soil Till. Res. 42:277-293.
Erenstein, O., 2002. Crop residue mulching in tropical and semi-tropical
countries: An evaluation of residue availability and other technological
implications. Soil and Tillage, 67: 115-133
FAO conservation agriculture website. 2006. http://www.fao.org/waicent/
faoinfo/agricult/ags/AGSE/agsee/general/OBJECT.htm
FAO, 2007. Conservation Agriculture in China and the Democratic people’s
Republic of Korea. FAO Crops and Grassland Service Working Paper.
FAO, 2007, 23p.
FAO, 2010. What is Conservation Agriculture. in: Conservation Agriculture
website of FAO, http://www.fao.org/ag/ca/1a.html Consulted in April
2010
Follett, R.F. and Peterson, G.A. 1988. Surface Soil Nutrient Distribution As
Affected by Wheat-Fallow Tillage Systems. Soil Sci. Soc. Am. J. 52:141-
147.
Franzluebbers, A.J., Hons, F.M., Zuberer, D.A., 1994a. Long-term changes in
soil carbon and nitrogen pools in wheat management systems. Soil Sci.
Soc. Am. J. 58: 1639–1645.
Franzluebbers, A.J. and Hons, F.M. 1996. Soil-profile distribution of primary
and secondary plantavailable nutrients under conventional and no tillage.
Soil Till. Res. 39:229-239.
Freitas, P. L. de., Blancaneaus, P., Gavinelli, E., Larré-Larroy, M. –C., and
Feller, C. (1999). Nature and level of organic stock in clayey oxisols
vi
under different land use and management systems. Pesq. agropec. bras.
vol.35, p.157-170.
Gal, A., Vyn, T.J., Micheli, E., Kladivko, E.J., and McFee, W.W. 2007. Soil
carbon and nitrogen accumulation with long-term no-till versus
moldboard plowing overestimated with tilled-zone sampling depths. Soil
Till. Res. 96:42-51.
Gangwar, K.S.and Sharma, S.K. 1994a Fodder-legume intercropping in maize
and its effect on succeeding wheat. Indian J. .Agric Sci. 64(1) : P.P. 38-
40.
Gantzer, C.J., Blake, G.R., 1978. Physical characteristics of Le Sueur clay loam
soil following no-tillage and conventional tillage. Agron. J. 70: 853-857.
Gomez, K.A and Gomez, A.A. (1984) In “Statistical procedures for agricultural
Research, 2nd Edition, John Wiley and Sons, New York, p.680
Govaerts, B., Sayre, K.D., Lichter, K., Dendooven, L., and Deckers, J. 2007c.
Influence of permanent raised bed planting and residue management on
physical and chemical soil quality in rain fed maize/wheat systems. Plant
Soil 291:39-54.
Graham, M.H., Haynes, R.J., and Meyer, J.H. 2002. Soil organic matter content
and quality: effects of fertilizer applications, burning and trash retention
on a long-term sugarcane experiment in South Africa. Soil Biol. Biochem.
34:93-102.
Grant, C.A., Lafond, G.P., 1993. The effects of tillage systems and crop
sequences on soil bulk density and penetration resistance on a clay soil in
southern Saskatchewan. Can. J. Soil Sci. 73:223-232.
Hatfield, J. L., Sauer, T. J., Prueger, J. H., 2001. Managing soils to achieve
greater water use efficiency: A review. Agron. J., 93: 271-280.
vii
Havlin, J.L., Kissel, D.E., Maddux, L.D., Claassen, M.M., Long, J.H., 1990.
Crop rotation and tillage effects on soil organic carbon and nitrogen. Soil
Sci. Soc. Am. J. 54: 448–452.
Hernanz, J.L., Lopez, R., Navarrete, L., and Sanchez-Giron, V. 2002. Long-term
effects of tillage systems and rotations on soil structural stability and
organic carbon stratification in semiarid central Spain. Soil Till. Res.
66:129-141.
Hobbs PR, Gupta RK (2004). Problems and challenges of no-till farming for
rice-wheat systems of the Indo-Gangetic Plains in South Asia. In:
Sustainable Agriculture and the rice-wheat system (eds Lal R, Hobbs PR,
Uphoff N, Hansen DO),pp 101-119. Columbus, Ohio and New York new
Jersey:Ohio State University and Marcel Dekker.
Holanda F.S.R., Mengel D.B., Paula M.B., Carvaho J.G., Bertoni J.C., 1998.
Influence of crops rotations and tillage systems on phosphorus and
potassium stratification and root distribution in the soil profile. Commun
Soil Sci Plant Anal 29: 2383-2394.
Hussain, I., Olson, K.R., and Siemens, J.C. 1998. Long-term tillage effects on
physical properties of eroded soil. Soil Sci. 163:970-981.
Ismail, I., Blevins, R.L., and Frye, W.W. 1994. Long-Term No-Tillage Effects
on Soil Properties and Continuous Corn Yields. Soil Sci. Soc. Am. J.
58:193-198.
Jackson, M.L. (1973). Soil chemical analysis. Prentice Hall of India, Pvt. Ltd.,
New Delhi.
Jena, P. K. and Saren, B. K. 1998. Drymatter accumulation, yield attributes and
yield of summer maize and groundnut intercropping systems as
influenced by irrigation. Indian. J. Agron. 43(1: P.P.18 - 22.
Jarecki, M.K. and Lal, R. 2003. Crop management for soil carbon sequestration.
Crit. Rev. Plant Sci.22:471-502.

viii
Jung, W.S., K.H.Kim, J.K. Ahn, S.J. Hahn, and I.M. Chung. 2004. Allelopathic
potential of rice (Oryza sativa L.) residues against Echinochloa Crus-
galli. Crop Protection 23:211-18
Karlen, D.L., Wollenhaupt, N.C., Erbach, D.C., Berry, E.C., Swan, J.B., Eash,
N.S., Jordahl, J.L., 1994. Long-term tillage effects on soil quality. Soil
Tillage Res. 32:313–327.
Karlen, D. L., Wollenhaupt, N. C., Erbach, D. C., Berry, E. C., Swan, J. B.,
Eash, N. S. & Jordahl, J. L. 1994 Crop residue effects on soil quality
following 10-years of no-till corn. Soil Tillage Res. 31: 149–167.
Kasture, M.N. and Mungikar, A.M. 1985 Performance of maize and cowpea in
an intercropping system. Agric Sci. Digest. 5(2) : P.P. 111-113.
Kay, B.D. and VandenBygaart, A.J. 2002. Conservation tillage and depth
stratification of porosity and soil organic matter. Soil Till. Res. 66:107-
118.
Kishna, A., Raikhelkar, S.V. and Reddy, A. S. 1998, Effect of planting pattern
and nitrogen on fodder maize, intercropped with cowpea. Indian. J .
Agron. 43(2) : P.P. 237- 240.
Koch, H.J., Stockfisch, N., 2006. Loss of soil organic matter upon ploughing
under a loess soil after several years of conservation tillage. Soil Tillage
Res. 86: 73–83.
Koshta, A. K, and Karanj Kar, S. V. 1986. Economics of intercropping system
under rainfed farming. Financing Agric. 18(22) : P.P. 33 - 36.
Landers, J. N. (2001). How and why the Brazilian zero tillage explosion
occurred.
Lal, R., Logan, T.J., and Fausey, N.R. 1990. Long-Term Tillage Effects on A
Mollic Ochraqualf in North- West Ohio .3. Soil Nutrient Profile. Soil Till.
Res. 15:371-382.
ix
Lal, R. 2005 Enhancing crop yields in the developing countries through
restoration of the soil organic carbon pool in agricultural lands. Land
Degrad. Dev 17: 197–209
Lamb, J.A., Peterson, G.A., Fenster, C.R., 1985. Wheat fallow tillage systems’
effect on a newly cultivated grassland soils’ N budget. Soil Sci. Soc. Am.
J. 49, 352–356.
Larney, F.J., Kladivko, E.J., 1989. Soil strength properties under four tillage
systems at three long-term study sites in Indiana. Soil Sci. Soc. Am. J. 53:
1539-1545.
Liang, A.Z., Zhang, X.P., Fang, H.J., Yang, X.M., Drury, C.F., 2007. Short-term
effects of tillage practices on organic carbon in clay loam soil of
Northeast China. Pedosphere 17:619–623.
Li,L.,Li, S.J., Zhang, H.L., Chen, F., 2006. Study on soil C pool management
index of conservation tillage. J. SoilWater Conserv. 20: 106–109 (in
Chinese).
Liu, L.J., 2004. Systematic experiments and effect analysis of all year
conservation tillage in two crops a year region. Ph.D. Dissertation, China
agricultural University, Beijing, China (in Chinese).
Lodhi, M.A.K., and K.A. Malik. 1987. Allelopathy in agroecosystems: wheat
phytotoxicity and its possible role in crop rotation. Journal of Chemical
Ecology 13:1881-91
Luo, Z.Z., Huang, G.B., Zhang, G.S., 2005. Effects of conservation tillage on
bulk density and water infiltration of surface soil in semi-arid area of west
Loess Plateau. Agric. Res. Arid Areas 23: 7–11 (in Chinese).
Madari, B., P.L.O.A. Machado, E. Torres, A.G. de Andrade, and L.I.O.
Valencia. 2005. No tillage and crop rotation effects on soil aggregation
and organic carbon in a Rhodic Ferralsol from southern Brazil. Soil and
Tillage 80: 185-200.
x
Matowo, P.R., Pierzynski, G.M., Whitney, D., and Lamond, R.E. 1999. Soil
chemical properties as influenced by tillage and nitrogen source,
placement, and rates after 10 years of continuous sorghum. Soil Till. Res.
50:11-19.
Motta A.C.V., Reeves D.W., Touchton J.T., 2002. Tillage intensity effects on
chemical indicators of soil quality in two coastal plain soils. Commun Soil
Sci Plant Anal 33, 913-932.
Niklaus, P. A., Kandeler, E., Leadley, P.W., Schmid, B., Tscherko, D., and
Korner, C. (2001). “A link between plant diversity, elevated CO2 and soil
nitrate.” Oecologia 127: 540-548.
Ofri, F. and Stern, W.R. 1987. Cereal-legume intercropping systems. Advances
in Agron. 41 : P.P. 41 - 90.
Ohno, T., Erich, S., 1997. Inhibitory effects of crop residue-derived organic
ligands on phosphate adsorption kinetics. J. Environ. Qual. 26: 889–895.
Olsen,S.R.,Cole,C.V.,Watanabe, F.S. and Dean, L.A. (1954) Estimation of
Available Phosphorus in soils by Extraction with Sodium Bicarbonate.
USDA Circular No.939. United States Department of Agriculture, USA.
Osunbitan, J.A., Oyedele, D. J., Adekalu, K.O., 2004. Tillage effects on bulky
density, hydraulic conductivity and strength of a loamy sand soil in south
western Nigeria. Soil and Tillage, 82: 57-64.
Pandey, R.K. and Singh F. 1985. System analysis of multiproportional blending
of cereals and legumes for duality fodder production. Annual Report .
Indian Grassland and Fodder Research Institure, Jhansi. P.P. 81.
Page,A.L.,Miller,R.H. and Keeny,D.R. (1982) Methods of soil analysis, Part-2.
Chemical and microbiological properties. 2nd Edition No.(9) Party-2 in
the series, Agronomy. American Society of Agronomy, Inc. Soil Science
Society of America. Inc. Medison Wisconsin, U.S.A.
xi
Pandey, A.K., Prakash, V., Singh, R.D. and Vlani, V.P. 1999. Effect of
intercropping patterns of maize and soybean on yield and economics
under mid-hills of NW Himalayas. Ann. Agric. Res. 20(3) : P.P. 354 -
359.
Piper, C.S (1950) Soil and plant analysis. University Adelaide, Austalia, PP.368.
Potter, K.N., Torbert, H.A., Jones, O.R., Matocha, J.E., Morrison Jr., J.E.,
Unger, P.W., 1998. Distribution and amount of soil organic C in long-
term management systems in Texas. Soil Till. Res. 47: 309–321.
Rao, M.R. and Willey. R.W. 1980. Evaluation of yield stability in inter cropping
studies on sorghum + pigeonpea. Expll. Agric. 16 : P.P. 105-106.
Reddy, M. N. and Chetty, C. R. K. 1984. Staple land equivalent ratio for
assessing yield advantage from intercropping. Expil. Agric. 20 : P.P. 171 -
177.
Reynolds M, Tuberosa R 2008 Translational research impacting on crop
productivity in droughtprone environments. Curr Opin Plant Biol
11:171–179
Riezebos, H., Th., Loerts, A. C. (1998). Influence of land use change and tillage
practice on soil organic matter in southern Brazil and eastern Paraguay.
Elsevier Soil & Tillage Research. 49 z pg 271-275. December 1998.
Riley, H.C.F., M.A. Bleken, S. Abrahamsen, A.K. Bergjord and A.K. Bakken.
2005 Effects of alternative tillage systems on soil quality and yield of
spring cereals on silty clay loam and sandy loam soils in cool, wet climate
of central Norway. Soil Tillage Research 80: 79-93.
Roldan, A., F. Caravaca, M.T. Hernandez, C. Garcia, C. Sanchez-Brito, M.
Velasquez, aM. Tiscareno. 2003. No-tillage, crop residue addition,
legume cover cropping effects on soil quality characteristics under maize
in Patzcuaro watershed (Mexico). Soil and Tillage 72: 65-73.
xii
Roldan, A., Salinas-Garcia, J.R., Alguacil, M.M., Diaz, E., Caravaca, F., 2005.
Soil enzyme activities suggest advantages of conservation tillage
practices in sorghum cultivation under subtropical conditions. Geoderma
129: 178–185.
Roy Sharma, R.P., Sharma, H.M. and Thakur, H.C. 1981. Studies on
intercropping in long duration pegeonpea, on sandy loam soil of North
Bihar. Indian J. Agron. 26 : P.P. 77 - 82.
Sidiras, N. and Pavan, M.A. 1985. Influencia do sistema de manejo do solo no
seu nivel de fertilidade. Rev. Bras. Cienc. Solo 9:244-254.
Six, J., Feller, C., Denef, K., Ogle, S. M., Sá, J. C. M., and Albrecht, A. (2002)
Soil organic matter, biota and aggregation in temperate and tropical soils:
Effects of zero tillage. Agronomie 22, 755-775.
Skogley, E. O., and Dobermann, A. (1996). “Synthetic ion-exchange resins: soil
and environmental studies.” Journal of Environmental Quality 25: 13-24.
Standley, J., Hunter, H.M., Thomas, G.A., Blight, G.W., and Webb, A.A. 1990.
Tillage and Crop Residue Management Affect Vertisol Properties and
Grain-Sorghum Growth Over 7 Years in the Semiarid Subtropics .2.
Changes in Soil Properties. Soil Till. Res. 18:367-388.
Stark, J. M. (2000). “Nutrient transformations.” Pages 215 - 234 in Methods in
Ecosystem Science, edited by O. E. Sala, Jackson, R.B., Mooney, H.A.,
and Howarth, R.W. New York: Springer-Verlag.
Steinsiek, J.W, L.R. Oliver, and F. Collins. 1982. Allelopathic potential of wheat
(Triticum aestivum) straw on selected weed species. Weed Science 30:
495-97
Studdert, G.A., Echeverrı´a, H.E., Casanovas, E.M., 1997. Crop–pasture rotation
for sustaining the quality and productivity of a Typic Argiudoll. Soil Sci.
Soc. Am. J. 61:1466–1472.

xiii
Subbih, B.V. and Asija, G.L. (1965) A rapid procedure for estimation of
available nitrogen in soils. Current Science,25,259-260
Tamar, V.S. 2008. Opportunities of adapting conservation agriculture in vertical
of semi-arid region. Indian Journal of Society of Soil Science. 56(4) :
P.P. 334-355.
Thierfelder, C., Amezquita, E. & Stahr, K. 2005 Effects of intensifying organic
manuring and tillage practices on penetration resistance and infiltration
rate. Soil Tillage Res. 82: 211–226.
Thomas, G.A., Dalal, R.C., Standley, J., 2007. No-till effects on organic matter,
pH, cation exchange capacity and nutrient distribution in a Luvisol in the
semi-arid subtropics. Soil Tillage Res. 94, 295–304
Tripathy, R.K., Pradhan, L. and Rath, B.S. 1997. Performance of maize and
cowpea forage intercroppping system in summer. Indian. J. Agron.42(1):
P.P. 38-41.
Unger, P.W., 1991. Organic matter, nutrient, and pH distribution in no- and
conventional-tillage semiarid soils. Agron. J. 83, 186–189.
Utz,E.J., C.E. Kellogg, E.H. Reed, J.H. Stallings, and E.N. Munns.1938. The
problem: The nation as a whole. In Soils and men.year book of
Agriculture. Washington DC: USDA. Pp. 84-110
Walkley, A.J. and Black, I.A. (1934) estimation of organic carbon by chromic
acid titration method. Soil science 37:29-38.
Wall, P.C. (1999). Experiences with crop residue cover and direct seeding in the
Bolivian highlands. Mt-res-dev. Berkeley, Calif. : University of
California Press. v. 19 (4) p. 313-317. Nov 1999.
Wang, X.Y., Gao, H.W., Li, H.W., Zhou, X.X., 2000. Experimental study on
runoff and erosion under conservation tillage. Trans. ASAE 3: 66–69 (in
Chinese).

xiv
Weil, R.R., Benedetto, P.W., Sikora, L.J., Bandel, V.A., 1988. Influence of
tillage practices on phosphorus distribution and forms in three Ultisols.
Agron. J. 80, 503–509.
Wienhold, B.J. and Halvorson, A.D. 1999. Nitrogen mineralization responses to
cropping, tillage, and nitrogen rate in the Northern Great Plains. Soil Sci.
Soc. Am. J. 63:192-196.
Yang, X.M. and Wander, M.M. 1999. Tillage effects on soil organic carbon
distribution and storage in a silt loam soil in Illinois. Soil Till. Res. 52:1-9.
Zhou, H., Lu, Y.Z., Yang, Z.C., Li, B.G., 2007. Influence of conservation tillage
on soil aggregates features in North China Plain. Agric. Sci. China
6:1099–1106.
Zibilske, L.M., Bradford, J.M., Smart, J.R., 2002. Conservation tillage induced
changes in organic carbon, total nitrogen and available phosphorus in a
semi-arid alkaline subtropical soil. Soil Tillage Res. 66: 153–163.