Embed Size (px)
Citation preview
This presentation, including any supporting materials, is owned by Gartner, Inc. and/or its affiliates and is for the sole use of the intended Gartner audience or other intended recipients. This presentation may contain information that is confidential, proprietary or otherwise legally protected, and it may not be further copied, distributed or publicly displayed without the express written permission of Gartner, Inc. or its affiliates. © 2015 Gartner, Inc. and/or its affiliates. All rights reserved.
Imperatives for Executing the Global Supply Chain Strategy
Michael Uskert
Managing Vice President
Gartner
1 © 2015 Gartner, Inc. and/or its affiliates. All rights reserved.
2 © 2015 Gartner, Inc. and/or its affiliates. All rights reserved.
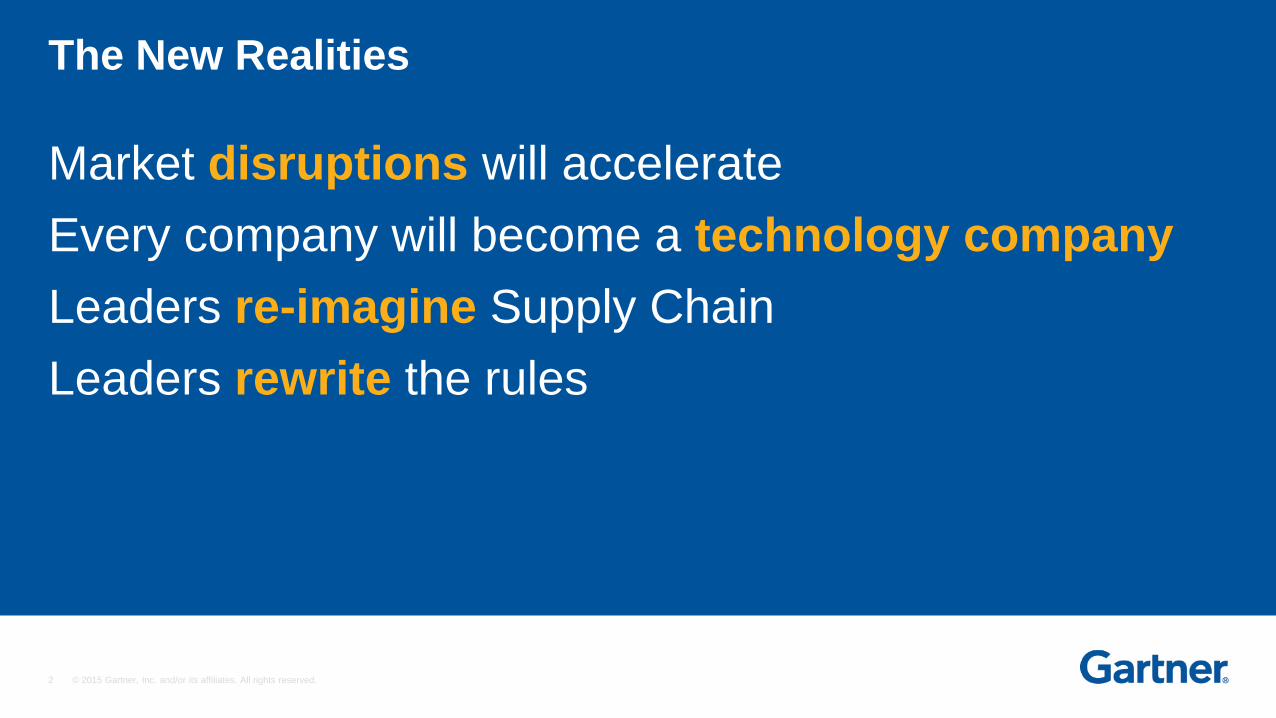
Market disruptions will accelerate
Every company will become a technology company
Leaders re-imagine Supply Chain
Leaders rewrite the rules
The New Realities
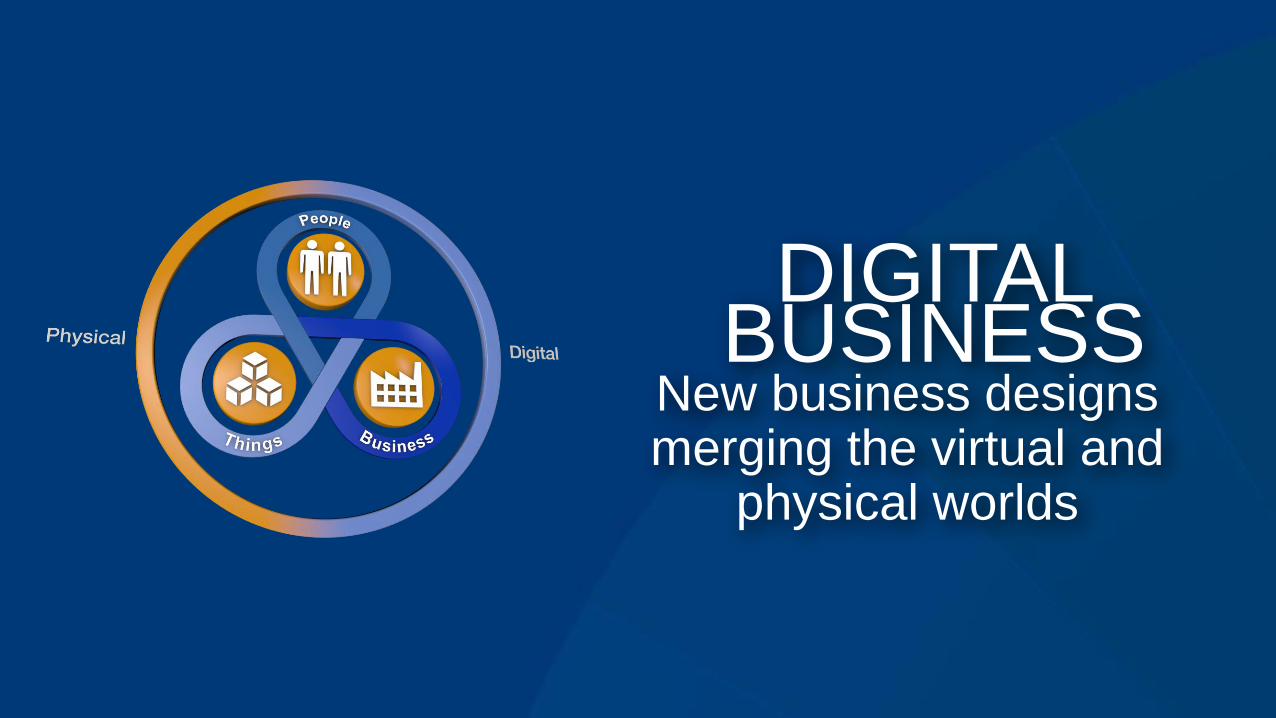
DIGITAL BUSINESS
New business designs merging the virtual and
physical worlds

“If the rate of change on the outside
exceeds the rate of change on the inside,
the end is near.”JACK WELCH
Former CEO, GE
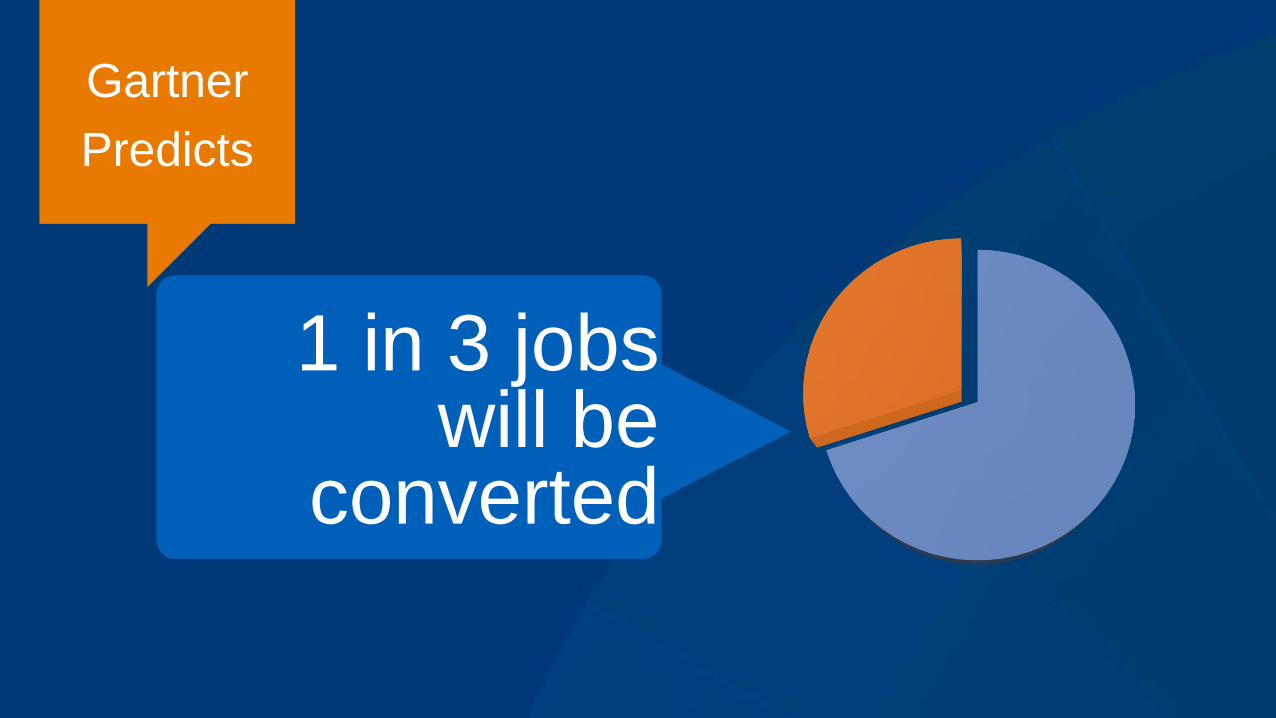
1 in 3 jobs will be
converted
Gartner
Predicts
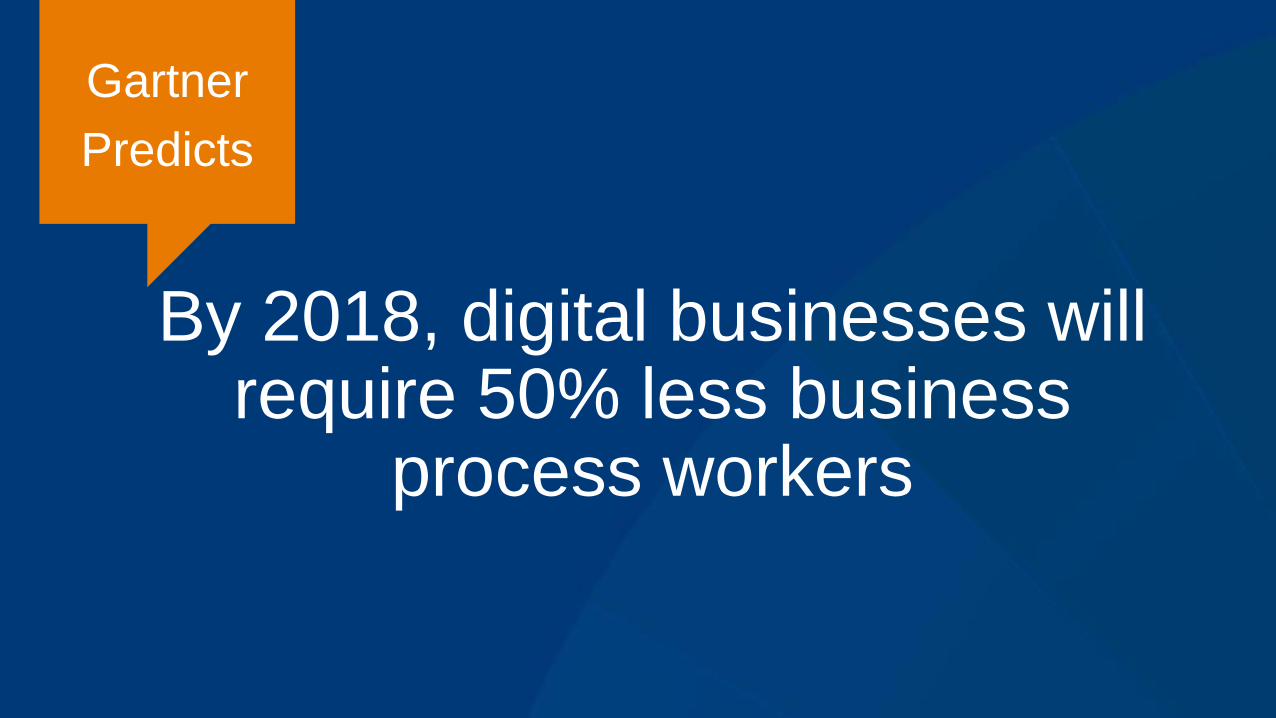
By 2018, digital businesses will require 50% less business
process workers
Gartner
Predicts
7 © 2015 Gartner, Inc. and/or its affiliates. All rights reserved.
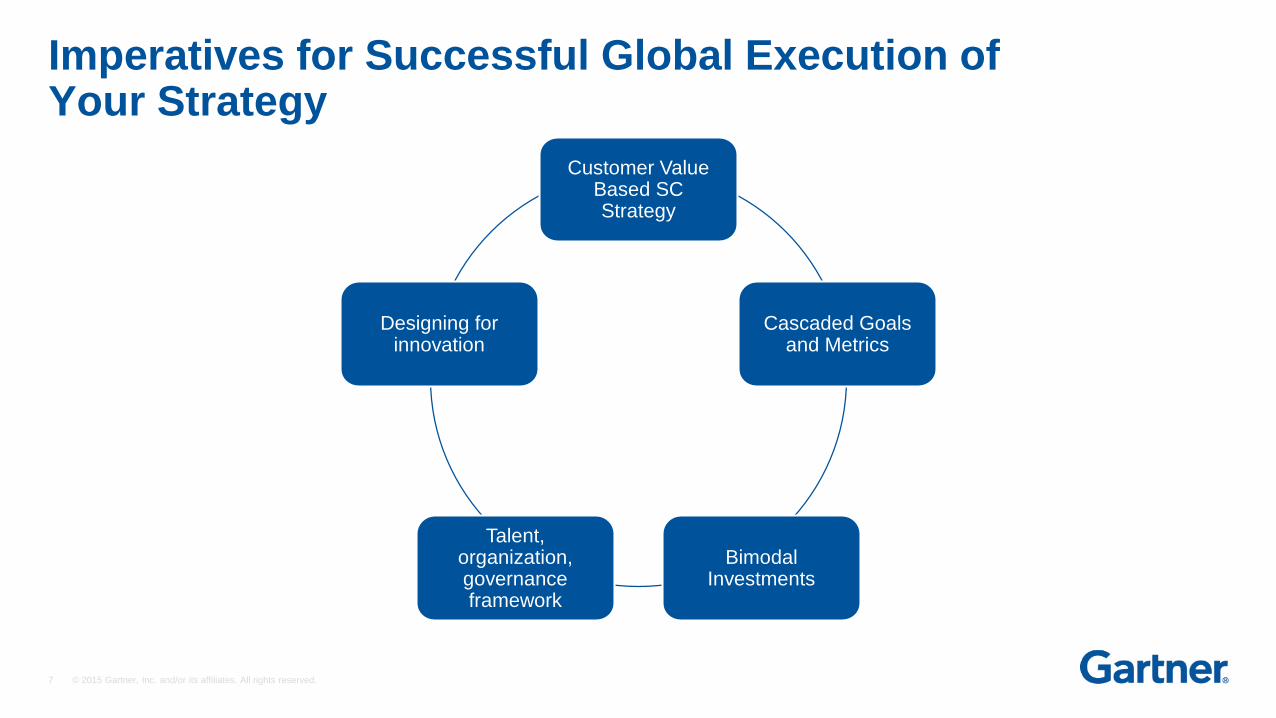
Customer ValueBased SC Strategy
Cascaded Goals and Metrics
Bimodal Investments
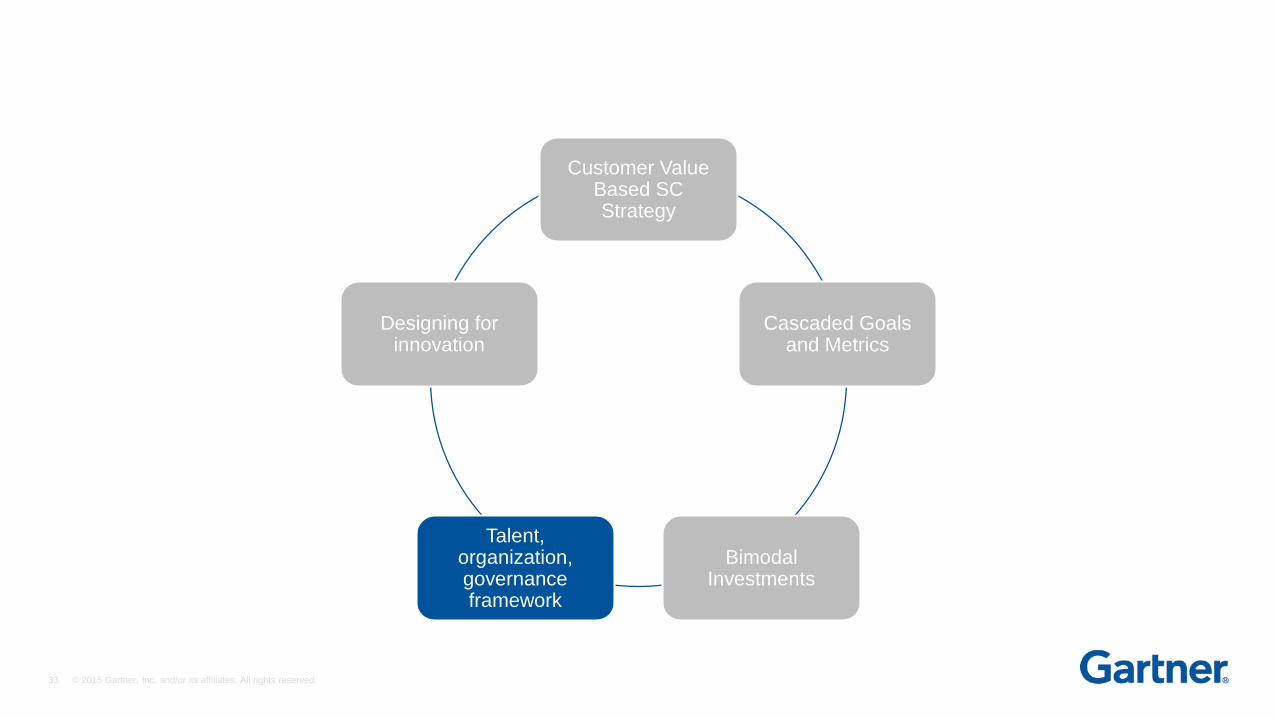
Talent, organization, governance framework
Designing for innovation
Imperatives for Successful Global Execution of Your Strategy
8 © 2015 Gartner, Inc. and/or its affiliates. All rights reserved.
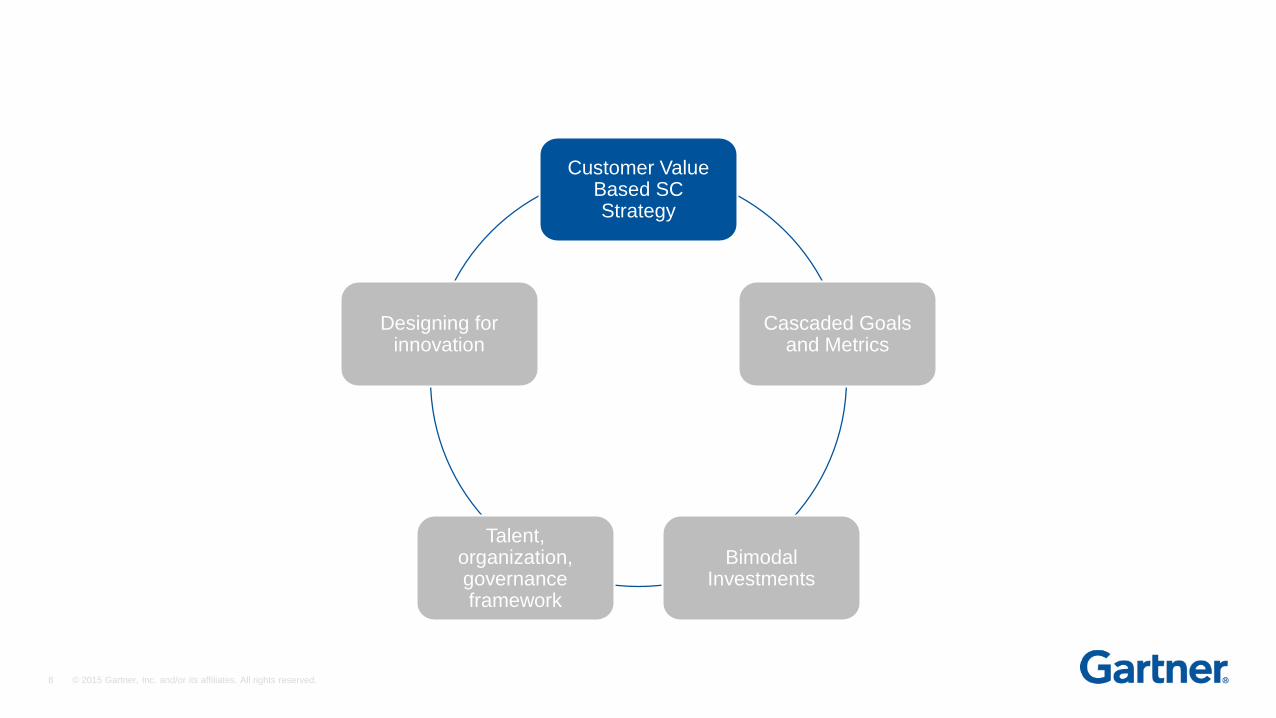
Customer ValueBased SC Strategy
Cascaded Goals and Metrics
Bimodal Investments
Talent, organization, governance framework
Designing for innovation
9 © 2015 Gartner, Inc. and/or its affiliates. All rights reserved.
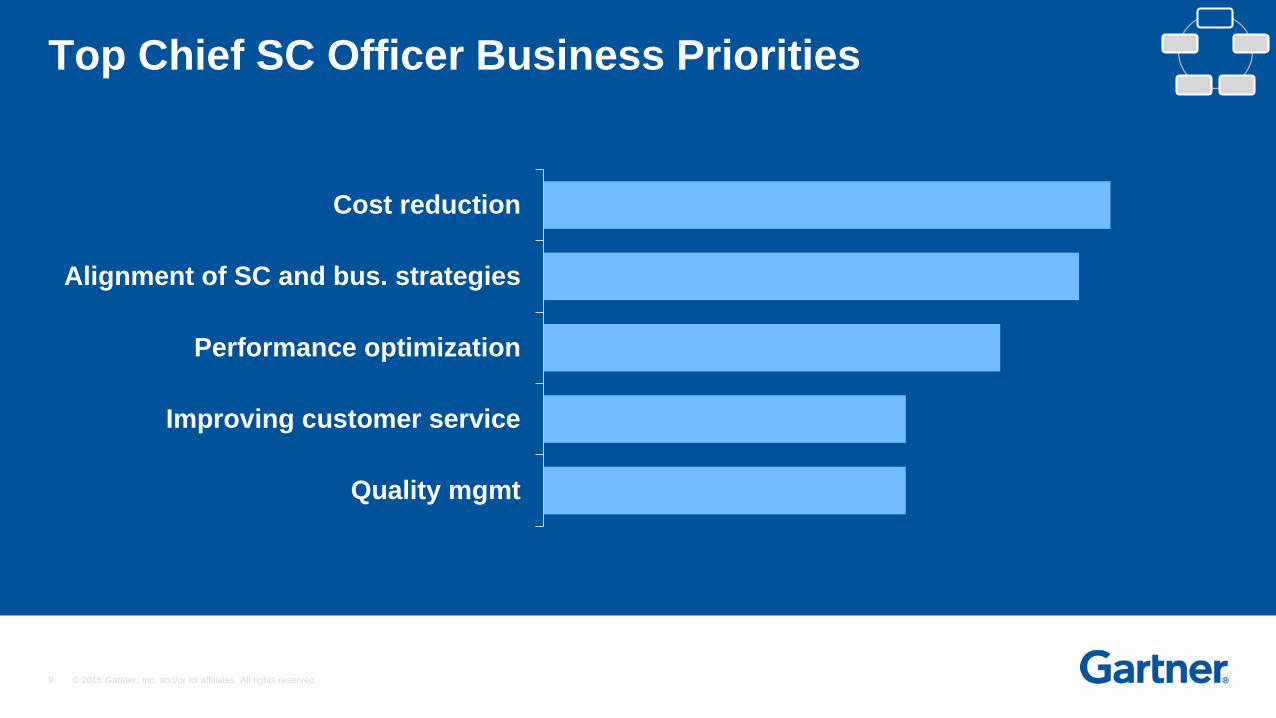
Top Chief SC Officer Business Priorities
Quality mgmt
Improving customer service
Performance optimization
Alignment of SC and bus. strategies
Cost reduction
10 © 2015 Gartner, Inc. and/or its affiliates. All rights reserved.
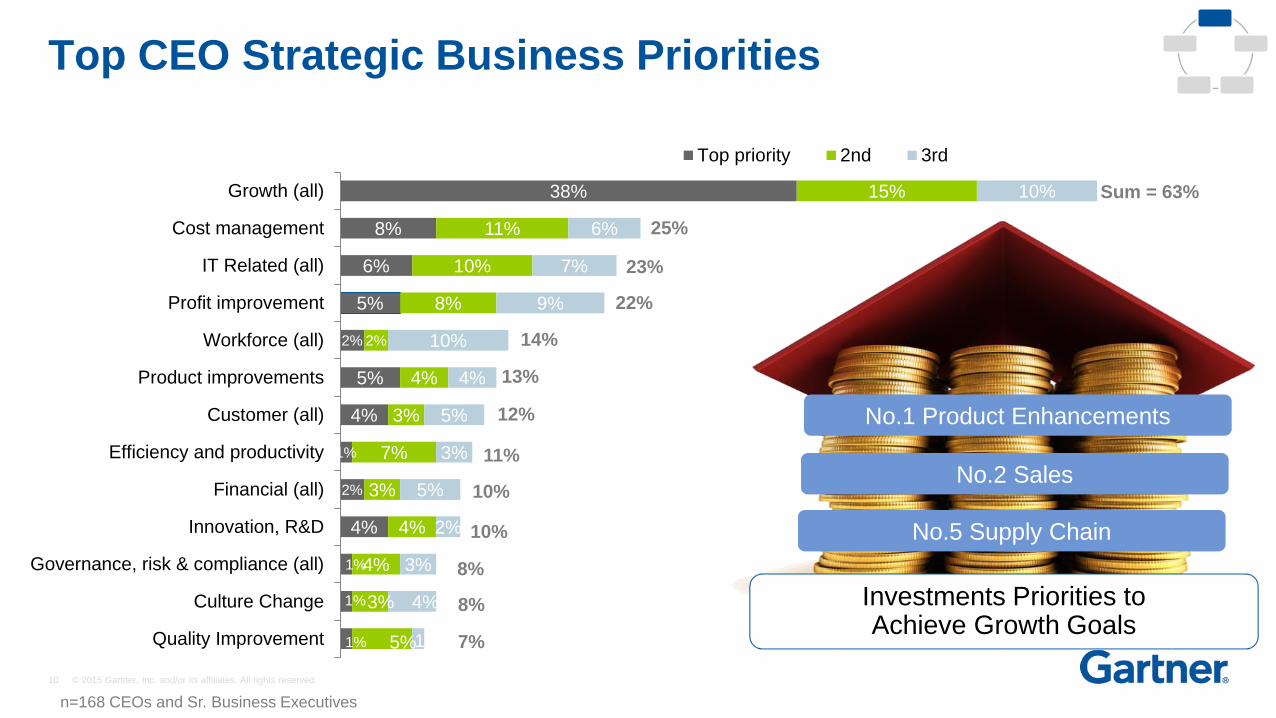
Top CEO Strategic Business Priorities
1%
1%
1%
4%
2%
1%
4%
5%
2%
5%
6%
8%
38%
5%
3%
4%
4%
3%
7%
3%
4%
2%
8%
10%
11%
15%
1%
4%
3%
2%
5%
3%
5%
4%
10%
9%
7%
6%
10%
Quality Improvement
Culture Change
Governance, risk & compliance (all)
Innovation, R&D
Financial (all)
Efficiency and productivity
Customer (all)
Product improvements
Workforce (all)
Profit improvement
IT Related (all)
Cost management
Growth (all)
Top priority 2nd 3rd
13%
12%
11%
10%
10%
8%
7%
8%
n=168 CEOs and Sr. Business Executives
Sum = 63%
25%
23%
14%
22%
Investments Priorities toAchieve Growth Goals
No.1 Product Enhancements
No.2 Sales
No.5 Supply Chain
11 © 2015 Gartner, Inc. and/or its affiliates. All rights reserved.
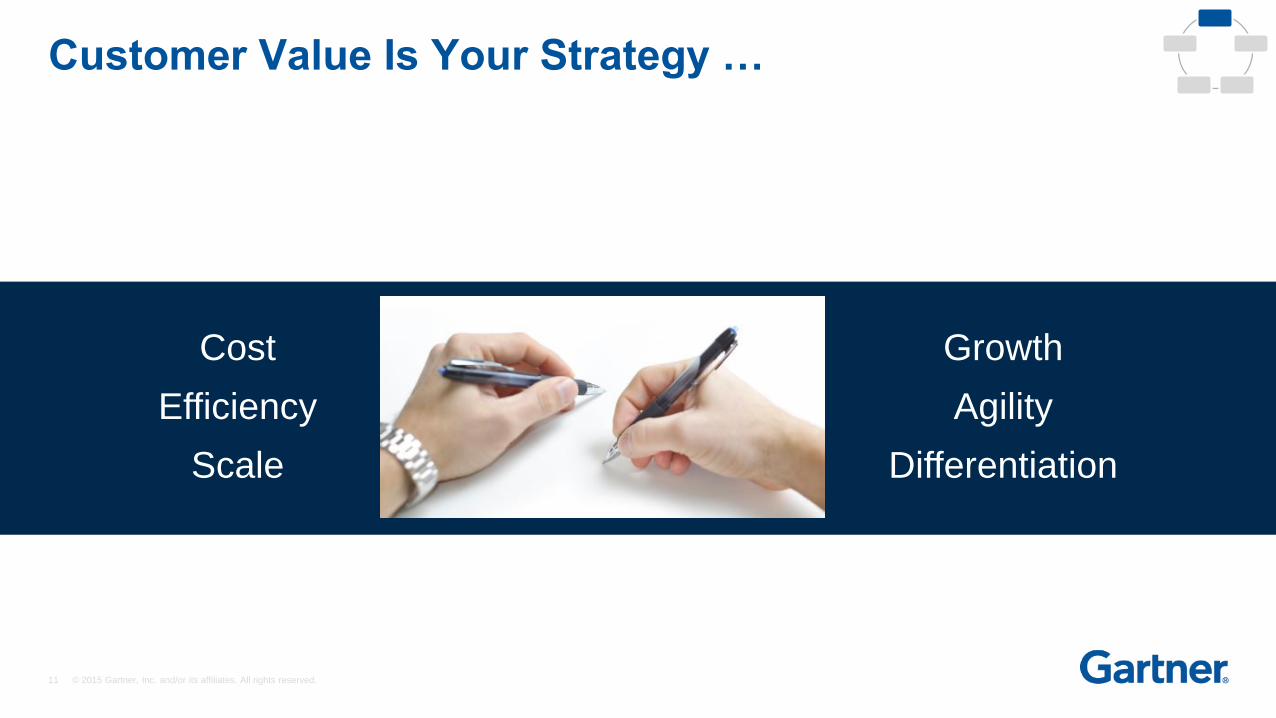
Cost
Efficiency
Scale
Growth
Agility
Differentiation
Customer Value Is Your Strategy …
12 © 2015 Gartner, Inc. and/or its affiliates. All rights reserved.
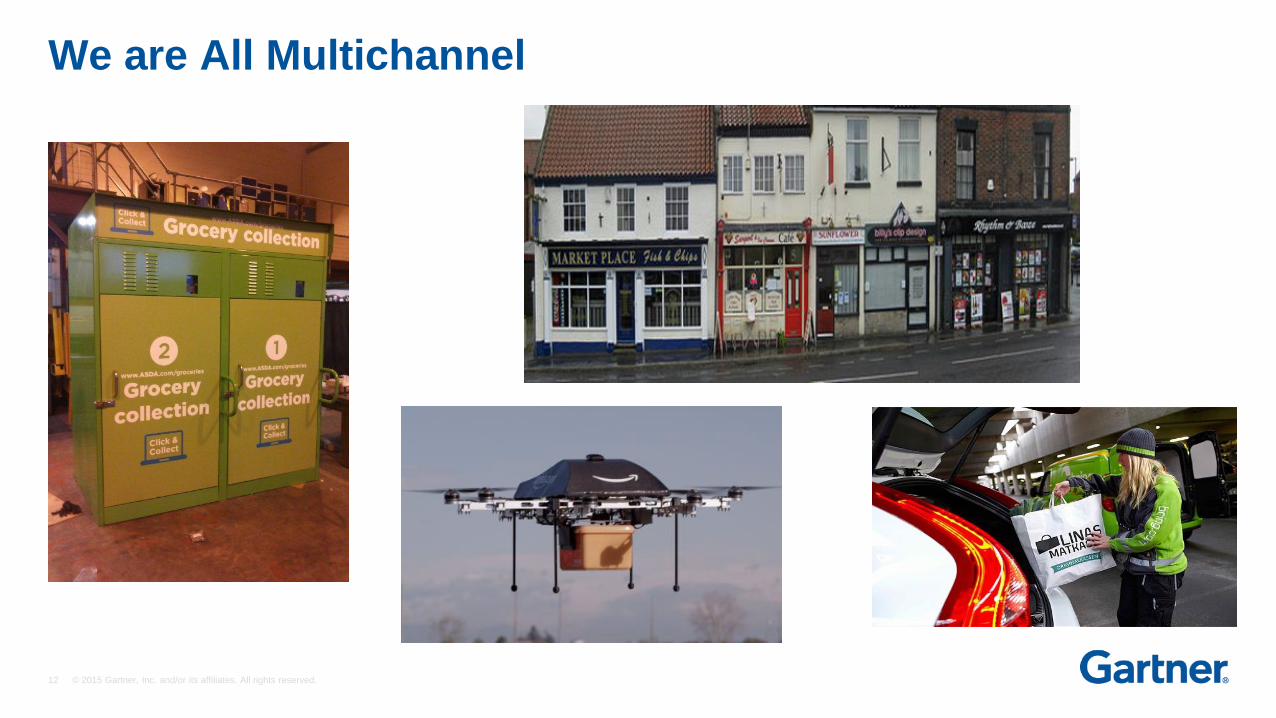
We are All Multichannel
13 © 2015 Gartner, Inc. and/or its affiliates. All rights reserved.
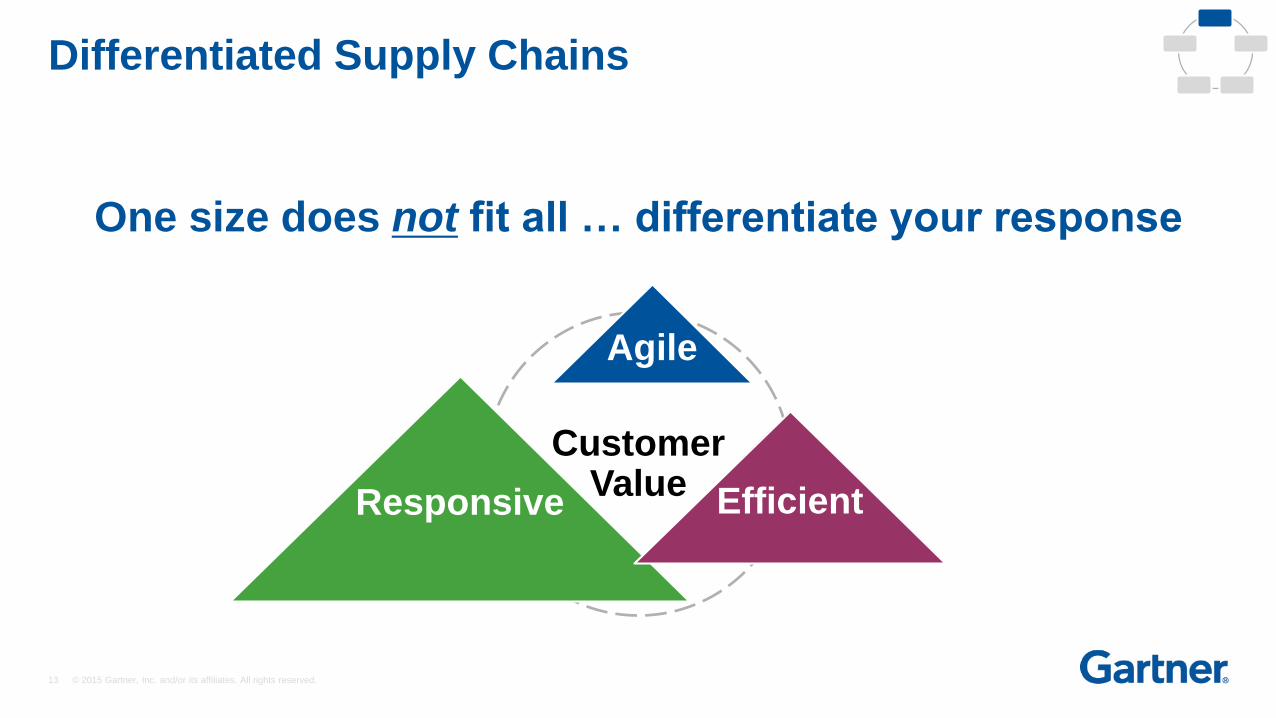
Differentiated Supply Chains
CustomerValue
Agile
Responsive Efficient
One size does not fit all … differentiate your response
14 © 2015 Gartner, Inc. and/or its affiliates. All rights reserved.
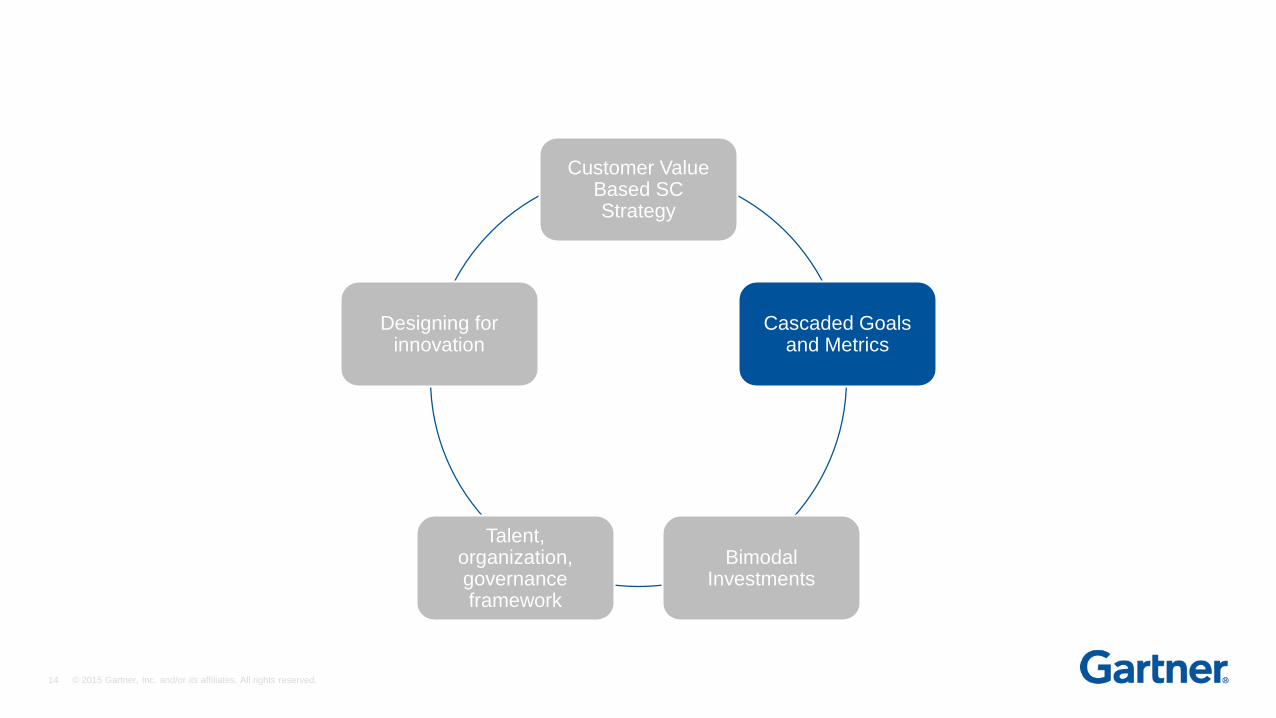
Customer ValueBased SC Strategy
Cascaded Goals and Metrics
Bimodal Investments
Talent, organization, governance framework
Designing for innovation
15 © 2015 Gartner, Inc. and/or its affiliates. All rights reserved.
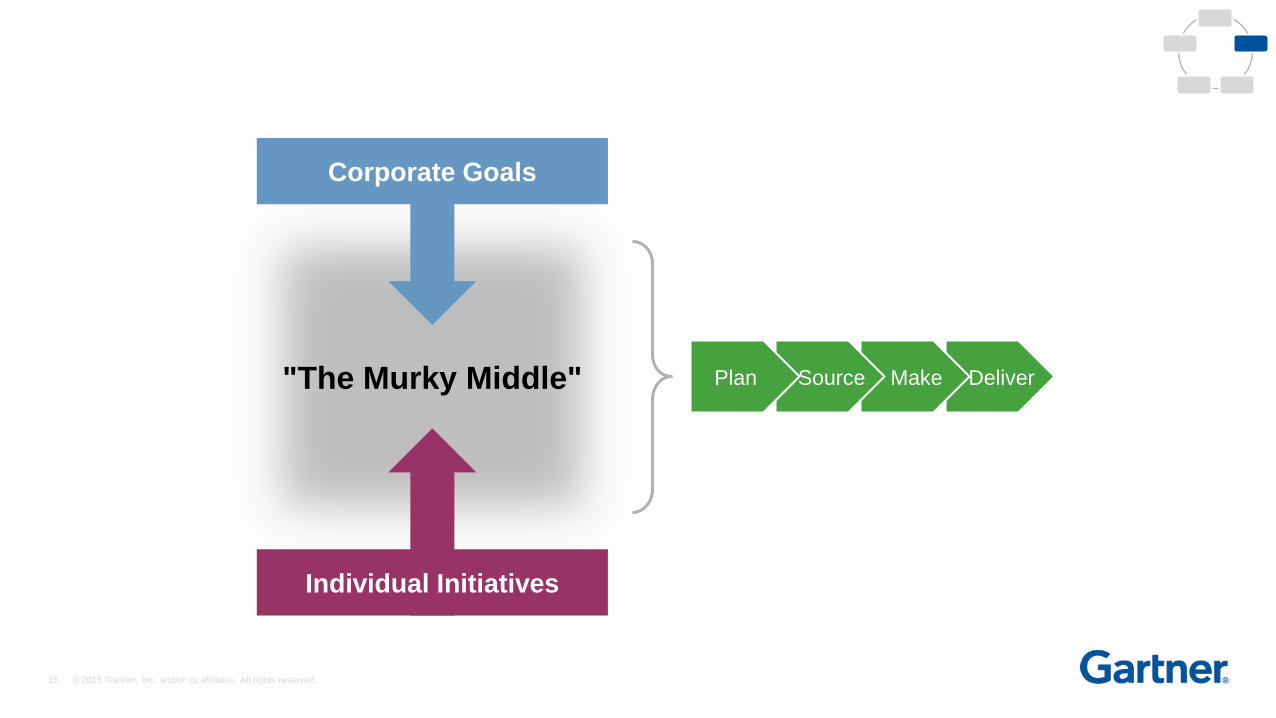
"The Murky Middle" DeliverMakeSourcePlan
Corporate Goals
Individual Initiatives
16 © 2015 Gartner, Inc. and/or its affiliates. All rights reserved.
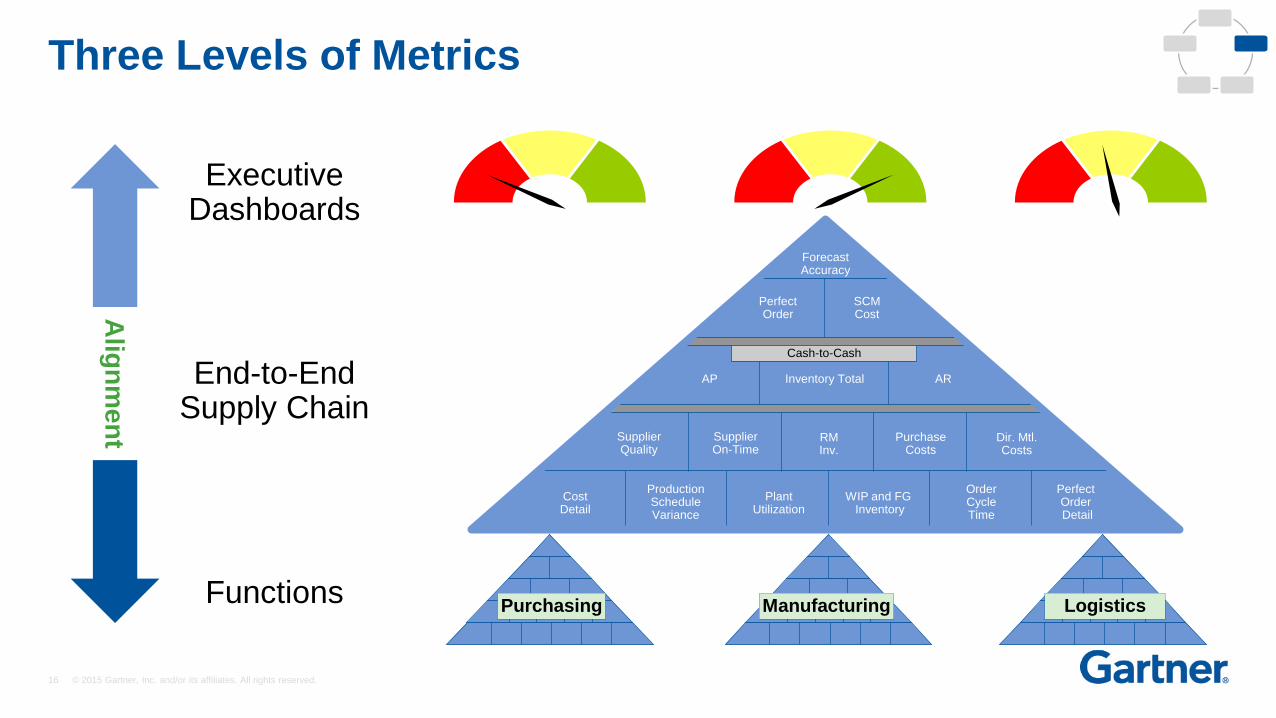
Three Levels of Metrics
End-to-End Supply Chain
Executive Dashboards
ForecastAccuracy
PerfectOrder
SCMCost
AP Inventory Total AR
SupplierQuality
SupplierOn-Time
PurchaseCosts
Dir. Mtl.Costs
CostDetail
ProductionScheduleVariance
PlantUtilization
WIP and FG Inventory
OrderCycleTime
PerfectOrderDetail
RMInv.
Cash-to-Cash
Functions
Alig
nm
en
t
Manufacturing LogisticsPurchasing
17 © 2015 Gartner, Inc. and/or its affiliates. All rights reserved.
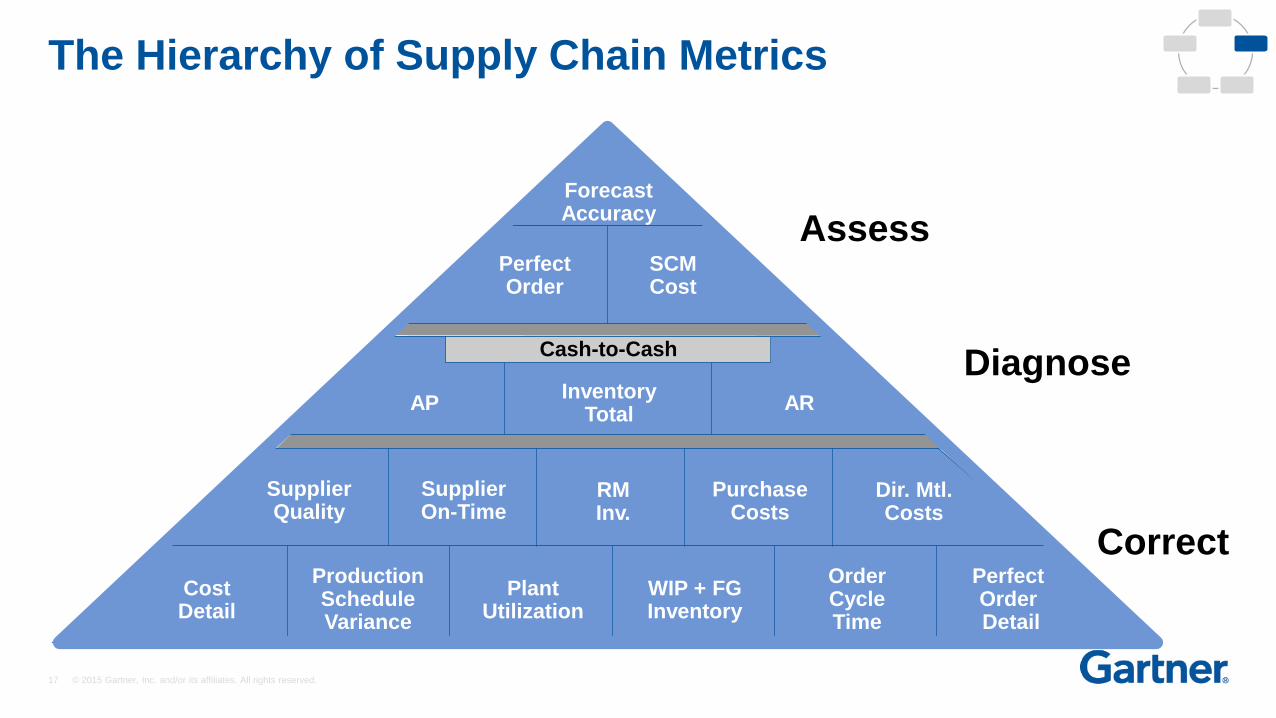
The Hierarchy of Supply Chain Metrics
APInventory
TotalAR
Cash-to-CashDiagnose
SupplierQuality
SupplierOn-Time
PurchaseCosts
Dir. Mtl. Costs
CostDetail
ProductionScheduleVariance
PlantUtilization
WIP + FGInventory
OrderCycleTime
PerfectOrderDetail
RMInv.
Correct
ForecastAccuracy
PerfectOrder
SCMCost
Assess
18 © 2015 Gartner, Inc. and/or its affiliates. All rights reserved.
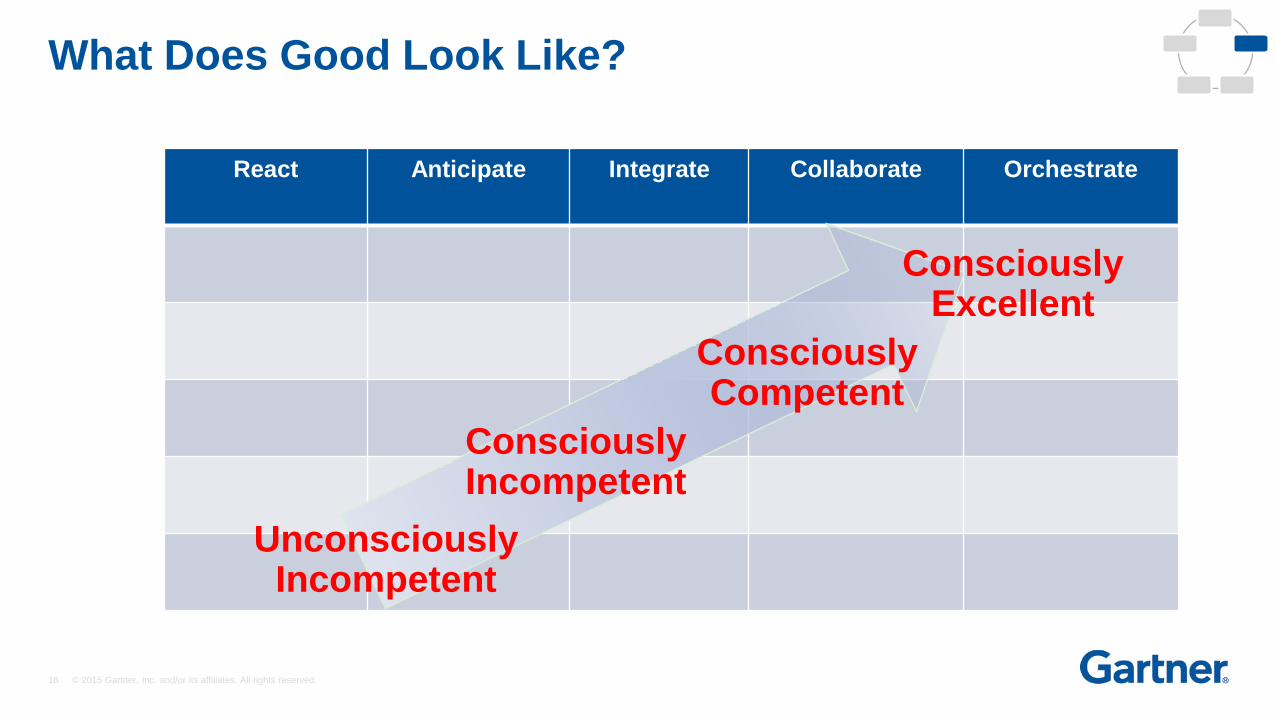
What Does Good Look Like?
React Anticipate Integrate Collaborate Orchestrate
Unconsciously Incompetent
Consciously Competent
Consciously Excellent
Consciously Incompetent
19 © 2015 Gartner, Inc. and/or its affiliates. All rights reserved.
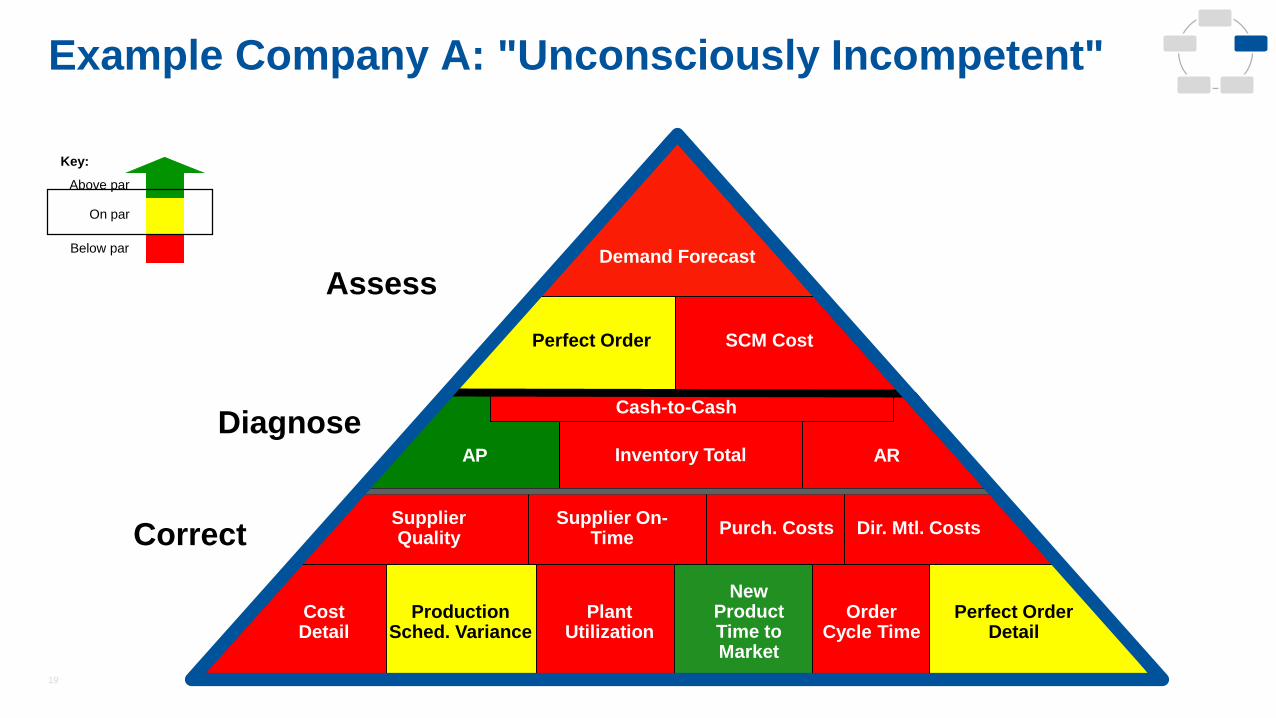
On par
Below par
Above par
Key:
Example Company A: "Unconsciously Incompetent"
Supplier Quality
Supplier On-Time
Purch. Costs Dir. Mtl. Costs
Cost Detail
Production Sched. Variance
Plant Utilization
Order Cycle Time
AP ARInventory Total
Cash-to-Cash
Perfect Order SCM Cost
Demand Forecast
Assess
Diagnose
Correct
New Product Time to Market
Perfect Order Detail
20 © 2015 Gartner, Inc. and/or its affiliates. All rights reserved.
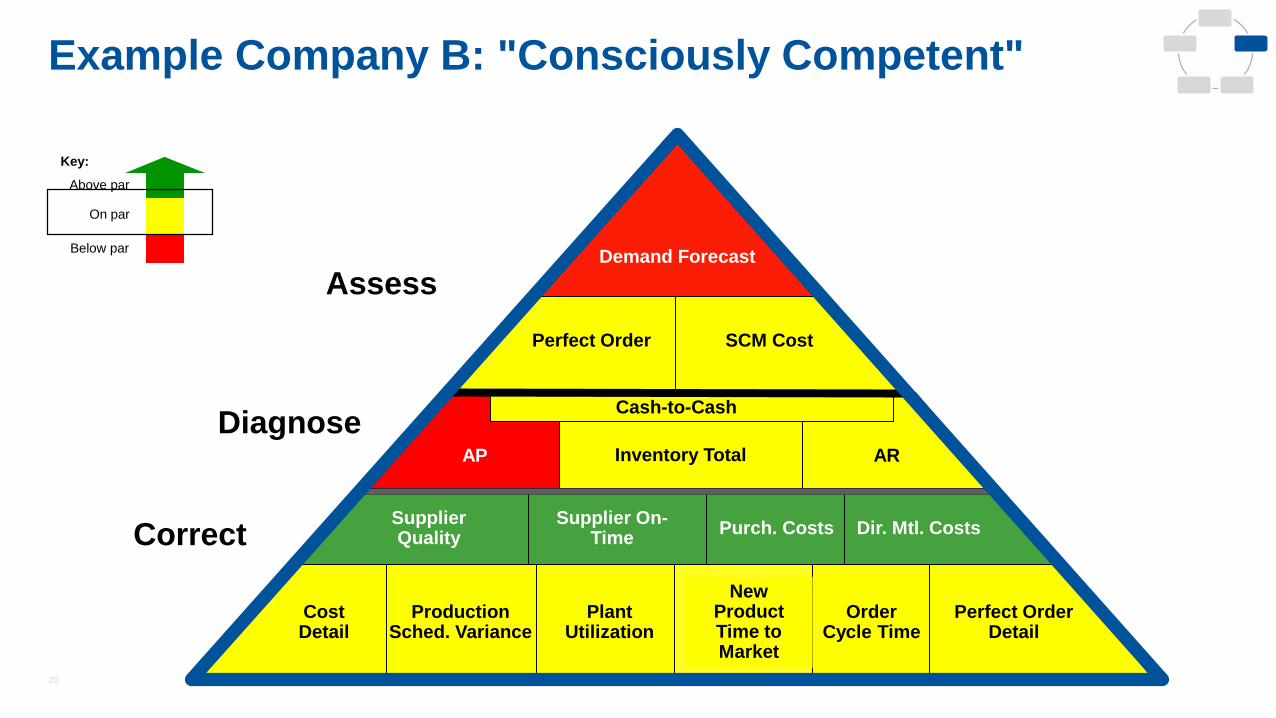
On par
Below par
Above par
Key:
Example Company B: "Consciously Competent"
Supplier Quality
Supplier On-Time
Purch. Costs Dir. Mtl. Costs
Cost Detail
Production Sched. Variance
Plant Utilization
Order Cycle Time
AP ARInventory Total
Cash-to-Cash
Perfect Order SCM Cost
Demand Forecast
Assess
Diagnose
Correct
New Product Time to Market
Perfect Order Detail
21 © 2015 Gartner, Inc. and/or its affiliates. All rights reserved.
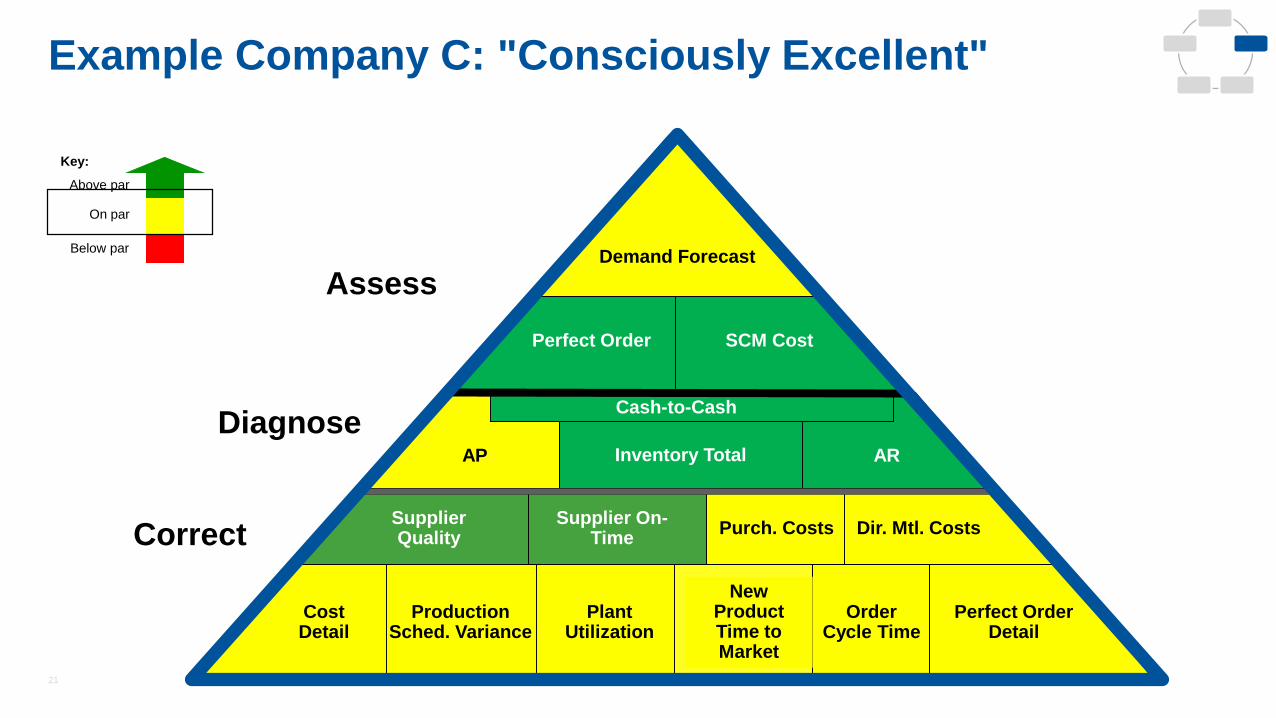
On par
Below par
Above par
Key:
Example Company C: "Consciously Excellent"
Supplier Quality
Supplier On-Time
Purch. Costs Dir. Mtl. Costs
Cost Detail
Production Sched. Variance
Plant Utilization
Order Cycle Time
AP ARInventory Total
Cash-to-Cash
Perfect Order SCM Cost
Demand Forecast
Assess
Diagnose
Correct
New Product Time to Market
Perfect Order Detail
22 © 2015 Gartner, Inc. and/or its affiliates. All rights reserved.
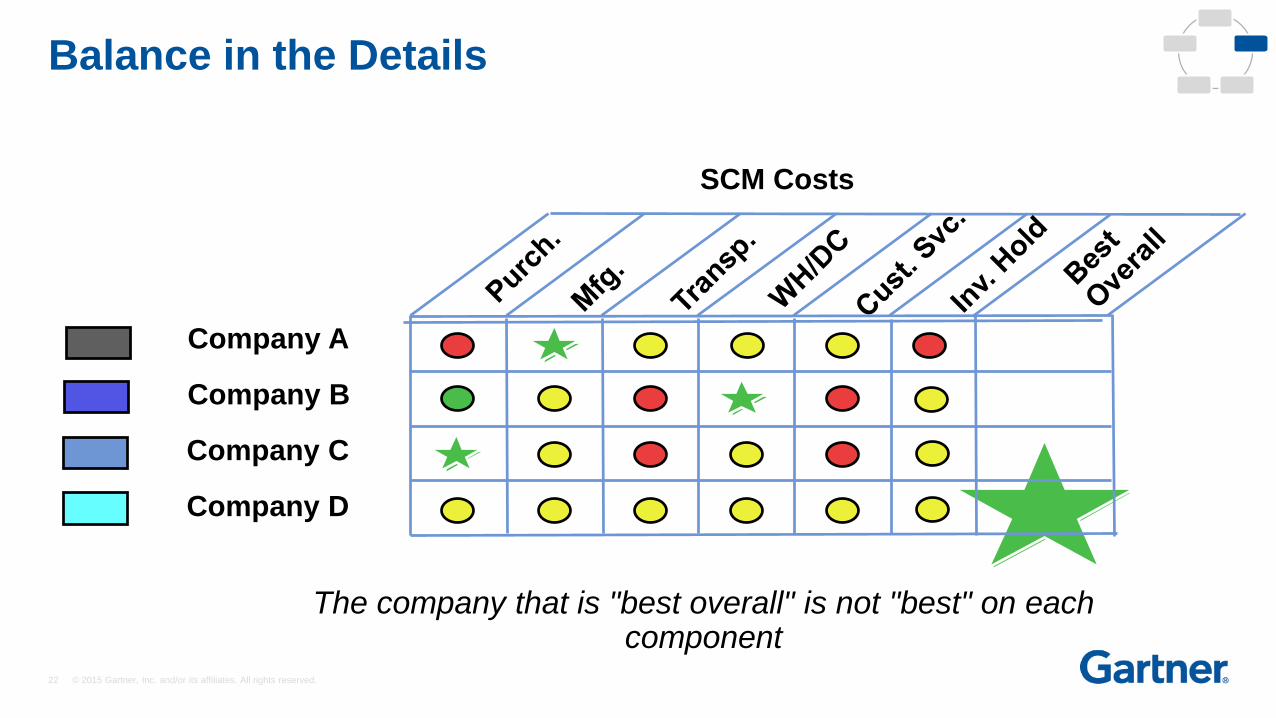
Balance in the Details
Company A
Company B
Company C
Company D
SCM Costs
The company that is "best overall" is not "best" on each component
23 © 2015 Gartner, Inc. and/or its affiliates. All rights reserved.
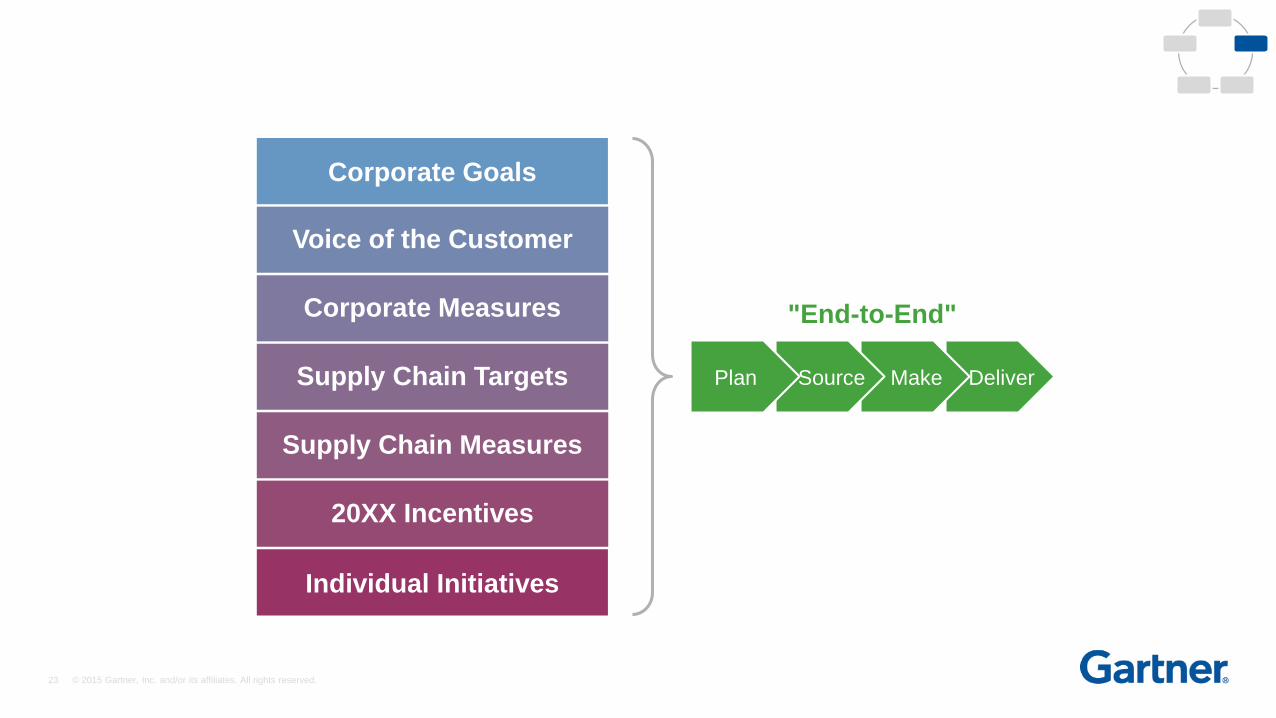
"End-to-End"
Voice of the Customer
Corporate Measures
Supply Chain Targets
Supply Chain Measures
20XX Incentives
DeliverMakeSourcePlan
Corporate Goals
Individual Initiatives
24 © 2015 Gartner, Inc. and/or its affiliates. All rights reserved.
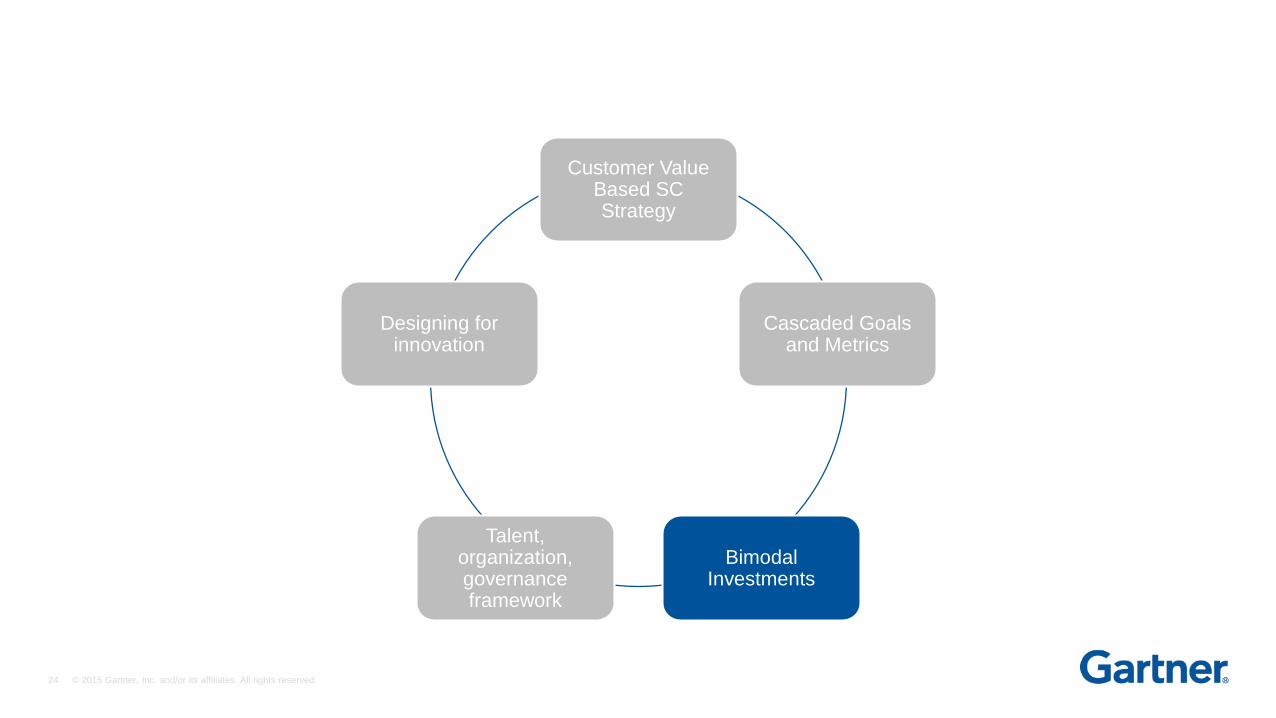
Customer ValueBased SC Strategy
Cascaded Goals and Metrics
Bimodal Investments
Talent, organization, governance framework
Designing for innovation
25 © 2015 Gartner, Inc. and/or its affiliates. All rights reserved.
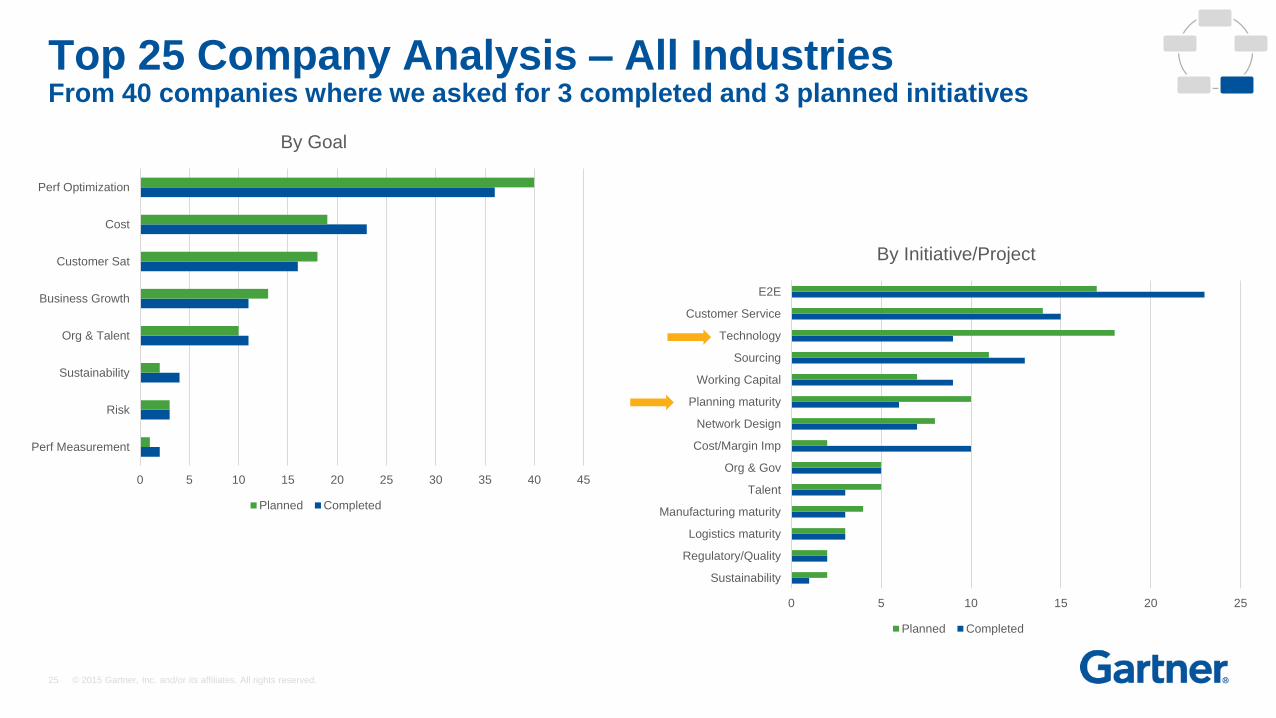
Top 25 Company Analysis – All IndustriesFrom 40 companies where we asked for 3 completed and 3 planned initiatives
0 5 10 15 20 25 30 35 40 45
Perf Measurement
Risk
Sustainability
Org & Talent
Business Growth
Customer Sat
Cost
Perf Optimization
By Goal
Planned Completed
0 5 10 15 20 25
Sustainability
Regulatory/Quality
Logistics maturity
Manufacturing maturity
Talent
Org & Gov
Cost/Margin Imp
Network Design
Planning maturity
Working Capital
Sourcing
Technology
Customer Service
E2E
By Initiative/Project
Planned Completed

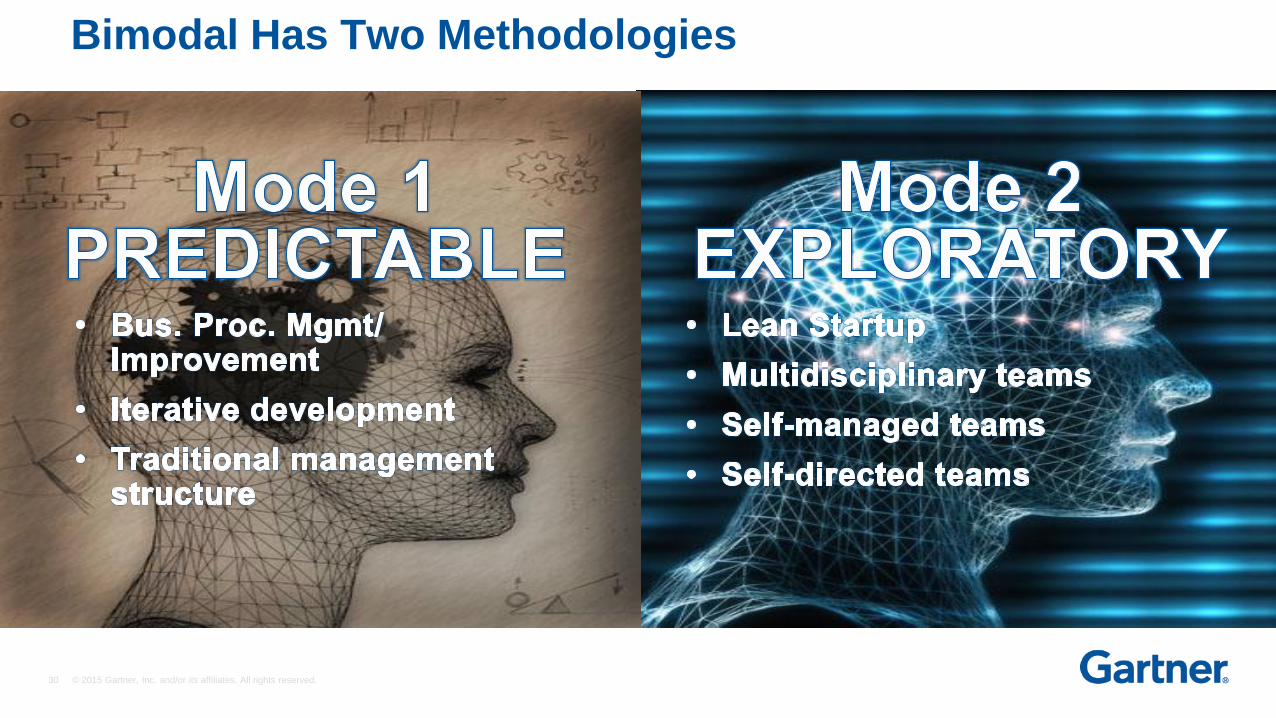
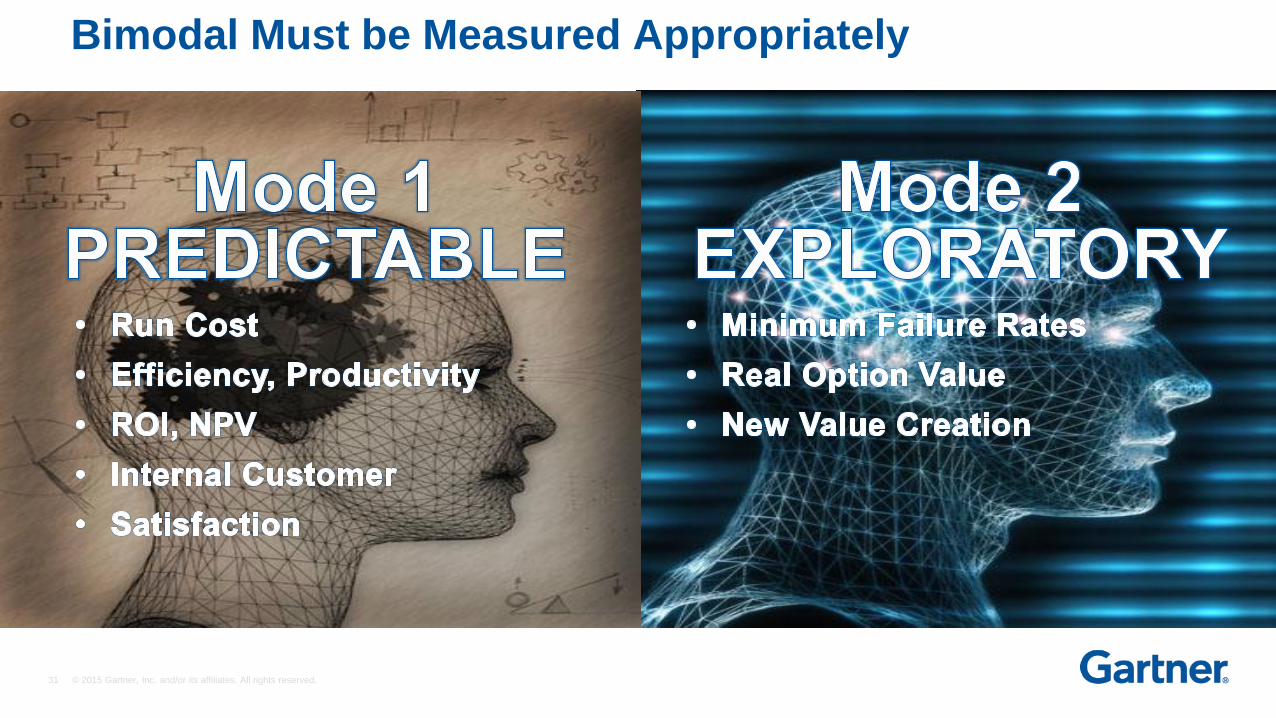
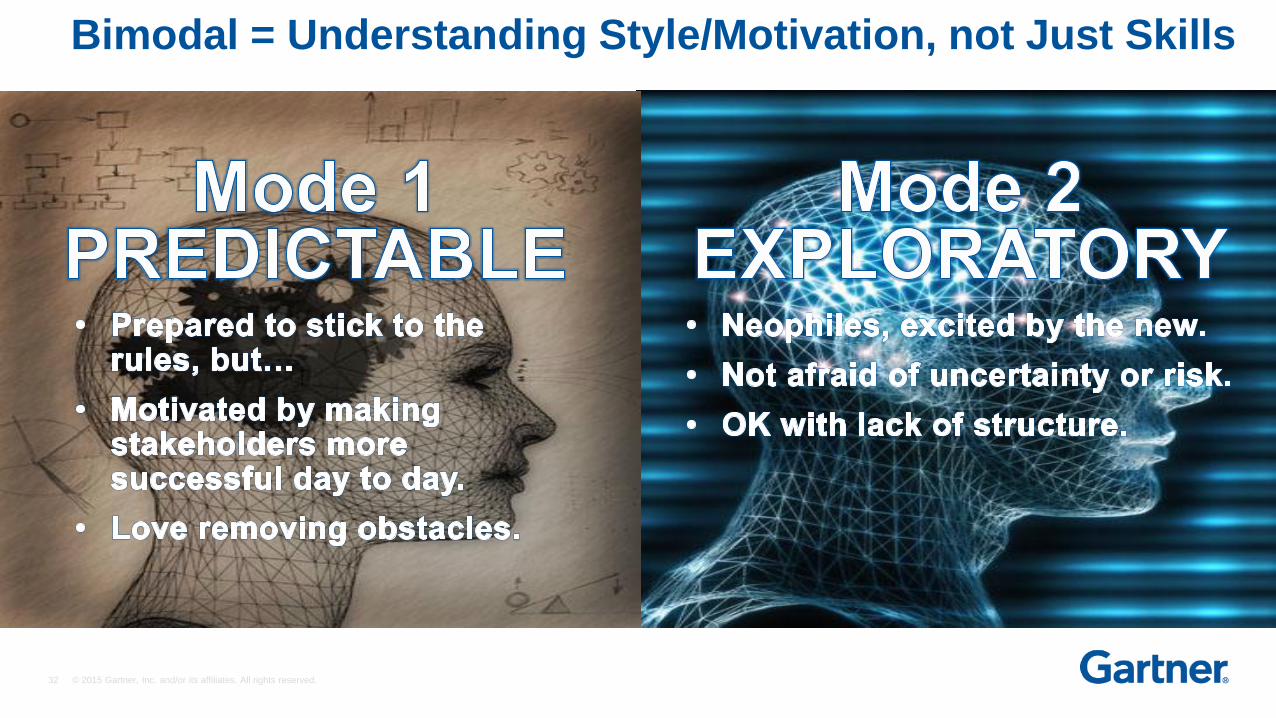
BIMODAL BUSINESS
27 © 2015 Gartner, Inc. and/or its affiliates. All rights reserved.
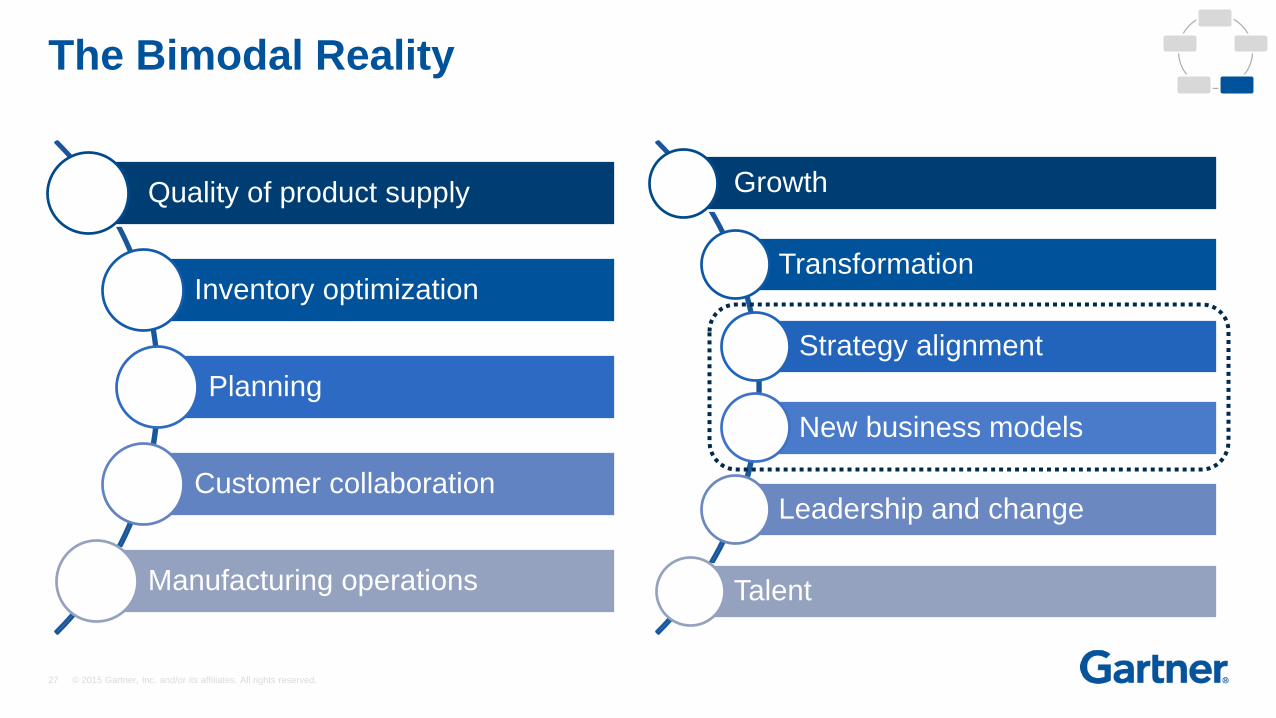
The Bimodal Reality
Quality of product supply
Inventory optimization
Planning
Customer collaboration
Manufacturing operations
Growth
Transformation
Strategy alignment
New business models
Leadership and change
Talent
28 © 2015 Gartner, Inc. and/or its affiliates. All rights reserved.
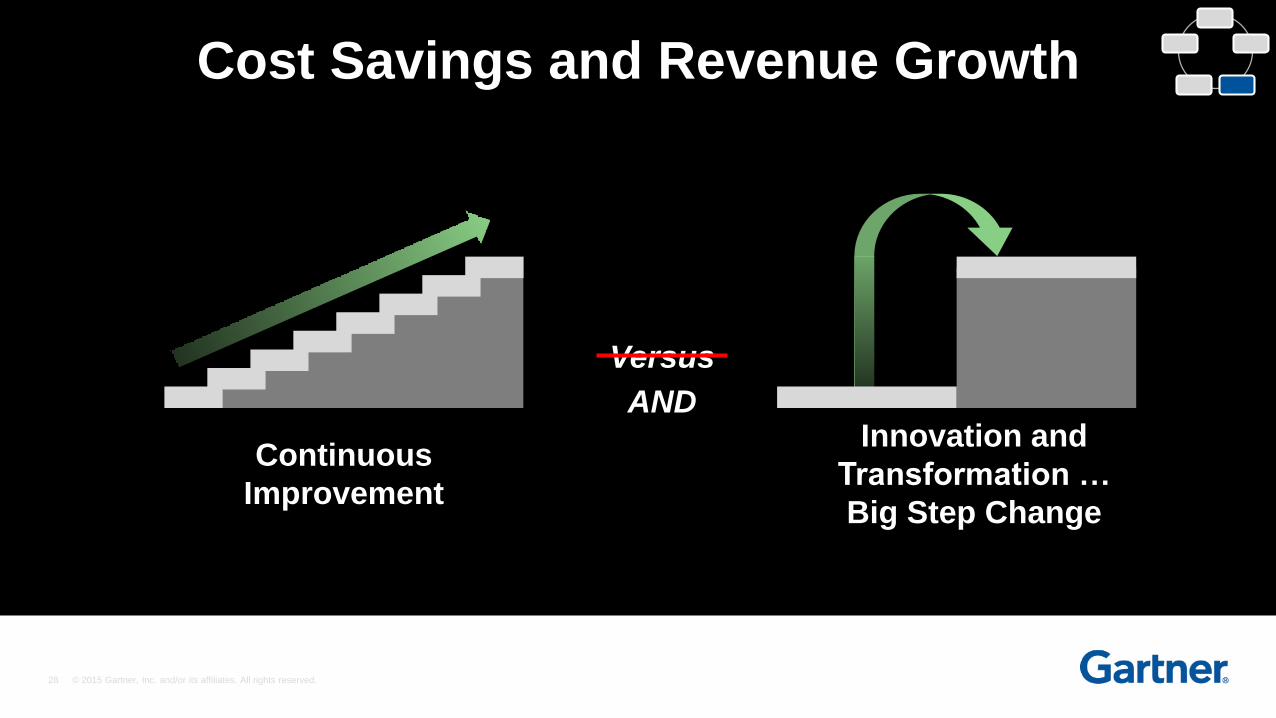
Cost Savings and Revenue Growth
Versus
Continuous
Improvement
Innovation and
Transformation …
Big Step Change
AND
29 © 2015 Gartner, Inc. and/or its affiliates. All rights reserved.
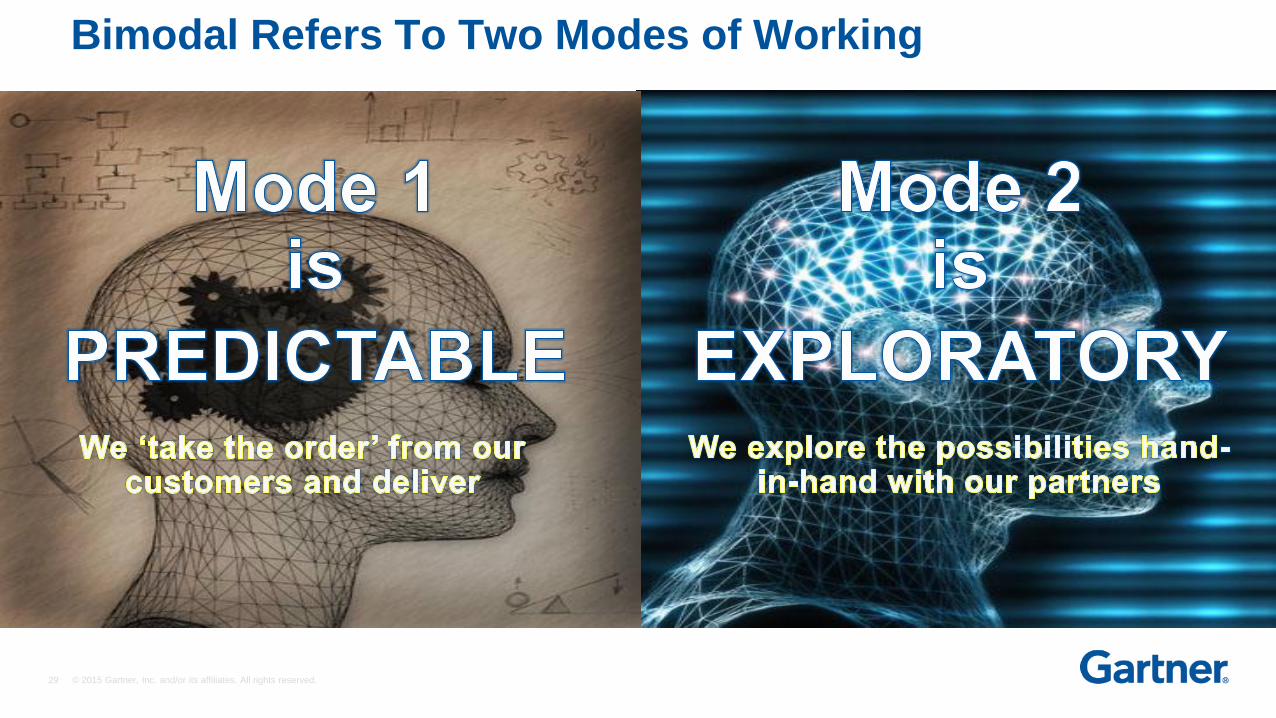
Bimodal Refers To Two Modes of Working
30 © 2015 Gartner, Inc. and/or its affiliates. All rights reserved.
Bimodal Has Two Methodologies
31 © 2015 Gartner, Inc. and/or its affiliates. All rights reserved.
Bimodal Must be Measured Appropriately
32 © 2015 Gartner, Inc. and/or its affiliates. All rights reserved.
Bimodal = Understanding Style/Motivation, not Just Skills
33 © 2015 Gartner, Inc. and/or its affiliates. All rights reserved.
Customer ValueBased SC Strategy
Cascaded Goals and Metrics
Bimodal Investments
Talent, organization, governance framework
Designing for innovation
34 © 2015 Gartner, Inc. and/or its affiliates. All rights reserved.
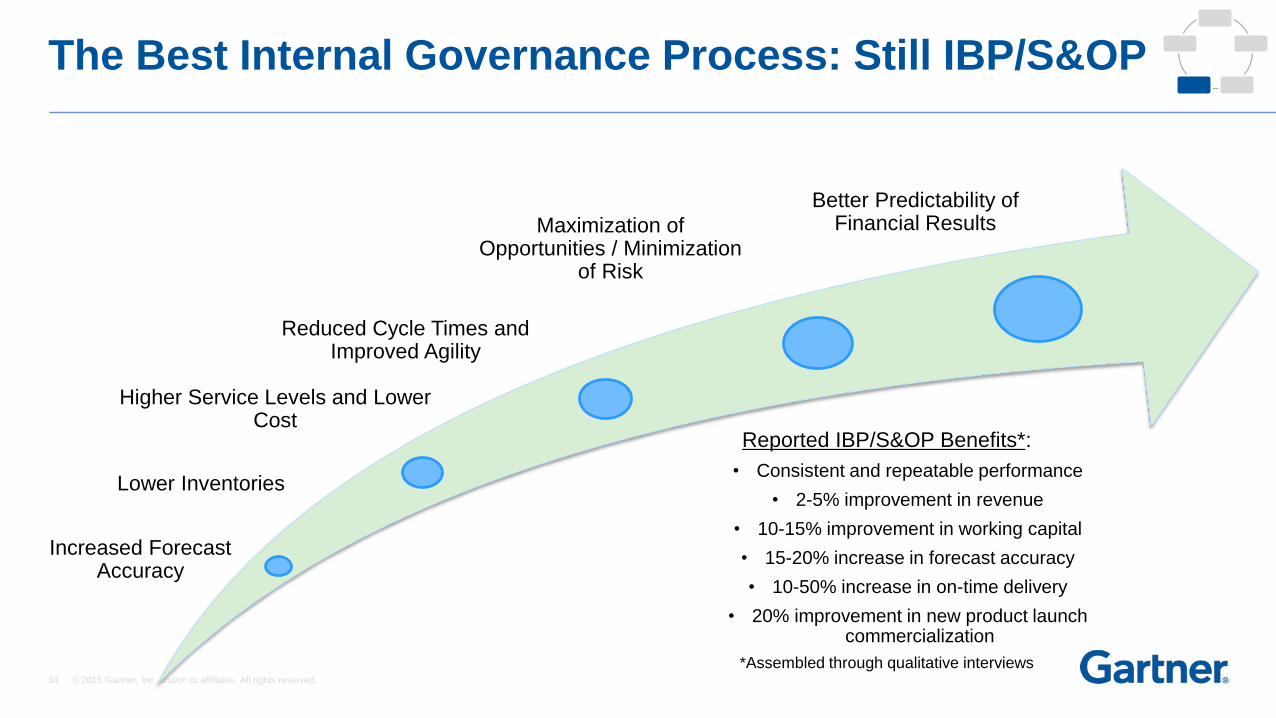
The Best Internal Governance Process: Still IBP/S&OP
Lower Inventories
Higher Service Levels and Lower Cost
Increased Forecast Accuracy
Better Predictability of Financial Results
Reduced Cycle Times and Improved Agility
Reported IBP/S&OP Benefits*:
• Consistent and repeatable performance
• 2-5% improvement in revenue
• 10-15% improvement in working capital
• 15-20% increase in forecast accuracy
• 10-50% increase in on-time delivery
• 20% improvement in new product launch commercialization
*Assembled through qualitative interviews
Maximization of Opportunities / Minimization
of Risk
35 © 2015 Gartner, Inc. and/or its affiliates. All rights reserved.
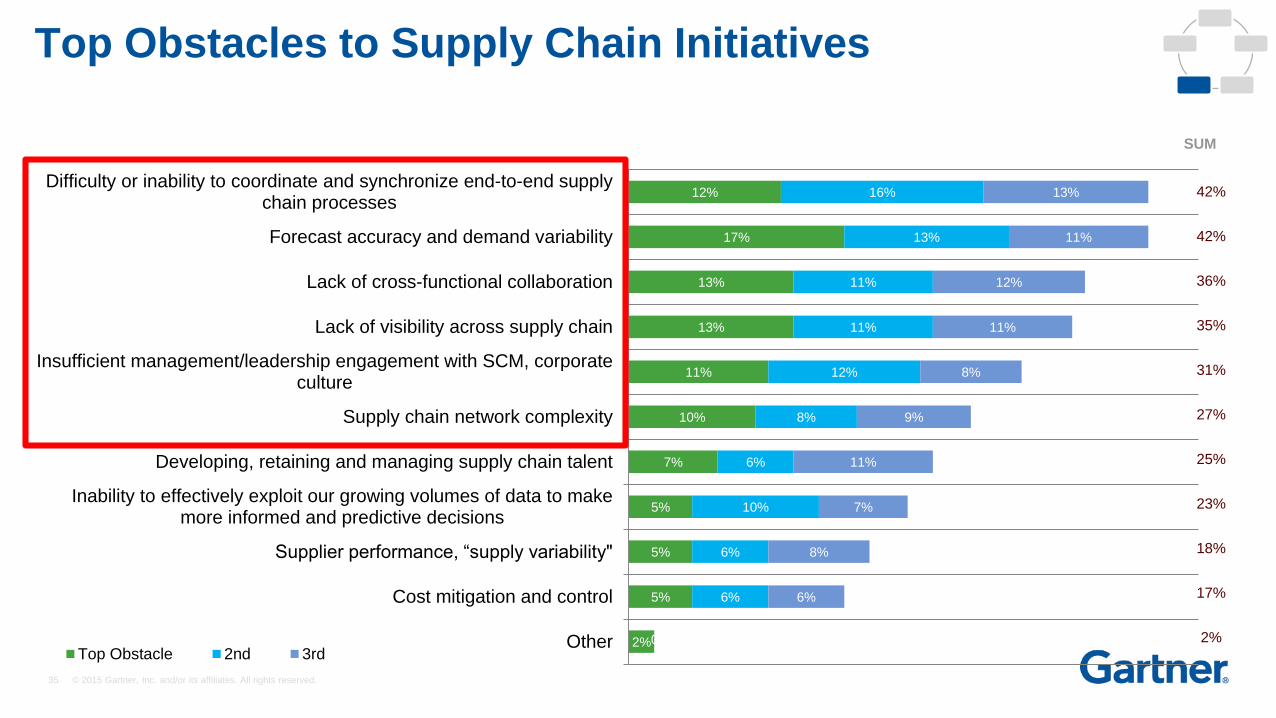
2%
5%
5%
5%
7%
10%
11%
13%
13%
17%
12%
0%
6%
6%
10%
6%
8%
12%
11%
11%
13%
16%
0%
6%
8%
7%
11%
9%
8%
11%
12%
11%
13%
Other
Cost mitigation and control
Supplier performance, “supply variability"
Inability to effectively exploit our growing volumes of data to makemore informed and predictive decisions
Developing, retaining and managing supply chain talent
Supply chain network complexity
Insufficient management/leadership engagement with SCM, corporateculture
Lack of visibility across supply chain
Lack of cross-functional collaboration
Forecast accuracy and demand variability
Difficulty or inability to coordinate and synchronize end-to-end supplychain processes
Top Obstacle 2nd 3rd
SUM
Top Obstacles to Supply Chain Initiatives
42%
42%
36%
35%
31%
27%
25%
23%
18%
17%
2%
36 © 2015 Gartner, Inc. and/or its affiliates. All rights reserved.
44%
35%
32%
36%
34%
29%
35%
25%
27%
24%
21%
19%
21%
17%
31%
39%
40%
36%
38%
43%
35%
38%
33%
34%
36%
38%
35%
35%
25%
26%
28%
28%
28%
28%
30%
37%
40%
42%
43%
43%
44%
48%
Visibility or event management
Analytics or performance management
Sales and Operations planning, Integrated business…
External collaboration (supplier, customer)
Internal cross functional collaboration
Workforce/labor management
New product introduction/Product lifecycle…
Customer service/Service lifecycle management
Core supply chain planning
Transportation management
Sourcing and Procurement
Manufacturing operations
Warehouse management
Order management/fulfillment
Weak/Very Weak (Bottom 2 Box-Net) Middle of the scale (3 rating) Strong/Very Strong (Top 2 Box Net)2
Quality Rating of Key Supply Chain Processes
37 © 2015 Gartner, Inc. and/or its affiliates. All rights reserved.
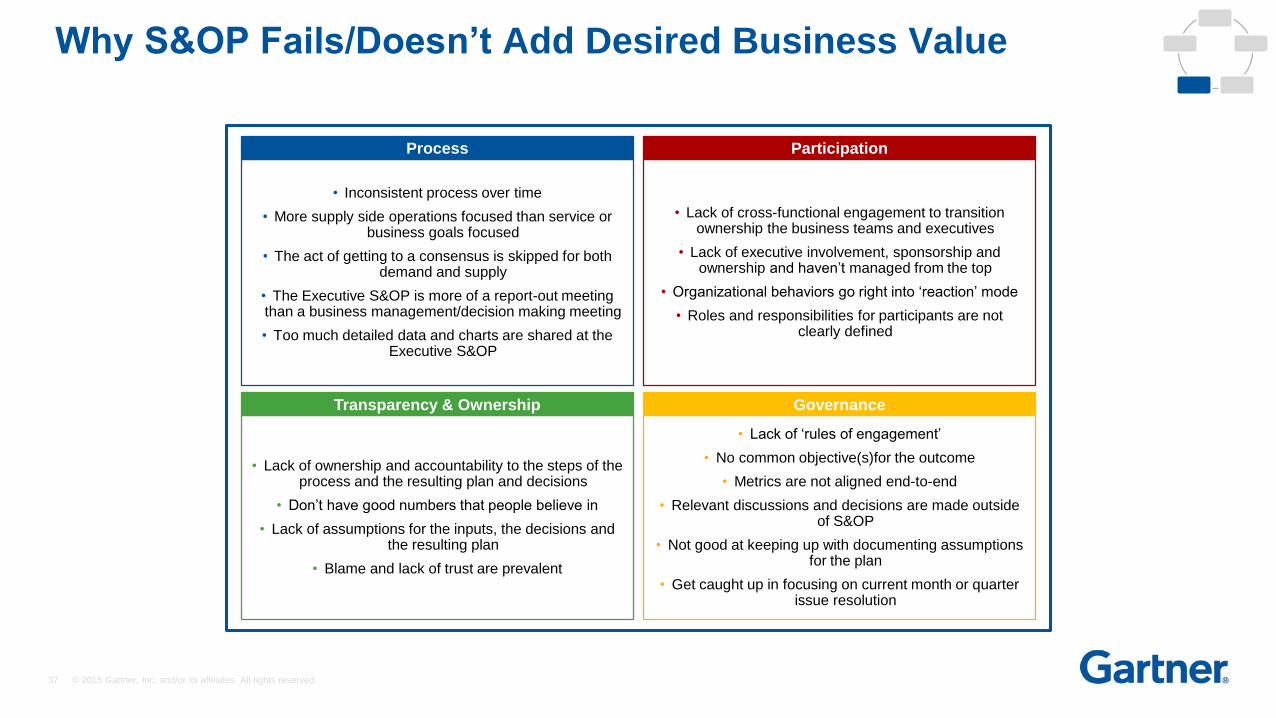
Why S&OP Fails/Doesn’t Add Desired Business Value
• Inconsistent process over time
• More supply side operations focused than service or business goals focused
• The act of getting to a consensus is skipped for both demand and supply
• The Executive S&OP is more of a report-out meeting than a business management/decision making meeting
• Too much detailed data and charts are shared at the Executive S&OP
Process
• Lack of cross-functional engagement to transition ownership the business teams and executives
• Lack of executive involvement, sponsorship and ownership and haven’t managed from the top
• Organizational behaviors go right into ‘reaction’ mode
• Roles and responsibilities for participants are not clearly defined
Participation
• Lack of ownership and accountability to the steps of the process and the resulting plan and decisions
• Don’t have good numbers that people believe in
• Lack of assumptions for the inputs, the decisions and the resulting plan
• Blame and lack of trust are prevalent
Transparency & Ownership
• Lack of ‘rules of engagement’
• No common objective(s)for the outcome
• Metrics are not aligned end-to-end
• Relevant discussions and decisions are made outside of S&OP
• Not good at keeping up with documenting assumptions for the plan
• Get caught up in focusing on current month or quarter issue resolution
Governance
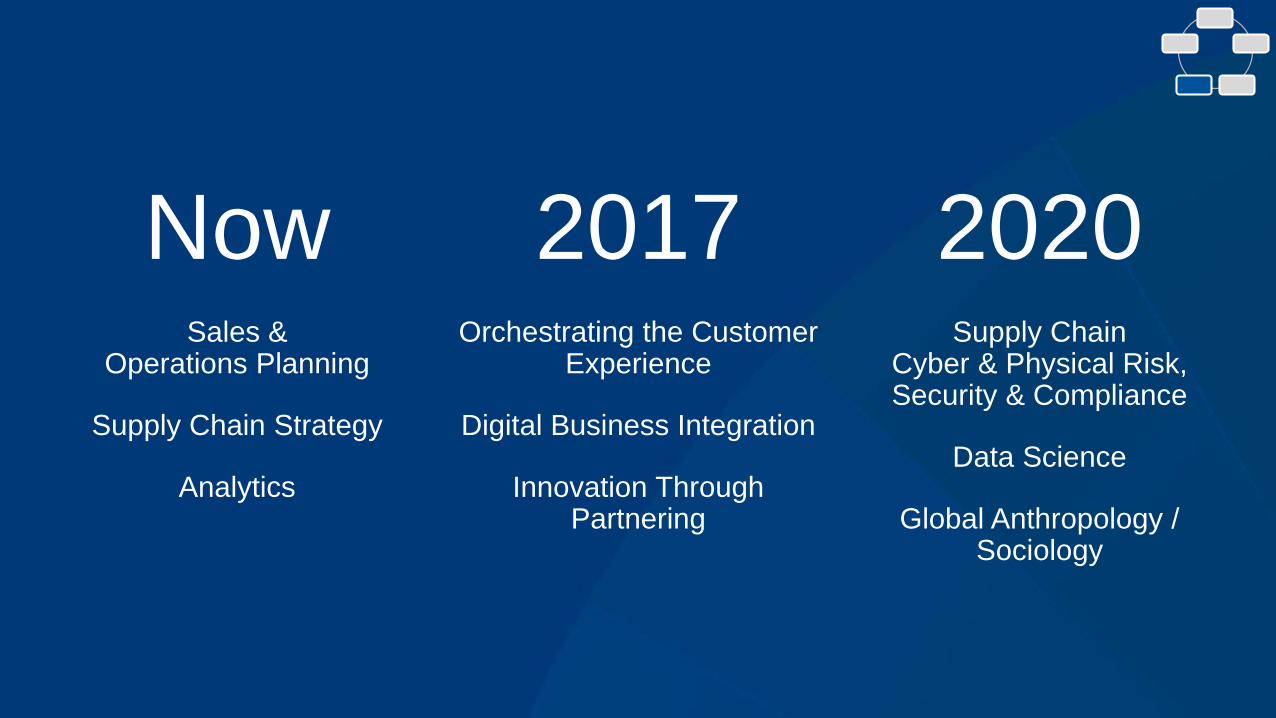
Now 2017 2020Sales &
Operations Planning
Supply Chain Strategy
Analytics
Orchestrating the Customer Experience
Digital Business Integration
Innovation Through Partnering
Supply Chain Cyber & Physical Risk, Security & Compliance
Data Science
Global Anthropology / Sociology
39 © 2015 Gartner, Inc. and/or its affiliates. All rights reserved.
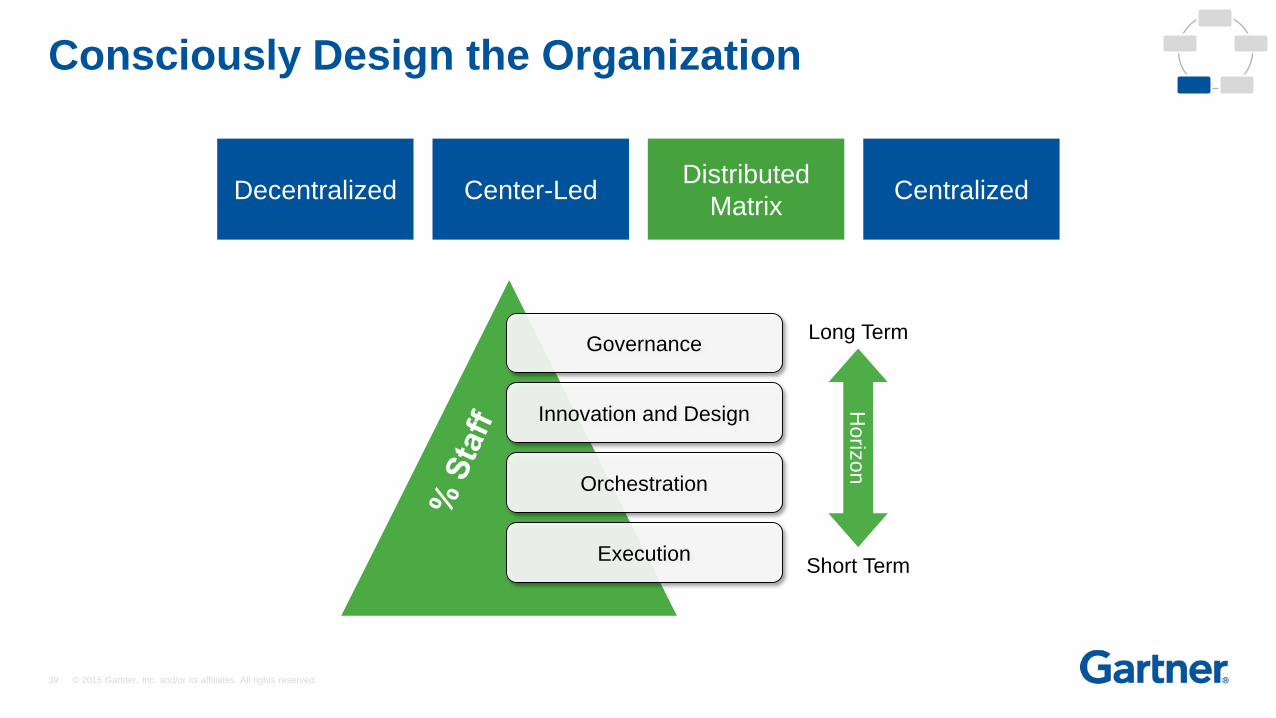
Consciously Design the Organization
Decentralized Center-LedDistributed
MatrixCentralized
Governance
Innovation and Design
Orchestration
Execution
Horiz
on
Short Term
Long Term
40 © 2015 Gartner, Inc. and/or its affiliates. All rights reserved.
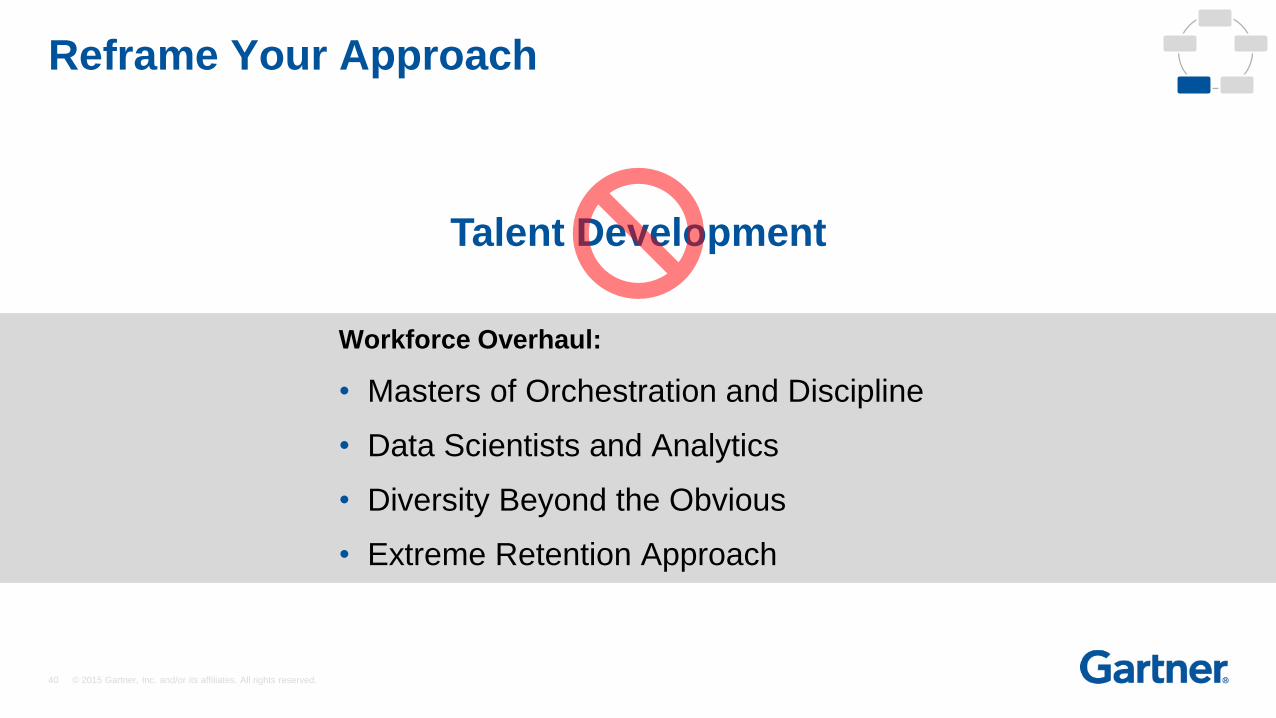
Talent Development
Workforce Overhaul:
• Masters of Orchestration and Discipline
• Data Scientists and Analytics
• Diversity Beyond the Obvious
• Extreme Retention Approach
Reframe Your Approach
41 © 2015 Gartner, Inc. and/or its affiliates. All rights reserved.
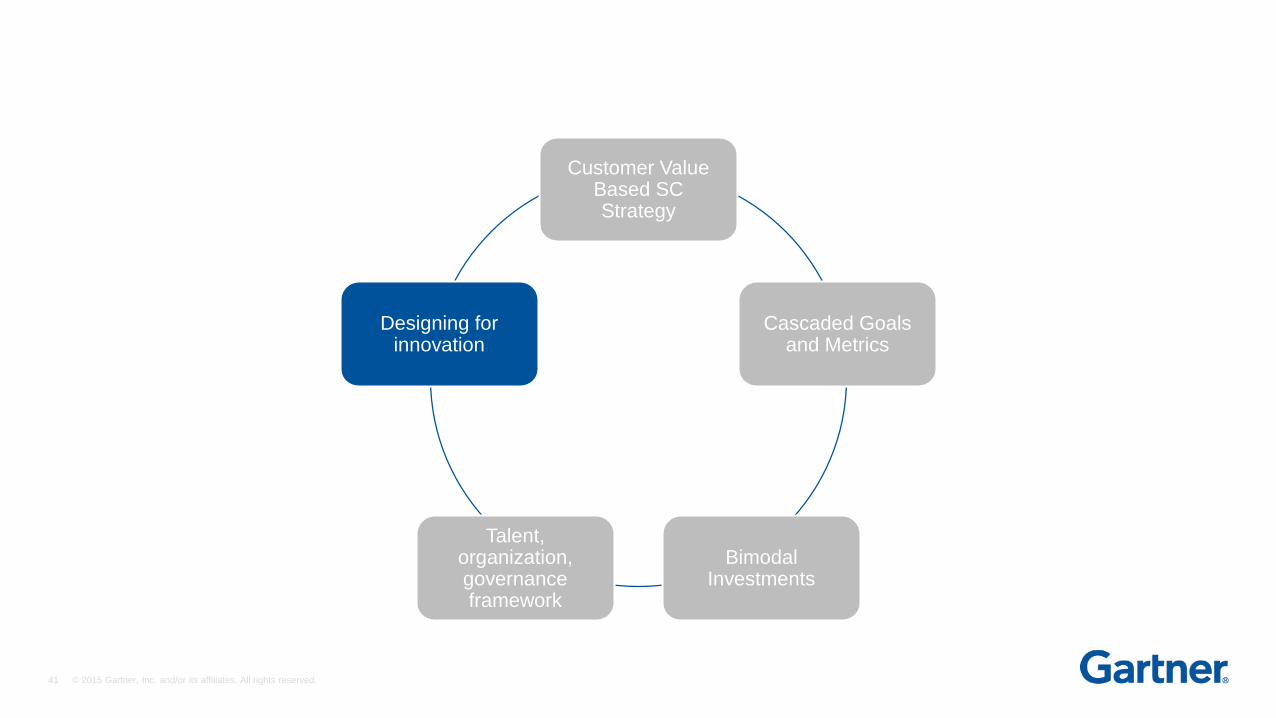
Customer ValueBased SC Strategy
Cascaded Goals and Metrics
Bimodal Investments
Talent, organization, governance framework
Designing for innovation
42 © 2015 Gartner, Inc. and/or its affiliates. All rights reserved.
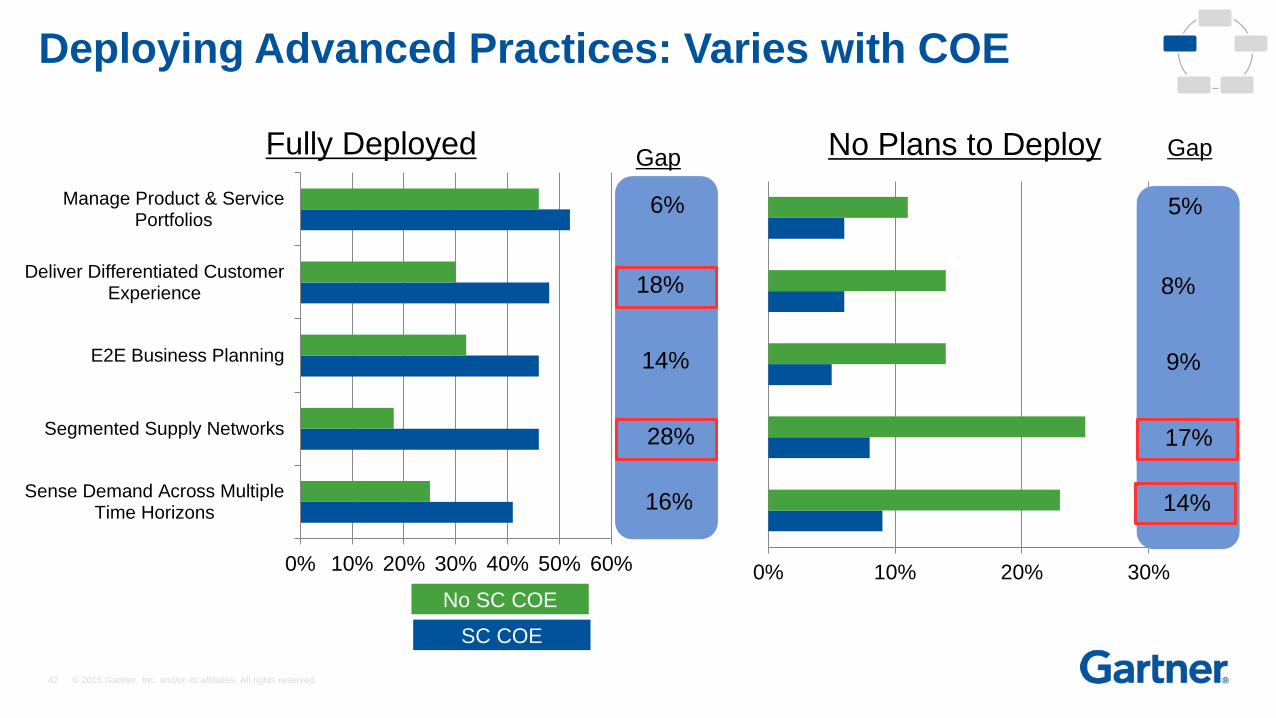
No SC COE
SC COE
Fully Deployed
0% 10% 20% 30% 40% 50% 60%
Sense Demand Across MultipleTime Horizons
Segmented Supply Networks
E2E Business Planning
Deliver Differentiated CustomerExperience
Manage Product & ServicePortfolios
Gap
6%
18%
14%
28%
16%
0% 10% 20% 30%
No Plans to Deploy
5%
8%
9%
17%
14%
Gap
Deploying Advanced Practices: Varies with COE
43 © 2015 Gartner, Inc. and/or its affiliates. All rights reserved.
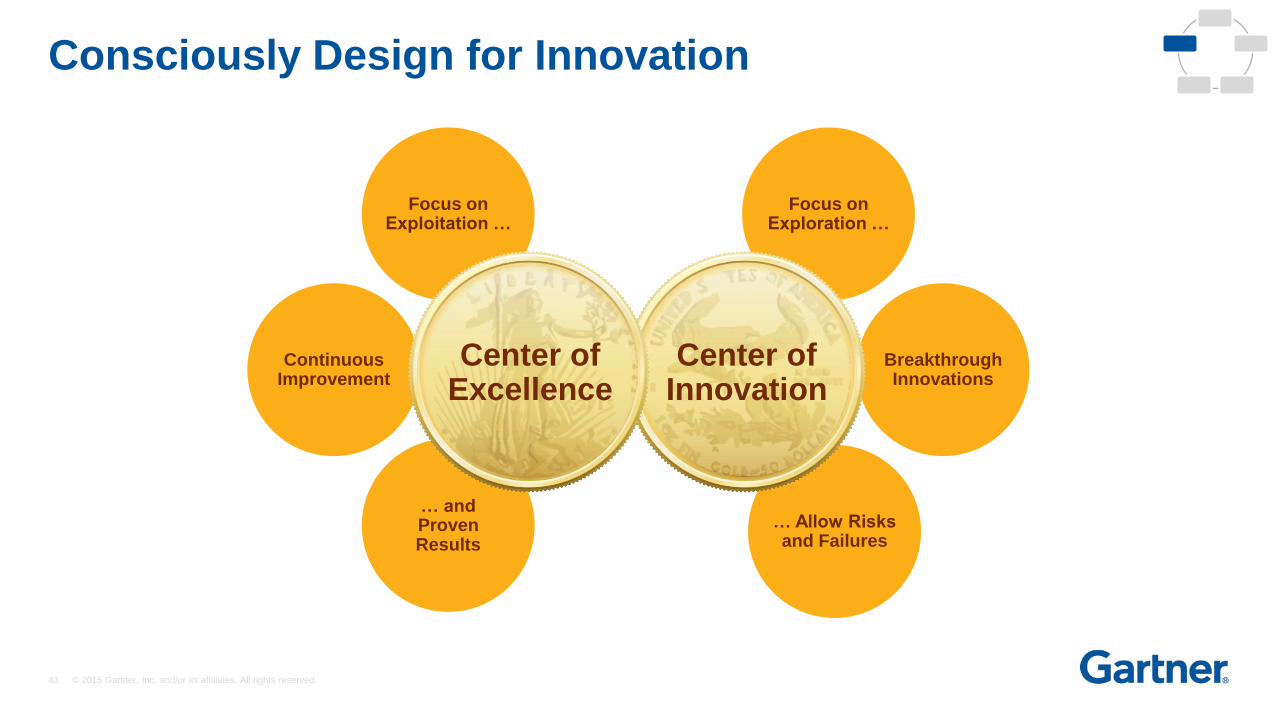
Consciously Design for Innovation
ContinuousImprovement
Focus onExploitation …
… andProvenResults
BreakthroughInnovations
Focus onExploration …
… Allow Risksand Failures
Center ofExcellence
Center ofInnovation
44 © 2015 Gartner, Inc. and/or its affiliates. All rights reserved.
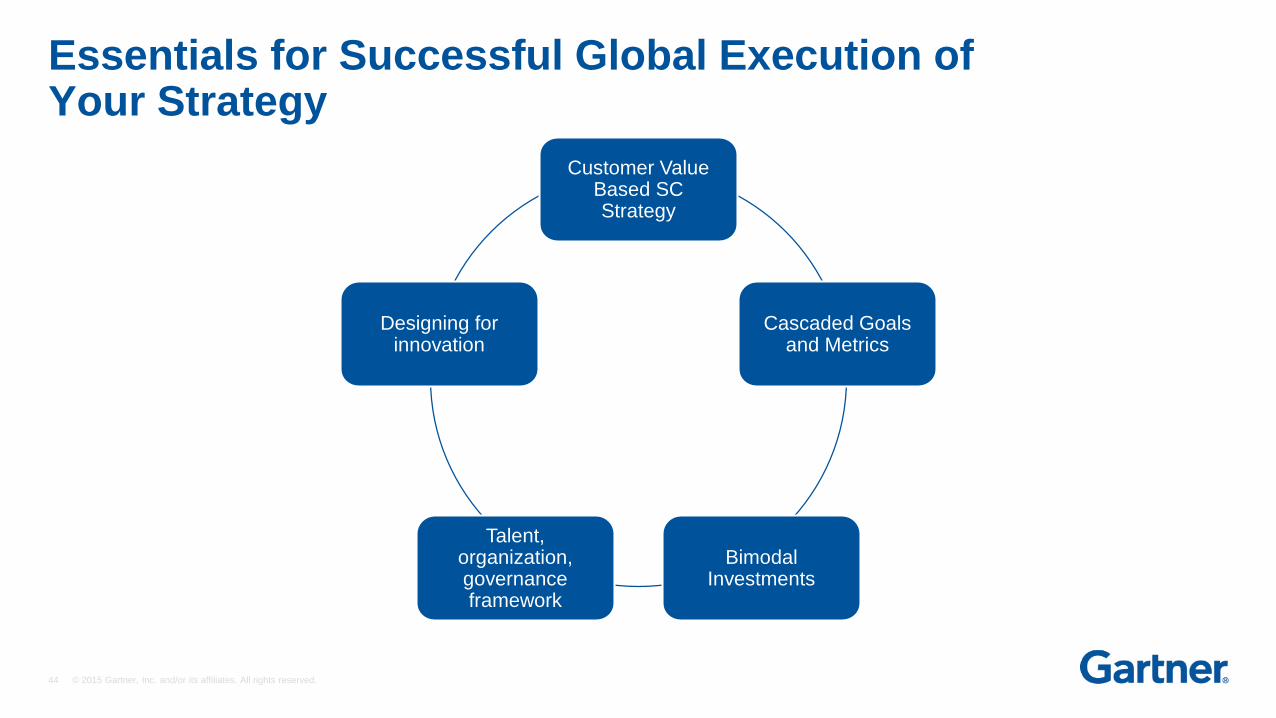
Essentials for Successful Global Execution of Your Strategy
Customer ValueBased SC Strategy
Cascaded Goals and Metrics
Bimodal Investments
Talent, organization, governance framework
Designing for innovation
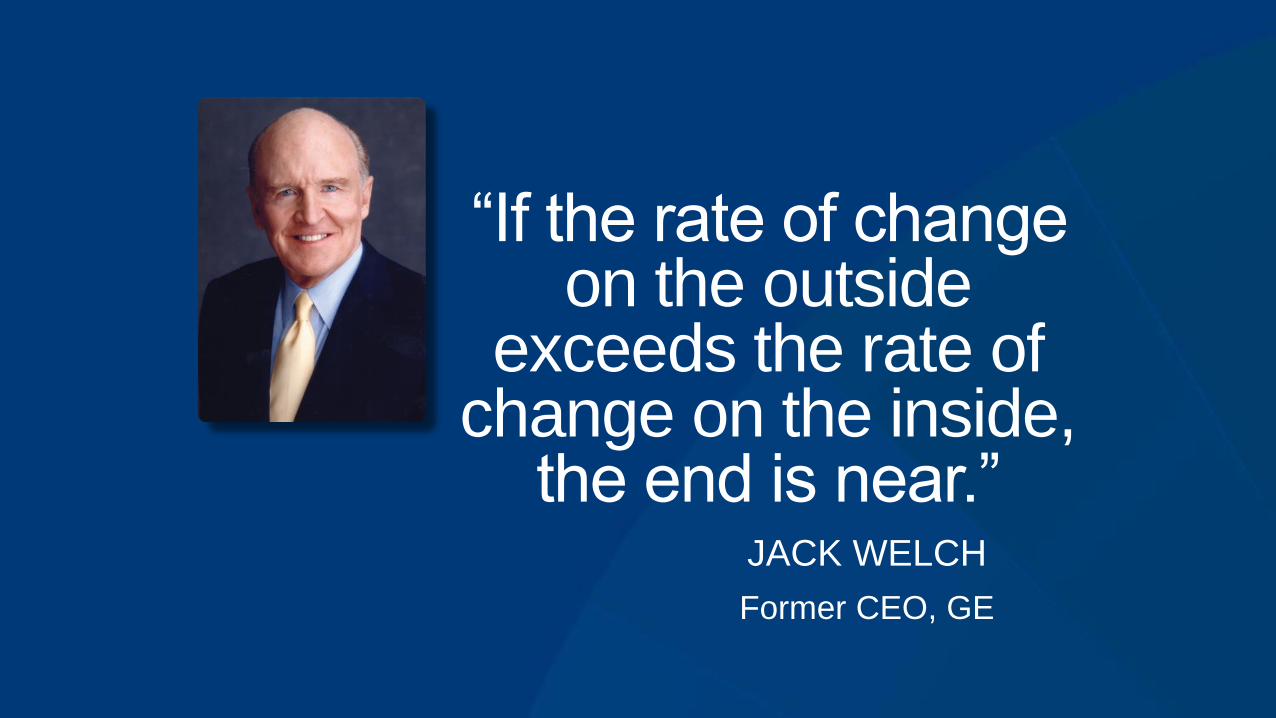
“If the rate of change on the outside
exceeds the rate of change on the inside,
the end is near.”JACK WELCH
Former CEO, GE

YOUCAN DO
IT