Embed Size (px)
Citation preview
University of South CarolinaScholar Commons
Theses and Dissertations
2016
Implementation Of Agile Project Management InThe ClassroomMichael Jerrod MyersUniversity of South Carolina
Follow this and additional works at: https://scholarcommons.sc.edu/etd
Part of the Business Administration, Management, and Operations Commons, and theEngineering Commons
This Open Access Thesis is brought to you by Scholar Commons. It has been accepted for inclusion in Theses and Dissertations by an authorizedadministrator of Scholar Commons. For more information, please contact [email protected].
Recommended CitationMyers, M. J.(2016). Implementation Of Agile Project Management In The Classroom. (Master's thesis). Retrieved fromhttps://scholarcommons.sc.edu/etd/3953
IMPLEMENTATION OF AGILE PROJECT MANAGEMENT IN THE CLASSROOM
by
Michael Jerrod Myers
Bachelor of Science
University of South Carolina, 2014
Submitted in Partial Fulfillment of the Requirements
For the Degree of Master of Science in
Engineering Management
College of Engineering and Computing
University of South Carolina
2016
Accepted by:
Roger Dougal, Director of Thesis
Keith Plemmons, Reader
Cheryl L. Addy, Vice Provost and Dean of the Graduate School

ii
© Copyright by Michael Jerrod Myers, 2016
All Rights Reserved.
iii
ABSTRACT
The world of engineering and engineering practices is advancing rapidly. In
response to this rapid change, engineering education practices have to advance to ensure
students are properly trained for the workforce. The purpose of this report is to address
and substantiate the hypothesis that if engineering instruction incorporated Agile project
management methods, then students will be challenged by professors to accomplish
course objectives with a systematic and timely approach that will improve assessment
performance metrics and present the framework of how agile methods of project
management can be integrated into the classroom. The agile methods incorporated will
also encourage the use of industry-related soft skills; emphasizing accountability,
resourcefulness, team building, and interpersonal skills. From this framework, the idea
that instructors have the ability to manage their students and accomplish course
objectives in a timely manner, similar to the engineering industry practices, even when
presented with impromptu absentees or cancellations, is plausible. The proposed method
to substantiate this hypothesis was the implementation of a flipped classroom and using
scrumban agile methods within a General and Honors classroom setting. Due to design
and time limitations, only the Kanban Board was implemented into the Honors section
for study. The results of the study showed the Honors section performance metrics
decrease. With the limitations of the experiment, the hypothesis was rendered
inconclusive. In moving forward, obstacles that were present (hurricane cancellations

iv
and guest instructors) are still believed to be mitigated with full experiment
implementation.
v
TABLE OF CONTENTS
ABSTRACT .......................................................................................................................... iii
LIST OF FIGURES ................................................................................................................. vi
CHAPTER 1: INTRODUCTION ..................................................................................................1
CHAPTER 2: BACKGROUND ...................................................................................................4
2.1 WHAT IS PROJECT MANAGEMENT? .......................................................................4
2.2 STANDARD INSTRUCTIONAL APPROACH ................................................................6
2.3 BLOOM’S TAXONOMY ...........................................................................................8
2.4 THE FLIPPED CLASSROOM ...................................................................................10
2.5 WHAT IS AGILE PROJECT MANAGEMENT?...........................................................10
2.6 AGILE IN THE CLASSROOM ..................................................................................12
2.7 AGILE TECHNIQUE: SCRUM + KANBAN = SCRUMBAN .........................................14
CHAPTER 3: METHODOLOGY ..............................................................................................18
3.1 PROPOSED METHODOLOGY .................................................................................18
3.2 IMPLEMENTED METHODOLOGY ...........................................................................20
CHAPTER 4: RESULTS/DISCUSSION .....................................................................................22
CHAPTER 5: CONCLUSION/FUTURE IMPLICATIONS ..............................................................34
WORKS CITED .....................................................................................................................37
APPENDIX A: DIFFERENTIATED INSTRUCTION: CHECKLIST AND
5 STEP LESSON PLAN ................................................................................................40
APPENDIX B: STUDENT SURVEY QUESTIONS ........................................................................42
vi
LIST OF FIGURES
Figure 2.1 Incremental Project Development ......................................................................7
Figure 2.2 Waterfall Project Management Flowchart ..........................................................7
Figure 2.3 Bloom’s Taxonomy ............................................................................................9
Figure 2.4 Circular Project Development ..........................................................................11
Figure 2.5 Agile Project Management Flowchart ..............................................................11
Figure 2.6 Agile v. Waterfall Graphical Comparison ........................................................12
Figure 2.7 Scrum Graphical Process ..................................................................................14
Figure 2.8 Kanban Wall .....................................................................................................16
Figure 2.9 Scrumban Diagram ...........................................................................................16
Figure 3.1 Kanban Board Used for Experiment Week 2 ...................................................18
Figure 4.1 General Section Grade Analysis .......................................................................22
Figure 4.2 General Section Time Analysis ........................................................................23
Figure 4.3 Honors Week 0 .................................................................................................24
Figure 4.4 Honors Week 0 v. Week 1 ................................................................................24
Figure 4.5 Week 3 Observations ........................................................................................25
Figure 4.6 Exam Trend Analysis .......................................................................................26
Figure 4.7 Exam Duration Week 0 ....................................................................................26
Figure 4.8 Exam Duration Honors Comparison ................................................................27
Figure 4.9 Honors Section Time Analysis .........................................................................28
Figure 4.10 Exam Time Trend Analysis ............................................................................29

vii
Figure 4.11 Honors Question Breakdown .........................................................................30
Figure 4.12 Honors Section Questions Analysis ...............................................................31
Figure 4.13 Honors Section Probability Analysis .............................................................31
1
CHAPTER 1: INTRODUCTION
The world of engineering and engineering practices is advancing rapidly. In
response to this rapid change, engineering education practices have to advance to ensure
students are properly trained for the workforce. Engineering schools play a huge role in
molding this shifting landscape as they prepare students to operate within engineering
industry. Pursuant to the American Society for Engineering Education (ASEE) Executive
Director, Don L. Millard, “Engineering schools are heavily influenced by academic
traditions that don’t always support the profession’s needs. Students abandon engineering
in part due to a lack of connection between what is studied and perceived as exciting
practice.” [1]. To improve the connection between the theory and the application,
engineering professors can adjust instructional approaches that better relate theoretical
knowledge to practical application.
The National Society of Professional Engineers (NSPE), in accordance with
ABET's Engineering Criteria 2000, stated, “…all U.S. engineering departments will have
to demonstrate that besides having a firm grasp of science, mathematics and engineering
fundamentals, their graduates possess communication, multidisciplinary teamwork, and
lifelong learning skills and awareness of social and ethical considerations associated with
the engineering profession,” [2]. Recurring conversations about the balance of
educational fundamentals and industry-related soft skills have encouraged university
administrators and professors to investigate and adjust aspects of traditional instructional
2
methods for engineering education. These conversations present a level of uncertainty for
transforming instructional approaches. It is plausible that instructors may feel that
commitment to implementing new instructional approaches will leave them with
insufficient time to pursue other academic responsibilities. Pursuant to Professional
Policy No. 14 of the NSPE, “engineering education is considered to be the foundation of
the engineering profession. The NSPE believes engineering educational programs must
prepare graduates for the practice of engineering at a professional level.”
The NSPE holds consistent values and belief in what engineering education and
instruction should encompass, including:
Encouraging schools to develop creative and imaginative programs as new
approaches to engineering education.
Strong belief that engineering curricula should incorporate instruction designed to
instill engineering students with professional concepts.
Instruction should emphasize the primary purpose of the profession as being the
pursuit of a learned art in the spirit of public service.
Professional concepts brought to the attention of the student should be the
responsibility of all engineering faculty [2].
In instilling these values and beliefs, an opportunity exists to apply agile methods of
project management (adaptive and iterative processes) to engineering instruction to
promote student analytical learning. The hypothesis being addressed is if engineering
instruction incorporated Agile project management methods, then students will be
challenged by professors to accomplish course objectives with a systematic and timely
3
approach that will improve assessment performance metrics. The agile methods
incorporated will also encourage the use of industry-related soft skills; emphasizing
accountability, resourcefulness, team building, and interpersonal skills. This emphasis
will help in leading to the improvement of student learning, engineering application, and
career readiness. The goal of this thesis is to substantiate the hypothesis and present a
framework of how agile methods of project management can be integrated into the
classroom. From this framework, the idea that instructors have the ability to manage
their students and accomplish course objectives in a timely manner, even when presented
with impromptu absentees or cancellations, is plausible. From the Project Management
Institute (PMI) (2013a) Pulse of the Profession report, “organizations with developed
project management practices, benefits realization processes, portfolio management
practices and program management practices and those with high organizational agility
all have significantly better project outcomes than their counterparts who are less
advanced in their project management practices” (p.11) [3]. In order to understand how
agile methods can be used effectively within the classroom, project management
practices must first be properly and thoroughly understood for readers.
4
CHAPTER 2: BACKGROUND
2.1 What is Project Management?
Project management is the application of knowledge, skills, tools, and techniques to
project activities to meet the project requirements. It is accomplished through the
appropriate application and integration of five process groups:
1. Initiating
a. Selection of the best project given resource limits
b. Recognizing the benefits of the project
c. Preparation of the documents to sanction the project
d. Assigning of the project manager
2. Planning
a. Definition of the work requirements
b. Definition of the quality and quantity of work
c. Definition of the resources needed
d. Scheduling the activities
e. Evaluation of the various tasks
3. Executing
a. Negotiating for the project team members
b. Directing and managing the work
c. Working with the team members to help them improve
5
4. Monitoring and Controlling
a. Tracking progress
b. Comparing actual outcome to predicted outcome
c. Analyzing variances and impacts
d. Making adjustments
5. Closing
a. Verifying that all of the work has been accomplished [4]
Managing a project includes:
Identifying requirements
Addressing the various needs, concerns, and expectations of the stakeholders in
planning and executing the project.
Setting up, maintaining, and carrying out communications among stakeholders
that are active, effective, and collaborative in nature.
Managing stakeholders towards meeting project requirements and creating project
deliverables
Balancing the competing project constraints
The project team works to assess the situation, balance the demands, and maintain
proactive communication to deliver a successful project. Iterations develop the product
through a series of repeated cycles, while increments successfully add to the functionality
of the product. These iterations lead to the life cycle of the project to become adaptive or
agile and incremental. Adaptive life cycles are intended to respond to high levels of
change and ongoing stakeholder involvement [5]. Within the engineering environment,
6
these changes may include new research techniques, new engineering instruments,
common industry-related practices, and impromptu changes in class meeting times,
ranging from cancellations to additional study sessions organized by instructors.
2.2 Standard Instructional Approach
Project Management methods and ideologies can be related to current instructional
approaches in education. A standard instructional approach within the classroom
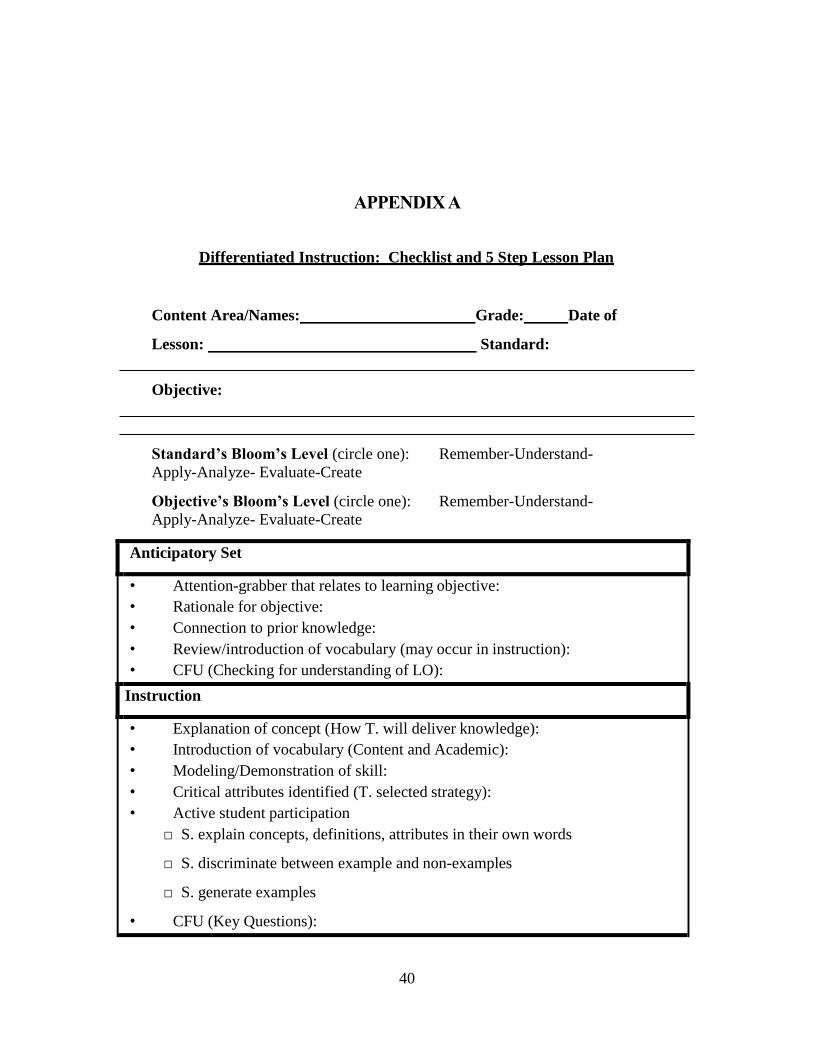
resembles (see Appendix A):
1. Anticipatory Set – the instructor reviews prior knowledge and begins introducing
a new concept.
2. Instruction – the instructor explains the new concept/skill and demonstrates.
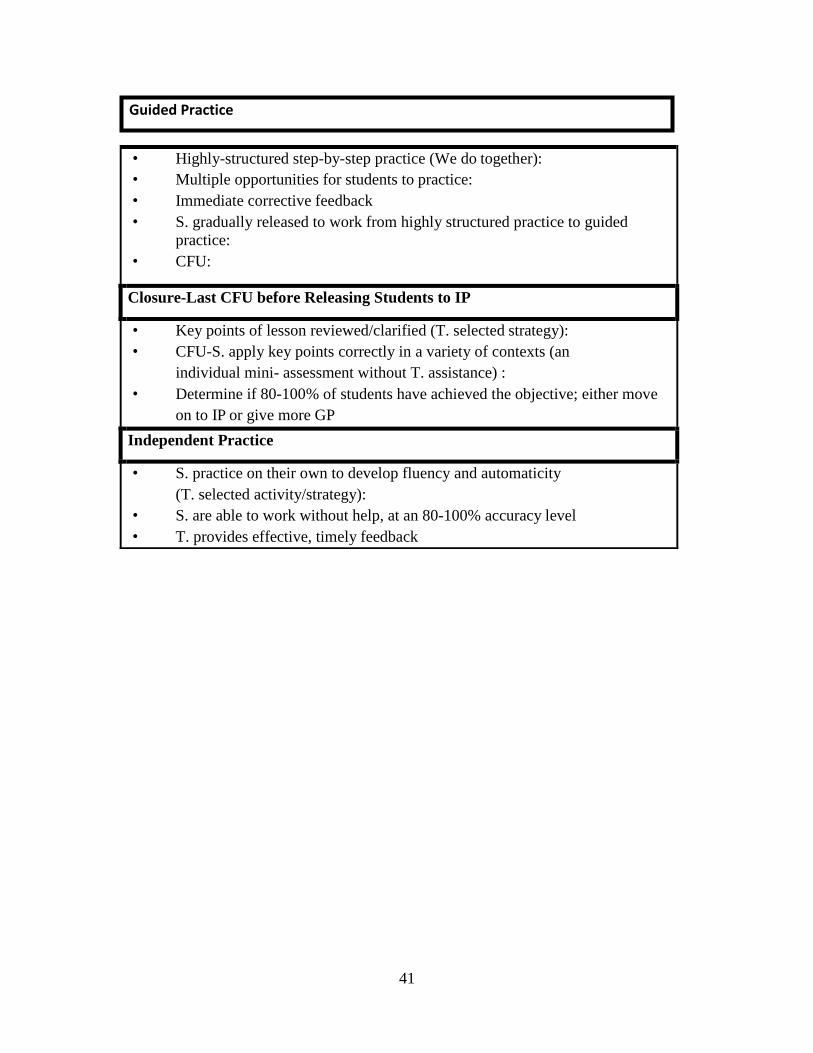
3. Guided Practice – these are practice problems or scenarios in which corrective
feedback for understanding is immediate.
4. Closure – This is the review section of the lesson and provides clarity.
5. Independent Practice – this step includes homework and take-home projects.
6. Results Survey – this step provides feedback on the lesson, including material
questions and instructional approach.
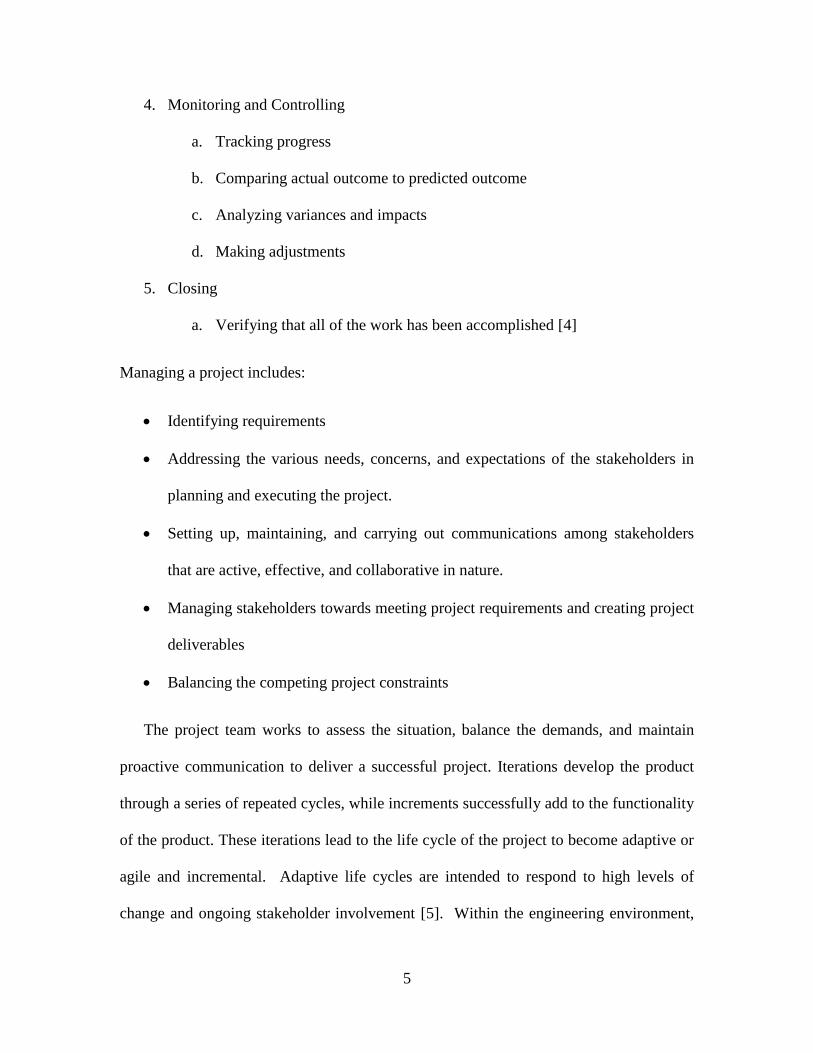
This instruction style is incremental in the development of the information but
relating lessons to the complete outcome of the course can be difficult when learned skills
and instructional approach are not audited frequently through feedback sessions. A
model without auditing and feedback session is shown in Figure 1.
7
Figure 2.1: Incremental Project Development
The x-axis of Figure 2.1 is the time of completion for the project [12]. The y-axis
denotes the total amount of work that needs to be completed at the beginning. As time
goes on, the work decreases incrementally but the work decrease is dependent upon the
previous stage of work. This one-way model is similar to the Waterfall approach to
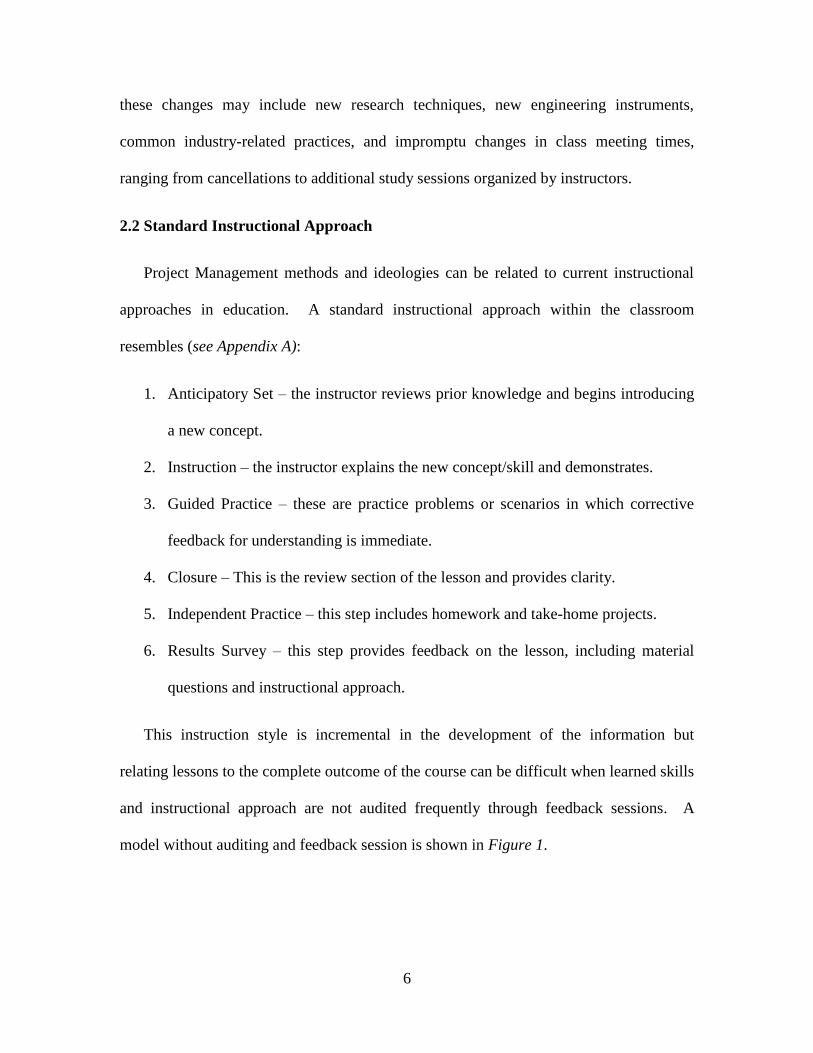
project management. The waterfall approach to project management is a non-iterative
design process in which progress is seen as flowing steadily downwards through the
phases of discovery, design, development, and testing. In the Waterfall approach, each
step is incremental but does not provide a flexible approach to the material being
presented if a change to objectives were to be made. A graphical representation is shown
below in Figure 2.2 [12].
Figure 2.2: Waterfall Project Management Flowchart
8
The Anticipatory Set relates to the Discover and Design stages, planning the
approach and methods that are to be used in instruction. The Instruction and Guided
Practice Steps correlate with the Develop stage to build and develop the skill that is being
taught. The Test stage encompasses the Closure and Independent Practice steps as the
information or skill should be ready for practical use. With the standard instructional
approach relating to the Waterfall method, planning instruction is mainstreamed.
However, what if there is a change (i.e. an added day of instruction) or lack of production
(i.e. below average test scores) in one of those stages? How would the project team react
to help solve the issue immediately? The waterfall method does not provide recourse for
unexpected changes. The use of Bloom’s Taxonomy helps identify where agile methods
come into play.
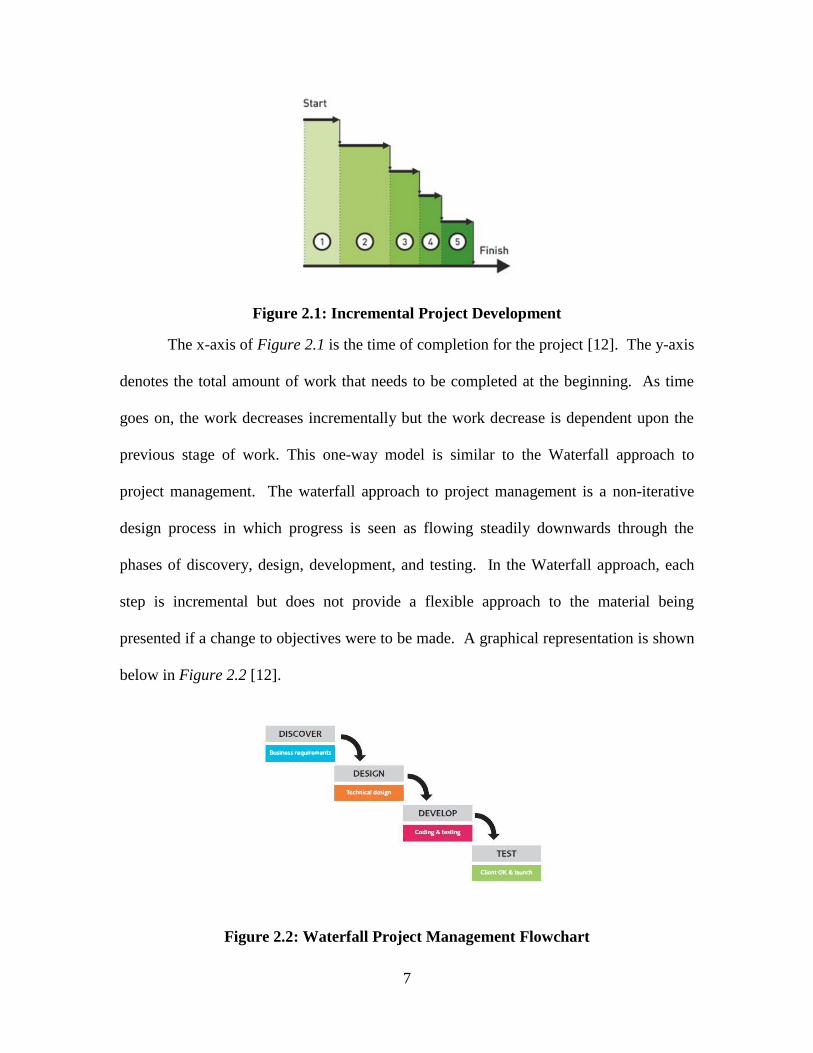
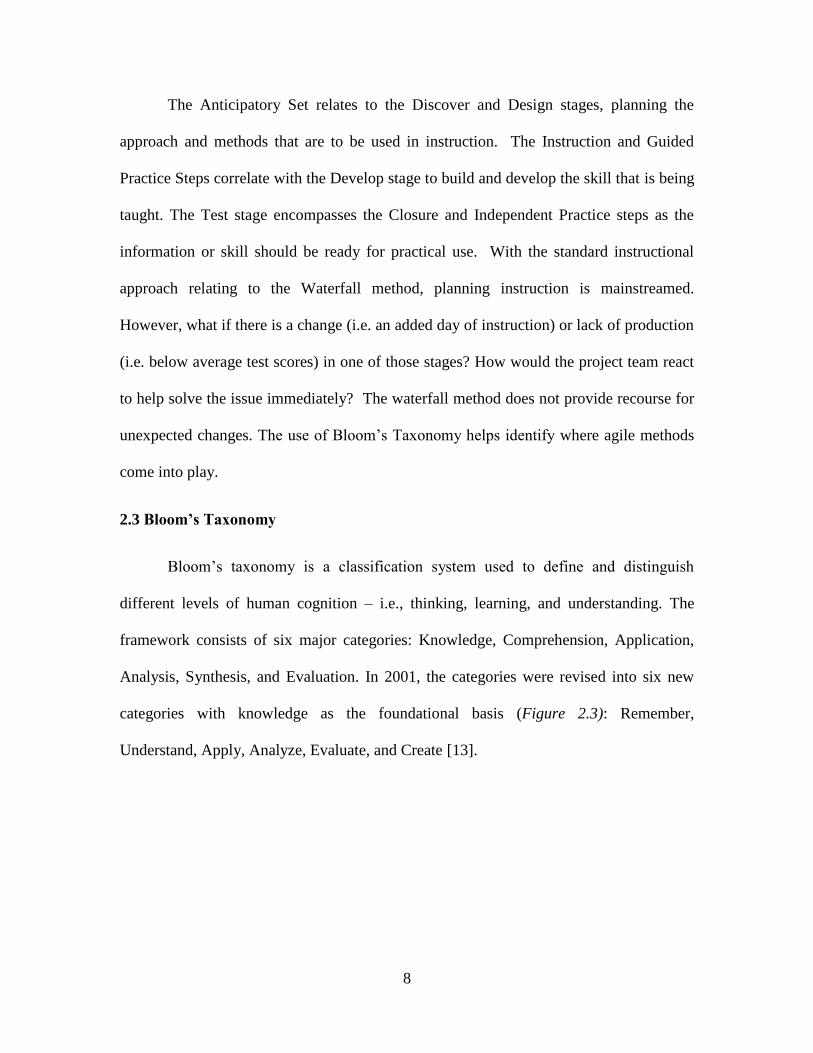
2.3 Bloom’s Taxonomy
Bloom’s taxonomy is a classification system used to define and distinguish
different levels of human cognition – i.e., thinking, learning, and understanding. The
framework consists of six major categories: Knowledge, Comprehension, Application,
Analysis, Synthesis, and Evaluation. In 2001, the categories were revised into six new
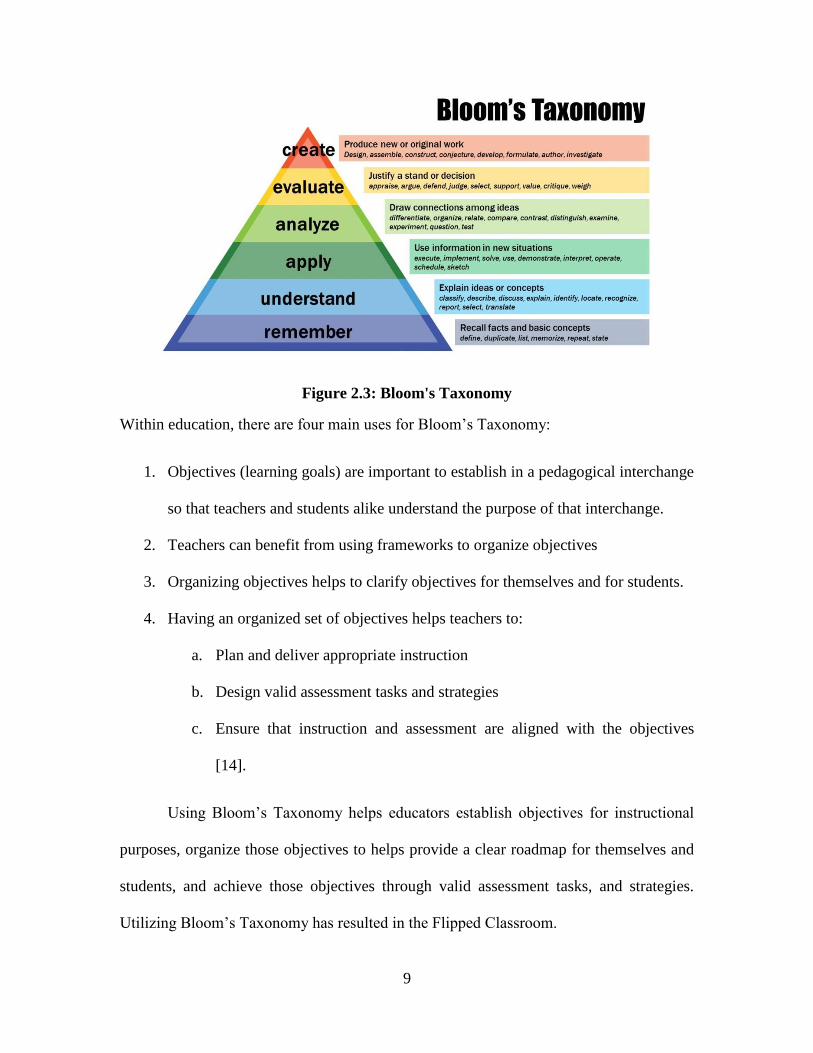
categories with knowledge as the foundational basis (Figure 2.3): Remember,
Understand, Apply, Analyze, Evaluate, and Create [13].
9
Figure 2.3: Bloom's Taxonomy
Within education, there are four main uses for Bloom’s Taxonomy:
1. Objectives (learning goals) are important to establish in a pedagogical interchange
so that teachers and students alike understand the purpose of that interchange.
2. Teachers can benefit from using frameworks to organize objectives
3. Organizing objectives helps to clarify objectives for themselves and for students.
4. Having an organized set of objectives helps teachers to:
a. Plan and deliver appropriate instruction
b. Design valid assessment tasks and strategies
c. Ensure that instruction and assessment are aligned with the objectives
[14].
Using Bloom’s Taxonomy helps educators establish objectives for instructional
purposes, organize those objectives to helps provide a clear roadmap for themselves and
students, and achieve those objectives through valid assessment tasks, and strategies.
Utilizing Bloom’s Taxonomy has resulted in the Flipped Classroom.
10
2.4 The Flipped Classroom
A Flipped Classroom insists that students gain first exposure to new material outside
of class, usually via reading or videos. The students and professor use class time to focus
on the assimilation of that knowledge through problem-solving, discussion, or debates. In
regards to Bloom’s revised taxonomy, students are performing the lower levels of
cognitive work (remember and understand) outside of the classroom, and focusing on the
higher levels of cognitive work (apply, analyze, evaluate, and create) in class, where they
have the resources of their peers and instructor. The Flipped Classroom consists of and
provides four key elements:
1. Provide an opportunity for students to gain first exposure prior to class.
2. Provide an incentive for students to prepare for class.
3. Provide a mechanism to assess student understanding.
4. Provide in-class activities that focus on higher level cognitive activities.
These four elements of the flipped classroom compliment the use of agile project
management and agile feedback methods [13].
2.5 What is AGILE Project Management?
Agile project management is an adaptive, iterative process that focuses on
customer value first, team interaction over tasks, and adapting to current business reality
rather than following a prescriptive plan. Agile uses facilitated work sessions, called
sprints, to establish a shared understanding of the problem, the solution, and the plan.
Agile methods are useful in constantly relating the work completed during sprints to the
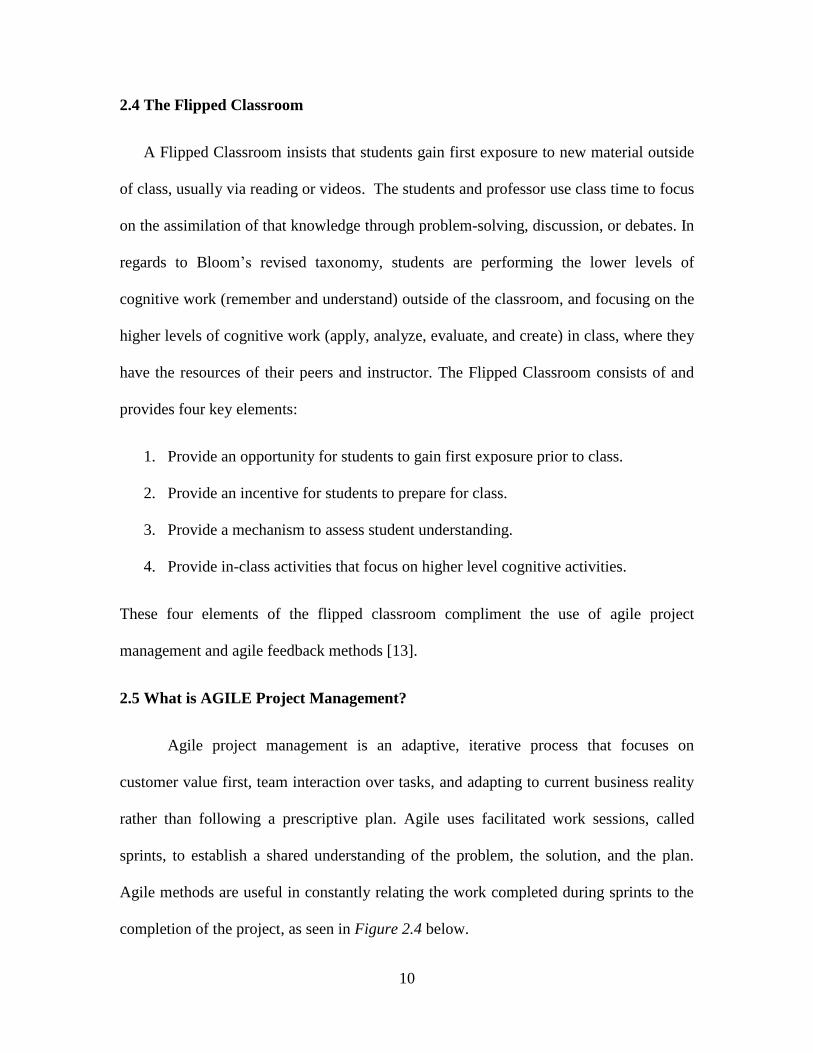
completion of the project, as seen in Figure 2.4 below.
11
Figure 2.4: Circular Project Development
In Figure 2.4, the circular development of a project through agile methods
indicate that from each cycle that is conducted, the final product deliverable is considered
finish at some level and ready to deployment [12]. After the first cycle, the product is
considered deliverable to an extent and so on until the final cycle and final product.
Using agile methods results in each step of the project contributing to the final outcome
by providing a result that can be functionally used at every stage of completion. Agile
project management helps in finding the source of the problem quickly through frequent
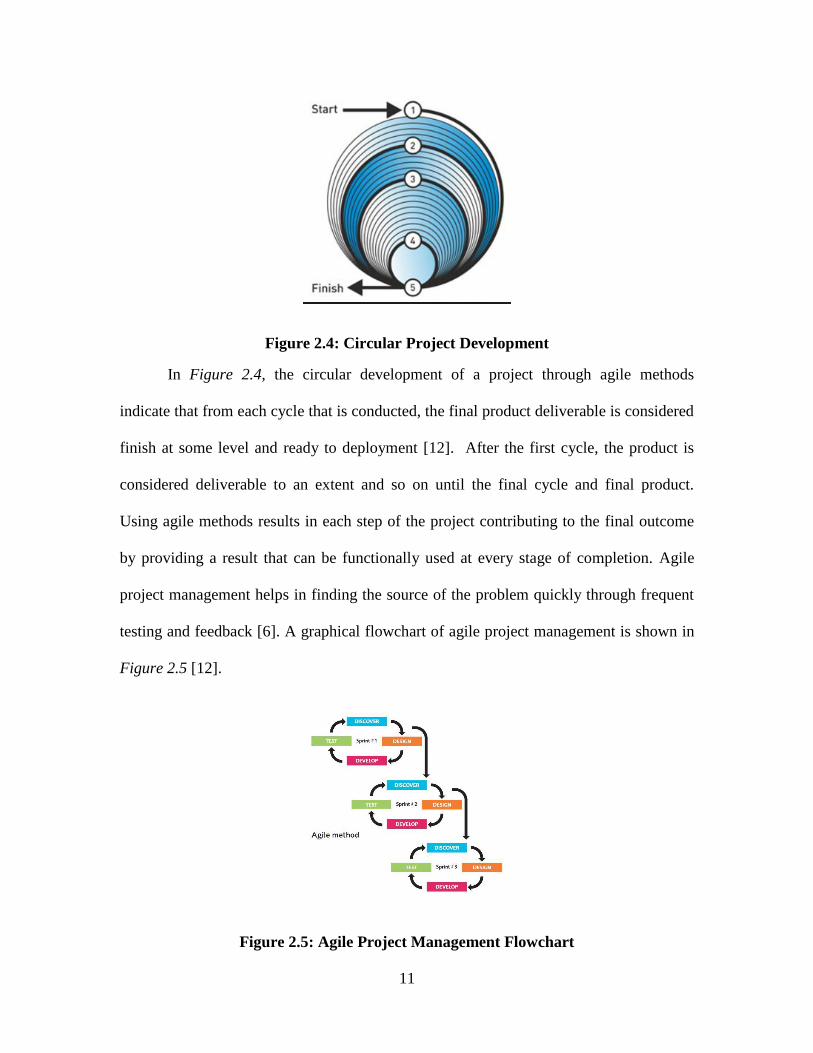
testing and feedback [6]. A graphical flowchart of agile project management is shown in
Figure 2.5 [12].
Figure 2.5: Agile Project Management Flowchart
12
Figure 2.5 shows a generalized agile method that consists of three sprints being
performed for one project lifecycle. Each sprint conducts all steps included in the
Waterfall method. By utilizing the Discover, Design, Develop, and Test steps at the
beginning of every sprint, feedback and changes can be accounted for throughout the
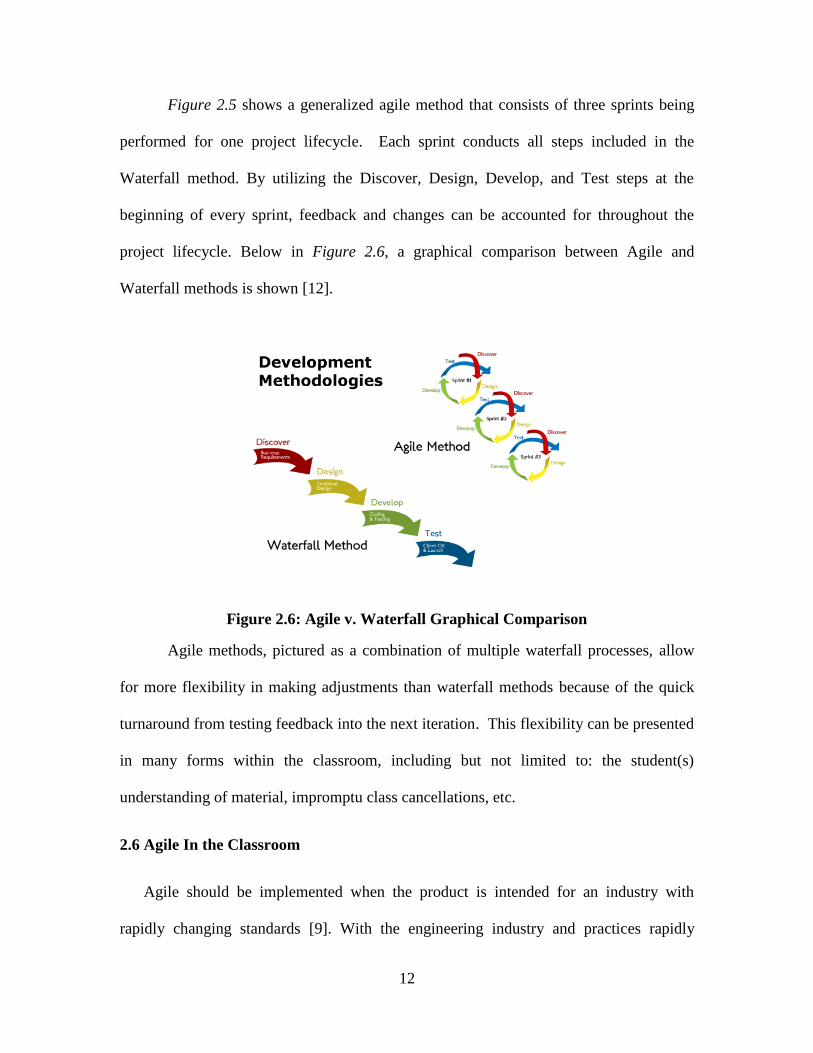
project lifecycle. Below in Figure 2.6, a graphical comparison between Agile and
Waterfall methods is shown [12].
Figure 2.6: Agile v. Waterfall Graphical Comparison
Agile methods, pictured as a combination of multiple waterfall processes, allow
for more flexibility in making adjustments than waterfall methods because of the quick
turnaround from testing feedback into the next iteration. This flexibility can be presented
in many forms within the classroom, including but not limited to: the student(s)
understanding of material, impromptu class cancellations, etc.
2.6 Agile In the Classroom
Agile should be implemented when the product is intended for an industry with
rapidly changing standards [9]. With the engineering industry and practices rapidly
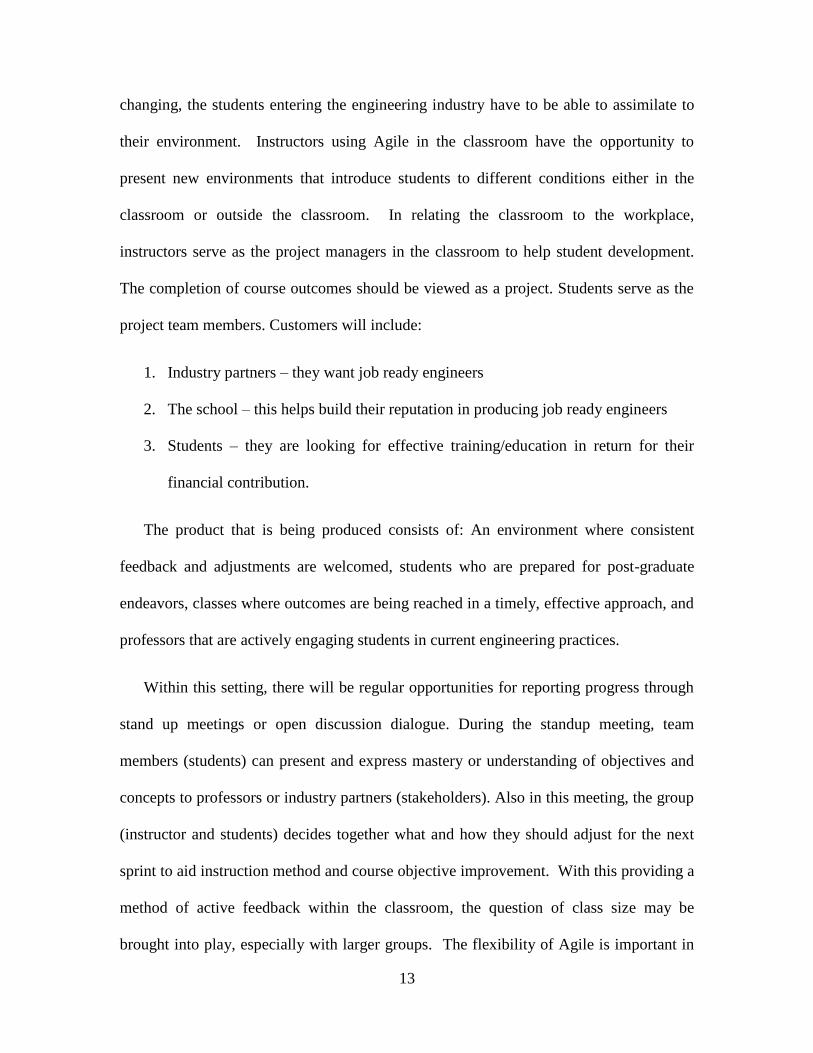
13
changing, the students entering the engineering industry have to be able to assimilate to
their environment. Instructors using Agile in the classroom have the opportunity to
present new environments that introduce students to different conditions either in the
classroom or outside the classroom. In relating the classroom to the workplace,
instructors serve as the project managers in the classroom to help student development.
The completion of course outcomes should be viewed as a project. Students serve as the
project team members. Customers will include:
1. Industry partners – they want job ready engineers
2. The school – this helps build their reputation in producing job ready engineers
3. Students – they are looking for effective training/education in return for their
financial contribution.
The product that is being produced consists of: An environment where consistent
feedback and adjustments are welcomed, students who are prepared for post-graduate
endeavors, classes where outcomes are being reached in a timely, effective approach, and
professors that are actively engaging students in current engineering practices.
Within this setting, there will be regular opportunities for reporting progress through
stand up meetings or open discussion dialogue. During the standup meeting, team
members (students) can present and express mastery or understanding of objectives and
concepts to professors or industry partners (stakeholders). Also in this meeting, the group
(instructor and students) decides together what and how they should adjust for the next
sprint to aid instruction method and course objective improvement. With this providing a
method of active feedback within the classroom, the question of class size may be
brought into play, especially with larger groups. The flexibility of Agile is important in
14
that effective approaches, such as designated study groups, can be implemented and serve
as class teams to present updates and questions similar to functional team leaders.
Another sign of agile flexibility is the types of methods that stem from agile
methodologies.
2.7 Agile Technique: Scrum + Kanban = Scrum ban
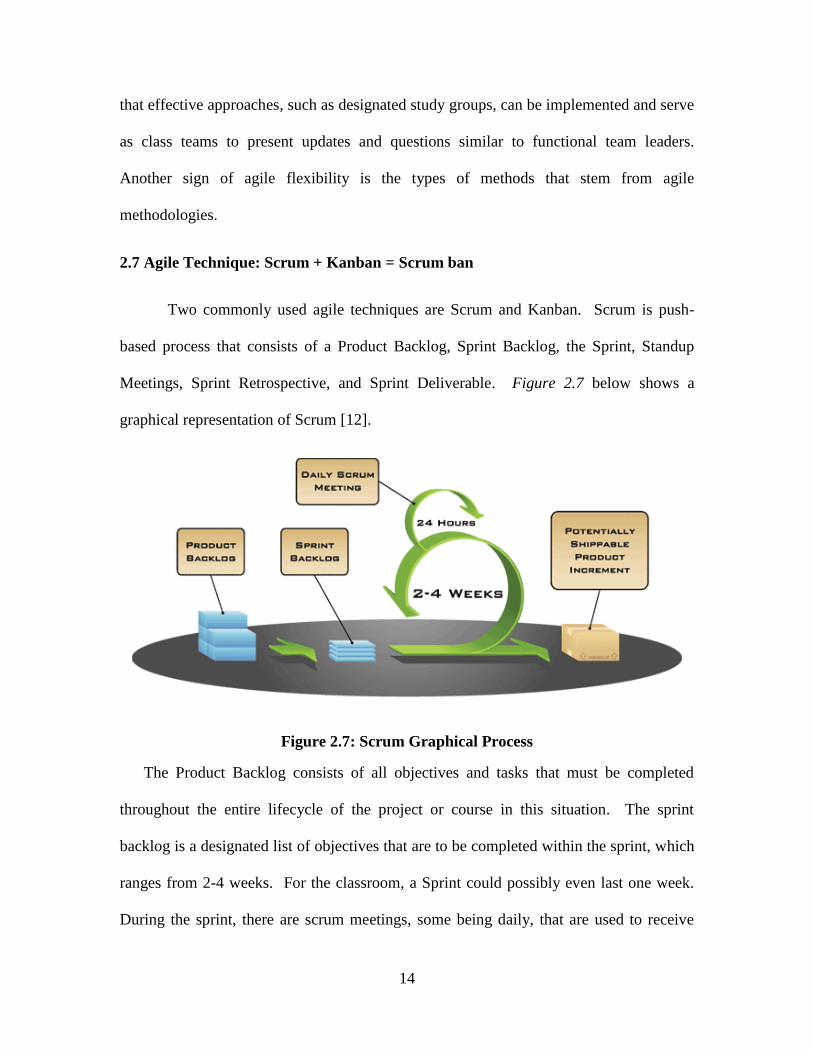
Two commonly used agile techniques are Scrum and Kanban. Scrum is push-
based process that consists of a Product Backlog, Sprint Backlog, the Sprint, Standup
Meetings, Sprint Retrospective, and Sprint Deliverable. Figure 2.7 below shows a
graphical representation of Scrum [12].
Figure 2.7: Scrum Graphical Process
The Product Backlog consists of all objectives and tasks that must be completed
throughout the entire lifecycle of the project or course in this situation. The sprint
backlog is a designated list of objectives that are to be completed within the sprint, which
ranges from 2-4 weeks. For the classroom, a Sprint could possibly even last one week.
During the sprint, there are scrum meetings, some being daily, that are used to receive
15
progress regarding the completion of tasks and to receive feedback that could help
improve process completions or sprint management. The three main questions that are
asked during a regular scrum meeting are:
1. What did you do yesterday?
2. What is planned to be done today?
3. Are there any impediments/concerns that may hinder progress?
The scrum meetings also allow team members to gain a level of understanding of
what each part of the project is responsible for. With engineering courses being
scheduled on a Monday-Wednesday-Friday basis, the scrum meetings would occur
during the class periods to focus on problem-solving and discussions that students may
have about the material. Students would also be able to peer review, learn study habits,
and understand how their peers are receiving and processing the information. At the end
of the sprint, the objectives and tasks assigned at the beginning of the sprint should be
completed. A way for students to exhibit the completion of the tasks and objectives is
through exams or projects based on the professor’s discretion.
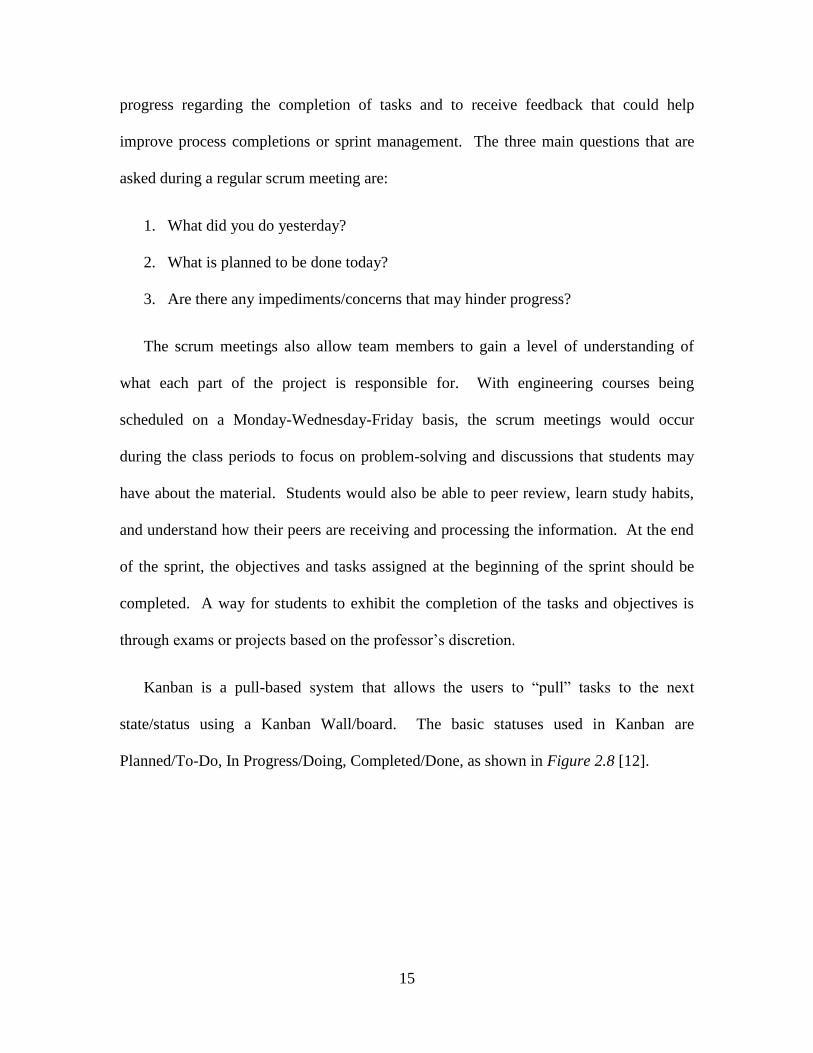
Kanban is a pull-based system that allows the users to “pull” tasks to the next
state/status using a Kanban Wall/board. The basic statuses used in Kanban are
Planned/To-Do, In Progress/Doing, Completed/Done, as shown in Figure 2.8 [12].
16
Figure 2.8: Kanban Wall
Kanban users begin by placing their tasks into the To Do column. When the user
is ready to begin the next task, the user “pulls” the task from the To Do stage to the
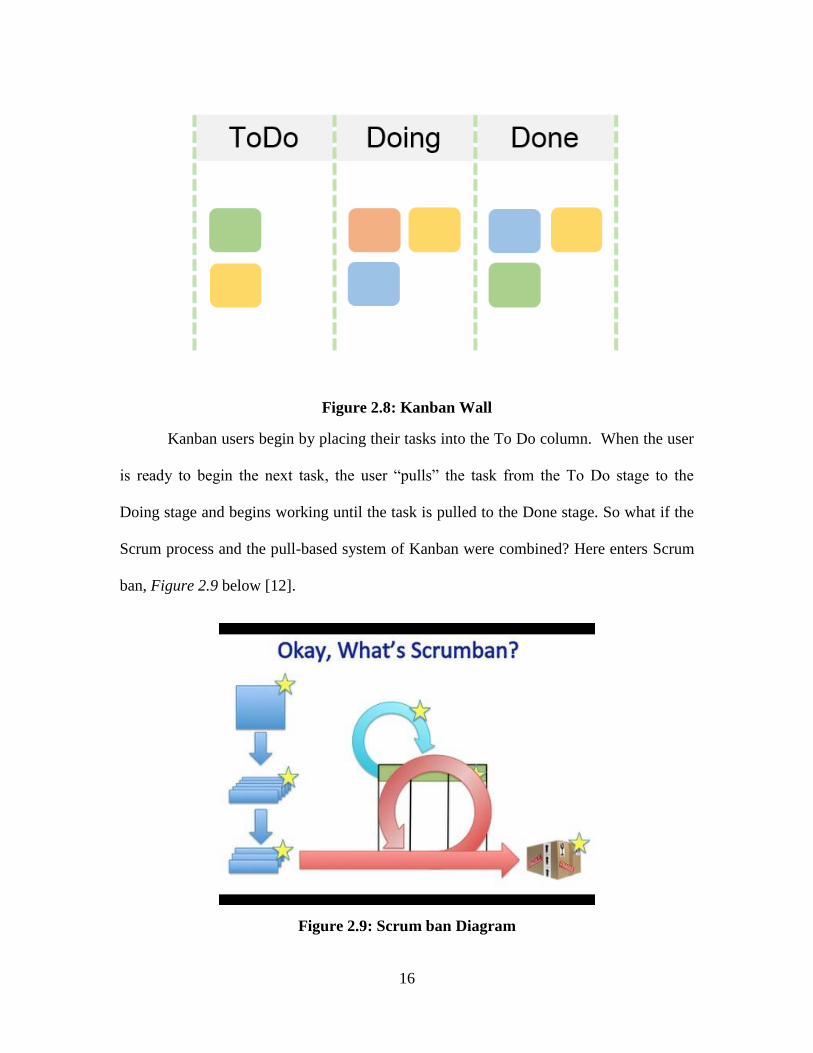
Doing stage and begins working until the task is pulled to the Done stage. So what if the
Scrum process and the pull-based system of Kanban were combined? Here enters Scrum
ban, Figure 2.9 below [12].
Figure 2.9: Scrum ban Diagram
17
In Scrumban, the Product Backlog, or for this method, Task Backlog is defined. A
sprint backlog is produced and placed within the Kanban board. As the tasks are being
pulled toward completion during the sprint, scrum meetings are conducted to assess the
progress of the sprint and task completion. Once the sprint is completed, the designated
tasks can be labeled as deliverables. At the end of each sprint, the instructor and students
(team) have the ability to review and conduct a sprint retrospective of the work that was
completed and the assessment metrics of the sprint. Observations that can be made can
include:
Were enough main tasks or learning objectives accomplished during the sprint?
Could we, as a group, have gone into deeper application of the material and
concepts?
Could the group have included another main task or objective in this sprint?
Did we achieve the sprint objectives in more efficient time than last sprint?
These questions help students grow comfortable with tasks and workloads while the
instructors are able to gauge the potential of their students to increase the challenge of
getting more initiative and effort from the students.
Furthermore, the scrumban process resembles a flipped classroom in that the
classroom meeting times can be used as the scrum meetings or check-ins. The task
completion will be conducted outside of the classroom and a list of objectives will be
completed and accounted for at the end of the specified sprint or lesson. This correlation
led to experimenting with the flipped classroom in engineering education to validate if
agile methods could be used as well in reference to this paper’s hypothesis.
18
CHAPTER 3: METHODOLOGY
3.1 Proposed Methodology:
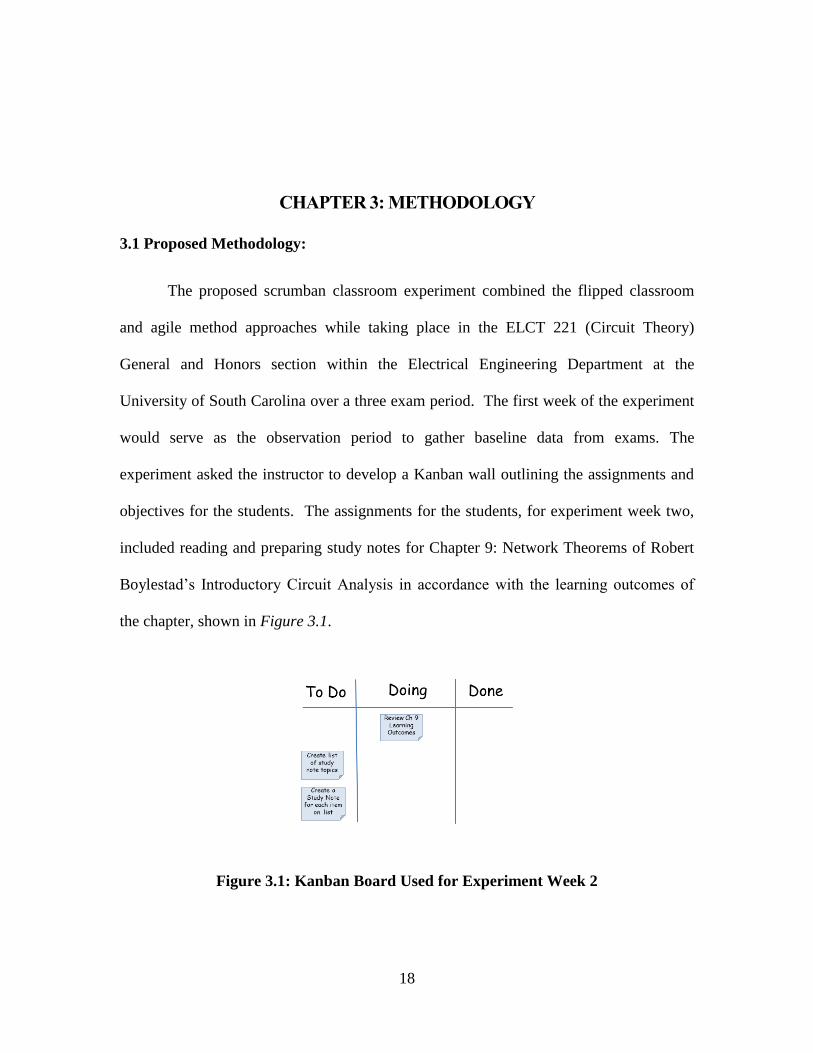
The proposed scrumban classroom experiment combined the flipped classroom
and agile method approaches while taking place in the ELCT 221 (Circuit Theory)
General and Honors section within the Electrical Engineering Department at the
University of South Carolina over a three exam period. The first week of the experiment
would serve as the observation period to gather baseline data from exams. The
experiment asked the instructor to develop a Kanban wall outlining the assignments and
objectives for the students. The assignments for the students, for experiment week two,
included reading and preparing study notes for Chapter 9: Network Theorems of Robert
Boylestad’s Introductory Circuit Analysis in accordance with the learning outcomes of
the chapter, shown in Figure 3.1.
Figure 3.1: Kanban Board Used for Experiment Week 2
19
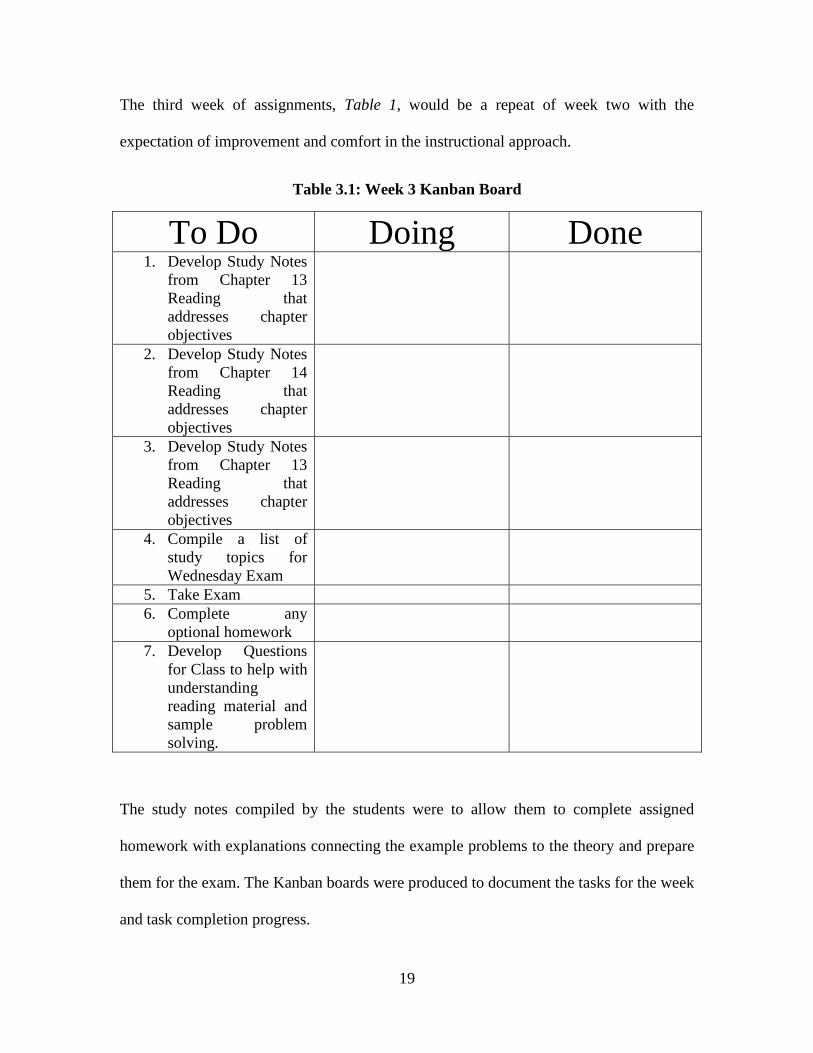
The third week of assignments, Table 1, would be a repeat of week two with the
expectation of improvement and comfort in the instructional approach.
Table 3.1: Week 3 Kanban Board
To Do Doing Done 1. Develop Study Notes
from Chapter 13
Reading that
addresses chapter
objectives
2. Develop Study Notes
from Chapter 14
Reading that
addresses chapter
objectives
3. Develop Study Notes
from Chapter 13
Reading that
addresses chapter
objectives
4. Compile a list of
study topics for
Wednesday Exam
5. Take Exam
6. Complete any
optional homework
7. Develop Questions
for Class to help with
understanding
reading material and
sample problem
solving.
The study notes compiled by the students were to allow them to complete assigned
homework with explanations connecting the example problems to the theory and prepare
them for the exam. The Kanban boards were produced to document the tasks for the week
and task completion progress.
20
Students were encouraged to peer review each other’s notes and bring questions
to class to engage in open discussions with the professor. During the week, the meeting
days for the class were encouraged to be used for problem solving, Q&A sessions, or
open discussions to expand on deeper aspects of the material and exam preparation. At
the end of the week, the students were to be tested on the chapter. The class grades
(average, maximum, and minimum), exam duration, question retries, incorrect answers,
and unanswered questions would be documented for observation. Lastly, the students and
professors were asked to complete a survey on their experience within the flipped agile
classroom for further implications and future research. The survey questions can be found
in Appendix B. The Honors section class population is seven (7).
3.2 Implemented Methodology
Aspects of the proposed methodology were not implemented. Only the Honors
section students were presented with the Kanban Board shown in Figure 3.1 for the first
week of implementation and developed their Kanban Board for exam preparation in the
second week of implementation. The instructor developed the Kanban wall shown in Fig
10 with the assignment to the students being to develop their own list of study topics and
pull them across the wall as they completed their studies.
Also, the survey questions that were formulated were condensed into an interview
style conversation that was held with the students and instructor present. The results of
the study may present a margin of error given that the exam taken during the normal
instructional approach consisted of seven (7) questions. The exam consisted of four (4)
questions and then eight (8) questions for exam 2. Additional pitfalls of the experiment
included:
21
The instructor and student loss a day of class due to hurricane conditions and class
cancellations
Also, the absence of the main instructor for five of the eight remaining classes
during the 3-week experiment period. Guest instructors were employed during
these absences, giving the Honors students the opportunity to attend the General
section class if desired.
Human error and interaction could also aid to the margin of error for the experiment
therefore, the margin of error was not calculated for this experiment.
22
CHAPTER 4: RESULTS/DISCUSSION
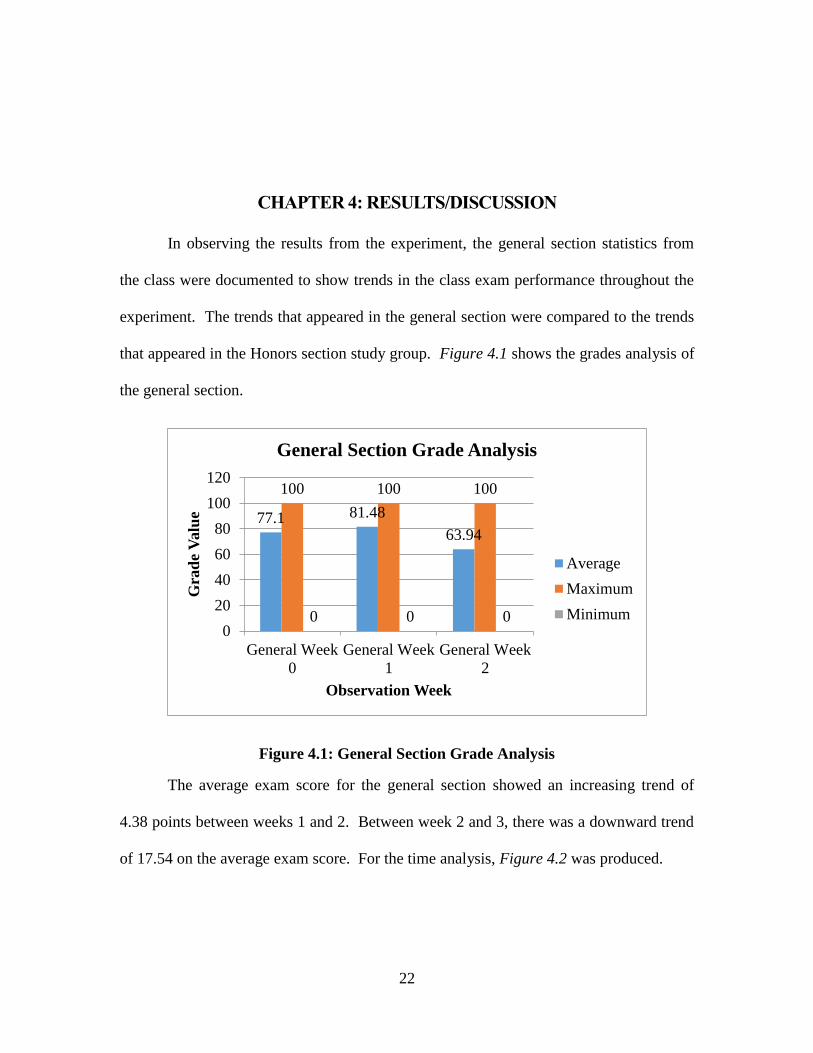
In observing the results from the experiment, the general section statistics from
the class were documented to show trends in the class exam performance throughout the
experiment. The trends that appeared in the general section were compared to the trends
that appeared in the Honors section study group. Figure 4.1 shows the grades analysis of
the general section.
Figure 4.1: General Section Grade Analysis
The average exam score for the general section showed an increasing trend of
4.38 points between weeks 1 and 2. Between week 2 and 3, there was a downward trend
of 17.54 on the average exam score. For the time analysis, Figure 4.2 was produced.
77.1 81.48
63.94
100 100 100
0 0 00
20
40
60
80
100
120
General Week
0
General Week
1
General Week
2
Gra
de
Valu
e
Observation Week
General Section Grade Analysis
Average
Maximum
Minimum
23
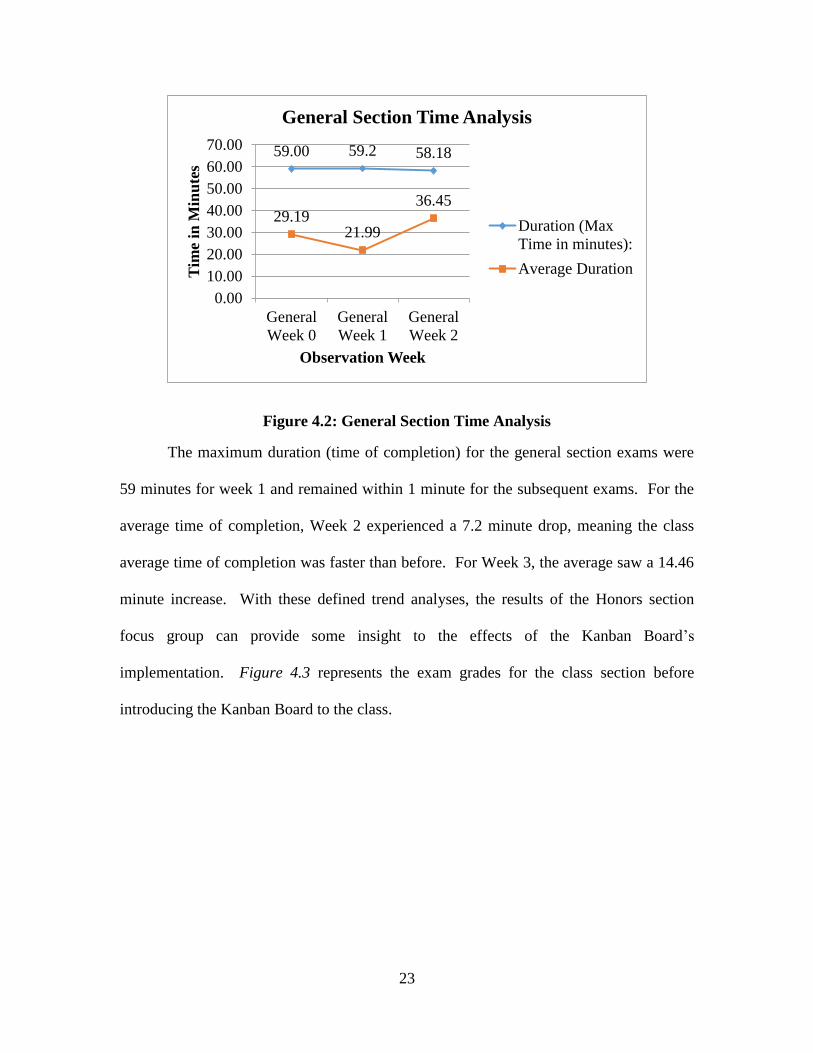
Figure 4.2: General Section Time Analysis
The maximum duration (time of completion) for the general section exams were
59 minutes for week 1 and remained within 1 minute for the subsequent exams. For the
average time of completion, Week 2 experienced a 7.2 minute drop, meaning the class
average time of completion was faster than before. For Week 3, the average saw a 14.46
minute increase. With these defined trend analyses, the results of the Honors section
focus group can provide some insight to the effects of the Kanban Board’s
implementation. Figure 4.3 represents the exam grades for the class section before
introducing the Kanban Board to the class.
59.00 59.2 58.18
29.1921.99
36.45
0.00
10.00
20.00
30.00
40.00
50.00
60.00
70.00
General
Week 0
General
Week 1
General
Week 2
Tim
e in
Min
ute
s
Observation Week
General Section Time Analysis
Duration (Max
Time in minutes):
Average Duration
24
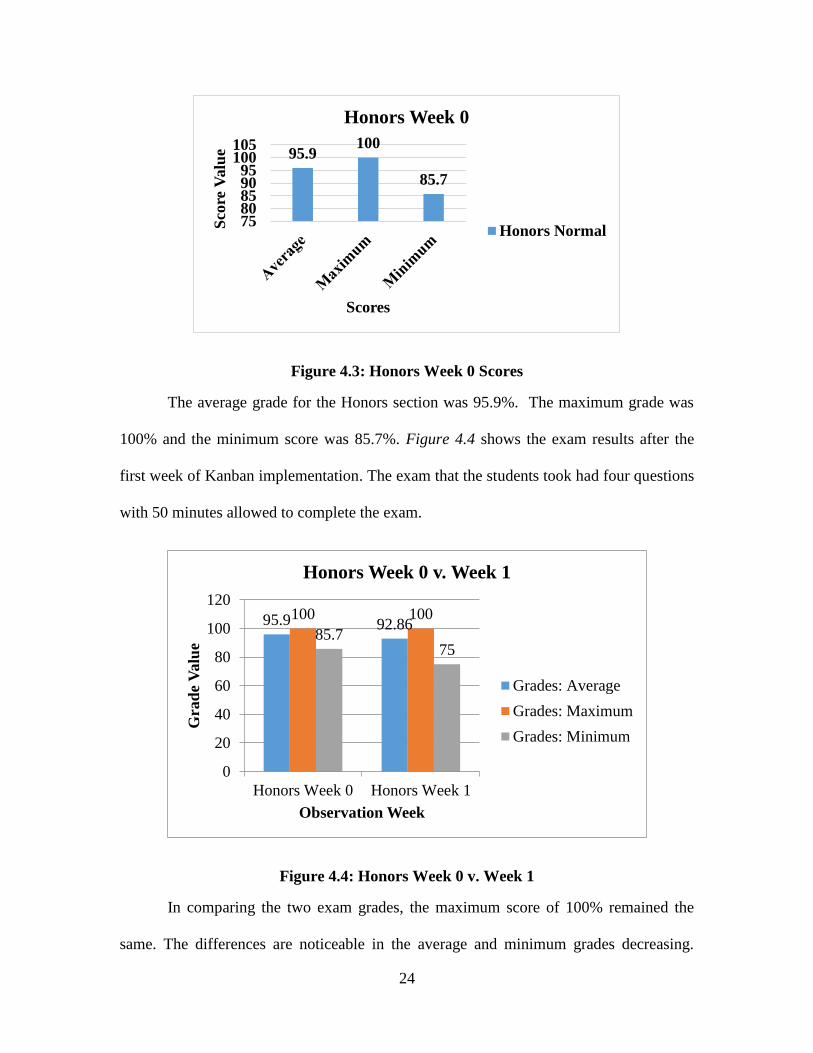
Figure 4.3: Honors Week 0 Scores
The average grade for the Honors section was 95.9%. The maximum grade was
100% and the minimum score was 85.7%. Figure 4.4 shows the exam results after the
first week of Kanban implementation. The exam that the students took had four questions
with 50 minutes allowed to complete the exam.
Figure 4.4: Honors Week 0 v. Week 1
In comparing the two exam grades, the maximum score of 100% remained the
same. The differences are noticeable in the average and minimum grades decreasing.
95.9100
85.7
7580859095
100105
Sco
re V
alu
e
Scores
Honors Week 0
Honors Normal
95.9 92.86100 100
85.775
0
20
40
60
80
100
120
Honors Week 0 Honors Week 1
Gra
de
Valu
e
Observation Week
Honors Week 0 v. Week 1
Grades: Average
Grades: Maximum
Grades: Minimum
25
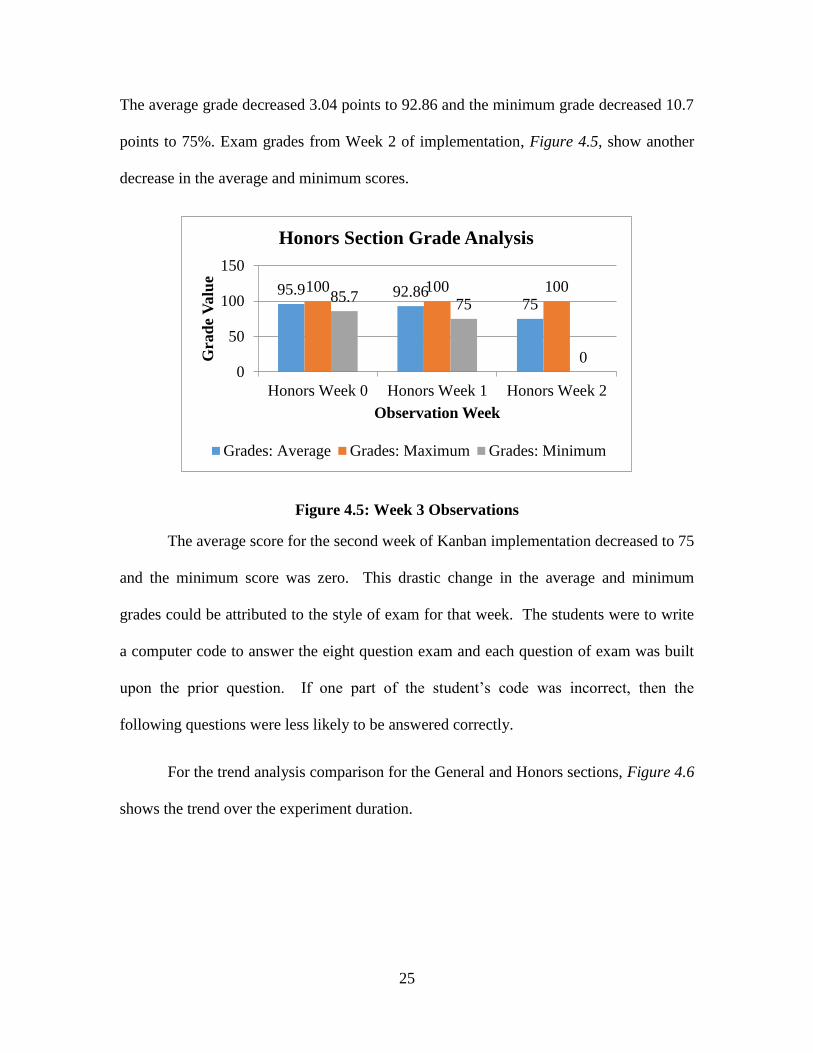
The average grade decreased 3.04 points to 92.86 and the minimum grade decreased 10.7
points to 75%. Exam grades from Week 2 of implementation, Figure 4.5, show another
decrease in the average and minimum scores.
Figure 4.5: Week 3 Observations
The average score for the second week of Kanban implementation decreased to 75
and the minimum score was zero. This drastic change in the average and minimum
grades could be attributed to the style of exam for that week. The students were to write
a computer code to answer the eight question exam and each question of exam was built
upon the prior question. If one part of the student’s code was incorrect, then the
following questions were less likely to be answered correctly.
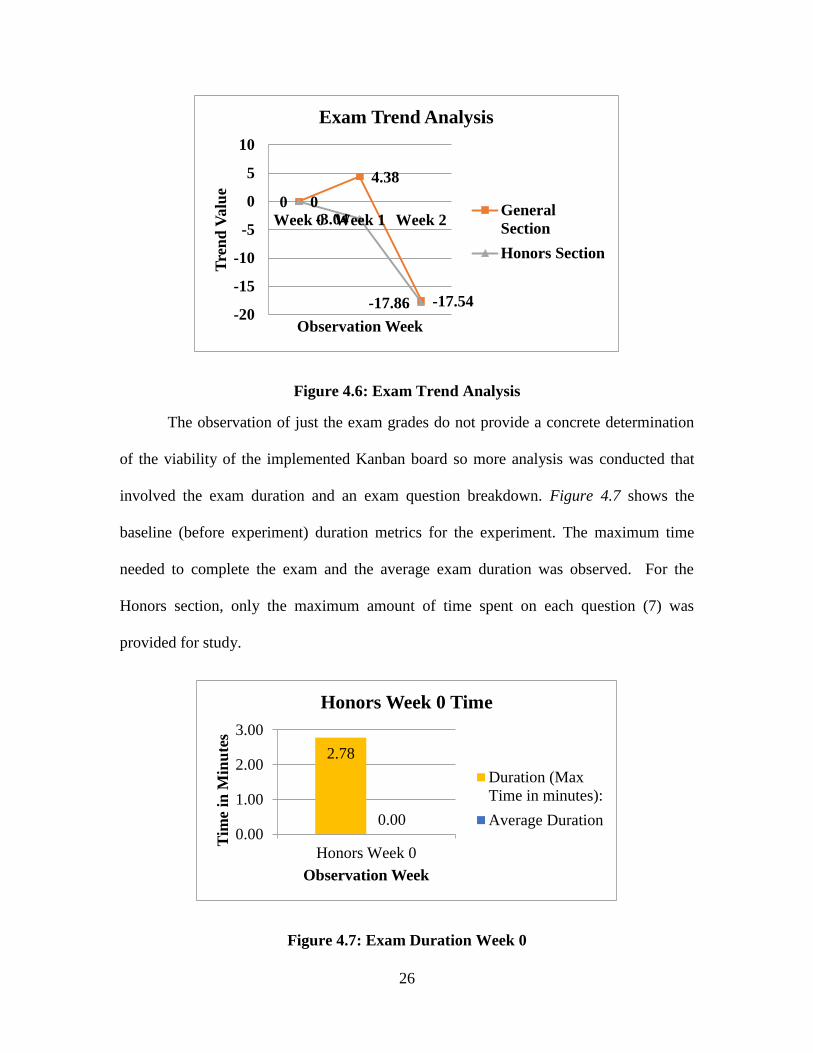
For the trend analysis comparison for the General and Honors sections, Figure 4.6
shows the trend over the experiment duration.
95.9 92.8675
100 100 10085.7
75
00
50
100
150
Honors Week 0 Honors Week 1 Honors Week 2
Gra
de
Valu
e
Observation Week
Honors Section Grade Analysis
Grades: Average Grades: Maximum Grades: Minimum
26
Figure 4.6: Exam Trend Analysis
The observation of just the exam grades do not provide a concrete determination
of the viability of the implemented Kanban board so more analysis was conducted that
involved the exam duration and an exam question breakdown. Figure 4.7 shows the
baseline (before experiment) duration metrics for the experiment. The maximum time
needed to complete the exam and the average exam duration was observed. For the
Honors section, only the maximum amount of time spent on each question (7) was
provided for study.
Figure 4.7: Exam Duration Week 0
0
4.38
-17.54
0-3.04
-17.86-20
-15
-10
-5
0
5
10
Week 0 Week 1 Week 2T
ren
d V
alu
e
Observation Week
Exam Trend Analysis
General
Section
Honors Section
2.78
0.000.00
1.00
2.00
3.00
Honors Week 0
Tim
e in
Min
ute
s
Observation Week
Honors Week 0 Time
Duration (Max
Time in minutes):
Average Duration
27
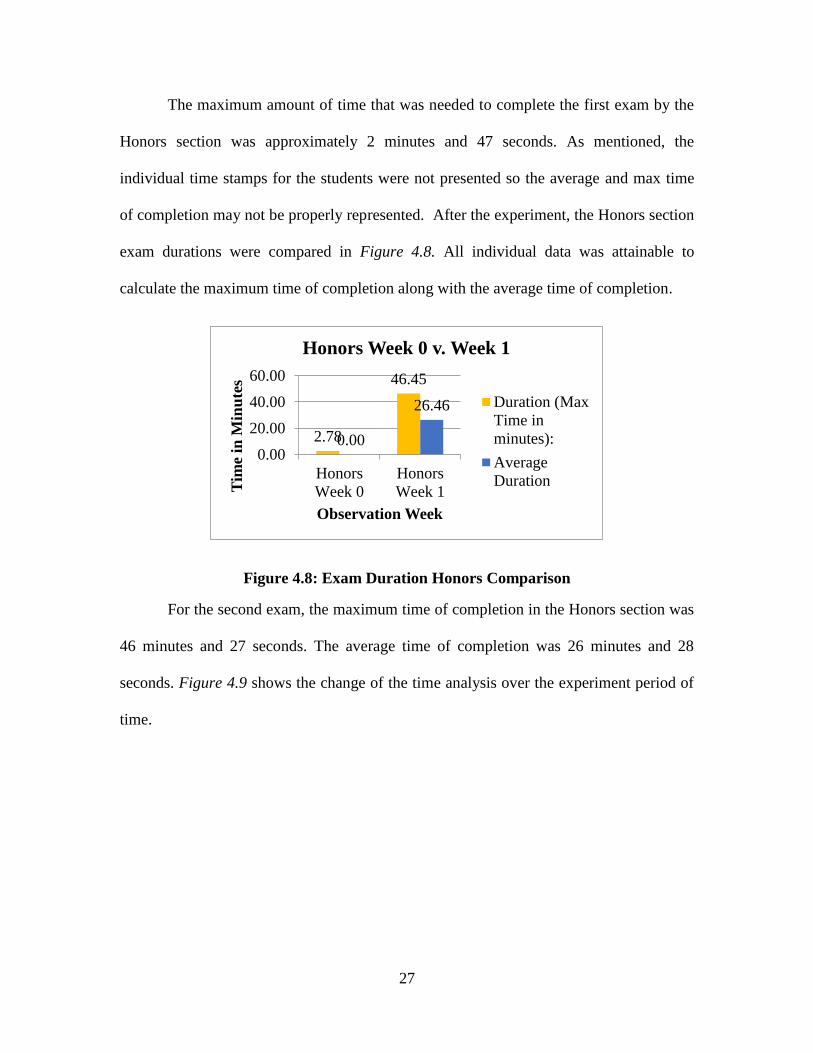
The maximum amount of time that was needed to complete the first exam by the
Honors section was approximately 2 minutes and 47 seconds. As mentioned, the
individual time stamps for the students were not presented so the average and max time
of completion may not be properly represented. After the experiment, the Honors section
exam durations were compared in Figure 4.8. All individual data was attainable to
calculate the maximum time of completion along with the average time of completion.
Figure 4.8: Exam Duration Honors Comparison
For the second exam, the maximum time of completion in the Honors section was
46 minutes and 27 seconds. The average time of completion was 26 minutes and 28
seconds. Figure 4.9 shows the change of the time analysis over the experiment period of
time.
2.78
46.45
0.00
26.46
0.00
20.00
40.00
60.00
Honors
Week 0
Honors
Week 1Tim
e in
Min
ute
s
Observation Week
Honors Week 0 v. Week 1
Duration (Max
Time in
minutes):
Average
Duration
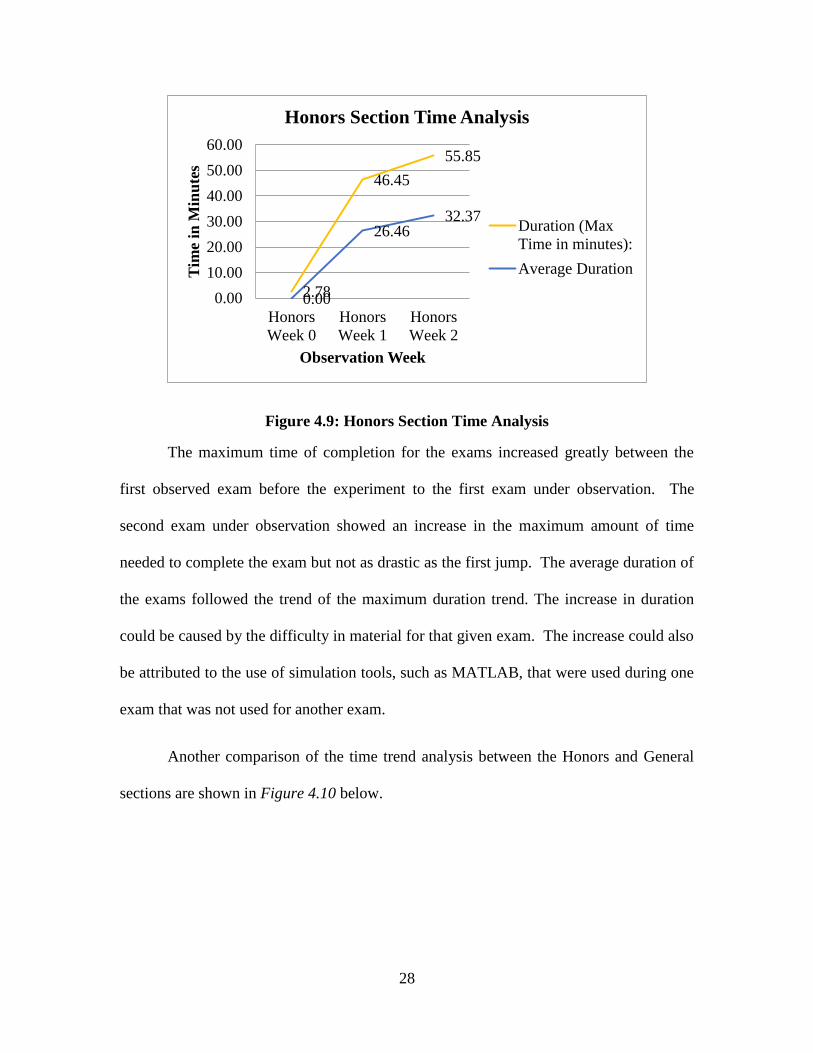
28
Figure 4.9: Honors Section Time Analysis
The maximum time of completion for the exams increased greatly between the
first observed exam before the experiment to the first exam under observation. The
second exam under observation showed an increase in the maximum amount of time
needed to complete the exam but not as drastic as the first jump. The average duration of
the exams followed the trend of the maximum duration trend. The increase in duration
could be caused by the difficulty in material for that given exam. The increase could also
be attributed to the use of simulation tools, such as MATLAB, that were used during one
exam that was not used for another exam.
Another comparison of the time trend analysis between the Honors and General
sections are shown in Figure 4.10 below.
2.78
46.45
55.85
0.00
26.4632.37
0.00
10.00
20.00
30.00
40.00
50.00
60.00
Honors
Week 0
Honors
Week 1
Honors
Week 2
Tim
e in
Min
ute
s
Observation Week
Honors Section Time Analysis
Duration (Max
Time in minutes):
Average Duration
29
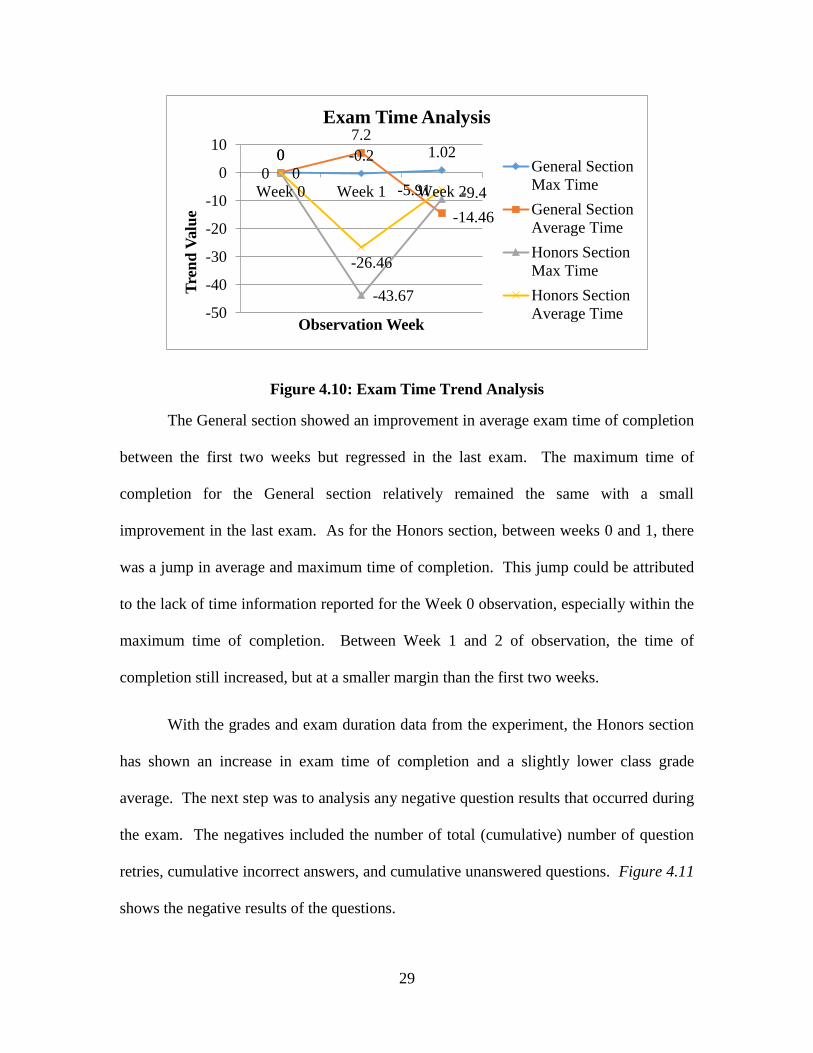
Figure 4.10: Exam Time Trend Analysis
The General section showed an improvement in average exam time of completion
between the first two weeks but regressed in the last exam. The maximum time of
completion for the General section relatively remained the same with a small
improvement in the last exam. As for the Honors section, between weeks 0 and 1, there
was a jump in average and maximum time of completion. This jump could be attributed
to the lack of time information reported for the Week 0 observation, especially within the
maximum time of completion. Between Week 1 and 2 of observation, the time of
completion still increased, but at a smaller margin than the first two weeks.
With the grades and exam duration data from the experiment, the Honors section
has shown an increase in exam time of completion and a slightly lower class grade
average. The next step was to analysis any negative question results that occurred during
the exam. The negatives included the number of total (cumulative) number of question
retries, cumulative incorrect answers, and cumulative unanswered questions. Figure 4.11
shows the negative results of the questions.
0 -0.2 1.020
7.2
-14.46
0
-43.67
-9.4
0
-26.46
-5.91
-50
-40
-30
-20
-10
0
10
Week 0 Week 1 Week 2T
ren
d V
alu
e
Observation Week
Exam Time Analysis
General Section
Max Time
General Section
Average Time
Honors Section
Max Time
Honors Section
Average Time
30
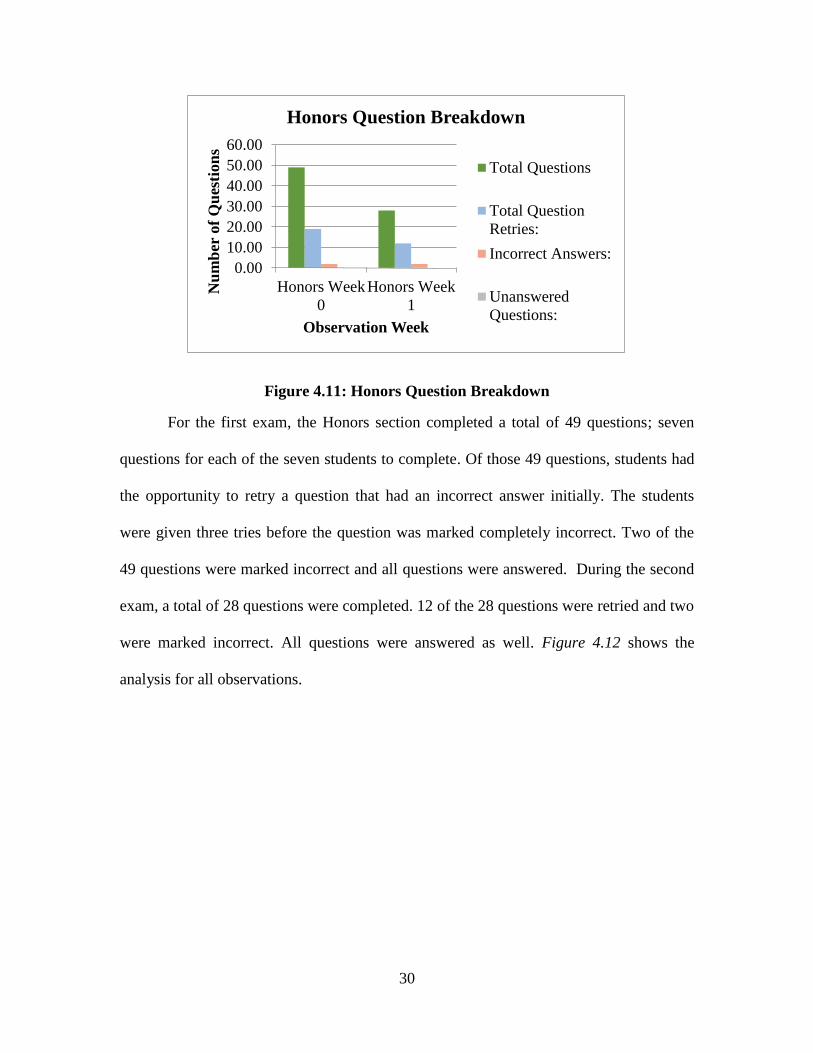
Figure 4.11: Honors Question Breakdown
For the first exam, the Honors section completed a total of 49 questions; seven
questions for each of the seven students to complete. Of those 49 questions, students had
the opportunity to retry a question that had an incorrect answer initially. The students
were given three tries before the question was marked completely incorrect. Two of the
49 questions were marked incorrect and all questions were answered. During the second
exam, a total of 28 questions were completed. 12 of the 28 questions were retried and two
were marked incorrect. All questions were answered as well. Figure 4.12 shows the
analysis for all observations.
0.00
10.00
20.00
30.00
40.00
50.00
60.00
Honors Week
0
Honors Week
1
Nu
mb
er o
f Q
ues
tion
s
Observation Week
Honors Question Breakdown
Total Questions
Total Question
Retries:
Incorrect Answers:
Unanswered
Questions:
31
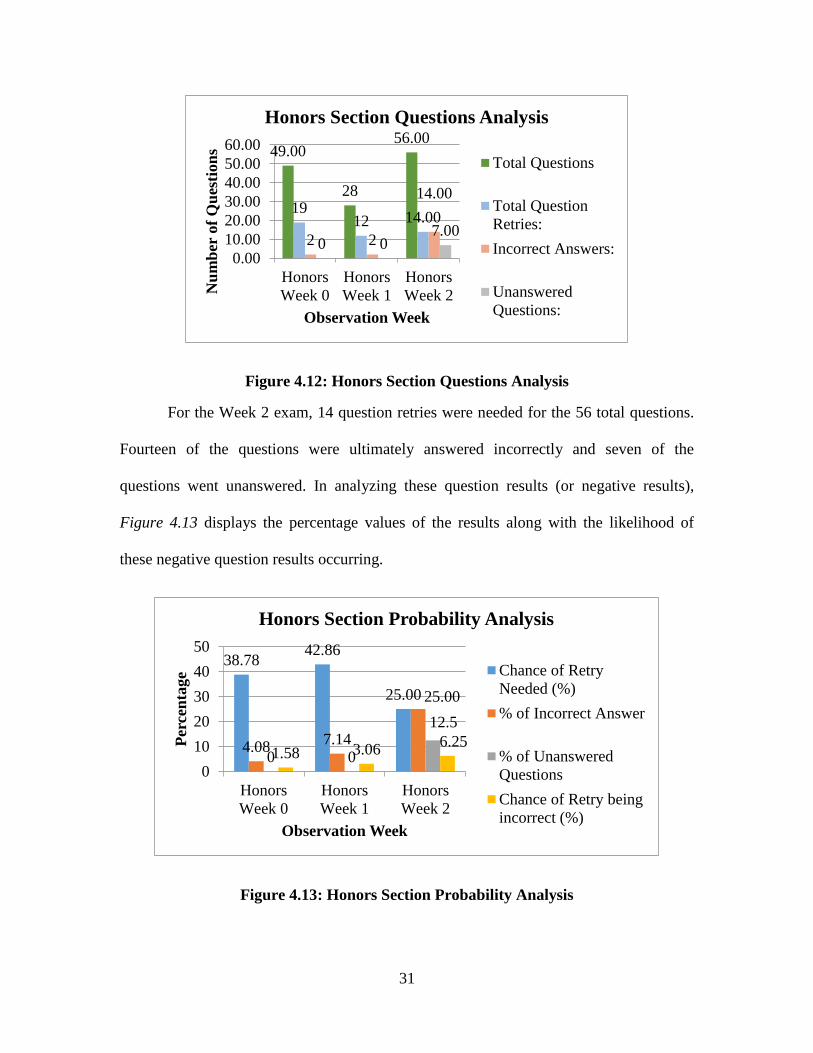
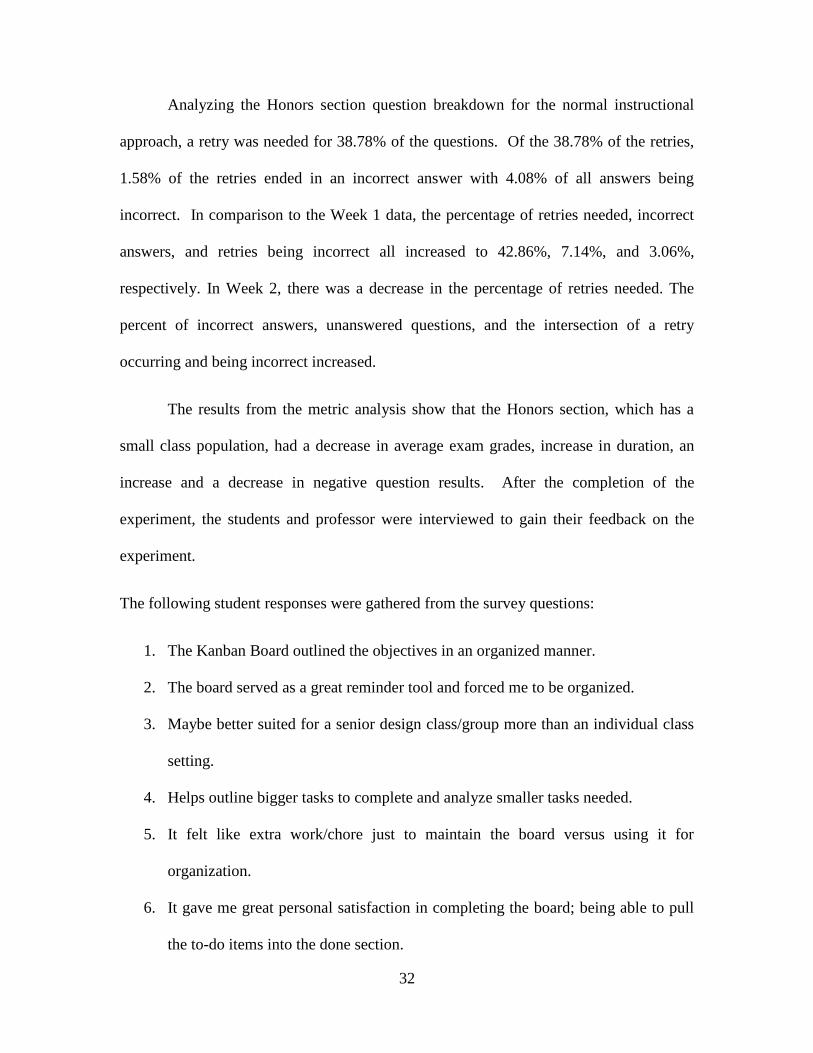
Figure 4.12: Honors Section Questions Analysis
For the Week 2 exam, 14 question retries were needed for the 56 total questions.
Fourteen of the questions were ultimately answered incorrectly and seven of the
questions went unanswered. In analyzing these question results (or negative results),
Figure 4.13 displays the percentage values of the results along with the likelihood of
these negative question results occurring.
Figure 4.13: Honors Section Probability Analysis
49.00
28
56.00
1912 14.00
2 2
14.00
0 07.00
0.00
10.00
20.00
30.00
40.00
50.00
60.00
Honors
Week 0
Honors
Week 1
Honors
Week 2Nu
mb
er o
f Q
ues
tion
s
Observation Week
Honors Section Questions Analysis
Total Questions
Total Question
Retries:
Incorrect Answers:
Unanswered
Questions:
38.7842.86
25.00
4.087.14
25.00
0 0
12.5
1.58 3.066.25
0
10
20
30
40
50
Honors
Week 0
Honors
Week 1
Honors
Week 2
Per
cen
tage
Observation Week
Honors Section Probability Analysis
Chance of Retry
Needed (%)
% of Incorrect Answer
% of Unanswered
Questions
Chance of Retry being
incorrect (%)
32
Analyzing the Honors section question breakdown for the normal instructional
approach, a retry was needed for 38.78% of the questions. Of the 38.78% of the retries,
1.58% of the retries ended in an incorrect answer with 4.08% of all answers being
incorrect. In comparison to the Week 1 data, the percentage of retries needed, incorrect
answers, and retries being incorrect all increased to 42.86%, 7.14%, and 3.06%,
respectively. In Week 2, there was a decrease in the percentage of retries needed. The
percent of incorrect answers, unanswered questions, and the intersection of a retry
occurring and being incorrect increased.
The results from the metric analysis show that the Honors section, which has a
small class population, had a decrease in average exam grades, increase in duration, an
increase and a decrease in negative question results. After the completion of the
experiment, the students and professor were interviewed to gain their feedback on the
experiment.
The following student responses were gathered from the survey questions:
1. The Kanban Board outlined the objectives in an organized manner.
2. The board served as a great reminder tool and forced me to be organized.
3. Maybe better suited for a senior design class/group more than an individual class
setting.
4. Helps outline bigger tasks to complete and analyze smaller tasks needed.
5. It felt like extra work/chore just to maintain the board versus using it for
organization.
6. It gave me great personal satisfaction in completing the board; being able to pull
the to-do items into the done section.
33
7. As a learning style, I learn best when given the full background proof and
practical application; think this can help in providing that model
8. I prefer a balance of lectures and hands-on instruction. Not sure if this approach
was framed to separate those two.
From these student responses, there were some positives in using the Kanban Board.
Students believed that the objectives were outlined and organized while serving as a great
reminder tool. One student felt that maintaining the board felt like and extra chore
because they were asked to submit any revisions that they made to the board to the
instructor. One student felt great personal satisfaction from completing the board. And
lastly, some of the students believed that the use of the board worked better in a team
setting versus an individualized class setting.
The instructor added, “This method was different; it was a very different approach
than I normally use. It was good for insight on to-do items and study topics that as a class
we were able to develop.”
34
CHAPTER 5: CONCLUSION/FUTURE IMPLICATION
In conclusion, the experiment did not yield a conclusive trend therefore rendering
the thesis as inconclusive due to design implementation and limitations. The proposed
experiment was not fully implemented so the performance metrics only reflect the
implementation of the Kanban Board method, not the flipped classroom or scrum
components. Even though some students mentioned the organization that the board
offered, the industry soft skills that were predicted to be emphasized were not readily
evident. In regards to limitations that were encountered, the time limit to conduct this
experiment did not support long term discernment as the instructor and students would
need an adjustment period to learning and implementing the experiment. The absence of
the instructor and cancelled class meetings, due to weather, also strained the limits of the
experiment. The agile and flipped classroom experiment, when fully implemented, can
help overcome these limitations. With students conducting the bulk of their learning
outside of the classroom, the absence of the main instructor or cancelled class meetings
would not affect the students performing tasks before meeting for the class.
Therefore, a blueprint for agile project management tools can still be formulated
to implement within the engineering classroom framework. In future studies, clearly
explaining the full experiment to the group would be useful in the students understanding
the process in which they are undertaking along with providing a detailed and graphical
representation of what is expected. With a fuller understanding, the expectations and
35
results can be shared by the instructor and students as the entire team then has the same
goal and process understanding to achieve that goal. To ensure that agile project
management skills can be useful in the classroom, referencing Harold Kerzner’s 16
Points of Project Management Maturity could be used to enforce focal points of
implementing agile project management methods. Referencing Kerzner’s 16 Points of
Project Management Maturity, the four points listed below serve as key cornerstones:
1. Adopt a project management methodology and use it consistently.
2. Focus on deliverables rather than resources.
3. Cultivate effective communication, cooperation, and trust to achieve rapid project
management maturity.
4. Measure Progress periodically [4].
In Agile method implementation, professors must adopt a project management
methodology and remain consistent in using it. Focus should be on the development of
the students in their field along with completing course objectives in a timely manner; not
only on tools and resources used to get the correct answer. The environment, students,
and professor should actively promote effective communication, cooperation, and trust to
achieve designated tasks and course objectives efficiently and effectively. Professors
should regularly measure the progress of course objective completion, the effectiveness
of their instructional approach, and the aptitude of the students in retaining the course
material through standup meetings and open discussions. The use of Scrum ban can
provide a manageable pathway into implementing agile into the classroom in conjunction
with a flipped classroom. Sprints can make instructor time management more effective
by reinforcing the core concepts and tasks directly related to course objectives and
36
consistently relate theoretical knowledge to practical application. Stand-up meetings
would emphasize personal accountability and team communication. The Kanban wall can
promote lifelong learning in the students by encouraging them to pull the information
from sources and tasks during cycles instead of professors automatically having to push
the information onto the students.
Engineering practices and environments are constantly changing, supporting the
implementation of agile methods in engineering education. Agile Project Management
offers more freedom and flexibility to team members to accomplish goals, allowing for
innovative approaches to arise. Even though the final completion of course objectives can
be different from the original designed path of completion, the opportunity for professors
and students to adapt is present and can be related to the adaptability of engineers in the
workplace. This is an opportunity for instructors to create an environment that subtly
introduces and utilizes industry practices in the classroom and that can improve class
performance metrics while encouraging students to be more engaged and accountable for
the class material.
37
Works Cited
[1] ASEE. Transforming Undergraduate Education in Engineering Phase I: Synthesizing
and Integrating Industry Perspectives. American Society for Engineering
Education, 10 May 2013. Web. 18 June 2016. <https://www.asee.org/member-
resources/resources/transforming-undergraduate-engineering-education>.
[2] NSPE. Engineering Education. Issue brief no. 1739. National Society of Professional
Engineers, July 2001. Web. 1 Aug. 2016.
<https://www.nspe.org/resources/issues-and-advocacy/take-action/position-
statements/engineering-education>.
[3] Whitaker, Sean. "The Benefits of Tailoring: Making a Project Management
Methodology Fit." Project Management Institute, Inc., Sept. 2014. Web. 22 July
2016
[4] Kerzner, Harold. Project Management A Systems Approach to Planning, Scheduling,
and Controlling. Hoboken, NJ: John Wiley & Sons, 2013. Print
[5] "Organizational Influences and Project Life Cycle." A Guide to the Project
Management Body of Knowledge. 5th ed. Pennsylvania: PMI, 2013. 44-46. Print.
[6] "Agile & Waterfall Methodologies - A Side-By-Side Comparison." Base 36. Base 36
38
Smart Solutions, n.d. Web. 22 July 2016. <http://www.base36.com/2012/12/agile-
waterfall-methodologies-a-side-by-side-comparison/>.
[7] APM, North West Branch. "The Practical Adoption of Agile Methodologies."
Association of Project Management (APM), May 2015. Web. 22 July 2016.
[8] "The Agile Movement." The Agile Movement. N.p., n.d. Web. 22 July 2016.
<http://agilemethodology.org/>.
[9] Editorial Team, MindTools. "Agile Project Management." MindTools, n.d. Web. 22
July 2016. <https://www.mindtools.com/pages/article/agile-project-
management.htm>.
[10] Felder, Richard M., Donald R. Woods, James E. Stice, and Armando Rugarcia. "The
Future of Engineering Education II. Teaching Methods That Work." North
Carolina State University, 2000. Web. 22 July 2016.
<www4.ncsu.edu/unity/.../f/.../Quartet2.pdf>.
[11] Lamm, Monica H., Michael Dorneich, and Diane T. Rover. "Team-Based Learning
in Engineering Classrooms: Feedback Form and Content Adds Value to the
Learning Experience." American Society for Engineering Education, 17 Oct.
2014. Web. 22 July 2016.
[12] Google, n.d. Web. 2 Aug. 2016
[13] Brame, Cynthia J. “Center for Teaching.” Center for Teaching.N.p., n.d. Web. 16
Sept. 2016.

39
[14] “Center for Teaching.” Center for Teaching.N.p., n.d. Web. 16 Sept. 2016.
40
APPENDIX A
Differentiated Instruction: Checklist and 5 Step Lesson Plan
Content Area/Names: Grade: Date of
Lesson: Standard:
Objective:
Standard’s Bloom’s Level (circle one): Remember-Understand-
Apply-Analyze- Evaluate-Create
Objective’s Bloom’s Level (circle one): Remember-Understand-
Apply-Analyze- Evaluate-Create
Anticipatory Set
• Attention-grabber that relates to learning objective:
• Rationale for objective:
• Connection to prior knowledge:
• Review/introduction of vocabulary (may occur in instruction):
• CFU (Checking for understanding of LO):
Instruction
• Explanation of concept (How T. will deliver knowledge):
• Introduction of vocabulary (Content and Academic):
• Modeling/Demonstration of skill:
• Critical attributes identified (T. selected strategy):
• Active student participation
□ S. explain concepts, definitions, attributes in their own words
□ S. discriminate between example and non-examples
□ S. generate examples
• CFU (Key Questions):
41
• Highly-structured step-by-step practice (We do together):
• Multiple opportunities for students to practice:
• Immediate corrective feedback
• S. gradually released to work from highly structured practice to guided
practice:
• CFU:
Closure-Last CFU before Releasing Students to IP
• Key points of lesson reviewed/clarified (T. selected strategy):
• CFU-S. apply key points correctly in a variety of contexts (an
individual mini- assessment without T. assistance) :
• Determine if 80-100% of students have achieved the objective; either move
on to IP or give more GP
Independent Practice
• S. practice on their own to develop fluency and automaticity
(T. selected activity/strategy):
• S. are able to work without help, at an 80-100% accuracy level
• T. provides effective, timely feedback
Guided Practice
42
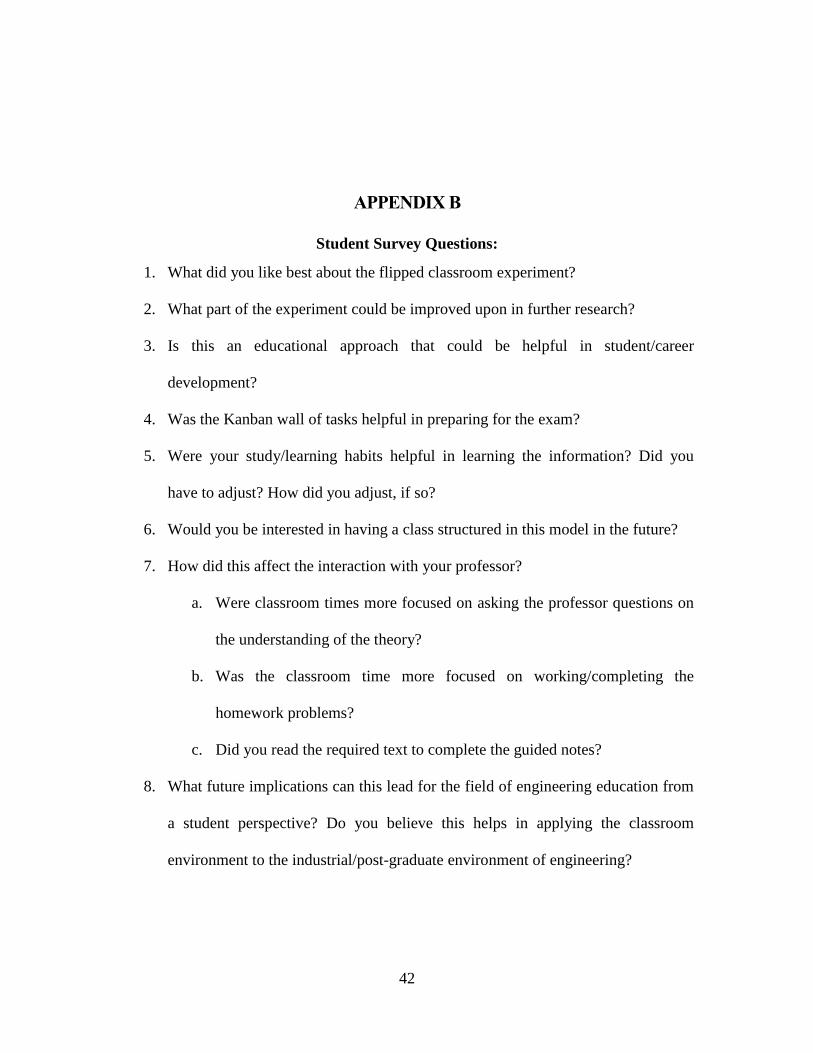
APPENDIX B
Student Survey Questions:
1. What did you like best about the flipped classroom experiment?
2. What part of the experiment could be improved upon in further research?
3. Is this an educational approach that could be helpful in student/career
development?
4. Was the Kanban wall of tasks helpful in preparing for the exam?
5. Were your study/learning habits helpful in learning the information? Did you
have to adjust? How did you adjust, if so?
6. Would you be interested in having a class structured in this model in the future?
7. How did this affect the interaction with your professor?
a. Were classroom times more focused on asking the professor questions on
the understanding of the theory?
b. Was the classroom time more focused on working/completing the
homework problems?
c. Did you read the required text to complete the guided notes?
8. What future implications can this lead for the field of engineering education from
a student perspective? Do you believe this helps in applying the classroom
environment to the industrial/post-graduate environment of engineering?