Embed Size (px)
Citation preview
Johnson & Wales UniversityScholarsArchive@JWU
K-12 Education Center for Research and Evaluation
10-20-2010
Implementation of Formative AssessmentStrategies Perceived by High School Students andTeachers: Professional Development ImplicationsRalph JasparroJohnson & Wales University - Providence, [email protected]
Rosemary BurnsJohnson & Wales University - Providence
Follow this and additional works at: https://scholarsarchive.jwu.edu/k12_ed
Part of the Education Commons
This Conference Proceeding is brought to you for free and open access by the Center for Research and Evaluation at ScholarsArchive@JWU. It hasbeen accepted for inclusion in K-12 Education by an authorized administrator of ScholarsArchive@JWU. For more information, please [email protected].
Repository CitationJasparro, Ralph and Burns, Rosemary, "Implementation of Formative Assessment Strategies Perceived by High School Students andTeachers: Professional Development Implications" (2010). K-12 Education. 20.https://scholarsarchive.jwu.edu/k12_ed/20
Implementation of Formative Assessment Strategies Perceived by
High School Students and Teachers:
Professional Development Implications
Ralph Jasparro
Johnson & Wales University
Rosemary Burns
Johnson & Wales University
________________________ Paper presented at the 41th annual meeting of the Northeastern Educational
Research Association, October 20, 2010, Rocky Hill, CT.
2
Purpose of the Study
The purpose of this study was to investigate three questions relating to formative
assessment. Question 1 examined the level of implementation of formative assessment
strategies among high school teachers and students. Question 2 analyzed the level of
agreement between teachers and students perceptions of levels of implementation of
formative assessment strategies. Finally, Question 3 investigated the relationship of the
disciplines teachers taught; the amount and kinds of professional development teachers
had; and district urbanicity relative to teacher levels of implementation of formative
assessment strategies.
Framework
Formative assessment is a systematic process to continuously gather evidence
about learning for both student and teacher. The data are used by teachers to identify a
student’s current level of learning and to adapt lessons to help the student reach the
desired learning goal. Students use formative assessment strategies to guide
themselves toward independent learning (Brookhart, 2009; Guskey, 2003; Heritage,
2007). Implementing classroom assessment for learning, or formative assessment,
improves student achievement (Arter, 2009; Black & Wiliam, 1998; Brookhart, 2009;
Chappuis, Chappuis, & Stiggins, 2009; Heritage, 2007; Hess, 2010; Popham, 2008;
Thompson & William). Recognition of the effectiveness of formative assessment comes
at a time when our nation is choosing to focus and fund high-stakes summative tests as
the sole instrument needed to evaluate all educational stakeholders (Bracey, 2009) and
not on building teacher capacity to capitalize on the research proven effective
instructional strategies of formative assessment (Elmore, 2007; Stiggins, 2002).
3
The theoretical foundation for this research is embedded in social constructivism. In
order to work with and support a social-constructivist model of learning and teaching,
classroom assessment must change to better represent critical thinking and problem
solving skills in each content area. Additionally, assessment processes must change in
the way in which it is used and thought about by teachers and students (Shepard,
2000). When determining what students know and can do, a social constructivist model
of assessment engages students to test what they know with their peers, during self-
evaluation, and through a variety of modalities (Brooks & Brooks, 1993). Knowing that
students learn in diverse ways means providing students with opportunities to express
their knowledge in different and authentic ways. Therefore, a “broader range of
assessment tools is needed to capture important learning goals and processes and to
more directly connect assessment to ongoing instruction” (Shepard, 2000, p. 8).
Methodology
Sample
A total of N = 129 high school students in grades 9 – 12 from an urban, suburban,
and urban ring community secured parent permission and completed a questionnaire
entitled Formative Assessment Use Scale – Students. A total of N = 137 teachers from
each of the same schools completed the Formative Assessment Use Scale – Teachers.
A total of N = 28 students and N = 19 teachers were interviewed in focus groups from
these same N = 3 schools. Students participated during non-academic advisory
periods. Teachers in the urban and suburban schools completed the questionnaires
with the researcher available to respond to questions after school during faculty
meetings, while teachers in the urban-ring school completed them on their own time
4
with a handout of explicit directions. Interviews took place during common preparation
periods during the school day.
Instrumentation
Questionnaires entitled, Formative Assessment Use Scale – Teachers and
Formative Assessment Use Scale – Students, containing demographic items were
employed. The survey was specifically designed for this study and developed by the
researcher. The 13 quantitative items ask teachers and students to respond to the level
(almost never - 1, sometimes - 2, usually - 3, and almost always - 4) with which they use
specific research based formative assessment strategies. The teacher and student
items sought the exact same information in the same order, but the wording was
modified to represent the participants’ perspective as teacher or student. Volunteer
students (n = 5) and teachers (n = 5) piloted each survey prior to their use. The pilot
survey participants provided feedback regarding their recommendations and
interpretations of the questions and recommendations (Borg, et al., 2007).
Interview guides support trustworthiness, dependability, and credibility of the
qualitative data (Lincoln & Guba, 1985; Rubin & Rubin, 1995). Examples of the
questions in the teacher interview guide are: How do you know how students are
progressing? What do you do with that information? What are professional
development opportunities available to teachers to support these strategies? Examples
of student questions are: How do you know what is expected of you to learn? What are
the ways that you measure your progress in school? The panel of content experts also
reviewed the interview questions.
5
Validity and Reliability. Content validity was supported through the literature,
(Black & Wiliam, 1998a; Shepard, 2000; Thompson & Wiliam, 2008), and expert
judgment concerning formative assessment strategies. The questionnaires were
reviewed by a panel of N = 5 formative assessment experts which included Dr. Karin
Hess from the National Center for the Improvement of Educational Assessment; Rick
Richards, School Improvement Specialist at the RI Department of Education; Dr. Anne
Seitsinger, Director of the National Center on Public Education and Social Policy, and
n = 2 RI Association of Secondary School Principals (Creswell, 2003; Borg et al., 2007).
The survey was piloted with n = 5 teachers and n = 5 students for understanding of the
instructions, the content of the items, and the response format employed. The total
teacher population was N = 254. The response rate for the teacher surveys was
137/254. The total student population selected for this study was N = 180 and the
response rate was 129/180.
Data Analysis
Research Question 1 was analyzed through descriptive statistics such as
frequencies, percentages, means, and standard deviation. These data reflect the
reported levels of implementation of formative assessment strategies by teachers and
students. Cronbach’s alpha reliability coefficient of at least .80 was achieved to
determine internal consistency of individual responses to the set items
Research Question 2 was analyzed utilizing t-tests at the dimension and item levels.
These analyses described the differences between the levels reported by teachers and
students. Using the Bonferroni adjustment, the significant level for the 13 item level
comparisons were set at .001 and effect sizes were reported.
6
Research Question 3 examined the relationship between teachers’ reported levels of
implementation of formative assessment strategies and the four independent variables:
content discipline taught, amount and kinds of professional development, and district
urbanicity. Data analysis of both dependent and independent variables generated
descriptive statistics. A one-way ANOVA indicated significant differences of perceptions
of implementation levels. Additionally, using a Pearson product-moment correlation
found significant relationships regarding kinds and amount of professional development
received relative to reported levels of implementation. Finally, a one-way ANOVA was
used to examine differences among and between each district relative to their levels of
implementation of formative assessment strategies.
The qualitative data derived through interviews and the open-ended questions on the
questionnaire of teachers and students were used to corroborate responses on the
quantitative aspect of the questionnaire. Each data set was analyzed to discover
themes through the long-table approach (Patton, 2002). An audit trail and a third party
completed verification. The researcher merged the two data sets so that a complete
picture was developed regarding the extent that the quantitative and qualitative data
converge and confirm. The technique for merging the two data sets was through
discussion, or narrative descriptions and quotes, from the qualitative data describing a
statistical report (Creswell & Plano Clark, 2007).
Results
What Teachers Reported
Teachers among the three schools indicated that they include formative assessment
strategies throughout the instructional period. Ranked highest in response, teachers
7
stated that they plan their formative assessment ahead of time (M = 3.16), continually
modify their instruction based on student feedback (M = 3.3), and engage students in
activities and problem solving in the same ways they will ultimately be tested (M = 3.28).
As questions on the survey asked teachers of their use of specific strategies, rates of
implementation began to fall. Ranked within the medium rate of implementation,
somewhat more than half of the teachers stated that they often use rubrics aligned to
standards (M = 2.92) and that they schedule class time for students to revise their work
(M = 2.91). Teachers reported low rates of implementation of providing students time
for student peer assessment (M = 2.48) and quizzing without grading (M = 2.19).
Qualitative data corroborated these findings; however, 56% of teachers stated that their
preferred formative assessments were summative assessments such as common end-
of-course assessments.
What Students Reported
Students reported high levels of implementation of only one formative assessment
strategy, their opportunities to use rubrics aligned to standards (M = 3.11). Following,
students stated that their teachers ask them open-ended questions (M = 2.97) and that
they are shown examples of student work assessed against rubrics aligned to
standards. Far fewer students indicated that they are given time during class to revise
their work (M = 2.33) or that teachers change their instructional approach when they do
not do well on quizzes (M = 2.03). Qualitative data corroborated these findings.
Additionally, when students were asked how they best recognized their own progress in
learning, 80% of respondents based it on their grades. Deeper inquiry during student
interviews found that students perceive that their grades are a number that represents
8
many forms of differently weighted data, depending on which teacher and/or department
who is grading. Interestingly though, 58%, stated that they believe teachers consider
their overall knowledge, not just their grades, when determining how students are
learning. I believe teachers don't go by grades, but understanding if I get what they are
asking, I am doing something correctly, stated a student from the urban-ring school.
Similarities and Differences between Student and Teacher Perceptions
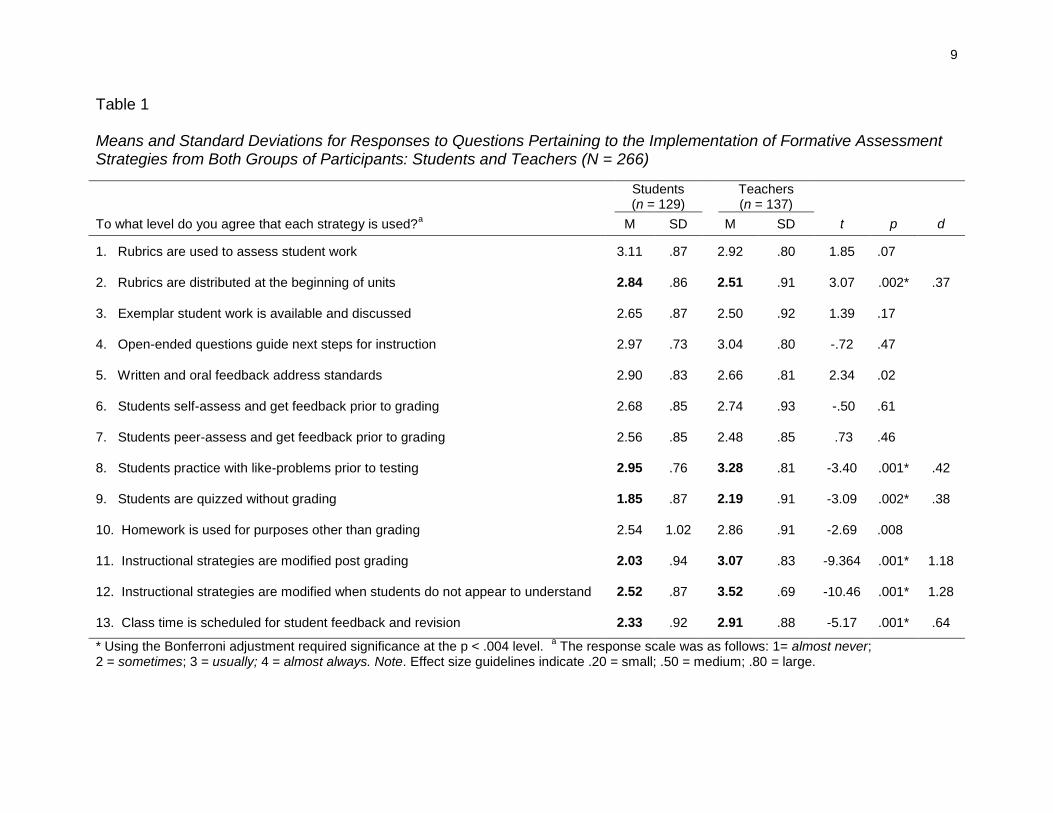
Research Question 2 examined if the levels of reported implementation of formative
assessment strategies were similar for teachers and students. Table 1 presents item
means, standard deviations, and t test data, for questions that probe whether there is
agreement between students and teachers on the perceived levels of implementation of
formative assessment strategies used in the classroom. There were six areas of
significant disagreement between students and teachers.
The greatest area of disagreement came in response to questions regarding teacher
modification of instruction. Teachers ranked these items the highest while students
ranked these toward the bottom. Item 11, Teachers change the way they teach me
when I do not do well on a quiz or test, students reported a very low sometimes (M =
2.03) with a wide deviation, (SD = .94). Teachers’ response to item 11, I modify my
instructional strategy when a student does not do well on a quiz or assessment, was
significantly higher (M = 3.07, SD = .83). The researcher calculated an effect size of (d
= 1.18) with respect to the difference of perceptions in the student and teacher mean
scores (Cohen, 1988). Based on the guidelines provided by Cohen, an effect size of
(d = 1.18) would be considered in the large range. The second question about teacher
modification of instruction when students do not appear to comprehend concepts, the
9
Table 1 Means and Standard Deviations for Responses to Questions Pertaining to the Implementation of Formative Assessment Strategies from Both Groups of Participants: Students and Teachers (N = 266)
Students (n = 129)
Teachers (n = 137)
To what level do you agree that each strategy is used?a M SD M SD t p d
1. Rubrics are used to assess student work 3.11 .87 2.92 .80 1.85 .07
2. Rubrics are distributed at the beginning of units 2.84 .86 2.51 .91 3.07 .002* .37
3. Exemplar student work is available and discussed 2.65 .87 2.50 .92 1.39 .17
4. Open-ended questions guide next steps for instruction 2.97 .73 3.04 .80 -.72 .47
5. Written and oral feedback address standards 2.90 .83 2.66 .81 2.34 .02
6. Students self-assess and get feedback prior to grading 2.68 .85 2.74 .93 -.50 .61
7. Students peer-assess and get feedback prior to grading 2.56 .85 2.48 .85 .73 .46
8. Students practice with like-problems prior to testing 2.95 .76 3.28 .81 -3.40 .001* .42
9. Students are quizzed without grading 1.85 .87 2.19 .91 -3.09 .002* .38
10. Homework is used for purposes other than grading 2.54 1.02 2.86 .91 -2.69 .008
11. Instructional strategies are modified post grading 2.03 .94 3.07 .83 -9.364 .001* 1.18
12. Instructional strategies are modified when students do not appear to understand 2.52 .87 3.52 .69 -10.46 .001* 1.28
13. Class time is scheduled for student feedback and revision 2.33 .92 2.91 .88 -5.17 .001* .64
* Using the Bonferroni adjustment required significance at the p < .004 level. a The response scale was as follows: 1= almost never;
2 = sometimes; 3 = usually; 4 = almost always. Note. Effect size guidelines indicate .20 = small; .50 = medium; .80 = large.
10
mean score for this question was significantly lower (p =.001) for students (M = 2.52,
SD = .87) than for teachers (M = 3.52, SD = .69). The calculated effect size of (d =
1.28) is also considered in the large range (Cohen, 1998). Students perceive that they
are provided less time to get feedback and revise their work (M = 2.33, SD = .92) than
their teachers (M = 2.91, SD = .88). The calculated effect size is considered in a
medium/large range at (d = .64). When considering opportunities to engage in and get
feedback on the kinds of problems that will be on tests, students reports significantly
less chances (M = 2.95, SD = .76), than do teachers (M = 3.28, SD = .81). The effect
size is considered in the small to medium range (d = .42) (Cohen, 1988).
While students and teachers agree that rubrics are used to assess, they do not
agree upon when those rubrics are distributed. Students report that they are passed
out at the beginning of the unit more so (M = 2.84, SD = .86) than do their teachers (M =
2.51, SD = .91). The effect size is small to medium at (d = .37). Finally, in regards to
students being quizzed on their knowledge without grades being recorded, students
state that they believe they are being graded more so (M = 1.85, SD = .87) than their
teachers do (M = 2.19, SD, = .91). The effect size calculated in this instance is also
small to medium at (d = .38).
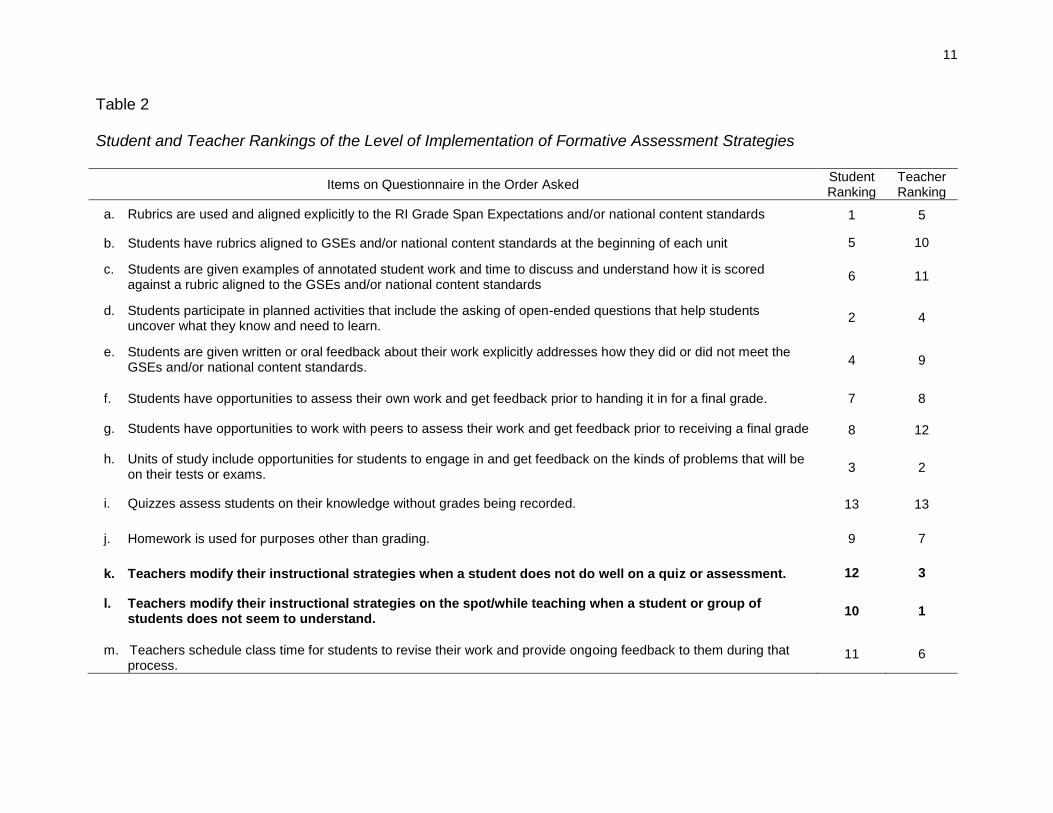
Table 2 illustrates the ranking in decreasing order of students and teachers
perceptions of the level of implementation of formative assessment strategies in all
three schools. An important finding in this part of the survey was the recognition of how
differently students and teachers perceive the overall implementation of formative
assessment in their schools.
11
Table 2
Student and Teacher Rankings of the Level of Implementation of Formative Assessment Strategies
Items on Questionnaire in the Order Asked Student Ranking
Teacher Ranking
a. Rubrics are used and aligned explicitly to the RI Grade Span Expectations and/or national content standards
1 5
b. Students have rubrics aligned to GSEs and/or national content standards at the beginning of each unit
5 10
c. Students are given examples of annotated student work and time to discuss and understand how it is scored against a rubric aligned to the GSEs and/or national content standards
6 11
d. Students participate in planned activities that include the asking of open-ended questions that help students uncover what they know and need to learn.
2 4
e. Students are given written or oral feedback about their work explicitly addresses how they did or did not meet the GSEs and/or national content standards.
4 9
f. Students have opportunities to assess their own work and get feedback prior to handing it in for a final grade.
7 8
g. Students have opportunities to work with peers to assess their work and get feedback prior to receiving a final grade
8 12
h. Units of study include opportunities for students to engage in and get feedback on the kinds of problems that will be on their tests or exams.
3 2
i. Quizzes assess students on their knowledge without grades being recorded.
13 13
j. Homework is used for purposes other than grading.
9 7
k. Teachers modify their instructional strategies when a student does not do well on a quiz or assessment.
12 3
l. Teachers modify their instructional strategies on the spot/while teaching when a student or group of students does not seem to understand.
10 1
m. Teachers schedule class time for students to revise their work and provide ongoing feedback to them during that process.
11 6
12
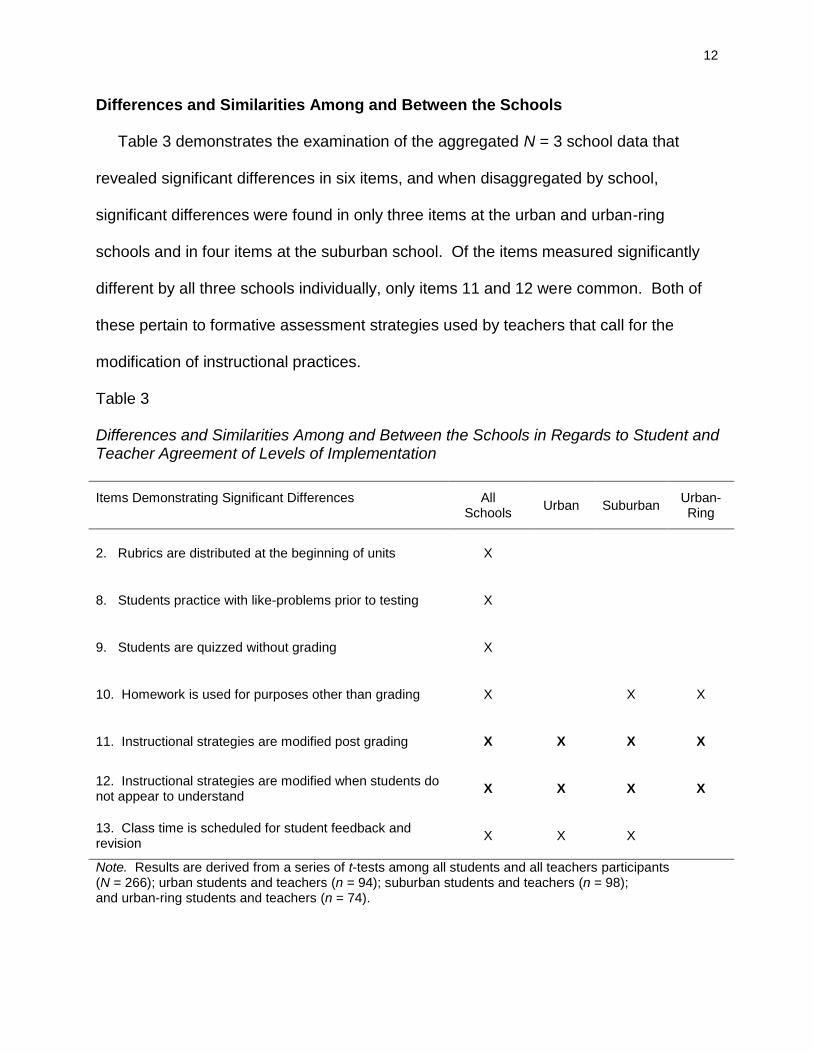
Differences and Similarities Among and Between the Schools
Table 3 demonstrates the examination of the aggregated N = 3 school data that
revealed significant differences in six items, and when disaggregated by school,
significant differences were found in only three items at the urban and urban-ring
schools and in four items at the suburban school. Of the items measured significantly
different by all three schools individually, only items 11 and 12 were common. Both of
these pertain to formative assessment strategies used by teachers that call for the
modification of instructional practices.
Table 3 Differences and Similarities Among and Between the Schools in Regards to Student and Teacher Agreement of Levels of Implementation
Items Demonstrating Significant Differences
All Schools
Urban Suburban Urban-Ring
2. Rubrics are distributed at the beginning of units X
8. Students practice with like-problems prior to testing X
9. Students are quizzed without grading X
10. Homework is used for purposes other than grading X X X
11. Instructional strategies are modified post grading X X X X
12. Instructional strategies are modified when students do not appear to understand
X X X X
13. Class time is scheduled for student feedback and revision
X X X
Note. Results are derived from a series of t-tests among all students and all teachers participants (N = 266); urban students and teachers (n = 94); suburban students and teachers (n = 98); and urban-ring students and teachers (n = 74).
13
Relationship of Discipline Taught to Levels of Implementation
Teacher demographics by discipline indicate the following number and total
percentages: arts (n = 11, 8%), English, (n = 22, 16%), mathematics (n = 21, 16%),
science (n = 19, 14%), social studies (n = 14, 10%), World Language (n = 14, 10%),
special education (n = 19, 15%), and other (n = 14, 10%). Included in the classification
of other are health and physical education, business, and technology educators.
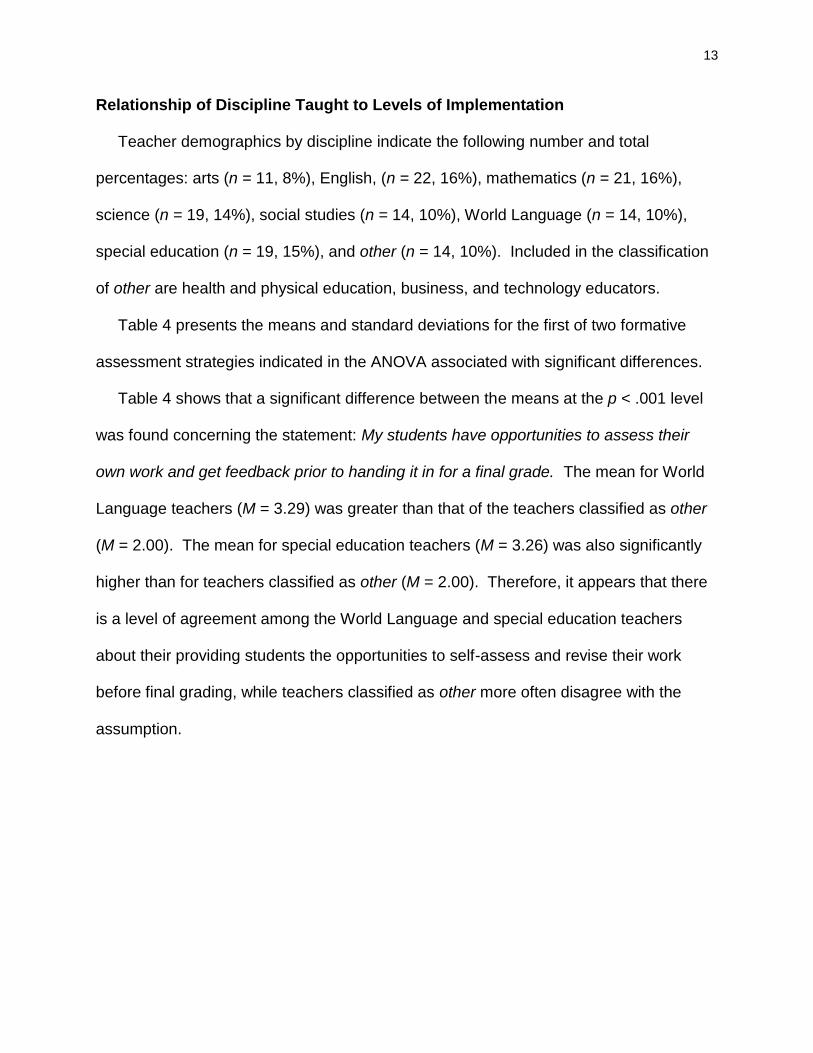
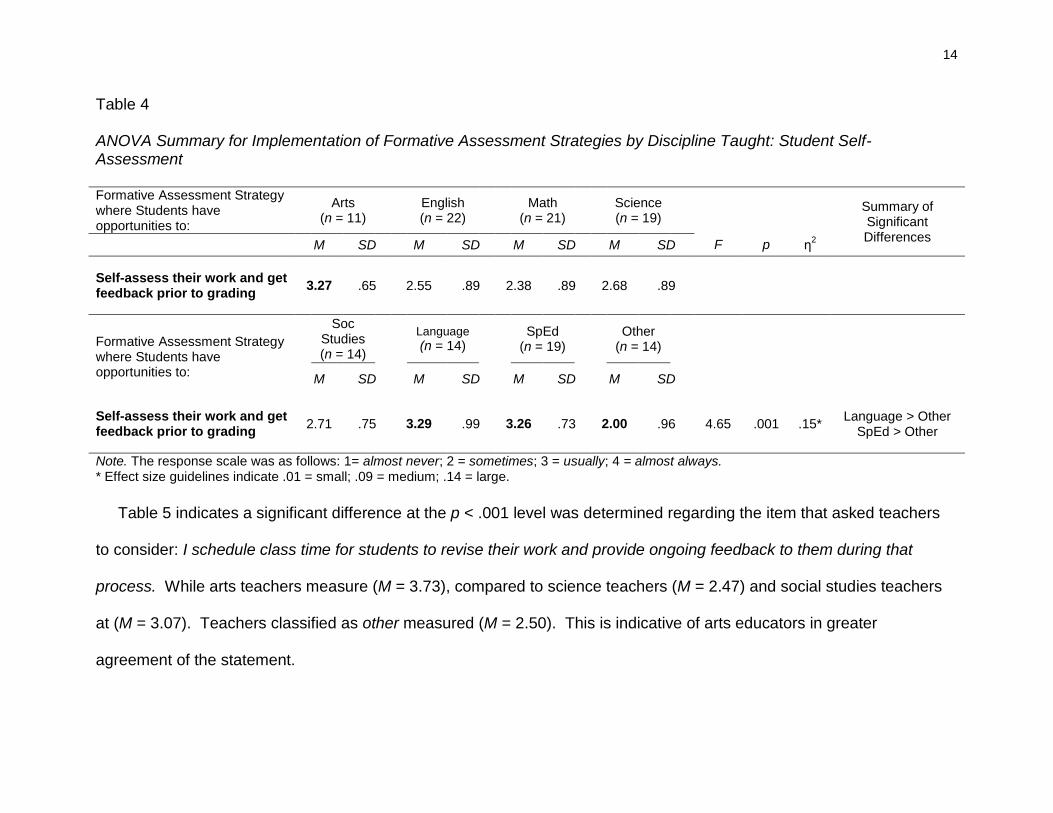
Table 4 presents the means and standard deviations for the first of two formative
assessment strategies indicated in the ANOVA associated with significant differences.
Table 4 shows that a significant difference between the means at the p < .001 level
was found concerning the statement: My students have opportunities to assess their
own work and get feedback prior to handing it in for a final grade. The mean for World
Language teachers (M = 3.29) was greater than that of the teachers classified as other
(M = 2.00). The mean for special education teachers (M = 3.26) was also significantly
higher than for teachers classified as other (M = 2.00). Therefore, it appears that there
is a level of agreement among the World Language and special education teachers
about their providing students the opportunities to self-assess and revise their work
before final grading, while teachers classified as other more often disagree with the
assumption.
14
Table 4 ANOVA Summary for Implementation of Formative Assessment Strategies by Discipline Taught: Student Self-Assessment Formative Assessment Strategy where Students have opportunities to:
Arts
(n = 11)
English (n = 22)
Math
(n = 21)
Science (n = 19)
F
p
η2
Summary of Significant Differences M SD M SD M SD M SD
Self-assess their work and get feedback prior to grading
3.27 .65 2.55 .89 2.38 .89 2.68 .89
Soc Studies (n = 14)
Language
(n = 14)
SpEd (n = 19)
Other
(n = 14)
Formative Assessment Strategy where Students have opportunities to:
M SD M SD M SD M SD
Self-assess their work and get feedback prior to grading
2.71 .75 3.29 .99 3.26 .73 2.00 .96 4.65 .001 .15* Language > Other
SpEd > Other
Note. The response scale was as follows: 1= almost never; 2 = sometimes; 3 = usually; 4 = almost always. * Effect size guidelines indicate .01 = small; .09 = medium; .14 = large.
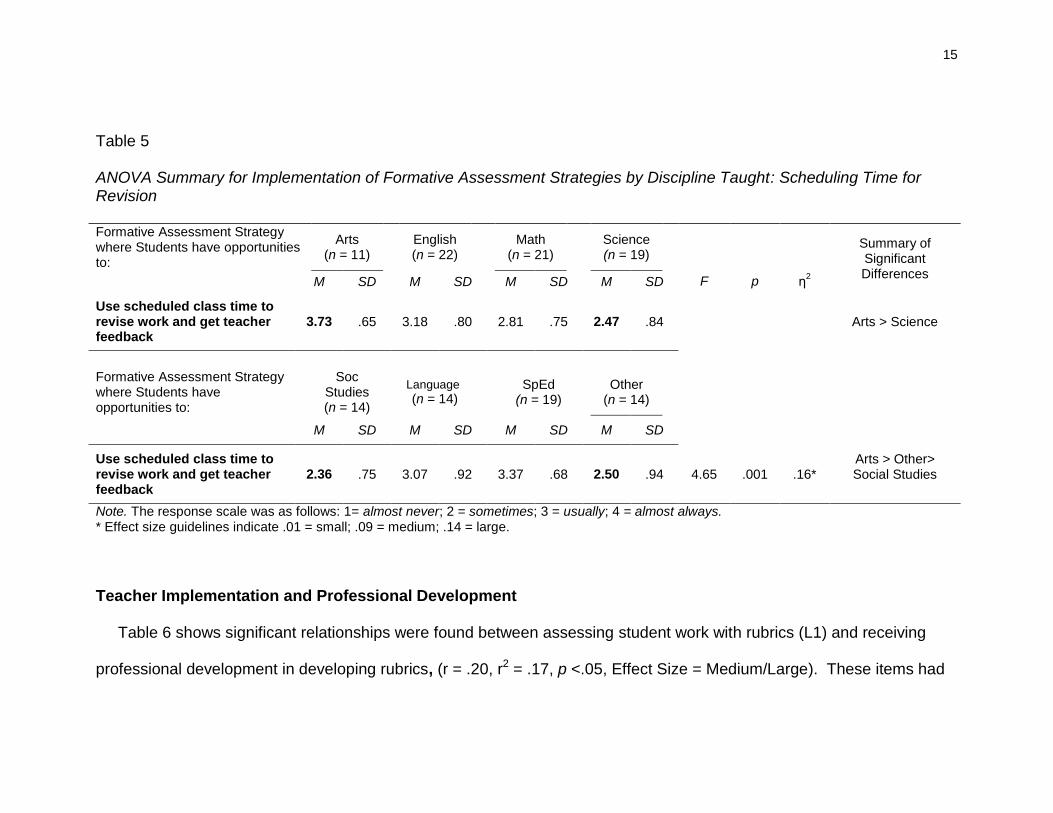
Table 5 indicates a significant difference at the p < .001 level was determined regarding the item that asked teachers
to consider: I schedule class time for students to revise their work and provide ongoing feedback to them during that
process. While arts teachers measure (M = 3.73), compared to science teachers (M = 2.47) and social studies teachers
at (M = 3.07). Teachers classified as other measured (M = 2.50). This is indicative of arts educators in greater
agreement of the statement.
15
Table 5 ANOVA Summary for Implementation of Formative Assessment Strategies by Discipline Taught: Scheduling Time for Revision Formative Assessment Strategy where Students have opportunities to:
Arts (n = 11)
English (n = 22)
Math
(n = 21)
Science (n = 19)
F
p
η2
Summary of Significant Differences M SD M SD M SD M SD
Use scheduled class time to revise work and get teacher feedback
3.73 .65 3.18 .80 2.81 .75 2.47 .84 Arts > Science
Formative Assessment Strategy where Students have opportunities to:
Soc
Studies (n = 14)
Language
(n = 14)
SpEd (n = 19)
Other
(n = 14)
M SD M SD M SD M SD
Use scheduled class time to revise work and get teacher feedback
2.36 .75 3.07 .92 3.37 .68 2.50 .94 4.65 .001 .16* Arts > Other> Social Studies
Note. The response scale was as follows: 1= almost never; 2 = sometimes; 3 = usually; 4 = almost always. * Effect size guidelines indicate .01 = small; .09 = medium; .14 = large.
Teacher Implementation and Professional Development
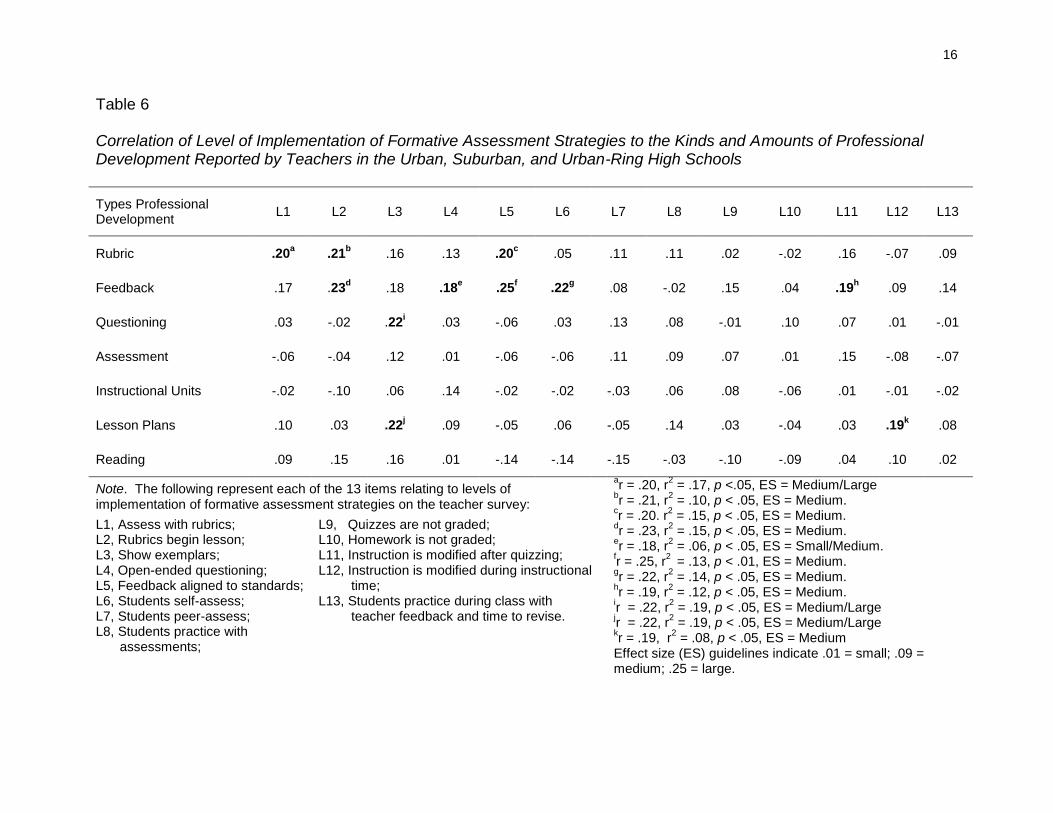
Table 6 shows significant relationships were found between assessing student work with rubrics (L1) and receiving
professional development in developing rubrics, (r = .20, r2 = .17, p <.05, Effect Size = Medium/Large). These items had
16
Table 6 Correlation of Level of Implementation of Formative Assessment Strategies to the Kinds and Amounts of Professional Development Reported by Teachers in the Urban, Suburban, and Urban-Ring High Schools
Types Professional Development
L1 L2 L3 L4 L5 L6 L7 L8 L9 L10 L11 L12 L13
Rubric .20a .21
b .16 .13 .20
c .05 .11 .11 .02 -.02 .16 -.07 .09
Feedback .17 .23d .18 .18
e .25
f .22
g .08 -.02 .15 .04 .19
h .09 .14
Questioning .03 -.02 .22i .03 -.06 .03 .13 .08 -.01 .10 .07 .01 -.01
Assessment -.06 -.04 .12 .01 -.06 -.06 .11 .09 .07 .01 .15 -.08 -.07
Instructional Units -.02 -.10 .06 .14 -.02 -.02 -.03 .06 .08 -.06 .01 -.01 -.02
Lesson Plans .10 .03 .22j .09 -.05 .06 -.05 .14 .03 -.04 .03 .19
k .08
Reading .09 .15 .16 .01 -.14 -.14 -.15 -.03 -.10 -.09 .04 .10 .02
Note. The following represent each of the 13 items relating to levels of implementation of formative assessment strategies on the teacher survey:
ar = .20, r
2 = .17, p <.05, ES = Medium/Large
br = .21, r
2 = .10, p < .05, ES = Medium.
cr = .20. r
2 = .15, p < .05, ES = Medium.
dr = .23, r
2 = .15, p < .05, ES = Medium.
er = .18, r
2 = .06, p < .05, ES = Small/Medium.
fr = .25, r
2 = .13, p < .01, ES = Medium.
gr = .22, r
2 = .14, p < .05, ES = Medium.
hr = .19, r
2 = .12, p < .05, ES = Medium.
ir = .22, r
2 = .19, p < .05, ES = Medium/Large
jr = .22, r
2 = .19, p < .05, ES = Medium/Large
kr = .19, r
2 = .08, p < .05, ES = Medium
Effect size (ES) guidelines indicate .01 = small; .09 = medium; .25 = large.
L1, Assess with rubrics; L2, Rubrics begin lesson; L3, Show exemplars; L4, Open-ended questioning; L5, Feedback aligned to standards; L6, Students self-assess; L7, Students peer-assess; L8, Students practice with
assessments;
L9, Quizzes are not graded; L10, Homework is not graded; L11, Instruction is modified after quizzing; L12, Instruction is modified during instructional
time; L13, Students practice during class with
teacher feedback and time to revise.
17
a positive correlation indicating that there was a consistent relationship between those
who answered positively about assessing using rubrics, and those that answered
positively about receiving professional development on this same topic. Thus,
individuals who use rubrics as a strategy to assess student work may be being
influenced by the professional development they receive about rubric development.
Significance was found in a number of the relationships pertaining to the professional
development topic regarding the provision of feedback to students that is aligned to
learning goals. Item 5 (L5) on the questionnaire states, The written or oral feedback
that I give students about their work explicitly addresses how they did or did not meet
the standards. In Table 2, teachers ranked it 9th out of 13 strategies. There was a
significant positive correlation (r = .25, r2 = .13, p < .01, Effect Size = Medium) between
the use of feedback strategies and the amount of professional development on this
same topic that teachers report they have received. This may indicate that the
professional development received was insufficient.
There was a significant positive relationship found between the level of
implementation of the use of exemplar student work that was assessed based on
standards (L3) and the attendance at professional development with the topic of,
Developing lesson plans that include planned formative assessment strategies during
the learning process (r = .22, r2 = .19, p < .05, Effect Size = Medium/Large). In Table 2,
teachers ranked their use of this strategy in tenth place out of thirteen items. Therefore,
it may be that the professional development teachers received in this regard did not
strongly recommend teachers to plan to present exemplar student work as a model for
students who are engaged in learning a similar concept or skill.
18
A significant positive relationship was demonstrated between the level of
implementation of teachers modifying their instruction on the spot during instructional
time (L12) and the professional development topic regarding how to develop lesson
plans that include formative assessment strategies during the instructional phase of
teaching (r = .22, r2 = .19, p < .05, Effect Size = Medium/Large). Teachers ranked
modifying their instruction during this time as the formative assessment strategy most
implemented (M = 3.52, SD = .69). According to the findings in Table 2, where student
and teacher agreement on the same question was measured, a significant difference
was indicated. Therefore, those teachers who responded positively to implementing
this strategy, responded significantly similarly to getting professional development to
support the modification of instruction when students are not learning; however,
students did not report the benefits (M = 2.52; SD = .87).
Relationship of Levels of Implementation to Urbanicity
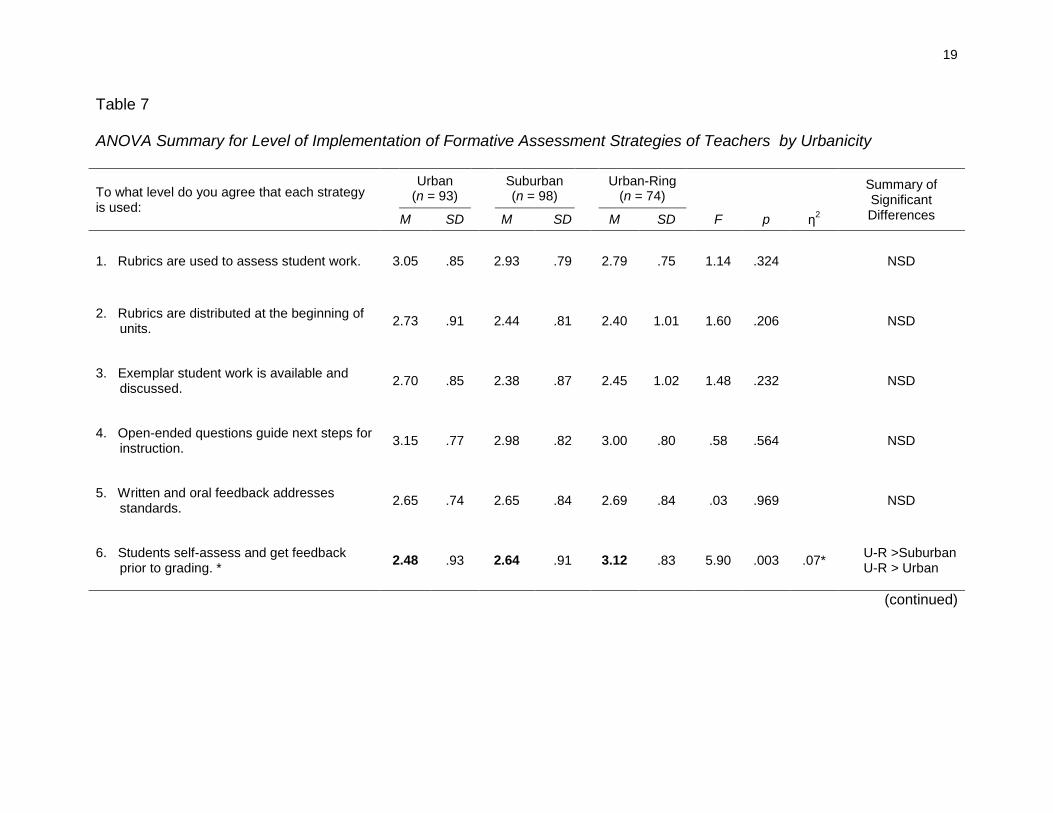
Table 7 presents the significant differences among the levels of implementation of
formative assessment strategies reported by teachers in relation to each school’s
urbanicity. Upon examination of the results of the ANOVA, two items emerged as
significant.
In regards to the statement, My students have opportunities to assess their own work
and get feedback prior to handing it in for a final grade, significance at the p = .003 level
was determined, followed by a post-hoc Scheffé. Teachers in the urban-ring school (M
= 3.12, SD = .83) responded positively, significantly more than both the urban (M =
2.48, SD = .93) and suburban (M = 2.64, SD = .91) schoolteachers.
19
Table 7 ANOVA Summary for Level of Implementation of Formative Assessment Strategies of Teachers by Urbanicity
To what level do you agree that each strategy is used:
Urban
(n = 93)
Suburban (n = 98)
Urban-Ring
(n = 74)
Summary of Significant Differences M SD M SD M SD F p η
2
1. Rubrics are used to assess student work. 3.05 .85 2.93 .79 2.79 .75 1.14 .324 NSD
2. Rubrics are distributed at the beginning of units.
2.73 .91 2.44 .81 2.40 1.01 1.60 .206 NSD
3. Exemplar student work is available and discussed.
2.70 .85 2.38 .87 2.45 1.02 1.48 .232 NSD
4. Open-ended questions guide next steps for instruction.
3.15 .77 2.98 .82 3.00 .80 .58 .564 NSD
5. Written and oral feedback addresses standards.
2.65 .74 2.65 .84 2.69 .84 .03 .969 NSD
6. Students self-assess and get feedback prior to grading. *
2.48 .93 2.64 .91 3.12 .83 5.90 .003 .07* U-R >Suburban U-R > Urban
(continued)
20
Table 7 ANOVA Summary for Level of Implementation of Formative Assessment Strategies of Teachers by Urbanicity (continued)
To what level do you agree that each strategy is used?
a
Urban
(n = 93)
Suburban (n = 98)
Urban-Ring
(n = 74)
Summary of Significant Differences M SD M SD M SD F p η
2
7. Students peer-assess and get feedback
prior to grading. 2.58 .93 2.35 .76 2.57 .86 1.19 .309
NSD
8. Students practice with like-problems prior to testing.
3.10 .84 3.31 .87 3.40 .67 1.53 .219 NSD
9. Students are quizzed without grading. 2.28 .99 2.16 .92 2.14 .84 .25 .779 NSD
10. Homework is used for purposes other than grading.
2.62 .99 2.92 .82 3.02 .90 2.27 .108 NSD
11. Instructional strategies are modified post grading.
3.00 .82 3.09 .89 3.12 .77 .23 .794 NSD
12. Instructional strategies are modified when students do not appear to understand. **
3.30 .72 3.57 .72 3.67 .57 3.27 .041 .03 U-R > Urban
13. Class time is scheduled for student feedback and revision.
2.78 .83 3.04 .86 2.86 .95 1.11 .333 NSD
Note. NSD = No Significant Difference. Post-hoc Scheffé mean difference is significant at the p = 0.05 level. ** Using the Bonferroni adjustment required significance at the p < .004 level. * Effect size guidelines indicate .01 = small; .09 = medium; .14 = large. .
a The response scale was as follows: 1= almost never;
2 = sometimes; 3 = usually; 4 = almost always
21
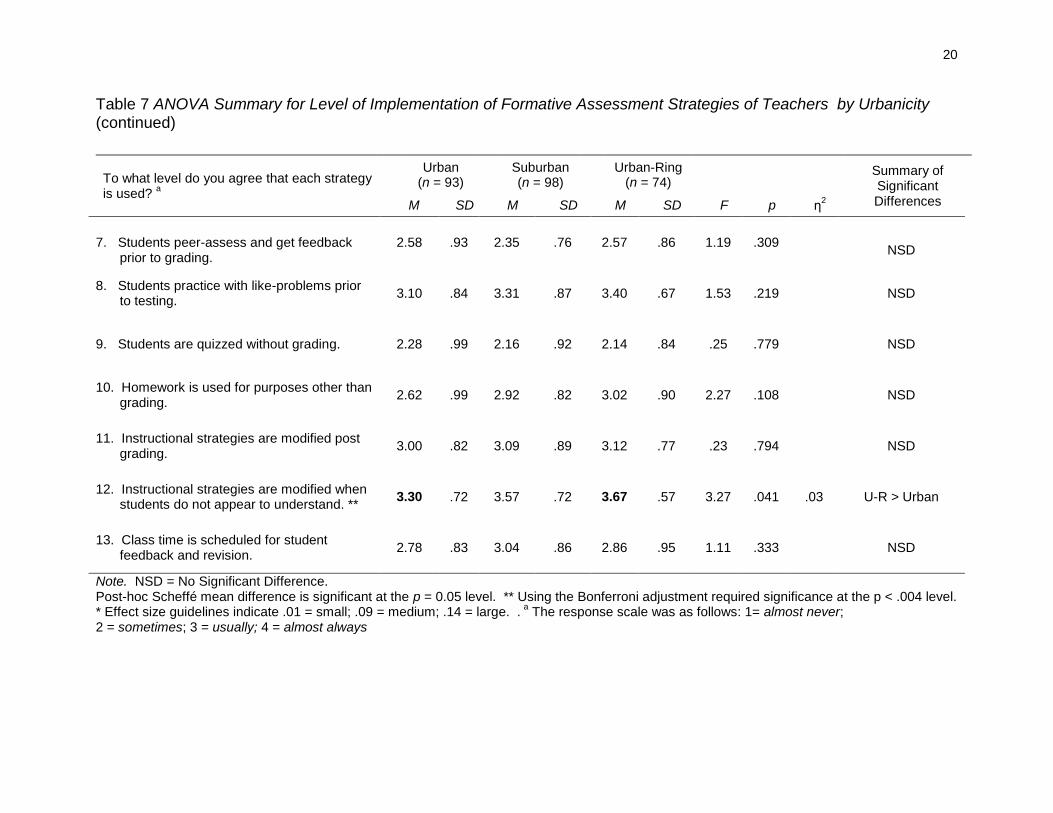
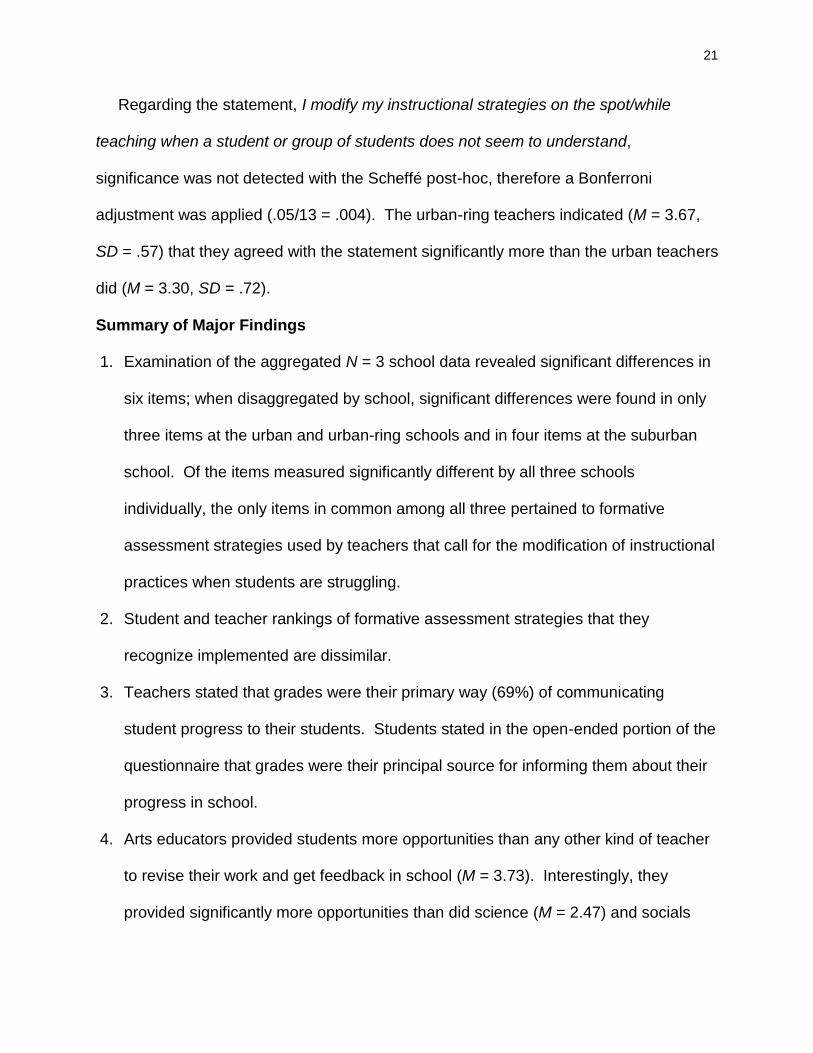
Regarding the statement, I modify my instructional strategies on the spot/while
teaching when a student or group of students does not seem to understand,
significance was not detected with the Scheffé post-hoc, therefore a Bonferroni
adjustment was applied (.05/13 = .004). The urban-ring teachers indicated (M = 3.67,
SD = .57) that they agreed with the statement significantly more than the urban teachers
did (M = 3.30, SD = .72).
Summary of Major Findings
1. Examination of the aggregated N = 3 school data revealed significant differences in
six items; when disaggregated by school, significant differences were found in only
three items at the urban and urban-ring schools and in four items at the suburban
school. Of the items measured significantly different by all three schools
individually, the only items in common among all three pertained to formative
assessment strategies used by teachers that call for the modification of instructional
practices when students are struggling.
2. Student and teacher rankings of formative assessment strategies that they
recognize implemented are dissimilar.
3. Teachers stated that grades were their primary way (69%) of communicating
student progress to their students. Students stated in the open-ended portion of the
questionnaire that grades were their principal source for informing them about their
progress in school.
4. Arts educators provided students more opportunities than any other kind of teacher
to revise their work and get feedback in school (M = 3.73). Interestingly, they
provided significantly more opportunities than did science (M = 2.47) and socials
22
studies (M = 3.07) teachers, as well as teachers categorized as other (M = 2.50).
Providing these opportunities seems natural in the arts areas where students are
generally given considerable time to work on their assignments in class. However,
it was surprising that in science, where students are expected to inquire and
experiment with concepts and structures, science teachers indicated few
opportunities for students to revise and get feedback during school.
5. Teachers from the urban-ring and suburban schools spoke at length about the kinds
of professional development that was being offered directly by the school or district.
These teachers reported that the school leadership, in conjunction with the School
Improvement Team, planned and funded PD that was directly embedded into their
instructional practices. Whether it was calibrating assessment scoring or learning
how to use notebook sized White-Boards with a classroom full of students, teachers
spoke of the fact that it was available for all teachers and, in some cases, required.
Their only complaint on this regard was that they wanted more.
6. At the end of the teacher questionnaire, after many questions focused on strategies
that may provide snapshots of student progress, teachers were asked to describe
the formative assessment strategy that they used most. The results of this question
made it clear that most teachers do not yet understand formative assessment. Of
the N = 69 responses, n = 49 indicated that summative assessments were their
preferred formative assessment.
Educational Implications
Implementing formative assessment strategies is recognized to be effective for
improving student achievement. The strategies are grounded in social/constructivist
23
learning theory and supported by decades of research. Teachers, who participate in
well planned, scaffolded, and supportive professional development and continually work
with their colleagues, are able to assess and appropriately modify their instruction
based on these assessments. When properly implemented, students develop greater
self-efficacy in their skills toward becoming self-regulated learners.
In this political climate of “Race To The Top” where teachers, administrators, and
state education leaders are now competing for their virtual existence, the stakes for are
higher than ever. Unfortunately, the selected strategies are large-scale testing
companies to develop larger tests and multiple smaller scale products, including
multiple annual interim tests, tenth grade college and career readiness tests, and so
called formative assessments that mimic the large annual test. To qualify for sparse
federal education funds, states are changing laws, to include evaluating teachers based
on student achievement measured against large-scale tests. However, the rush to the
top, and to success, must not become a barrier for improving instruction and local
assessment. Leaders must recognize that real achievement will only occur when
systems of balanced assessment includes formative assessment defined and
implemented in a way to support students in their ability to become independent
learners. Additionally, formative assessment must be implemented in conjunction with
significant professional development.
The results of this study found that, while many high school students and teachers
are beginning to implement a few formative assessment strategies in this North Eastern
state, there is a tremendous distance to go before improved student achievement will
result. While many teachers perceive that they have skills and knowledge regarding
24
formative assessment, the data showed otherwise. Many teachers still employ
instructional and assessment strategies that are ambiguous and counter productive.
Students concur with this description.
However, there is some evidence of fertile soil for advancing formative assessment
initiatives within current regulations and present efforts of continuous school
improvement. The study found that teachers are using rubrics; they expect that
students revise their work, and they are beginning to engage students in the processes
of self and peer collaboration for the purposes of learning and assessing. Two of the
three districts studied have also demonstrated systemic thinking around professional
development for all secondary teachers focused on instructional and assessment best
practices.
25
References
Arter, J., (2009, April). Classroom assessment for student learning (CASL) perspective on the JCSEE student evaluation standards [Electronic version]. Paper presented at the meeting American Educational Research Association, San Diego, CA.
Black, P., & Wiliam, D. (1998). Assessment and classroom learning. Assessment in Education: Principles, Policy, & Practice, 5(1), 7-74.
Borg, W., Gall, M., & Gall, J. (2007). Educational research. Boston, MA: Allyn and Bacon.
Bracey G., (2009). The big tests: What ends do they serve? Educational Leadership, 67(3), 32-37.
Brookhart, S. M. (2008). How to give effective feedback to your students. Alexandria, VA: Association for Supervision and Curriculum Development
Brooks, J.G., & Brooks, M.G. (1993). The case for constructivist classrooms. Alexandria, VA: Association for Supervision and Curriculum Development.
Chappuis, S., Chappuis, J., & Stiggens, R. (2009). The quest for quality. Educational Leadership, 67(3), 14-19.
Cohen, J (1988). Statistical power analysis for the behavioral sciences (2nd ed.). Mahwah, NJ: Erlbaum.
Creswell, J. W. & Plano Clark, V. L. (2007). Designing and conducting mixed methods research. Thousand Oaks, CA: Sage Publications
Elmore, R. F. (2007, August). Educational improvement in Victoria [Electronic version], Paper presented to the Victoria Department of Education, Victoria, Australia.
Guskey, T. (2003). How classroom assessments improve learning. Educational Leadership, 60(5), 6-11.
Heritage, M. (2007). Formative assessment: What do teachers need to know and do? Phi Delta Kappan, 89(2), 140-145.
Hess, K. (2008, June). Developing and using learning progressions as a schema for measuring progress. Paper presented at the CCSSO’s National Conference on Student Assessment, Orlando, FL.
Lincoln, Y. & Guba, A. (1985) Naturalistic inquiry. Newbury Park, CA: Sage Publications.
Patton, M. Q. (2002). Qualitative research and evaluation methods. Thousand Oaks, CA: Sage Publications.
26
Popham, W. J. (2008). Transformative assessment. Alexandria, VA: Association for Supervision and Curriculum Development.
Rubin, H., & Rubin, I. (1995). Qualitative interviewing, the art of hearing data. Thousand Oaks, CA: Sage Publication.
Shepard, L. A. (2000). The role of classroom assessment in teaching and learning. [Electronic version] CSE Technical Report 517.
Stiggins, R. J. (2002). Assessment crisis: The absence of assessment for learning. Phi Delta Kappan, 83(10), 758-765.
Thompson, M., & Wiliam, D. (2008). Tight but loose: A conceptual framework for scaling up school reforms. In E. C. Wylie (Ed.), Tight but loose: Scaling up teacher professional development in diverse contexts (ETS Research Rep. No. RR-08-29, pp. 1-44). Princeton, NJ: ETS.