Embed Size (px)
Citation preview
Implementing Quality Improvement Programs Designed to Enhance Customer Satisfaction: Quasi-experiments in the U.S. and Spain
Duncan I. Simester
John R. Hauser
Birger Wernerfelt
and
Roland T. Rust
June 1999
Duncan I. Simester is an Associate Professor of Management Science, Massachusetts Institute of
Technology, Sloan School of Management, 38 Memorial Drive, E56-305, Cambridge, MA 02142, (617)
258-0679, (617) 258-7597 fax, [email protected]. John R. Hauser is the Kirin Professor of Marketing,
Massachusetts Institute of Technology, Sloan School of Management, 38 Memorial Drive, E56-314,
Cambridge, MA 02142. Birger Wernerfelt is a Professor of Management Science, Massachusetts Institute of
Technology, Sloan School of Management, 38 Memorial Drive, E56-326, Cambridge, MA 02142. Roland
T. Rust is the Madison S. Wigginton Professor of Management and Director of the Center for Service
Marketing, Owen Graduate School of Management, Vanderbilt University
This research was funded by the International Center for Research on the Management of Technology
and the Center for Innovation in Product Development. We wish to thank Ning Peng, Lisa Tener, and
Robert Klein who participated in the design and implementation of the quality improvement effort and the
quasi-experiment. We also which to acknowledge the generous contributions of time and data by the firm
that is the subject of this study. The qualitative research was conducted by Applied Marketing Science, Inc.
in Waltham, MA.
Implementing Quality Improvement Programs Designed to Enhance Customer Satisfaction: Quasi-experiments in the U.S. and Spain
Abstract
We describe two related quasi-experiments, one in the United States and one in Spain, in which a
sophisticated, high-technology firm designed and implemented customer-satisfaction improvement
programs. Voice-of-the-customer measurements and “House-of-Quality” techniques were used to design
intervention programs to improve satisfaction with five targeted customer needs. Although the interventions
implemented in the two countries differed in some respects, both interventions were targeted at the same five
needs and the same type of business-to-business customers. In each country, the programs were
implemented in “treatment” regions, but not in “control” regions and the firm collected pretest and posttest
satisfaction measures for targeted and non-targeted needs. An analysis of these measures reveals that the
intervention had a significant impact on satisfaction with the targeted needs in both countries.
The data also reveal a complex and, in many respects, surprising picture. While the interventions
were able to effect significant, enduring improvements in satisfaction with the targeted needs, several natural
assumptions failed. First, although the firm believed ex ante that the interventions were similar, seemingly
inconsequential differences in empowerment between the Spanish and U.S. interventions appear ex post to
be important. Second, despite the use of state-of-the-art methods to identify customer needs, overall
satisfaction responded significantly to effects that were not captured by the measured needs. Third, despite
the careful selection of control regions, there were unobserved ecological impacts on satisfaction which
could only be accounted for with a nonequivalent-dependent-variables design. Such designs are rare in
industry. The absence of such controls in typical industry studies may explain the growing concern among
industry commentators that quality interventions do not yield their anticipated outcomes.
Enhancing Customer Satisfaction with Quality Improvements
Many literatures within marketing seek to understand and develop means to enhance customer
satisfaction. The marketing research literature has developed a variety of methods to identify and
prioritize customer needs to focus managerial effort; the product-quality literature proposes methods to
link product or service improvements to customer needs in order to design interventions to enhance
satisfaction with respect to those needs; the service-quality literature focuses on measuring changes in
service quality; the customer-satisfaction literature seeks to establish the means by which customer
satisfaction can be improved; and the return-on-quality literature seeks to determine whether such
improvements lead to increased profits.
While these literatures vary in their analyses and definitions of constructs, they generally agree
that if a firm were to improve its products and services in order to fulfill important customer needs, then
that firm would enhance its customers’ satisfaction and its future profits (Anderson and Sullivan 1993,
Fornell 1992; Hauser, Simester and Wernerfelt 1994, 1996, 1997; Rust, Zahorik, and Keiningham 1995;
Zeithaml, Parasuraman and Berry 1990). Such prescriptions are common in textbooks and monographs
and are supported by several excellent laboratory studies and many compelling anecdotes of product and
service quality successes. However, there are few published field experiments (or quasi-experiments)
designed to test whether firms can implement quality improvement interventions that lead to measurable
improvements in customer satisfaction. One notable exception is Bolton and Drew’s (1991) description
of GTE’s attempt to improve telephone service.
Widespread acceptance of the relationship is evident in the growing popular literature on quality,
and the reliance on customer satisfaction measures in new product development and employee
compensation (Anderson, Fornell and Lehman, 1994). In contrast, despite initially accepting the wisdom
of implementing new quality interventions, firms are now beginning to demand explicit justification for
their investments. Consulting firms and industry commentators are encouraging this trend with a series of
Customer Satisfaction Quasi-experiments in the U.S. and Spain Page 2
studies questioning the benefits of quality interventions (Howe, Geaddert, and Howe 1995; Rust,
Zahorik, and Keiningham 1995):
“A study by the American Quality Foundation and Ernst & Young suggests that many companies are wasting their efforts in trying to improve quality. The consulting firms of AT Kerney and Arthur D. Little present equally disappointing findings in two separate studies: (1) 80% of more than 100 British firms reported ‘no significant impact as a result of TQM’ and (2) almost two-thirds of 500 U.S. companies saw ‘zero competitive gains’.”
- Anderson, Fornell and Lehman (1994, p. 53)
A scientific evaluation of an actual industrial program provides an important contribution to this
debate. In this paper we describe two quasi-experiments undertaken by a technically sophisticated, $2
billion, international firm seeking to evaluate a new quality-and-customer-satisfaction intervention. For
this paper we disguise the firm by calling it KemTek. The intervention began when a CEO-led task force
determined that enhancing customer satisfaction was key to the firm’s survival. The task force
commissioned state-of-the-art marketing research to determine important customer needs and adopted
widely-used quality tools to design a customer-satisfaction improvement program to improve its products
and services on these important customer needs. It hoped the improvements would enhance customer
satisfaction and, hence, long-term profitability in its business-to-business market.
The implementation is unique from the perspective of field research because this firm, with its
science-oriented culture, sought to measure the impact of the program by (1) designing parallel quasi-
experiments in two countries and (2) investing approximately two years and $500,000 in data collection
to measure the impact of the program. Given the significant capital investment required to implement
similar programs in all of its divisions, the firm sought to determine whether this investment was justified.
By describing the development and implementation of the firm’s intervention and by providing data on
the outcome of the quasi-experiments we seek to add insight to the relevant scientific literatures within
marketing and to provide a window on the implementation of one large-scale, market-driven, customer-
satisfaction intervention in industry.
Customer Satisfaction Quasi-experiments in the U.S. and Spain Page 3
The study confirms the basic premise: KemTek’s efforts led to measurable and enduring
improvements in satisfaction with the targeted needs. Beyond this, however, the data contain a number of
surprises. At least three commonly held beliefs are questioned. First, while we (and KemTek) believed ex
ante that the treatments in the two countries, the U.S. and Spain, were equivalent, this appears not to have
been the case. Seemingly minor and inconsequential differences in the manner in which employees were
empowered appear to have been quite important. Second, while we used state-of-the-art methods to elicit
customer attributes (and evidence suggests that the list of attributes was fairly exhaustive), some of the
improvement in overall satisfaction was due to factors not captured in attribute satisfaction. This suggests
the need for academic research to improve our measurement (and understanding) of the determinants of
overall satisfaction. Third, in spite of relatively large sample sizes, the nonequivalent treatment and
control groups were not sufficient to identify significant effects in both quasi-experiments. Fortunately,
we had data available to incorporate a “nonequivalent-dependent-variables” design with the standard
“pretest/posttest untreated control group” design to enhance the power of the analysis (Cook and
Campbell, 1979, pp. 249, 261). Together these three lessons may help explain why industry
commentators and firms themselves are starting to question the wisdom of quality interventions. If these
three effects are not taken into account, industry might be led to erroneous conclusions that some quality
and customer-satisfaction interventions do not work when a more complete analysis might suggest
otherwise.
Quasi-experimental Design and Measures
KemTek implemented a quasi-experimental design that included an extensive array of controls,
including use of:
1. Pretest and posttest measures from the same panel of customers
2. Nonequivalent control groups
3. Nonequivalent dependent variables
4. Replication in separate countries (chosen by KemTek to vary in the amount of competition)
Using Cook and Campbell’s (1979) notation, we depict the design in each country as follows:

Customer Satisfaction Quasi-experiments in the U.S. and Spain Page 4
O1A X O2A O1B O2B
O1A O2A O1B O2B
Measurement activities are denoted by O, treatment activities are denoted by X, and the dashed line
distinguishes between treatment and control regions. That is, KemTek chose a set of treatment regions in
each country (above the dashed line) and implemented the customer-satisfaction improvement programs
to every customer that they could reach in the treatment regions. KemTek did not implement the
program, nor undertake any special activities to improve customer satisfaction, in the control regions
(below the dashed line). Identical measurement instruments (O’s) were fielded prior to (O1) and
following the intervention (O2). The measurement instruments included two sets of dependent variable
scales, one of which was expected to change because of the treatment (OA) and one which was not
expected to change (OB). (For a detailed discussion of the use of two related but different sets of
dependent variables see Cook and Campbell 1979, p. 261). The design was replicated in two countries.
Because the interventions were not identical in both countries, we consider the implementations as two
separate, but related quasi-experiments. Technically, this is equivalent to allowing a “country” variable to
interact with every other variable and variable interaction.
The implementation of the quasi-experiments is detailed in a Technical Appendix which is
available from the authors. The implementation included the following steps:
1. Product and market selection.
2. Identification of customers’ needs.
3. Design of pretest and posttest measurements.
4. Design of the customer satisfaction improvement program (experimental intervention) to improve customer satisfaction by targeting key customer needs.
5. Implementation of the customer satisfaction improvement program.
With the exception of the posttest measures (which occurred after implementation of the improvement
program) this list represents an approximate chronological order of the activities.
Customer Satisfaction Quasi-experiments in the U.S. and Spain Page 5
KemTek sells a variety of integrated systems based on chemical, electronic, and materials
technology. Some of its products are sold in the business-to-business market, some directly to end
consumers, and some to intermediate customers (retailer/manufacturers) who use KemTek’s product as
raw material to produce finished goods for the end consumer. At the time we became involved, a CEO-
led task force had decided that KemTek’s profits were stagnating and that the firm could increase long-
term profits by undertaking programs to increase customer satisfaction.1 This would be a significant
capital investment over five years, so the task force decided to test the intervention using a major
product/market chosen from KemTek’s line of businesses.
The product/market that best matched the criteria was a product/market in which KemTek’s
products were used by small, retail stores to produce a finished product for the end consumers. While we
cannot name the product category, the business-to-business customers (retailers) in this category would be
analogous to tailors who produced finished apparel from cloth and sewing machines. In KemTek’s
market, the final item was sold for approximately $10 while the intermediate product cost the retailer
approximately $1.50 per item. Production equipment (analogous to sewing machines) was a one-time
capital cost for the retailer. The quality of the final item depended upon the manner in which the
intermediate product was used and stored by the retailer. Those retailers with greater expertise in these
tasks produced higher quality finished goods. KemTek’s task force believed that training in the use and
storage of the intermediate product combined with the maintenance and use of production equipment
would greatly improve the quality of the final item and increase customer satisfaction. (One of the authors
underwent training on KemTek’s products and can attest that high quality output requires expertise to
produce and that training improves the judged quality of the output.) Here customer satisfaction refers to
the satisfaction of the retailers who can now produce a higher-quality product and, hopefully, increase
their own profitability.
KemTek’s activities were global, so the task force interviewed management at KemTek’s
corporate office in order to select two countries in which to implement the intervention. The United
Customer Satisfaction Quasi-experiments in the U.S. and Spain Page 6
States and Spain were selected. There were many similarities between the U.S and Spain. KemTek sold
identical products in both countries; the product was used for the same purposes; it was distributed
through independent distributors; it was used to produce the same final product; and this final product
was produced and sold by similar types of retailers. Kemtek’s management structures were also similar –
both countries shared the same senior management and local managers were company employees in
regular contact with the corporate office.
Although KemTek’s products were branded, retailers did not purchase directly from KemTek.
They purchased from independent, non-exclusive distributors who also supplied retailers with a variety of
products, both KemTek’s and other firms' products. The distributors neither dealt exclusively with
KemTek nor enjoyed exclusive markets. The distributors employed their own sales staff and, typically,
did not offer training in the use or storage of the KemTek’s products. KemTek’s own direct sales force
did not have frequent contact with the retailers, concentrating instead on larger volume customers in other
product categories. (Prior to the implementation, the Spanish sales staff may have visited their customers
relatively more than the U.S. sales staff. However, such visits were not made frequently). The task-force
believed that a carefully designed program to call on retailers represented an opportunity to enhance
retailers’ satisfaction.
Notwithstanding these similarities, the two countries differ. One important difference is
competition. At the time of the intervention KemTek enjoyed an effective monopoly in the U.S.
However, in other countries, a global competitor was beginning to offer products that competed with
KemTek’s products. KemTek saw the entry of this competitor as a major threat to its future profitability
and believed that defending KemTek’s worldwide markets was a primary strategic objective for the firm.
To gather data for strategic decisions they chose to run one quasi-experiment in a country where there
was no competition (the U.S.) and one country in which the competitor had already entered. After
considering many countries KemTek chose Spain. If the findings were similar, they would represent
evidence that the effect of the intervention was relatively insensitive to changes in the intensity of
Customer Satisfaction Quasi-experiments in the U.S. and Spain Page 7
competition. If the findings were different, the competitive environment might help to explain the
observed disparities.
In Spain, the competitor had entered the market approximately two years prior to the intervention
and had begun to offer a substitute product at a slightly lower price. Some Spanish retailers were not yet
aware of the availability of the competitive brand, but all were aware of KemTek’s brand. KemTek
believed that supply constraints had restricted the competitor's ability to enter the domestic U.S. market.
It correctly predicted that entry would not occur before completion of the study. Based on their long
experience in these two markets, KemTek felt that the presence of competition would be a much larger
factor than other differences between the U.S. and Spain.
Three U.S. cities, New York, San Francisco and Dallas, were assigned to treatment status while
Chicago, Los Angeles and Miami were assigned to control status. In Spain, Barcelona and Malaga were
designated as treatment regions and Madrid and Alicante as control regions. KemTek anticipated that
these divisions would yield large samples of approximately equivalent customers.
The two-step voice-of-the-customer analysis described in Griffin and Hauser (1993) was used to
identify important retailer needs. This process yielded a list of seventeen needs. KemTek invested
significant effort to identify these needs. Based on their experience in the market and voice-of-the-
customer theory, KemTek believed that a combination of the seventeen needs would almost completely
explain the systematic variance in overall satisfaction. The proprietary nature of the data prevents us from
publishing a complete description of each need, however, an edited description can be found below (and
in Table 1).
Pretest and posttest measures were collected through telephone interviews. The pretest measures
were collected approximately six months prior to the intervention and the posttest measures were
collected approximately six months after the intervention. The same retailers answered both the pretest
and the posttest questions. The interviews included the following groups of questions:
1. Brand awareness
2. Overall satisfaction
Customer Satisfaction Quasi-experiments in the U.S. and Spain Page 8
3. Satisfaction with each of the seventeen (retailer) customers’ needs.
4. Perceived importance of each of the seventeen customers’ needs.
5. Demographics and store description.
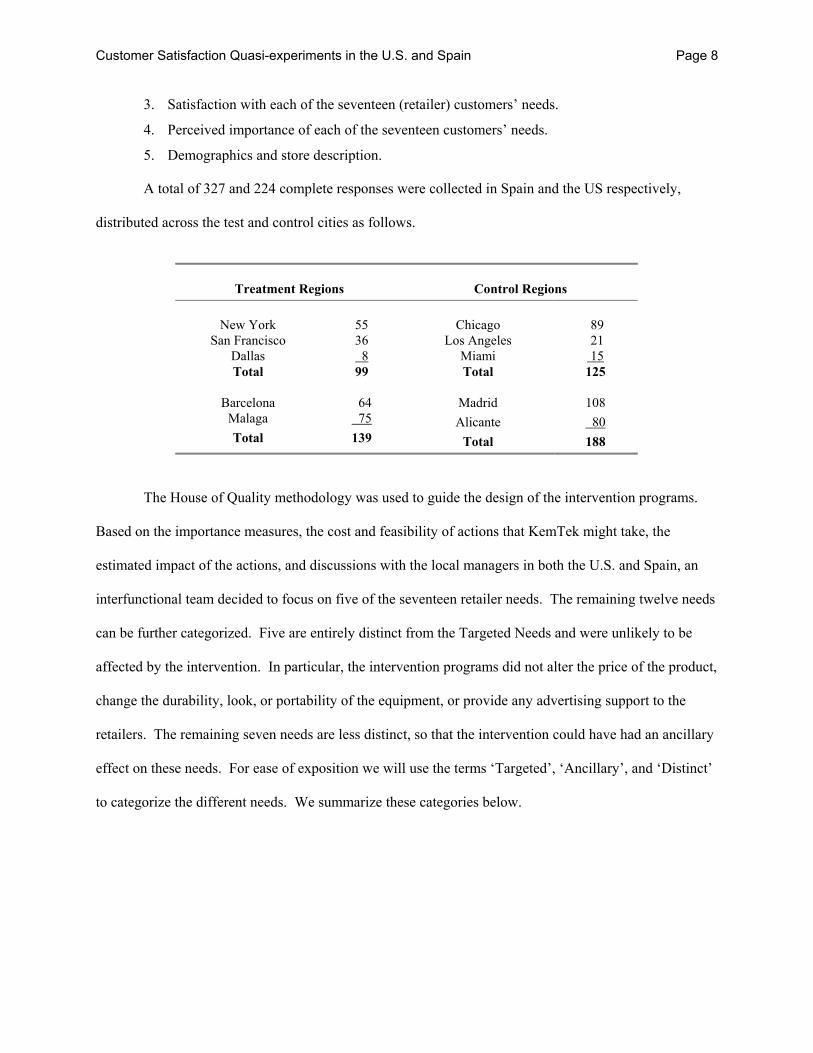
A total of 327 and 224 complete responses were collected in Spain and the US respectively,
distributed across the test and control cities as follows.
Treatment Regions
Control Regions
New York San Francisco
Dallas Total
Barcelona
Malaga Total
55 36 8 99
64 75 139
Chicago
Los Angeles Miami Total
Madrid Alicante
Total
89 21 15 125
108 80 188
The House of Quality methodology was used to guide the design of the intervention programs.
Based on the importance measures, the cost and feasibility of actions that KemTek might take, the
estimated impact of the actions, and discussions with the local managers in both the U.S. and Spain, an
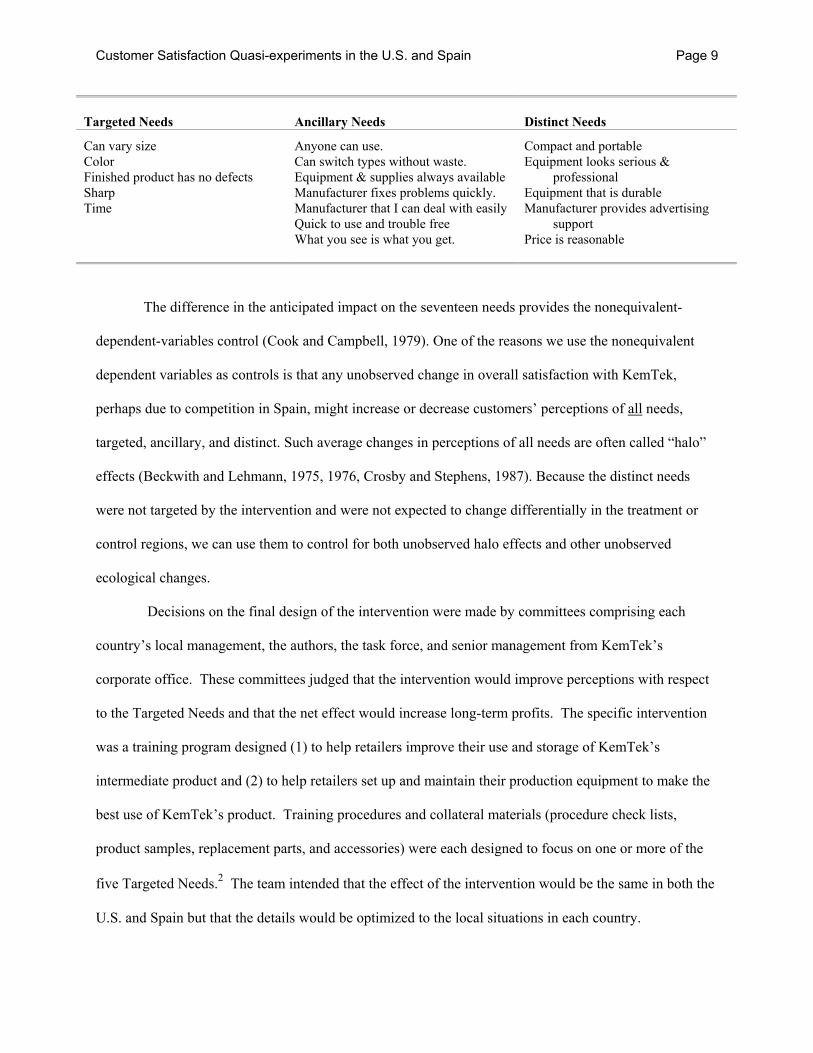
interfunctional team decided to focus on five of the seventeen retailer needs. The remaining twelve needs
can be further categorized. Five are entirely distinct from the Targeted Needs and were unlikely to be
affected by the intervention. In particular, the intervention programs did not alter the price of the product,
change the durability, look, or portability of the equipment, or provide any advertising support to the
retailers. The remaining seven needs are less distinct, so that the intervention could have had an ancillary
effect on these needs. For ease of exposition we will use the terms ‘Targeted’, ‘Ancillary’, and ‘Distinct’
to categorize the different needs. We summarize these categories below.
Customer Satisfaction Quasi-experiments in the U.S. and Spain Page 9
Targeted Needs Ancillary Needs Distinct Needs
Can vary size Color Finished product has no defects Sharp Time
Anyone can use. Can switch types without waste. Equipment & supplies always available Manufacturer fixes problems quickly. Manufacturer that I can deal with easily Quick to use and trouble free What you see is what you get.
Compact and portable Equipment looks serious &
professional Equipment that is durable Manufacturer provides advertising
support Price is reasonable
The difference in the anticipated impact on the seventeen needs provides the nonequivalent-
dependent-variables control (Cook and Campbell, 1979). One of the reasons we use the nonequivalent
dependent variables as controls is that any unobserved change in overall satisfaction with KemTek,
perhaps due to competition in Spain, might increase or decrease customers’ perceptions of all needs,
targeted, ancillary, and distinct. Such average changes in perceptions of all needs are often called “halo”
effects (Beckwith and Lehmann, 1975, 1976, Crosby and Stephens, 1987). Because the distinct needs
were not targeted by the intervention and were not expected to change differentially in the treatment or
control regions, we can use them to control for both unobserved halo effects and other unobserved
ecological changes.
Decisions on the final design of the intervention were made by committees comprising each
country’s local management, the authors, the task force, and senior management from KemTek’s
corporate office. These committees judged that the intervention would improve perceptions with respect
to the Targeted Needs and that the net effect would increase long-term profits. The specific intervention
was a training program designed (1) to help retailers improve their use and storage of KemTek’s
intermediate product and (2) to help retailers set up and maintain their production equipment to make the
best use of KemTek’s product. Training procedures and collateral materials (procedure check lists,
product samples, replacement parts, and accessories) were each designed to focus on one or more of the
five Targeted Needs.2 The team intended that the effect of the intervention would be the same in both the
U.S. and Spain but that the details would be optimized to the local situations in each country.
Customer Satisfaction Quasi-experiments in the U.S. and Spain Page 10
Implementation of the Customer-Satisfaction Improvement Programs
United States
Eleven management volunteers, whose prior experience provided them with the necessary
expertise, implemented the experimental treatment. This effort represented incremental resources
invested by KemTek (the existing salesforce continued their normal activities).
To standardize the treatment, the implementation team participated in a group training session
and received detailed script and procedure manuals. Implementation of the program began four months
after completion of the pretest measures and started with a telemarketing call by each representative to his
assigned sample of approximately 20 retailers. (The eleven management representatives were all males).
The goal of this first contact was to establish an initial relationship with the retailer and schedule a
convenient time for a site visit. The representatives were instructed to assure the retailers that the purpose
of the visit was neither to collect data nor to induce a purchase, but rather to offer assistance in the use of
KemTek's product.
Actual field visits of approximately one hour were made to 179 of the retailers in the treatment
regions who participated in the pretest measures. The field visits began with the representative
determining the quality of the manufactured item at the start of the visit. The representatives then
described storage and usage procedures that would improve perceived quality. To achieve improvements,
the representatives cleaned and, where necessary, serviced the retailers' equipment, provided free product
samples, supplied free accessories and/or recommended changes in the retailers' current procedures.
Before leaving, the representatives demonstrated the improvements by comparing the output produced by
the retailer at the beginning of the visit with that produced at the end of the visit. In the month after their
visits the representatives followed-up with telephone calls and, if appropriate, supplied retailers with
additional literature and accessories.
As a record of each visit, the management representatives completed a brief log summarizing the
actions that they had taken and the retailers’ responses. Analysis of these logs indicated that 96% of the
Customer Satisfaction Quasi-experiments in the U.S. and Spain Page 11
retailers visited were supplied with free product, literature, and/or accessories and that in almost every
case the retailers acknowledged that there was a dramatic improvement in the perceived quality of the
manufactured product that they produced. They had not expected a visit from a representative of
KemTek, but almost universally appreciated the visit.
In the months following the site visits by the management representatives, retailers might or
might not have been given a higher than normal level of attention from KemTek's sales representatives. It
was not feasible for KemTek to record whether such visits took place, which retailers were visited, or the
content of the visits. Because the sales representatives were free to make their own decisions, we assume
that that they made such visits only if that did not divert them from other activities that they perceived as
more productive.
Spain
KemTek intended that the intervention in Spain would yield the same results as in the U.S.,
however the details would be adapted to the Spanish market. Unlike in the U.S., the KemTek employees
in Spain were not incremental resources but rather a redirection of activities from business as usual to the
customer-satisfaction improvement program. As a result, the Spanish employees were given more
freedom in implementing the intervention. They chose a program which included three site visits to each
retailer by local sales representatives of KemTek. The series of visits was positioned as a training
program, with retailers promised a “Gold Seal Accreditation” upon completion of the visits. Prior to the
program the representatives received one day of technical training and were accompanied for two days on
site visits by expert technicians sent specifically for this purpose from the corporate office. On the first
visit the representatives asked for a product sample to assess initial quality. They then presented the goals
of the Gold Seal program, gave training on the use and storage of KemTek’s product, cleaned and
replaced equipment, recommended, sold, and/or installed additional accessories, and finished by asking
for another product sample to compare the quality improvement. On the second visit, the representatives
installed a check list summarizing and reiterating their earlier advice and followed up on any previous
Customer Satisfaction Quasi-experiments in the U.S. and Spain Page 12
service requests. On the third visit, Gold Seal Accreditation certificates were issued and any additional
service or training requests were satisfied. Approximately 75% of the retailers in the Spanish treatment
regions participated in the program. The remaining retailers either could not be located by the
implementation team or refused to participate.
Analysis of the Related Quasi-Experiments
The task-force designed the interventions in both the U.S. and Spain to improve satisfaction with
respect to the Targeted Needs. They predicted that improvements on the Targeted Needs would enhance
Overall Satisfaction and would, in turn, lead to more long-term profit for KemTek. Our first analyses test
KemTek’s predictions. Because this is a quasi-experiment (without random assignment of customers to
treatment groups), we must understand the baseline satisfaction in each treatment group. Thus, we first
compare pretest satisfaction for retailers who received the experimental treatment with those who did not.
The averages of the pretest satisfaction measures in the treatment and control regions are summarized in
Table 1. It is evident that in Spain retailers in the treatment cities generally reported higher levels of
pretest satisfaction than retailers in the control cities. It appears that the groups are not equivalent on
pretest satisfaction, despite the relatively large sample sizes and KemTek’s efforts to identify roughly
equivalent groups.
Table 1 about here.
The pretest satisfaction levels in Table 1 are not the same in the treatment and control regions.
These differences suggest that the regions have not been subject to identical histories. We control for
differences in pretest satisfaction of the customer needs with the standard pretest-posttest analysis
described below. This analysis assures that we do not misattribute a priori differences in the groups to
the effects of the treatment.
In addition, the existence of prior differences cautions that differences might persist. Thus, we
must consider controls to correct for any potential continued, unobserved “ecological” changes that might
affect the change in satisfaction between the pretest and posttest. This is a serious issue in Spain because
Customer Satisfaction Quasi-experiments in the U.S. and Spain Page 13
KemTek was concerned that unobserved actions by the competitor would lower retailers’ perceived
satisfaction with all needs. While KemTek believed that these changes would be the same in the
treatment and control cities, they did not have any the capability to collect detailed information about
competitive activity – unobserved effects were a real possibility. Fortunately, KemTek’s extensive data
collect gave us the means to control for potential unobserved impacts on customer needs. We do this by
using changes in the Distinct Needs as a nonequivalent-dependent-variables control (Cook and Campbell
1979, p. 261).
We first develop a model to predict what posttest satisfaction with the customer needs would have
been in the absence of an intervention. We develop this model by estimating the following equation
using the responses to the five Distinct Needs where i indexes individual respondents and n indexes the
needs. This equation simultaneously controls for three effects: an individual-specific effect, a need-
specific effect, and a pretest measure effect.
Posttest Satisfactionin = αi + β1i Average Pretest Satisfactionn + β2i Pretest Satisfactionin + error (1)
The individual-specific effect accounts for heterogeneity in customers’ reactions to the scales.
(We used the same scale format for all needs and for Overall Satisfaction.) For each individual customer,
i, we allow a mean bias, αi, to account for any yeasaying or naysaying tendency on the part of
respondents (Greenleaf, 1992). This parameter also controls for halo effects.
The need-specific effect accounts for the fact that, on average, some needs are satisfied better
than others. We use the average pretest rating of need n. We call this variable Average Pretest
Satisfactionn and allow its contribution to Posttest Satisfaction to vary by individual. Based on Table 1,
we use separate averages for the test and control groups.
The final control variable is the individual respondents’ pretest ratings. Because these ratings are
measured with error we must account for their reliability (Silk 1994; Caporaso and Roos 1973). Indeed,
if the pretest ratings were the only variable in the model and we expected no change in the “true” ratings,
then the regression coefficient would estimate the reliability.3 We allow the reliability, β2i, to be
Customer Satisfaction Quasi-experiments in the U.S. and Spain Page 14
heterogeneous.
Although simply comparing the change in satisfaction (Posttest Satisfaction - Pretest
Satisfaction) is intuitively appealing, the reliability arguments alone argue for a more general model with
β2i ≠1. In addition, two other arguments suggest that we allow β2i to be estimated. If satisfaction changes
over time, we expect current satisfaction to reflect prior satisfaction updated by recent experiences. The
coefficient β2i would also reflect the weight assigned to prior satisfaction.4 Furthermore, pretest
satisfaction levels may affect the ability to implement improvements, β2i <1 could be interpreted as an
indicator that it is harder to improve satisfaction when retailers are already satisfied – in other words, β2i
is a correction for scale saturation. All three arguments suggest that β2i < 1. This estimates from our data
turn out to be within this range.
We estimate Equation 1 using data only from the Distinct Needs which should be unaffected by
the intervention. The data includes the individual ratings (327 respondents in Spain and 224 in the U.S.)
on each of the five Distinct Needs. This is logically equivalent to estimating a separate three-parameter
model for each respondent based on observations of the five Distinct Needs. This implies a model with
1653 parameters estimated with 2755 observations.5 We used a Chow (1960) test to compare the fit of
this model with a parsimonious model that estimated aggregate coefficients rather than individual
coefficients for each respondent (Equation 1 without the i subscripts on αi, β1i, and β2i). The Chow test
rejected the parsimonious model in both Spain and the U.S. (p<0.01).
The coefficients estimated for each individual were used to predict posttest satisfaction for the
Targeted Needs, the Ancillary Needs, and Overall Satisfaction. We then test our prediction that
satisfaction with the Targeted Needs will be higher among customers in the treatment cities by comparing
observed measures to those predicted by Equation 1. If KemTek’s intervention had a measurable effect,
then the relative effect (observed satisfaction minus satisfaction predicted by pretest measures) should be
significantly larger in the treatment regions than in the control regions.
Customer Satisfaction Quasi-experiments in the U.S. and Spain Page 15
Residual Satisfaction
Before presenting the results, we introduce one more construct, Residual Satisfaction. Based on
KemTek’s experience and voice-of-the-customer theory, KemTek assumed that Overall Satisfaction
could be decomposed based on satisfaction with the customer needs (see review in Griffin and Hauser,
1993). KemTek went to considerable effort to assure an exhaustive list of customer needs. We define
Residual Satisfaction to test KemTek’s assumption. We begin by approximating the customer-need
decomposition with a linear model.
Overall Pretest Satisfactioni = θ1 + θ2 Σn win Pretest Satisfactionin + error (2)
The terms θ1 and θ2 are estimated using OLS. The win is a weight ascribed to each of the seventeen needs.
For robustness we considered three different methods for determining the weight to ascribe to each need
(determining the win terms): equal weights, stated weights, and revealed weights. “Equal weights”
attribute the same weight to each need (Einhorn and Hogarth, 1975). “Stated weights” uses retailers’
responses to the importance questions in the pretest and posttest measurement waves. “Revealed
weights” uses OLS coefficients in which Overall Satisfaction is regressed on all seventeen needs. For
parsimony and ease of exposition we focus on the Equal Weights model. Very similar results were
obtained using the Stated Weights model. Weights in the Revealed Weights model cannot be estimated
reliably due to collinearity between the needs. (See also comparisons in Griffin and Hauser 1993).
Residual Satisfaction is then that portion of Overall Satisfaction that cannot be explained with the
measures of satisfaction for the customer needs. That is,
Residual Satisfactioni = Overall Pretest Satisfactioni - θ1 - θ2 Σn win Pretest Satisfactionin (3)
Comparing Equations 2 and 3 we see that for the pretest measures, Residual Satisfaction is
equivalent to the (zero-mean) “errors” in Equation 2. For the posttest measures it is possible that Residual
Satisfaction is larger (smaller) in the treatment regions than in the control regions. To make the
comparison fair, we must use Equation 1 to control for any unobserved differences between the test and

Customer Satisfaction Quasi-experiments in the U.S. and Spain Page 16
control measures.6 Observed Residual Satisfaction is calculated from the observed measures of Overall
Satisfaction and satisfaction with the customer needs. Predicted Residual Satisfaction is based on
measures predicted by Equation 1. If variance in the seventeen customer needs is sufficient to explain
systematic variance in Overall Satisfaction, then the difference between observed and predicted Residual
Satisfaction should not be significantly different in the test region versus in the control region.
Results
Table 2 summarizes the net impact of the U.S. and Spanish interventions.7 The Distinct Needs
act as a control and, hence, are not included in Table 2.
Table 2 about here.
The results support our prediction that satisfaction with the Targeted Needs will be higher in the
treatment cities. Table 2 suggests that the quality improvements yielded enduring and measurable
improvements in customer satisfaction with the Targeted Needs. These results are comforting. A
carefully designed and implemented customer-satisfaction improvement intervention could yield positive
results. Despite the lack of significance in the U.S. for Overall Satisfaction, KemTek considered all of
the data and, combined with managerial judgment, felt that the both the U.S. and Spanish interventions
achieved their objectives.
KemTek continued with their customer-satisfaction initiatives. It is beyond the scope of this
paper (and proprietary to KemTek) to discuss the details necessary to estimate whether the increased
revenues justified the interventions’ costs. We can only say that, today, customer satisfaction is an
important criterion by which executives at KemTek are evaluated.
However, there are two surprises in Table 2. First, the results also suggest that there were
differences between the U.S. and Spanish interventions, even though KemTek believed ex ante that they
would be equivalent. It appears that the scope of the intervention in Spain was much broader than in the
U.S. While the intervention in the U.S. appeared to affect satisfaction with the Targeted Needs, it did not
appear to affect the Ancillary Needs. The change in Overall Satisfaction had a positive sign in the U.S.,
Customer Satisfaction Quasi-experiments in the U.S. and Spain Page 17
but the change was not significant. In contrast, the Spanish intervention appeared to increase satisfaction
with the Ancillary Needs and Overall Satisfaction. Second, in Spain, the changes in the customer needs
did not appear to be sufficient to explain the change in Overall Satisfaction. There was also a significant
impact on Residual Satisfaction.
The data in Table 2 can only highlight the surprises, not explain them. However, because we
were involved from the beginning and have access to the paper trail, we can use our experience to
conjecture on (1) the cause of the apparent difference in scope of the two interventions and (2) the
significant effect in Spain on Residual Satisfaction. We address each of these in turn. We then discuss
another important lesson from the quasi-experiments – the practical importance of the “nonequivalent-
dependent-variables” design which was necessary to identify the significance of the interventions.
Surprise 1: The Variation in the Scope of the Intervention Between the U.S. and Spain
The U.S. intervention was implemented by management volunteers who had considerable
technical expertise but very limited previous interaction with retailers in this market. The absence of
market knowledge made these management volunteers dependent upon the task force and the local U.S.
management for guidance in conducting their field visits. This guidance was provided in a formal
training session and through detailed script and procedure manuals which the task force reviewed and
helped design. The influence of the task force and the volunteers’ need for guidance ensured that the
intervention was closely focused on the Targeted Needs.
In contrast, the Spanish interventions were implemented by KemTek’s local sales representatives,
who had extensive market experience, but limited technical expertise. These representatives received
some technical training but little other guidance and their activities were subjected to less review and
control by the task force. In the absence of that control, the Spanish representatives may have diverted
their efforts from the specific activities proposed by the task force to other improvements suggested by
their knowledge of the market. Lessening the task force’s control appears to have yielded more wide-
ranging improvements, without compromising the impact on the Targeted Needs. To the extent that this
Customer Satisfaction Quasi-experiments in the U.S. and Spain Page 18
holds up in other quasi-experiments, this result argues for a policy of allowing resources to be allocated
by the parties who are best informed about their use.
Other differences between the Spanish and U.S. interventions can be interpreted as an outcome of
empowering the Spanish representatives. For example, the Spanish representatives chose to make three
separate visits to the treatment retailers, while their U.S. counterparts were instructed to make just a single
visit. This difference obviously provided the Spanish representatives with more time to satisfy a broader
range of retailer needs. If the same level of control had been exercised over the Spanish representatives
as was exercised over their U.S. counterparts, the Spanish intervention would probably also have been a
single visit.
Although this ex post analysis highlights the differences between the US and Spanish
interventions, KemTek’s management did not have the luxury of this data when they designed the
interventions. KemTek is an experienced multinational firm operating in a large number of geographic
markets. They decided to control carefully the U.S. management volunteers and to impose much less
control in Spain. Ex ante KemTek did not believe the empowerment of the Spanish representatives was a
major difference. Ex post we now realize it may have been a major difference. Although the quasi-
experiments by themselves cannot rule out other differences between the U.S. and Spain, such as culture,
language, and the presence of competition, empowerment survives as an attractive explanation. For
example, experienced KemTek managers did not feel culture and language caused the difference. The
presence of competition differed between the quasi-experiments, but KemTek’s hypothesis was that
competition would decrease the impact of the intervention, not make it more wide-ranging.
We feel that this potential evidence for empowerment is a major practical lesson, both for the
manner in which global marketers approach their markets and as evidence of the efficiency of trusting in
local marketing knowledge. At minimum it is an interesting hypothesis worth further testing.
Surprise 2: A Significant Increase in Residual Satisfaction in Spain
The increase in Residual Satisfaction in Spain offers evidence that the improvement in Overall
Customer Satisfaction Quasi-experiments in the U.S. and Spain Page 19
Satisfaction due to the intervention cannot be fully explained by the changes in satisfaction with the
seventeen measured needs. More generally, this suggests that Overall Satisfaction in Spain is affected by
factors other than the seventeen measured needs. This result occurred despite the considerable resources
that KemTek invested to ensure that no retailer needs were omitted. Professionals and managers with
extensive experience in the relevant products and markets used state-of-the-art methods.
We can estimate the likelihood of missing customer needs by using Griffin and Hauser’s (1993)
beta-binomial model. Their model suggests that 99% of the product and service delivery needs were
uncovered by the 38 merged interviews. (The relevant model is the improved questioning method
described on page 10 of their article). Even if we limit the analysis to the 20 Spanish interviews, the
model suggests that 98% of the product and services needs were uncovered. It is unlikely that KemTek
missed a sufficient number of retailer needs to explain the significant increase in Residual Satisfaction. It
is more likely that the intervention in Spain affected constructs that do not fit Griffin and Hauser’s (1993,
p. 4) definition of “a description, in the customer’s own words, of the benefit fulfilled by the product or
service experience.”
Our Residual Satisfaction estimation procedure controlled for changes in the importances of the
customer needs, thus we also reject that potential explanation for the observed effect. In general,
Residual Satisfaction might be due to nonlinearities in the relationship between needs and Overall
Satisfaction (Mittal, Ross and Baldasare, 1998). We do not think that is the case here because (1) we
tested for nonlinearities and did not find them, (2) linear models have fit well in the past, and (3) if the
effect were due only to nonlinearities, we would have seen it in the U.S. as well as Spain.8
However, the hypothesis that Residual Satisfaction in Spain reflects one or more unmeasured
determinants of Overall Satisfaction is consistent with our earlier arguments that the Spanish intervention
was broader in scope than the U.S. intervention. The Spanish representatives may have found a way to
enhance Overall Satisfaction directly rather than through the seventeen needs – a way not anticipated by
the task force. We offer three hypotheses to suggest further research.
Customer Satisfaction Quasi-experiments in the U.S. and Spain Page 20
Labeling and self-perception. The Spanish representatives chose to give retailers in Spain, who
completed the three step training and service program, a Gold Seal Accreditation, certifying their
participation. Retailers in both the U.S. and Spain were given positive reinforcement when they were
shown how much better they could use the equipment after receiving training. However, the accreditation
was used only in Spain. The labeling literature suggests that the very act of certifying successful
completion may have influenced retailers’ perceptions. Labeling a retailer as the type of person who
would tie himself or herself to KemTek (certification) might lead to behavior and beliefs consistent with
the label (Allen 1982; Allen and Dillon 1982). Because they were KemTek customers, the label is
consistent with their self-schema and, hence, more likely to be salient (Tybout and Yalch 1980). In
addition, the fact that the Spanish retailers invested their own time in the training may have led to a self-
perception that it was worthwhile to link themselves to KemTek (Folkes and Kiesler 1991; Bem 1972).
Commitment and Trust. The Spanish representatives chose three visits rather than just one.
(There was a follow-up in the U.S., but it was only via telephone.) On each subsequent visit the
representatives reacted to requests made on the previous visit. This might signal the desire to invest in a
durable relationship of shared interests which could lead to commitment and trust (Dwyer, Schurr and Oh
1987). This hypothesis is consistent with Morgan and Hunt (1994) who propose commitment and trust
as important determinants of successful channel relationships; in apparent accordance with predictions
from the economic literature on repeated games (Abreu 1988; Axelrod 1984).9
Spain vs. the U.S. Finally, the effects occurred in Spain but not the U.S. While KemTek did not
believe that language or culture were the determinants, we can not rule out the hypothesis that
mechanisms of customer satisfaction vary based on language and culture.
It is beyond the scope of this paper (and KemTek’s data) to test these hypotheses. However, we
suggest that such data be collected in future customer-satisfaction interventions. Measurement scales
exist in the literature for these constructs (e.g., Morgan and Hunt 1994; Sullivan, et. al. 1981).
Customer Satisfaction Quasi-experiments in the U.S. and Spain Page 21
Practical Need for the Nonequivalent-Dependent-Variables Control
KemTek invested in extensive measures to determine whether their customer-satisfaction
intervention had the desired effect. These measures included both pretest and posttest measures, control
groups, and nonequivalent dependent measures. This level of measurement is well beyond that which is
typical in industry. From our experience, the most common designs are one-group pretest-posttest
designs or, sometimes, posttest-only designs. The limitations of these designs are widely recognized and
well-understood in the academic literature (e.g., Cook and Campbell 1979, p. 247). Nonetheless, the
wide industrial use of such designs might lead to false rejection of customer-satisfaction initiatives. For
example, in Spain, where satisfaction with all customer needs was generally trending downward (likely
due to competitive actions), had we analyzed KemTek’s test groups only we would have found either no
effect or a negative effect.
The more interesting aspect of KemTek’s design was the availability of the nonequivalent
dependent variables. These variables, which were clearly not targeted by the intervention, enabled us to
control for the otherwise-unobservable ecological impacts on all customer needs. To illustrate their
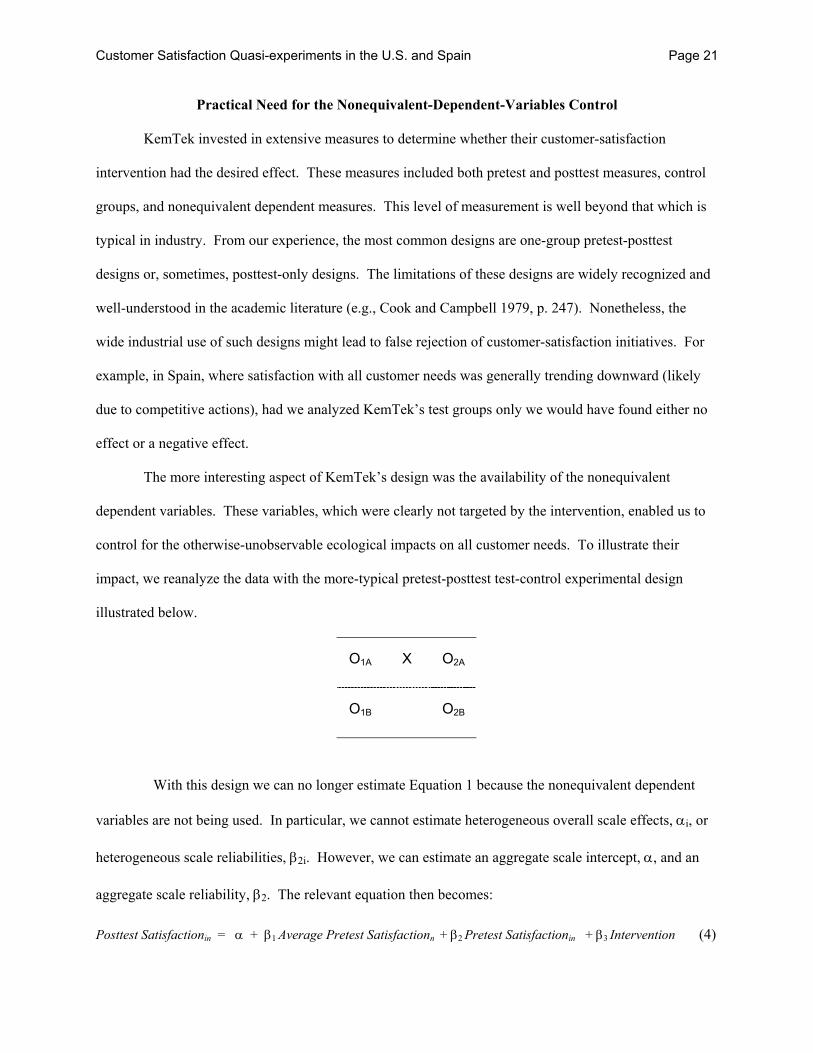
impact, we reanalyze the data with the more-typical pretest-posttest test-control experimental design
illustrated below.
O1A X O2A
O1B O2B
With this design we can no longer estimate Equation 1 because the nonequivalent dependent
variables are not being used. In particular, we cannot estimate heterogeneous overall scale effects, αi, or
heterogeneous scale reliabilities, β2i. However, we can estimate an aggregate scale intercept, α, and an
aggregate scale reliability, β2. The relevant equation then becomes:
Posttest Satisfactionin = α + β1 Average Pretest Satisfactionn + β2 Pretest Satisfactionin + β3 Intervention (4)
Customer Satisfaction Quasi-experiments in the U.S. and Spain Page 22
The results based on this design are summarized in Table 3. In the U.S. the results are
qualitatively similar, perhaps because there was no competitor cause unobserved ecological changes in all
customer needs. However, in Spain, where there was likely significant, but unobserved, competitive
activity, the results change dramatically. There is still a significant impact on Overall Satisfaction and
Residual Satisfaction, but there was no significant effect on the Targeted Needs and on the Ancillary
Needs. (In fact, the sign is negative.) Without the nonequivalent-dependent-variable controls, the
analysis in Table 3 might have falsely rejected the ability of the customer-satisfaction intervention to
affect the Targeted Needs. It is also possible that industry would consider an even simpler model, which
does not account for the reliability of the measures. One such model might simply examine the
differences in the means between the pretest and posttest measures. When we examined such a model, it
also estimated a significant increase in the targeted needs in the U.S. and a non-significant decrease in the
targeted needs in Spain.
Table 3 about here.
Customer Satisfaction Quasi-experiments in the U.S. and Spain Page 23
Potential Limitations
Although KemTek collected more data than is normal in industrial settings, we caution the reader
that the two interventions were quasi-experiments rather than fully-controlled experiments. KemTek
wanted to understand the results of the interventions, but they had to balance this goal with their fiduciary
responsibility of earning profit in these markets. As a result, the U.S. and Spanish interventions differ on
more than one dimension. We have done our best to interpret these differences in light of our knowledge
of the interventions and KemTek’s knowledge of the markets, but the natural limits of quasi-experiments
remain.
Second, although our experience, and that of KemTek, suggest that the Distinct Needs were
appropriate as nonequivalent-dependent-variable controls, it is always possible that there was some small
impact on the Distinct Needs that was due to the intervention. For example, retailer perceptions of
satisfaction with price may have changed more in the treatment regions than the control regions even
though the actual measures, say the price of the product, remained unchanged. An alternative explanation
that attempts to explain such a change might be that perceptions of the Distinct Needs required
maintenance effort and the Spanish representatives diverted efforts from the Distinct Needs toward the
Targeted Needs. Although neither we, nor KemTek, believe this was the explanation, we can not rule it
out completely. Our experiences suggest that it is more likely that competitive entry targeted all needs
(targeted, ancillary, and distinct) and that, without the intervention, all needs would have been lowered.
Even if we accept this alternative explanation that the effect of the intervention was only relative,
KemTek still considered the intervention to be successful. Not only were the Targeted Needs chosen
because they were most important to customers, but there is evidence that Overall Satisfaction increased.
It clearly increased when the Distinct Needs act as controls (Table 2) and, as indicated in Table 3, it
increases even when the Distinct Needs are not used as controls.
Customer Satisfaction Quasi-experiments in the U.S. and Spain Page 24
Conclusions
We reported on the results of controlled, longitudinal field studies in two countries, in which a
sophisticated, high technology firm used state-of-the-art marketing-research and “quality” tools to design
and implement a customer-satisfaction improvement program. The results confirm the basic premise that
it is possible to implement quality improvements that yield enduring and measurable improvements in
customers' perceptions of satisfaction. This finding is particularly notable due to the delay between the
intervention and posttest measures and the rather targeted nature of the treatment. The experimental
treatment focused on providing training to customers in the use and storage of a business-to-business
product. No changes were made to the price or the production, distribution, or sales systems. The
intervention was successful in a country where the firm enjoyed an effective monopoly and in a
representative country in which the firm faced a strong competitive entrant.
Besides demonstrating that a carefully-design customer-satisfaction intervention could be
successful in a field setting, the matched quasi-experiments highlight three interesting lessons. First, the
more broad-ranging impact in Spain suggests that firms can combine careful central planning (voice of
the customer, House of Quality, interfunctional task force) with a strategy that empowers employees to
adapt interventions to local market conditions. Second, the ability of the Spanish representatives to effect
a significant improvement in Residual Satisfaction suggests the need to understand further those aspects
of Overall Satisfaction that can be affected independently of the satisfaction with the customer needs.
Finally, the Spanish analyses, as compared to the U.S. analyses, suggest that the popular press and
industry might be falsely rejecting customer-satisfaction initiatives because they are relying on
insufficient controls to evaluate the initiatives properly. KemTek collected data that was well beyond
industry norms. Perhaps those norms need be rethought.
Customer Satisfaction Quasi-experiments in the U.S. and Spain Page 25
References
Abreu, Dilip (1988), “On the Theory of Infinitely Repeated Games with Discounting,” Econometrica, 56, 383-96.
Allen, Chris T. (1982), “Self-Perception Based Strategies for Stimulating Energy Conservation,” Journal
of Consumer Research, 8 (March), 381-390. _____, and William R. Dillon (1983), “Self-Perception Development and Consumer Choice Criteria: Is
There A Linkage?” in Advances in Consumer Research, 10, Eds. Richard P. Bagozzi and Alice M. Tybout. Ann Arbor, MI: Association for Consumer Research, 45-50.
Anderson, Eugene W., Claes Fornell, and Donald R. Lehmann (1994), “Customer Satisfaction, Market
Share, and Profitability: Findings From Sweden,” Journal of Marketing, 58, (July), 53-66. _____ and Mary W. Sullivan (1993), "The Antecedents and Consequences of Customer Satisfaction for
Firms," Marketing Science, 12, 2, (Spring), 125-143. Axelrod, Robert (1984), The Evolution of Cooperation, (New York, NY: Basic Books). Beckwith, Neil E. and Donald R. Lehmann (1976), “Halo Effects in Multiattribute Attitude Models: An
Appraisal of Some Unresolved Issues,” Journal of Marketing Research, 13, 4, November, 418-421..
______ and ______ (1975), “The Importance of Halo Effects in Multi-Attribute Models,” Journal of
Marketing Research, 12, 3, August, 265-75. Bem, Daryl (1972), “Self Perception Theory,” in Advances in Experimental Social Psychology, 6, Ed.
Leonard Berkowitz, New York: Academic Press. Bolton, Ruth N. and James H. Drew (1991), “A Longitudinal Analysis of the Impact of Service Changes
on Customer Attitudes,” Journal of Marketing, 55 (January), 1-9. Boulding, William, Ajay Kalra, Richard Staelin, and Valarie A. Zeithaml (1993), "A Dynamic Process
Model of Service Quality: From Expectations to Behavioral Intentions," Journal of Marketing Research, 30 (February), 7-27.
Caporaso, James A. and Leslie L. Roos, Jr. (1973), Quasi-experimental Approaches: Testing Theory and
Evaluating Policy, (Evanston, IL: Northwestern University Press) Chow, Gregory. C. (1960), “Tests of Equality Between Sets of Coefficients on Two Linear Regressions,”
Econometrica, 28, 3, (July), 591-605. Cook, Thomas D. and Donald T. Campbell (1979), Quasi-Experimentation: Design and Analysis Issues
For Field Settings, Boston: Houghton Mifflin. Cronin, J. Joseph and Steven A. Taylor (1994), “Servpref vs. Servqual: Reconciling Performance-Based
and Perceptions-Minus-Expectations Measurement of Service Quality,” Journal of Marketing, 58, (January), 125-131.
Customer Satisfaction Quasi-experiments in the U.S. and Spain Page 26
Crosby, Lawrence A. and Nancy Stephens (1987), “Effects of Relationship Marketing on Satisfaction, Retention, and Prices in the Life Insurance Industry,” Journal of Marketing Research, 24, 4, November, 404-11.
Dwyer, F. Robert, Paul H. Schurr, and Sejo Oh (1987), “Developing the Buyer-Seller Relationships,”
Journal of Marketing, 51 (April), 11-27. Einhorn, Hillel J. and Robin M. Hogarth (1975), “Unit Weighting Schemes for Decision Making,”
Organizational Behavior and Human Performance, 13, 171-92. Folkes, Valerie S., and Tina Kiesler, (1991), “Social Cognition: Consumers’ Inferences About the Self
and Others,” in Thomas S. Robertson and Harold H. Kassarjian, eds., Handbook of Consumer Behavior, 281-315.
Fornell, Claes (1992), “A National Customer Satisfaction Barometer,” Journal of Marketing, 56,
(January), 6-21. Fournier, Susan and David G. Mick (1999), “Rediscovering Satisfaction,” Marketing Science Institute
Working Paper 99-092, Cambridge, MA 02139, (February). Green, Paul E. and V. Srinivasan (1990), “Conjoint Analysis in Consumer Research: Issues and Outlook,”
Journal of Marketing, 54, 4, (October), 3-19. Greenleaf, Eric A. (1992), “Improving Rating Scale Measures by Detecting and Correcting Bias
Components in Some Response Scales,” Journal of Marketing Research, 29, 2, May, 176-188. Griffin, Abbie and John R. Hauser (1993), "The Voice of the Customer," Marketing Science, 12 (Winter),
1-25. Hauser, John R., Duncan I. Simester and Birger Wernerfelt (1997), “Side Payments in Marketing”
Marketing Science, Vol. 16(3), pp. 246-255. _____, _____, and _____ (1996), “Internal Customers and Internal Suppliers,” Journal of Marketing
Research, Vol. 33(3), pp. 268-280. _____, _____, and _____ (1994), "Customer Satisfaction Incentives," Marketing Science, 13, 4, (Fall),
327-350. Howe, Roger J., Dee Gaeddert, and Maynard A. Howe (1995), Quality on Trial: Bringing Bottom-Line
Accountability to the Quality Effort, New York: McGraw-Hill. Mittal, Vikas, William T. Ross, Jr., and Patrick M. Baldasare (1998), “The Asymmetric Impact of
negative and Positive Attribute-Level Performance on Overall Satisfaction and Repurchase Intentions,” Journal of Marketing, 62, 1, January, 33-47.
Moorman, Christine, Gerald Zaltman, and Rohit Deshpandé (1992), “Relationships Between Providers
and Users of Marketing Research: The Dynamics of Trust Within and Between Organizations,” Journal of Marketing Research, 29, 314-329.
Customer Satisfaction Quasi-experiments in the U.S. and Spain Page 27
Morgan, Robert M. and Shelby D. Hunt (1994), “The Commitment-Trust Theory of Relationship Marketing,” Journal of Marketing, 58 (July), 20-38.
Rust, Roland T., Anthony J. Zahorik, and Timothy L. Keiningham (1995), “Return on Quality (ROQ):
Making Service Quality Financially Accountable,” Journal of Marketing, 59, (April), 58-70. Schurr, Paul H. and Julie L. Ozanne (1985), “Influences on Exchange Processes: Buyers’ Preconceptions
of a Seller’s Trustworthiness and Bargaining Toughness,” Journal of Consumer Research, 11, (March), 939-953.
Silk, Alvin J. (1994), “Notes on Reliability and Attitude Measurement,” Harvard Business School Case
Notes, April, 9-594-087. Sullivan, Jeremiah , Richard B. Peterson, Naoki Kameda and Justin Shimada (1981), “The Relationship
Between Conflict Resolution Approaches and Trust – A Cross Cultural Study, “ Academy of Management Journal, 24 (4), 803-815.
Tybout, Alice M. and Richard R. Yalch (1980), “The Effect of Experience: A Matter of Salience,”
Journal of Consumer Research, 6, 406-413. Wittink, Dick R. and Phillippe Cattin (1989), “Commercial Use of Conjoint Analysis: An Update,”
Journal of Marketing, 53, 3, (July), 91-96. Yi, Youjae (1990), "A Critical Review of Consumer Satisfaction," in Review in Marketing 1990, Valerie
A. Zeithaml, Ed., (Chicago, IL: American Marketing Association), 68-123. Zeithaml, Valarie A., Parasuraman, and Leonard L. Berry (1990), Delivering Quality Service: Balancing
Customer Perceptions and Expectations, (New York, NY: The Free Press).
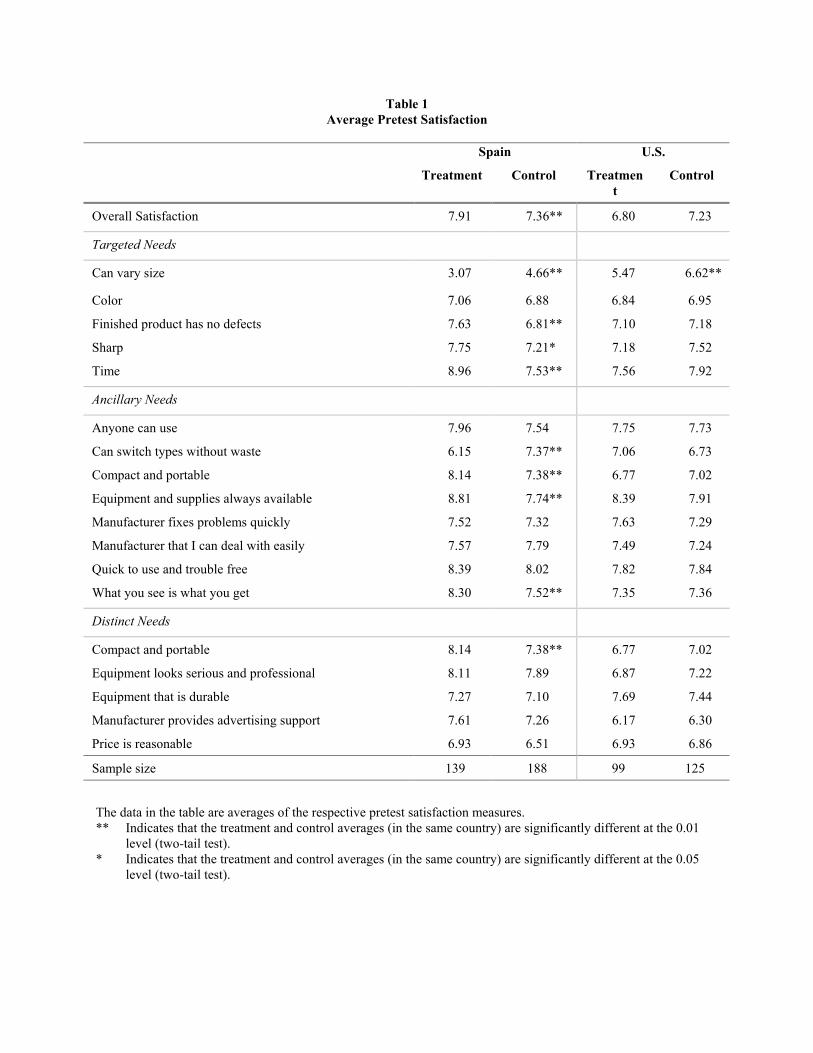
Table 1 Average Pretest Satisfaction
Spain U.S. Treatment Control Treatmen
t Control
Overall Satisfaction 7.91 7.36** 6.80 7.23
Targeted Needs
Can vary size 3.07 4.66** 5.47 6.62**
Color 7.06 6.88 6.84 6.95
Finished product has no defects 7.63 6.81** 7.10 7.18
Sharp 7.75 7.21* 7.18 7.52
Time 8.96 7.53** 7.56 7.92
Ancillary Needs
Anyone can use 7.96 7.54 7.75 7.73
Can switch types without waste 6.15 7.37** 7.06 6.73
Compact and portable 8.14 7.38** 6.77 7.02
Equipment and supplies always available 8.81 7.74** 8.39 7.91
Manufacturer fixes problems quickly 7.52 7.32 7.63 7.29
Manufacturer that I can deal with easily 7.57 7.79 7.49 7.24
Quick to use and trouble free 8.39 8.02 7.82 7.84
What you see is what you get 8.30 7.52** 7.35 7.36
Distinct Needs
Compact and portable 8.14 7.38** 6.77 7.02
Equipment looks serious and professional 8.11 7.89 6.87 7.22
Equipment that is durable 7.27 7.10 7.69 7.44
Manufacturer provides advertising support 7.61 7.26 6.17 6.30
Price is reasonable 6.93 6.51 6.93 6.86
Sample size 139 188 99 125
The data in the table are averages of the respective pretest satisfaction measures. ** Indicates that the treatment and control averages (in the same country) are significantly different at the 0.01
level (two-tail test). * Indicates that the treatment and control averages (in the same country) are significantly different at the 0.05
level (two-tail test).
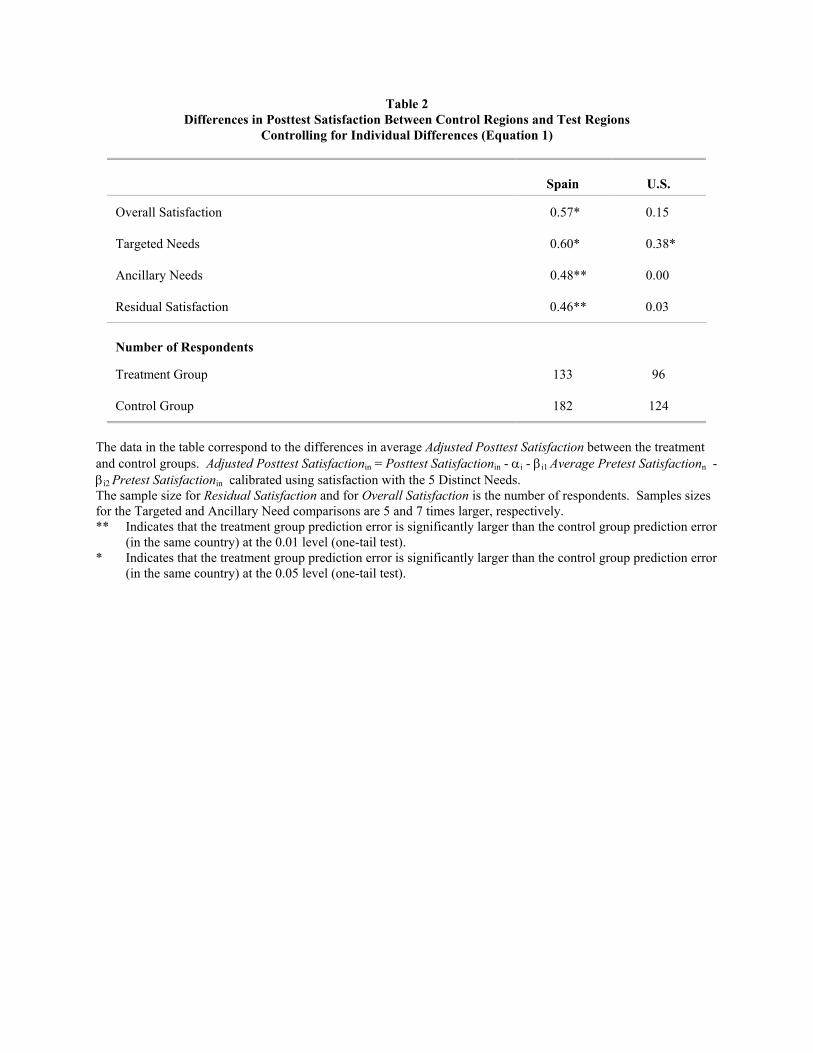
Table 2 Differences in Posttest Satisfaction Between Control Regions and Test Regions
Controlling for Individual Differences (Equation 1)
Spain
U.S.
Overall Satisfaction 0.57* 0.15
Targeted Needs 0.60* 0.38*
Ancillary Needs 0.48** 0.00
Residual Satisfaction 0.46** 0.03
Number of Respondents
Treatment Group 133 96
Control Group 182 124
The data in the table correspond to the differences in average Adjusted Posttest Satisfaction between the treatment and control groups. Adjusted Posttest Satisfactionin = Posttest Satisfactionin - αi - βi1 Average Pretest Satisfactionn - βi2 Pretest Satisfactionin calibrated using satisfaction with the 5 Distinct Needs. The sample size for Residual Satisfaction and for Overall Satisfaction is the number of respondents. Samples sizes for the Targeted and Ancillary Need comparisons are 5 and 7 times larger, respectively. ** Indicates that the treatment group prediction error is significantly larger than the control group prediction error
(in the same country) at the 0.01 level (one-tail test). * Indicates that the treatment group prediction error is significantly larger than the control group prediction error
(in the same country) at the 0.05 level (one-tail test).
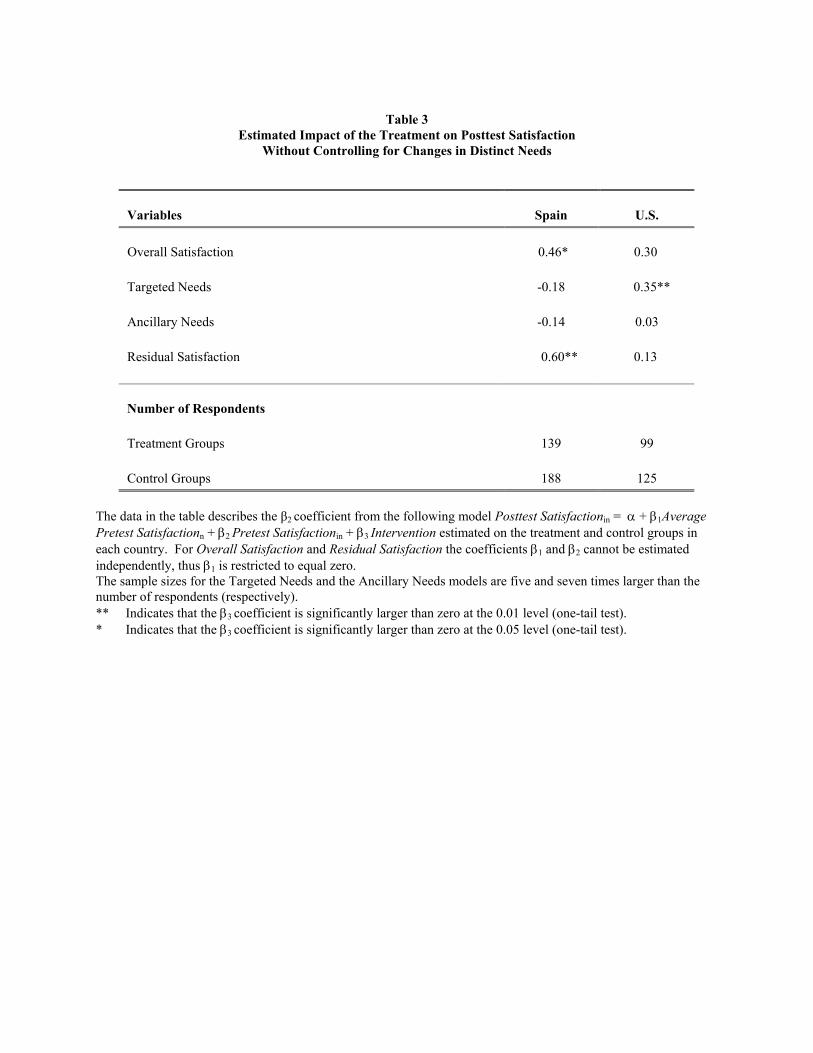
Table 3
Estimated Impact of the Treatment on Posttest Satisfaction Without Controlling for Changes in Distinct Needs
Variables
Spain
U.S.
Overall Satisfaction
0.46*
0.30
Targeted Needs
-0.18
0.35**
Ancillary Needs
-0.14
0.03
Residual Satisfaction
0.60**
0.13
Number of Respondents
Treatment Groups
139
99
Control Groups
188
125
The data in the table describes the β2 coefficient from the following model Posttest Satisfactionin = α + β1Average Pretest Satisfactionn + β2 Pretest Satisfactionin + β3 Intervention estimated on the treatment and control groups in each country. For Overall Satisfaction and Residual Satisfaction the coefficients β1 and β2 cannot be estimated independently, thus β1 is restricted to equal zero. The sample sizes for the Targeted Needs and the Ancillary Needs models are five and seven times larger than the number of respondents (respectively). ** Indicates that the β3 coefficient is significantly larger than zero at the 0.01 level (one-tail test). * Indicates that the β3 coefficient is significantly larger than zero at the 0.05 level (one-tail test).
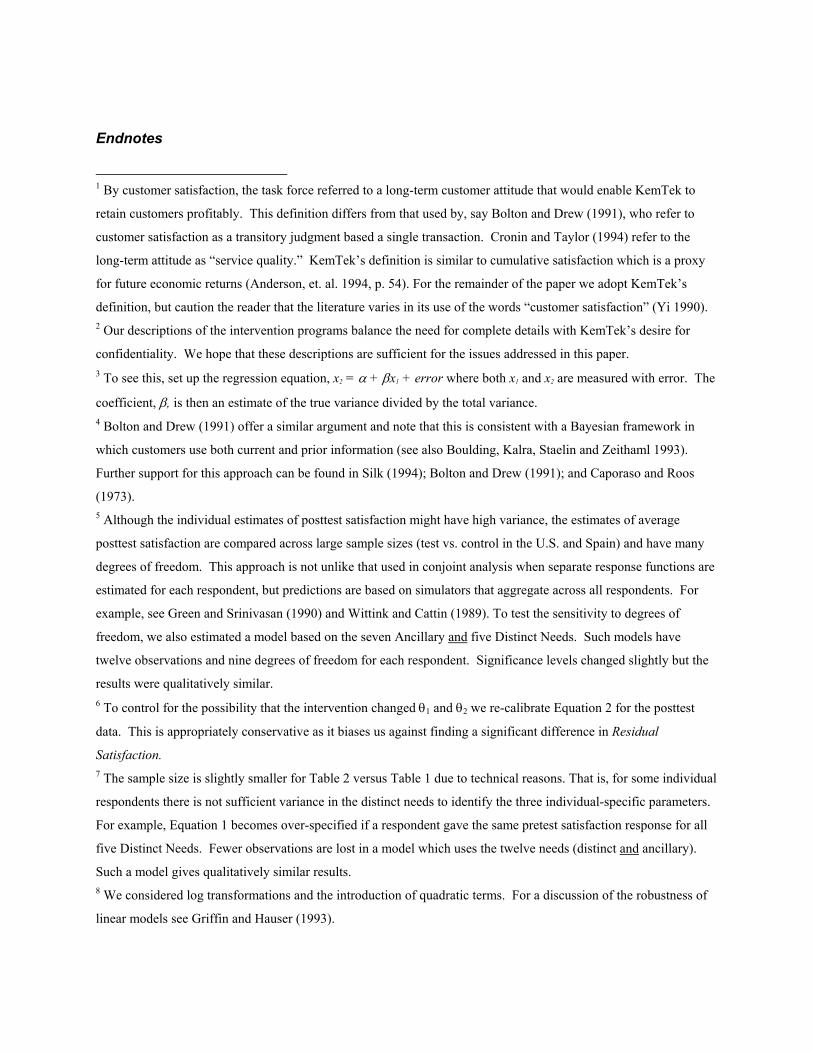
Endnotes
1 By customer satisfaction, the task force referred to a long-term customer attitude that would enable KemTek to
retain customers profitably. This definition differs from that used by, say Bolton and Drew (1991), who refer to
customer satisfaction as a transitory judgment based a single transaction. Cronin and Taylor (1994) refer to the
long-term attitude as “service quality.” KemTek’s definition is similar to cumulative satisfaction which is a proxy
for future economic returns (Anderson, et. al. 1994, p. 54). For the remainder of the paper we adopt KemTek’s
definition, but caution the reader that the literature varies in its use of the words “customer satisfaction” (Yi 1990). 2 Our descriptions of the intervention programs balance the need for complete details with KemTek’s desire for
confidentiality. We hope that these descriptions are sufficient for the issues addressed in this paper. 3 To see this, set up the regression equation, x2 = α + βx1 + error where both x1 and x2 are measured with error. The
coefficient, β, is then an estimate of the true variance divided by the total variance. 4 Bolton and Drew (1991) offer a similar argument and note that this is consistent with a Bayesian framework in
which customers use both current and prior information (see also Boulding, Kalra, Staelin and Zeithaml 1993).
Further support for this approach can be found in Silk (1994); Bolton and Drew (1991); and Caporaso and Roos
(1973). 5 Although the individual estimates of posttest satisfaction might have high variance, the estimates of average
posttest satisfaction are compared across large sample sizes (test vs. control in the U.S. and Spain) and have many
degrees of freedom. This approach is not unlike that used in conjoint analysis when separate response functions are
estimated for each respondent, but predictions are based on simulators that aggregate across all respondents. For
example, see Green and Srinivasan (1990) and Wittink and Cattin (1989). To test the sensitivity to degrees of
freedom, we also estimated a model based on the seven Ancillary and five Distinct Needs. Such models have
twelve observations and nine degrees of freedom for each respondent. Significance levels changed slightly but the
results were qualitatively similar. 6 To control for the possibility that the intervention changed θ1 and θ2 we re-calibrate Equation 2 for the posttest
data. This is appropriately conservative as it biases us against finding a significant difference in Residual
Satisfaction. 7 The sample size is slightly smaller for Table 2 versus Table 1 due to technical reasons. That is, for some individual
respondents there is not sufficient variance in the distinct needs to identify the three individual-specific parameters.
For example, Equation 1 becomes over-specified if a respondent gave the same pretest satisfaction response for all
five Distinct Needs. Fewer observations are lost in a model which uses the twelve needs (distinct and ancillary).
Such a model gives qualitatively similar results. 8 We considered log transformations and the introduction of quadratic terms. For a discussion of the robustness of
linear models see Griffin and Hauser (1993).

9 Commitment is an “enduring desire to maintain a valued relationship,” (Moorman, Zaltman, and Deshpandé 1992,
p. 316) and “an implicit or explicit pledge of relational continuity” (Dwyer, Schurr and Oh 1987, p. 19). Trust is “a
willingness to rely on an exchange partner in whom one has confidence” (Moorman, Zaltman and Deshpandé 1992,
p. 315) and “the belief that a party’s word or promise is reliable and a party will fulfill his/her obligations in an
exchange relationship (Schurr and Ozanne 1985, p. 940).