Embed Size (px)
Citation preview

The Taiwanese Notebook Computer Production Network in China:
Implication for Upgrading of the Chinese Electronics Industry
By Yungkai Yang Ph.D Candidate, Manchester Business School
Manchester University, UK
Email: [email protected]
Center on China’s Transnational Relations
Research Workshop
The Hong Kong University of Science and Technology

Yung-kai Yang
Abstract
In the late 1990s Taiwanese firms began to shift production to mainland China. The
watershed came in 2001 when the Taiwanese government changed regulations restricting the
location of strategic activities outside Taiwan. In the years immediately following, a mass
‘exodus’ occurred with of Taiwan’s production capacity relocated to mainland China. The
move of such a significant segment in China’s electronics industry raise the question as to the
extent to which this historical shift in notebook production represents a resource and
opportunity for the upgrading of China’s indigenous capabilities. This paper presents
preliminary findings from fieldwork carried out in Taiwan during 2005 as part of a doctoral
research project on this and related questions. The main finding thus far suggests that for
China, an opportunity is being missed. Little or no linkages exist between any of the major
Taiwanese notebook firms and indigenous electronics firms in mainland China. This lack of
linkages, in turn, raises specific questions about how we understand the relationship between
global production networks (GPN) and the upgrading of domestic industrial capacities.
1

Yung-kai Yang
Introduction
China has become one of the largest producers of information technology hardware1. Yet
much evidence also suggests that the contribution and value-added of indigenous Chinese
firms remains low in the sector2. Why is this?
This paper examines a series of questions about the “upgrading” prospects of the domestic
electronics industry in China. These questions are inspired both by claims advanced by
researchers and policy-makers as to the benefits of participating in global value chain (e.g.,
Ernst & Kim, 2001; Humphrey & Schmitz, 2004; UNCTD, 2001) as well as by recent
developments in the one of the major segments of China’s burgeoning electronics industry
notebook computers.
Taiwan has been a major player in the production of notebook (NB) computers for many
years. In the late 1990s Taiwanese firms began to shift production to mainland China. The
watershed came in 2001 when the Taiwanese government changed regulations restricting the
location of strategic activities outside Taiwan. In the years immediately following, a mass
‘exodus’ occurred with much of Taiwan’s production capacity relocated to mainland China.
This would not only make notebook computers came to the leading electronics export3, it
also represented a massive boost to China’s position in the supply of IT hardware.
The move of such a significant segment in China’s electronics industry raises the question as
1 According to Market Intelligence Center (MIC), a well-known IT industry research institute in Taiwan, in year 2002 China has overtaken Japan and became the second largest IT hardware producer. Competitiveness Analysis of China’s Information Technology Industry (2004) 2 According to China electronics Industry Yearbook 2004, total amount of electronics products export was $142 billion in 2003. Foreign wholly-owned enterprises, Foreign-Sino joint-venture enterprises and Foreign-Sino Collaboration enterprises all together account for 83.7% ($ 118.9 billion) of export. Comparatively, Chinese enterprises, including state-owned enterprises and other forms of enterprises, only account for 16.3% ($ 23.1 billion) of export. 3 China’s export of various electronics product in 2003 (China electronics Industry Yearbook 2004): notebook computer ($11.3 billion); monitor ($9.6 billion); mobile phone ($7.4 billion); semiconductor ($60 billion).
2

Yung-kai Yang
to the extent to which this historical shift in notebook production represents a resource and
opportunity for the upgrading of China’s indigenous capabilities. This paper presents
preliminary findings from fieldwork carried out in Taiwan during 2005. The main sources of
data were the author’s interviews with managers and engineers from notebook computer
companies and component suppliers, industry reports and governments statistics. The main
finding thus far suggests that for China, an opportunity is being missed. Little or no linkages
exist between any of the major Taiwanese notebook firms and indigenous electronics firms in
mainland China. This lack of linkages, in turn, raises specific questions about how we
understand the relationship between global production networks (GPN) and the upgrading of
domestic industrial capacities.
A key theme underlying the current literature on global production networks and economics
development (eg. Humphrey and Schmitz, 2004) is that domestic participation within such
networks creates the possibility of ‘localised learning’ in one form or another. While GPNs
may be potential ‘carriers of knowledge’ useful for local industrial upgrading, realising this
potential depends critically on the formation of linkages between domestic firms and foreign
companies ‘higher up’ in the value-chain. Critically, the degree of ‘openness’ within the
network is a critical feature affecting the nature of linkages formed and the potential for
upgrading. An ‘open’ production network implies that local affiliates are given
decision-making authority, R&D activities take place locally and indigenous companies are
encouraged to supply inputs and enter into sub-contracting relations (Naughton, 1997). That
being said, what we have found in China is a notebook segment where production is
dominated by Taiwanese OEM/ODM producers with no linkages to indigenous Chinese
firms. In other words, the exodus of Taiwanese notebook production to China has occurred
within an enclave environment that insulates these operations from the wider electronics
industry in China. This suggests that the notebook segment is providing little, if any,
3

Yung-kai Yang
substantive contribution to the upgrading of China’s indigenous capabilities in the sector.
Evidence to this effect, a preliminary interpretation as to why these developments have
occurred, and future research questions to strengthen the interpretation are offered here.
This paper is organised a follows. Section 1 introduces the theoretical background to this
research. Section 2 & 3 document the development of Taiwanese NB computer industry and
geographical restructuring of Taiwanese NB production network respectively. Section 4
provides evidence as to the ‘closed’ nature of Taiwanese NB production network in China
while section 5 offers an interpretation of these why this has been the case. Section 6 revisits
the ‘upgrading-through-linkages’ thesis and suggests that while not through the more
‘conventional’ routes offered by GPNs, the relocation of Taiwanese notebook firms to China
could still contribute to indigenous upgrading through alternative learning channels.
Localised learning need not arise from knowledge passed across organisational boundaries as
is more widely conceived in the GPN literature. Rather, the benefits to Chinese capabilities
may stem from learning opportunities which take place inside of Taiwanese firms. The key
question here concerns the extent and nature in which the Chinese are recruited within the
closed ranks of Taiwanese production networks given that at the firm level, Chinese
companies are largely excluded from participation.
Section 1 Global Production Networks and Upgrading
The concept and analysis of global production networks is a relatively recent addition to the
study of economic development (Gereffi 1994; Henderson et al. 2002; Hobday 1995).
Analysing GPNs require attention to both the configuration of intra- and inter-firm
4

Yung-kai Yang
relationships in a given sphere of production, as well as consideration of the forms of
coordination which bind the network together. The concept is most commonly associated
with the idea that production takes placed within a network of relationships organized
around a flagship company with varying ‘tiers’ of subcontractors as well as relationships
with other service providers and strategic alliances (Ernst & Kim, 2001) (see Figure 1). One
example of a GPN is Cisco, a US-owned company. Cisco only carries out new product
definition and software development at its headquarters in Silicon Valley. However the bulk
of more conventional R&D and significant development work on some products is done
through technology and product development alliances with key suppliers such as chip,
design and software firms. Instead of manufacturing products by itself, the products are
assembled entirely by independent subcontractors in US and Asia. These suppliers are bound
to Cisco through a variety of contractual arrangements; however, which typically do not
involve an equity stake (Borrus et al., 2000).
Figure 1 The Nodes of A Global Production Network
Flagship Company
Independent
suppliers
Independent
subcontractors
Distribution
Channel
Cooperative agreements
(standards consortia etc) R&D alliances
Subsidiaries
and affiliates
Joint Ventures
Inter-firm
Intra-firm
Source: Adapted from Ernst and Kim (2001)
GPNs typically consists of various hierarchical layers that range from network flagships that
5

Yung-kai Yang
dominate such networks, down to a variety of usually smaller local specialised network
suppliers. Conceptually, two types of global flagships are frequently identified: 1) brand
leaders, such as IBM and Dell and 2) contract manufacturers, such as Solectron and
Flextronics (Ernst & Kim, 2001). These contract manufacturers establish their own GPNs
providing integrated global supply chain services to the ‘brand leaders’. The essence of
contract manufacturers is a division of labour between “brand leaders” companies that design
and market products, and firms which actually engage in manufacturing and the management
of supply-chain functions. The relations between brand leaders and contract manufacturers
are rather more complimentary than competitive (Henderson & Phillips, 2004).
The global flagship firm is at the heart of the production network. They are frequently the
‘brand name’ company which serves as the ‘orchectrator’ of lower tier specialised suppliers
and subcontractors. They provide both strategic and organisational leadership for the
production network. The power of lead firms derives from its control over critical resources
and capabilities that facilitate innovation and from its capacity to coordinate transactions and
knowledge exchange between the different network nodes. Flagships retain in-house
activities in which they have a particular strategic advantage; they outsource those in which
they do not. Some flagships focus on design, product development and marketing, and
outsource volume manufacturing and related support services. Others outsource a variety of
high-end, knowledge-intensive support services as well (Ernst & Kim, 2001).
There are two types of local suppliers in global production networks (Ernst, 2000).
“Higher-tier” suppliers deal directly with global flagships and play an intermediary role
between global flagships and lower-tier suppliers. Although they possess valuable
proprietary assets (including technology) and hard-core R&D, strategic marketing remain
under the control of the network flagships. Many Taiwanese higher-tier suppliers have their
6

Yung-kai Yang
own mini-GPNs with dense linkages developed between geographically dispersed, yet
concentrated and locally specialised clusters (Chen & Chen, 2001).
“Lower-tier” suppliers’ rarely interact directly with the global flagships; they deal primarily
with local higher-tier suppliers. Lower-tier suppliers normally lack proprietary assets, they
are in weak financial positions and are highly vulnerable to abrupt changes in markets and
technology. Consequently, their main competitive advantages are their low cost and speed as
well as flexibility of delivery (Ernst, 2003).
The link between GPNs and upgrading is based on the notion that they may represent
powerful carriers of knowledge which are deposited in the host country. One idea is that
flagships need to transfer technical and managerial knowledge to the local suppliers. It is
necessary to upgrade the suppliers’ technical and managerial skills, so that they can meet the
technical specifications of the flagships. Once a network supplier successfully upgrades its
capabilities, this creates an incentive for flagships to transfer more sophisticated knowledge,
including engineering, product and process development (Ernst, 2003).
Flagships transfer knowledge across borders through various mechanisms. First, transfer may
be mediated through the market, involving a formal contract for terms and conditions
between the knowledge supplier and the knowledge buyer with payment involved.
Knowledge may also be transferred informally without any payment involved. Second, the
flagship may play an active role, exercising significant control over the way in which
knowledge is disseminated to and used by the local supplier. The flagship may play a passive
role, having almost nothing to do with the way the local supplier takes advantage of available
knowledge (Ernst & Kim, 2001). ‘Market-mediation’ together with ‘the role of flagships’
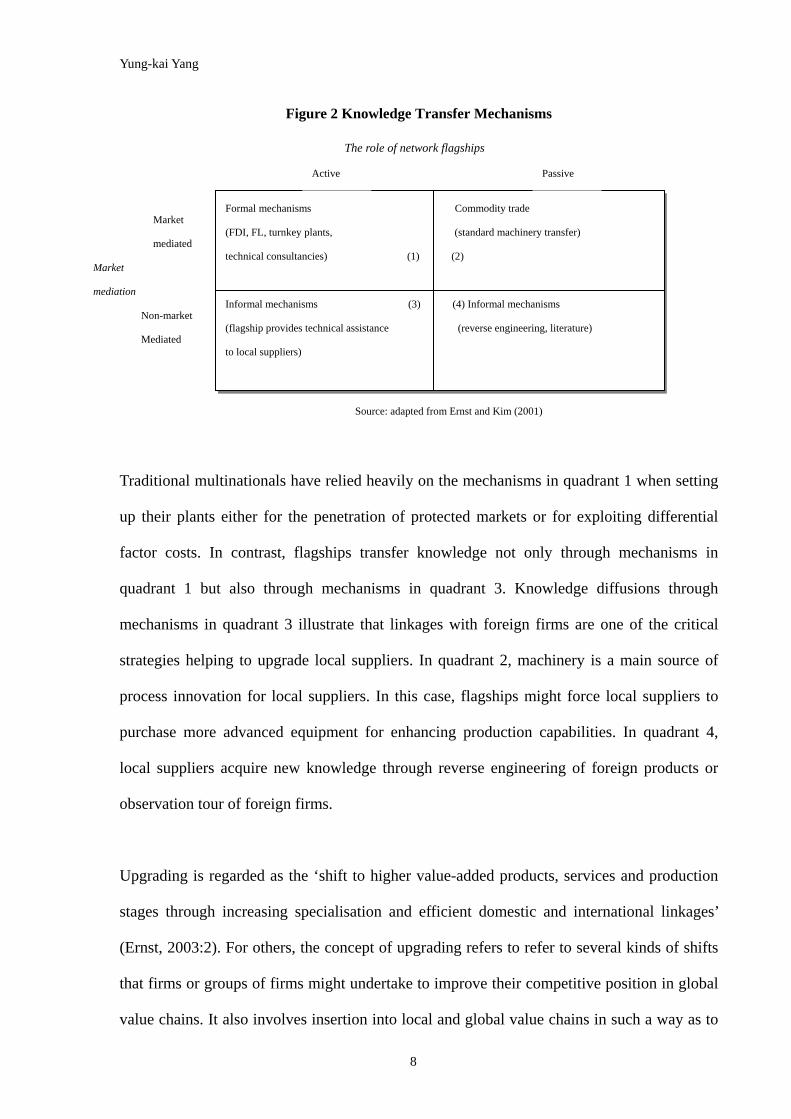
offers a useful two-by-two matrix that illustrates these mechanisms (see Figure 2)
7
Yung-kai Yang
Figure 2 Knowledge Transfer Mechanisms
Formal mechanisms Commodity trade
(FDI, FL, turnkey plants, (standard machinery transfer)
technical consultancies) (1) (2)
Informal mechanisms (3) (4) Informal mechanisms
(flagship provides technical assistance (reverse engineering, literature)
to local suppliers)
Market
mediated
Market
mediation
Non-market
Mediated
Active
The role of network flagships
Passive
Source: adapted from Ernst and Kim (2001)
Traditional multinationals have relied heavily on the mechanisms in quadrant 1 when setting
up their plants either for the penetration of protected markets or for exploiting differential
factor costs. In contrast, flagships transfer knowledge not only through mechanisms in
quadrant 1 but also through mechanisms in quadrant 3. Knowledge diffusions through
mechanisms in quadrant 3 illustrate that linkages with foreign firms are one of the critical
strategies helping to upgrade local suppliers. In quadrant 2, machinery is a main source of
process innovation for local suppliers. In this case, flagships might force local suppliers to
purchase more advanced equipment for enhancing production capabilities. In quadrant 4,
local suppliers acquire new knowledge through reverse engineering of foreign products or
observation tour of foreign firms.
Upgrading is regarded as the ‘shift to higher value-added products, services and production
stages through increasing specialisation and efficient domestic and international linkages’
(Ernst, 2003:2). For others, the concept of upgrading refers to refer to several kinds of shifts
that firms or groups of firms might undertake to improve their competitive position in global
value chains. It also involves insertion into local and global value chains in such a way as to
8

Yung-kai Yang
maximise value creation and learning (Gereffi et al., 2001). Hence, the concept of upgrading
is about local firms’ insertion into the production network, learning from international firms
and then consequently moving up in the positions of global production network or global
value chain.
There are five types of upgrading which are not only relevant to the analysis of firms, but
also to an understanding of how countries fashion development strategies to attempt to move
themselves into relatively high-value, sustainable niches in the global economy (Gereffi et al.,
2001). Product upgrading: firms can upgrade by moving into more sophisticated product
lines (which can be defined in terms of increased unit values). Process upgrading: firms can
upgrade processes by transforming inputs into outputs more efficiently through superior
technology or reorganising the production systems. Intra-chain upgrading: involving several
types of upgrading opportunities that exist within a particular value chain. Firms can acquire
new functions in the chain, such as moving from production to design or marketing. Firms
can also move backward or forward to different stages in a supply chain, such as moving
from the production of finished goods to intermediates or raw materials. Inter-chain
upgrading: this occurs when firms apply the competence acquired in a particular function of
a chain to a new sector. For example, a company or a cluster of companies that specialise in
graphite materials could move from making golf clubs and tennis rackets to racing bikes.
Section 2 Overview of Taiwanese Notebook (NB) Computer Industry
2.1 Growing Global NB Computer Market
The size of global NB computer market has grown five-fold between 1998 and 2004 (table 1).
This growth had been driven by fierce price competition which saw sale of notebook
9

Yung-kai Yang
computers increasingly replace sales in desktops. In 2002, one out of five personal
computers4 sold in the global market is NB computer and the ration is expected to get
higher5.
Table 1. Taiwanese Notebook Computer Industry from 1998-2004 1998 1999 2000 2001 2002 2003 2004
Volume 1 6,088 9,703 12,708 14,161 18,380 25,238 33,340
Value 2 $8,423 $11,073 $13,549 $12,239 $13,847 $16,809 $21,830
Average Sales Prices $1,384 $1,141 $1,066 $864 $753 $666 $655
Global market by volume 1 15,610 19,816 24,437 25,747 30,033 37,857 46,110
Global market share by volume 40% 49% 52% 55% 61% 66% 72%
source: compiled by author from various reports of Market Intelligence Center and Economic Daily 1.thousand units 2. million US dollars
3.2 Growing Faster Than Global Market
Global demand for notebook computers has become increasingly supplied by the Taiwanese
NB computer industry (see Table 1). By year 2002, Taiwanese companies had taken more
than half of global market share by volume, reaching over 70% in 2004. In fact, the rate of
growth of Taiwanese NB computer industry has been constantly higher than the volume
growth rate of global market since 1999 (see Diagram 1), which strongly suggests an
influential position of the Taiwanese NB industry in the world.
Diagram 1 Volume growth rate of global market and Taiwan production 1999-2004
0%
10%
20%
30%
40%
50%
60%
99' 00' 01' 02' 03' 04'
Global
Taiwan
Source: data from table 1 in this article
4 Personal computer includes both desktop computer and notebook computers.
5 Market Intelligence Center, (2003) ‘Logistics Model of PC Industry across Taiwan and China’ published by Market Intelligence Center, Taiwan
10

Yung-kai Yang
2.3 Growing in Volume but Not in Added-value
In spite of the fact that the Taiwanese NB computer industry keeps growing in volume every
year since 1999, its ‘average sales prices’ (ASP) grows in negative direction ever since (see
Diagram 2). Two reasons help explain this phenomenon: firstly, low price products
introduced by flagship companies such Dell and HP in 2000; secondly, compared to Korean
OEM/ODM companies namely Samsung and LG, Taiwanese producers focus more on low-
& middle-end products with lower added-value.
Diagram 2 Volume/value/ASP growth rate of Taiwan NB production 1999-2004
-20%
0%
20%
40%
60%
99' 00' 01' 02' 03' 04'
volume growth
value growth
ASP growth
Source: data from table 1 in this article
2.4 Strategies of Growing in Both Volume and Added-value
Gradual decrease of average sales price per unit has made NB computers made by Taiwanese
companies became a “commodity” product. The main Taiwanese producers have been
struggling to maintain profit margin above 5 percent in the face of declining profit margins
over recent years (see Figure 3). In response, several strategies have been adopted by
Taiwanese companies for growing not only in volume but value. 1. Relocating
manufacturing sites to countries with lower production cost, namely China and southeast
Asia countries; 2. Vertically integrates key components manufacturing in order to ensure not
11

Yung-kai Yang
only stable components supply but also higher profit margin. One source of profit for
Taiwanese NB companies used to be purchasing components on behalf of flagship companies.
However, when flagship companies retake more and more procurement job, they lost the
profit earned from purchasing components. Thus they begin to build up their own factories
producing components such as LCD-panel and DVD-ROM so that flagship companies could
buy components from Taiwanese NB companies, instead of from a third party. 3. Upgrades to
marketing function in the value chain. Most of Taiwanese NB companies do not have own
brands products (see next section). In other words, most of them only focus on manufacturing
function of the notebook computer value chain. However, there are companies such as Acer,
Asus and BenQ choose to expand their territory into marketing area, choose to develop their
own brand products.
Figure 3 Profit margin of four main Taiwanese NB companies 1998-2004
0%
2%
4%
6%
8%
10%
12%
14%
16%
18%
20%
1998 1999 2000 2001 2002 2003 2004
year
prof
it m
argi
n %
Quanta
Compal
Wistron
Inventec
Source: companies annual reports. * data of Wistron is only available after 2001
2.5 OEM/ODM as Main Business
Taiwanese NB industry largely bases on OEM/ODM business. The proportion of OEM/ODM
business is constantly higher than 80% and has reached as high 95% in recently years (see
12

Yung-kai Yang
Diagram 3). In other words, own-brand business has never been more than 20% in the
Taiwanese NB computer industry. Due to the substantial proportion of OEM/ODM business,
the Taiwanese NB computer industry has been particularly governed by flagship companies
in aspects of price, volume and product strategy.
Diagram 3 Volume proportion between OBM and OEM/ODM business 1998-2004
0% 10% 20% 30% 40% 50% 60% 70% 80% 90% 100%
98 'Q 1
98 'Q 3
99 'Q 1
0 '1Q 1
0 '1Q 3
02 'Q 1
02 'Q 3
03 'Q 1
03 'Q 3
O B M
O EM /O D M
source: complied by the author from various MIC reports
2.6 Three Types of NB Companies
There are three types of company in the Taiwanese NB computer industry
1. Own-brand business company, which products are sold under its own-brand name.
Companies in this category include Acer and BenQ. Acer was formerly one of main
Taiwanese first-tier supplier producing various computer-related products for international
buyers. To deal with the conflict between own-brand business and OEM 6 (Original
Equipment Manufacturing) business within organisation, decisions was made to separate
OEM from own-brand business. After the separation, Acer solely focuses on marketing and
R&D activities and outsources manufacturing activity to OEM companies. BenQ is an Acer’s
spin-off company and likewise Acer, BenQ also out sources manufacturing activity to other
6 An OEM supply relationship refers to a contractual arrangement in which the contract manufacturer provides
manufacturing services based on the product design, specification, quality standard and, in some cases, designated
components furnished by the outsourcing firm (Lee & Chen, forthcoming).
13

Yung-kai Yang
OEM companies.
2. Pure OEM business company7: companies of this type merely focus on producing NB
computers for flagship companies; products are sold under flagship companies’ brand names.
There are totally seven companies in this category. Among them, Quanta and Compal are the
largest two with more than five million units ahead of others. Wistron is a spin-off company
of Acer. Mitac and Inventec also produces notebook computer for industrial and military
usage. FIC and Uniwill are also in this category (See Appendix 1 for company profiles).
3. Mix of own-brand and OEM business: companies of this category not only produce NB
computer for flagship companies through OEM or ODM contract arrangement, but also sell
products with their own-brand name on them. A difference among companies of this type is
arrangement of organization for own-brand business. Companies like Arima, Clevo, Elite and
Twinhead, own-brand and OEM business are placed within the same organization. In Asus,
different from these companies, OEM business is allocated to its wholly-owned subsidiary.
Thus its own-brand and OEM business enjoy higher independence from each compare to
other companies. Sales amount and market of own-brand products of these companies tend to
be rather small and limited to Taiwan market, except that Asus has overtaken Acer as No.1
brand in Taiwan and gradually expands in overseas market.
2.7 Collaboration and Competition between Supplier and Flagship Company
Flagship companies usually have two or three or even more first-tier NB computer suppliers
(see Table 2). Advantages of multiple suppliers include reducing risk in supply chain
7 If a supplier can provide product design and manufacturing outsourcing services, we may call this type of contractual
arrangement ODM (own design, development and manufacturing) supply (Lee & Chen, forthcoming).
14
Yung-kai Yang
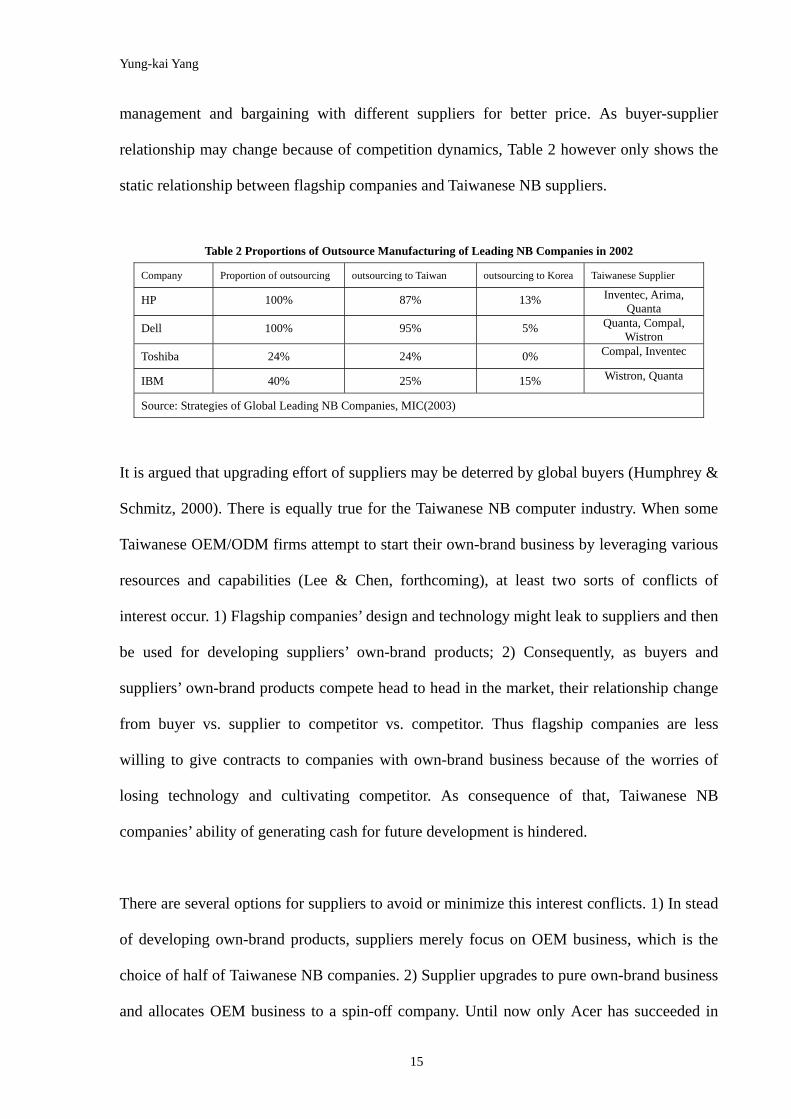
management and bargaining with different suppliers for better price. As buyer-supplier
relationship may change because of competition dynamics, Table 2 however only shows the
static relationship between flagship companies and Taiwanese NB suppliers.
Table 2 Proportions of Outsource Manufacturing of Leading NB Companies in 2002
Company Proportion of outsourcing outsourcing to Taiwan outsourcing to Korea Taiwanese Supplier
HP 100% 87% 13% Inventec, Arima, Quanta
Dell 100% 95% 5% Quanta, Compal, Wistron
Toshiba 24% 24% 0% Compal, Inventec
IBM 40% 25% 15% Wistron, Quanta
Source: Strategies of Global Leading NB Companies, MIC(2003)
It is argued that upgrading effort of suppliers may be deterred by global buyers (Humphrey &
Schmitz, 2000). There is equally true for the Taiwanese NB computer industry. When some
Taiwanese OEM/ODM firms attempt to start their own-brand business by leveraging various
resources and capabilities (Lee & Chen, forthcoming), at least two sorts of conflicts of
interest occur. 1) Flagship companies’ design and technology might leak to suppliers and then
be used for developing suppliers’ own-brand products; 2) Consequently, as buyers and
suppliers’ own-brand products compete head to head in the market, their relationship change
from buyer vs. supplier to competitor vs. competitor. Thus flagship companies are less
willing to give contracts to companies with own-brand business because of the worries of
losing technology and cultivating competitor. As consequence of that, Taiwanese NB
companies’ ability of generating cash for future development is hindered.
There are several options for suppliers to avoid or minimize this interest conflicts. 1) In stead
of developing own-brand products, suppliers merely focus on OEM business, which is the
choice of half of Taiwanese NB companies. 2) Supplier upgrades to pure own-brand business
and allocates OEM business to a spin-off company. Until now only Acer has succeeded in
15

Yung-kai Yang
this strategy. 3) Supplier places OEM business in a subsidiary so that the level of interest
conflict decreases, which what has been adopted by Asus.
Section 3 Offshore Manufacturing in China
3.1 Investment Regulations
Owing to the political tension between Taiwan and China, Taiwanese investment activities
are regulated by the Taiwan government in terms of product, industry, amount of capital and
technology transferring. NB computer industry was categorized as restricted industry by the
Taiwan government and was not allowed to invest in China until the end of 20018. However,
if investment project in china was over 20 million US dollars, specific project reviewing is
obligated for companies. Otherwise only general reviewing process is needed9.
3.2 Offshore Manufacturing in China
After the relaxation of investment regulations in the November of 2001, the percentage of
Taiwanese NB computers produced in China increased dramatically. By early 2004, the
percentage of Taiwanese NB computers produced in China has reached as high as 70% (see
Figure 4). Actually the growing percentage of offshore manufacturing, either in China or
other countries, does not only occur in the Taiwanese NB computer industry. Since by the
end of 2004, more than 85% of Taiwanese information technology (IT) hardware
manufacturing is done in China and relatively, less than 10% is done in Taiwan (see Figure 5),
the exodus of Taiwanese NB industry in fact represents a widespread cross-strait geographic
8 NB computer was removed from restricted investment list in the end of 2001. ‘The influence of Taiwanese notebook computer industry investment in China” published by Market Intelligence Centre, (2003). 9 More details about investment regulations could be found in ‘Investment Commission, Ministry of Economic Affairs, www.moeaic.gov.tw
16

Yung-kai Yang
reconstruction happening in the Taiwanese electronics industry.
Figure 4 Percentage of Taiwanese NB computers produced in China 2000-2004
40%
0 5%
80%71%
0%
20%
40%
60%
80%
100%
2000 2001 2002 2003 2004
year
per
centa
ge
source: complied by the author from MIC reports
Figure 5 Offshore production of iwanese IT hardware 1995-2004 Ta
0%
10%
20%
30%
40%
50%
60%
70%
80%
90%
100%
1995 1996 1997 1998 1999 2000 2001 2002 2003 2004
Pro
port
ion
of V
alue
Proportion of production inTaiwan
Proportion of offshoreproduction in China
Proportion of offshoreproduction in othercountries
source: complied by the author from MIC reports and China Times(28/12/04)
3.3 Why leave Taiwan----Cheaper in China and Make More Profit?
Cost-saving is one of main purposes of investing in china for many foreign firms, particularly
for those from other Asian countries (Gaulier, Lemoine & Unal-Kesenci, 2005). Nevertheless,
17

Yung-kai Yang
from the case of Taiwanese NB computer industry, it is learnt that if logistics cost was
included, offshore manufacturing in China does not make too much cost difference. Apart
from that, relocation to China does not save the Taiwanese NB computer industry from ever
decreasing profit margin.
omponents for NB computer manufacturing could be divided into five categories: 1) Active
Diagram 4 Cost structure of NB components
C
component: LCD panel, CUP, Chipset and memory; 2) Mechanism component: PCB,
connector and switch; 3) Reactive component: capacitance, resistance add adaptor; 4)
Function component: power supply, speaker and battery; 5) others: CD/DVD-ROM, hard
disk (modulized component); case, keyboard (non-electronics component). Taiwanese NB
companies not only buy most of active components but also CD/DVD-ROM and hard disk
from Japanese, Korean and US companies10, which means that there is about 70% to 80% of
components purchased from other countries (see Diagram 4 ).
Mechanism
6%
Reactive
4%
Other
19%
Function
4%
Active
67%
source: adapted from ‘competition of NB computer components between Taiwan and China’,
Industrial Economics and Knowledge Center, Taiwan
Normally these components are purchased with so called ‘global prices’, which means the
purchase prices are not related to the locations of manufacturing. Consequently, the
10 Kuo Y. C. (2002), Competition of NB computer component across the strait, published by Industrial Economics and Knowledge Center, Taiwan
18

Yung-kai Yang
Table 3. Cost difference between Taiwan and China in various items
Item Location Taiwan China
difference of manufacturing in China and Taiwan in the components aspect would only
derive from the prices difference contributed by Taiwanese suppliers marking components in
China, which saves about 1 % of component cost (6 US dollars) per notebook computer
(see Table 3). Cost difference of components together with cost saved in items such as labour
and electricity, offshore manufacturing in China is about 3% (21 US dollar) lower per unit
than in Taiwan. However if cost of flight is added, the cost advantage of manufacturing in
China decreases to 1.8% (12 US dollar) of total cost.
CPU 170 170
LCD Panel 125 125
HDD 80 80
OS 65 65
Battery 32 30
DVD-ROM 35 35
Memory 30 30
Adaptor 19 18
Others 68 65
subtotal 624 618
Labour, electricity…et cetera 30 15
subtotal 654 633
flight 8x3kg=24 11x3kg=33
Total 678 666
Unit: US dollar. sed on NB com monitor, Intel Pentium M CPU,
256MB RAM and 40G hard disk. Source: MIC report ‘The Competitive Advantage of Taiwanese IT
Industry’ Reasons of offshore manufacturing in China for Taiwanese NB industry---cost
incentives? MIC, 2003; MIC presentation on ‘Taiwanese ODM Maker Strategy’, 2005).
These prices are ba puter with 15”
ffshore manufacturing in China indeed saves some cost for the Taiwanese NB companies, O
however such relocation did not solve the profit margin squeeze. From 2001 to 2004, the
percentage of offshore manufacturing in China grown every year, on the contrary the profit
19

Yung-kai Yang
5 Comparison of average profit margin and percentage of offshore production in China
2001-2004
Section 4 Closed Taiwanese NB Computer Production Network in China
4.1 No Linkage Evidence 1---Ownership Aspect of Investment Strategies
Less developed country as a channel of learning technology from outside world. However, no
Table 4. Taiwanese NB Computer Company's Investment in China11
Company Investment
Approach
Percentage of
ownership
Location Company Investment
Approach
Percentage of
ownership
Location
margin of four main Taiwanese NB companies decreased steadily in the same period (see
Diagram 5).
Diagram
source: Figure 3 & 4 of this paper
10.2%
8.3%
5.6%
7.1%
5.0%
80.0%
71.0%
40.0%
0%
2%
4%
6%
8%
10%
12%
2001 2002 2003 2004
year
per
cent
age
0%
10%
20%
30%
40%
50%
60%
70%
80%
90%
per
cent
age
Average profitmargin of fourmain TaiwaneseNB companiesPercentage of NBoffshoremanufacturing in
joint-venture company has been established by Taiwanese NB companies and local
companies (see Table 4), which means no learning through join-venture channel for the
Chinese electronics industry.
Quanta 1 100% Shanghai Uniwill 1 100% Suzhou
11 Direct investment in China is restricted by Taiwan government. Taiwanese NB companies have to set up investment
company in a third country such as British Virgin Island and then invest in China through its investment company. See more
details of related regulations in ‘Investment Commission, Ministry of Economic Affairs’. www.moeaic.gov.tw
20

Yung-kai Yang
Compal Kunshan FIC Wujiang 1 & 2 100% 1 100%
Inventec 1 100% Shanghai Twinhead 1 100% Kunshan
Wistron 1 100% Kunshan Mitac 2 100% Kunshan
Asus 1 100% Suzhou Clevo 1 100% Kunshan
Arima 1 100% Wujiang Elite 1 100% Kunshan
There are two ways estme rce: co by au m annua eports) 1. Set up new company in a third country and then invest in subsidiary in China through it.
2. I an existing mpany in ountry vest i diary in C a through i
of inv nt: (sou mpiled thor fro l r
nvest in co a third c and then in n subsi hin t.
4.2 No Linkage Evidence 2--No Chinese Suppliers in the Production Network
Y
, as a matter of fact that there are no local Chinese companies participating in
Table. 5 Computer manufacturer in Yangtze River Delta area
Taiwanese company Chinese company Other countries
angtze River Delta area has become a cluster of NB computer manufacturing because of
‘co-location’ of twelve Taiwanese NB companies and five NB companies from other
countries (see Appendix 2 & Table 5). Such an agglomeration of NB companies has provided
local Chinese companies an opportunity of inter-organization learning through interacting
with members of cluster (Bell & Albu, 1999).
Name City Produc Name City Product t Name City Product Name City Product
Arima
C
c
a
Wujiang
Kunshan
ill
Shuzhou
Kunshan
NB Legen
W
Samsun
T Shanghai
ai
B
NB
NB
d Shanghai DT
TCL uxi
DT
g Suzhou N
oshiba
Sony
HP
NEC
Wuxi
Shanghai
Shangh
NB
NB
DT+
DT+
NB Asus
NB NB Compal levo
NB
NB
NB
NB
Wujiang
Kunshan
Wuxi
Kunshan
FIC
Mitac
Uniw
Wistron
NB
NB
NB
NB
Kunshan
Shanghai
Shanghai
Kunshan
Elite
Invente
Quant
Twinhead
Source: com thorplied by au
Nonetheless
supplying Taiwanese NB companies (see Table 6), the prospect of learning through ‘linkages’
with Taiwanese NB production network is gloomy for the local industry. For Taiwanese NB
21

Yung-kai Yang
companies, components are sourced only from Taiwanese suppliers or suppliers from third
countries such as Japan and US. Components made by local Chinese suppliers are rarely
purchased; at most only packing material such as paper box is sourced from Chinese
suppliers12. Hence, it strongly suggests that Taiwanese NB computer production network is a
‘closed’ production network with foreign companies operating in an enclave environment in
China.
Table 6. Component Procurement Sources of Taiwanese NB Computer Company by volume
Item
Place of Producing
CUP LCD
Module
Hard
Disk
Case CD/DVD
ROM
Chipset Adaptor Fan Speaker Microphone
Taiwanese company 30% 30% 10% 25% 20% 10% Taiwan
Third country company 2% 80%
Taiwanese company 15% 30% 10% 70% 20% 10%
Chinese company
China
Third country company 55% 10% 80% 10% 80% 20%
Others 98% 100% 75% 60% 30% 20%
Source: material given by senior industry annalist in Market Intelligence Center during interview, data was collected in year 2003
Section 5 Why It Is a ‘Closed’ Production Network
5.1 Relocation of Whole Production Network
5.1.1 Linkage Permanence of NB Companies and Taiwanese suppliers
Linka rom
ormally suppliers provide customized components to NB companies. In some cases,
ge permanence of Taiwanese NB companies and their Taiwanese suppliers stems f
the nature of NB computer products development.
N
12 interview 1, 3, 5, 7 & 9.
22

Yung-kai Yang
collaborative-design takes place between Taiwanese NB companies and components
suppliers13. Therefore, for some components, instead of changing suppliers in order to have
cheaper components, NB companies prefer to work together with existing suppliers to
improve cost and quality. As stated by a manager:
‘…We have some long-term collaboration with component suppliers
5.1.2 Flagship Companies’ Quality Assurance System
Poor quality is e components
roduct quality is highly regarded by flagship companies so that comprehensive quality
because components are more customized. We have to start from the
beginning if we use a new supplier. So we seek for long-term
collaboration to improve quality. It is not necessarily a good thing to
change supplier often. In principle, we work together with existing
supplier to improve quality; changing supplier is our last resort’,14
a main reason why Taiwanese NB companies are reluctant to us
produced by Chinese suppliers15. It is related to the fact that product defects penalty makes it
finically risky to use unreliable components.
P
assurance system is adopted to ensure quality of products bought from OEM companies.
There are generally three levels of auditing in quality assurance system. 1. System audit:
focusing on OEM companies’ business scale, customer base, supplier base, quality
management system (ISO system) and security management system. 2. Process audit:
focusing on engineer’s experience and know-how, engineer testing equipment, routine
manufacturing report checking and engineering change management. 3. Final product audit:
13 interview 9 14 quote from interview with a NB company manager in Yang & Hsia (2004) 15 Interviews 1,3, 5, 7 & 9
23

Yung-kai Yang
on-site-account manager from flagship companies conduct OOB (out of box) samples
checking. Prior to shipment of final products, on-site-account manager check product’s
appearance, function and appliances as he is the customer who buy that product.16
or OEM manufacturers, product quality is critical for winning contracts from and
5.1.3 The Missing link--- Business norms and practices
Flexibility an ir ‘informal’
‘they (suppliers) know that you (NB company) are the boss so that they
F
maintaining relationship with flagship companies. ‘Penalty agreement’ is usually signed
between OEM manufactures and flagship companies. OEM manufacturers have to
compensate flagship companies once defects occur. Though the amount of compensation is
unknown, it is for sure avoided by Taiwanese NB companies since their profit margin has
been as low as 5%-6%. As result of that, Taiwanese NB companies are cautions in choosing
qualified components in order to keep the possibility of product failures as low as possible.
d speed of Taiwanese NB companies mainly stem from the
agreements and interactions with Taiwanese suppliers, which trust is a critical element. The
special of business norms and practices of Taiwanese companies, compare to others, could be
seen in the following statement given by a manager in a NB company:
would listen to you. If you do business with foreign companies you have
to sign many agreements. For Taiwanese companies, you just ask them to
do what you want them to do. Because they know that you are a leader in
the industry and they will have prosperity as long as they follow you. Thus
they would not talk about contract, agreement or terms & condition with
you; things can be changed immediately if you want them to, it is very
16 interview 5
24

Yung-kai Yang
flexible’17. (Italic added by the author)
stead of official law arrangements, agreements are reached by oral promises so that
5.2 Consequence of China’s Trade and Industrial Policy
5.2.1 Domestic Market Quota Policy Promotes Vertical Integration
Though mestic
In
Taiwanese NB companies could avoid rigidity and delay caused by extra administration work.
Taiwanese NB companies found it difficult to work with Chinese suppliers which not only
have different business norms and practices but different mentality18. In fact, without those
business norms and practices, flexibility and speed is hard to be achieved, which suggests a
lost of competitive advantage.
only one case is found during fieldwork, it is noteworthy that China’s do
market quota policy indirectly encourages vertical-integration of Taiwanese NB companies.
Sales to China’s domestic market are imposed with quota for Taiwanese companies investing
in China. Quota is decided by central government on the bases such as number of employees,
wage level and difference of value between import and export. Quota policy seems not bother
large companies because of their scale of operations. However it is difficult to get quota for
Taiwanese components suppliers since majority of them are small and medium companies.
Consequently, to supply Taiwanese NB companies, they need to export and then import
components, which apparently not only delay suppliers’ delivery time but also complicates
buyers’ supply chain management. Therefore in order to shorten supply chain lead time, a
company chooses to integrate its suppliers into the organization.
17 interview 9 18 interview 1
25

Yung-kai Yang
5.2.2 Small & Medium Enterprise is Neglected because of National Champion Policy
W
(SMEs) (see Table7), industrial policy which greatly favour large enterprises has undermined
the development of the SMEs.
Table 7. Numbers of Large, Medium and Small Enterprise in China from 2001-2003 19
2001 2002 2003
hile more than 80% of electronics companies in China are small and medium enterprises
Large enterprise 499 (16.3%) 803 (8.9%) 824 (7.8%)
Medium enterprise 580 ) 87 101 (18.9% 3 (9.7%) 7 (9.6%)
Small enterprise 1983 (64.8%) 8 7330 (81.4) 755 (82.6%)
total 3062 (100%) 9006 (100%) 10596 (100%)
Source: China Electronics Industry Y 2003 & 200 House of El ry. earbook 2002 & 4, Publishing ectronics Indust
In the 1990s, a key theme of china’s industrial policy is ‘grasp the large, let go off the small’,
which aim is to develop a number of large enterprises to be the backbone of the Chinese
economy and be able to participate in international competition (Nolan, 2001). For
electronics industry, goal was set in the ‘Ninth Five-Year National Development Plan’ to
develop two or three domestic microcomputer manufacturers into enterprises with an annual
production capacity of over 1 billion US dollars (Kraemer & Dedrick, 2001).
In the context of promoting large enterprises, Chinese SMEs face various obstacles. Among
them, lack of finance support from government particularly limits the development of
Chinese SMEs. Unlike other governments, which set up enterprise development fund
specifically providing loans to the SMEs, China government does not have such finance
policy practically targeting at the SMEs. Meanwhile, loan policy of Chinese banks is 19 Companies are categorized into super-large, large, medium, small company according to their sales income and asset. If both sales income and asset are between 50 and 500 million RMB, it is categorized as medium company. If sales income and asset are less than 50 million RMB, it is categorized as small company (Lin & Wei, 2001).
26

Yung-kai Yang
is difficult to get loans from banks, self-accumulation is a main source of
vesting capital for Chinese SMEs. According to a survey done in 1998, the SMEs which
Fixed Asset Investment Current Asset Investment
substantially in favour of large enterprises. As result, the town-village enterprises, which
account for majority of Chinese SMEs, only represent 7%-8% of total loans in China (Lin &
Wei, 2001).
Given that it
in
self-own capital constitute of more than half of fixed asset investment, account for 81% of all
SMEs and on the contrary, the SMEs which loans constitute of more than half of fixed assent
investment, only account for 10% of all SMEs in China (see Table 8). Slow progress and
limited amount of self-accumulation capital all constrain Chinese SMEs’ capability of
improving product quality and innovation. Lack of innovation capability and poor product
quality naturally limit their opportunities of being a supplier for foreign companies.
Table8 Capital Sources of Fixed and Current Assent Investment
Proportion of
Investment Self-own (%) Loan (%) Others (%) Self-own (%) Loan (%) Others (%)
0.0 81 8 77 84 9 67
0.1-49.9 11 7 12 20 10 13
50.0-99.0 14 7 5 24 10 5
1 00.0 67 3 4 55 3 4
total 100 100 1 00 100 100 100
Source: Hanchuan Lin (2003), Development Mechanism of Sma m Enterprise in China, Beijing: The Commerci ress ll and Mediu al P
5.3 Taiwan Government’s Involvement
Evidence suggests that considerable number of Taiwanese suppliers have already established
their operations in China (see Figure 6) priori to the relaxation of investment restriction in 20
20 List of main Taiwanese NB components suppliers are taken from the report ‘competition across the Strait in NB computer component industry’ published by Industrial Technology Research Institute, Industrial Economics and Knowledge Center, Taiwan in 2002. Year of first investment in China is identified in company annual reports. For non-public companies, the year is identified in their company websites.
27

Yung-kai Yang
year 2001. Given that there are 11 companies which have no investment in China till 2004,
36 out of 57 main Taiwanese component suppliers have invested in China before year 2001.
Since there were many Taiwanese component suppliers available in China already, Taiwanese
NB companies are less willing to find local Chinese ones.
Figure 6 Number of Taiwanese component suppliers’ investment in China
1989-2004
12
4
1
3
1
5 5
7 7
10
7
4
0
2
4
6
8
10
12
89 ' 92 ' 93 ' 94 ' 94 ' 96' 97 ' 98 ' 99 ' 00 ' 01 ' 02 ' 04 '
year
num
ber
of c
ompa
ny
Section 6 Discussion and Conclusion
6.1 Governance Power in the Taiwanese Production Network
Governanc aiwanese
advantage for bargaining prices with suppliers. Therefore, to some extent, the characters of so
e power could be found in at least three aspects in the case of T
production network: components assignment; quality assurance and inventory risk sharing.
As far as components assignment is concerned, most of key components are assigned by
flagship companies to first-tier suppliers; non-key components are assigned in some cases as
well. Second-tier suppliers are also required by first-tier suppliers to only use components
approved by them. By assigning components, flagship companies not only ensure the quality
of final products but also comprehend the cost structure of their suppliers, which gives them
called ‘Taiwanese production network’ are rooted in the decisions of flagship companies
28

Yung-kai Yang
ity assurance
ystem’ (see also section 6.1.2), suppliers have to be either assigned or approved by buyers.
ory risk is shifted from flagship companies to first-tier suppliers via
uild-to-order (BTO) practice. BTO practice is adopted to replace the traditional way of
mon denominator
from US and Japan. Bedsides, while Taiwanese NB companies have similar principles and
practices with flagship companies in managing their suppliers (second-tier supplier),
governance pattern is further extended from the relationship between flagship company and
first-tier supplier to the one between first-tier supplier and second-tier supplier.
Governance power could also be found in quality assurance and inventory risking sharing
system in the Taiwanese NB production network. In the principles of ‘qual
s
Failures in products and components quality cause penalty for suppliers. Both flagship
company and first-tier supplier prefer to use someone who is reliable in quality and of
reputation in the industry. First-tier suppliers also prefer second-tier suppliers which are
financially capable of sharing penalty risks with them, i.e. be able to pay penalty if quality
failure occurred.
‘Inventory risk sharing’ is done by shifting part of inventory risk, if not all, to up-stream
suppliers. Invent
b
building to stock. This practice necessitates Taiwanese NB companies to produce products
according to orders that are collected instantly on the internet and then ship the products to
designated places on time (Chen, 2003). Thus inventory pressure and risk are transferred
from flagship companies to Taiwanese NB companies. BTO is especially welcomed by
flagship companies when the demand of market is highly unpredictable.
Inventory risk is shifted from first-tier suppliers to second-tier suppliers via ‘vendor managed
inventory (VMI)’21 supply chain management. VMI represents a com
21 A working definition of VMI is ‘a collaborative strategy between a customer and supplier to optimise he availability of
29

Yung-kai Yang
e Explanations of No Linkages and Alternative Channels of Learning
he presence of foreign direct investment (Taiwanese NB companies) does not, as a matter of
c
between various industrial contexts which aspire to time compression in the supply chain
(Hines et al., 2000). What have been found in practice from fieldwork is that suppliers are
demanded to deliver components to warehouse hubs set up by NB companies. Prior to the
use of components, they are regarded as suppliers’ inventory. In the end of period agreed, NB
companies only pay for units used, regardless how many are left in the warehouse. NB
companies even charge suppliers for using their warehouse utilities. The suppliers incur
increased inventory costs with a negative impact on liquidity and cashflow (Hines et al.,
2000).
6.2 Som
T
ourse, promote linkages with local suppliers (Chinese suppliers), because governance
system raises both quality and finance thresholds of participating in global production
networks. Given that ‘quality assurance’ and ‘inventory risk sharing’ are both norms in the
Taiwanese NB production network, to be able to participate in global production, suppliers
are compelled to have sufficient finance strength in order to share risk with other network
members. Regrettably, finance capability is exactly a weakness of Chinese small and medium
enterprises. Therefore, an explanation of why linkages between the Taiwanese NB production
network and local Chinese suppliers do not exist is that, besides poor quality, the weak
finance strength of Chinese suppliers leaves them unable to share risks with other network
members. Consequently the possibility of becoming a qualified or prospective supplier is
excluded. In other words, instead of contributing to process and product upgrading
(Humphrey & Schmitz, 2004), governance system of global production networks could be an
adverse element as to wider participation in global economic activities for companies in less
products at minimal cost to the two companies. The supplier takes responsibility for the operational management of the inventory within a mutually agreed framework of performance targets which are constantly monitored and updated to create an environment of continuous improvement’ (Hines et al., 2000).
30

Yung-kai Yang
this research project also bring the notion of learning through global linkages
to questions. It would be pointless to discuss how dispersal of global production
t that Taiwanese NB production network has limited contribution to the
pgrading of Chinese electronics industry through external linkages, it is conducive to the
developed countries. For local suppliers in less developed countries to participate in global
production networks, there are not only technology issues need to be tackled but also
financial ones.
The findings of
in
organization is advantageous to local economy if linkage never exist. For that reason, we
need not only study what and how local suppliers could benefit from linkages with various
networks and chains (ex. Ernst & Kim, 2001; Humphrey & Schmitz, 2004) but also ask why
linkages may or may not occur in the first place. Apart from that, the GPN and development
literature need to begin thinking more about what and how local supplier could learn within a
‘closed network’.
In spite of the fac
u
upgrading Chinese electronics industry in two alternative ways. Firstly, benefits could be
reaped from R&D activities conducted in China. The process of producing notebook
computer includes five phases: design, engineer verification test (EVT), design verification
test (DVT), pilot verification test (PVT) and mass production (also see Appendix 3). Not long
ago, design and all testing tasks were done in Taiwan and then passed to production sites in
China for mass production. Today not only almost all PVT is done by sites in China; DVT
and EVT tasks also have been gradually taking up by engineers in China22. Apart from
testing tasks, software development is also carried out in China in some companies. One
advantage of conducting software development in china is that one task could be divided into
many small tasks and to be handled by many engineers at the same time. In this way, the
22 MIC (2003) “logistics Model of PC industry across Taiwan and China.
31

Yung-kai Yang
ity of learning managerial-related skills
r Chinese in. Personnel localisation is favoured because limited number of expatriates from
ns, surely Chinese employees,
iven the empirical evidence found thus far, there are some issues need to be further
enquired into for more comp namics of global production
ntory and quality failure are shared among product network members in order to
urvive in a highly volatile market. Risks are shifted from flagship companies to first-tier
process of software development is speeded up23.
Secondly, personnel localisation provides opportun
fo
Taiwan could not sustain their operations in China which are normally larger than their
counterparts in Taiwan. In addition to limited expatriates, lower wage level is also a reason
why local Chinese is favoured by Taiwanese NB companies24.
Although the extents to which R&D activities will be allocated to China and the extent of
personnel localisation in China in the future are open to questio
both in managerial and engineering positions, could gain beneficial experience and skill from
the training and education provided by their Taiwanese employers.
6.3 Further Research Issues
G
rehensive understanding of the dy
networks.
Risks of inve
s
suppliers and then to second-tiers suppliers via practices such as BTO and VMI. In the end,
who actually share most of risk in global production networks? Who shares what kind of
risks? What is the relationship between ‘risk’ and ‘governance power’ in global production
networks? Does the one who share more risk enjoy greater governance power in a global
production network, in other words is amount of risk shared equivalent to amount of
23 interview 11 24 interview 9
32

Yung-kai Yang
licies leaves Chinese supplier hard to jump
ver the ‘wall’ built by governance system between the Taiwanese NB production network
governance power? If not, why the one who share more risk but enjoy less governance power
is willing to stay in a global production network?
Lack of finance support and linkage-promoting po
o
and local Chinese suppliers. Nevertheless, China’s national champion policy has encouraged
another format of linkage between Taiwanese companies and Chinese companies, which is
Taiwanese suppliers and Chinese buyers. Yet it is claimed that Chinese brand-name
companies are poor in technology capability25. Questions posed in here include: how critical
is it to be technologically advanced in order to be a leader of a production network? How
critical is it to have manufacturing capability or technology knowledge in order to upgrade to
own-brand business in a production network? If there is technological capability gap between
Chinese brand-name companies and other flagship companies, what would be the distinction
of Sino-Taiwanese production network and Anglo/Japan-Taiwanese production network in
terms of operation modes and governance power? If Chinese buyers indeed learnt from
Taiwanese suppliers (reverse learning), it provides a contrary case to the literature often
claiming that suppliers should learn from buyers.
25 interview 1
33

Yung-kai Yang
Reference
Bell, M., Albu, M. (1999) ‘Knowledge systems and technological dynamism in industrial
Borrus, M., D. Ernst, and Haggard, S.(eds) (2
Chen, T. J. (2003) ‘E the case of Taiwan’s
Chen, T. J. and Chen S. H. (2001), “Globa nd Local Capabilities:
Ernst, D., (2000), “Placing the Networks on the Internet: Challenges and Opportunities for
Ernst, D. (2003) ‘How sustainable are benefi networks? Malaysia’s
Ernst, D. and Ki tion networks, knowledge diffusion, and local
Gaulier :
Gereffi, G. (1994), ‘The organization of buyer-driven global commodity chains: how U.S. (eds.)
Gereffi
clusters in developing countries’, World Development, Vol.27, No.9, Pp.1715-1734.
000)., International Production Networks in
Asia: Rivalry or Riches?, Routledge, London
-commerce to protect the network relationships:
PC industry’, The Information Society, Vol.19, Pp. 59-67.
l Production Networks a
New Opportunities and Challenges for Taiwan,” East West Center Working Paper:
Economic Series No. 15
Managing in Developing Asia”, paper presented at the Second Asia Academy of
Management Conference, December 15-18, 2000, Singapore.
ts from global production
upgrading prospects in the electronics industry’, East-West Center Working Papers,
Economics Series No.57.
m, L. (2001) ‘Global produc
capability formation a conceptual framework’ Paper presented at the Nelson & Winter
Conference in Aalborg, Denmark June 2001, organized by DRUID.
, G., Lemoine, F. and Unal-Kesenci, D. (2005) ‘China’s Integration in East Asia
Production Sharing, FDI & High-Tech Trade’ CEPII Working Paper No.2005-09
retailers shape overseas production networks’ in G. Gereffi and M. KorzeniewiczCommodity Chains and Global Capitalism, Westport: Praeger. , G., Humphrey J. Kaplinsky R. and Sturgeon T. J. (2001) ‘Introduction: globalisation, value chains and development’ IDS Bulletin Vol.32, No.3.
34

Yung-kai Yang
Hobday, M. (1995) ‘East Asian latecomer firms: learning the technology of electronics’, World Development, Vol.23, No.7, Pp.1171-1193.
pment’ Review of International
Hender
rd
Hines, R. La ones, D. Cousins, P. and Rich, N. (2000) Value Stream Management:
Hum in
Kraem ant: China’s Industrial
Lee, Ji-Ren and Jen-Shy ic Synergy Creation with Multiple
Lin, Han Chuan & W all &
Naughton, B. (1997), ‘The Future of China Circle’ in Barry Naughton (ed) The China Circle, Washington: Brookings Institution Press
Henderson, J., Dicken, P., Hess, M., Coe, N. and Yeung, H. W. (2002) ‘Global production networks and the analysis of economic develoPolitical Economy, Vol.9, No. 3, Pp.436-464.
son, J. and Phillips, R. (2004) ‘The unintended consequences of pro-poor growth:
globalisation, industrial upgrading and the underdevelopment of Malaysian electronics’,
Paper for the 3 International Conference of the Centre for Regulation and Competition,
Cape Town
mming, R. J
strategy and excellence in the supply chain, Harlow: Pearson Education.
phrey, J. and Schmitz, H. (2004) ‘Chain governance and upgrading: taking stock’
Local enterprises in the Global Economy: Issues of Governance and Upgrading, edited
by Hubert Schmitz, Cheltenhem: Edward Elgar.
er, K. & Dedrick, J. (2001) ‘Creating a Computer Industry Gi
Policies and Outcomes in the 1990s’, China PC paper, Center for Research on
Information Technology and Organizations.
ang Chen, (forthcoming) ‘Dynam
Business Activities: Toward a Competence Based Growth Model for Contract
Manufacturer’ in Research in Competence-Based Research Advances, Applied Business
Strategy Series Volume C, Ron Sanchez and Aime Heene, eds, JAI Press.
ei, Zhongqi Zhu (2001) Comparison of Development of Sm
Medium Enterprise in Different Counties (Zhong xiao qi ye fa zhan de guo bie bi jiao),
Beijing: China Finance & Economic Publishing.
Nolan, P. (2001) China and the Global Economy: National Champions, Industrial Policy and
35

Yung-kai Yang
36
UNCTD (2001), oting Linkages. United Nations.
the Big Business Revolution, New York: Palgrave.
World Investment Report 2001---Prom
You-Ren Yang & Chu-Joe Hsia (2004) ‘Local Clustering and Organizational Governance of
Trans-border Production Networks: a case study of Taiwanese IT companies in the
Greater Suzhou area’, Journal of Geographical Science (36):23-54

Yung-kai Yang
37
Appendix 1 Profiles of Taiwanese NB Companies
Name Product (proportion of income) Number of Employee Main Customer Sales locations (proportion of sales
income)
Notebook Computer Sales
Volume
Share of Taiwan’s Export / of World
market *
Arima, Notebook Computer (78%) Components (23%)
1140 HP NEC Compaq
America (62%) European (4%) Asia (32 %)
838,512
3.3% / 2.2%
Asus Notebook Computer (29%) Motherboard (32%) Multimedia (18%)
7036 Sony North America (14%) Asia (42%) European (42%)
691,617 2.7% / 1.8%
Clevo Notebook computer, LCD PC, Tablet PC (95%) Others (5%)
942 TCL European (48%) Asia (36%) America (14%)
About 510,000 2.0% / 1.4%
Compal Notebook computer Monitor Mobile communication
4360 Dell, HP, Toshiba, Fujitsu-Siemens, Acer, Apple
European (34.5%) Asia (34.3%) America (29.2%) Others (2.0%)
8,000,000 31.1% / 21.3%
Elite Notebook computer (39.7%) Motherboard (48%)
3340 Apple, PC Wave Asia /America/European 706,253 2.8% / 1.9%
FIC Notebook & Desktop computer Motherboard
1798 NEC, Hitachi Not available Not available Not available
Inventec Notebook computer & Server (64%) Others (36%)
2119 HP, Toshiba, Compaq Asia America European
Not available Not available
Mitac notebook computer (95%) Industry notebook computer (3%)
636 NEC, Sharp Not available 961,885 3.7% / 2.6%
Quanta Notebook computer (82%) Mobile Phone (5%)
4979 HP, Dell, Fujitsu-Siemens, IBM, Acer, Sony, NEC, Apple
America (39%) Asia (20%) European (33%)
9,677,000 37.6% / 25.8%
Twinhead Notebook computer (95%) Others (5%)
330 Sotec, Trigem computer, Itronix Not available 230,875 0.9% / 0.6%
Wistron Notebook computer (62%) Desktop computer (11%) Other (27%)
3703 Acer, Dell, Fujitsu-Siemens, Hitachi European (8%) Non-European & America (92%)
1,782,342 6.9% / 4.8%
Source: Year 2003 annual reports & Business Times (Taiwan) *The numbers in this column are calculated by author. Volumes of NB global market and Taiwan’s export are adopted from ‘Report of global NB Market
2004’, published by MIC. Volume of global market in 2003 is 37,500,000; Taiwan’s export volume was 25,710,000.

Yung-kai Yang
Appendix 2
Compal, Elite, Twinhead,
Wistron, Mitac, Clevo
Quanta, Inventec
Asus, Uniwill
FIC, Arima
Wujiang
Appendix 3
NB Manufacturing Process
Source: Logistics Model of PC Industry across Taiwan and China, MIC, (2003)
Design
*Architecture design
*Product feature list
MP
Mass
Production
PVT Small scale production
and testing
DVT Temperature,
anti-shock testing ect.
EVT
* Basic function testing
* Parameter and
specification setting
3 months 1.5 months 1.5 months Lead Time
38