Embed Size (px)
Citation preview

Implications of Fecal Bacteria Input from Latrine-Polluted Ponds forWells in Sandy AquifersPeter S. K. Knappett,†,△,* Larry D. McKay,† Alice Layton,‡ Daniel E. Williams,‡ Md. J. Alam,§
Md. R. Huq,§ Jacob Mey,∥ John E. Feighery,⊥ Patricia J. Culligan,⊥ Brian J. Mailloux,# Jie Zhuang,‡,▽
Veronica Escamilla,○,⧫ Michael Emch,○,⧫ Edmund Perfect,† Gary S. Sayler,‡ Kazi M. Ahmed,§
and Alexander van Geen∥
†Department of Earth and Planetary Sciences, The University of Tennessee, Knoxville, Tennessee 37996-1410, United States△Helmholtz Center Munich, Institute of Groundwater Ecology, Ingolstaedter Landstr. 1, 85764 Neuherberg, Germany‡Center for Environmental Biotechnology, The University of Tennessee, Knoxville, Tennessee 37996-1605, United States§Department of Geology, University of Dhaka, Dhaka 1000, Bangladesh∥Lamont-Doherty Earth Observatory of Columbia University, Route 9W, Palisades, New York 10964, United States⊥Civil Engineering and Engineering Mechanics, Columbia University, New York, New York 10027, United States#Department of Environmental Science, Barnard College, New York, New York 10027, United States▽Department of Biosystems Engineering and Soil Science, Institute for a Secure and Sustainable Environment, University ofTennessee, Knoxville, Tennessee 37996, United States○Department of Geography, University of North CarolinaChapel Hill, Chapel Hill, North Carolina 27599-3220, United States⧫Carolina Population Center, University of North CarolinaChapel Hill, Chapel Hill, North Carolina 27516-2524, United States
*S Supporting Information
ABSTRACT: Ponds receiving latrine effluents may serve as sources of fecalcontamination to shallow aquifers tapped by millions of tube-wells inBangladesh. To test this hypothesis, transects of monitoring wells radiatingaway from four ponds were installed in a shallow sandy aquifer underlying adensely populated village and monitored for 14 months. Two of the pondsextended to medium sand. Another pond was sited within silty sand and the lastin silt. The fecal indicator bacterium E. coli was rarely detected along thetransects during the dry season and was only detected near the ponds extendingto medium sand up to 7 m away during the monsoon. A log−linear decline in E.coli and Bacteroidales concentrations with distance along the transects in theearly monsoon indicates that ponds excavated in medium sand were the likelysource of contamination. Spatial removal rates ranged from 0.5 to 1.3 log10/m.After the ponds were artificially filled with groundwater to simulate the impact ofa rain storm, E. coli levels increased near a pond recently excavated in medium sand, but no others. These observations show thatadjacent sediment grain-size and how recently a pond was excavated influence the how much fecal contamination pondsreceiving latrine effluents contribute to neighboring groundwater.
1. INTRODUCTIONFecal contamination has been reported in many shallow sandyaquifers throughout the world.1−3 This finding is often contraryto expectations based on laboratory-scale column experiments,which routinely demonstrate high bacterial removal rates (m−1)in fine and medium sand.4−7 Field studies, however, show thatbacteria are often transported greater distances than predictedby column experiments.2,8−11 Relatively few microbial transportstudies in sand aquifers have been carried out in the field. Suchresearch has included the injection of a microbial tracersolution in an uncontaminated aquifer at depth,2,9,12,13 anengineered wastewater infiltration basin subjected to constantloading,14,15 and an aquifer being evaluated for protection via a
riverbank filtration.16 Findings from these studies might not beapplicable to microbial transport in other aquifer settings,especially in developing countries, where there are abundantsources of fecal contamination, the depth of the water tablevaries widely through the year, and numerous shallow wells arethe main source of drinking water.17,18
In rural Bangladesh, the population density is high, sanitationis poor, and diarrheal disease morbidity19,20 is very high,
Received: August 9, 2011Revised: December 17, 2011Accepted: December 20, 2011Published: December 20, 2011
Article
pubs.acs.org/est
© 2011 American Chemical Society 1361 dx.doi.org/10.1021/es202773w | Environ. Sci. Technol. 2012, 46, 1361−1370

causing an estimated 11% of all deaths.21 The majority ofvillagers obtain their drinking water from shallow tube wells insand aquifers so at least part of the high level of diarrhealdisease might be attributable to exposure to fecal-contaminatedwell water.22−24 Two recent studies observed frequentoccurrence of the fecal indicator bacterium (FIB) E. coli intube-well water, particularly during the monsoon.18,23 It wasnot clear, however, whether E. coli entered the aquifer throughvertical infiltration from near-surface sources, like latrines,through lateral transport from fecal-contaminated ponds, whichare very common in the villages,17 or from other sources, likecontaminated water occasionally used to prime hand-pumps.25
Ponds are typically excavated for foundation material and areubiquitous in rural Bangladesh. The existence of a stronghydrologic connection between ponds and shallow aquifers inthe Bengal Basin is unclear according to the contrastingfindings of two previous studies based on stable isotopes ingroundwater. One study reported that ponds in West Bengalhad no impact on the isotopic composition of groundwaterduring the dry season,26 whereas the other study suggested thatponds in Bangladesh were responsible for the majority of labileorganic matter introduced into aquifers.27 The discrepancycould reflect local differences in seasonal and geologic featuresof the specific study sites that affect hydrologic connectivity.
This study investigates the connection between ponds andaquifers in the context of the potential transfer of microbialpathogens from contaminated ponds. The study was carried outin a typical village of Bangladesh where a previous studyidentified persistent E. coli in 33 private tube-wells.18 Thespatial distribution of FIB was determined by a culture-basedmethod for E. coli and a DNA-based assays for E. coli andBacteriodales,28 a bacterium that constitutes up to 10% of fecalmass,29 along transects radiating from several ponds dug insediment with varying grain sizes. The study findings haveimplications for safe setback distances from ponds in ruralBangladesh and for understanding of microbial transport in fineand medium sand aquifers more generally.
2. SETTING AND METHODS2.1. Site Description and Hydrogeology. Bangladesh
experiences a dry season from November through April and amonsoon from May through October with the vast majority ofannual precipitation occurring during the monsoon. The studysite was the village of Char Para (23.796° N, 90.629° E), or SiteK.30 Char Para is underlain by a 25-m thick unconfined sandyaquifer, bounded by a 7-m thick silt layer below,30 covers anarea of 30 ha and houses approximately 1500.17 A surveyconducted in 2009 recorded the locations of 177 latrines, 43
Figure 1. Relative locations of four latrine ponds (shaded area) and transects wells (gray dots) within Site K. All shallow wells within a given transectwere spaced exactly 1 m apart. Colored circles represent 4 groupings of transects according to breadth of parameters analyzed from the 6 weekintensive monitoring period in June/July 2009. Group I transects (T1.1 and T2.1) were sampled before and after flooding for water chemistry, mE.coli and Bacteroidales as assessed by qPCR, and cultured E. coli at a minimum of once weekly. Each level thereafter indicates stepwise decreases inanalyzed parameter coverage as indicated in the legend.
Environmental Science & Technology Article
dx.doi.org/10.1021/es202773w | Environ. Sci. Technol. 2012, 46, 1361−13701362
ponds and 144 private tube-wells within the villageboundaries.17
Nine transects consisting of 5 to 6 monitoring wells (4 to 5same depth shallow wells and one well approximately 3 mdeeper) were installed in June 2008 in lines approximately 5−7m long radiating away from four ponds receiving latrine effluent(Figure 1; Figure 2). These are also known as latrine ponds.17
Transects and wells are labeled according to Δx·y·δ, where Δ iseither T or W, referring to the transect or well, respectively, xnumerically references the pond (1−4), y refers to the transectadjacent to pond x (1−3), and δ refers to a well in transect y(a−e for shallow wells, and z for the single deeper well).Transect T1.1 was installed as a line of wells between ponds 1and 3 (Figure 1; Figure 2).A total of 47 wells were developed near the four ponds along
nine transects (Figure 1) using the traditional hand-flappermethod: a manual mud circulation method that quicklypenetrates the loose, wet floodplain deposits throughout theBengal Basin.31 The annulus between the PVC casing (5.1 cmdia.) and the borehole was sealed with cement grout fromground surface to the top of the sand pack, which starts 0.7 mabove the 1.5 m screened interval and extends to the boreholebase. Wells were developed and sampled with a battery-
powered submersible pump. Shallow and deep well depthsvaried from 5.5 to 7.9 m and 8.5 to 10.9 m, respectively. Pondwater levels were monitored with “L-shaped” piezometersconsisting of a vertical steel pipe in the adjacent bankconnected to a horizontal pipe extending into the pond center.Drill cuttings from each hole were visually logged at 1.5 m
intervals. In at least one shallow well per transect, 0.3 m-longundisturbed core samples were collected continuously from 3m below the surface to the bottom of the borehole, usingmanual direct push coring methods with an AMS 424.45 coresampler (AMS, American Falls, Idaho, U.S.). For each 0.3 mcore, silt layers were identified at subcentimeter resolution, andthen excluded from dry sieving for grain-size distribution.Logarithmic interpolation was used to obtain the tenthpercentile (d10), median (d50), and sixtieth percentile (d60)grain diameters32 and the uniformity coefficient (U = d60/d10)was calculated for sand samples from each core.Water levels were measured using an electric water-level tape
(Dipper-T, Heron Instruments Inc., Burlington, Ontario,Canada) and pressure transducers (Levelogger Model 3001,Solinst Canada Ltd., Georgetown, Ontario, Canada). Manualwater-level monitoring of all wells and ponds was performed atminimum once a week from June 11 to July 20, 2008 and once
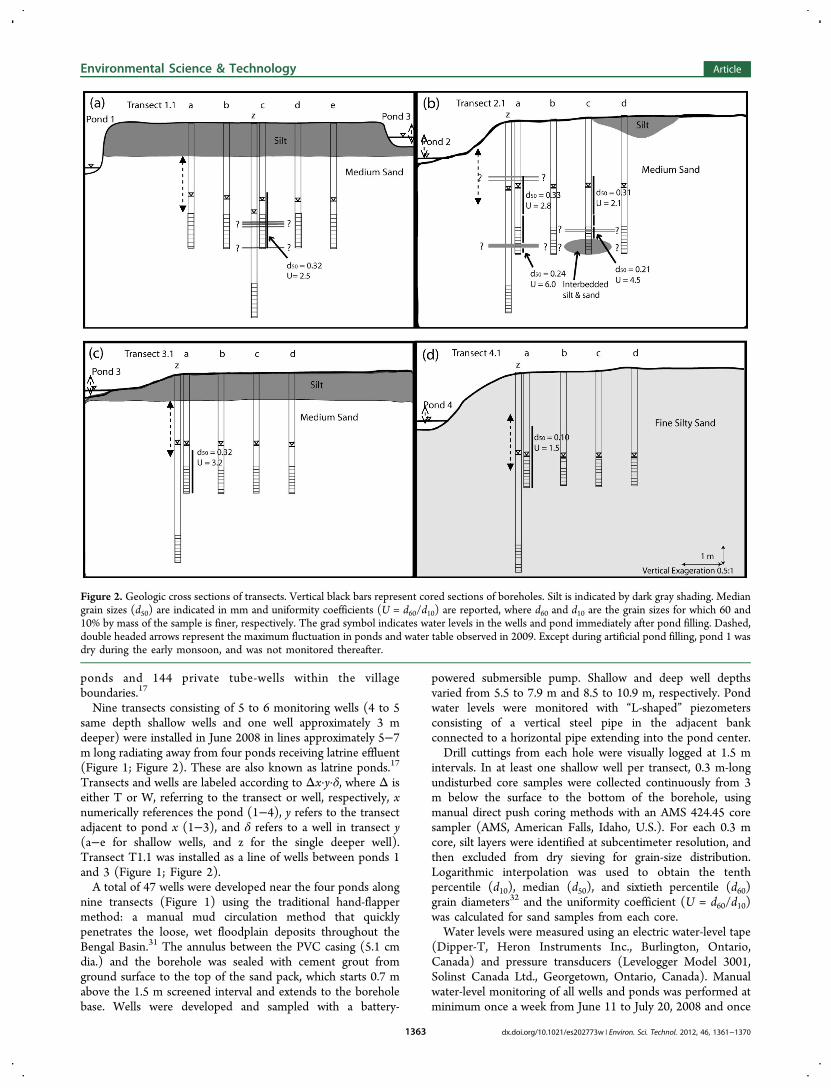
Figure 2. Geologic cross sections of transects. Vertical black bars represent cored sections of boreholes. Silt is indicated by dark gray shading. Mediangrain sizes (d50) are indicated in mm and uniformity coefficients (U = d60/d10) are reported, where d60 and d10 are the grain sizes for which 60 and10% by mass of the sample is finer, respectively. The grad symbol indicates water levels in the wells and pond immediately after pond filling. Dashed,double headed arrows represent the maximum fluctuation in ponds and water table observed in 2009. Except during artificial pond filling, pond 1 wasdry during the early monsoon, and was not monitored thereafter.
Environmental Science & Technology Article
dx.doi.org/10.1021/es202773w | Environ. Sci. Technol. 2012, 46, 1361−13701363
monthly through November, 2009 thereafter. Pneumatic risinghead slug tests were performed in triplicate to measure thehydraulic conductivity of aquifer sediments using a pressuretransducer. Lateral average linear groundwater velocities werecalculated based on hydraulic gradients between the closest andfurthest monitoring well from each pond and the averageconductivity of shallow wells within each transect, assuming aneffective porosity of 0.4. Shallow (8−30 m) groundwatertemperature in Bangladesh is typically 26 °C year-round.33
2.2. E. coli Monitoring. Monthly E. coli monitoring wasperformed on the wells closest and furthest from a pond alongeight transects (excluding T1.1) from September 2008 throughMay 2009. T1.1 was monitored monthly from June throughOctober 2009 only.All tubing and pumps were soaked in cleaning solution
consisting of powdered Chlorox (5 g) and TWEEN-80 (5 mL)(T164−500, Fischer Scientific) in approximately 5 L of wellwater prior to sampling each transect. The cleaning solutionwas cycled through the tubing for 5 min, followed by rinsingwith 10 L of a 5 g of sodium thiosulfate solution (S446−3,Fisher Scientific) for 2 min to consume any remaining dissolvedChlorox. To ensure that only water from the aquifer adjacent toeach monitoring well was sampled, 60 to 100 L were purged at5−10 L per minute from each monitoring well; representingapproximately three wellbore volumes.28
Intensive monitoring was performed approximately once aweek on one transect per pond (T1.1, 2.1, 3.1, 4.1) during theearly 2009 monsoon (June 11 to July 20). During the first weekof intensive monitoring, sampling was performed under naturalgradient flow conditions, before water levels were manipulated(as described below).2.3. Field-Scale Infiltration Experiment. In order to
simulate a major rainfall event, the volumes of ponds 2, 3, and 4were increased by 11−29% by raising the water level by 0.2−0.6
m with groundwater from the slightly deeper (∼10 m) wells intwo of the adjacent transects (SI Table S1). After filling, waterfrom pond 3 was channeled into pond 1, which was initially dry.
2.4. Chemical and Microbial Measurements. Pondwater and groundwater samples were collected in 20 mLscintillation vials. Samples from all four ponds and transectswere analyzed, at minimum, once prior and post artificial pondfilling. After acidification to 1% HCl for at least one week toensure redissolution of any iron oxide precipitate, samples wereanalyzed for Na, Mg, S, Ca, Fe, and As using high-resolutioninductively coupled plasma mass spectrometry (HR ICP-MS).18
Culturable E. coli was measured using the MPN basedColilert test kit (IDEXX Laboratories, Inc.). Duplicate 100 mLgroundwater samples were collected in sterile containers andmeasured in a lab within 8 h of sample collection.Concentrations of E. coli were determined by combining thenumbers of discrete positive wells in each replicate tray.28,34
The minimum detection limit (MDL) of the Colilert test kit fora single analysis is 1 MPN/100 mL. By combining duplicatetrays, however, the detection limit is lowered statistically to 0.5MPN/100 mL.34
For enumeration of fecal indicator bacteria (FIB) genes, 6 (±2) L of groundwater and 0.2 (± 0.1) L of pond water werefiltered onto 0.22 μm nitrocellulose filters. The filters wereremoved from the plastic housing, placed in sterile Petri dishes,frozen and transported on dry ice to the University ofTennessee. DNA was extracted and purified from the filtersusing the FastDNA SPIN for Soil Kit (MP Biomedicals, LLC,Solon, Ohio) following the manufacturer’s protocols.Quantitative PCR was performed to detect E. coli and
Bacteroidales using assays and laboratory methods as describedpreviously.28 The gene targets for the E. coli (herein referred toas mE. coli) and Bacteroidales assays were the 23S rRNA gene
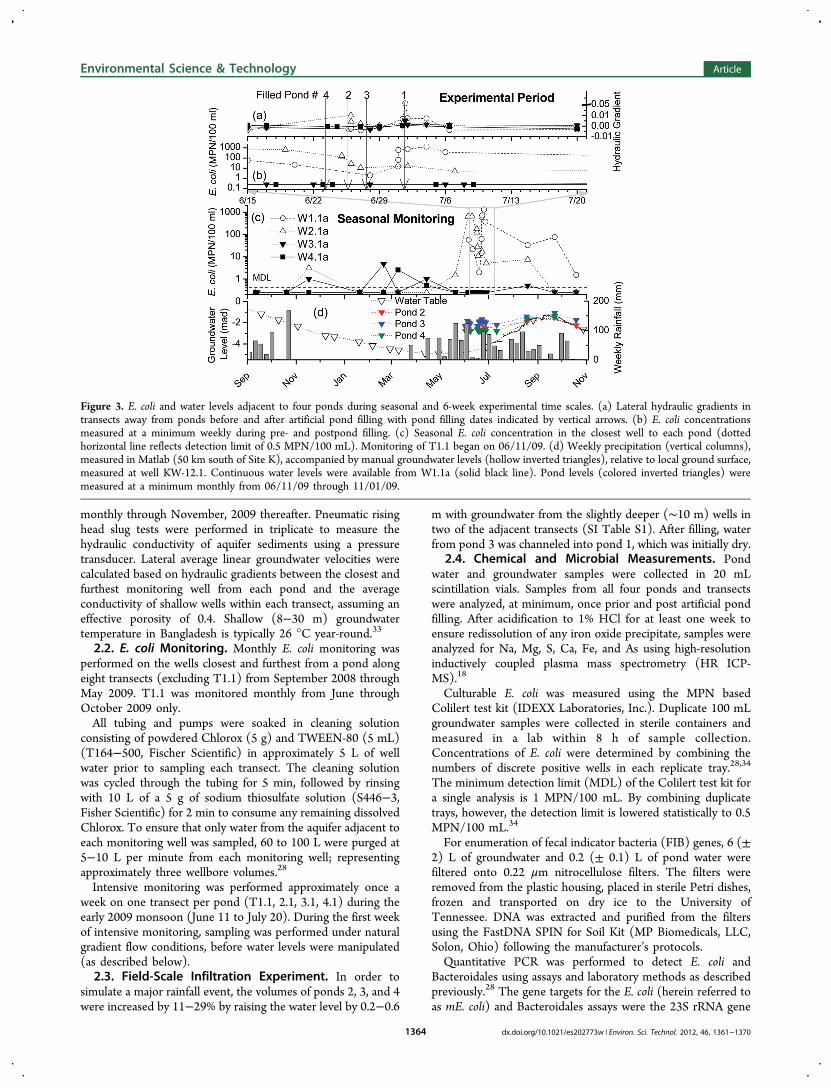
Figure 3. E. coli and water levels adjacent to four ponds during seasonal and 6-week experimental time scales. (a) Lateral hydraulic gradients intransects away from ponds before and after artificial pond filling with pond filling dates indicated by vertical arrows. (b) E. coli concentrationsmeasured at a minimum weekly during pre- and postpond filling. (c) Seasonal E. coli concentration in the closest well to each pond (dottedhorizontal line reflects detection limit of 0.5 MPN/100 mL). Monitoring of T1.1 began on 06/11/09. (d) Weekly precipitation (vertical columns),measured in Matlab (50 km south of Site K), accompanied by manual groundwater levels (hollow inverted triangles), relative to local ground surface,measured at well KW-12.1. Continuous water levels were available from W1.1a (solid black line). Pond levels (colored inverted triangles) weremeasured at a minimum monthly from 06/11/09 through 11/01/09.
Environmental Science & Technology Article
dx.doi.org/10.1021/es202773w | Environ. Sci. Technol. 2012, 46, 1361−13701364

and the 16S rRNA gene, respectively.35−40 Before performingthe PCR assays, DNA samples were diluted to 5−10 ng/μLtotal DNA to avoid PCR inhibition. Sample and assay valueswere calculated as copies/μL of total extracted DNA andconverted to copies/100 mL based on the volume of waterfiltered. The MDL was determined from the standard curve tobe 20 copies per qPCR reaction. Due to differences in theinitial volume of water filtered, the MDL varied betweensamples17 with a geometric mean MDL of 40 copies/100 mLfor the groundwater samples. In all pond water samples, geneconcentrations exceeded the MDL by several orders ofmagnitude.The most complete set of microbiological and chemical
parameters were measured during the intensive monitoringperiod (June/July 2009) along transects T1.1, T2.1, T3.1, andT4 (Figure 1). Results from five other transects are presentedin the Supporting Information to document the range ofhydrogeologic, microbiological, and chemical conditionssurrounding each of the four ponds.
3. RESULTS
3.1. Grain-size of Sediment Around Ponds. Theinstallation of transects of monitoring wells indicated thatmedium aquifer sand extends to the banks of ponds 1 and 2(Figure 2a, b). The bottom of recently excavated pond 1 wasalso sandy, whereas, the bottom of pond 2 was silty. Pond 3 wasexcavated within a ∼2-m silt layer and was not similarlyconnected to the aquifer (Figure 2c). A few thin silt layers wereencountered while installing monitoring wells along T1.1 andT2.1, including one laterally continuous, 20 cm thick silt later inT2.1. With one exception, the measured hydraulic conductiv-ities of the sands around ponds 1, 2, and 3 ranged from 1.1 to4.7 × 10−4 m/s (SI Table S2). The setting of pond 4 washomogeneous fine silty sand (Figure 2d) of lower hydraulicconductivity (0.2−0.9 × 10⁻⁴ m/s).
3.2. Groundwater Levels and Hydraulic GradientsBefore the Intervention. The ground surface elevation variedby no more than 1 m within Char Para (excluding ponds). Allwell and pond elevations were referenced to the ground surfacenear monitoring well KW-12.1 (Figure 1).41 Monthly measure-ments at this location indicated a water table rising within 1.5 m
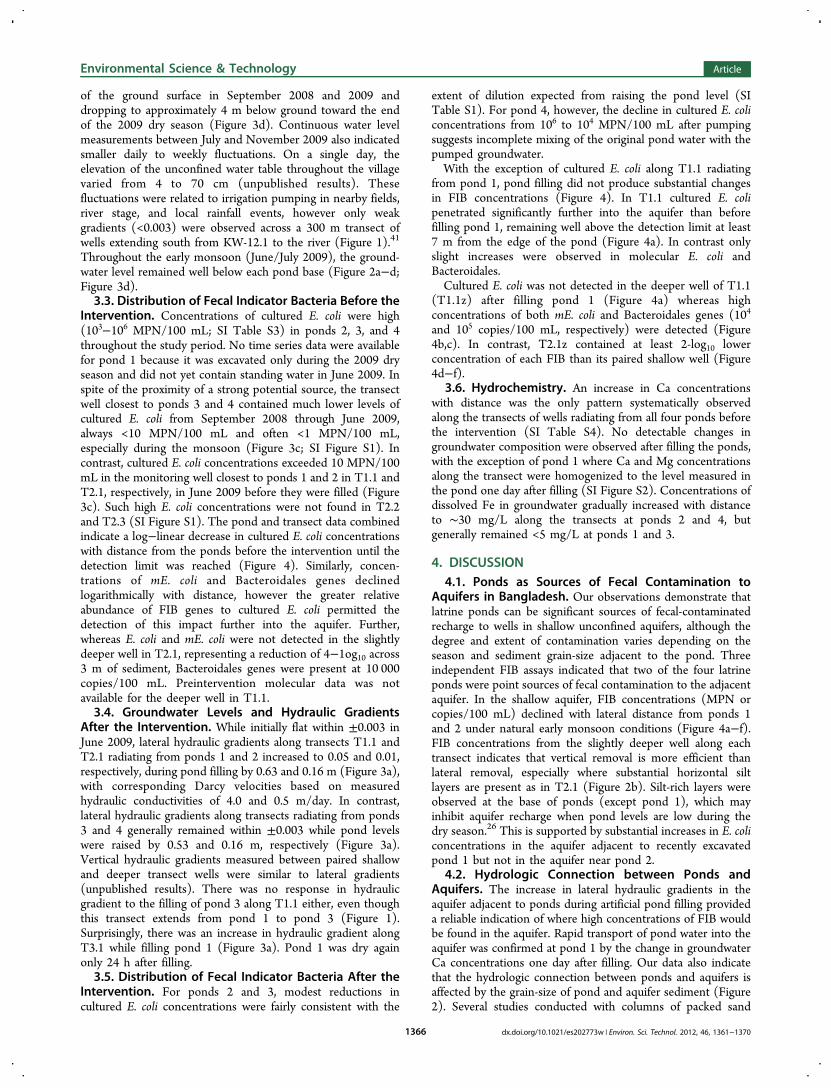
Figure 4. Fecal bacteria concentrations in transects with lateral distance from ponds, measured before and after pond filling. Panels a, b and crepresent concentrations of E. coli, mE. coli, and Bacteroidales respectively, measured in pond 1 and within T1.1. Panels d, e and f represent FIB’smeasured in pond 2 and within T2.1. Panels g, h and I represent FIB’s measured in both ponds 3 and 4 and within T3.1 and T4.1. Filled symbolsrepresent ponds and shallow wells; open symbols represent the deeper well within each transect. Lines represent the model fitted with linearregression using eq 1. λ indicates the spatial removal rate when pond water is used as the initial concentration (Cx=0), whereas λgw (dashed line)indicates the removal rate regressed on the groundwater concentration only (the closest well to the pond becomes Cx=0). Postfilling concentrationsfor T1.1, T2.1, T3.1, and T4.1 are reported for 5, 1, 11, and 3 days, respectively, after filling. The horizontal dotted line represents the MDL for eachassay.
Environmental Science & Technology Article
dx.doi.org/10.1021/es202773w | Environ. Sci. Technol. 2012, 46, 1361−13701365
of the ground surface in September 2008 and 2009 anddropping to approximately 4 m below ground toward the endof the 2009 dry season (Figure 3d). Continuous water levelmeasurements between July and November 2009 also indicatedsmaller daily to weekly fluctuations. On a single day, theelevation of the unconfined water table throughout the villagevaried from 4 to 70 cm (unpublished results). Thesefluctuations were related to irrigation pumping in nearby fields,river stage, and local rainfall events, however only weakgradients (<0.003) were observed across a 300 m transect ofwells extending south from KW-12.1 to the river (Figure 1).41
Throughout the early monsoon (June/July 2009), the ground-water level remained well below each pond base (Figure 2a−d;Figure 3d).3.3. Distribution of Fecal Indicator Bacteria Before the
Intervention. Concentrations of cultured E. coli were high(103−106 MPN/100 mL; SI Table S3) in ponds 2, 3, and 4throughout the study period. No time series data were availablefor pond 1 because it was excavated only during the 2009 dryseason and did not yet contain standing water in June 2009. Inspite of the proximity of a strong potential source, the transectwell closest to ponds 3 and 4 contained much lower levels ofcultured E. coli from September 2008 through June 2009,always <10 MPN/100 mL and often <1 MPN/100 mL,especially during the monsoon (Figure 3c; SI Figure S1). Incontrast, cultured E. coli concentrations exceeded 10 MPN/100mL in the monitoring well closest to ponds 1 and 2 in T1.1 andT2.1, respectively, in June 2009 before they were filled (Figure3c). Such high E. coli concentrations were not found in T2.2and T2.3 (SI Figure S1). The pond and transect data combinedindicate a log−linear decrease in cultured E. coli concentrationswith distance from the ponds before the intervention until thedetection limit was reached (Figure 4). Similarly, concen-trations of mE. coli and Bacteroidales genes declinedlogarithmically with distance, however the greater relativeabundance of FIB genes to cultured E. coli permitted thedetection of this impact further into the aquifer. Further,whereas E. coli and mE. coli were not detected in the slightlydeeper well in T2.1, representing a reduction of 4−1og10 across3 m of sediment, Bacteroidales genes were present at 10 000copies/100 mL. Preintervention molecular data was notavailable for the deeper well in T1.1.3.4. Groundwater Levels and Hydraulic Gradients
After the Intervention. While initially flat within ±0.003 inJune 2009, lateral hydraulic gradients along transects T1.1 andT2.1 radiating from ponds 1 and 2 increased to 0.05 and 0.01,respectively, during pond filling by 0.63 and 0.16 m (Figure 3a),with corresponding Darcy velocities based on measuredhydraulic conductivities of 4.0 and 0.5 m/day. In contrast,lateral hydraulic gradients along transects radiating from ponds3 and 4 generally remained within ±0.003 while pond levelswere raised by 0.53 and 0.16 m, respectively (Figure 3a).Vertical hydraulic gradients measured between paired shallowand deeper transect wells were similar to lateral gradients(unpublished results). There was no response in hydraulicgradient to the filling of pond 3 along T1.1 either, even thoughthis transect extends from pond 1 to pond 3 (Figure 1).Surprisingly, there was an increase in hydraulic gradient alongT3.1 while filling pond 1 (Figure 3a). Pond 1 was dry againonly 24 h after filling.3.5. Distribution of Fecal Indicator Bacteria After the
Intervention. For ponds 2 and 3, modest reductions incultured E. coli concentrations were fairly consistent with the
extent of dilution expected from raising the pond level (SITable S1). For pond 4, however, the decline in cultured E. coliconcentrations from 106 to 104 MPN/100 mL after pumpingsuggests incomplete mixing of the original pond water with thepumped groundwater.With the exception of cultured E. coli along T1.1 radiating
from pond 1, pond filling did not produce substantial changesin FIB concentrations (Figure 4). In T1.1 cultured E. colipenetrated significantly further into the aquifer than beforefilling pond 1, remaining well above the detection limit at least7 m from the edge of the pond (Figure 4a). In contrast onlyslight increases were observed in molecular E. coli andBacteroidales.Cultured E. coli was not detected in the deeper well of T1.1
(T1.1z) after filling pond 1 (Figure 4a) whereas highconcentrations of both mE. coli and Bacteroidales genes (104
and 105 copies/100 mL, respectively) were detected (Figure4b,c). In contrast, T2.1z contained at least 2-log10 lowerconcentration of each FIB than its paired shallow well (Figure4d−f).
3.6. Hydrochemistry. An increase in Ca concentrationswith distance was the only pattern systematically observedalong the transects of wells radiating from all four ponds beforethe intervention (SI Table S4). No detectable changes ingroundwater composition were observed after filling the ponds,with the exception of pond 1 where Ca and Mg concentrationsalong the transect were homogenized to the level measured inthe pond one day after filling (SI Figure S2). Concentrations ofdissolved Fe in groundwater gradually increased with distanceto ∼30 mg/L along the transects at ponds 2 and 4, butgenerally remained <5 mg/L at ponds 1 and 3.
4. DISCUSSION4.1. Ponds as Sources of Fecal Contamination to
Aquifers in Bangladesh. Our observations demonstrate thatlatrine ponds can be significant sources of fecal-contaminatedrecharge to wells in shallow unconfined aquifers, although thedegree and extent of contamination varies depending on theseason and sediment grain-size adjacent to the pond. Threeindependent FIB assays indicated that two of the four latrineponds were point sources of fecal contamination to the adjacentaquifer. In the shallow aquifer, FIB concentrations (MPN orcopies/100 mL) declined with lateral distance from ponds 1and 2 under natural early monsoon conditions (Figure 4a−f).FIB concentrations from the slightly deeper well along eachtransect indicates that vertical removal is more efficient thanlateral removal, especially where substantial horizontal siltlayers are present as in T2.1 (Figure 2b). Silt-rich layers wereobserved at the base of ponds (except pond 1), which mayinhibit aquifer recharge when pond levels are low during thedry season.26 This is supported by substantial increases in E. coliconcentrations in the aquifer adjacent to recently excavatedpond 1 but not in the aquifer near pond 2.
4.2. Hydrologic Connection between Ponds andAquifers. The increase in lateral hydraulic gradients in theaquifer adjacent to ponds during artificial pond filling provideda reliable indication of where high concentrations of FIB wouldbe found in the aquifer. Rapid transport of pond water into theaquifer was confirmed at pond 1 by the change in groundwaterCa concentrations one day after filling. Our data also indicatethat the hydrologic connection between ponds and aquifers isaffected by the grain-size of pond and aquifer sediment (Figure2). Several studies conducted with columns of packed sand
Environmental Science & Technology Article
dx.doi.org/10.1021/es202773w | Environ. Sci. Technol. 2012, 46, 1361−13701366
reported evidence for a critical threshold in the colloid (likebacteria) size to median grain-size ratio where removal rategreatly increased due to small changes in the median graindiameter of the sand.4,7,42,43 The sensitivity of FIB transport tosediment grain-size in the present study demonstrates thisphenomenon at the field scale.4.3. Fitted Spatial Removal Rates. Removal of bacteria
through porous media may be described by a simplelogarithmic spatial reduction equation first proposed byIwasaki:44
= =−λC x C( ) 10x
x0 (1)
where C(x) is the bacteria concentration at x distance from theinput source, Cx=0 is the input concentration at the source, andλ is the removal rate. Equation 1 was fit to log10-standardizedconcentrations (C(x)/Cx=0) of each fecal bacteria indicator ingroundwater using linear regression to obtain λ with 95% CI’s.The interpretation of λ in the present study has somelimitations because eq 1 is one-dimensional and thereforeignores dilution effects due to three-dimensional spreading ofthe FIB plume in the sediments near a pond. This removalmodel also implicitly assumes the population of a given FIB ishomogeneous with respect to λ6. Measuring λ along a log−linear slope along the length of a flow path assumes steady-stateand first-order attachment, a prediction of colloid filtrationtheory (CFT),45 and die-off kinetics.11 Processes such asstraining,5 clogging14,15 and variable saturation along the lengthof the flow path,46 however, lead to hyper-exponentialconcentration-distance curves.11
Spatial removal rates for T1.1 and T2.1 (Figure 4) were fittedin two different ways to eq 1. The first calculates λ along thepathway between the pond base to aquifer, using the pond asthe initial concentration (Cx=0), with correlation coefficients(R2) ranging from 0.95 to 0.99. The second approach fits λgwalong the aquifer flow path only, where Cx=0 is theconcentration in the well closest to the pond, and results inR2 values ranging from 0.68 to 0.96. The fit of λ to FIBconcentrations indicates a consistent log−linear decline withdistance through the aquifer, agreeing with CFT45 and first-order die-off kinetics.The fitted λ values were used to calculate expected 7-log10
(99.99999%) removal distances. This is the predicted distancewhere E. coli from a latrine pond (∼106 MPN/100 mL) will beremoved to below the acceptable drinking water limit of 1
MPN/100 mL used in many countries.47 Under natural earlymonsoon conditions, removal distances decrease in the orderBacteroidales > mE. coli > E. coli (Figure 4a−f; Table 1),suggesting that Bacteroidales travels further than mE. coli and E.coli. After the simulated rainfall event, 7-log10 removal distancestended to equalize, with the exception that cultured E. coli inT2.1 was still removed across a shorter distance than mE. coliand Bacteroidales (Figure 4d−f). The initial order may reflectdifferent persistence times of the FIB in the aquifer, whereasthe disappearance of this order shortly after a recent influx ofcontaminated pond water suggests similar removal rates.In each case, the postfilling λgw fitted to FIB concentrations
along the saturated flow pathway tends to be lower thanmeasured from the pond through the aquifer (λ) (Figure 4a−f),probably because bacteria must pass vertically through apartially saturated zone from each pond to the water table, lying1−3 m below the pond base at the beginning of the monsoon(Figure 2).46 In T2.1 7-log10 removal distances, based on λgw,follow the same order before pond filling (Bacteroidales > mE.coli > E. coli). At T1.1, however, E. coli is predicted to travelfurther than mE. coli and Bacteroidales in the saturated aquifer.Following artificial pond filling, the 7-log10 removal distancebased on λ ranged from 7 to 12 m, with cultured E. coli tendingto be removed across a shorter distance (range 6.7−10.1 m)than mE. coli and Bacteroidales (9.5−12.4 m) (Table 1).The longer transport distances of molecular markers relative
to cultured E. coli may reflect longer persistence times in theaquifer. In their review Foppen and Schijven48 reported averagedie-off rate constants of cultured E. coli in groundwater at 20 °Ccorresponding to T90 (time required for initial concentrationreduction of 90% or 1 log10) of 4.6 days (range 2.6−23). Incontrast, fresh water (aerobic) microcosms at 25 °C showed aT90 of 2.8 days for the Bacteroidales marker.49 Another studycomparing die-off rates of E. coli and Bacteroidales found T90’sof 7.9 days and 1.6, respectively (sewage-seeded, fresh water,dark microcosms at 13 °C).50 Therefore, under aerobicconditions Bacteroidales genes seem to die-off faster thancultured E. coli, implying that the greater penetration distanceof Bacteroidales is due to less efficient filtration45 or straining.5
Thus Bacteroidales may be a useful relatively conservativeindicator to determine safe setback distances for drinking wells.The spatial removal rates (λ) measured in the present study
(0.5−1.3 log10/m) are higher than in two previous transportexperiments (0.2−0.6 log10/m) conducted in medium sand
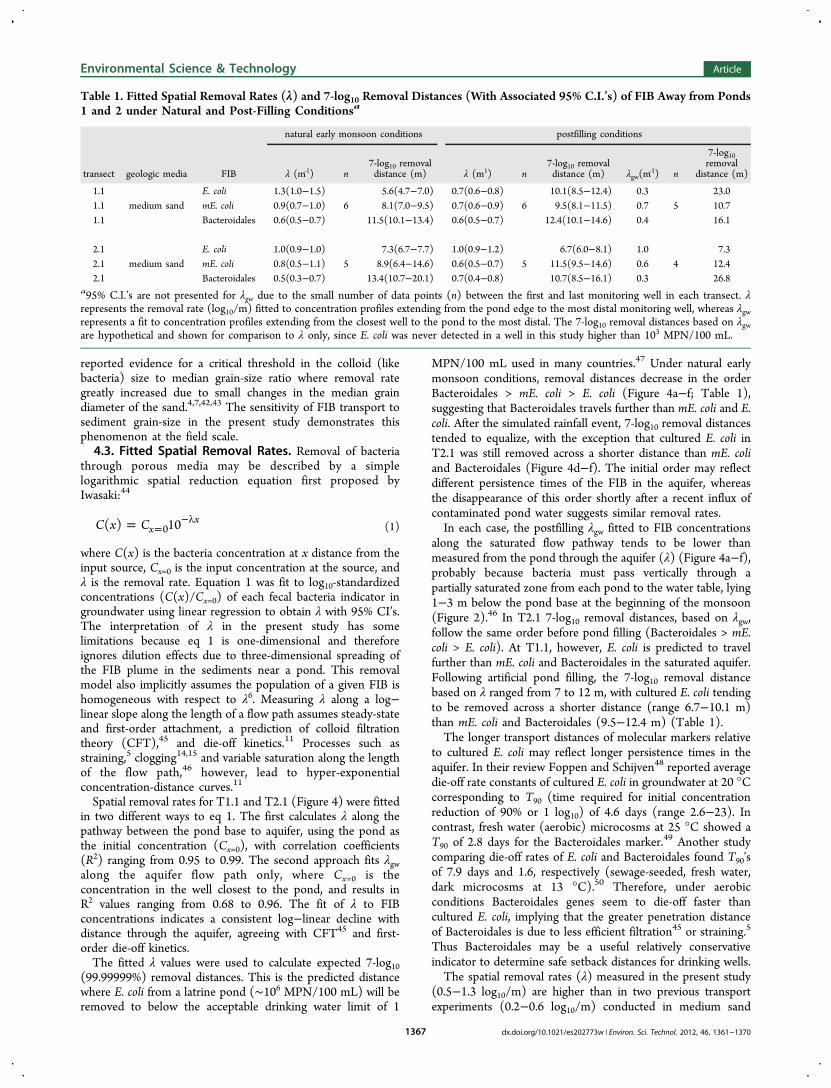
Table 1. Fitted Spatial Removal Rates (λ) and 7-log10 Removal Distances (With Associated 95% C.I.’s) of FIB Away from Ponds1 and 2 under Natural and Post-Filling Conditionsa
natural early monsoon conditions postfilling conditions
transect geologic media FIB λ (m‑1) n7-log10 removaldistance (m) λ (m1) n
7-log10 removaldistance (m) λgw(m
‑1) n
7-log10removal
distance (m)
1.1 E. coli 1.3(1.0−1.5) 5.6(4.7−7.0) 0.7(0.6−0.8) 10.1(8.5−12.4) 0.3 23.01.1 medium sand mE. coli 0.9(0.7−1.0) 6 8.1(7.0−9.5) 0.7(0.6−0.9) 6 9.5(8.1−11.5) 0.7 5 10.71.1 Bacteroidales 0.6(0.5−0.7) 11.5(10.1−13.4) 0.6(0.5−0.7) 12.4(10.1−14.6) 0.4 16.1
2.1 E. coli 1.0(0.9−1.0) 7.3(6.7−7.7) 1.0(0.9−1.2) 6.7(6.0−8.1) 1.0 7.32.1 medium sand mE. coli 0.8(0.5−1.1) 5 8.9(6.4−14.6) 0.6(0.5−0.7) 5 11.5(9.5−14.6) 0.6 4 12.42.1 Bacteroidales 0.5(0.3−0.7) 13.4(10.7−20.1) 0.7(0.4−0.8) 10.7(8.5−16.1) 0.3 26.8
a95% C.I.’s are not presented for λgw due to the small number of data points (n) between the first and last monitoring well in each transect. λrepresents the removal rate (log10/m) fitted to concentration profiles extending from the pond edge to the most distal monitoring well, whereas λgwrepresents a fit to concentration profiles extending from the closest well to the pond to the most distal. The 7-log10 removal distances based on λgware hypothetical and shown for comparison to λ only, since E. coli was never detected in a well in this study higher than 103 MPN/100 mL.
Environmental Science & Technology Article
dx.doi.org/10.1021/es202773w | Environ. Sci. Technol. 2012, 46, 1361−13701367

with constant Darcy velocities ranging from 0.5 to 1.7 m/day.12,14 This may result from contaminated water entering theaquifer in pulses rather than under constant flow conditions.Peak Darcy velocities of 4.0 and 0.5 m/day after pond filling inT1.1 and T2.1 respectively, were short-lived (<24 h) (Figure3), with typical velocities <0.2 m/day. If the average reporteddie-off constant for E. coli in groundwater is used48 with peakvelocities (Figure 4), then the calculated λ parameters resultingfrom die-off alone are 0.05 and 0.4 for T1.1 and T2.1,respectively. This indicates that diminished advection afterpond levels readjusted coupled with die-off contributedsubstantially to λ.4.4. Implications for Microbial Drinking Water
Quality. Only the transect radiating from the freshly excavatedpond showed a rapid response to an artificial increase in pondlevel, suggesting that older ponds, which typically haveaccumulated a lining of finer grained sediments, provide agreater measure of protection against rapid microbialcontamination of shallow groundwater. However, preinterven-tion FIB gradients along transects from both sandy pondsshowed that chronic contamination through pond walls may bewidespread. Surface runoff during the early monsoon mayovertop silt layers at the pond base, at which time microbialcontaminants enter the local shallow aquifer of even moreestablished ponds. Infiltration of fecal contamination into theaquifer is most likely during the early monsoon because thehead gradient is favorable. Later in August, this head gradientdisappears as ground and pond water tables equalize (Figure3d).Previous monitoring has shown that as many as 70% of tube-
wells in any given monsoonal month contain E. coli in ruralareas underlain by unconfined sand aquifers, including CharPara.18,23 Rather than indicating continuous input, our datasuggest that this pattern may reflect multiple inputs during theearly monsoon followed by a combination of filtration,straining, transport, and die-off. The lower removal ratesmeasured in saturated sediment suggests potential for lateralspreading of fecal bacteria once sand layers are contaminated.On the basis of Bacteroidales, the FIB that appears to betransported furthest, installing tube-wells at least 13 m awayfrom ponds might decrease the risk of exposure to fecalcontamination from the aquifer. This should be interpretedwith caution because bacterial removal rates were measured atonly four sites and tended to be lower in the saturated aquifer.It is likely that coarser sediment exists elsewhere in Char Paraand in other villages where this distance may not be sufficientto remove fecal bacteria. It is also likely that removal rates willvary substantially for fecal viruses, which typically differ fromfecal bacteria in terms of transport behavior and occurrence inaquifers.51
■ ASSOCIATED CONTENT
*S Supporting InformationThis information is available free of charge via the Internet athttp://pubs.acs.org/.
■ AUTHOR INFORMATION
Corresponding Author*Phone: 917-797-8371; fax: 845-365-8154; e-mail: [email protected].
■ ACKNOWLEDGMENTS
This study was supported by Grant 5 R01 TW008066 from theNIH/FIC Ecology of Infectious Disease program. Additionalfunding was provided by the Center for EnvironmentalBiotechnology and the Institute for a Secure and SustainableEnvironment at the University of Tennessee. The comments oftwo anonymous reviewers greatly improved the final product.Thank you to K. Radloff for providing long term groundwaterlevels; to P. Robertson and P. Brooks for assistance with grain-size analyses.
■ REFERENCES(1) Rudolph, D. L.; Barry, D. A. J.; Goss, M. J. Contamination inOntario farmstead domestic wells and its association with agriculture:2. Results from multilevel monitoring well installations. J. Contam.Hydrol. 1998, 32 (3−4), 295−311.(2) Schijven, J. F.; Medema, G.; Vogelaar, A J.; Hassanizadeh, S. M.Removal of microorganisms by deep well injection. J. Contam. Hydrol.2000, 44 (3−4), 301−327.(3) Embrey, S. S.; Runkle, D. L. Microbial Quality of the Nation’sGround-Water Resources. United States Geological Survey, NationalWater-Quality Assessment Program Principal Aquifers. 1993−2004,Scientific Investigations Report 2006−5290, U.S. Department of theInterior, 2006.(4) Zhuang, J.; Jin, Y.; Flury, M. Comparison of hanford colloids andkaolinite transport in porous media. Vadose Zone J. 2004, 3 (2), 395−402.(5) Bradford, S. A.; Simunek, J.; Bettahar, M.; van Genuchten, M.Th.; Yates, S. R. Modeling colloid attachment, straining, and exclusionin saturated porous media. Environ. Sci. Technol. 2003, 37 (10), 2242−2250.(6) Foppen, J. W.; van Herwerden, M.; Schijven, J. Transport ofEscherichia coli in saturated porous media: Dual mode deposition andintra-population heterogeneity. Water Res. 2007, 41 (8), 1743−1753.(7) Knappett, P. S. K.; Emelko, M. B.; Zhuang, J.; McKay, L. D.Transport and retention of a bacteriophage and microspheres insaturated, angular porous media: Effects of ionic strength and grainsize. Water Res. 2008, 42 (16), 4368−4378.(8) Foppen, J. W.; van Herwerden, M.; Kebtie, M.; Noman, A.;Schijven, J. F.; Stuyfzand, P. J.; Uhlenbrook, S. Transport of Escherichiacoli and solutes during waste water infiltration in an urban alluvialaquifer. J. Contam. Hydrol. 2008, 95 (1−2), 1−16.(9) Harvey, R. W.; George, L. H.; Smith, R. L.; LeBlanc, D. R.Transport of microspheres and indigenous bacteria through a sandyaquifer: Results of natural and forced-gradient tracer experiments.Environ. Sci. Technol. 1989, 23 (1), 51−56.(10) Taylor, R.; Cronin, A.; Pedley, S.; Barker, J.; Atkinson, T. Theimplications of groundwater velocity variations on microbial transportand wellhead protectionReview of field evidence. FEMS Microbiol.Ecol. 2004, 49 (1), 17−26.(11) Pang, L. Microbial removal rates in subsurface media estimatedfrom published studies of field experiments and large intact soil cores.J. Environ. Qual. 2009, 38 (4), 1531−1559.(12) Mailloux, B. J.; Fuller, M. E.; Onstott, T. C.; Hall, J.; Dong, H.L.; DeFlaun, M. F.; Streger, S. H.; Rothmel, R. K.; Green, M.; Swift, D.J. P.; Radke, J. The role of physical, chemical, and microbialheterogeneity on the field-scale transport and attachment of bacteria.Water Resour. Res. 2003, 39 (6), 1142.(13) Van der Wielen, P. W. J. J.; Senden, W. J. M. K.; Medema, G.Removal of bacteriophages MS2 and φX174 during transport in asandy anoxic aquifer. Environ. Sci. Technol. 2008, 42 (12), 4589−4594.(14) Schijven, J. F.; Hoogenboezem, W.; Hassanizadeh, S. M.; Peters,J. H. Modeling removal of bacteriophages MS2 and PRD1 by dunerecharge at Castricum, Netherlands. Water Resour. Res. 1999, 35 (4),1101−1111.
Environmental Science & Technology Article
dx.doi.org/10.1021/es202773w | Environ. Sci. Technol. 2012, 46, 1361−13701368

(15) Carre, J.; Dufils, J. Wastewater treatment by infiltration basins:Usefulness and limitssewage plant in Creanes (France). Water Sci.Tech. 1991, 24 (9), 287−293.(16) Weiss, W. J.; Bouwer, E. J.; Aboytes, R.; LeChevallier, M. W.;O’Melia, C. R.; Le, B. T.; Schwab, K. J. Riverbank filtration for controlof microrganisms: Results from field monitoring. Water Res. 2005, 39(10), 1990−2001.(17) Knappett, P. S. K.; Escamilla, V.; Layton, A.; McKay, L. D.;Emch, M.; Williams, D. E.; Huq, Md. R.; Alam, Md. J.; Farhana, L.;Mailloux, B. J.; Ferguson, A.; Sayler, G. S.; Ahmed, K. M.; van Geen, A.Impact of population and latrines on fecal contamination of ponds inrural Bangladesh. Sci. Total Environ. 2011, 409 (17), 3174−3182.(18) van Geen, A.; Ahmed, K. M.; Akita, Y.; Alam, M. J.; Culligan, P.J.; Emch, M.; Escamilla, V.; Feighery, J.; Ferguson, A. S.; Knappett, P.;Layton, A. C.; Mailloux, B. J.; McKay, L. D.; Mey, J. L.; Serre, M. L.;Streatfield, P. K.; Wu, J.; Yunus, M. Fecal contamination of shallowtubewells in Bangladesh inversely related to arsenic. Environ. Sci.Technol. 2011, 45 (4), 1199−1205.(19) Emch, M. Diarrheal disease risk in Matlab, Bangladesh. Soc. Sci.Med. 1999, 49 (4), 519−530.(20) Escamilla, V.; Wagner, B.; Yunus, M.; Streatfield, P. K.; vanGeen, A. Effect of deep tube well use on childhood diarrhea inBangladesh. B. World Health Organ. 2011, 89 (7), 521−527.(21) Streatfield, K., Persson, L. A., Chowdhury, H. R. Saha, K.K..2001. Disease Patterns in Bangladesh: Present and Future Needs, Dhaka,Bangladesh: International Centre for Diarrhoeal Disease Research:Bangladesh.(22) Islam, M. S.; Brooks, A.; Kabir, M. S.; Jahid, I. K.; Islam, M. S.;Goswami, D.; Nair, G. B.; Larson, C.; Yukiko, W.; Luby, S. Faecalcontamination of drinking water sources of Dhaka city during the 2004flood in Bangladesh and use of disinfectants for water treatment. Appl.Environ. Microbiol. 2007, 103 (1), 80−87.(23) Leber, J.; Rahman, M. M.; Ahmed, K. M.; Mailloux, B.; vanGeen, A. Contrasting influence of geology on E. coli and arsenic inaquifers of Bangladesh. Ground Water 2011, 49 (1), 111−124.(24) Wu, J.; van Geen, A.; Ahmed, K. M.; Akita, Y.; Alam, M. J.;Culligan, P. J.; Escamilla, V.; Feighery, J.; Ferguson, A. S.; Knappett, P.;Mailloux, B. J.; McKay, L. D.; Serre, M. L.; Streatfield, P. K.; Yunus,M.; Emch, M. Increase in diarrheal disease associated with arsenicmitigation in Bangladesh. PLoS One 2011, 6 (12), e29593.(25) Ferguson, A. S.; Mailloux, B. J.; Ahmed, K. M.; van Geen, A.;McKay, L. D.; Culligan, P. J. Hand-pumps as reservoirs for microbialcontamination of well water. J. Water Health 2011, 9 (4), 708−717.(26) Sengupta, S.; McArthur, J. M.; Sarkar, A.; Leng, M. J.;Ravenscroft, P.; Howarth, R. J.; Banerjee, D. M. Do ponds causeArsenic-Pollution of groundwater in the Bengal Basin? An answer fromWest Bengal. Environ. Sci. Technol. 2008, 42 (14), 5156−5164.(27) Neumann, R. B.; Ashfaque, K. N.; Badruzzaman, A. B. M.; Ali,M. A.; Shoemaker, J. K.; Harvey, C. F. Anthropogenic influences ongroundwater arsenic concentrations in Bangladesh. Nat. Geosci. 2010,3 (1), 46−52.(28) Knappett, P. S. K.; Layton, A.; McKay, L. D.; Williams, D.;Mailloux, B. J.; Huq, Md. R.; Alam, Md. J.; Ahmed, K. M.; Akita, Y.;Serre, M. L.; Sayler, G. S.; van Geen, A. Efficacy of hollow-fiberultrafiltration for microbial sampling in groundwater. Ground Water2011, 49 (1), 53−65.(29) Matsuki, T.; Watanabe, K.; Fujimoto, J.; Miyamtoto, Y.; Takada,T.; Matsumoto, K.; Oyaizu, H.; Tanaka, R. Development of 16SrRNA-gene-targeted group-specific primers for the detection andidentification of predominant bacteria in human feces. Appl. Environ.Microbiol. 2002, 68 (11), 5445−5451.(30) Radloff, K. A.; Cheng, Z; Rahman, M. W.; Ahmed, K. M.;Mailloux, B. J.; Juhl, A. R.; Schlosser, P.; van Geen, A. Mobilization ofarsenic during one-year incubations of grey aquifer sands fromAraihazar, Bangladesh. Environ. Sci. Technol. 2007, 41 (10), 3639−3645.(31) Horneman, A.; van Geen, A.; Kent, D. V.; Mathe, P. E.; Zheng,Y.; Dhar, R. K.; O’Connell, S.; Hoque, M. A.; Aziz, Z.; Shamsudduha,M.; Seddique, A. A.; Ahmed, K. M. Decoupling of As and Fe release to
Bangladesh groundwater under reducing conditions. Part I: Evidencefrom sediment profiles. Geochim. Cosmochim. Ac 2004, 68 (17), 3459−3473.(32) Bardet, J. Experimental Soil Mechanics, Prentice-Hall, Inc.: UpperSaddle River, New Jersey, USA, 1997.(33) Klump, S.; Kipfer, R.; Cirpka, O. A.; Harvey, C. F.; Brennwald,M. S.; Ashfaque, K. N.; Badruzzaman, A. B. M.; Hug, S. J.; Imoden, D.M. Groundwater Dynamics and Arsenic Mobilization in BangladeshAssessed Using Noble Gases and Tritium. Environ. Sci. Technol. 2006,40 (1), 243−250.(34) Hurley, M. A.; Roscoe, M. E. Automated statistical-analysis ofmicrobial enumeration by dilution series. J. App. Bacteriol. 1983, 55,159−64.(35) Bernhard, A. E.; Field, K. G. Identification of nonpoint sourcesof fecal pollution in coastal waters by using host-specific 16S ribosomalDNA genetic markers from fecal anaerobes. Appl. Environ. Microbiol.2000, 66 (4), 1587−1594.(36) Scott, T. M.; Rose, J. B.; Jenkins, T. M.; Farrah, S. R.; Lukasik, J.Microbial source tracking: Current methodology and future directions.Appl. Environ. Microbiol. 2002, 68 (2), 5796−5803.(37) Layton, A.; McKay, L. D.; Williams, D.; Garrett, V.; Gentry, R.;Sayler, G. Development of Bacteroides 16S rRNA gene TaqMan-basedreal-time PCR assays for estimation of total, human, and bovine fecalpollution in water. Appl. Environ. Microbiol. 2006, 72 (6), 4214−4224.(38) Noble, R. T.; Griffith, J. F.; Blackwood, A. D.; Fuhrman, J. A.;Gregory, J. B.; Hernandez, X.; Liang, X.; Bera, A. A.; Schiff, K.Multitiered approach using quantitative PCR to track sources of fecalpollution affecting Santa Monica Bay, California. Appl. Environ.Microbiol. 2006, 72 (2), 1604−1612.(39) Kildare, B. J.; Leutenegger, C. M.; McSwain, B. S.; Bambic, D.G.; Rajal, V. B.; Wuertz, S. 16S rRNA-based assays for quantitativedetection of universal, human-, cow- and dog-specific fecalBacteroidales: A Bayesian approach. Water Res. 2007, 41 (16),3701−3715.(40) DuPont, H. L.; Chapell, C. L.; Sterling, C. R.; Okhuysen, P. C.;Rose, J. B.; Jakubowski, W. Infectivity of Cryptosporidium parvum inhealthy volunteers. New Engl. J. Med. 1995, 332 (13), 855−859.(41) Radloff, K. A. Geochemical and hydrologic determinants ofarsenic distribution in sedimentary aquifers in Bangladesh. Ph.D.Dissertation; Columbia University: New York, NY, 2010.(42) Tufenkji, N.; Miller, G. F.; Ryan, J. N.; Harvey, R. W.;Elimelech, M. Transport of Cryptosporidium oocysts in porous media:Role of straining and physicochemical filtration. Environ. Sci. Technol.2004, 38 (22), 5932−5938.(43) Foppen, J. W.; van Herwerden, M.; Schijven, J. Measuring andmodeling straining of Escherichia coli in saturated porous media. J.Contam. Hydrol. 2007, 93 (1−4), 236−254.(44) Iwasaki, T. Some notes on sand filtration. JAWWA 1937, 29,1591−1597.(45) Yao, K.; Habibian, M. T.; OMelia, C. R. Water and waste waterfiltration: Concepts and applications. Environ. Sci. Technol. 1971, 5(11), 1105−1112.(46) DeNovio, N. M.; Saiers, J. E.; Ryan, J. N. Colloid movement inunsaturated porous media: Recent advances and future directions.Vadose Zone J. 2004, 3 (2), 338−351.(47) Edberg, S. C.; Rice, E. W.; Karlin, R. J.; Allen, M. J. Escherichiacoli: The best biological drinking water indicator for public healthprotection. J. Appl. Microbiol. 2000, 88 (S), 106S−116S.(48) Foppen, J. W. A.; Schijven, J. F. Evaluation of data from theliterature on the transport and survival of Escherichia coli andthermotolerant coliforms in aquifers under saturated conditions. WaterRes. 2006, 40 (3), 401−426.(49) Bell, A.; Layton, A. C.; McKay, L. D.; Williams, D.; Gentry, R.;Sayler, G. S. Factors influencing the persistence of fecal Bacteroides instream water. J. Environ. Qual. 2009, 38 (3), 1224−1232.(50) Walters, S. P.; Field, K. G. Survival and persistence of humanand ruminant-specific faecal Bacteroidales in freshwater microcosms.Environ. Microbiol. 2009, 11 (6), 1410−1421.
Environmental Science & Technology Article
dx.doi.org/10.1021/es202773w | Environ. Sci. Technol. 2012, 46, 1361−13701369
(51) Abbaszadegan, M.; LeChevallier, M.; Gerba, C. P. Occurrence ofviruses in U.S. groundwaters. J. Am. Water Works Assoc. 2003, 95 (9),107−120.
Environmental Science & Technology Article
dx.doi.org/10.1021/es202773w | Environ. Sci. Technol. 2012, 46, 1361−13701370