Embed Size (px)
Citation preview
SOUTHERN JOURNAL OF AGRICULTURAL ECONOMICS DECEMBER, 1985
IMPORTANCE, CAUSES, AND MANAGEMENT RESPONSES TOFARM RISKS: EVIDENCE FROM FLORIDA AND ALABAMA
William G. Boggess, Kwabena A. Anaman, and Gregory D. Hanson
Abstract Corn Belt production to the North; wheat,
Despite the contention that risk and un- cotton, and cattle operations to the West; andcertainty play an important role in agricul- the high-valued citrus and vegetable pro-ture in North Florida and South Alabama, very duction to the South. This area is part of anlittle is known about producers' perceptions agricultural region that has been particularlyof risk. This paper describes the procedures characterized by grave financial difficultiesused and the results obtained from a statis- in the 1980's (Farm Credit Administration).tically random survey of farmers' perceptions While it is clear that risk and uncertaintyof the importance of various sources of risk play an important role in agriculture in theand alternative risk management practices. Southeast and in other regions, very little isInitially, farmers were asked to define risk known about producers' perceptions of riskand then to rank various sources of risk and
issues. However, considerable 'risk researchmanagement responses to risk based on the . h errelative importance of each to their opera-m growth modelstion. Summary statistics, Chi-square analyses, now incorporate to varying degrees produc-and logistic regression techniques were used tion, marketing, and financial risks (Hansonto analyze the data. et al.; Richardson and Condra). Further evi-
dence of treatment of risk is found in sim-Key words: risk, uncertainty, management, ulation analyses and specifically in areas such
logistic regression. as irrigation (Boggess et al.; Mapp and Eid-
Farm risks faced by mixed crop and live- man), biophysical/bioeconomic analysesstock farmers in North Florida and South (Boggess and Amerling; Wilkerson et al.),Alabama depend to a large degree on the integrated pest management (Carlson), andresource and climatic conditions of the area. decision analyses in general (Anderson et al.).The growing season is long, but the winters Risk has also become key in financial analysesare too cold for citrus or winter vegetables. (Barry, 1983a; Barry et al.; Eidman). JollyThe summer months are warm and humid provides a useful distinction between twoproviding an excellent environment for in- broad risk management strategies: control-sects, weeds, and diseases. Despite the fact ling risk exposure (e.g. insurance) and con-that the area receives nearly 60 inches of trolling risk impacts (e.g. use of insurance).rain yearly, drought is a frequent problemrain yearly, drought is a frequent problem This level of activity in risk treatment andon the extremely sandy soils because of their m low water holding capacity. Compounding modeling beg the question, r What have wethese biological and climatic problems is the larned about producers' risk attitudes? Theregion's distance from and lack of ready ac- apparent response is that very little can becess to major crop and livestock markets. The said with a high degree of confidence. Onregion can realistically be viewed as part of the positive side, it is safe to posit that riska 'fringe' agricultural area between the major averse behavior exists (Young et al.), edu-
William G. Boggess and Kwabena A. Anaman are Associate Professor and Graduate Assistant, respectively,Department of Food and Resource Economics, University of Florida. Gregory D. Hanson is Section Leader, EconomicIndicators Research and Income Forecasts, Economic Indicators Branch, Economic Research Service, USDA. Hansonwas formerly an Assistant Professor of Agricultural Economics, Auburn University.
Florida Experiment Station Journal Series Paper No. 6581.This study was prepared as part of the Southern Regional Research Project S-180, "An Economic Analysis of Risk
Management Strategies for Agricultural Production Firms."Appreciation is extended to Leonard Cobb, Tim Hewitt, and John Holt for their support and assistance.
105
cation may increase willingness to bear risk Hypotheses to be tested in this study are:
(Eidman), attitudes toward risk change as (1) sample producers perceive variousnew information becomes available and man- sources of risk in a hierarchy of importance,agement objectives evolve (Young et al.), and (2) sample producers' perceptions of themeasurement of risk preferences has been relative importance of alternative sources of
operationalized with the recent development risk depend on socioeconomic characteristicsof the interval approach (King and Robison). of the producer (e.g. experience, education,
However, several problems and disturbing size of farm, etc.), and (3) sample producers'issues exist with respect to treatment of risk. risk management responses depend on so-
With notable exceptions, most risk analyses cioeconomic characteristics of the producer
have utilized secondary data (Musser and Tew; (e.g. experience, education, size of farm,
Young et al.). Risk involved in livestock pro- etc.). The remainder of the paper includes
duction has been much less studied than crop a description of the procedures used to sur-
production (Musser and Tew). New questions vey producers' perceptions of various sources
have arisen regarding the intertemporal sta- of risk and risk management strategies, a sum-
bility of farmer risk preferences (Love and mary of the survey responses, and an analysis
Robison). The important requirements of data, of the results.model, and results validation are oftenneglected to a disturbing extent (McCarl andNelson; Hanson and Eidman). Antle has re- SURVEY PROCEDUREScently suggested that risk averse behavior can One of the primary objectives of the South-be explained without recourse to Pratt ab- Regional Research Project S-80, "Ansolute risk aversion coefficients and expected Economic Analysis of Risk Management Strat-utility theory. Also in this regard, Weiss has e s Agricultural Production Firms," isrecently provided examples establishing that eo es f armers' perceptions of risk. In re-to assess farmers' perceptions of risk. In re-risk aversion cannot be universally equated objective, several project par-to concavity of a utility function (p, II), sponse to this objective, several project par-
to concvity ofa utilityfunction (. ). ticipants jointly developed a surveyIt appears that risk averse behavior is ex- instrument (Patrick).' Part I of the question-plained by a multivariable function rather naire asked for general information about thethan one single attitude or attribute. While farm (size, enterprises, form of business or-this has long been recognized in the litera- ganization, etc.). In addition, the respond-ture, agricultural economists still frequently ents were asked to define risk. Part II identifiedattempt to explain risk behavior with a single and briefly illustrated various sources of riskmeasure. in crop and livestock production, respec-
This study contributes toward the goal of tively. Twenty sources of risk in crop pro-establishing a more fundamental empirical duction and 18 sources in livestockbasis for risk analyses. A strong empirical production were identified. Producers werebasis is necessary to qualitatively understand asked to indicate the relative importance of(and predict) how farmers (will) react to each source using a scale from 1 (not im-risk related aspects of production, marketing, portant) to 5 (extremely important). Im-finance, technology, and policy (Lee). In this mediately after ranking each source of risk,regard, recognition of farmers' perceptions the respondents were asked what, if any,of the sources and importances of risk is management practices they used to combatnecessary in order to characterize risk man- that particular risk. Managerial responses toagement responses in agriculture. The survey risk were listed and briefly described in Partapproach of this study is part of a larger effort III. Producers were asked to indicate the(Patrick). Barry indicates that a few surveys importance of each (on a scale of 1 to 5)have been conducted; however, the results and whether they used it. Part IV containedhave not been sufficiently comprehensive to open-ended questions about producers' in-
understand how risk responses differ with formation needs for dealing with risk. Thefirm and producer characteristics (May, final section asked for socioeconomic infor-1983b). mation including age, education, experience,
' Copies of the risk survey questionnaire are available from the senior author upon request. The version used
in this study was modified to some extent from the regional project version of the questionnaire in order to better
probe certain production issues related to the area of study.
106
family size, race, net worth, off-farm em- RESULTSployment, debt, and income. Respondents' Definition of Risk
In the Fall of 1983, 25 farmers in JacksonCounty, Florida and 23 farmers in Henry "Risk is a loaded gun," is how one ratherCounty, Florida and 23 farmers in Henry forthright farmer defined risk. This definitionCounty, Alabama were selected with a sta- captures the essence of the majority of re-tistically random sampling technique based sponses. Nearly all of the farmers focused onon master lists of farmers in the respective the potential of negative outcomes and manycounties.2 The two counties are located within expressed the probability notion in the def-
initions. A couple of farmers, however, in-25 miles of each other across the Florida and c eluded the potential for gain involved in anyAlabama border. Agricultural crops and prac- risky prospect
tices are similar in both counties. Personalinterviews were conducted with each farmer. Socioeconomic Characteristics of theSummary statistics, Chi-square analyses, and Respondentslogistic regression techniques were used to Forty-one of the farmers (20 from Floridaanalyze the data. and 21 from Alabama) produced both crops
TABLE 1. SOCIOECONOMIC CHARACTERISTICS OF THE SAMPLE RESPONDENTS IN NORTH FLORIDA AND SOUTH ALABAMA BY SIZE(ACREAGE) OF FARMS, 1983
Size of farmSmall Medium Large<150 150-500 >500
Item acres acres acres Total............................................ Percen t .......................................
Financial leverage ratio:aZero .................................... 5.3( 20.1)b 10.5( 20.0) 2.6( 12.4) 18.40.01-0.20 ..................................... . 15.8( 60.1) 18.4( 35.0) 2.6( 12.4) 36.80.21-0.50 ...................................... 2.6( 9.9) 13.2( 25.0) 7.9( 37.6) 23.70.51-1.00 ............................................... 2.6( 9.9) 10.5( 20.0) 7.9( 37.6) 21.1Total................................................... 26.3(100.0) 52.6(100.0) 21.0(100.0) 100.0
Taxable farm income ($):cNegative .................................. 2.4( 9.1) 9.5( 19.0) 2.4( 10.1) 14.30-9,999 ........................................ 14.3( 54.6) 11.9( 23.8) 2.4( 10.1) 28.610,000-19,999 ...................................... 4.8( 18.3) 11.9( 23.8) 2.4( 10.1) 19.120,000-49,999 ....................................... 4.8( 18.3) 11.9( 23.8) 7.1( 29.8) 23.850,000-99,999 ....................................... 0.0( 0.0) 2.4( 4.8) 7.1( 29.8) 9.5100,000 or more ................................... 0.0( 0.0) 2.4( 4.8) 2.4( 10.1) 4.8
Total................................................... 26.2(100.0) 50.0(100.0) 23.8(100.0) 100.0Years of experience in farming:d
0-9 ........................................ 2.1( 6.7) 6.3( 13.2) 6.3( 30.2) 14.610-24 ..................................................... 16.7( 53.4) 16.7( 34.8) 2.1( 10.1) 35.410-24.16.7( 53.4) 16.7( 34.8) 2.1( 10.1) 35.425-39 ..................................................... 4.2( 13.4) 10.4( 21.6) 8.3( 39.7) 22.940 years or more .................................. 8.3( 26.5) 14.6( 30.4) 4.2( 20.1) 27.1
Total ................................................... 31.3(100.0) 47.9(100.0) 20.8(100.0) 100.0Educationd
Some high school .................................. 10.4( 33.2) 16.7( 34.9) 2.1( 10.1) 29.2High school graduate ............................. 4.2( 13.4) 10.4( 21.7) 8.3( 39.9) 22.9Two year college/vocational .................. 10.4( 33.2) 12.5( 26.1) 2.1( 10.1) 25.0Four year college .................................. 6.3( 20.1) 8.3( 17.3) 8.3( 39.9) 22.9
Total................................................... 31.3(100.0) 47.9(100.0) 20.8(100.0) 100.0Dominant crop grownd
Peanuts ................... ..... 18.8( 60.1) 37.5( 78.3) 10.4( 50.0) 66.7Any other crop ...................................... 12.5( 39.9) 10.4( 21.7) 10.4( 50.0) 33.3Total ............................................. 31.3(100.0) 47.9(100.0) 20.8(100.0) 100.0
aValues are based on 38 responses. Financial leverage is defined as total debts divided by total assets.bvalues in parenthesis are the percent within each size strata.cValues are based on 42 responses.Values are based on 48 responses.
2 Master lists of farmers in each county were obtained from the local Agricultural Stabilization and ConservationService (ASCS) offices. Random number generators were used to randomly select sample farmers from the list.This technique has the advantage that the probability that a particular "category" of farmers will be sampled isequal to the population frequency. Conversely, the disadvantage is that relatively few observations are obtainedfor certain categories.
107
and livestock, five farmers (three from Florida of 0.20 or lower and none had a ratio greater
and two from Alabama) produced only crops than 0.50. One explanation for this phenom-
while two farmers (both from Florida) pro- enon might be life cycle differences among
duced only livestock. Forty of the sample farmers. That is, the more experienced farm-farmers were white and the remaining eight ers have already paid for the majority of their
were black. Forty-six of the 48 farmers were fixed assets and, thus, are no longer interestedmarried and the average number of depend- in expanding their operations as retirementents was 2.3. The average size of farms with nears.crop and harvested forage production was Based on 1982 taxable farm income, 14.3
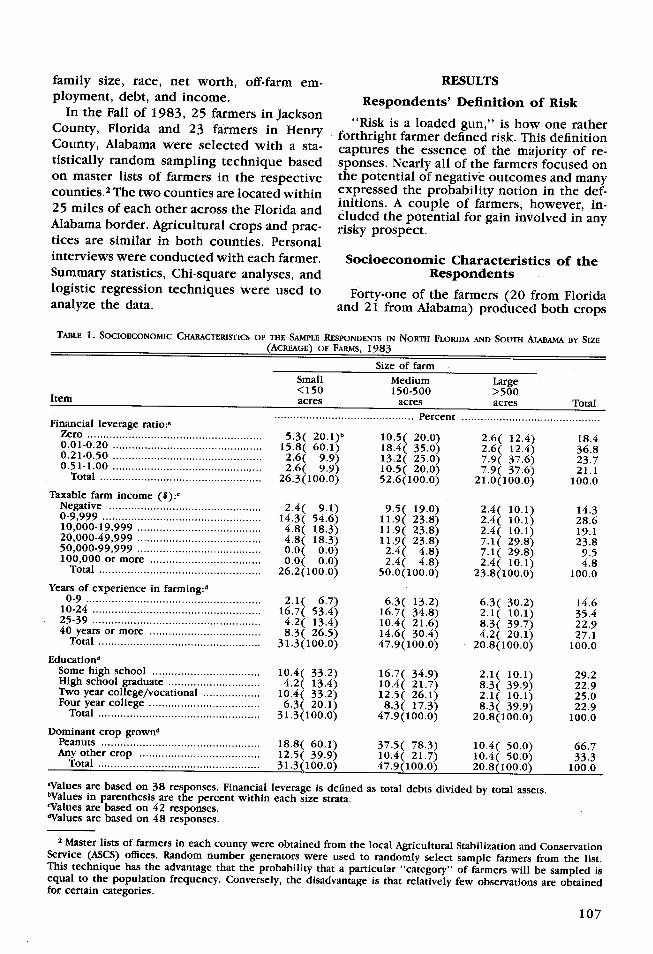
312 acres, while the average acreage of pas- percent of the sample farmers had negativeture and range was 172 acres. Tables 1 and incomes, Table 1. Six (14.3 percent) of the
2 present a breakdown by size of farm and farmers had incomes of $50,000 or morefinancial leverage ratio for various socioec- while 62 percent of the farmers had incomeonomic characteristics of the respondents. of less than $20,000. Only 18 percent of the
Leverage, defined as total farm debts di- small farms reported taxable incomes ofvided by total farm assets, is a commonly $20,000 or more; whereas, 33 percent of theused measure of financial solvency. A lever- medium farms and 70 percent of the large
age ratio of 0.50 or greater is normally re- farms reported taxable incomes over $20,000.garded as unstable and a ratio of 1.0 indicates The average farming experience was 26.5that the farm is bankrupt. Eight of the farmers years with a standard deviation of 14.1. Sev-had leverage ratios greater than 0.50 (ranging enty percent of the farmers had completedfrom 0.52 to 0.84), while seven farmers had high school. Twenty-five of the farmers hadzero leverage ratios. either attended two-year college or voca-
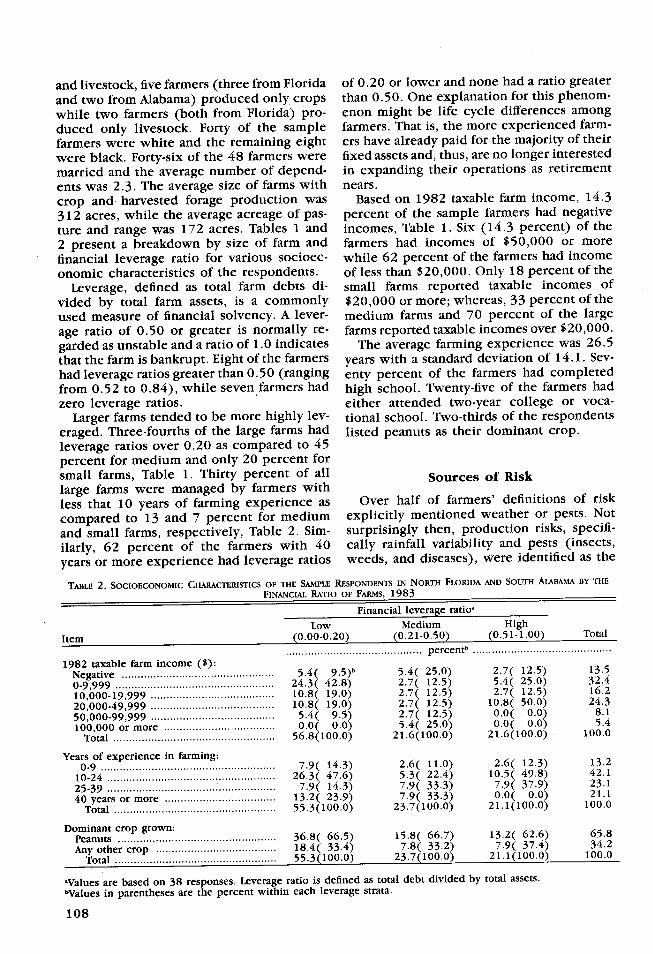
Larger farms tended to be more highly lev- tional school. Two-thirds of the respondentseraged. Three-fourths of the large farms had listed peanuts as their dominant crop.leverage ratios over 0.20 as compared to 45percent for medium and only 20 percent forsmall farms, Table 1. Thirty percent of all Sources of Risklarge farms were managed by farmers withless that 10 years of farming experience as Over half of farmers' definitions of risk
compared to 13 and 7 percent for medium explicitly mentioned weather or pests. Not
and small farms, respectively, Table 2. Sim- surprisingly then, production risks, specifi-
ilarly, 62 percent of the farmers with 40 cally rainfall variability and pests (insects,
years or more experience had leverage ratios weeds, and diseases), were identified as the
TABLE 2. SOCIOECONOMIC CHARACTERISTICS OF THE SAMPLE RESPONDENTS IN NORTH FLORIDA AND SOUTH ALABAMA BY THE
FINANCIAL RATIO OF FARMS, 1983
Financial leverage ratioa
Low Medium High
Item (0.00-0.20) (0.21-0.50) (0.51-1.00) Total
........................................... p ercentb ............................................
1982 taxable farm income ($):Negative ................................... 5.4( 9.5)b 5.4( 25.0) 2.7( 12.5) 13.5
0-9,999 . ............................... 24.3( 42.8) 2.7( 12.5) 5.4( 25.0) 32.4
10,000-19,999 .................... ................. 10.8( 19.0) 2.7( 12.5) 2.7( 12.5) 16.2
20,000-49,999 ................................. 10.8( 19.0) 2.7( 12.5) 10.8( 50.0) 24.3
50,000-99,999 ..................................... 5.4( 9.5) 2.7( 12.5) 0.0( 0.0) 8.1
100,000 or more ................................... 0.0( 0.0) 5.4( 25.0) 0.0( 0.0) 5.4
Total ...... ................. ............ ...... 56.8(100.0) 21.6(100.0) 21.6(100.0) 100.0
Years of experience in farming:0-9 .............................. ....... 7.9( 14.3) 2.6( 11.0) 2.6( 12.3) 13.2
10-24 .................... ... ... . 26.3( 47.6) 5.3( 22.4) 10.5( 49.8) 42.1
25-39 ................... ................. . 7.9( 14.3) 7.9( 33.3) 7.9( 37.9) 23.140 years or more ................................... 13.2( 23.9) 7.9( 33.3) 0.0( 0.0) 21.1
Total ......................... ............... . 55.3(100.0) 23.7(100.0) 21.1(100.0) 100.0
Dominant crop grown:Peanuts .................................. 36.8( 66.5) 15.8( 66.7) 13.2( 62.6) 65.8
Any other crop ................................... 18.4( 33.4) 7.8( 33.2) 7.9( 37.4) 34.2
Total .............. ....................... 55.3(100.0) 23.7(100.0) 21.1(100.0) 100.0
aValues are based on 38 responses. Leverage ratio is defined as total debt divided by total assets.
bvalues in parentheses are the percent within each leverage strata.
108
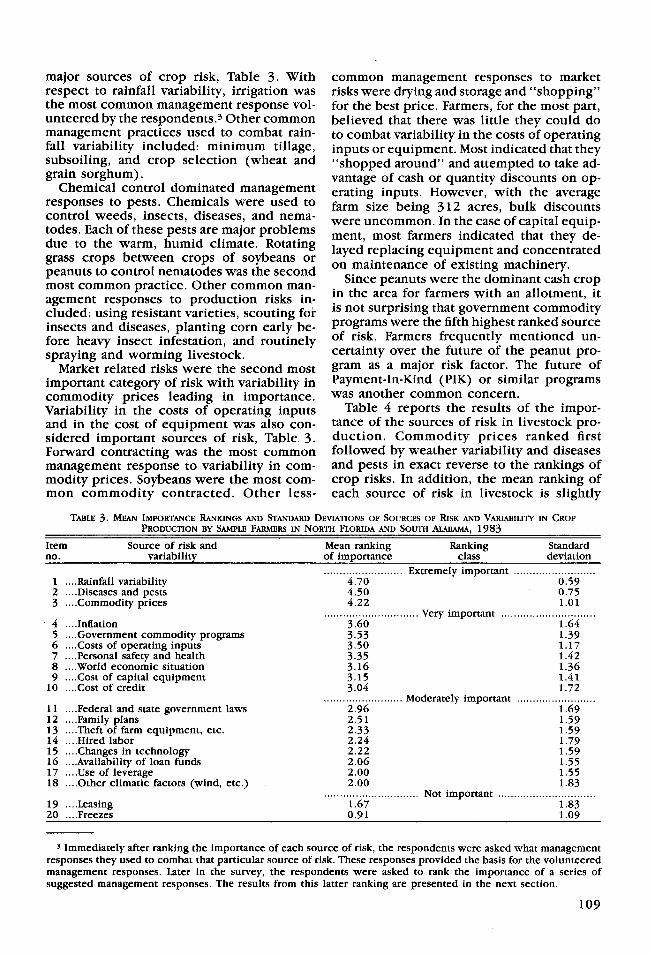
major sources of crop risk, Table 3. With common management responses to marketrespect to rainfall variability, irrigation was risks were drying and storage and "shopping"the most common management response vol- for the best price. Farmers, for the most part,unteered by the respondents.3 Other common believed that there was little they could domanagement practices used to combat rain- to combat variability in the costs of operatingfall variability included: minimum tillage, inputs or equipment. Most indicated that theysubsoiling, and crop selection (wheat and "shopped around" and attempted to take ad-grain sorghum). vantage of cash or quantity discounts on op-
Chemical control dominated management erating inputs. However, with the averageresponses to pests. Chemicals were used to farm size being 312 acres, bulk discountscontrol weeds, insects, diseases, and nema- were uncommon. In the case of capital equip-todes. Each of these pests are major problems ment, most farmers indicated that they de-due to the warm, humid climate. Rotating layed replacing equipment and concentratedgrass crops between crops of soybeans or on maintenance of existing machinerypeanuts to control nematodes was the second ine ants ee te omimost common practice. Other common man- ce peanuts were the dominant cash crop
in the area for farmers with an allotment, itagement responses to production risks in- n the ara fr f s with allotment, itcluded: using resistant varieties, scouting for s not surprising that government commodityinsects and diseases, planting corn early be- programs were the fifth highest ranked sourcefore heavy insect infestation, and routinely of risk. Farmers frequently mentioned un-spraying and worming livestock, certainty over the future of the peanut pro-
Market related risks were the second most gram as a major risk factor. The future ofimportant category of risk with variability in Payment-In-Kind (PIK) or similar programscommodity prices leading in importance. was another common concern.Variability in the costs of operating inputs Table 4 reports the results of the impor-and in the cost of equipment was also con- tance of the sources of risk in livestock pro-sidered important sources of risk, Table 3. duction. Commodity prices ranked firstForward contracting was the most common followed by weather variability and diseasesmanagement response to variability in com- and pests in exact reverse to the rankings ofmodity prices. Soybeans were the most com- crop risks. In addition, the mean ranking ofmon commodity contracted. Other less- each source of risk in livestock is slightly
TABLE 3. MEAN IMPORTANCE RANKINGS AND STANDARD DEVIATIONS OF SOURCES OF RISK AND VARIABILITY IN CROPPRODUCTION BY SAMPLE FARMERS IN NORTH FLORIDA AND SOUTH ALABAMA, 1983
Item Source of risk and Mean ranking Ranking Standardno. variability of importance class deviation
......................... Extrem ely im portant ..........................1 ....Rainfall variability 4.70 0.592 ....Diseases and pests 4.50 0.753 ....Commodity prices 4.22 1.01
.............................. Very im portant ..............................4 .... Inflation 3.60 1.645 ....Government commodity programs 3.53 1.396 ....Costs of operating inputs 3.50 1.177 ....Personal safety and health 3.35 1.42.8 ....World economic situation 3.16 1.369 ....Cost of capital equipment 3.15 1.41
10 ....Cost of credit 3.04 1.72......................... M oderately im portant .........................
11 ....Federal and state government laws 2.96 1.6912 .... Family plans 2.51 1.5913 ....Theft of farm equipment, etc. 2.33 1.5914 ....Hired labor 2.24 1.7915 ....Changes in technology 2.22 1.5916 ....Availability of loan funds 2.06 1.5517 ....Use of leverage 2.00 1.5518 ....Other climatic factors (wind, etc.) 2.00 1.83
.............................. Not im portant ..............................19 ....Leasing 1.67 1.8320 ....Freezes 0.91 1.09
3 Immediately after ranking the importance of each source of risk, the respondents were asked what managementresponses they used to combat that particular source of risk. These responses provided the basis for the volunteeredmanagement responses. Later in the survey, the respondents were asked to rank the importance of a series ofsuggested management responses. The results from this latter ranking are presented in the next section.
109
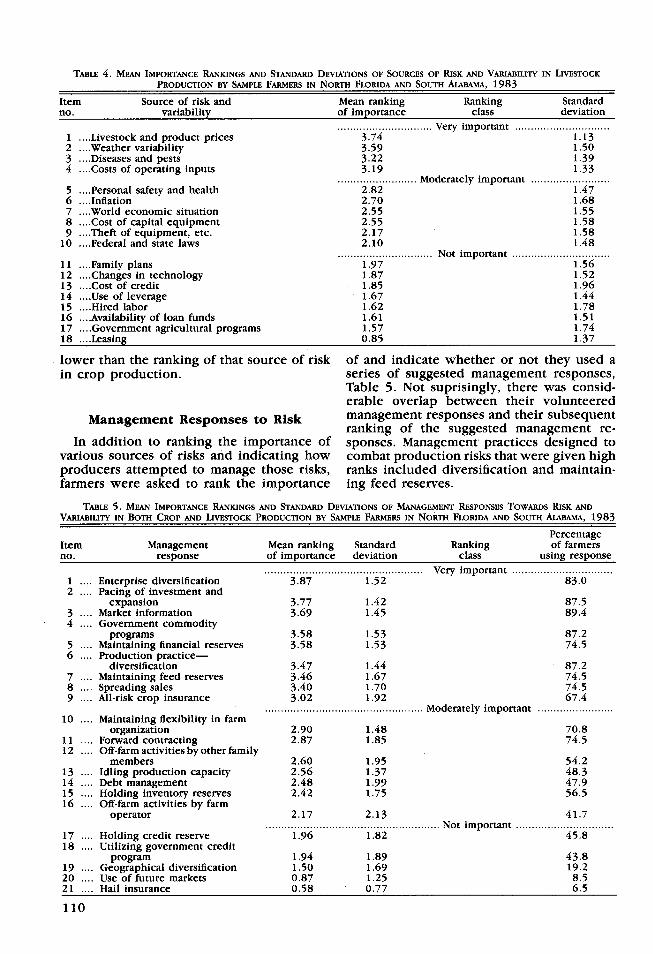
TABLE 4. MEAN IMPORTANCE RANKINGS AND STANDARD DEVIATIONS OF SOURCES OF RISK AND VARIABILITY IN LIVESTOCK
PRODUCTION BY SAMPLE FARMERS IN NORTH FLORIDA AND SOUTH ALABAMA, 1983
Item Source of risk and Mean ranking Ranking Standardno. variability of importance class deviation
.............................. Very im portant ..............................1 ....Livestock and product prices 3.74 1.132 ....Weather variability 3.59 1.503 ....Diseases and pests 3.22 1.394 ....Costs of operating inputs 3.19 1.33
......................... M oderately important .........................5 ....Personal safety and health 2.82 1.476 .... Inflation 2.70 1.687 ....World economic situation 2.55 1.558 ....Cost of capital equipment 2.55 1.589 ....Theft of equipment, etc. 2.17 1.58
10 ....Federal and state laws 2.10 1.48.............................. Not im portant ...............................
11 .... Family plans 1.97 1.5612 ....Changes in technology 1.87 1.5213 ....Cost of credit 1.85 1.9614 ....Use of leverage 1.67 1.4415 ....Hired labor 1.62 1.7816 ....Availability of loan funds 1.61 1.5117 ....Government agricultural programs 1.57 1.7418 ....Leasing 0.85 1.37
lower than the ranking of that source of risk of and indicate whether or not they used ain crop production. series of suggested management responses,
Table 5. Not suprisingly, there was consid-erable overlap between their volunteered
Management Responses to Risk management responses and their subsequentranking of the suggested management re-
In addition to ranking the importance of sponses. Management practices designed tovarious sources of risks and indicating how combat production risks that were given highproducers attempted to manage those risks, ranks included diversification and maintain-farmers were asked to rank the importance ing feed reserves.
TABLE 5. MEAN IMPORTANCE RANKINGS AND STANDARD DEVIATIONS OF MANAGEMENT RESPONSES TOWARDS RISK ANDVARIABILITY IN BOTH CROP AND LIVESTOCK PRODUCTION BY SAMPLE FARMERS IN NORTH FLORIDA AND SOUTH ALABAMA, 1983
PercentageItem Management Mean ranking Standard Ranking of farmersno. response of importance deviation class using response
.................................................. Very im portant ................................1 .... Enterprise diversification 3.87 1.52 83.02 .... Pacing of investment and
expansion 3.77 1.42 87.53 .... Market information 3.69 1.45 89.44 .... Government commodity
programs 3.58 1.53 87.25 .... Maintaining financial reserves 3.58 1.53 74.56 .... Production practice-
diversification 3.47 1.44 87.27 .... Maintaining feed reserves 3.46 1.67 74.58 .... Spreading sales 3.40 1.70 74.59 .... All-risk crop insurance 3.02 1.92 67.4
........................................ M oderately im portant ........................10 .... Maintaining flexibility in farm
organization 2.90 1.48 70.811 .... Forward contracting 2.87 1.85 74.512 .... Off-farm activities by other family
members 2.60 1.95 54.213 .... Idling production capacity 2.56 1.37 48.314 .... Debt management 2.48 1.99 47.915 .... Holding inventory reserves 2.42 1.75 56.516 .... Off-farm activities by farm
operator 2.17 2.13 41.7....................................................... N ot im portant ...............................
17 .... Holding credit reserve 1.96 1.82 45.818 .... Utilizing government credit
program 1.94 1.89 43.819 .... Geographical diversification 1.50 1.69 19.220 .... Use of future markets 0.87 1.25 8.521 .... Hail insurance 0.58 0.77 6.5
110
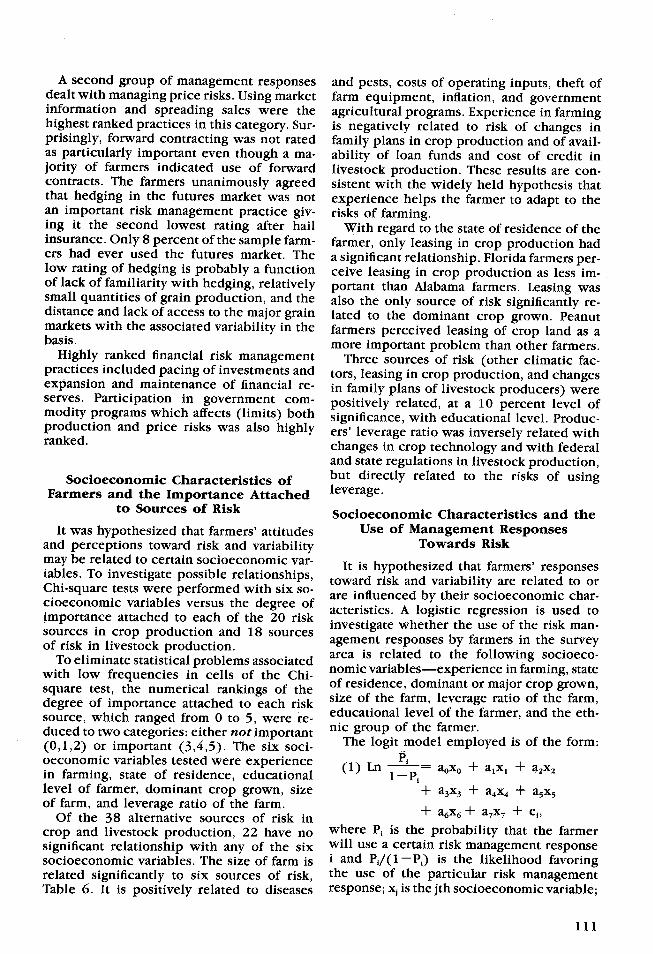
A second group of management responses and pests, costs of operating inputs, theft ofdealt with managing price risks. Using market farm equipment, inflation, and governmentinformation and spreading sales were the agricultural programs. Experience in farminghighest ranked practices in this category. Sur- is negatively related to risk of changes inprisingly, forward contracting was not rated family plans in crop production and of avail-as particularly important even though a ma- ability of loan funds and cost of credit injority of farmers indicated use of forward livestock production. These results are con-contracts. The farmers unanimously agreed sistent with the widely held hypothesis thatthat hedging in the futures market was not experience helps the farmer to adapt to thean important risk management practice giv- risks of farming.ing it the second lowest rating after hail With regard to the state of residence of theinsurance. Only 8 percent of the sample farm- farmer, only leasing in crop production haders had ever used the futures market. The a significant relationship. Florida farmers per-low rating of hedging is probably a function ceive leasing in crop production as less im-of lack of familiarity with hedging, relatively portant than Alabama farmers. Leasing wassmall quantities of grain production, and the also the only source of risk significantly re-distance and lack of access to the major grain lated to the dominant crop grown. Peanutmarkets with the associated variability in the farmers perceived leasing of crop land as abasis. more important problem than other farmers.
Highly ranked financial risk management Three sources of risk (other climatic fac-practices included pacing of investments and tors, leasing in crop production, and changesexpansion and maintenance of financial re- in family plans of livestock producers) wereserves. Participation in government com- positively related, at a 10 percent level ofmodity programs which affects (limits) both significance, with educational level. Produc-production and price risks was also highly ers' leverage ratio was inversely related withranked. changes in crop technology and with federal
and state regulations in livestock production,Socioeconomic Characteristics of but directly related to the risks of using
Farmers and the Importance Attached leverage.to Sources of Risk Socioeconomic Characteristics and the
It was hypothesized that farmers' attitudes Use of Management Responsesand perceptions toward risk and variability Towards Riskmay be related to certain socioeconomic var- It is hypothesized that farmers responsesiables. To investigate possible relationships, toward risk and variability are related to orChi-square tests were performed with six so- are influenced by their socoeconomicchar-cioeconomic variables versus the degree of . io i acteristics. A logistic regression is used toimportance attached to each of the 20 risk
investigate whether the use of the risk man-sources in crop production and 18 sourcesof risk in livestock production. agement responses by farmers in the survey
ofrski.ivsoc rd o. .area is related to the following socioeco-To eliminate statistical problems associated area i rele o following socioeco-with low frequencies in cells of the Chi- nomic variablesexperience in farming, statesquare test, the numerical rankings of the of residence, dominant or major crop grown,degree of importance attached to each risk size of the farm, leverage ratio of the farm,source, which ranged from 0 to 5, were re- educational level of the farmer, and the eth-duced to two categories: either not important group of the farmer.(0,1,2) or important (3,4,5). The six soci- The logit model employed is of the form:oeconomic variables tested were experience (1) Ln Pi a + a + ain farming, state of residence, educational 1-Pilevel of farmer, dominant crop grown, size + a3x3 + a4x4 + a5x5of farm, and leverage ratio of the farm. -
Of the 38 alternative sources of risk in a6 a7 ei,crop and livestock production, 22 have no where Pi is the probability that the farmersignificant relationship with any of the six will use a certain risk management responsesocioeconomic variables. The size of farm is i and Pi/( -Pi) is the likelihood favoringrelated significantly to six sources of risk, the use of the particular risk managementTable 6. It is positively related to diseases response; xj is the jth socioeconomic variable;
111
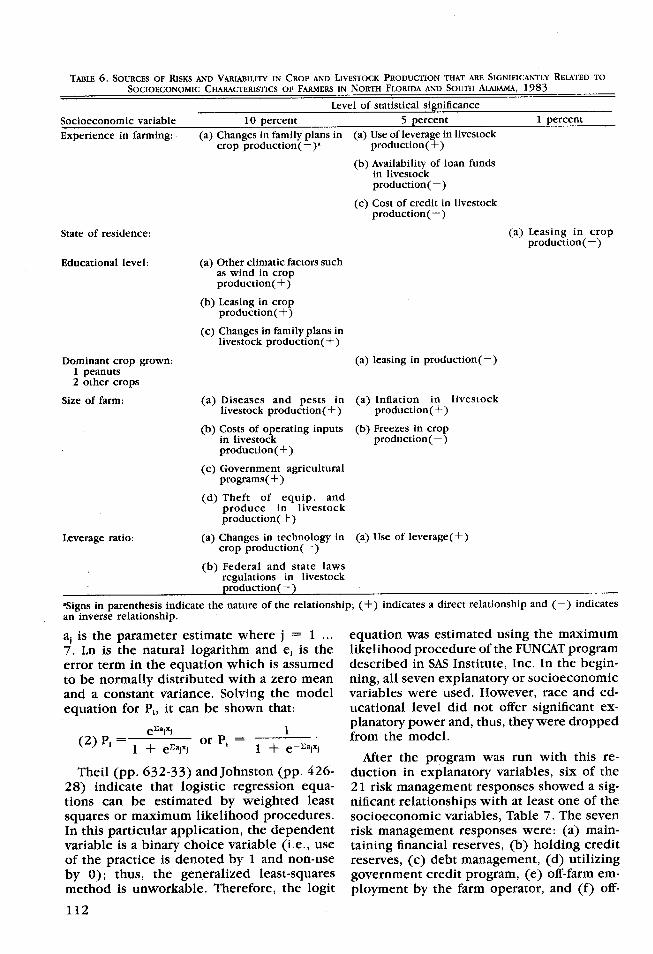
TABLE 6. SOURCES OF RISKS AND VARIABILITY IN CROP AND LIVESTOCK PRODUCTION THAT ARE SIGNIFICANTLY RELATED TO
SOCIOECONOMIC CHARACTERISTICS OF FARMERS IN NORTH FLORIDA AND SOUTH ALABAMA, 1983
Level of statistical significance
Socioeconomic variable 10 percent 5 percent 1 percent
Experience in farming: (a) Changes in family plans in (a) Use of leverage in livestockcrop production(-)a production(+)
(b) Availability of loan fundsin livestockproduction(--)
(c) Cost of credit in livestockproduction(--)
State of residence: (a) Leasing in cropproduction(-)
Educational level: (a) Other climatic factors suchas wind in cropproduction(+)
(b) Leasing in cropproduction(+)
(c) Changes in family plans inlivestock production(+)
Dominant crop grown: (a) leasing in production(-)1 peanuts2 other crops
Size of farm: (a) Diseases and pests in (a) Inflation in livestocklivestock production(+) production(+)
(b) Costs of operating inputs (b) Freezes in cropin livestock production(-)production(+)
(c) Government agriculturalprograms(+)
(d) Theft of equip. andproduce in livestockproduction(+)
Leverage ratio: (a) Changes in technology in (a) Use of leverage(+)crop production(-)
(b) Federal and state lawsregulations in livestockproduction(--)
aSigns in parenthesis indicate the nature of the relationship; (+) indicates a direct relationship and (-) indicatesan inverse relationship.
a, is the parameter estimate where j = 1 ... equation was estimated using the maximum7. Ln is the natural logarithm and ei is the likelihood procedure of the FUNCAT programerror term in the equation which is assumed described in SAS Institute, Inc. In the begin-to be normally distributed with a zero mean ning, all seven explanatory or socioeconomicand a constant variance. Solving the model variables were used. However, race and ed-equation for Pi, it can be shown that: ucational level did not offer significant ex-
SeF-~ajixj 1planatory power and, thus, they were dropped(2) Pi = ex r Pi 1 from the model.
1 + ecaix^ l+ e-Yajx.After the program was run with this re-
Theil (pp. 632-33) andJohnston (pp. 426- duction in explanatory variables, six of the28) indicate that logistic regression equa- 21 risk management responses showed a sig-tions can be estimated by weighted least nificant relationships with at least one of thesquares or maximum likelihood procedures. socioeconomic variables, Table 7. The sevenIn this particular application, the dependent risk management responses were: (a) main-variable is a binary choice variable (i.e., use taining financial reserves, (b) holding creditof the practice is denoted by 1 and non-use reserves, (c) debt management, (d) utilizingby 0); thus, the generalized least-squares government credit program, (e) off-farm em-method is unworkable. Therefore, the logit ployment by the farm operator, and (f) off-
112
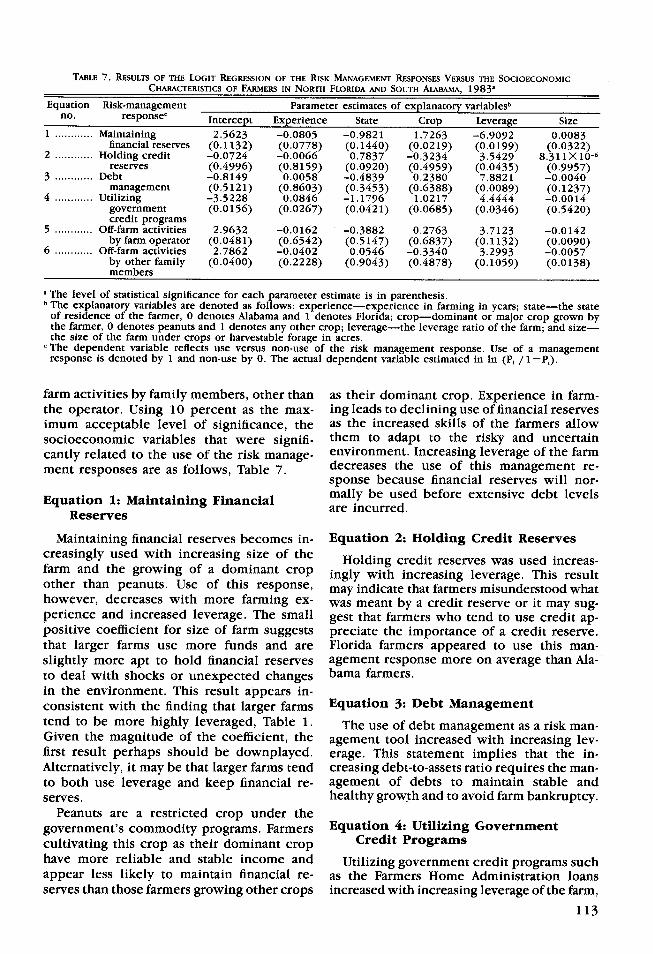
TABLE 7. RESULTS OF THE LOGIT REGRESSION OF THE RISK MANAGEMENT RESPONSES VERSUS THE SOCIOECONOMICCHARACTERISTICS OF FARMERS IN NORTH FLORIDA AND SOUTH ALABAMA, 1983a
Equation Risk-management Parameter estimates of explanatory variablesbno. _ response- Intercept Experience State Crop Leverage Size
1 ............ Maintaining 2.5623 -0.0805 -0.9821 1.7263 -6.9092 0.0083financial reserves (0.1132) (0.0778) (0.1440) (0.0219) (0.0199) (0.0322)
2 ............ Holding credit -0.0724 -0.0066 0.7837 -0.3234 3.5429 8.311X10- 6
reserves (0.4996) (0.8159) (0.0920) (0.4959) (0.0435) (0.9957)3 ............ Debt -0.8149 0.0058 -0.4839 0.2380 7.8821 -0.0040
management (0.5121) (0.8603) (0.3453) (0.6388) (0.0089) (0.1237)4 ............ Utilizing -3.5228 0.0846 -1.1796 1.0217 4.4444 -0.0014
government (0.0156) (0.0267) (0.0421) (0.0685) (0.0346) (0.5420)credit programs
5 ............ Off-farm activities 2.9632 -0.0162 -0.3882 0.2763 3.7123 -0.0142by farm operator (0.0481) (0.6542) (0.5147) (0.6837) (0.1132) (0.0090)
6 ............ Off-farm activities 2.7862 -0.0402 0.0546 -0.3340 3.2993 -0.0057by other family (0.0400) (0.2228) (0.9043) (0.4878) (0.1059) (0.0138)members
a The level of statistical significance for each parameter estimate is in parenthesis.bThe explanatory variables are denoted as follows: experience-experience in farming in years; state-the state
of residence of the farmer, 0 denotes Alabama and 1 denotes Florida; crop-dominant or major crop grown bythe farmer, 0 denotes peanuts and 1 denotes any other crop; leverage-the leverage ratio of the farm; and size-the size of the farm under crops or harvestable forage in acres.
cThe dependent variable reflects use versus non-use of the risk management response. Use of a managementresponse is denoted by 1 and non-use by 0. The actual dependent variable estimated in In (P, /1- P.).
farm activities by family members, other than as their dominant crop. Experience in farm-the operator. Using 10 percent as the max- ing leads to declining use of financial reservesimum acceptable level of significance, the as the increased skills of the farmers allowsocioeconomic variables that were signifi- them to adapt to the risky and uncertaincantly related to the use of the risk manage- environment. Increasing leverage of the farmment responses are as follows, Table 7. decreases the use of this management re-
sponse because financial reserves will nor-Equation 1: Maintainin Financial mally be used before extensive debt levelsEquation 1: Maintaining Financial a i are incurred.Reserves
Maintaining financial reserves becomes in- Equation 2: Holding Credit Reservescreasingly used with increasing size of the Holding credit reserves was used increas-farm and the growing of a dominant crop ingly with increasing leverage. This resultother than peanuts. Use of this response, may indicate that farmers misunderstood whathowever, decreases with more farming ex- was meant by a credit reserve or it may sug-perience and increased leverage. The small gest that farmers who tend to use credit ap-positive coefficient for size of farm suggests preciate the importance of a credit reserve.that larger farms use more funds and are Florida farmers appeared to use this man-slightly more apt to hold financial reserves agement response more on average than Ala-to deal with shocks or unexpected changes bama farmers.in the environment. This result appears in-consistent with the finding that larger farms Equation 3: Debt Managementtend to be more highly leveraged, Table 1. The use of debt management as a risk man-Given the magnitude of the coefficient, the agement tool increased with increasing lev-first result perhaps should be downplayed. erage. This statement implies that the in-Alternatively, it may be that larger farms tend creasing debt-to-assets ratio requires the man-to both use leverage and keep financial re- agement of debts to maintain stable andserves. healthy growth and to avoid farm bankruptcy.
Peanuts are a restricted crop under thegovernment's commodity programs. Farmers Equation 4: Utilizing Governmentcultivating this crop as their dominant crop Credit Programshave more reliable and stable income and Utilizing government credit programs suchappear less likely to maintain financial re- as the Farmers Home Administration loansserves than those farmers growing other crops increased with increasing leverage of the farm,
113
experience in farming,4 and the cultivation Despite a relatively diverse sample in termsof non-peanut crops as the dominant crop by of education, experience, farm size, leveragethe farmer. Higher leverage was directly re- ratio, and farm income, there was consider-lated to greater use of government disaster able agreement on the relative importanceloans and Farmers Home Administration loans. of various sources of risk and alternative riskThe cultivation of crops other than peanuts management practices. Less than half of theas the dominant crop means that the farmer rankings of sources of risk and only a thirdis less likely to achieve the more stable and of the responses on the use of managementreliable income obtained from peanuts. Fi- practices had significant relationships withnally, Florida farmers appeared less likely to any of the six socioeconomic variables. Pro-utilize government credit programs than Ala- duction risks (rainfall variability and diseasesbama farmers. and pests) were identified as the most im-
portant category of crop risks, followed byEquation 5: Off-Farm Activities by the market risks (variability in commodity prices,
Farm Operator inflation, and variability in costs of operating
The use of this risk management response inputs) and financial risks (cost of credit,was negatively related to the size of the farm. availability of loan funds, and use of lever-Larger farms require the full attention of the age).operator and hence there is less time for the In general, livestock risks were ranked asoperator to devote to off-farm activities. While less important than crop risks. However, fouroff-farm employment does have a portfolio risk sources (livestock products, weather var-effect, the limited resource base of small iability, diseases and pests, and cost of op-farms and the corresponding diminishing re- crating inputs) were considered veryturns to labor is probably the principal cause important.of the above relationship. Logistic regression techniques were used
to investigate the effect of various socioec-
Equation 6: Off-Farm Activities by onomic characteristics of the respondents onOther Members of the Family the probability that they use a particular risk
management practice. The firm's leverage ra-The use of this management response was tio and size and the producer's experience
also inversely related to the size of the farm. were the three most important variables inThe explanation may be that larger farms may determining use versus non-use of the riskrequire the labor services of the other mem- management practices. Producers with highbers of the family, thus depriving them of leverage ratios were much less likely to holdtime to perform off-farm jobs. financial reserves, but more likely to have
Use of off-farm activities by other members used government credit programs, debt re-of the family appeared to increase with in- structuring, credit reserves, and off-farm em-structuring, credit reserves, and off-farm em-creasing leverage of the farm, Table 7. This ployment.Larger farmers were more apt tofinding is intuitively appealing since higher but less apt toleverage farmers tend to require funds gen- use off-farm employment. More experiencederated by off-farm activities in order to meet farmers were more likely to maintain finan-cash flow requirements. This relationship may ia eervesandmoreapttohaveusedgov-be a function of particular financial planst t rather than specifically relating to risk.time during
their career.The analysis seemed to identify two groups
of producers. One group consisted of farmersS~UMM ARY ^who are relatively older, more experienced,
The survey results shed useful light on and better established. These farmers tendedfarmers' perceptions of risk, risk sources, and to have smaller acreages and very little lev-risk management practices in North Florida erage and, though not highly profitable, theyand South Alabama. The respondents tended were financially secure. The second groupto define risk in terms of the potential or consisted of younger, more aggressive farm-probability of negative outcomes. ers. These farmers tended to have larger
4 This result appears inconsistent with normal expectations, since more experienced farmers are expected torely less on government subsidized credit. However, the responses to this question were based on whether theyhad ever used government credit programs during their career, not whether they were currently using the programs.
114
acreages and high leverage ratios resulting diverse sample across socioeconomic groups.in tenuous financial positions. In many cases, the null hypothesis that the
Several implications can be drawn from relative importance or use of a managementthe study. Respondents were clearly able to response across socioeconomic groups wasrank the relative importance of various the same was maintained. However, theresources of management responses to risk. were some important exceptions, in partic-This information provides a strong empirical ular the use of financial risk managementbasis for targeting research and extension practices (e.g. government credit programs,
programs in the area. For example, if i is credit reserves, debt restructuring, off-farmprograms intheareaForexampl, i income, and maintaining financial reserves)carefully demonstrated that rainfall variabil- which were shown to vary significantly with
ity and commodity price variability are prior- the firms leverage ratio and size and withity risk sources of concern to farmers, it the producer's experience Use of this in-
the producer's experience. Use of this in-becomes more justifiable to commit scarce formation should llow more precision inresources to studying these problems. In ad- the design of research, extension, and lendingdition, it would be interesting to compare practices relating to financial risk manage-the rankings obtained in this area with similar ment, while at the same time suggesting thatresults in other regions. detailed breakdown by socioeconomic groups
There was a surprising degree of consensus are unnecessary for production and marketon the relative rankings, despite a relatively risk research and extension.
REFERENCES
Anderson, J. R., J. L. Dillon, and B. Hardaker. Agricultural Decision Analysis. Ames, Iowa:Iowa State University Press, 1977.
Antel, John M. "Incorporating Risk into Production Analysis." Amer. J. Agr. Econ., 65,5(1985): 1,099-106.
Barry, Peter J. "Financing Growth and Adjustment of Farm Firms Under Risk and Inflation:Implications for Micromodeling." In K. H. Baum and L. P. Schertz (eds.), ModelingFarm Decisions for Policy Analysis; Boulder, Colorado: Westview Press; 1983a, pp.111-34.
Barry, PeterJ. "Perspectives of Risk Management Research: Contributions of Regional ProjectW- 149." Risk Management Strategies for Agricultural Production Firms: Perspectivesand Research Issues. Department of Agricultural Economics, Oklahoma State University,AE-8350; May, 1983b; pp. 1-6.
Barry, P. J., C. B. Baker, and L. R. Sanint. "Farmers' Credit Risks and Liquidity Management."Amer. J. Agr. Econ., 63,2(1981): 216-27.
Boggess, W. G. and C. B. Amerling. "A Bioeconomic Simulation Analysis of IrrigationInvestments." So. J. Agr. Econ., 15,2(1983): 85-92.
Boggess, W. G., G. D. Lynn, J. W. Jones, and D. P. Swaney. "Risk-Return Assessment ofIrrigation Decisions in Humid Regions." So. J. Agr. Econ., 15,1(1983): 135-44.
Carlson, Gerald A. "A Decision Theoretic Approach to Crop Disease Prediciton and Control."Amer. J. Agr. Econ., 52,2(1970): 216-23.
Eidman, V. R. "Cash Flow, Price Risk, and Production Uncertainty Considerations." In K.H. Baum and L. P. Schertz (eds.), Modeling Farm Decisions for Policy Analysis;Boulder, Farm Credit Administration, Colorado: Westview Press; 1983, pp. 159-80.
Farm Credit Administration, Agricultural and Credit Outlook. Washington, D.C.; December,1983.
Hanson, Gregory D. and Vernon R. Eidman. "Farm Size Evaluation in the El Paso Valley:Comment." Amer. J. Agr. Econ., 65,2(1983): 340-3.
Hanson, G. D., N. R. Martin, Jr., and J. B. Flynn. "Production, Price and Risk Factors inChannel Catfish Farming." So. J. Agr. Econ., 16,1(1984): 173-82.
Johnston, J. Econometric Methods. Third Ed., McGraw-Hill Book Company; New York, NewYork, 1984.
115
Jolly, R. W. "Risk Management in Agricultural Production." Amer. J. Agr., Econ., 65,5(1983):1,107-13.
King, R. P. and L. J. Robison, "An Interval Approach to Modeling Decisionmaker Preferences."Amer. J. Agr. Econ., 63,3(1981): 510-20.
Lee, L. E., Jr. "A Perspective on the Evolution and Status of Micromodeling in Agricultural
Economics." In K. H. Baum and L. P. Schertz (eds.) Modeling Farm Decisions for
Policy Analysis. Boulder, Colorado: Westview Press; 1983, pp. 111-34.
Love, R. 0. and L. J. Robison. "An Empirical Analysis of the Intertemporal Stability of Risk
Preference." So. J. Agr. Econ., 16,1(1984): 159-66.Mapp, Harry P., Jr. and Vernon R. Eidman. "Simulation of Soil Water-Crop Yield Systems:
The Potential for Economic Analysis." So. J. Agr. Econ., 7,1(1975): 47-53.
McCarl, Bruce A. and A. Gene Nelson. "Model Validation: An Overview with Some Emphasis
on Risk Models." Risk Management Strategies for Agricultural Production Firms:
Perspectives and Research Issues. Oklahoma State University, Dept. of Agr. Econ. AE-
8350; May, 1983, pp. 90-106.Musser, W. N. and B. V. Tew. "Use of Biophysical Simulation in Production Economics."
So. J. Agr. Econ., 16,1(1984): 77-86.Patrick, George R., "Producers' Attitudes, Perceptions and Management Responses to Var-
iability." Risk Analysis for Agricultural Production Firms: Concepts, Information
Requirements and Policy Issues. Dept. of Agr. Econ., University of Illinois; AE-4574;
July, 1984, pp. 197-256.Richardson, James W. and Gary D. Condra. "Farm Size Evaluation in the El Paso Valley: A
Survival/Success Approach." Amer. J. Agr. Econ., 63,3(1981): 430-7.
SAS Institute Inc. SAS User's Guide. 1982 Edition. Cary, North Carolina, 1982, pp. 923.
Theil, H. Principles of Econometrics. John Wiley and Sons, Inc., New York, 1971.
Weiss, M. D. "Risk Concepts in Agriculture: A Closer Look." Paper presented at annual
meeting of the Amer. Assn. of Agr. Econ.; Ithaca, New York; August, 1984.
Wilkerson, G. G., J. W. Mishoe, J. W. Jones, W. G. Boggess, and D. P. Swaney. "Within-
Season Decision Making for Pest Control in Soybeans." Agr. Econ. Paper No. 83-4044;University of Florida, 1983.
Young, D., W. Lin, R. Pope, L. Robison, and R. Selley. "Risk Preference of Agricultural
Producers: Their Measurement and Use." Risk Management in Agriculture: Behavorial
Managerial and Policy Issues, AE-4478; University of Illinois, Dept. of Agr. Econ.;
July, 1979, pp. 1-28.
116