Embed Size (px)
Citation preview
8/7/2019 IMPORTANCE OF TURBIDITY
http://slidepdf.com/reader/full/importance-of-turbidity 1/13
April 1999 7-1 EPA Guidance ManualTurbidity Provisions
7. IMPORTANCE OF TURBIDITY
7.1 Overview
Section 2 of this guidance manual is included to present an overview on the definition and
sources of turbidity. Understanding turbidity, its causes and sources, and the significance
to human health will provide the background on which the new turbidity standards are
based.
7.2 Turbidity: Definition, Causes, and History as a Water
Quality Parameter
Turbidity is a principal physical characteristic of water and is an expression of the optical
property that causes light to be scattered and absorbed by particles and molecules ratherthan transmitted in straight lines through a water sample. It is caused by suspended matter
or impurities that interfere with the clarity of the water. These impurities may include
clay, silt, finely divided inorganic and organic matter, soluble colored organic compounds,
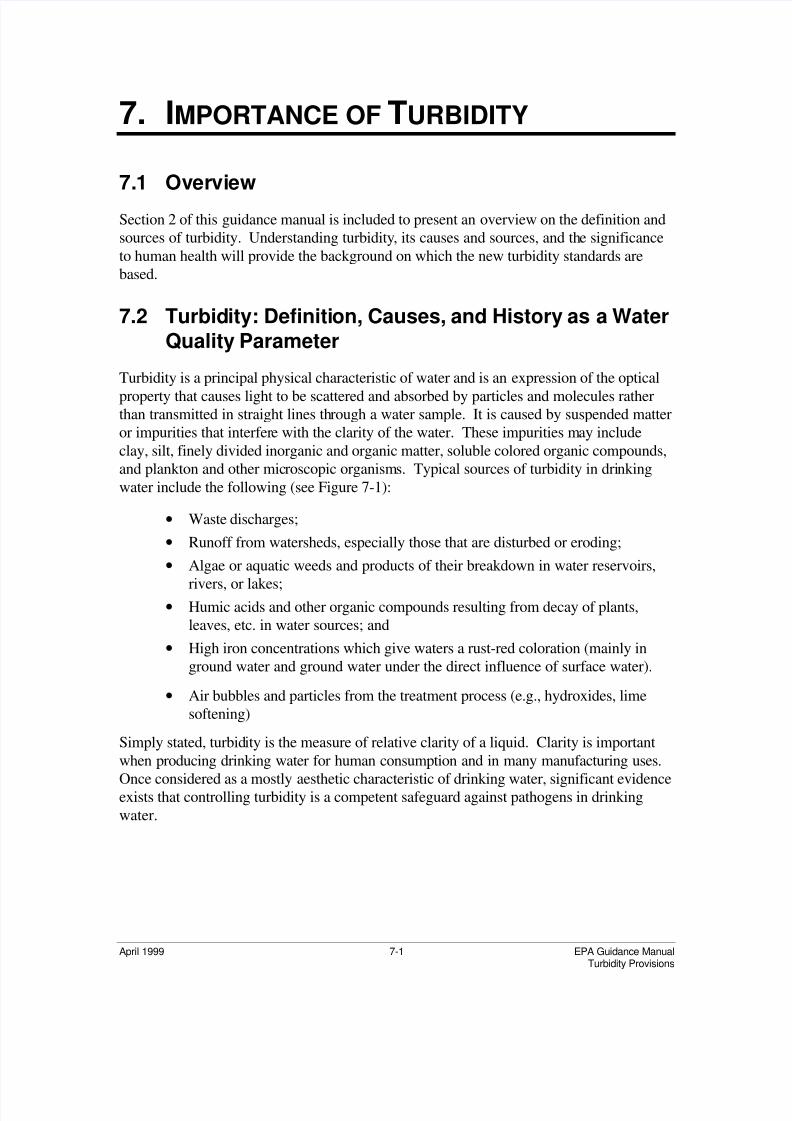
and plankton and other microscopic organisms. Typical sources of turbidity in drinking
water include the following (see Figure 7-1):
• Waste discharges;
• Runoff from watersheds, especially those that are disturbed or eroding;
• Algae or aquatic weeds and products of their breakdown in water reservoirs,
rivers, or lakes;• Humic acids and other organic compounds resulting from decay of plants,
leaves, etc. in water sources; and
• High iron concentrations which give waters a rust-red coloration (mainly in
ground water and ground water under the direct influence of surface water).
• Air bubbles and particles from the treatment process (e.g., hydroxides, lime
softening)
Simply stated, turbidity is the measure of relative clarity of a liquid. Clarity is important
when producing drinking water for human consumption and in many manufacturing uses.
Once considered as a mostly aesthetic characteristic of drinking water, significant evidenceexists that controlling turbidity is a competent safeguard against pathogens in drinking
water.
8/7/2019 IMPORTANCE OF TURBIDITY
http://slidepdf.com/reader/full/importance-of-turbidity 2/13
7. I MPORTANCE OF T URBIDITY
EPA Guidance Manual 7-2 April 1999Turbidity Provisions
Figure 7-1. Typical Sources of Turbidity in Drinking Water
The first practical attempts to quantify turbidity date to 1900 when Whipple and Jackson
developed a standard suspension fluid using 1,000 parts per million (ppm) of
diatomaceous earth in distilled water (Sadar, 1996). Dilution of this reference suspensionresulted in a series of standard suspensions, which were then used to derive a ppm-silica
scale for calibrating turbidimeters.
The standard method for determination of turbidity is based on the Jackson candle
turbidimeter, an application of Whipple and Jackson's ppm-silica scale (Sadar, 1996). The
Jackson candle turbidimeter consists of a special candle and a flat-bottomed glass tube
(Figure 7-2), and was calibrated by Jackson in graduations equivalent to ppm of
suspended silica turbidity. A water sample is poured into the tube until the visual image of
the candle flame, as viewed from the top of the tube, is diffused to a uniform glow. When
the intensity of the scattered light equals that of the transmitted light, the image
disappears; the depth of the sample in the tube is read against the ppm-silica scale, and
turbidity was measured in Jackson turbidity units (JTU). Standards were prepared from
materials found in nature, such as Fuller's earth, kaolin, and bed sediment, making
consistency in formulation difficult to achieve.

8/7/2019 IMPORTANCE OF TURBIDITY
http://slidepdf.com/reader/full/importance-of-turbidity 3/13
7. I MPORTANCE OF T URBIDITY
April 1999 7-3 EPA Guidance ManualTurbidity Provisions
Source: Sadar, 1996.
Figure 7-2. Jackson Candle Turbidimeter
Eye
Scattered Light is asIntense as TransmittedLight-Image of FlameDisappears at this Depth
Scattered Light
Scattered Light Weak-Transmitted Light Strong
Length of ArrowProportional to Intensityof Beam of Light
8/7/2019 IMPORTANCE OF TURBIDITY
http://slidepdf.com/reader/full/importance-of-turbidity 4/13
7. I MPORTANCE OF T URBIDITY
EPA Guidance Manual 7-4 April 1999Turbidity Provisions
In 1926, Kingsbury and Clark discovered formazin, which is formulated completely of
traceable raw materials and drastically improved the consistency in standards formulation.
Formazin is a suitable suspension for turbidity standards when prepared accurately by
weighing and dissolving 5.00 grams of hydrazine sulfate and 50.0 grams of
hexamethylenetetramine in one liter of distilled water. The solution develops a white hue
after standing at 25EC for 48 hours. A new unit of turbidity measurement was adopted
called formazin turbidity units (FTU).
Even though the consistency of formazin improved the accuracy of the Jackson Candle
Turbidimeter, it was still limited in its ability to measure extremely high or low turbidity.
More precise measurements of very low turbidity were needed to define turbidity in
samples containing fine solids. The Jackson Candle Turbidimeter is impractical for this
because the lowest turbidity value on this instrument is 25 JTU. The method is also
cumbersome and too dependent on human judgement to determine the exact extinction
point.
Indirect secondary methods were developed to estimate turbidity. Several visual
extinction turbidimeters were developed with improved light sources and comparison
techniques, but all were still dependent of human judgement. Photoelectric detectors
became popular since they are sensitive to very small changes in light intensity. These
methods provided much better precision under certain conditions, but were still limited in
ability to measure extremely high or low turbidities.
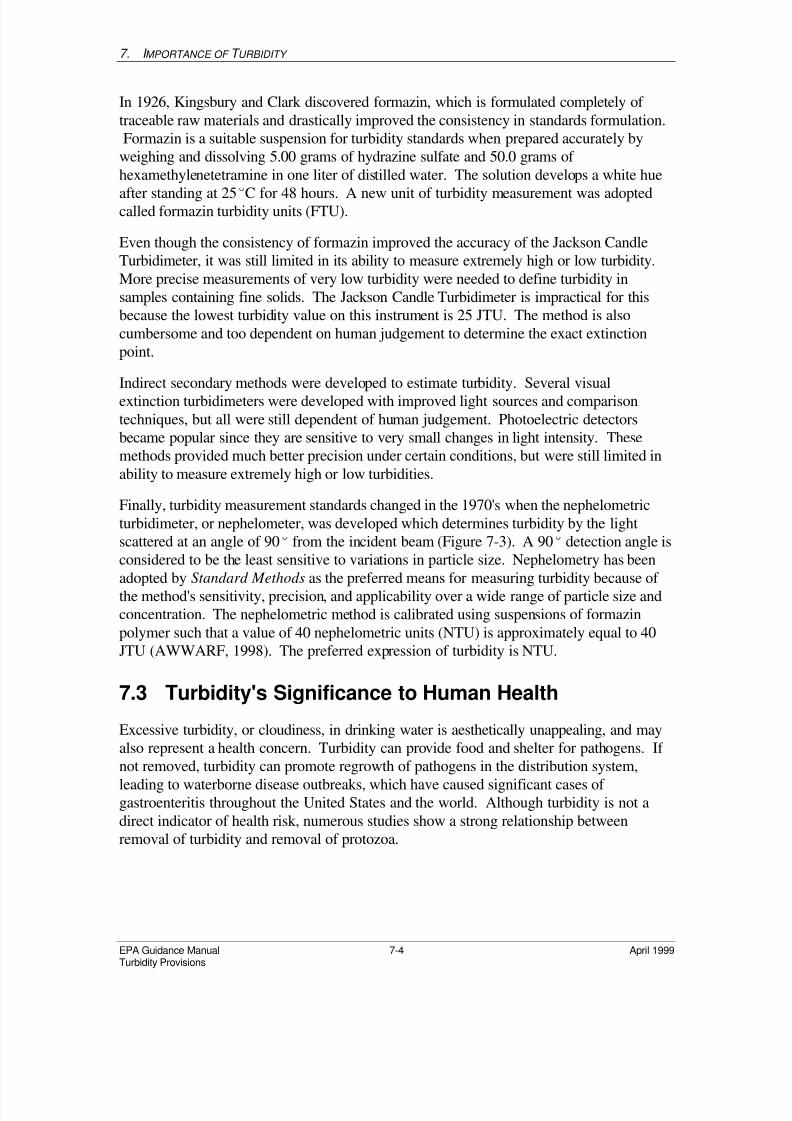
Finally, turbidity measurement standards changed in the 1970's when the nephelometric
turbidimeter, or nephelometer, was developed which determines turbidity by the light
scattered at an angle of 90E from the incident beam (Figure 7-3). A 90E detection angle is
considered to be the least sensitive to variations in particle size. Nephelometry has been
adopted by Standard Methods as the preferred means for measuring turbidity because of
the method's sensitivity, precision, and applicability over a wide range of particle size and
concentration. The nephelometric method is calibrated using suspensions of formazin
polymer such that a value of 40 nephelometric units (NTU) is approximately equal to 40
JTU (AWWARF, 1998). The preferred expression of turbidity is NTU.
7.3 Turbidity's Significance to Human Health
Excessive turbidity, or cloudiness, in drinking water is aesthetically unappealing, and may
also represent a health concern. Turbidity can provide food and shelter for pathogens. If
not removed, turbidity can promote regrowth of pathogens in the distribution system,
leading to waterborne disease outbreaks, which have caused significant cases of gastroenteritis throughout the United States and the world. Although turbidity is not a
direct indicator of health risk, numerous studies show a strong relationship between
removal of turbidity and removal of protozoa.
8/7/2019 IMPORTANCE OF TURBIDITY
http://slidepdf.com/reader/full/importance-of-turbidity 5/13
7. I MPORTANCE OF T URBIDITY
April 1999 7-5 EPA Guidance ManualTurbidity Provisions
Source: Sadar, 1996; photo revised by SAIC, 1998.
Figure 7-3. Nephelometric Turbidimeter
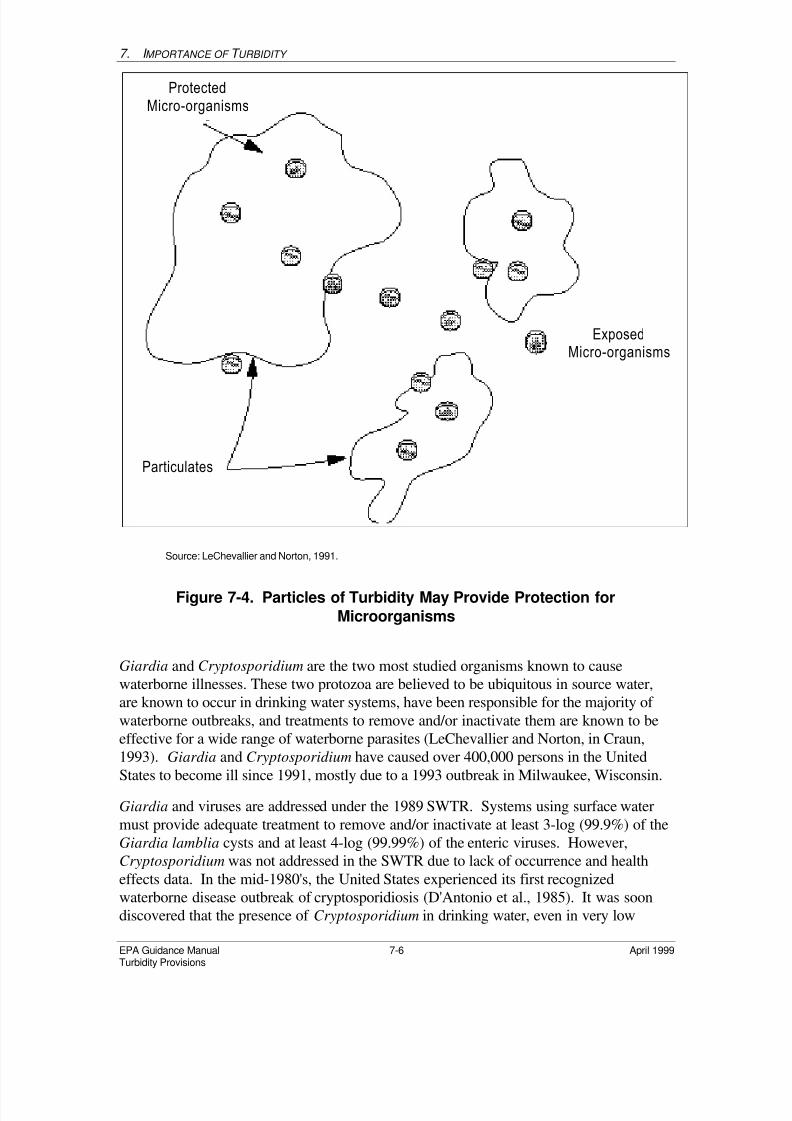
The particles of turbidity provide “shelter” for microbes by reducing their exposure to
attack by disinfectants (Figure 7-4). Microbial attachment to particulate material or inert
substances in water systems has been documented by several investigators (Marshall,
1976; Olson et al., 1981; Herson et al., 1984) and has been considered to aid in microbe
survival (NAS, 1980). Fortunately, traditional water treatment processes have the abilityto effectively remove turbidity when operated properly.
7.3.1 Waterborne Disease Outbreaks
Notwithstanding the advances made in water treatment technology, waterborne pathogens
have caused significant disease outbreaks in the United States and continue to pose a
significant problem. Even in developed countries, protozoa have been identified as the
cause of half of the recognized waterborne outbreaks (Rose et al., 1991). The most
frequently reported waterborne disease in the United States is acute gastrointestinal
illness, or gastroenteritis (Huben, 1991). The symptoms for this disease include fever,
headache, gastrointestinal discomfort, vomiting, and diarrhea. Gastroenteritis is usuallyself-limiting, with symptoms lasting one to two weeks in most cases. However, if the
immune system is suppressed, as with the young, elderly and those suffering from HIV or
AIDS, the condition can be very serious and even life threatening. The causes are usually
difficult to identify but can be traced to various viruses, bacteria, or protozoa.
Lamp Lens Aperture
GlassSample Cell
Detector
TransmittedLight
90°° ScatteredLight
8/7/2019 IMPORTANCE OF TURBIDITY
http://slidepdf.com/reader/full/importance-of-turbidity 6/13
7. I MPORTANCE OF T URBIDITY
EPA Guidance Manual 7-6 April 1999Turbidity Provisions
Source: LeChevallier and Norton, 1991.
Figure 7-4. Particles of Turbidity May Provide Protection for
Microorganisms
Giardia and Cryptosporidium are the two most studied organisms known to cause
waterborne illnesses. These two protozoa are believed to be ubiquitous in source water,
are known to occur in drinking water systems, have been responsible for the majority of
waterborne outbreaks, and treatments to remove and/or inactivate them are known to be
effective for a wide range of waterborne parasites (LeChevallier and Norton, in Craun,
1993). Giardia and Cryptosporidium have caused over 400,000 persons in the United
States to become ill since 1991, mostly due to a 1993 outbreak in Milwaukee, Wisconsin.
Giardia and viruses are addressed under the 1989 SWTR. Systems using surface water
must provide adequate treatment to remove and/or inactivate at least 3-log (99.9%) of the
Giardia lamblia cysts and at least 4-log (99.99%) of the enteric viruses. However,
Cryptosporidium was not addressed in the SWTR due to lack of occurrence and health
effects data. In the mid-1980's, the United States experienced its first recognized
waterborne disease outbreak of cryptosporidiosis (D'Antonio et al., 1985). It was soon
discovered that the presence of Cryptosporidium in drinking water, even in very low
ExposedMicro-organisms
ProtectedMicro-organisms
Particulates
8/7/2019 IMPORTANCE OF TURBIDITY
http://slidepdf.com/reader/full/importance-of-turbidity 7/13
7. I MPORTANCE OF T URBIDITY
April 1999 7-7 EPA Guidance ManualTurbidity Provisions
concentrations, could be a significant health hazard (Gregory, 1994). In 1993, a major
outbreak of cryptosporidiosis occurred even though the system was in full compliance
with the SWTR. Several outbreaks caused by this pathogen have been reported (Smith et
al., 1988; Hayes at al., 1989; Levine and Craun, 1990; Moore et al., 1993; Craun, 1993).
The ESWTR's primary focus is to establish treatment requirements to further address
public health risks from pathogen occurrence, and in particular, Cryptosporidium.
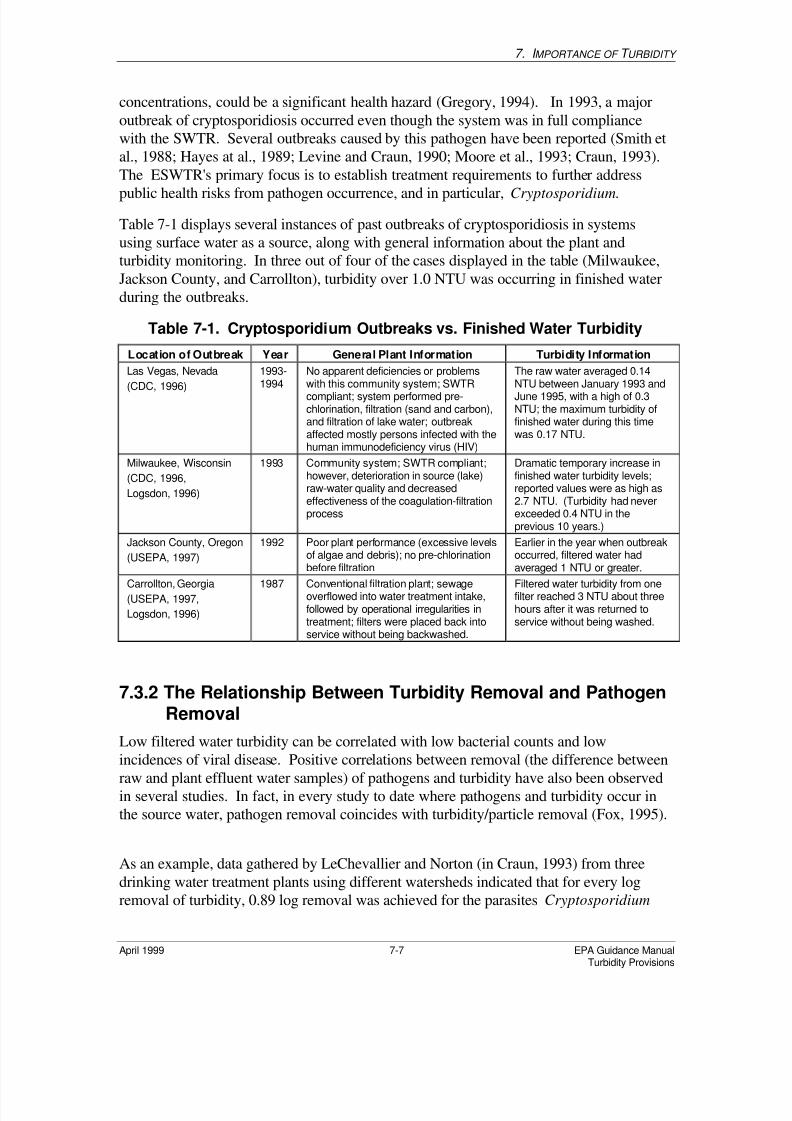
Table 7-1 displays several instances of past outbreaks of cryptosporidiosis in systems
using surface water as a source, along with general information about the plant and
turbidity monitoring. In three out of four of the cases displayed in the table (Milwaukee,
Jackson County, and Carrollton), turbidity over 1.0 NTU was occurring in finished water
during the outbreaks.
Table 7-1. Cryptosporidium Outbreaks vs. Finished Water Turbidity
Location of Outbreak Year General Plant Information Turbidity Information
Las Vegas, Nevada
(CDC, 1996)
1993-1994
No apparent deficiencies or problemswith this community system; SWTR
compliant; system performed pre-chlorination, filtration (sand and carbon),and filtration of lake water; outbreakaffected mostly persons infected with thehuman immunodeficiency virus (HIV)
The raw water averaged 0.14NTU between January 1993 and
June 1995, with a high of 0.3NTU; the maximum turbidity offinished water during this timewas 0.17 NTU.
Milwaukee, Wisconsin
(CDC, 1996,
Logsdon, 1996)
1993 Community system; SWTR compliant;however, deterioration in source (lake)raw-water quality and decreasedeffectiveness of the coagulation-filtrationprocess
Dramatic temporary increase infinished water turbidity levels;reported values were as high as2.7 NTU. (Turbidity had neverexceeded 0.4 NTU in theprevious 10 years.)
Jackson County, Oregon
(USEPA, 1997)
1992 Poor plant performance (excessive levelsof algae and debris); no pre-chlorinationbefore filtration
Earlier in the year when outbreakoccurred, filtered water hadaveraged 1 NTU or greater.
Carrollton, Georgia(USEPA, 1997,
Logsdon, 1996)
1987 Conventional filtration plant; sewageoverflowed into water treatment intake,followed by operational irregularities intreatment; filters were placed back intoservice without being backwashed.
Filtered water turbidity from onefilter reached 3 NTU about threehours after it was returned toservice without being washed.
7.3.2 The Relationship Between Turbidity Removal and PathogenRemoval
Low filtered water turbidity can be correlated with low bacterial counts and low
incidences of viral disease. Positive correlations between removal (the difference between
raw and plant effluent water samples) of pathogens and turbidity have also been observedin several studies. In fact, in every study to date where pathogens and turbidity occur in
the source water, pathogen removal coincides with turbidity/particle removal (Fox, 1995).
As an example, data gathered by LeChevallier and Norton (in Craun, 1993) from three
drinking water treatment plants using different watersheds indicated that for every log
removal of turbidity, 0.89 log removal was achieved for the parasites Cryptosporidium

8/7/2019 IMPORTANCE OF TURBIDITY
http://slidepdf.com/reader/full/importance-of-turbidity 8/13
7. I MPORTANCE OF T URBIDITY
EPA Guidance Manual 7-8 April 1999Turbidity Provisions
and Giardia (Figures 7-5 and 7-6). Of course, this exact relationship does not hold for all
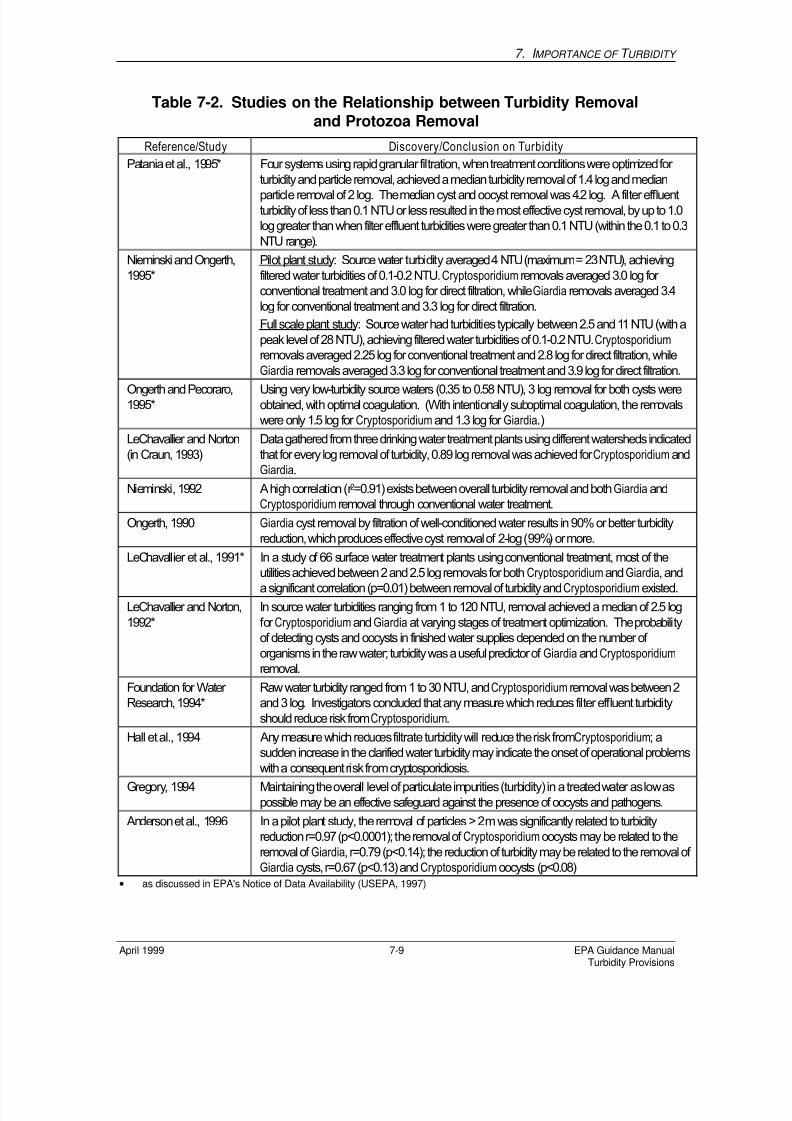
treatment plants. Table 7-2 lists several other studies in addition to LeChevallier and
Norton's, and their conclusions on the relationship of turbidity to protozoan removal.
All studies in Table 7-2 show turbidity as a useful predictor of parasite removal efficiency.
This evidence suggests that although a very low turbidity value does not completely
ensure that particles are absent, it is an excellent measure of plant optimization to ensure
maximum public health protection.
Source: LeChevallier and Norton, 1991.
Figure 7-5. Relationship Between Removal of Giardia and Turbidity
Source: LeChevallier and Norton, 1991.
Figure 7-6. Relationship Between Removal of Cryptosporidium and
Turbidity
Log Removal Turbid ity
lo Y = 0.892 lo x + 0.694
r = 0.780
Log Removal Giardia
5
4
3
2
1
0
-1-1.0 0.0 1.0 2.0 3.0 4.0
Lo Removal Turbidit
Log R
emoval Cryptosporidium
4.0
3.0
2.1
1.1
0.1
-0.9
-1.0 0.0 1.0 2.0 3.0 4.0
logY = 0.996(logx ) + 0.494
r = 0.771
8/7/2019 IMPORTANCE OF TURBIDITY
http://slidepdf.com/reader/full/importance-of-turbidity 9/13
7. I MPORTANCE OF T URBIDITY
April 1999 7-9 EPA Guidance ManualTurbidity Provisions
Table 7-2. Studies on the Relationship between Turbidity Removal
and Protozoa Removal
Reference/Study Discovery/Conclusion on Turbidity
Patania et al., 1995* Four systems using rapid granular filtration, when treatment conditions were optimized for
turbidity and particle removal, achieved a median turbidity removal of 1.4 log and median
particle removal of 2 log. The median cyst and oocyst removal was 4.2 log. A filter effluentturbidity of less than 0.1 NTU or less resulted in the most effective cyst removal, by up to 1.0
log greater than when filter effluent turbidities were greater than 0.1 NTU (within the 0.1 to 0.3
NTU range).
Nieminski and Ongerth,
1995*
Pilot plant study: Source water turbidity averaged 4 NTU (maximum = 23 NTU), achieving
filtered water turbidities of 0.1-0.2 NTU. Cryptosporidium removals averaged 3.0 log for
conventional treatment and 3.0 log for direct filtration, whileGiardia removals averaged 3.4
log for conventional treatment and 3.3 log for direct filtration.
Full scale plant study: Source water had turbidities typically between 2.5 and 11 NTU (with a
peak level of 28 NTU), achieving filtered water turbidities of 0.1-0.2 NTU.Cryptosporidium
removals averaged 2.25 log for conventional treatment and 2.8 log for direct filtration, while
Giardia removals averaged 3.3 log for conventional treatment and 3.9 log for direct filtration.
Ongerth and Pecoraro,1995*
Using very low-turbidity source waters (0.35 to 0.58 NTU), 3 log removal for both cysts wereobtained, with optimal coagulation. (With intentionally suboptimal coagulation, the removals
were only 1.5 log for Cryptosporidium and 1.3 log for Giardia.)
LeChavallier and Norton
(in Craun, 1993)
Data gathered from three drinking water treatment plants using different watersheds indicated
that for every log removal of turbidity, 0.89 log removal was achieved for Cryptosporidium and
Giardia.
Nieminski, 1992 A high correlation (r 2=0.91) exists between overall turbidity removal and bothGiardia and
Cryptosporidium removal through conventional water treatment.
Ongerth, 1990 Giardia cyst removal by filtration of well-conditioned water results in 90% or better turbidity
reduction, which produces effective cyst removal of 2-log (99%) or more.
LeChavallier et al., 1991* In a study of 66 surface water treatment plants using conventional treatment, most of the
utilities achieved between 2 and 2.5 log removals for both Cryptosporidium andGiardia, and
a significant correlation (p=0.01) between removal of turbidity andCryptosporidium existed.LeChavallier and Norton,
1992*
In source water turbidities ranging from 1 to 120 NTU, removal achieved a median of 2.5 log
for Cryptosporidium andGiardia at varying stages of treatment optimization. The probability
of detecting cysts and oocysts in finished water supplies depended on the number of
organisms in the raw water; turbidity was a useful predictor of Giardia andCryptosporidium
removal.
Foundation for Water
Research, 1994*
Raw water turbidity ranged from 1 to 30 NTU, andCryptosporidium removal was between 2
and 3 log. Investigators concluded that any measure which reduces filter effluent turbidity
should reduce risk fromCryptosporidium.
Hall et al., 1994 Any measure which reduces filtrate turbidity will reduce the risk fromCryptosporidium; a
sudden increase in the clarified water turbidity may indicate the onset of operational problems
with a consequent risk from cryptosporidiosis.
Gregory, 1994 Maintaining the overall level of particulate impurities (turbidity) in a treated water as low aspossible may be an effective safeguard against the presence of oocysts and pathogens.
Anderson et al., 1996 In a pilot plant study, the removal of particles > 2 m was significantly related to turbidity
reduction r=0.97 (p<0.0001); the removal of Cryptosporidium oocysts may be related to the
removal of Giardia, r=0.79 (p<0.14); the reduction of turbidity may be related to the removal of
Giardia cysts, r=0.67 (p<0.13) andCryptosporidium oocysts (p<0.08)
• as discussed in EPA's Notice of Data Availability (USEPA, 1997)
8/7/2019 IMPORTANCE OF TURBIDITY
http://slidepdf.com/reader/full/importance-of-turbidity 10/13
7. I MPORTANCE OF T URBIDITY
EPA Guidance Manual 7-10 April 1999Turbidity Provisions
7.4 References
1. Anderson, W.L., et al. 1996. “Biological Particle Surrogates for Filtration
Performance Evaluation.”
2. CDC (Centers for Disease Control). 1996. “Surveillance for Waterborne-Disease
Outbreaks - United States, 1993-1994.” Morbidity and Mortality Weekly Report ,
45(SS-1).
3. D'Antonio, R.G., R.E. Winn, J.P. Taylor, et al. 1985. “A Waterborne Outbreak of
Cryptosporidiosis in Normal Hosts.” Annals of Internal Medicine. 103:886-888.
4. Fox, K.R. 1995. “Turbidity as it relates to Waterborne Disease Outbreaks.”
Presentation at M/DBP Information Exchange, Cincinnati, Ohio. AWWA white
paper.
5. Gregory, J. 1994. “Cryptosporidium in Water: Treatment and Monitoring
Methods.” Filtration & Separation. 31:283-289.
6. Hall, T., J. Presdee, and E. Carrington. 1994. “Removal of Cryptosporidium oocysts
by water treatment processes.” Foundation for Water Research.
7. Herson, D.S., D.R. Marshall, and H.T. Victoreen. 1984. “Bacterial persistence in
the distribution system.” J. AWWA. 76:309-22.
8. LeChevallier, M.W., W.D. Norton, and R.G. Lee. 1991. “Giardia and
Cryptosporidium in Filtered Drinking Water Supplies.” Applied and Environmental
Microbiology. 2617-2621.
9. LeChevallier, M.W. and W.D. Norton. 1992. “Examining Relationships Between
Particle Counts and Giardia, Cryptosporidium, and Turbidity.” J. AWWA.
10. LeChevallier, M.W. and W.D. Norton. “Treatments to Address Source WaterConcerns: Protozoa.” Safety of Water Disinfection: Balancing Chemical and
Microbial Risks. G.F. Craun, editor. ILSI Press, Washington, D.C.
11. Marshall, K.C. 1976. Interfaces in microbial ecology. Harvard University Press,
Cambridge, MA.
12. NAS (National Academy of Sciences). 1980. National Research Council: drinking
water and health, Volume 2. National Academy Press, Washington, D.C.
13. Nieminski, E.C. 1992. “Giardia and Cryptosporidium - Where do the cysts go.”
Conference proceedings, AWWA Water Quality Technology Conference.
14. Olson, B.H., H.F. Ridgway, and E.G. Means. 1981. “Bacterial colonization of mortar-lined and galvanized iron water distribution mains.” Conference proceedings,
AWWA National Conference. Denver, CO.
15. Ongerth, J.E. 1990. “Evaluation of Treatment for Removing Giardia Cysts.” J.
AWWA. 82(6):85-96.
16. Sadar, M.J. 1996. Understanding Turbidity Science. Hach Company Technical
Information Series - Booklet No. 11.
8/7/2019 IMPORTANCE OF TURBIDITY
http://slidepdf.com/reader/full/importance-of-turbidity 11/13
7. I MPORTANCE OF T URBIDITY
April 1999 7-11 EPA Guidance ManualTurbidity Provisions
17. USEPA. 1997. Occurrence Assessment for the Interim Enhanced Surface Water
Treatment Rule, Final Draft . Office of Ground Water and Drinking Water,
Washington, D.C.
18. USEPA. 1983. Turbidity Removal for Small Public Water Systems. Office of
Ground Water and Drinking Water, Washington, D.C.

8/7/2019 IMPORTANCE OF TURBIDITY
http://slidepdf.com/reader/full/importance-of-turbidity 12/13
7. I MPORTANCE OF T URBIDITY
EPA Guidance Manual 7-12 April 1999Turbidity Provisions
THIS PAGE INTENTIONALLY LEFT BLANK
8/7/2019 IMPORTANCE OF TURBIDITY
http://slidepdf.com/reader/full/importance-of-turbidity 13/13
7. I MPORTANCE OF T URBIDITY
April 1999 7-13 EPA Guidance ManualTurbidity Provisions
7. IMPORTANCE OF TURBIDITY........................................................................................................7-1
7.1 OVERVIEW.............................................................................................................................................7-1
7.2 TURBIDITY: DEFINITION, CAUSES, AND HISTORY AS A WATER QUALITY PARAMETER.....................7-1
7.3 TURBIDITY'S SIGNIFICANCE TO HUMAN HEALTH ................................................................................7-4
7.3.1 Waterborne Disease Outbreaks..................................................................................................7-5
7.3.2 The Relationship Between Turbidity Removal and Pathogen Removal....................................7-7
7.4 REFERENCES .......................................................................................................................................7-10
Figure 7-1. Typical Sources of Turbidity in Drinking Water ............................................................................7-2
Figure 7-2. Jackson Candle Turbidimeter..........................................................................................................7-3
Figure 7-3. Nephelometric Turbidimeter...........................................................................................................7-5
Figure 7-4. Particles of Turbidity May Provide Protection for Microorganisms...............................................7-6
Figure 7-5. Relationship Between Removal of Giardia and Turbidity.............................................................7-8
Figure 7-6. Relationship Between Removal of Cryptosporidium and Turbidity ..............................................7-8
Table 7-1. Cryptosporidium Outbreaks vs. Finished Water Turbidity..............................................................7-7Table 7-2. Studies on the Relationship between Turbidity Removal and Protozoa Removal..........................7-9


![Eckart Meiburg Modeling Gravity and Turbidity …...from turbidity current deposits plays an important role in oil and gas exploration [8]. From an engineering point of view, turbidity](https://img.pdfslide.net/doc/110x75/5f961f0fa181290f0d1b531d/eckart-meiburg-modeling-gravity-and-turbidity-from-turbidity-current-deposits.jpg)