Embed Size (px)
Citation preview

Importing, Accessing and Handling Data
Charles E. Noon, Ph.D.The University of Tennessee
Session Overview
Types of information to assemble within a GIS Methods for importing data A walk-through example of importing, geo-locating, and editing data A reinforcing exercise Descriptive Analysis

Types of Information to Assemble within a GIS
Internal Information
External Foreground Information
External Background Information

Types of Information to Assemble within a GIS
1. External Background Information: the part of the system you don’t own and can’t influence.
2. Internal Information: the part of the system you own or directly work with.
3. External Foreground Information: the part of the system you don’t own or directly work with, yet is very relevant to your organization .
OperationalApplication
StrategicPlanning
Application

External Background Information
Geo-political boundaries, landmarks, common-use transportation systems.
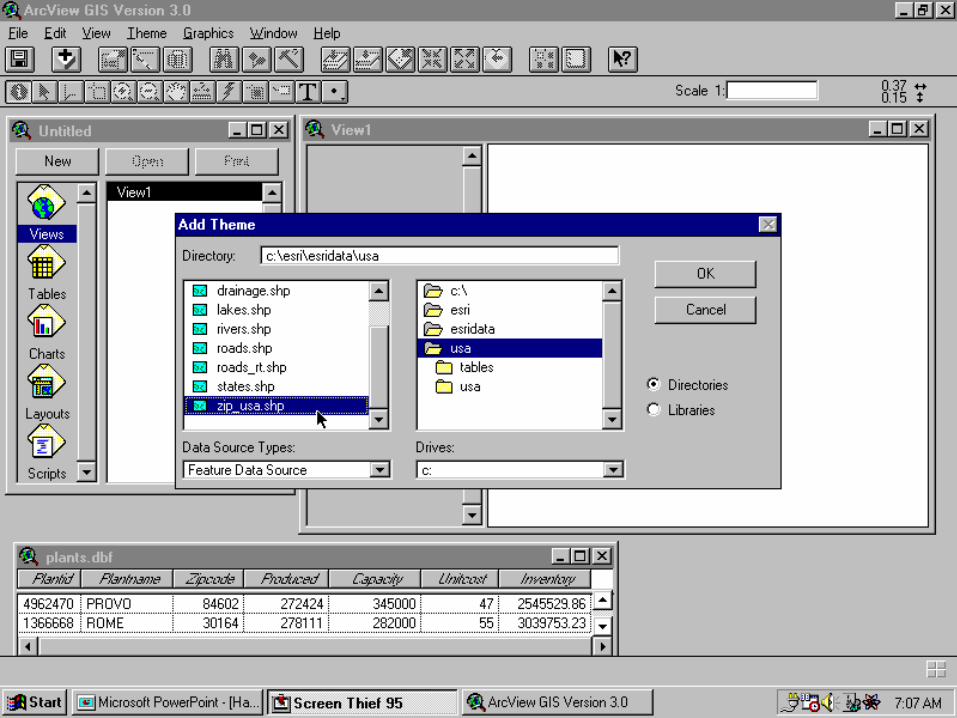
Such data can be found on data disks that accompany GIS software packages.
Importing it is usually easy. In ArcView use View-Add Theme.


Internal Information
Any data found within your MIS, LIS, financial system, WMS, purchasing system, ERP, or any transaction-based IS.
Ease of obtaining such data is organization-specific and depends on: – IS infrastructure– IS culture (sometimes require AOG)

External Foreground Information
Examples: – potential customers– current and potential competitors– potential partners
Wide range in difficulty to obtain such data: – Some public via “phone books”– Some can be purchased as demographic or
business databases– Some may be provided by potential partners
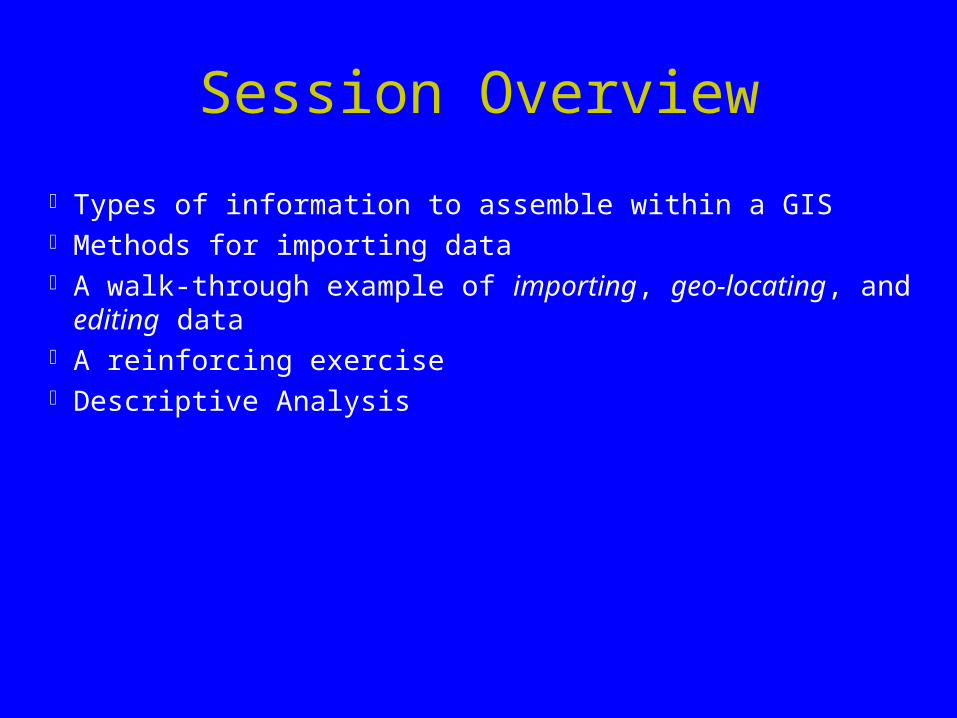
RITE AID Mileage Histogram
18 18 18 2011 14
0
10
20
30
40
Under50
51 to100
101 to150
151 to200
201 to250
Over250
Mileage Intervals
Per
cen
t o
f S
tore
s
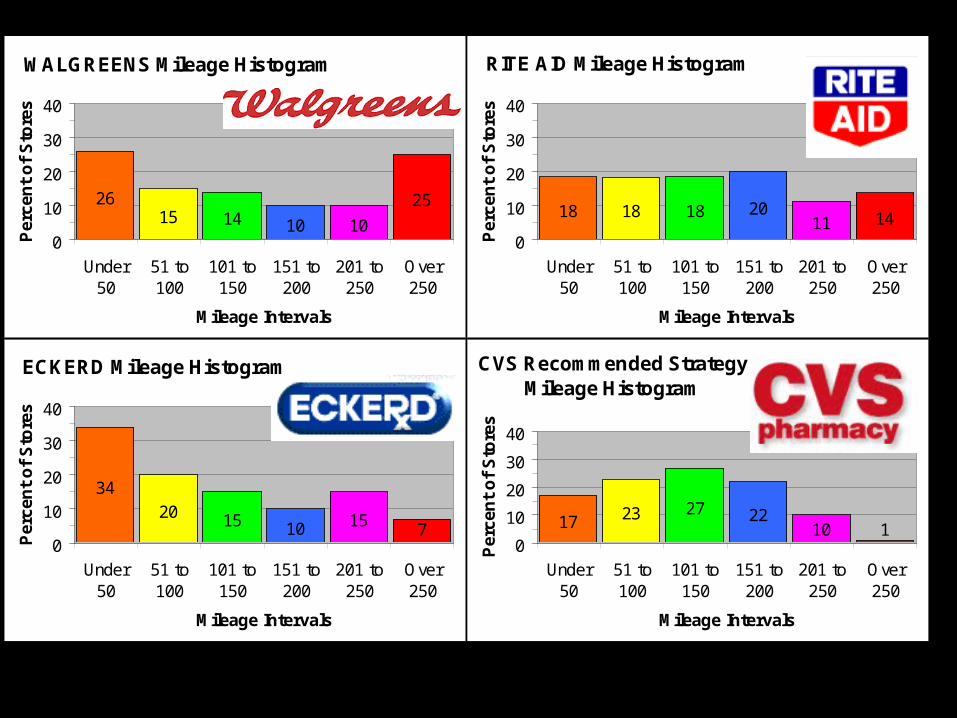
ECKERD Mileage Histogram
34
20 15 10 15 70
10
20
30
40
Under50
51 to100
101 to150
151 to200
201 to250
Over250
Mileage Intervals
Per
cen
t o
f S
tore
s
RITE AID Mileage Histogram
18 18 18 2011 14
0
10
20
30
40
Under50
51 to100
101 to150
151 to200
201 to250
Over250
Mileage Intervals
Per
cen
t o
f S
tore
s
WALGREENS Mileage Histogram
2615 14 10 10
25
0
10
20
30
40
Under50
51 to100
101 to150
151 to200
201 to250
Over250
Mileage Intervals
Per
cen
t o
f S
tore
s
CVS Recommended StrategyMileage Histogram
17 23 27 2210 1
0
10
20
30
40
Under50
51 to100
101 to150
151 to200
201 to250
Over250
Mileage Intervals
Per
cen
t o
f S
tore
s


Getting Data into a GIS Principle:
– there might be a lot of data associated with an entity (for example, a DC), but that entity has just one location. Make sure each entity has a data element that will allow it to be geographically located.
5-digit zipcode city/state street address latitude/longitude other codes

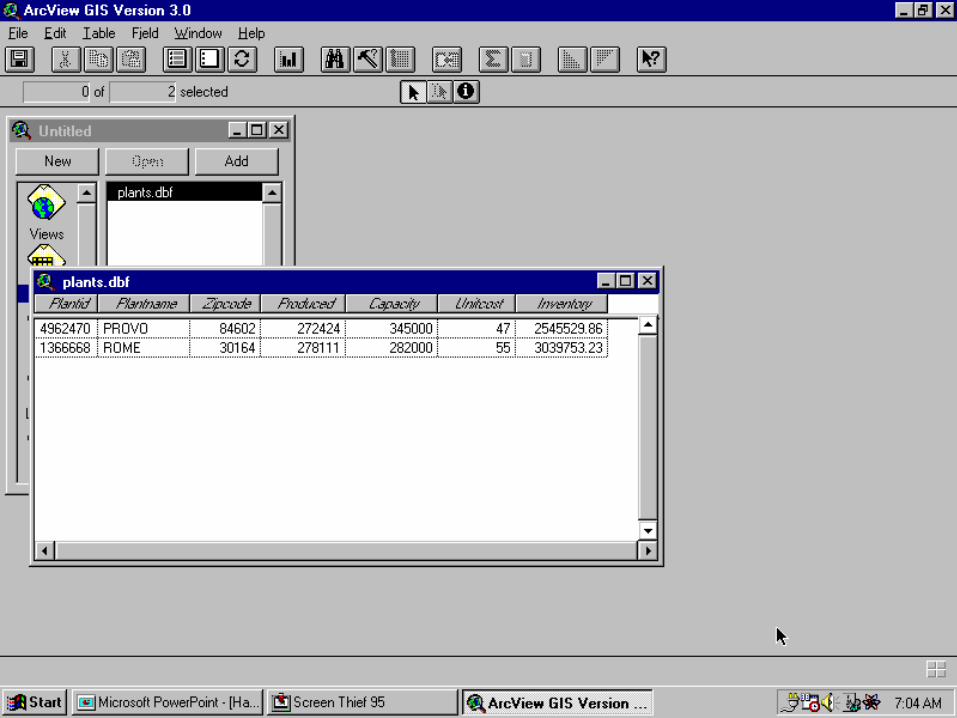
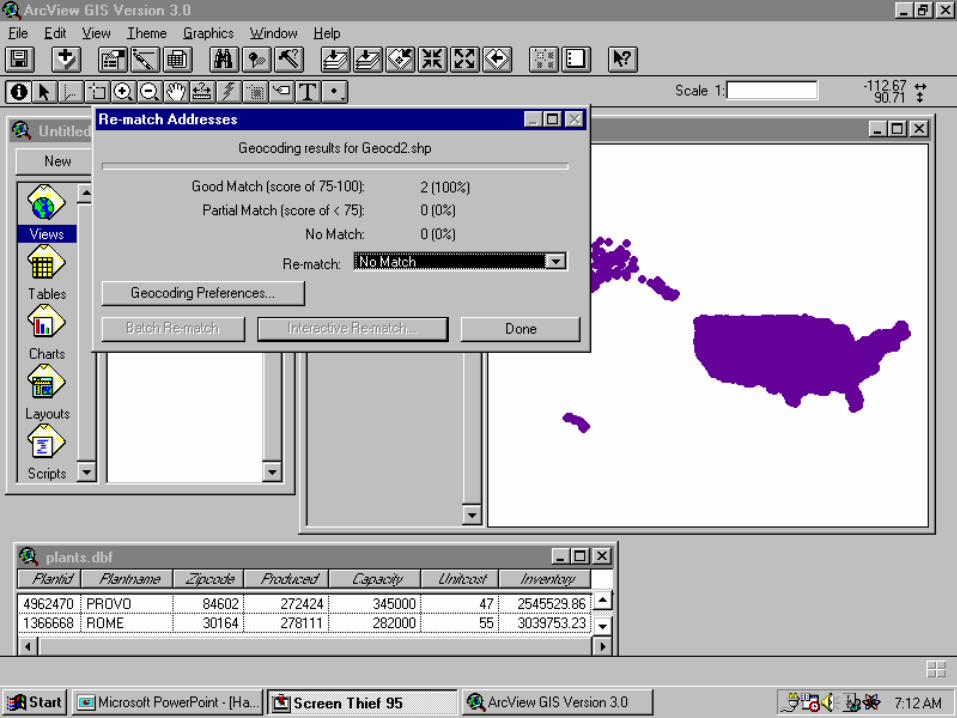
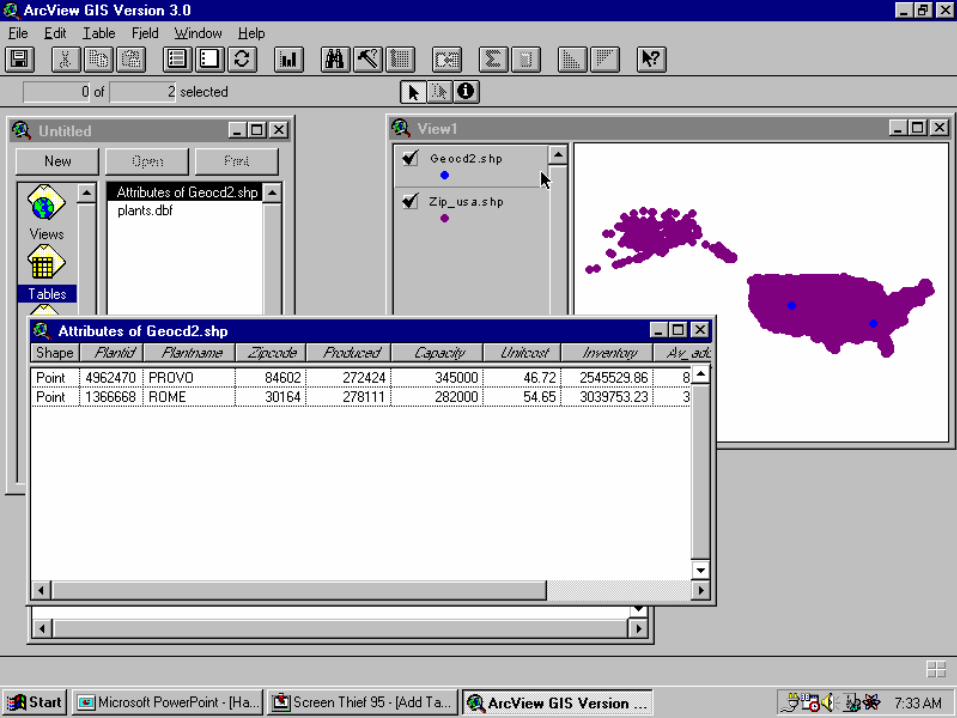
Example: Information for 2 plantsPlant Name PROVO ROMELocation UTAH GEORGIAZipcode 84602 30164Plant ID 4962470 1366681997 units produced 272,424 278,111Unit Cost $46.72 $54.65Capacity (units) 345,000 282,000Value of Inventory $2,545,529.86 $3,039,753.23

Getting Data into a GIS Principle:
– there might be a lot of data associated with an entity (for example, a DC), but that entity has just one location. Make sure each entity has a data element that will allow it to be geographically located.
5-digit zipcode city/state street address latitude/longitude other codes
Data can be pulled or pushed into a GIS

Ways to Pull Data into a GIS
SQL (Sequential Query Language) ODBC R/3 interface SDE (Spatial Database Engine) RPC (Remote Process Call) Informix Datablade

Various Paths to Push Data into a GIS
GPS
Spread Sheet
DBMS
DBF file
Other formats
GIS
Data Table

Various Paths to Push Data into a GIS
GPS
Spread Sheet
DBMS
DBF file
Other formats
GIS
Data Table

Each row corresponds to an entity location


Various Paths to Push Data into a GIS
GPS
Spread Sheet
DBMS
DBF file
Other formats
GIS
Data Table

With the Tables icon selected, hit Add button.


Various Paths to Push Data into a GIS
GPS
Spread Sheet
DBMS
DBF file
Other formats
GIS
Data Table

The selected theme will be the reference theme.

How to Edit Data in a Table
Manually editing of existing data.
Adding a new data field.
Adding a field whose value is a function of other data fields.


It will add the formula into whatever field is selected.


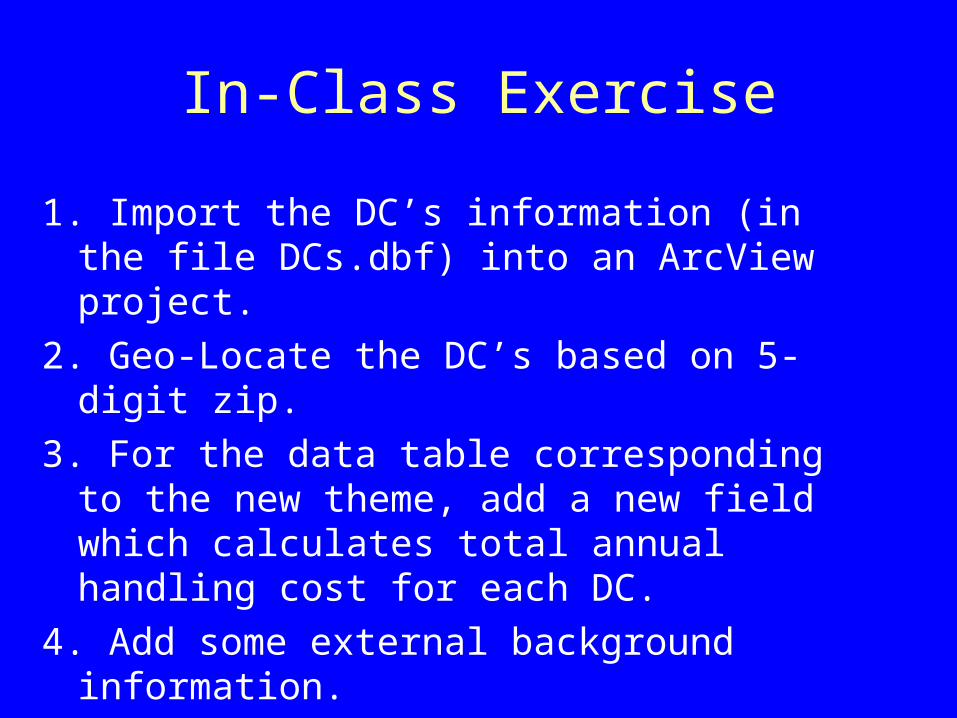
In-Class Exercise
1. Import the DC’s information (in the file DCs.dbf) into an ArcView project.
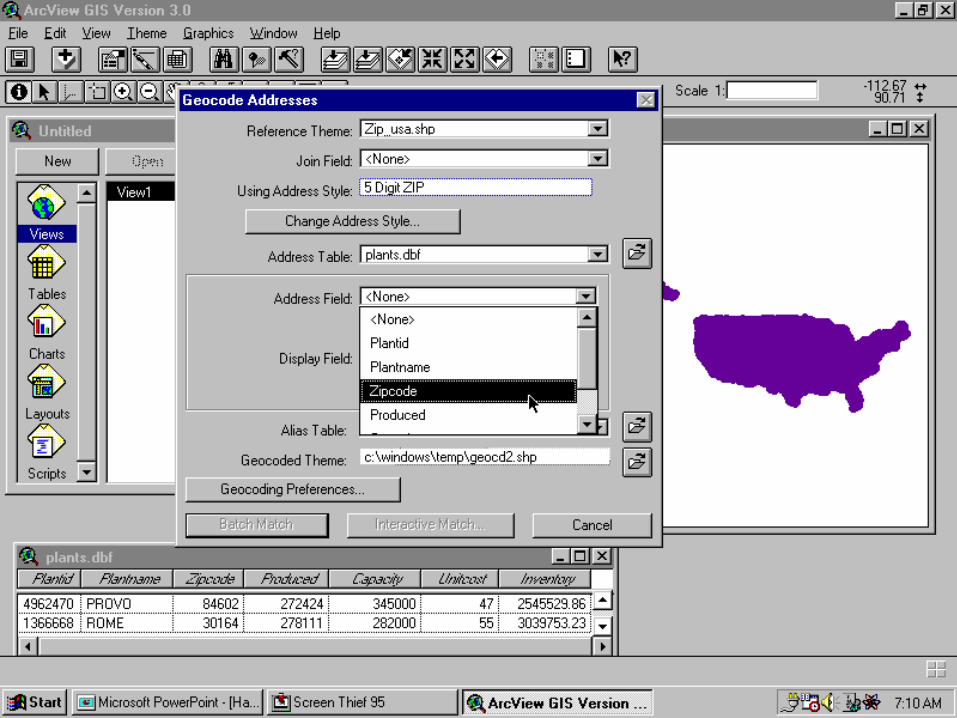
2. Geo-Locate the DC’s based on 5-digit zip.
3. For the data table corresponding to the new theme, add a new field which calculates total annual handling cost for each DC.
4. Add some external background information.