Embed Size (px)
Citation preview


Worshop Organisers
• Bedir Tekinerdoğan (Contact), University of Twente • Yasemin Topaloğlu, Ege University • Semih Çetin, Cybersoft • Tunç Torosdağlı, Milsoft • Mehmet Akşit, University of Twente
Program Committee
• Naci Akkök, University of Oslo • Turgay Aytaç, Logo Business Solutions • Ali Doğru, ODTÜ • Oğuz Dikenelli, Ege Üniversitesi • Uğur Doğrusöz, Bilkent Üniversitesi • Yenal Göğebakan, Cybersoft • Alpay Karagoz, Bilgi Grubu, Ankara, Turkey • Halil Şengonca, Ege Üniversitesi
Sponsoring
Ege University, Department of Computer Engineerin İzmir, Türkey

TABLE OF CONTENTS
Light vs. Heavy Which to Choose? ……………………………………………………………………………6 P. Tortamış, Cybersoft
Paradigm and Software Engineering ………………………………………………………………………..10 E. Göktürk & N. Akkök, University of Oslo
Quality for Components: Component and Component-based Software Quality Issues ……………….18 Y. Altınel & M.R. Tolun, İstanbul Kültür Üniversitesi
Refining Compositional Structure Using the N2 Chart for Identifying Components and Design Patterns in Component-Based Systems …………………………..23 N. Akkök & E. Göktürk. University of Oslo
Real Life Experience - How to Develop CMMI Processes?.................................................................29 O. Kalaycı, Nitelik Danışmanlık S. Dinmez, H. Kiraz, O. Yilmazkurt, G. Mutlu, V. Sevincok. BIMAR
Real Life Experience - Using CMMI L2 Processes and XP Practices …………………………………..43 O. Kalaycı. Nitelik Danışmanlık S. Dinmez, E. Saygın, S. Ferhatoğlu, G. Akgün, S. Bolat, H. Özkeser. BIMAR
Real Life Experience – XP Practice: First Test then Coding……………………………………………...51 O. Kalaycı. Nitelik Danışmanlık Ş. Bolat, H. Özkeser. BIMAR
Experiences from Teaching PSP……………………………………………………………………….………58 N. Alpay Karagöz & A. Yıldız. Bilgi Grubu
Lighthouse: A Practical Quality Management Information System ……………………………….……..64 Özgür Tüfekçi, Cybersoft
Managing Variability in Product Line Scoping using Design Space Models …………………………...69 B. Tekinerdoğan & M. Akşit. University of Twente
Software Project Management with Usage of Metrics………………………………………..…………….77 C. Bozkurt & T. Menteş. Delta Aerospace
3

4
IMPROQ 2004: Impact of Software Process on Quality
It is generally accepted that software process has an impact on the quality of the software product. In parallel with this, there is an ongoing debate what the structure of a process should look like to improve the required quality factors. Conventional software processes and the corresponding process improvement criteria such as for example as defined by the Capability Maturity Model (CMM) and Software Process Improvement and Capability Determination model (SPICE), have focused on an increased formalization of the process elements in order to control the process as much as possible. In contrast, the last years agile processes have been introduced that aim to reduce the large amount of documents, rules, notations and tools to deliver software faster. Both camps have claimed that their adopted process is delivering software with higher quality.
An increasing number of researchers and practitioners now share the view that instead of debating on a particular process the focus should be rather on the identification of the important project parameters that are necessary to decide on the appropriate process. As such several researchers have proposed to combine plan-based and agile methods, while others have focused on process modeling and method engineering techniques in order to develop a customized process for the given project parameters.
In this workshop we did not focus on a particular process or process improvement model but were primarily interested in the relation between the process elements and their impact on the specific quality factors such as reusability, adaptability and maintainability. This workshop was a follow-up to the first IMPROQ workshop that has been held at Bilkent University (Turkey) in June 2003.
This workshop took 2 days in which we tried to provide a more thorough understanding of the domain and the related research goals. The first day primarily focused on paper presentations and the most fundamental problems. The second day was oriented towards finding solutions and defining the research setting for the coming years.
There were around 70 participants to the workshop, from which around half of them were from industry. More than half of the papers are from industry. Besides of an academic research area this shows that the topic has currently a primary interest in industry. We hope that we have stimulated further research on the relation between processes and the software quality factors.
The organization of this workshop would not have been possible without the help of many people. We would like to thank the members of the program committee for helping us in reviewing the submitted papers. Further, we would like to thank all the participants of the workshop who actively participated to the group discussions and the panel discussions. Finally, we are grateful for the department of computer engineering at the Ege University for their active support and the sponsoring of the workshop.
September 22, 2004
Bedir Tekinerdoğan, University of Twente
Yasemin Topaloğlu, Ege University Semih Çetin, Cybersoft
Tunç Torosdağlı, Milsoft Mehmet Akşit, University of Twente
5

Light vs. Heavy: Which To Choose?
Pınar Işıl Tortamış
Cybersoft Enformasyon Teknolojileri Ltd. Şti. [email protected]
Abstract The methodology applied by an organization is a social platform that includes the roles, skills, teaming, activities, techniques, deliverables, standards, habits and culture of the organization as it develops software. There are several software development methodologies in use today, and the list grows fast. Some companies have their own customized methodologies for developing their applications, while others simply use the ones that known and used by a large community. However, people speak nowadays frequently about two kinds of methodologies: heavyweight and lightweight. Heavyweight methodologies are generally considered the traditional way to develop the software. These methodologies approach development in a requirements-design-build paradigm with standard, well-defined processes that organizations improve continuously. Lightweight methodologies employ short iterative cycles, and rely on tacit knowledge within a team as opposed to documentation. The aim of this paper is to conduct a literature survey and to give an idea about when and under which conditions to use these methodologies in software development process as a result of this survey. 1. Introduction We can characterize the formal, disciplined software engineering methodologies as "heavy" - not only in terms of the weight of the paper documentation they require to produce, but also in terms of the degree of management effort, quality assurance reviews, and rigid procedures that developers should follow. Heavy methodologies require defining and documenting a stable set of requirements at the beginning of a project. They assume that the customer knows the requirements at the beginning and they will not change. These methodologies also have another assumption that fixing the errors costs high. A light methodology, also known as agile methodology, is less structured. It provides guidance and boundaries, whereas a heavy methodology dictates every activity and documentation in detail.
Light methodologies produce frequent increments to already functioning software (monthly, weekly or even daily). The lessons learned from each increment are applied to future increments as well. They offer generative rules over inclusive rules, which break down quickly in a dynamic environment. According to [3], what is new about the agile methods is not the practices they use, but their recognition of people as the primary drivers of the project success, coupled with an intense focus on effectiveness and maneuverability. Since there are clear differences between light and heavy methodologies, several factors involve in determining the relative suitability of light or heavy methodologies in a particular project situation. 2. Factors Affecting Methodology Since heavy and light methodologies look like the opposite corners of the methodologies, people usually think that they have to select one of them at a time. The major factors to select a methodology can be classified into three categories. These categories are project size, people and risk. First, the software methodology must be chosen according to the project size. Project budget, duration and project team organization are the main key factors in this category. Second, people play an important role in methodology decision. The skill and the experience of project team directly affect the type of methodology to choose. Since light methodologies involve the customer as part of the team, customer’s adaptability also designates the methodology. How organization adapts to changes or change itself is also an essential issue when settling a methodology. And finally, risks also have an effect on choosing the methodology. Project’s methodology is selected considering project’s criticality, technology used and frequency of changes in the requirements. Now, let’s examine how these factors affect methodology decision and which one is suitable under what conditions. 2.1. Project Size Factors
6
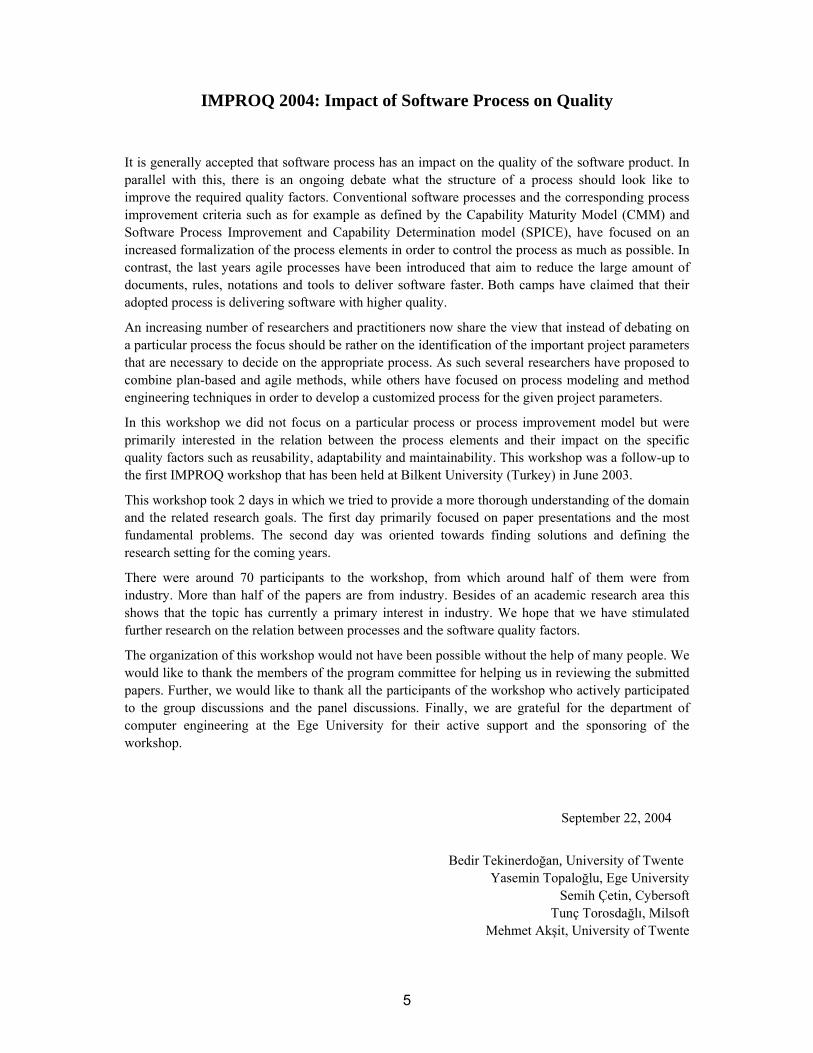
Project size can be defined in terms of the budget, duration and required team size. Due to this definition, it can be concluded that the larger team or more budget you need, the bigger the project is. Thus, when the project team size is getting bigger, the requirement is getting up that you need a heavyweight methodology. Because more people require more coordination and heavyweight methodologies support this by providing plans, documentation and processes for better communication and coordination across large groups. However, a bureaucratic, plan-driven organization is not going to be very efficient on small projects. Figure 1 [4] depicts that for a given problem size, fewer people are needed if a lighter methodology is used, and more people are needed if a heavier methodology is used. It also claims that there is a limit to the size of problem that can be solved with a given number of people. That limit is higher for a large team using a heavier methodology than for a small team using a lighter methodology.
Figure 1. Problem size and methodology
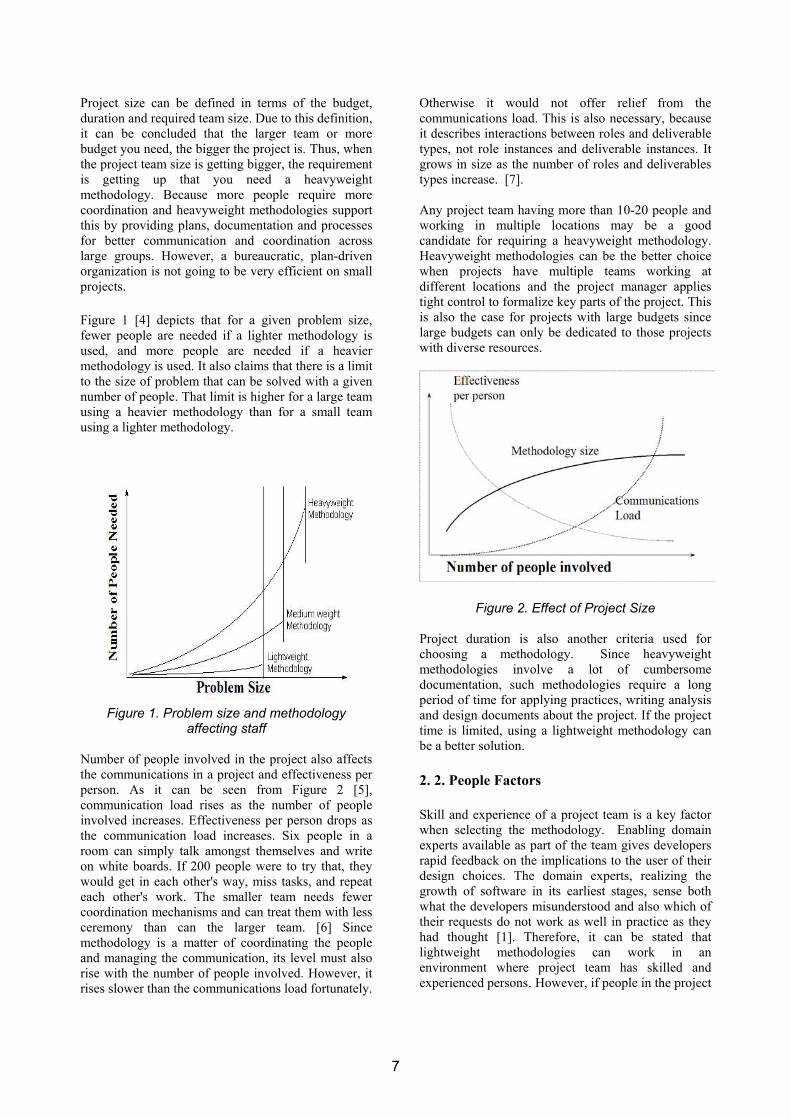
affecting staff Number of people involved in the project also affects the communications in a project and effectiveness per person. As it can be seen from Figure 2 [5], communication load rises as the number of people involved increases. Effectiveness per person drops as the communication load increases. Six people in a room can simply talk amongst themselves and write on white boards. If 200 people were to try that, they would get in each other's way, miss tasks, and repeat each other's work. The smaller team needs fewer coordination mechanisms and can treat them with less ceremony than can the larger team. [6] Since methodology is a matter of coordinating the people and managing the communication, its level must also rise with the number of people involved. However, it rises slower than the communications load fortunately.
Otherwise it would not offer relief from the communications load. This is also necessary, because it describes interactions between roles and deliverable types, not role instances and deliverable instances. It grows in size as the number of roles and deliverables types increase. [7]. Any project team having more than 10-20 people and working in multiple locations may be a good candidate for requiring a heavyweight methodology. Heavyweight methodologies can be the better choice when projects have multiple teams working at different locations and the project manager applies tight control to formalize key parts of the project. This is also the case for projects with large budgets since large budgets can only be dedicated to those projects with diverse resources.
Figure 2. Effect of Project Size
Project duration is also another criteria used for choosing a methodology. Since heavyweight methodologies involve a lot of cumbersome documentation, such methodologies require a long period of time for applying practices, writing analysis and design documents about the project. If the project time is limited, using a lightweight methodology can be a better solution. 2. 2. People Factors Skill and experience of a project team is a key factor when selecting the methodology. Enabling domain experts available as part of the team gives developers rapid feedback on the implications to the user of their design choices. The domain experts, realizing the growth of software in its earliest stages, sense both what the developers misunderstood and also which of their requests do not work as well in practice as they had thought [1]. Therefore, it can be stated that lightweight methodologies can work in an environment where project team has skilled and experienced persons. However, if people in the project
7

team are not qualified enough, results of applying lightweight methodologies will be a potential failure. Customer adaptability in the project team is also a great factor. In an adaptive process the customer has much control over the software development process. At every iteration, customer gets the power both to check progress and to alter the direction of the software development. At the end customer gets closer relationship with the software developers, s/he becomes as a member of the software development team. In extreme programming (XP), which is an example of lightweight methodology, customers involve in writing user stories to collect the software requirements. Light methodologies bring the project team and the customer together as one extended team. This level of engagement is not for every customer organization, as well as nor for every software developer [2]. If you cannot gain that level of commitment from your customer, many of the other aspects of the light methodology will likely suffer. In some software processes, customers may not be qualified enough to work with software developers, they may slow down the process instead of speeding up work done. So, in this kind of projects, using lightweight methodologies will potentially end up with a nightmare. Last factor that may be important when choosing a methodology is the culture of an organization. An organization management and culture dictate how it improves, changes, adapts etc. If the organization is not responsive to changes enough or even rejects them entirely, decision of using lightweight methodology will be nonsense. Since agility means being responsive or flexible within a defined context, organizations have to adopt adaptability towards changes as their culture if they want to apply lightweight methodologies. Solid organizations that have many rules and procedures cannot be successful when applying lightweight methodologies. 2.3. Risk Factors Project criticality and the frequency of changes in the requirements are the main risk factors in the development of a software process. If a project is critical, i.e. more damage results from an undetected defect, a heavyweight methodology has to be used to control all phases of the project. The damage from a latent failure in software to control an atomic power plant is much greater than software to calculate the difference between annual income and expenses of a company. Accordingly, the methodology used to build the power plant software can afford to be much more laborious and expensive, if the added expense reduces defects. Therefore heavyweight methodologies will be a better solution for critical projects.
Frequency of changes in requirements can be resolved with applying lightweight methodologies. Lightweight methodologies do not try to answer the question “how to stop change early in a project” but they try to answer the question “how to better handle inevitable changes throughout its life cycle”. They recommend a variety of practices for constant feedback on technical decisions, customer requirements, and management constraints [3]. In projects where requirements are known from the beginning and do not change frequently, the use of heavyweight methodologies will be an answer. Another risk factor is the technology used in the software development process. If the technology is brand new or already used in a few projects, applying a heavy methodology will be better for that case. With every new technology, there is always a probability that something may go wrong, but applying a heavy methodology will try to solve this problem by preparing alternative at the very beginning. Another reason is that using a new technology requires experienced people working in the development process; hence this is more suitable in lightweight case. 3. Conclusion In this study, the literature survey has been accomplished to select a methodology for software development process depending on some criteria. Both heavy and light methodologies have their advantages and disadvantages. Therefore the one a project manager chooses depends on her/his needs. In the overall, it can be understood that every project requires its own type of methodology and different methodologies are needed depending on project factors, people factors and risk factors. Basically it looks like "use the right tool for the right job", to which the qualifier can be added, "and that is appropriate to your constraints.” The key to success is finding the right balance between the two methodologies, which will vary from project to project according to circumstances and risks involved. 4. References [1] Cockburn A, Highsmith J, “The People Factor”, Software Management, November 2001, pp. 131-133 [2] Fowler M., “The New Methodology”, available at http://www.martinfowler.com/articles/newMethodology.html [3] Cockburn A, Highsmith J, “Agile Software Development: The Business Of Innovation”, Computer34 (9), pp. 120-122
8

[4] Cockburn A, “The Methodology Space”, available at http://alistair.cockburn.us/crystal/articles/ms/methodologyspace.htm [5] Cockburn A, “A Methodology Per Project”, available at http://alistair.cockburn.us/crystal/articles/mpp/methodologyperproject.html [6] Cockburn, A., "Learning From Agile Software Development - Part One" CrossTalk Oct. 2002: 10-14. [7] Harrison N, Coplien J, "Patterns of productive software organizations", Bell Labs Technical Journal, 1996, pp. 138-145
9

Paradigm and Software Engineering
Erek Göktürk Information Design Group,
Dept. of Informatics, University of Oslo, Norway.
M. Naci Akkøk Information Design Group,
Dept. of Informatics, University of Oslo, Norway.
Abstract The word paradigm is used, defined and re-defined in many disciplines (including software engineering) to the degree that its meaning has become overloaded and hence vague. In this paper, we look at its various meanings and offer a working definition for use in software engineering. We also offer an explanation of the role of paradigm in software engineering, claiming that the choice of model-ing/design paradigm has profound effects on the quality of both the software process and its product. We propose that paradigms be reified into artifacts and consciously used to improve software development, and recommend that more emphasis be put towards understanding their nature in depth.
Keywords Software Engineering – software engineering paradigms – software quality – process improvement.
1. Introduction The last decades witnessed a proliferation of the use of the term paradigm in connection with many fields, resulting also in the proliferation of its definitions. Software Engineer-ing is one of the fields that use the term extensively. Views like one paradigm being better than the other are not un-common in software engineering, where the yardstick of comparison is often relative improvements in the process by which software is produced, implying also relative im-provements in the quality of the software produced.
One issue in using the term paradigm in relation to its ef-fects on the software development process and/or software quality is obvious: when a term has as many different defin i-tions as the term paradigm has, the term is most likely not well defined. Even when we assume one specific definition, there is still an issue: the exact effect of choosing a specific paradigm upon the software engineering process or the resulting software is neither empirically studied, nor cogni-tively grounded, and not even theoretically or philosophi-cally defined.
In this paper, we try to remedy the situation first by ex-tracting a plausible definition for the concept of a paradigm through looking at the term’s various definitions as well as its history of use in general and in software engineering in particular. We then reason through to its potential role in software engineering, essentially formulating hypotheses related to why and how a paradigm influences the process and product of software engineering. We conclude by sug-gesting that a paradigm may intentionally be reified into an artifact of software development and used consciously to amplify its positive (potential) effects upon the software engineering process. We claim that turning the paradigm into a concrete software engineering artifact consciously will also facilitate evaluating its actual effects within a pro-ject and across software engineering projects.
2. What is “Paradigm”? An etymological analysis shows us that the word comes from the Latin word ‘paradigma’, and appears in Greek as ‘paradeigma’, whose English translation is ‘example’, or as its earlier form ‘paradeiknunai’. The prefix ‘para-‘ meaning ‘alongside’, and ‘deiknunai’ meaning ‘to show,’ so the two words together sound as ‘alongside shown’ or ‘what shows itself beside’ [1].
2.1 Tracing the Meaning Back in History The word “paradigm” surely escaped from the laboratory of philosophers, mostly due to the fact that its meaning was vague. Plato and Aristotle are the oldest sources who have left written discussions that include aspects of the nature of exemplary relations and the example, the paradigm. Agam-ben [1] reports work of Victor Goldschmidt [2], in which Goldschmidt discusses that the paradigmatic relation in the context of Plato’s works is not of inductive nature, and works between a singular example, the paradigm, and the object class that the paradigm makes intelligible. Aristotle, in Rhetoric [3] 1356b, states that the paradigm is different from both deduction, which goes from the universal to the particular, and induction, which goes from particular to the universal, in that the paradigm (example) goes from the par-
10
ticular to particular. Aristotle further states that the relation-ship between the paradigm and the class of objects is an anti-symmetric one, the paradigm being more “knowable” than the objects it gets compared to.
To give an example to this notion of paradigm, and how its conception might differ from person to person, think of the most typical kind of cheese for you. we guess many of us, in some point of our lives, have been confronted by a kind of an edible substance which was claimed to be a kind of “cheese” as well, yet was out of our conception of cheese, that is our typical cheese and the class generated by it. It’s only more astonishing to see that this imaginary conception of the typical cheese kind gets twisted to in-clude the new kind of cheese if we like it and choose to re-gard it as “cheese”, and each person has his/her conception of what is cheese, a personal cheese paradigm. The cheese paradigm is what we use to define the class, but it, as itself, isn’t an element of it. This human dependency of the “para-digm” appears as a recurrent theme, sometimes even re-garded as the intangible aspects of it.
The concepts of example and analogies were not a very favorite concept among the philosophers up until the 20 th century. The words entered to the popular vocabulary through the works of Michel Foucault, and more promi-nently through works of Thomas Kuhn.
Unlike Foucault, who uses the term paradigm but never defines it, Kuhn uses the word paradigm in explaining his thoughts on the philosophy of science, and attempts at the following definition [4]:
Achievements that share these two characteristics (de-scribed in the previous paragraph as being “sufficiently unprecedented to attract an enduring group of adher-ents away from competing modes of scientific activity” and being “sufficiently open-ended to leave all sorts of problems for the redefined group of practitioners to re-solve”) I shall henceforth refer to as ‘paradigms’… By choosing it, I mean to suggest that some accepted ex-amples of actual scientific practice –examples which in-clude law, theory, application, and instrumentation to-gether– provide models from which spring particular co-herent traditions of scientific research.
The word paradigm is used in many meanings in his book, but this definition of paradigm got so immediately popular-ized and applied onto everything with virtually every mean-ing that seem closer enough (!) to this definition, that even Kuhn himself admitted that his usage of the word was vague, suggested the word exemplar instead of the word paradigm and suggested an elaboration of the meaning. Among other reasons, its popularization is also connected to the fact that the paradigm in Kuhnian sense provides the external justification, a strong excuse for not being rigorous. This can especially be observed in social sciences: the be-
longing to a group of people with similar research and world view, which can be named as working in a particular para-digm, is all that’s enough to immediately justify or argue for the presuppositions to build research upon.
When we take a look closer to the Kuhnian sense of the word paradigm, we can see that his definition virtually bonded it with only one of its specific philosophical appli-cation, thereby narrowing the meaning of the word para-digm to a specific paradigmatic relationship. What he calls paradigms in science are just the typical singularities (exam-ples) in the ways of pra cticing science. Since everybody has a personal way of practicing science, these examples that Kuhn calls paradigms are paradigms (examples) that define categories over this set of personal attitudes towards science, by being typical elements of these categories. Thus suggestion of the word exemplar and his original use of the word paradigm by Kuhn himself is far from being an arb i-trary naming, but is an act of referring and relating to a known concept.
If one looks up the meaning of the word ‘paradigm’ from a dictionary, one of the meanings turns out to be “a model”. An interesting question is how this meaning appeared and became attributed to the word paradigm. The answer most probably lies in its being implied both in Fo ucault’s and Kuhn’s work. To give an example, in the works of Foucault, the panopticon of Jeremy Bentham, which is an architectural surveillance machine, not only serves as an historical arti-fact, but also as the a paradigmatic structure, an architec-tural “model” which also can be used for understanding power relations [5]. So one can conjure similarities between various parts of the panopticon and a power structure to analyze it, which implies the panopticon as a model as well. In Kuhn’s work, the paradigm includes the meta-model of the representation tools and models of the subject matter used by a specific scientific community, and the paradigm easily gets confused to be this meta-model, which is actu-ally a part of it from a Kuhnian perspective.
Taking the cheese paradigm example also into account, one observation is that some things that we perceive as paradigms have the properties of a model, but some para-digms do not. What is similar and different between these two notions of paradigm is a question that should be ad-dressed, and also how they relate to each other. This might lead to a model of multi-paradigm structures.
2.2 Paradigm, Ontology, and Epistemology Whether we confine ourselves to the meaning of the word paradigm as a model or not, two subjects of philosophy are related to it: epistemology and ontology. It must also be added that epistemology and ontology themselves are re-lated as well.
11

Many definitions for ontology exist. An exemplar of one category of definitions is the theory or the study of objects and their relationships. Although this definition seems very intuitive and easy to grasp, it’s flawed in its drawing onto an ontological assumption of objects being present. An operational definition that does not refer to objects is that an ontology is a specification of a conceptualization [6]. The fact that this definition also needs to be coupled by the definition of conceptualization makes it clear that defining what is ontology is a very hard task. The ontology seems to be the answer to this question: what is out there?
The question of what is out there can obviously be an-swered by a specification, which depends on the observer with respect to whom “out there” is defined, and the ontol-ogy-maker who constructs the specification. Philosophers take this question as being about what exists in the one and only universe that also includes the observer and the on-tology-maker, and hence become chilled by references to multiple ontologies1, which is a very common expression especially in Artificial Intelligence in which an ontology bases upon what can be representable. But one should also observe that when this concept of what is representable gets applied not to a system but a human, it derives the philosophical point of view, and “an” ontology becomes one attempt at representing “the” ontology.
Whether it’s “the” ontology or “an” ontology, the truth or fidelity of such a representation, and its knowability, is the subject of yet another branch of philosophy which studies knowledge: epistemology. It attempts to answer the basic question: what distinguishes true (adequate) knowl-edge from false (inadequate) knowledge?
Having mentioned the ontology and epistemology, now we may turn back to the question of the relation between the paradigm and the ontology and epistemology. First of all, if ‘paradigm’ is also something out there, it’s definitely a part of ontology in philosophical sense, and an assessment of how much we can know about it would depend on the epistemological stance we might take. If it is a class forma-tion operator, defining a class by being the typical example, then paradigmatic relationships should also be parts of on-tologies, whether “an” or “the”, and should be studied just as much as ‘part-of’ and ‘kind-of’ relationships gets stud-ied. How the paradigm relates to our ability to relate to “adequate” knowledge is another open question.
1 Our thanks goes to Michael Biggs, who was in University
of Hertfordshire, UK at the time this paper was written, who pointed to this “chilling effect” as a feedback for one of the authors’ presentation in CEPHAD’04 conference, Bornholm, Denmark.
2.3 Paradigm Creeps into Computing Kristen Nygaard, one of the fathers of the Simula language and what is today known as the object-oriented paradigm, mentioned more than once that it took about 20 years for the object-oriented paradigm to establish 2, except that there is no mention of the term paradigm from 1967, when SIMULA 67 was introduced [7], and none of his profes-sional acquaintances seem to remember him actually using the term paradigm until much later.
It is difficult to establish the exact date when the term paradigm was first used in software engineering, but it seems it started within the context of Smalltalk [8] rather than Simula around 1972. This is about 2 years after the publication of the revised edition of Kuhn’s work that trig-gered the widespread use of the term paradigm. Thus, it is very likely that the term was first used in its Kuhnian sense in software engineering as well. Alan C. Kay himself refers to the introduction of the “new” computing principles through Smalltalk as “a new Kuhnian paradigm in the same spirit as the invention of the printing press” [9].
This sounds as if we know what paradigm means in the context of software engineering despite the fact that the word has come to have a variety of different meanings in other disciplines. Unfortunately, this doesn’t seem to be the situation. We have searched “software engineering para-digm” in Google (www.google.com), and out of five results in the first ten, we extracted six different meanings, some from how the word paradigm was used, and some as direct definitions: trend [10]; method, procedure, generalization of process [11]; methodology [12]; a technique; the process model (this was actually presented as a definition of the word paradigm) [13]; and an approach to software design and programming (this was also a definition) [14]. Here are some more examples of usage from various papers in the field of computing: “high level paradigm”, “programming paradigm”, “design paradigm”, “object-oriented paradigm”, “constraint satisfaction paradigm”, “probability theory is perhaps the best understood paradigm”, “the paradigms used for temporal reasoning”, “xxx framework enables a new paradigm for Internet services”, “most basic algorithmic paradigms in computational geometry”, “intrusion detection paradigm”, “employee-manager-salary paradigm”3. Obvi-ously some of these fit into the word’s meaning as an exem-plar, model, or its meaning in Kuhnian sense. Such a broad meaning and the use of adjectives as “most basic” or “best understood” to qualify the word paradigm, or the concept
2 Private conversations with Kristen Nygaard. 3 References are not given for brevity, simply search “para-
digm” on http://citeseer.ist.psu.edu/ and look at the first couple of papers.
12
of “enabling a new paradigm” are nevertheless interesting, but the variety suggests a confusion, both for the individ-ual software engineer or designer, and also for the software engineering community.
Thus the question stands: what does “paradigm” mean in the field of Software Engineering? We believe that the an-swer to this question is not so trivial, and we will not at-tempt to give a final all-encompassing definition in this pa-per. It’s the subject of one of our ongoing studies to answer this question and arrive at an inclusive definition of the word “paradigm” based on philosophical and cognitive aspects, which we hope will uncover the essence needed to relate all definitions, or uses of the word. Still, we offer a working definition of paradigm (actually an attitude) that has utility value for software engineering in the next sec-tion.
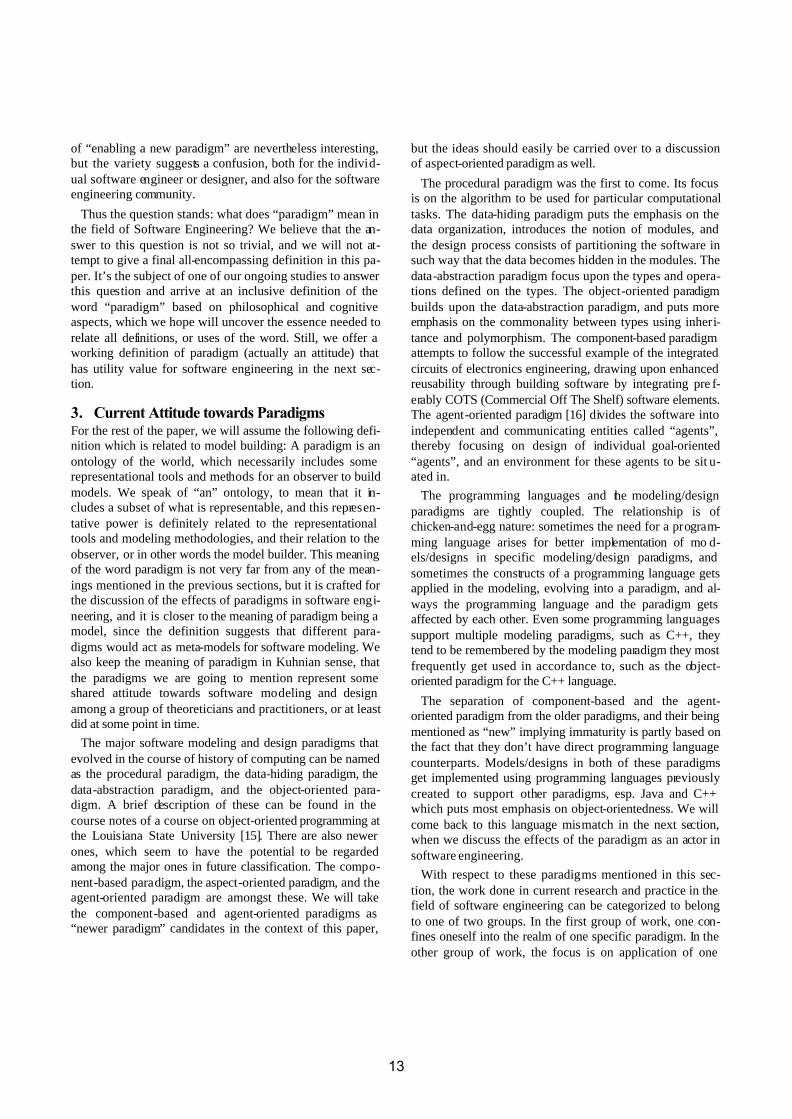
3. Current Attitude towards Paradigms For the rest of the paper, we will assume the following defi-nition which is related to model building: A paradigm is an ontology of the world, which necessarily includes some representational tools and methods for an observer to build models. We speak of “an” ontology, to mean that it in-cludes a subset of what is representable, and this represen-tative power is definitely related to the representational tools and modeling methodologies, and their relation to the observer, or in other words the model builder. This meaning of the word paradigm is not very far from any of the mean-ings mentioned in the previous sections, but it is crafted for the discussion of the effects of paradigms in software engi-neering, and it is closer to the meaning of paradigm being a model, since the definition suggests that different para-digms would act as meta-models for software modeling. We also keep the meaning of paradigm in Kuhnian sense, that the paradigms we are going to mention represent some shared attitude towards software modeling and design among a group of theoreticians and practitioners, or at least did at some point in time.
The major software modeling and design paradigms that evolved in the course of history of computing can be named as the procedural paradigm, the data-hiding paradigm, the data-abstraction paradigm, and the object-oriented para-digm. A brief description of these can be found in the course notes of a course on object-oriented programming at the Louisiana State University [15]. There are also newer ones, which seem to have the potential to be regarded among the major ones in future classification. The compo-nent-based paradigm, the aspect-oriented paradigm, and the agent-oriented paradigm are amongst these. We will take the component-based and agent-oriented paradigms as “newer paradigm” candidates in the context of this paper,
but the ideas should easily be carried over to a discussion of aspect-oriented paradigm as well.
The procedural paradigm was the first to come. Its focus is on the algorithm to be used for particular computational tasks. The data-hiding paradigm puts the emphasis on the data organization, introduces the notion of modules, and the design process consists of partitioning the software in such way that the data becomes hidden in the modules. The data-abstraction paradigm focus upon the types and opera-tions defined on the types. The object-oriented paradigm builds upon the data-abstraction paradigm, and puts more emphasis on the commonality between types using inheri-tance and polymorphism. The component-based paradigm attempts to follow the successful example of the integrated circuits of electronics engineering, drawing upon enhanced reusability through building software by integrating pre f-erably COTS (Commercial Off The Shelf) software elements. The agent-oriented paradigm [16] divides the software into independent and communicating entities called “agents”, thereby focusing on design of individual goal-oriented “agents”, and an environment for these agents to be sit u-ated in.
The programming languages and the modeling/design paradigms are tightly coupled. The relationship is of chicken-and-egg nature: sometimes the need for a program-ming language arises for better implementation of mo d-els/designs in specific modeling/design paradigms, and sometimes the constructs of a programming language gets applied in the modeling, evolving into a paradigm, and al-ways the programming language and the paradigm gets affected by each other. Even some programming languages support multiple modeling paradigms, such as C++, they tend to be remembered by the modeling paradigm they most frequently get used in accordance to, such as the object-oriented paradigm for the C++ language.
The separation of component-based and the agent-oriented paradigm from the older paradigms, and their being mentioned as “new” implying immaturity is partly based on the fact that they don’t have direct programming language counterparts. Models/designs in both of these paradigms get implemented using programming languages previously created to support other paradigms, esp. Java and C++ which puts most emphasis on object-orientedness. We will come back to this language mismatch in the next section, when we discuss the effects of the paradigm as an actor in software engineering.
With respect to these paradigms mentioned in this sec-tion, the work done in current research and practice in the field of software engineering can be categorized to belong to one of two groups. In the first group of work, one con-fines oneself into the realm of one specific paradigm. In the other group of work, the focus is on application of one
13

paradigm onto a modeling/design problem, using the repre-sentational and methodological toolset of another paradigm. This last can especially be easily observed in the case of component-based and agent-oriented paradigms, which lack their supporting programming la nguages and an explicit definition of their respective paradigms, and which then tend to borrow their representational tools for the object-oriented paradigm such as the UML [17]. See also [18] for a discussion of object-oriented paradig m based approaches to representational issues in agent-based software model-ing/design paradigm, and for an attempt to create a repre-sentational tool which would not be based on object-oriented concepts and representational tools. The degree of fitness of object -oriented tools to component-based soft-ware engineering is also discussed in chapter 6 of Akkøk’s doctoral thesis [19].
Both of these approaches, either confinement into one specific paradigm or trying to model/implement one para-digm using the others, do not touch on the concept of the paradigm itself, and can act only as parts of an operational definition for software modeling/design paradigms. What is missing is a theory explaining the nature of paradigms, and it is the absence of which we want to draw attention upon via this paper.
4. Paradigm as an Actor in Software Engineer-ing
Need help in exploring and changing your paradigms for a brighter future? Contact us today!4
Since Kuhn has written his book [4], it has become almost the standard practice for new developments to be intro-duced as the new cure for the blinding effects of the older, more established paradigm, even though Kuhn points to the fact that the lifecycle of a discipline is cyclic, one paradigm following another. Nevertheless, the need for a panacea (the cure of all pains) in any specific discipline is so pressing that, almost as a rule, any new paradigm is regarded as a relief to all (mortal) practitioners and/or theoreticians.
Software engineering is a field no different. If we look into the history (which is only about three-four decades back in case of the every young discipline called software engineer-ing, starting approximately with the NATO software engi-neering conferences [20, 21]), we see that the search for a silver bullet [22, 23] was a constant one, and claimed to be silver bullets all oxidized and vaporized as more experience accumulated on the new paradigm thought at that time to be
4 Taken from the website of a management consultancy
company. Reference is not given, since we don’t want to advertise, but if you do want to find the page and the company, try searching the Web using Google.
as the one, and brand new well polished silver bullets got introduced only to create greater enthusiasm, and only to be pushed aside by newer and newer ones.
One of the most recent (and widely accepted) examples to a “rescuer new paradigm” in software engineering is the object-oriented paradigm, which has been claimed to be the ultimate solution without convincing empirical evidence to that effect. The advertisements for the comp onent -based paradigm seem to be also of a similar attitude, creating something like a deja-vu.
Although the object-oriented paradigm is far from being packed away into the dusty shelves of the history of com-puting, already there exist new paradigms to claim the crown, most notably the component-based paradigm, the aspect-oriented paradigm and the agent-oriented paradigm. We may also note that there exist other approaches, such as agile methods, whose being a paradigm or not is not very clear to the authors. But taking into account that in practic-ing using these three paradigms one uses the representa-tional tools and approaches from other paradigms, espe-cially the object-oriented, it’s tempting to ask the question that given any two so called paradigms, what makes them different? So is the so-called component-based paradigm indeed a different paradigm from the object-oriented? Is there a comparative scale between paradigms, ranging from "can be modeled using one another", as in the case of com-ponent-based and object-oriented, to "inherently different, incompatible"? Furthermore, does or can these relations work only one way: Can one paradigm be modeled via an-other but not vice versa?
For the software modeling/design paradigms, the set of differentiating properties might be found in the relation of the paradigm to the concept of ontology, as discussed in section 2 and exemplified below. This is because software is essentially an executable model, and it is the result of a se-ries of (mechanical and/or mental) transformations of mod-els as suggested in the definitions of the concept of a lan-guage and modeling in sections 5.1 and 1.1 of Akkøk’s work [19] as represented by Figure 1.
The act of modeling starts with a mapping between the elements from “the” ontology, what is out there in the uni-verse, to “an” ontology, the ontology of the model-ing/design paradigm. Thus the paradigm determines what is representable, and how easily. To give an example, one of the reasons why the object-oriented paradigm is so intuitive at first is that humans have the tendency to differentiate objects, yet trying to model everything with objects also create problems, such as the need for reifying some proc-esses. The data-abstraction paradigm maps “the” ontology onto types and operations, the component-based onto components, and agent-based onto agents and communica-tion. Is one paradigm better than other? If we think of the
14

mapping between “the” ontology and the ontology of para-digms, it’s clear that we should expect some paradigms suit some tasks/domains better. It’s an open question to find which paradigms relate to what kind of tasks, and how to assess the suitableness.
If one paradigm suits one task better than others and supposing we have the grounds to claim such a normative statement, what about complex tasks, constituent tasks of which might require multiple paradigms? A solution to this combination of paradigms might be “by modeling one with the other, thereby exporting the conceptualization done by one paradigm to the other”, but since we don’t know the answer to the question if there exist a scale of compatibility, and the positions of the paradigms in such a scale with re-spect to others, we cannot be sure that this claim consti-tutes as an solution or not. We believe that the solution to multiple-paradigm modeling lies in a theory of paradigms, which would constitute of meta-paradigmatic statements and would act as the common grounds and norms to choose and to combine paradigms, or to show that they are not combinable.
PROGRAMCODE
”REALITY”
MODEL HUMAN AGENT
1. CONCEPTUALIZATION
2. MODELING
3. RE-CONCEPTUALIZATION
EXECUTABLEPROGRAM
CODE
ALTERNATIVES 3:INTERPRETATION,
COMPILATION(also SIMULATION)
ALTERNATIVE 2:CODE-GENERATION
INTERPRETATION orCOMPILATION
4. CODING
ALTERNATIVE 1: MODELING and SOFTWARE
DEVELOPMENT asDISTINCT ACTIVITIES
Figure 1. Mode l transformation in Model Driven Development (MDD)
The compatibility of paradigms question is also related to the programming language - modeling/design paradigm coupling, especially in the case of paradigms that do not have their own programming languages, namely the compo-nent-based and the agent-oriented paradigms. What do we pay in using a programming language that is created to sup-port a different paradigm, say the object-oriented (like Java, C++ or Smalltalk), when we use them in building com-ponents or agents? From the translational point of view, this means that at least in the last translation from non-executable representational forms of the model to the execu-table form, if not before in translations between non-executable translations, we model one paradigm using an-other, thereby change paradigms. This suggests informa-tion loss, increased probability of introducing errors etc. Can and do we justify what we are doing?
There is also the “problem” that the ones who are creat-ing the first mapping from “the” ontology to the ontology of the paradigm, and the ones who are translating one rep-resentational form to another to end in an executable final representation are only human. This aspect of the paradigm is mostly neglected, and studies on understanding the cog-nitive load created on the designer/model builder, and de-signer’s/model builder’s cognitive toolset should become a study area. There is need for more cognitive/empirical stud-ies on the question of how the human relate to the suitabil-ity of the paradigms to the tasks problem. How such studies should be conducted is another open question.
Finally, we ask what the role of a paradigm is in software engineering. With the definition we have proposed in this paper, its role is already set through for examp le OMG’s [24] MOF [25] that can be interpreted as an attempt to define “an” ontology of modeling languages – i.e., modeling lan-guage “things”, relationships between them and the rules governing these languages, except that the ontology would be limited to reflect one specific modeling approach (like the object-oriented approach) in any given software engineer-ing project. Alternatively, one could have a paradigm de-fined per phase or activity of the software engineering life-cycle. In essence, what we claim is that a paradigm’s impor-tance in software engineering is parallel to choice of con-ceptualization and communication language in a software engineering project, and that it can be done explicitly and defined formally.
One last comment in order to explain the importance of choice of paradigm in software engineering: if choice of paradigm is like choice of conceptualization/communication language, then according to the Sapir-Whorf thesis [26, 27], it is of utmost importance because choice of language de-cides to a large degree what we see, how we see and con-ceptualize what we see, and how we reason. Since software engineering activities like analysis, design and implementa-
15

tion are communication and reasoning-intensive activities, setting out with a wrong or ill-defined paradigm would be very unlucky indeed.
5. Conclusion - Towards Conscious Usage From a philosophical perspective, the paradigm used in the software process should have profound effects on the suc-cess of the process and the quality of both the process and the product. The effects of the paradigm on the quality of the process is mostly due to the cognitive aspects of the paradigm: It eases some representational tasks and makes some others harder, thereby having direct influence on the cognitive load the process has on its implementers. The effect on the end-product is not only due to the effects on the process, but also due to the software engineering para-digms’ frequent inclusion of a computational ontology: the basic elements of computation and their relations.
Like many questions posed in this paper are, the question of how farfetched the effects of paradigms in software life-cycle are is also still open. To address these questions, we argue for reifying the paradigm into a cognitive artifact [28] to be included in the software engineering toolset, in order to pave way towards understanding various paradigms’ both threats and promises, to avoid the negative effects and harness the potentials.
To reify the paradigm as an artifact, and to focus on its ef-fects, a definition of the paradigm sufficiently grounded, covering the philosophical aspects as well as the cognitive ones and their relations is needed. In this paper we pre-sented a direction and first results, and we believe this di-rection will prove to be a fruitful one for software engineer-ing.
6. References [1] G. Agamben, "What is a Paradigm?," available online
at http://www.egs.edu/faculty/agamben/agamben-what-is-a-paradigm-2002.html, last visited April 29th, 2004.
[2] V. Goldschmidt, Le paradigme dans la dialectique platonicienne. Paris: Presses Universitaires de France, 1947.
[3] Aristotle, "Rhetoric," available online at http://www.public.iastate.edu/~honeyl/Rhetoric/index.html, last visited April 29th, 2004.
[4] T. S. Kuhn, The Structure of Scientific Revolutions, 3rd ed: University of Chicago Press, 1996.
[5] M. Foucault, Surveiller et Punir: Naissance de la Prison. Paris: Gallimard, 1975.
[6] T. R. Gruber, "A translation approach to portable on-tology specifications," Knowledge Acquisition, vol. 5, pp. 199-220, 1993.
[7] A. C. Kay, "The Early History of Smalltalk," available online at http://gagne.homedns.org/~tgagne/contrib/EarlyHistoryST.html , last visited March 29, 2004.
[8] Smalltalk Organization, "Smalltalk official site with tu-torial," available online at http://www.smalltalk.org/, last visited March 29, 2004.
[9] K. Nygaard, "How Object-Oriented Programming Started," available online at http://heim.ifi.uio.no/~kristen/FORSKNINGSDOK_MAPPE/F_OO_start.html , last visited March 29, 2004.
[10] V. Radonic, M. Krieger, and J.-P. Corriveau, "A re-sponse oriented paradigm for software engineering," presented at 1994 Conference of the Center for A d-vanced Studies on Collaborative Research, Toronto, Ontario, Canada, 1994.
[11] I. Crnkovic and M. Larsson, "Component-based Soft-ware Engineering - New Paradigm of Software Devel-opment," presented at MIPRO 2001, Opatija, Crotia, 2001.
[12] S. O'Malley and S. A. DeLoach, "Determining When to Use an Agent-Oriented Software Engineering Para-digm," presented at Second International Workshop On Agent-Oriented Software Engineering (AOSE-2001), Montreal, Canada, 2001.
[13] "An Abbreviated Software Engineering Glossary," available online at http://www.rspa.com/spi/glossary/, last visited April 24th, 2004.
[14] "Fact Guru, Object-Oriented Software Engineering Knowledge Base," available online at http://www.site.uottawa.ca:4321/oose/index.html, last visited April 24th, 2004.
[15] L. T. Blanks, "Web-notes for CSC 3370 - Introduction to Object Oriented Programming Using JAVA," avail-able online at http://bit.csc.lsu.edu/~ltb/cd3370-sum01/, last visited March 21, 2004.
[16] N. R. Jennings and M. Woolridge, "Agent-Oriented Software Engineering," in Handbook of Agent Tech-nology, J. Bradshaw, Ed.: AAAI/MIT Press, (to ap-pear).
[17] A. Dogru and I. Altintas, "Modeling Language for Component Oriented Software Engineering: COSEML," presented at The 5th Biennial World Con-ference in Integrated Design & Process Technology, Addison, Texas, USA, 2000.
[18] R. Choren and C. Lucena, "ANote: A Modeling Lan-guagae for Agent-Based Systems," available online at http://www.teccomm.les.inf.puc-rio.br/esac2003.1/files/arq/esac_18Mar.pdf, last visited April 24th.
[19] M. N. Akkøk, "Towards the Principles of Designing Diagrammatic Modeling Languages: Some Visual, Cognitive and Foundational Aspects," in Institute of
16

Informatics, Mathematics and Natural Sciences Fac-ulty. Oslo: University of Oslo, 2004.
[20] P. Naur, B. Randell, and (Editors), "Software Engineer-ing: Report of a conference sponsored by the NATO Science Committee," Garmisch, Germany, 7-11 Oct. 1968, 1969.
[21] B. Randell, J. N. Buxton, and (Editors), "Software En-gineering Techniques: Report of a conference spon-sored by the NATO Science Committee," Rome, Italy, 27-31 Oct. 1969, 1970.
[22] F. P. Brooks, The Mythical Man-Month: Essays on Software Engineering. Reading, Mass.: Addison-Wesley Pub. Co., 1975.
[23] F. P. Brooks, "No Silver Bullet," presented at IFIP'86, 1986.
[24] OMG, "Object Management Group (OMG) Home Site," available online at http://www.omg.org/, last visited March 20, 2003.
[25] OMG, "Meta-Object Facility (MOF) V1.4 Specifica-tion," available online at http://www.omg.org/technology/documents/formal/mof.htm, last visited April 29, 2004.
[26] B. L. Whorf, "Science and Linguistics," Technology Review, vol. 42, pp. 229-31, 247-8. Also in B. L. Whorf (1956): Language, Thought and Reality (ed. J. B. Car-roll). Cambridge, MA: MIT Press, 1940.
[27] E. Sapir, "The Status of Linguistics as a Science," E. Sapir (1958): Culture, Language and Personality, 1929.
[28] D. A. Norman, Things That Make Us Smart: Defend-ing Human Attributes in the Age of the Machine. Ad-dison Wesley Pub. Co., 1993.
17

Quality for Components: Component and Component-Based Software Quality Issues
Yusuf Altunel
Istanbul Kultur University, Department of Computer Engineering, ISTANBUL. 34520 Turkey
(Phd Student at Eastern Medditerrenaen University, Departmen of Computer Engineering, KKTC)
Mehmet R. Tolun Prof.Dr., Çankaya Üniversitesi, Department of Computer Engineering, 06530 Balgat Ankara,
TURKEY [email protected]
Abstract Software components and component-based software systems have the capacity to enhance the productivity, reduce the time-to-market and the increase the confidence on the software. Producing the software out of reusable components satisfying the quality requirements would help to meet the goals of software production. The problems in the component market and the market-oriented components prevent the wide application of component based software production. In this paper we investigate the quality related problems of component-based software development and the possible solutions.
Introduction The quality focus in component-based software engineering (CBSE) is the base layer that any methodology in the area must be based on. The component market, which is a priori condition to maximize the intra-organizational software reusability, cannot emerge without supplying high-quality products. Organizations whose aim is to construct software by integrating components rather than developing software from scratch will not be able to meet their objectives, if they cannot find sufficient number of components and component versions satisfying certain functional and quality requirements. The common belief is that the market components are not reliable and this prevents the emergence of a mature software component market [14]. Market components’ quality problems must be resolved to increase the reliability [13], and third-party certification programs would help to increase the trust to the market oriented components [8]. A general definition for product quality would be stated as satisfying the ‘needs’ and expectations of the users. The term ‘user needs’ is subjective and must be defined in objectively measurable format. So, the product quality is defined as ensuring the satisfaction of functional and non-functional characteristics, which will determine the level of user satisfaction and conforming expectations. There are certain product characteristics that will reduce the software quality, some are neutral in determining the
product quality, and some others will decrease the quality. Therefore, for a complete definition of the product quality it is necessary to include not only the productive characteristics of quality, but also the absence of contra-productive characteristics [11]. Software quality is defined as the level of a software system possessing the desired set of attributes [6], and lacking the undesired characteristics. The software quality problems become visible especially when the user satisfaction level decreases due to the faults and bugs existing in the deployed system [11]. To prevent such user dissatisfaction the quality must be the main focus and quality related activities must be executed at each level of development. Hence, there is a need to define a methodology, which will be used to specify software’s quality-related characteristics and corresponding metrics to objectively measure product’s quality. There are some quality models already developed, but they must be adapted to satisfy the unique characteristics of CBSE. A quality attribute is defined as a non-functional characteristic of a software system. Certain standards exist to define the quality model like IEEE 106, and ISO/IEC Draft 9126-1. The quality characteristics defined by these standards are the functionality, reliability, usability, efficiency, maintainability, and portability. A quality model is the set of characteristics and sub-characteristics to provide a basis in specifying the quality requirements of a software system. A quality attribute is defined, as a quality property representing a non-functional characteristics of a software system to which a metric can be assigned ([4] and [6]). Quality attributes are determined basically by decomposing the software architecture into its functional divisions. Quality attribute requirements must exist in both abstract and concrete forms within the requirements specification. Having too concrete specifications of requirements might cause an increase in the maintenance costs, and too abstract specifications causes difficulty in objectively measuring the quality. The relationships between the software quality and architecture are exploited as a part of design activities in component-based software development [2].
18

In producing components and component-based software systems, it is important to clarify how to certify the quality of individual components and the software systems composed out of components. To answer such questions it is important to promote component-based quality models and provide metrics to assess the size, complexity, reusability and reliability [5].
Quality Assurance Large-scale component reuse can generate great saving of development resources and improve the product quality. Quality assurance activities help to localize the effects of changes on the product reducing the ripple effects. Increasing the modularity by using components will increase the speed of incremental delivery and helps the developers to reduce time-to-market. On the other hand, component reuse might produce integration difficulties, performance problems, and incompatibility among products manufactured by different vendors. Additionally, the final product might have reliability and performance problems as a result of poor testing [12]. Quality assurance activities would help to overcome such problems. The main focus in quality assurance is to maximize the product quality. In component-based development the product is either the software component or a software system produced out of components. To increase the reuse and trustworthiness, it is necessary to adequately describe the quality characteristics of individual components, and increase the conformance to the standards. Trusting to the code constructed outside of the organization is a basic prerequisite to widespread use of commercial of-the-shelf (COTS) components [4]. Licensing components by third-party organizations would solve the trustworthiness problem in the discipline and enhance the overall quality of components available in the market [8]. The ability to show that the software components would satisfy both the functional and non-functional user requirements would certainly help to gain the confidence on the market components. By careful application of quality assurance activities, the externally developed software code reuse would be increased and more suitable market conditions would appear.
Quality Evaluation To evaluate the quality of components it is necessary to define some quality metrics with statistical evidence showing the correspondence between the quality and its metrics. CBSE metrics must be different from classical software, since code oriented measure is not feasible due to the lack of the source code in most of the times [12]. A metric for quality measurement is a value that can be assigned to a quality attribute [4].
Quality metrics would be used to evaluate the quality level of components before the making the purchase or develop decisions. The possible metrics that can be used in component based software development would be management metrics (cost, time to market, software engineering environment and system resource utilization), requirements metrics (requirements conformance, and requirements stability), and quality oriented metrics (adaptability, complexity of interfaces and integration, integration test coverage, end-to-end test coverage, fault profiles, reliability, and customer satisfaction metrics) [4].
Component-based Software Quality Improvement Software quality and process improvement are strongly interrelated in the area of component-based software production [3]. Improving the quality in the organization requires to set up certain tasks: a quality plan must be produced, quality and productivity measures applied, measures and measure results investigated, correction actions implemented, and the results are analysed [9]. Low process maturity, lacking the coordination and management, absence of well-tested, undocumented and ill-defined reuse oriented methods, models, and processes are some of the basic reasons of unsuccessful component-based application projects [10]. Qualitative and quantitative methods would be used to verify the conceptual characteristics of products and identify the problems with deeper analysis. The collected measures provide a valuable insight in optimizing the development processes [3]. Organization-wide assessment standards should be established for component manufacturers. The supplier must discover the rules and other information required to define such standards. Additionally, the knowledge obtained from previous projects would be used to make the necessary adjustments in component production activities. Efficient reuse strategies would reduce the quality assurance effort and integration problems [1]. Reuse is accepted as a major dimension of software production, which would effectively improve the overall software quality [7]. An organization to implement systematic reuse will face four categories of issues, which are defined also as potential independent variables of experiments to improve the quality of software reuse processes: Managerial issues to promote and reward reuse, economic issues to make reuse economical, legal issues to protect the legal rights of reuse and technical issues to apply technical variables like design method, coding standards and practices, and reuse library indexing methods [9].
19

Cost of Quality Cost of quality provides a valuable knowledge on the production processes and in identification of the activities that are responsible in reducing the product quality. The issue represents the possible loses in terms of money that provides a measurement and identifies the opportunities for improvement. Cost of quality measure and analysis provides information about management performance, points out for improvement and provides a measurement to evaluate the accomplished improvement. Investments in quality improvement can increase the product quality to prevent any failure occurs before and after the delivery. The costs of failure before delivery includes costs of reprogramming, defect management, and retesting; whereas the cost failure after the delivery are the cost of technical support, maintenance, remedial upgrades, and liability damages [12]. The cost of quality can be categorized as the costs due to the lack of quality, which consists of internal and external failure costs, and costs of achieving quality, which would further be categorized as appraisal and prevention costs. Internal failure costs include the defects determined prior to delivery of shipment of the product. External failures occur after the delivery or shipment of the product, and covers efforts needed to detect and correct problems that are informed by the user. Appraisal costs are those that are associated with measuring, evaluating, or auditing products or services to assure conformance to quality standards and performance requirements. Prevention costs are those associated with activities designed to keep failure and appraisal costs to minimum in products or services. In component production the internal failure costs must be measured to analyse and improve the component development process. Appraisal costs measurement is used in the cost/benefit analysis of producing higher quality components and component-based software. The results of the measures would provide a clear picture of development process, which would help to increase the overall quality of the products.
Conclusions The quality problem of components is one of the obstacles preventing the wide application of the CBSE. Although the lack-of-the quality is a general problem for software development, it has a vital importance for CBSE. CBSE provides a radical change in software development: construct the software systems out of quality components instead of developing every piece of code from scratch. This approach provides wide application of software developed outside of the organization. However, confidence on the software developed outside of the organization cannot easily be gained. To remedy this problem, the component producers must concentrate on
quality issues although this requires extra costs and further activities. Extra resource allocation in increasing and assuring quality, identifying and mitigating the risks related with the quality, quality planning and tracking activities must be executed throughout the project development life cycle. The software quality problem cannot be solved without changing the existing software development style, and establish a new development culture based on continuous process improvement. This requires that, the software development organizations must define formal processes and regularly collect data to assess and improve the development receiving a better organizational maturity. Developing component with no defects or minimum defects is a desired characteristic in component-based software production. Classical software development methodologies are not useful in decreasing the number of failure lower than a certain level, since every piece of code is developed from scratch and due to the huge maintenance costs. Component-based software development constructs the software out of qualified components satisfying certain quality level, and as a result the whole system is trustable, more efficient, easier to maintain and better in user satisfaction. Quality by product issue is especially critical in emergence of the software component market. By producing components satisfying the quality requirements, software producers become more enthusiastic to consume the market-oriented components. In return, a more matured market would become available which further encourages the component consumption and producing the software in component-based manner.
References [1] D. Ansorge, K. Bergner, B. Deifel, N. Hawlitzky, C.
Maier, B. Paech, A. Rausch, M. Sihling, V. Thurner, S. Vogel; Managing Componentware Development – Software Reuse and the V-Model Process; In Lecture Notes in Computer Science 1626, Advanced Information Systems Engineering, Page 134-148, Editors: Matthias Jarke, Andreas Oberweis; Springer Verlag, June 1999.
[2] L. Bass; Software Architecture Design Principles; In Component-Based Software Engineering Putting the Pieces Together; Editors: G. T. Heineman, W. T. Councill; Addison-Wesley, 2001.
[3] A. Bobkowska; Quantitative and Qualitative Methods in Process Improvement and Product Quality Assessment; In Proceedings of ESCOM (European Software Control and Metrics), 2001.
[4] M. F. Bertoa & A. Vallecillo; Quality Attributes for COTS Components; In Proceedings of the 6th ECOOP Workshop on Quantitative Approaches in Object-Oriented Software Engineering (QAOOSE 2002). Málaga, Spain, June 2002.
20

[5] Xia Cai, Michael R. Lyu, Kam-Fai Wong, Roy Ko; Component-Based Software Engineering: Technologies, Development Frameworks, and Quality Assurance Schemes; In Proceedings of the Seventh Asia-Pacific Software Engineering Conference (APSEC.00), IEEE 2000.
[6] L. Dobrica and E. Niemalia; A Survey On Software Architecture Analysis Model; IEEE Transactions on Software Engineering, July 2002.
[7] E. Ellmer, D. Merkl, G. Quirchmayr, A. M. Tjoa; Process Model Reuse to Promote Organizational Learning in Software Development; In Proceedings of the 20th Annual Int’l Computer Software and Applications Conference (COMPSAC’96); Seoul, Korea, August 19-20; IEEE Press, 1996 pp 21-26.
[8] J. Flynt, Manoj Desai; The Future of Software Components: Standards and Certification; In Component-Based Software Engineering Putting the Pieces Together; Editors: G. T. Heineman, W. T. Councill; Addison-Wesley, 2001.
[9] W. B. Frakes & Christopher J. Fox; Quality Improvement Using A Software Reuse Failure Modes Model; IEEE Transaction on Software Engineering Vol. 22, No. 4; April 1995.
[10] M. L. Griss; CBSE Success Factors: Integrating Architecture, Process, and Organization; In Component-Based Software Engineering Putting the Pieces Together; Editors: G. T. Heineman, W. T. Councill; Addison-Wesley, 2001.
[11] R. Petrasch; The Definition of 'Software Quality: A Practical Approach; In Proceedings of the 10th International Symposium on Software Reliability Engineering (ISSRE99), Boca Raton 1999.
[12] S. Sedigh-Ali, Arif Ghafoor, Raymond A. Paul; Software Engineering Metrics for COTS-Based Systems; IEEE Computer; May 2001.
[13] J. Speed, B. Councill, G. T. Heineman; Component-Based Software Engineering As a Unique Engineering Discipline; In Component-Based Software Engineering Putting the Pieces Together; Editors: G. T. Heineman, W. T. Councill; Addison-Wesley, 2001.
[14] E. J. Weyuker; The Trouble with Testing Components; In Component-Based Software Engineering Putting the Pieces Together; Editors: G. T. Heineman, W. T. Councill; Addison-Wesley, 2001.
21

Refining Compositional Structure Using the N2 Chart for Identifying Components and Design Patterns in Component-Based Systems
M. Naci Akkøk Department of Informatics,
University of Oslo, Norway.
Abstract Component-based software engineering has gained in im-portance to a degree where it deserves its own set of tech-niques. Based upon a diagrammatic modeling language (DML) used in systems engineering called the N2 Chart, this paper offers a simple technique for identifying compo-nents by refining compositional structure in component-based systems. The technique also demonstrates how a DML that agrees with the software engineering paradigm it is meant to be a modeling tool for – in this case compo-nent-based software engineering – may enhance the soft-ware engineering process, exemplified in this paper through showing how design-level reasoning is facilitated by the correct choice of DML.
Keywords Component-based software engineering – diagrammatic reasoning – identifying components – refining composi-tional structure.
1. Introduction This paper is one of many responses to a need for tech-niques that are native to component-based software engi-neering (CBSE). Specifically, this paper offers a diagram-matic modeling language (DML) capable of facilitating design-level reasoning in CBSE.
There are already tools and techniques used for CBSE. The de-facto industry standard Unified Modeling Language (UML) [1-3] is one such ‘tool’ that has been used for ad-dressing the modeling needs of CBSE. As a mater of fact, UML seems to be the dominant modeling language suite used for CBSE in relatively recent literature [4-7]. Still, UML originates from object-oriented (OO) modeling – i.e., a paradigm that is possibly distinct from the component-based (CB) paradigm – and its fitness to support CB model-ing remains unquestioned.
The fact that object-oriented software engineering really differs from CBSE is pointed out in more than one case [8-10]. In the foreword of a book about UML components by
Cheesman and Daniels [4], Clemens Szyperski states the following: “Geared toward object-oriented analysis and design, the all-important component concept has fallen by the wayside in many object-centric approaches. Worse yet, there is the occasional thesis that components are special objects. Clearly, there is nothing wrong with objects – but it is components, not objects, that promise industrial leverage of software production and composition.”
If components are not objects as these views advocate, then there is obviously room for designing a ‘native’ com-ponent based DML (as well as other ‘native’ CB tools and techniques).
The DML we offer as an example in this paper – based upon Lano’s N2 Chart [11, 12] – is an example of a DML that is native to the CB paradigm in that the N2 Chart was originally designed for component-based systems engineer-ing. We mentioned earlier that it is capable of facilitating design-level reasoning, where the term reasoning refers to diagrammatic reasoning as summarized for example by Kulpa [13] in the context of this paper. Diagrammatic rea-soning is a special case of the broader concept of visual reasoning, which is elaborated in earlier work [14-20] to-gether with characteristics that improve a DML’s desired visual characteristics like visual (and diagrammatic) reason-ing.
In the next section (section 2), we briefly look at the component notation supported by UML V1.5 and some of its variations, as well as the newer component notation sup-ported by UML V2.0. In the same section, we also intro-duce the N2 Chart, highlighting its main differences from UML. We then demonstrate in section 3 how one may use a slightly modified version of the N2 Chart to refine a compo-nent-based design and hence identify the components of the system in a healthier manner.
22

2. Existing Component-Based Modeling No-tations
Figure 1 below shows component notations offered by UML V1.5. Figure 1a is the ‘standard’ component notation, which represents a unit of implementation. UML compo-nents can expose interfaces as shown in Figure 1b. The no-tation is from the UML V1.5 specification [3], available from the Object Management Group’s UML resources site [21]. Figure 1c depicts classes (the rectangles) exposing interfaces (the circles attached to the boxes) that together form a component. Figure 1c demonstrates a component specification (as opposed to the unit of implementation rep-resented in Figure 1a) as well as its implementation that realizes the specification with respect to a realization con-tract, and its client that uses the component with respect to a usage contract. The concept of a contract as used here is originally due to Bertrand Meyer [22], which is applied to components in Catalysis [7]. The concepts of Figure 1c are employed for example by the work of Cheesman et al. [4] that builds further upon works of Meyer as well as the Ca-talysis method.
Figure 1. UML V1.5 component notation
The notation in Figure 2a below is the Catalysis notation already mentioned above. It models event-passing from component to component using the ‘open-arrow/open-circle’ notation as between components C1 and C3 (or C2 and C3) in Figure 2a, and value passing using the ‘filled-arrow/filled-circle’ notation as between components C3 and C4.
Figure 2. UML-based component notations that differentiate between calls and events. See Catalysis [7] and Lorenz & Vlissides [4]
Figure 2b is from Lorenz’s and Vlissides’ work [9]. Both notations are closer to input-process-output (IPO) notations as compared to the UML V1.5 component notation. IPO notations are more usual in other engineering disciplines where components are more natural and not in software, primarily because software “components” are usually called and return to the caller instead of just passing on a value.
Though UML V2.0 is not finalized at the time of writing this and there is little written about it yet, there is some in-formation available for example in Björkander and Ko-bryn’s article [23]. It summarizes a few newer aspects of UML V2.0, including classes with provided interfaces, re-quired interfaces and ports as demonstrated in Figure 3.
Figure 3. A class (black-box view) with interfaces and ports in UML V2.0
What is really interesting in UML V2.0 is that it allows non-implementation level components to be represented, which was not possible in UML V1.5. The implication of the existence of the conceptual level component in addition (as compared to the implementation level component that was the only kind of component available in UML V1.5), is that we can actually design with conceptual components. The decompositional structure (white-box view of a class) that enables carrying component instances over into the class (structure) diagram is depicted in Figure 4.
23

Figure 4. Internal structure of a class (white-box view) in UML V2.0
We see that not only the concept of a component but also the concept of an interface exists in all UML and UML-based component notations depicted above. The N2 Chart notation is slightly different, but the difference is not in its focus on components and interfaces. Its only significant difference is in its layout requirements (see Figure 5).
Figure 5. The N2 Chart: a) Matrix notation and b) node notation
The N2 Chart DML supports several notational dialects. Two of these are shown: the matrix notation in Figure 5a and the node notation in Figure 5b (called circle-arrow for-mat in Lano). We shall keep to the node notation in our version of the N2 Chart in this paper.
The four basic production rules of the N2 Chart are listed in table 1. Note that the rules include layouting rules.
Table 1. Diagramming rules for the N2 Chart
Rule # Diagramming Rule
Rule 1 Construct an N×N matrix with N components on the diagonal
Rule 2 Interface from CX to CY is one-way and in the off-diagonal
cell (X, Y)
Rule 3 All inputs to a component are on its column
Rule 4 All outputs from a component are on its row
There are very few other DMLs that include layouting rules as part of their production rules. Notable exceptions are DMLs like IDEF0 [24] and SADT [25]. What these layout-ing rules enable is very interesting: they enable diagram-matically reasoning about design decisions.
The example in Figure 6 depicts the generic case of a sys-tem with a critical component CC. It may be a visual indica-tion of the existence of a bottleneck for proper system op-eration, implying the need to secure or replicate the critical component to ensure reliable operation, or that the critical component needs to be further decomposed.
Figure 6. N2 Chart of a system with a critical component CC (re-drawn from [12])
In any case, the diagram offers visual design-level informa-tion that is available at a glance, facilitating design level reasoning towards a better design. The same is valid for Figure 7, except that it depicts the case of three tightly cou-pled components CP, CQ and CR indicated by the existence of all possible interfaces between all three components, which could (and often would) mean that there is a need to reduce these three components to a single component.
24

Figure 7. N2 Chart of a system with three tightly coupled components CP, CQ and CR
With proper reduction techniques also for the interfaces between components that are reduced to a single compo-nent, one can reason through to a healthier compositional structure for the system in concern. The same technique can also be used to identify a healthier set of components from an initial and not necessarily well-founded set of them. The next section explains and exemplifies how one can refine compositional structure and hence identify components in CB design.
3. An Example: Reasoning About a Confer-ence Center Portal Design
Our example is a Conference Center Portal (CCP), helping participants register to conferences, organizers to organize and manage conferences, and providers to offer and manage their services. CCP was modeled after real conference por-tals, but is a simplified graduate course class-work at the Department of Informatics, University of Oslo, Norway. The system was designed by groups participating in a course on OO modeling, every group refining the previous group’s design and presenting it to the whole class. One of the aims of the exercise was to use and learn CB and prod-uct-line engineering in accordance with the KobrA method-ology [5].
During the course of designing a CB solution to the CCP, the following three sets of components were identified in three passes, each pass detailing the previous:
Pass 1:
Organizer Provider Participant Invitation Calendar Reservation resources (conference rooms, over-
night accommodation, catering, other) Pass 2:
Invitation manager
Reservation manager Resource manager Calendar manager Reservation
Pass 3:
Conference Conference Center Portal (CCP itself) Booking (confirming and finalizing reservation)
There was obviously some amount of confusion related to where to stop in the process of detailing components and introducing new ones, and what was recommendable to choose as the final set of components. The students are not alone in being confused. As a knowledgeable consultant and a good friend bluntly put some time ago1:
“We have some techniques for identifying objects and for refining the structure of an object-oriented view of a sys-tem, but everybody says (as I also am confronted with of-ten) that objects and components are different types of building blocks. So, how do we do that with components?”
It turns out that the answer may be easier than feared. Figure 8 below is the abstracted N2 Chart of one set of ini-tial components for the CCP.
Figure 8. Initial compositional structure (CB design) of the CCP
1 The original question was from Cell Network, merged in 2000 with
Mandator and renamed to Mandator, one of Scandinavia’s stronger con-sultancy companies (about 2000-person strong), which focuses on sys-tem integration, business modeling an interactive communication. Simi-lar questions were asked in a Norwegian Central Bank project and many other projects of some size.
25

The initial set is obtained simply by using standard OO ap-proaches for identifying objects – for example Abbott’s natural language approach where nouns are potential ob-jects [26] expanded and summarized for example by Gra-ham [27] (available on http://uml.tutorials.trireme.com/ as well) – just that the focus is more on “things that perform”, i.e., objects that are responsible for operations often indi-cated by “doing verbs” and “transitive verbs” in the text of the specification in case of components.
Once the initial compositional structure is in place, we sim-ply use the rules for reducing tightly coupled components depicted in Figure 7 above. The result is in Figure 9 and the reductions are summarized in Table 2 below.
Table 2. Details of the reductions in Figure 8 to yield Figure 9
Figure 9. New compositional structure of the CCP after 1st set of reduc-tions (see Table 2)
Note that two tightly coupled components (like C7 + C8 in Figure 8 or C1 + C[2] and C6 + C[7] in Figure 9) may or may not be reduced further. One may set the limit to three or more components before one decides to reduce, since two interacting components do not always pose problems unless they are for example physically distributed with too high communication rate in between. The context of design as well as the specification should guide designer’s decisions.
We have chosen to reduce all tightly coupled sets of com-ponents.
Figure 10a is the final reduction, where C1 + C[2] and C6 + C[7] are reduced to C[2] and C[6] respectively. Still, we can see visually that the design may be refined further visually using what we call a rearrangement, which is simply ex-changing the places of components (in this case C5 and C[6]) resulting in the diagram in Figure 10b.
Figure 10. Diagrams showing compositional structure of the CCP a) after 2nd set of reductions and b) after final rearrangement
Our choice to reduce all tightly coupled sets of components is for demonstrating one additional outcome of the tech-nique: if fully reduced as in the example in Figure 10b above, the technique ends up with the components at the highest level of abstraction possible, and hence produces a CB “design pattern candidate” that can be matched to the results of other similar designs reduced to the same degree and eventually verified as a CB design pattern! Thus, this last compositional structure translates to a high-level CB design pattern for systems like the CCP, saying more-or-less that we (in general) need a component (C[1]) that man-ages the needs of the providers, another component (C[6]) that manages the needs of the organizers (mediators) and a third component (C5) that manages the needs of the partici-pants (end-users), which then becomes our (candidate) de-sign pattern.
Note that each components should be accessible on its own as well (not shown) for this pattern to function at least in the context of the CCP.
Note also that we would most likely stop at a rearranged version of Figure 9 if we did not aim at extracting a CB design pattern but only a CB design with the “correct” components.
4. Conclusions This paper does present a technique for refining composi-tional structure, for identifying components and for identi-fying design patterns in CBSE, but the reason why such a simple technique can do all this is at the heart of this paper and in itself important to understand.
Reduction # Figure 9
(reduced to)
Figure 8
(reduced from)
Red. 1 C[2] C2, C3 , C4
Red. 2 C[7] C7, C8
Red. 3 Interface [2]-1 Interfaces 2-1 and 3-1
26

The lesson to learn is detailed in a parallel paper written by Göktürk [28] with contributions from these studies on DMLs for CBSE. The paper concludes by stating that “the paradigm used in the software process has profound effects on the success of the process and the quality of both the process and the product. The effects of the paradigm on the quality of the process is mostly due to the cognitive aspects of the paradigm: it eases some representational tasks and makes some others harder, thereby having direct influence on the cognitive load the process has on its implementers”. Thus, choosing a DML that is native to the paradigm it is going to be a modeling tool for makes a difference. The kind of difference it makes is cognitive and may decide whether one can reason visually with the DML or not as exemplified here.
5. References [1] UML-URL, "OMG's Unified Modeling Language
(UML) Home Site," vol. 2003. http://www.uml.org/, 2003.
[2] G. Booch, J. Rumbaugh, and I. Jacobson, The Unified Modeling Language User Guide: Addison-Wesley, 1999.
[3] OMG, "Unified Modeling Language Specification V1.5, March 2003," OMG, 2003.
[4] J. Cheesman and J. Daniels, UML Components: A Simple Process for Specifying Component-Based Software: Addison-Wesley, 2001.
[5] C. Atkinson, J. Bayer, C. Bunse, E. Kamsties, O. LaitenBerger, R. Laqua, D. Muthig, B. Paech, J. Wüst, and J. ettel, Component-based Product Line Engineering with UML: Addison-Wesley, 2002.
[6] K. Z. Ahmed and C. E. Umrysh, Developing Enter-prise Java Applications with J2EE and UML: Addi-son-Wesley, 2002.
[7] D. F. D'Souza and A. C. Willis, Objects, Components and Frameworks with UML: The Catalysis Approach: Addison-Wesley, 1999.
[8] T. D. Meijler and O. Nierstrasz, "Beyond Objects: Components," in Cooperative Information Systems: Current Trends and Directions, M. P. Papazoglou and G. Schlageter, Eds.: Academic Press, 1997.
[9] D. H. Lorenz and J. Vlissides, "Designing Compo-nents versus Objects: A Transformational Approach," presented at 23rd International Conference on Soft-ware Engineering (ICSE), Toronto, Ontario, Canada, 2001.
[10] C. Szyperski, Component-Oriented Software, Beyond Object-Oriented Programming: Addison-Wesley, 1997.
[11] R. Lano, The N2 Chart: TRW, Redondo Beach, CA, 1977.
[12] R. J. Lano, "The N2 Chart (reprint)," in System and Software Requirements Engineering, R. H. Thayer
and M. Dorfman, Eds.: IEEE Computer Society, 1995, pp. 244-271.
[13] Z. Kulpa, "Diagrammatic Representation and Reason-ing," Machine Graphics & Vision, vol. 3, pp. 77-103, 1994.
[14] M. N. Akkøk, "An Overview of the Unified Modeling Language and Diagrammatic Modeling Language De-sign Efforts in Software Engineering," Information Design Journal, vol. 11, 2003.
[15] M. N. Akkøk, "Defining Visual Immediacy, the Un-derused Gift of Diagrammatic Modeling Languages," (Submitted to) Journal of Visual Languages and Computing, 2003.
[16] M. N. Akkøk, "Designing Visual Immediacy into a Diagrammatic Modeling Language," (In press) Infor-mation Design Journal, 2004.
[17] M. N. Akkøk, "Towards the Principles of Designing Diagrammatic Modeling Languages: Some Visual, Cognitive and Foundational Aspects," in Institute of Informatics, Mathematics and Natural Sciences Fac-ulty. Oslo: University of Oslo, 2004.
[18] A. Karabeg and M. N. Akkøk, "Towards a Language for Talking about Visual and Spatial Reasoning," pre-sented at (submitted to) Visual and Spatial Reasoning in Design: VR'04 Third International Conference, MIT, Cambridge, USA, 2004.
[19] A. Karabeg, M. N. Akkøk, and K. Kristensen, "To-wards a Language for Talking about Information Visualization Aimed at Presentation on the Web," presented at Eigth International Conference on Infor-mation Visualization (IV04), London, UK, 2004.
[20] A. Karabeg and M. N. Akkøk, "Visual Representation and the Web," presented at Selected Papers from the International Visual Literacy Association (IVLA) Conference, Newport Rhode Island, USA, 2004.
[21] UML-Resources, "OMG's Unified Modeling Lan-guage (UML) Resource Page with Request for Pro-posals (RFPs)," vol. 2003. http://www.omg.org/uml/, 2003.
[22] B. Meyer, Object-Oriented Software Construction (2nd ed.): Prentice Hall, 1997.
[23] M. Björkander and C. Kobryn, "Architecting Systems with UML 2.0," IEEE Software, vol. 20, pp. 57-61, 2003.
[24] J. E. Long, "Relationships between Common Graphi-cal Representations Used in System Engineering," presented at Proceedings of SETE 2000 (see also http://www.seecforum.unisa.edu.au/SETE2000/Programme2papers.html), Brisbane, Queensland, 2000.
[25] D. A. Marca and C. L. McGowan, SADT: Structured Analysis and Design Technique. NY: McGraw-Hill, 1988.
27

[26] R. J. Abbott, "Program Design by Informal English Descriptions," Communications of the ACM, vol. 26, pp. 882-894, 1983.
[27] I. Graham, Object-Oriented Methods: Principles and Practice, 3rd ed.: Addison Wesley, 2000.
[28] E. Göktürk and M. N. Akkøk, "Paradigm and Soft-ware Engineering," presented at (Submitted to) Work-shop on Impact of Software Process on Quality (IMPROQ), May 21-22 2004, Ege University, Izmir, Turkey, 2004.
28

Real Life Experience – How to Develop CMMI Processes?
Orhan KALAYCI Nitelik Danışmanlık Ltd.
Sarit DİNMEZ Özge YILMAZKURT
Güner MUTLU Hüseyin KİRAZ
Volkan SEVİNÇOK BİMAR Bilgi İşlem Hizmetleri A.Ş.
[email protected]@izm.bimar.com.tr
[email protected]@izm.bimar.com.tr
Abstract
In December 2003, BIMAR has initiated an SPI project to reach CMMI L2 in 2004 using XP practices at the same time. Nitelik Danışmanlık Ltd. has planned and conducting the project. Total of seven processes [1] described in CMMI L2 has been divided into two groups. The first group was including four process, namely, Requirements Management, Project Planning, Configuration Management, Supplier Agreements Management and completed in March 2003. A lot have been learned while developing these processes. These lessons learned applied the second group processes, Project Tracking and Oversight, Process and Product Quality Assurance, Measurements and Analysis. We found that although the second groups process development activities completed in much more shorter time, end results are as satisfactory as the first group of processes.
This paper aimed at sharing the real life experiences gathered during developing the CMMI L2 processes in the SPI project of BIMAR. Four examples from the process development activities will be given to further clarify the process development activities. These examples will be from the following processes: Project Tracking and Oversight, Process and Product Quality Assurance, Measurement and Analysis, Supplier Agreements Management 1 Introduction In December 2003, BIMAR has initiated an SPI project to reach CMMI L2 in 2004 using XP practices at the same time. Nitelik Danışmanlık Ltd. has planned and conducting the project. The quantitative targets of the project was 20% decrease in duration and cost of projects and 30% decrease in the number of defects delivered to customer. This paper aimed at describing
the best practices experienced while developing CMMI L2 Processes. When we begin process development with four processes in November 2003 it took us seven weeks to finalize the process designs. Then in March 2004 when we began to second set of process with the rest three processes of CMMI L2 we managed to conclude the process design activities in four weeks without any rush or no giving up the work quality. That is to say, the second set of processes were designed as the same quality as the first set but with twice faster. We also want to bring it to light that BIMAR has a unique company culture which is hard to find in Turkey as well as not easy to find all over the world. The company culture focused onto creating a friendly environment of teamwork and clear and continuous communication among all levels of the company which makes CMMI process development activities easier to carry on and having fun during the process works. We cannot emphasis it more that without BIMAR’s top management sincere and uninterrupted commitment, no process activity can be reach the successful end results so that we will be able describe them as best practices here in the paper. 2 Process of process development Process of process development has the following building items. Process development activities are planned to be completed in around 12 weeks in which 1 day is for training for the process, 3 weeks are for process design, 6 weeks (over lapping with 2 weeks of training) for pilot project and 8 weeks (overlapping
29

with 3 weeks of pilot project) for institutionalizing the process as shown in figure 1.
Figure 1 – Process development activities plan This paper is giving examples for the designing of the processes. In the examples you will see these topics will be explained: Roles: The roles played within the process design teams Purpose: How the purpose of the process identified Metaphor: Metaphor is a daily life story which has certain analogies with the process designed. [1] Customer: It is important to identify the customer of the process. Under this heading it will be explained how the customer found Main Steps: One of the most important outcome of the process design is the main steps. The other important outcome is the documents designed that will be used while performing the process in the projects Brain Storming: The most used technique in designing process is Brain Storming. Using this technique it is possible to make everybody participate to teamwork and a feeling of ownership towards to process created. Simplifying: We want our processes to be simple, applicable and measurable. To make them simple, after main steps identified we question every step whether it is really required. Applicability: Under this heading, the question is “what do we need to have to make the main steps of the process easily applicable, i.e. how can we make the life of the process performers easier?” Measurements: To improve the process performance we know that we have to measure it so that we can follow the improvements. Lessons Learned: After each meeting of process design, we ask ourselves “in the next meeting, what do we need to “do better” or “not do” for a better meeting next time” 2.1 Project Tracking and Oversight Project Tracking & Oversight (PTO) Process is designed to ensure finishing a project in the promised period of time and with minimum amount of bugs. The Process Policy is: [1]
- To ensure that the projects progress as planned,
- To ensure that the risks are tracked and the promises are kept,
- To ensure that the problems are analyzed and solution actions are tracked,
- To track the planning parameters,
2.1.1 Roles Five different roles are defined to determine the responsibilities in the Process Developing Team and to ascertain that the Process is embraced by the team members as shown in figure 2. These are:
- Manager: S/he is the process leader and manages the meetings.
- Script Writer: S/he is responsible from preparing and keeping the Process Development Documents up-to-date.
- Timer: S/he is responsible from keeping track of time spent for agenda topics and from giving warnings related to time.
- Reviewer: S/he is responsible for making critics on the Process Development Studies.
- Staff Member 1: - Staff Member 2:
Only the member at the managerial role is kept fixed, and for the others a table which shows the changing holders of the roles every week is prepared. PTO Process Development Team’s role table is below. The lines marked in red, indicates the Process study at the mentioned date is completed.
Figure 2 – Process developing team roles As an outcome of the PTO Process Development Studies, a new role, PTO Manager (PTOM), is considered necessary for the applicability of the Process. PTOM will be responsible from executing the process steps, and preparing/distributing the relevant reports. The function of the PTOM begins the moment a project reaches the Project Office and a Project Manager (PM) is appointed. In this context, it is decided that the PTOM and PM have to be appointed simultaneously.
30

2.1.2 Purpose Before starting any Process Design, the purpose of the Process must be defined. The members of the Process Design Team have to be sure about the necessities for, and the expectations from the process. By setting a purpose sentence, the path to be followed during design and the borders of the process become sharper. The ideas which are chosen among the ones that emerged during the brain storming session executed to determine the PTO Purpose Sentence and comments on them are shown below in figure 3. The team discussed all items one by one and the ones which are found irrelevant (in dim letters) are eliminated. TO DEFINE THE PURPOSE CHOSEN ITEMS A To track that the project plans are
correct A1 To track the project risks A1 To track the risks A2-B2 To be aware of the delays asap A3 To track whether the communication
plan is applied or it is sufficient A4 To track the human resources
management A-B-C-D To control whether the project goes
on in harmony with the plan and the necessary corrective actions are taken
Purpose To ensure that the project sticks to the proposed time and quality
To be investigated (tbi)
To follow the integration management
B To follow the consistency with the plan
B To determine the problems related to project plans
B-C In case of deviations from plans, determining the causes and requesting precautions
Inform To inform the upper management about the course of projects
Inform To ensure that the created BİMAR values are saved
Inform To report the statuses of the projects Inform To inform the relevant parties
(persons) about the deviations C Requesting corrective actions in
inappropriate (with the plan) cases C Triggering the renewal of planning Decision 2 To produce healthier plans for the
future projects Decision 2 Taking precautions so as not to live
similar problems in future projects Decision 2 Recording and sharing lessons-learned Eliminated Items Predetermining cost/time deviations Predetermining and/or keeping the
exact finishing date and cost of the project up-to-date
Controlling products and data Foresee the problems asap
Keep the out-of-date risks out of sight Ensuring that the resources are
utilized in the most efficient manner Managing changes Revising the project plan oftenly, so
decreasing the effects of the deviations which are expected in the near future
To inform the parties To fulfill the requirements of Quality
Assurance, Measurement & Analysis, Configuration Management Processes
To perform Contract Management Figure 3 –Brain Storming results for “Process Purpose” Following that step, some simplifications are made in order to make the purpose sentence clearer by focusing on the remaining ideas. After simplification, the initial form of the purpose sentence is developed, and it later became a guiding principle in defining the process steps. The purpose sentence for the PTO Process is as follows; To inform the PM and upper management as soon as possible about the deviations in plans and to track the captured problems until they are solved in order to assist the PM in delivering the project in the promised period of time and with minimum amount of bugs. 2.1.3 Metaphor Samples from the daily life are seek in order to ascertain that the process and its functions are easily understood. [1] 3 candidate metaphors are determined as an outcome of a brain storming. These are:
- A season of a football team - A building under construction - Formula 1 Pit Stop
Formula 1 PIT Stop is chosen as the process’ metaphor since it is found more suitable and it is expected to attract more attention. The leading reason for choosing the F1 Pit Stop as a metaphor was that all relevant processes and process responsibilities can be shown on it. In this metaphor, the PTO Process’ steps are easily followed if the operation which begins when a racing car enters the pit stop -and ends when it leaves the pit stop- is taken as a project. The PM’s, pairs’, Measurement & Analysis Group’s, Quality Control Group’s, upper management’s, and PTO Manager’s duties and relations are easily tracked during the tasks such as replacing tires, taking in gas and so on. Since the pit stop process takes only
31

seconds, they are changed to hours in order to make the analogy more traceable and understandable. 2.1.4 Customers After the requirements for and the purpose of the process are made clear among the team members, then came the step where the person(s) that the process will serve will be determined. The intent of this step was to determine the person(s) who are affected by the process and who are denominated as customers. As an outcome of a brain storming, following customers are found:
- * Coordination Committee - Project Team - All company - Customer Relations Manager - * PM - Manager of the Project Office - Other PMs
(Only the ones marked with “*” are kept as customers at the end of the process studies) 2.1.5 Main Steps Following the afore-mentioned (pre)studies, the team passed to the development step where the main steps of the process would be determined and another brain storming session was executed. The items which did not serve for the purpose and/or were found out of context are eliminated first, and the remaining ones grouped under certain classes. The ideas that emerged during the brain storming are evaluated by making use of the simplification principles. Following the evaluations, the first frame of the process steps is formed. They are as follows: PTO Main Steps (First Form) A. TRACKING A.1. PLANNING A.1.1.Tracking Plan is prepared
- Up-to-date statistical data related to criteria are received from the Measurement & Analysis Process
PTOM & PM fills in the Tracking Plan Template A.1.2.The roles and responsibilities in the Tracking Operation are announced
- The holder of PTOM role is announced in the Project Opening Message
A.2. TRACKING A.2.1.The compliance with the project plan is tracked
- PTOM controls the compliance of the project documents with the project plan according to the Tracking Plan.
B. PROBLEM DESIGNATION B.1. TO DESIGNATE A PROBLEM B.1.1.The data obtained during the tracking sub-process are analyzed and problems are determined
- PTOM puts forth the deviations in the project plan
- PTOM compares the deviations with the threshold values stated in the Tracking Plan
B.2. PRIORITIZATION B.2.1. The costs that the problems may cause are asked for - PTOM demands the costs of the effects that the problems may lead from the PM. B.2.2. Problems are sorted - PTOM prioritizes the problems of which the costs are forecasted. C. MONITORING THE PROBLEM C.1. TO REQUEST A SOLUTION C.1.1. A solution is asked for - Solution is requested from the PM with its cost-benefit analysis
- PM refreshes the project documents according to the solution plan
- PTOM tracks the refreshed plans - In case the PM cannot offer a solution the
matter is escalated C.2. TRACKING THE PROBLEM C.2.1. PTOM tracks the statuses of the problems. C.2.2. Unsolved problems are escalated by PTOM D. CLOSING THE PROBLEM D.1.1. PTOM refreshes the status of the problem in the tracking plan D.1.2. PTOM enters the information related to the problem in the database
- PTOM records the information related to the project in the general PTO database
- PTOM derives lessons learned by filling in the comments area in the general PTO database
2.1.6 Brain Storming During the process design studies, brain storming is adopted as the dominant design method in order to;
32

- Provide full participation of the team - Put no boundaries to the ideas.
Thanks to the brain storming method, - Team members declared their ideas without
any limitations and as they wished, - Time management could be accomplished, - More effective and visionary discussion
media could be attained. During the “Determination of Main Steps” study which was carried out by the brain storming method, the items that are found by the team members are first recorded without any comments as shown in figure 4. Then, the items which are considered out of scope or do not comply with the purpose of the process, are eliminated by evaluating all items one by one. The eliminated items are kept as dim lines in the process development documents. The simplifying procedure is explained in detail in section 4.2.7 Simplifying. The determination of the process steps, can be given as an example of brain storming sessions executed during process development studies. The initial outcome of brain storming about process steps are as follows:
DETERMINING THE STEPS 23.03.2004 REQUESTING SOLUTION
C1 Requesting explanations from the PM about the problems of which priorities are determined
C1 Requesting solutions and solution plans from the PM about the problems whose priorities are fixed
Risk
C2 Escalation of the problem in case no solution is suggested
Time Plan
C1 Requesting the cost/benefit analysis of the proposed solution
Comm
Reporting Informing PM about the probable dangers / existing problems
Resources
Reporting Informing upper management about the probable dangers / existing problems
Cost
Reporting Submitting information to the relevant person(s) about the problem and its priority
Scope
Reporting In case of no solution, escalation report Social Dimension
Deciding from whom solution will be
asked Decide
Asking the periods of time required for the proposed solutions
Inform
Requesting solutions for the prioritized problems
Request
Evaluating the requests of PM related to the solution and supplying them
Determine
Pass on the problems to the PM Supply Requesting explanation/solution from
the PM Transfer
Requesting report from the PM about the solution plan
Prepare
Requesting the PM to fix the cause/root of the problem
Escalate
Requesting the PM to fix the responsible person(s) and due dates about the solution
Guess
Requesting solution proposals for the problems starting from the most important
Analyze
Expecting alternative solution proposals when necessary
Satisfy
Requesting the threshold value for starting the alternative solution
Warn
Forecasting the solution’s capability for meeting the requirements
To be satisfied by the proposed solution
23.03.2004 TRACKING THE SOLUTION D1 Tracking the problems’ and solution
plans’ statuses D2 Escalating the troubles encountered
during execution of the solutions Risk
Reporting Reporting the progress of the solution plan to the upper management
Time Plan
Preparing an escalation report in case of un-coordination with the plan
Comm
Tracking whether there are improvements
Resources
Recording the difference that the solution creates
Cost
Tracking whether the risks are updated Scope Recording the problem and the
solution’s success or failure in the lessons-learned database
Social Dimension
Requesting the status of the solution plan
Tracking the conformity with the solution plan
Follow
Tracking that the project plan is revised Track Tracking that the baseline of project
plan is saved Escalate
Informing the PM about the risks of the solution plan
Request
Requesting information regarding the plan during the tracking of the solution
Inform
Observing the solution’s capability for meeting the needs
Ask for information
In case the solution does not suffice, determining the root/cause of the problem
Observe
Requesting the PM to execute the solution plan
Determine
Submit a report
Figure 4 – Brain Storming results for “Determination of Main Steps” The marginal or similar ideas that arose during the brain storming sessions are simplified and/or merged together by means of win-to-win principles or accepted as they were, provided that a consensus is reached among team members.
33

2.1.7 Simplifying The suitability of process steps with the metaphor is evaluated following the constitution of the first version. A scenario is prepared on which the process steps are executed to make them more applicable, fitter for purpose, and of higher quality. While evaluating the steps that emerged as the result of the brain storming sessions, 3 questions are utilized;
- Is this specific brain storming session output under discussion, a main step? Or does it define a sub-step of any main step? As in the case of the “designation and prioritization of problems.” (This is decided as a sub-step)
- Is this specific brain storming session output under discussion falls in the scope of the process? Does it suit to the purpose and metaphor of the process? As in the item “determining the source of the problem.” (This item is out of the scope and does not fit to the purpose of the process.)
- Is this specific brain storming session output under discussion really necessary? In order to answer the above question, 3 additional questions are utilized;
o What if this is not performed? As in the case of “determining the risks that may be triggered by the problem”.(This item falls into the responsibility area of the PM, so is unnecessary.)
o Is it trivial? As in the case of determining the person(s) from whom solution would be asked for (This is unnecessary since the roles are defined)
o Is it a very perfectionist approach? As in the item of “determining the cause in case of delay” (The purpose of the process is solely to designate the problem. Trying to find the causes or roots of the problem is evaluated as a perfectionist approach)
During the simplification studies, the sub-steps which are utilized in determining the main process steps are also taken into consideration and all process steps took their latest form as below: PTO Main Steps (Last Version)
A. TRACKING A.1. PLANNING A.1.1.Tracking Plan is prepared
A.1.1.1 Up-to-date statistical data related to criteria (average delay percentage) are received from the measurement and analysis process. A.1.1.2 PTOM & PM fills in the relevant
sections in the PTO Status Report. A.1.2. Roles and responsibilities in the Tracking
Operations are announced. A.2. TRACKING A.2.1. Compliance with the project plan is tracked
A.2.1.1 PTOM controls the compliance of the project documents with the project plan according to the Tracking Plan A.2.1.2 PTO Status report is published at a frequency stated in the tracking plan
B. PROBLEM DESIGNATION B.1. TO DESIGNATE A PROBLEM B.1.1.The data obtained during the tracking sub-process are analyzed and problems are determined
B.1.1.1 PTOM puts forth the deviations in the project plan. B.1.1.2 PTOM compares the deviations with the threshold values stated in the Tracking Plan B.1.1.3 PTOM records the problem in the Problem Tracking Excel Sheet
B.2. PRIORITIZATION B.2.1. Approximate costs that the problems may cause are asked for B.2.1.1 PTOM requests the approximate cost-
benefit analyses of the problems from the PM. PM sorts the problems according to the projected costs.
[(The cost of the problem to the customer (ARKAS) * Probability of materialization) – The cost of the solution = Aggregate utility cost. All 4 values must be requested separately.]
C. MONITORING THE PROBLEM C.1. TO REQUEST A SOLUTION PLAN C.1.1. A solution plan is asked for
C.1.1.1 PTOM follows the project plans which are revised according to the solution plans by the PM C.1.1.2 The priorities are refreshed by deleting the solution cost in the status reports for the problems for which no solution plans are suggested. PTOM tracks the refreshed plans. C.1.1.3 In case the PM cannot suggest a
solution, the problem is escalated.
34

C.2. TRACKING THE PROBLEM C.2.1. PTOM tracks the statuses of the problems and refreshes the Problem Tracking Excel Sheet
C.2.2. The problems which cannot be solved, are escalated by the PTOM. D. CLOSING THE PROBLEM D.1.1. PTOM refreshes the status of the problem in the tracking plan. D.1.2. PTOM puts the information related to the problem in the relevant database.
D.1.2.1 PTOM records the problems related to the project in the general PTO Problem Tracking Excel Sheet.
2.1.8 Applicability After setting and testing the process steps, the applicability headings are filled. The purpose of this milestone was to put forth the “sine-qua-non”s for applying the process steps and the matters which would ease their application. It is observed that the applicable decreased considerably after simplification milestone, and the process steps became easily usable. As an example, the applicability items determined for the tracking main step are below:
* PTOM must be appointed at the same time with PM * Measurement & Analysis Process must provide the necessary statistical data for the PTO Process * PM must prepare the project plan and submit it to Configuration Management
2.1.9 Measurements Following completion of main process steps, measurements which mean “the information set that can be measured during the execution of the process to be presented in the reports requested by the upper management” are defined as well as applicable. [1] These items can also be defined as “base measurements which will be taken into consideration to be tracked in the upper management reporting by the Measurements & Analyses Process” As an example, the measurements which are defined in the “Problem Designation” step are given below: Measurability: * Measuring the time passed during prioritization process
* Measuring how many problems are designated 2.1.10 Lessons Learned During the team studies, many benefits are attained in many disciplines including team management, process design study management, discussion styles, applied methods. These benefits are mostly attained by utilizing the critics that were made by the Reviewers at the ends of the sessions. The rules that followed are perceived as lessons-learned and compiled under the heading “Process Design Team Working Principles”. PTO Process Design Team Working Principles 1 – The process team must be precise about the working hours and rest intervals. 2 – Every member of the process team has a defined role which changes weekly. The only exception is the team leader. 3 – At the end of each session, the positive/negative critics, first of the Reviewer, then of all participants are asked for and recorded. 4 – Some games, research and conversation topics are also accepted as process development studies as long as they contribute to the participation of and communication among the team members 5 – Documents prepared by single/multiple members of the team can be considered as official process documents with the condition that they are shared and confirmed by all members 6 – The problems that arise during the process development studies shall be solved by making use of the win-win principle wherever possible. 2.2 Process and Product Quality Assurance 2.2.1 Roles
In CMMI Process and Product Quality Assurance process design studies held at BIMAR, distribution of roles in process group, is described below: Process Group Leader : A person responsible for overall success of the group. Scriptwriter : A person responsible for writing study notes during process design studies. Timekeeper : A person responsible for keeping accurate time during process design studies. Quality Assurance Observer : A person responsible for criticizing process design studies for improving productivity of next study.
35

2.2.2 Purpose In CMMI Process and Product Quality Assurance process design studies held at BIMAR, following ideas related to purpose were suggested by process group. Improving efficiency and productivity of
other CMMI Processes. Providing a point of view to management
with which they can evaluate performed processes against designed process descriptions. Supplying services at registered quality level
to customers. Providing transparency about processes to
high level management. Improving satisfaction of high level
management by instituting quality management concept in BIMAR and improving quality level. Focusing on processes that manage and
produce product instead of the product itself. Establishing a selfevaluation mechanism for
all CMMI processes. Helping high level management to control
company. Providing visibility on processes to high level
management. Assuring project managers that task are
completed with minimum number of errors. Increasing added value of processes in the
way of the company reaching its objectives. Strengthening company’s competition power
by application of processes. From these ideas, an idea about self-evaluation mechanism was embraced by process group and it was strategically agreed to institute BIMAR’s Quality Assurance System based on this mechanism. As a result, the purpose of CMMI Process and Product Quality Assurance process design studies was defined as; Establishing a process focused Quality Management System based on self-evaluation mechanism, to help high level management to control company by providing them a point of view with which they can evaluate performed processes and work products against the designed process descriptions and standards. 2.2.3 Metaphor In CMMI Process and Product Quality Assurance process design studies held at BIMAR, following
metaphors are suggested by process group to use in process design studies. Turkey’s EU accession process and
inspections. Pregnancy and Gynecologist. Military investigations and maneuvers. Aircraft manufacturing. School inspections. Traffic and Traffic Police.
From these candidate metaphors, “Pregnancy and Gynecologist” was chose to use in process design studies by process design group. Periodic checks done by Gynecologist were likened Quality Assurance Evaluations. Another important reason to choose this metaphor was naturalness of pregnancy process and thus its closeness to perfection. However mother’s bad habits can have harmful effects on pregnancy process. In periodic checks, Gynecologist tries to find out these bad habits, their harmful effects and then discourages mother from carrying on these bad habits. Also in software development, developers who have been educated in software engineering, try to be faithful to software engineering processes. On the other hand, because of some restrictions like cost, deadline etc. applied by management to projects, processes could not be executed completely. With evaluations in company, Quality Assurance Persons would try to provide complete execution of processes. 2.2.4 Customers In CMMI Process and Product Quality Assurance process design studies held at BIMAR, following customer groups of Product Quality Assurance process were determined: Other CMMI Processes High Level Management Software Development Group Project Managers Customer Relationship Managers
2.2.5 Main Steps In CMMI Process and Product Quality Assurance process design studies held at BIMAR, following steps has been defined as main steps of process. 1. Planning the evaluation
36

1.1. Establishing a Quality Assurance Plan 1.2. Adding Quality Assurance work products into Configuration Management Plan and Measurement and Analysis Plan
2. Maintaining the evaluation 2.1. Collecting Self-evaluation Data 2.2. Performing Evaluation 2.3. Communicating evaluation results 2.4. Communicating noncompliance issues and ensuring their resolutions.
3. Closing Project 3.1. Preparing Project Quality Assurance Report
4. General Quality Assurance Steps 4.1. Preparing General Quality Assurance Report
which includes Quality Trends. 2.2.6 Brain Storming In CMMI Process and Product Quality Assurance process design studies held at BIMAR, Brain Storming idea generation method was used effectively. All ideas about Quality Assurance activities that could be performed in BIMAR, were recorded, regardless of they were reasonable or not. All ideas were explained in detail for correct understanding. Finally these ideas were grouped under process main steps and main steps of CMMI Process and Product Quality Assurance process were obtained. In the next step, which was simplifying, unnecessary steps were eliminated. 2.2.7 Simplifying In CMMI Process and Product Quality Assurance process design studies held at BIMAR, ideas produced with brain storming method, were reduced according to tree criteria. These three reduction criteria are shown below. Process step has more superiority then
required. Absence of process step does not have
effects on process sufficiency. Process step is performed naturally in
process. For example “Establishing a Quality Assurance Risk Plan” process step was eliminated, because its conformity to first criteria. “Customizing Quality Assurance Plan according to project type.” process step was eliminated, because its conformity to second criteria. And “Performing evaluations according to Quality Assurance Plan” process step was eliminated, because its conformity to third criteria.
2.2.8 Applicability In CMMI Process and Product Quality Assurance process design studies held at BIMAR, to provide applicability of process steps, some pre-requisites and support activities required for performing process step, were defined. Thus it was tried to expose missing points which could be appear during the application of processes. Some examples to these items are below. For each project Quality Assurance Responsible
must be appointed by Project Office Manager. Self-evaluation reports must be placed in
Configuration Management System. 2.2.9 Measurements In CMMI Process and Product Quality Assurance process design studies held at BIMAR, for obtaining improvable and thus for obtaining measurable process steps, some measurements were defined. Some samples are below. Project Quality Assurance Plan Establishment
time. Evaluation time. Time spent for communicating
noncompliance and resolution. 2.2.10 Lessons Learned In CMMI Process and Product Quality Assurance process design studies held at BIMAR, it was experienced that despite designing a process requires intensive work, it is pleasant study. Other lessons learned are below; Being present in studies on exact time and
regular attendance are important for success. Bringing each process group member’s
understandings to same level, prevents the discussed idea to appear in later studies. Preparation to studies and looking over
previous notes increase the speed of current study. 2.3 Supplier Agreement Management 2.3.1 Purpose In CMMI Supplier Agreement Management process design works held at BIMAR, following purpose were suggested by processing group.
37

To find and recommend our customer; • The most satisfying, accute and exact solution
(not less than and not more than our customers’needs ),
The cheapest solution, The fast solution, The most correct solution, The minimum risk, The latest techology, The most useful
Solution corresponding to our customer requirements and managed this aim with supplier agreement. 2.3.2 Metaphor In CMMI Supplier Aggrement Management process design studies held at BIMAR, following metaphores are suggestes by processing group to use in process development works. While designing the metopher, we imaged the rental car company that rents car from suppliers and rent cars to customers. Prerequisites Customers Beginning Criteria (prerequisities) Potential Customer Forecast Demand Planning Special Customer Request After Sales Agreement Preparing rental aggrement Preparing an insurance aggrement Preparing guarantee agreement Preparing leasing agreement (credit purchase) Preparing sales agreement Finding Customers and Cars Methods Renter Suppliers (we rent cars from this company) Company’s owner Loan Renting Purchase Credit purchase Special order (talior made) 2.3.3 Customers
In CMMI Supplier Agreement Management process design works held at BIMAR, following customer groups of Supplier Agreement Management Process were determined: In this step we used our metaphor and brainstorming.
1. Arkas Holding companies 2. Arkas High Level Management
3. IT Systems Coordination 4. Our suppliers (even their sub
constractor) 5. Bimar S.A.
2.3.4 Main Steps
In the CMMI Supplier Agreement Management process development works which is held at BIMAR, following steps has been defined as main steps of process.
1. Project Plan Preparation a. Details Analysis of
Customer Requirements b. Possible supplier research
2. Analysis and request for information a. Short list preparation b. Request for information and
scorecard 3. Make supplier choice
a. Short list preparation b. Request for information and
scorecard 4. Signing of the agreement / contract
a. Preliminary enquiries before signing
b. Signing of contract 5. Agreement Flow - Control
(Customize / Development) a. Supplying additional
hardware, software and infastructure
b. Customize/Development c. Acceptance Test d. Installation (Installation,
Power user acceptance test and go alive)
6. Closing Project a. Customer Agreement b. Customer Satisfaction
Survey ( Supplier, Product, Bimar)
c. Supplier Agreement d. Supplier Project Evaluation e. Project Technical
Evaluation
2.3.5 Brain Storming
Brainstorming was used mostly in the activities below;
Choosing the metaphor, Setting the process goal,
38

Setting the process activities, Setting the process customers.
2.3.6 Simplifying
Brainstorming method was used to collect the iadeas of the team. To design a simple and easy to understand process; 1-The result words/sentences of brainstroming were discussed. 2-The items discussed were converted to simple and easy to understand sentences. 3- As the metaphor chosen was good, it improved the team’s way of thinking. 4- Help was taken from the other process teams about the simplicity of the process steps.
2.3.7 Applicability To design an applicable process; 1- Experience of the team was used. 2- Every activity was tested by the question “If we were the one to fulfill this activity, what would we think and feel?” . 3- The applicability of the activity was discussed in the light of current circumstances and problems. An example is below;
6.3.2 Analyse and Reguest For Information Applicability
1. To have a supplier database 2. The supplier database should include the
supplier performance analysis results. 3. The supplier database should include the
critea of suppliers that can be worked. 4. The supplier database should include the
supplier product information.
2.3.8 Measurements After simplifying and improving the process steps, process indicators were set in order to measure process performance and to be able to give reports to management. To improve the process is also aimed while setting the process indicators. An example is below;
6.3.3.2 Proposal and Validation Measurements
1. Planned and real duration, number of people worked and effort (man/day) for each process step.
2. Planned and real duration for each meeting. (Meetings are grouped according to their goal.)
3. Number of times the proposal was rejected.
4. Product cost 5. Number of pages of the proposal 6. Time between sending the proposal and
the reply. 7. Number of criteria in the scorecard 8. Number of suppliers 9. Number of logical errors in the proposal. 10. Number of rejected items in the
proposal. 11. Number of updates on the proposal.
4.1. 10. Lessons Learned During the process improvement project we learned very important technical and teamwork lessons. We observed positive improvement during the process improvement project about the team. Some of the lessons learned are below;
- The team should attend all the meetings as much as possible and everyone should be on time.
- In the beginning of every meeting, the roles are set. Only the process leader’s role – manager of the meeting – is fixed.
- In the beginning of our process improvement project, perfect ideas were discussed usually. But after the team realized that “the process designed should be acceptable and applicable by all company” the best solution for BİMAR was discussed instead of the perfect one.
2.4 Measurements and Analysis 2.4.1 Purpose The purpose of the process is
o helping the firm for reaching the firm targets by supporting the concrete data
o evaluate the chance and problems just in time o build a warning system and support its
continuity
2.4.2 Customers
39

Top management are the only customer of the Measurement and Analysis Process. Other requests owners should transmit their requests through their managers. 2.4.3 Main Steps
• REQUEST CREATION • DESIGN • VALUE ADDED ANALYSIS
A REQUEST CREATION A1 Making a presentation that contains the
advantage and the results of the measurement projects to the top management as a period of three months according to their authorization levels.
A2 Getting the targets which prepared by the customers.
A3 Suggesting measurement targets to the managers by using firm targets, market analysis
• B DESIGN B1 Getting the target of the measurement
for the Measurement Projects B11 Filling the Target Definition Form B2 Preparing Measurement Project Plan B21 Filling the Measurement List Card
(Obtaining target of measurements by defining the necessary measurements and their relationships. Finding alternative methods and choosing the best one )
B22 Filling the Measurement Cards (Each measurement card contains one measurement)
B23 Filling the Qualification Cards (Measurement Qualification cards divided into works that takes 2 days. Each qualification card is prepared for one measurement card.)
B3 Managing Measurement Project Plan B31 Filling the measurement method form
for each measurement according to qualification card. (This card contains the method of collecting the measurement results)
B32 Filling the information form. (This card contains the measurement analysis methods and their communication plan)
B4 Pilot Project B41 Defining the pilot project B42 Managing the pilot project
B43 Evaluating the result of the pilot project and if necessary, updating measurements or their methods.(if necessary back to the step B2)
B44 Customer Approval
B5 End of the project B51 To become wide spread (education,
sharing user manual and forms) B52 Sharing the Project outputs with the
Quality and the Configuration Management teams
• C VALUE ADDED ANALYSIS
C1 Tracing the measurement method form and the information form for meeting the targets with the requirements
C2 Evaluating the advantage of the measurements among top management of the Bimar
2.4.4 Brain Storming We defined the main steps beginning from the goals of the Measurement and Analysis Process. For each step we use the brainstorming method. 126 items were found and categorized. 2.4.5 Simplifying We traced all steps when simplifying, we used figures and process library for understanding each other and also the Measurement and Analysis Process. As a result of this work we obtain the different main steps from the brain storming study and create new forms. 2.4.6 Applicability REQUEST CREATION
o General Measurement Analysis Leader role must be assigned
o Attention presentation must be prepared o Ethic rules must be shared with top
management o Firms must have defined vision and targets
DESIGN o There must be at least one measurable
demand o Its purpose must be clarified o Measurement Project team must be assigned
VALUE ADDED ANALYSIS
40

o Measurement Method Form and information form must be prepared
o The cost of the project should be lower than the profit of the project
2.4.7 Measurements DEMAND CREATION The number of demand per period of time DESIGN Project planning duration Project Management duration Pilot Project duration The expected cost profit ratio of the project The real cost of the project VALUE ADDED ANALYSIS Recovery project cost / Expected profit Measurement operation cost / Expected profit 2.4.8 Lessons Learned Recovery Proposal Some topics are over-negotiated Our agenda was un-structured Agenda was not properly followed We have difficulty on understanding each other Sometime we didn’t skim the lessons learned part
at the beginning of the meeting We haven’t got a detailed agenda tasks so we
didn’t have a feeling of the end of task. Sometimes tasks were as a group because of that we finished half of the task and couldn’t close the task.
Positive Perspective It was a very efficient study for the first time
of the group Standardization of the terminology enhanced
the communication Flow Charts make us understand each other
easily Conflict among group demonstrates that we
have an idea about topic Preparation of the scenario makes process
steps more clear. Keeping the all documents in a specific folder
accelerated our study
Figure 5 – Measurement & Analysis System 3 Conclusion We have tried to describe in this paper the ingredients of the process design. Namely, the roles required in the process design team, the value of using a metaphor, how to find the purpose of the process designed by using the techniques such as brain storming and simplifying then how to make processes more applicable and measurable. The last point explained was the lessons learned to make better meetings. We believe that the secret of good work is teamwork and communication. We managed to become team and we never underestimate the value of good communication and encourage participation. Then the conclusion is success. 4 References 1. SEI, CMMI-SE/SW/IPPD/SS Version 1.1,
Carnegie Mellon University, March 1, 2002 5 Acknowledge
This paper would not possible without commitment of and support from the top management team whose members were İsmail Berkan, Hakan Erdem, Köksal Ataman, Umut Altınay, Azim Aydınlı, Osman Çiftçi, Sarit Dinmez. Many thanks should go to the process members: Project Tracking and Oversight: Özge Yılmazkurt, Habil Şenocak, Murat Feruz, Zeynep Demiralp, Şenol Bolat, Hüseyin Yağcı Process and Product Quality Assurance: Güner Mutlu, Güliz Gököz, Sibel Demirayak, Murat Çelik, Aydın Şen Supplier Agreements Management: Hüseyin Kiraz, Naciye Saatçi, Esra Soydaş, Kübra Doğan, Zakire Yıldız
41

Measurement and Analysis: Volkan Sevinçok, Oya Altay, Lütfi Süvari, Betül Semercioğlu, Selin Erdoğan
42

Real Life Experience Using CMMI L2 Processes and XP Practices
Orhan KALAYCI Nitelik Danışmanlık Ltd.
Sarit DİNMEZ Emel SAYGIN
Serden FERHATOĞLU Gülfer AKGÜN Şenol BOLAT
Hasan ÖZKESER BİMAR Bilgi İşlem Hizmetleri A.Ş.
[email protected]@izm.bimar.com.tr
[email protected]@[email protected]
Abstract
In December 2003, BIMAR has initiated an SPI project to reach CMMI L2 in 2004 using XP practices. Nitelik Danışmanlık Ltd. has planned and conducting the project. This paper aimed at describing the pilot project in which three CMMI L2 processes, namely Requirements Management, Project Planning, Configuration Management, together with three XP practices, namely, customer as a member of team (card system), pair programming, first test then coding. The pilot project concluded very successful. The CMMI processes and XP practices were working very well and in harmony. 1 Introduction In 2002 BIMAR has initiated a Change Program aiming at enhancing the customer satisfaction. A part of the Change Program was improving the software development processes. SPI program has been launched in 2003. CMMI has been chosen as the maturity model for the software processes to be improved. XP has also been chosen as the software lifecycle model to be used together with CMMI. [4] In this sense, it is the first experience in Turkey for using CMMI processes and XP practices together. In this paper, we would like to share our experience about piloting CMMI L2 processes together with XP practices. The processes piloted in the study are Requirements Management, Project Planning, and Configuration Management. XP practices piloted are Planning the game (cards), pair programming, first test then coding, customer as a team member. For each process piloted we have given the following information: purpose of the process , metaphor used in
designing the process, main activities identified for the process, and strategic decisions about the process. For the XP practices, following topics will be given: Observation made about using the cards In XP for planning the game, experiences about pair programming, and first test then coding implementation. [1] 2 CMMI Processes Piloted 2.1 Requirements Management 2.1.1 Purpose [5]
Make the customers’ needs to be taken correctly, accurately and exactly.
To take managerial commitments from both BİMAR and the customer..
To keep track of these commitments and therefore, to provide their return to the customer, on time with minimum errors.
2.1.2 Metaphor While designing the metaphor, we imagined a restaurant that works on a special-order basis. We performed an environment that lets each customer describe and tell the cooks whatever meal he/she enjoys to eat. For the waiter, we created a role which; kindly meets the customer at the front, gets the details of the orders, gives information about the status of the kitchen, without any negative effect to other customers, prohibits any external disturbs while the meal is prepared by the cooks and the customer, and finally lets the customer to leave the restaurant with good mood and positive emotions. Our customer not only could bring his suggestions while cooking the meal cooperatively, but also would have no hesitation about the time being spent and the type of ingredients that is being used.
43

Müsteri
Mutfak Şefi
Bekleme Salonu(Sıra Verme)
Mutfak
Otopark Çocuk Alanı WC
AşçıAşçıMüşteri
Şef
AşçıAşçı
AşçıAşçı
AşçıAşçı
Müşteri
Müşteri
Müşteri
Kapı
Tedarikçi(Manav)
Tedarikçi(Tüpçü)
Tedarikçi(Kasap)
Müşteri Müşteri Müşteri
Müşteri
Müşteri MüşteriMüşteri
Müşteri
Garson
Garson
Şef Garson
Şef
Mutfak Şefi
Kapı
Figure 1 – Metaphor As a result of this methodology, our goal becomes, to have the customer eat his/her actual, desired meal, and to have the staff work in a more comfortable and more productive environment. 6 major steps have overcome after the metaphor task,
Take order Proactive Approach Forward (Scale, Communicate) the Order Keep Track of the order Sophisticated (Qualified) Approach Close the order
Figure 2 – Main Steps for Requirements Management
We combined the ‘Communicate the order’ step into the obtain the order step, thereby performed 4 major steps. See Figure 2.
Taking the order Keeping track of the accepted order Close the order.
The below two steps are thought to be included in all the steps, because they are important in the whole story for enhancing service quality and customer satisfaction.
Proactive Approach Sophisticated Approach
2.1.3 Main Activities
Take the Order;
MüşterininKarşılanması Sipariş Detaylarının alınması Fiyatlandırma
(Teklif) Onay
Siparişin Alınması
Figure 3 – Taking the order In this step, first of all we check whether
the customer has the authority to make an order. Then, we help him/her to meet with the correct person to contact in Bimar.
After this appointment, the customer needs are obtained by qualified software personnel by using Customer Cards and verification (Test Scenario) cards. .
The estimated time magnitudes that are given by the Software Forecast Team (The Bimar software experts, who help the customers to fill the Customer cards and actually identify the estimated completion time value of them) are used in order to form a price proposal and eventually let a final offer to come into life.
When the proposal of the software Project is accepted, a rendezvous date (Project Start Date) is asked to the Project office.
Siparişin Alınması Onaylı Siparişin Takip Edilmesi Siparişin Kapatılması
Gereksinim Yönetimi Süreci
Keeping Track Of Accepted Order;
Onay - Randevu TarihiDönemi RandevuTarihi(Başlangıç) - Kapanış Dönemi
Siparişin Takip Edilmesi
Figure 4 – Keeping track of accepted order We divide this step into two time
intervals; First level is following and managing the states between the acceptance and the rendezvous date. Second level is between rendezvous date, which means the start of the Project studies of the Project Office and the termination of the Project again by the Project office.
In the life cycle of the Software Project,
the issues about the scope and cost are handled by the Customer Relations Representative, however, the issues about
44

Time and Quality are handled by the Project Leader.
Closing Of The Order;
Mali TakipMüşteri MemnuniyetiÖlçmeTeknik Kapanış
Siparişin Kapatılması
Figure 5 – Closing the order This step starts working, whenever an information comes from the Project Office that the studies are completed and Project can now be closed.
The attributes of the customer about this
Project are taken by a Project inquiry questionnaire form.
As the technical closure is made, the Project resources become available.
Financial track includes invoicing of the products and control of the payment.
2.2 Project Planning 2.2.1 Purpose
The purpose of project planning process can be described as the following recursive steps: [2]
Do the most valuable(the most important, urgent etc...) thing
Coordinate the related parties If any change occur, go to the first step
2.2.2 Metaphor The Japanese Restaurant is used as the metaphor, while designing the process. There is the hall at the entrance of the restaurant in which customers wait until get to the dining room.. In the dining room, there are the tables at which food is cooked by the two cooks in accordance with the customer’s desire. Waiters takes the orders from customers at the saloon and forward to the chief. The chief lines the orders up and get the customers to the empty tables in the dining room. Food is cooked under customer’s very eye and until the customer say “It’s ok”, cooking process continues. At the end, the customer and his/her family can eat the meal.
In this example, actually the chief is the project manager and the cooks are the programmers. The chief gets the right customer and the right cooks together, plans the works, follows the matter and solves the problems. 2.2.3 Main Activities Project activities were performed, according to the process, whose main steps are project planning, project tracking, closure. At the beginning of the project, iteration based planning was tested. This was the first meeting with cards. The customer cards were grouped to constitute the working program parts. One part, would be completed in one iteration(4-6 weeks). Then, the technical cards were filled. The customer cards were divided two day lasted technical cards and then the project plan was done. We saw that, the cards would make the project planning much easier. In addition to this, to keep track of the project tasks, divided into small parts, would be getting easier. At the end of the 2 day, the average duration of the technical card completion, the status of the card would be apparent, the problems which negatively effect the time schedule could be realized early and solved before too late. Because the programmers worked as pair, the real task durations were shorter than planned. High quality programs were produced and the customer was very satisfied with the outputs. The work environment is very important for the productivity of the programmers. Because of this, the environment should be planned at the beginning of the project. The pair programmers should work together at one conformable table without disturbed by any other thing such as telephone, other people etc.... During the project, if the pair programmer and the customer meets every day and work together for several hours, that project will be successful. As a result of such a communication, changes in the requirements can be easily accepted and acted quickly against the change request. The most powerful way of sharing the information is the face-to-face discussion. During the project, regular status meeting was hold to make the information distribution homogeneous and to develop the solutions
45

as a team for the problems. As a result of the good team work the project was successfully completed. 2.2.4 Strategic Decisions
1. In order to make the program management successfully, during the projects, their time schedules should be fixed and should not deviate from the schedules.
2. In order to create customer satisfaction and Bimar prestige, allocate the less resources for bug fixing: Quality shouldn’t be sacrificed.
3. Invoicing should be made when the working parts of the program is completed and not delivered at the end of the whole project. So, the offer should include the flexible cost.
4. This process will be used only for the software development projects in Bimar.
5. According to the project’s size and urgency, different approaches will be adopted to the project. For example, for an urgent and middle sized project, the approach will be ‘start immediately and document later’.
6. The project will be planned iteratively. 7. The project will be planned by using the
cards. [2] 8. The customer cards will be created as
manageable, independent, small parts. For example, a pair programmer will be able to complete the card max. in 2-3 weeks. [2]
9. The team works in only one project at a time and to concentrate on this they shouldn’t work for another project.
10. XP suggests the specialization in the business area and don’t suggest the technical specialization. [3]
2.2.5 What the pilot project means for Bimar
In the Bimar project team, there were the team members which act in the project as the customer. While, the project was executed with the old methods with the real customer, the new process was tested with the “imitation customer”. Before applying the process to the real customer, This test provided the chance to make the necessary improvements in the process “In theory, there is no difference between theory and practice but in practice, there is!”. The opportunity that comparing the designed process
and the realized process, provided the process design teams to see the differences between them. During the project, primitive quality assurance, measurement and analysis reports were prepared and process improvement was exercised. This exercises created the ideas to make the process more convenient. For example, to make the process more practical, standard content templates(communication plan etc…) were created.
During the process design, the good team work and taking into consideration every idea are the critical success factors. The process was designed by the team containing the people from different departments. After the design period, the spreading period starts. The project team members who acted in the process design, acted actively to execute the process during the project. As a result, process spreading activities is predicted to be effective.
All the process design and spreading activities shows that Bimar takes big steps along the learning organization’s way. At this age, the organizations who act quickly against the changes will be successful. We are proud of working in such a company which learn to live in the changing environment.
2.3 Configuration Management The Configuration Management System is a system that provides and maintains the consistency and integrity by using the identification, control, status assessment and audit activities for work products that form the values of an organization. The Configuration Management System is designed for purpose of protecting the data that is the most valuable asset of an organization. The existence and usability of the Configuration Management System in an organization ensures to access the most reliable data in a speedy and easier manner within the limits of authorization. 2.3.1 Purpose The purpose in establishment of the Configuration Management System is to identify the work products to be kept in this system, to follow up the modifications on work products and to provide and
46

maintain their consistency and integrity by making control on them. For this purpose, the special Goals and practices of CMMI level 2 are as follows; [5] Special Goal 1. Establish Baselines
Specific Practice 1.1 Identify Configuration Items Specific Practice 1.2 Establish a Configuration Management System Specific Practice 1.3 Create or Release Baselines
Specific Goal 2. Track and Control Changes
Specific Practice 2.1 Track Change Requests Specific Practice 2.2 Control Configuration Items
Specific Goal 3. Establish Integrity Specific Practice 3.1 Establish Configuration Management Records Specific Practice 3.2 Perform Configuration Audits
After the Configuration Management System was established in the company, a Configuration Management Plan has been prepared for the internal pilot project with which the functionality of the system to be tested. In the plan, the work products to be included in the system, authorization on the work products and relations between them are defined. During the project period, in conformity with the prepared plan, the consistency and integrity of the Configuration Management System for the project has been ensured , by following up the modification on work products and the version management. During the performance period of the internal pilot project, the joint operation of the configuration management process and other processes have been observe, the resulting suggestions been assessed at the status meetings and improvements been made for the process. 2.3.2 Metaphor In the process design and internal pilot project studies, the bank has been used as a metaphor. The purpose, working method and customer satisfaction understanding of the bank and the configuration management system are almost similar. To use a metaphor during the process design and internal pilot project studies, has made the idea sharing of the team members more productive.
2.3.3 Main Activities In the design studies of the Configuration Management process , it has been determined that there is a need for the roles such as General Configuration Manager and Project Configuration Responsible ,and some persons have been appointed for such roles in the internal pilot project. While applying the configuration management process in the internal pilot project, three main steps that were established in the process design studies have been operated. Three main steps for the configuration management system are as follows; 1. Project-Starting : The top management has the authority to start a project in the Configuration Management System. A Project Configuration Responsible is appointed for the project. The Project Configuration Responsible, together with the Project Manager or Project Customer Relations Representative, prepare a Project Configuration Management Plan. The prepared configuration management plan is sent t with the demand form to the General Configuration Manager by the person who demands to start the project. The General Configuration Manager operates the Project-Starting step. 2. Project-Operating : In the Project Configuration Management ,a demand form is completed to perform a procedure on the work products . For the related demand, the Project-Operating step is operated by the Project Configuration Responsible. Within the performance , the following procedures are included.
To check in the work product To check out work product To delete the work product To create a baseline To withdraw the baseline To update the data on work product
3. Project-Ending: In the Project Configuration Management, the Project manager or in case he /she is not appointed , the Customer Relations Representative has the authority to make the project ending demand. With the demand of project ending, the Project Configuration Responsible operates the Project- Ending step. Certainly, during the application period of the Configuration Management System, some difficulties have been experienced to eliminate them, some improvement have been made.
47

The purpose in the internal pilot project is to identify and eliminate the deficiencies for all the processes and by assessing the suggestions and approaches to the process, to make improvements. During the performance period of the internal pilot project, it has been determined at the beginning that the persons included in the project did not know the Project Configuration Management and its significance and besides, its application was like a big load. Additionally, other processes did not trigger the application of the Project Configuration Management. In order to clarify this point, an informative guide has been prepared to emphasize the significance of the Project Configuration Management and make its application easier. Again, in the studies carried out during the application period of the pilot project, a theater idea was suggested , all the processes came together to work together with this regard, and an educative scenario about the functionality of processes and their relations was prepared in BİMAR. The persons included in the process transformed the scenario to a play and it was showed to all the BİMAR employees. Thanks to this play, all the designed processes , including the Project Configuration Management process, became more understandable for the audiences and process project teams. Another issue was that, when any work product is wanted to be taken from the Configuration Management system just for purpose of reading ( not to want to make any modification but just to review), whether it is necessary to complete a form for such a procedure. As such questions were asked very frequently, by improving the application process of the system, the reading authorization has been given to everybody who works for the project and so this problem has been eliminated. Again, by considering the suggestions to simplify the Configuration Management System Demand Form that must be completed for each demand in the Configuration Management System, it has been decided to make improvements on the demand form. 2.3.4 Strategic Decisions
The strategic decisions that were taken during the process design and internal pilot project studies and approved by the top management are as follows; A tool must be used for the sound operation and
functionality of the Configuration Management System. However, to determine the expectations and selection criteria related to the tool to be used, firstly a system has been designed and decided to operate manually. For this reason, during the internal pilot project studies and project studies for a while, a file server to store the work products and MS Excel to store the movements and relations of the work products within the system will be used. On the File server, there exist confidential and private areas related to the project.
Confidential area: It is an area separated for the baselines and ended projects that only the General Configuration Manager is authorized to access. Private area : It is an area separated for the ongoing projects that only the Project Configuration Responsible is authorized to access.
As no tool has been used for the Configuration
Management System yet and its manual follow up is difficult , the work products out of project and source codes will not be included in the Configuration Management System.
To follow up the work products of the confidential area in the Configuration Management System, there must be a Company General Configuration Management Plan.
For each project to be taken into Configuration Management System, there must be a Project Configuration Management Plan.
There must be General Configuration Manager and Project Configuration Responsible roles in the company.
General Configuration Manager: he is responsible for the confidential area in the Configuration Management System. He caries out and follows up the procedures of the project starting, project ending and to create a baseline steps in the confidential area .He is responsible for following up the company General Configuration Management Plan. Project Configuration Responsible: In the Configuration Management System , he is the full authorized person in the special area for the project he
48

is responsible for . He is responsible for the operation of all the process steps in the related project and following up the project configuration management plan. 3 XP Practices Piloted 4.1 Cards Cards are tools that the customers can write their requirements in detail and that are used to determine the projet duration and cost. Customer cards should be written by business specialists that have the enough authority and business knowledge. These business specialists are to be assigned by their managers and they will work as a team member. They should work with the team preferably 5 days a week, and not less than 2 days. Each card written by the customer should include maximum 2 weeks of work. The cards that are longer than 2 weeks should be and rewritten . [1] Validation card is written by the customer, after the customer card, in order to define how to check the output. Validation card includes the acceptance criteria for the relevant customer card. The cards should be prioritized according to ist urgency and possible earned value, by the customer. The card chosen are implemented by iterations and delivered to the customer. During the project, the customer may realize that some of the cards are not important for him and may cancel them. The advantages of a making project using cards are below;
Schedule plan and scope are trackked up to date.
Customer should only need to pay for the finished parts (cards)
Makes the prioritization of the requirements easier.
In our pilot project our new way of working was first presented to the customer. The customer was positive about the card system. He told that a project we did for them in the past would be more successful if we had used this system. A business specialist was assigned for the project by the customer. The business specialist, working together with the Software Estimation Team, wrote the requirements on cards. After the project started, he worked together with he project manager to prioritize the cards and plan the following iteration. The customer could track the status of the project easily as the periodic status reports were written in terms of cards. The customer satisfaction was increased as he worked with the team and could see the results as soon as the work was done. And also he could make
changes in his requirements and added new ones while working with the team. At the end of each iteration the programs for the chosen cards were delivered to the customer. Our pilot project was finished in 3 iterations. We found out that the customer was pleased with our new way of working by the results of the customer satisfaction survey we made. Card examples:
Figure 6 – Customer Card
Figure 7 – Validation Card
Figure 8 – Technical Card
3.1 Pair Programming
The pair programmer means that two programmers sit on the same table and look at the same screen and write code by rotation. As
49

one of them writes the code, the other traces the code at the same time. [1]
At first sight, it may seem to allocate two programmers for the same project, in practice it is very good idea. It was seen that at the pilot project that the team of two programmers writes code more quickly than the one programmer. Because the second eye traces the code, the problems are realized and solved early. In addition to this, controlling the code continuously reduces the bugs, as a result, the number of defects are inconsiderable. The time is saved and the products are in quality. As the mathematical formula, it is expressed that the time to write code and fix the bugs by the two programmers separately is more than the time to write code by pair programmers. At the beginning, there may be problems due to the difference in level of the knowledge of programmers but as the time passes it becomes unimportant. While implementing the XP practices, the difference in level between the programmers seems to be the disadvantage, as the time passes, it is seen that this difference is not very important and one programmer can catch up with the other. But obviously, if the knowledge of the programmers are in the same level, projects go faster. However there is an important advantage of this work style that the new programmers in the area learns very quickly by working together with the expert programmer and start to produce the code in the area. As a result the knowledge is shared and become homogeneous in the organization. Of course, the psychological factors should be concerned also while the pair is gathered. If the pair programmers get along well together, the project goes well, work become pleasurable.
3.2 First Test then Coding
At the project, program codes was written by RPG on the IBM AS/400 system.
Figure 9: Test program is calling the main module provide it with the inputs and check outputs fit to expected outputs
Differently from the classical approaches, according to the XP practices, first the test code was written. [1] To write the test code, firstly inputs and outputs were defined.(Figure 9) While the test code was written by RPG programming language on the AS/400 system, the most difficult task was how to get the inputs. The cause of this is that, in RPG language, screens run integrated with the code and without conditions in the source code, program doesn’t run in the test mode. This kind of changes in the main program was tried to minimize. Depend on the function keys, for the data that will be listed on the screen from the any database, worked to get the inputs and test the outputs The goal of the test method, to control the program by the another program. While writing the test code, at the beginning for the every test, some test data were defined as the constant. For example, to match the port number and the port names, they are defined as the constant data, and then port number is gotten from the database dynamically and verified. This method provides the long-lived test code, it can be used without any change in the future. Besides that, for every test, the physical file is created on the AS400 and the test data is entered to this file. Samely, the data at the end of the test is saved to the
50

another physical file. Then at the end of the test, the control list was built by comparing the outputs of the main program with the test data. The outputs means that the data which the user would like to obtain. This can cause some difficulties in file management, because the number of the files increases while testing the complex modules. Every information entered by the user or on the lists should be controlled by the test program. In RPG like programs, to write the test code of the program, prepared to get lists, is more difficult than to write the test code for the screen controls. This difficulty increases as the lists get bigger and more complex. In spite of these difficulties, this method provides quality software and as a result high customer satisfaction. The other advantages of writing the test code are the followings;
1- While writing the test code, it is possible
to look at the program from different respects and the defective points of the program can be noticed.
2- With the different data, all the program conditions are tested.
3- Programs can be tested every time when desired with pressing only one key.
4- The test is made by the program and this provides the objectivity in testing.
5- It can be observed that, how the last changes in the program effects the old program.
4 Conclusion
We found that XP practices are very well supporting CMMI processes: Requirements Management, and Project Planning, project planning process becomes very trivial when cards used in hardcopy as suggested in XP. However, using hardcopy cards have some disadvantages considering to Configuration Management. The final word can be “While CMMI creates an organizational discipline XP ease the daily life by providing pragmatic end result oriented practices. CMMI and XP can be very well used together and their synergy is incredible”
Cards Pair
Programming First Test then Coding
Requirements Managements
++ N/A +++
Project Planning
+++ ++ ++
Configuration Management
-- N/A N/A
Table 1 – Relationship between some of CMMI process with some XP practices
5 References 1. Kent Beck, “Extreme Programming Explained:
Embrace Change,” Addison-Wesley ,October 5, 1999
2. Kent Beck, Martin Fowler, “Planning Extreme Programming” Addison-Wesley, October 13, 2000
3. Ron Jeffries, Ann Anderson, Chet Hendrickson, Extreme Programming Installed, Addison-Wesley, October 13, 2000
4. Orhan Kalaycı, CMM vs Extreme Programming, Impact of Software Process on Quality, Bilkent University, June 2003
5. SEI, CMMI-SE/SW/IPPD/SS Version 1.1, Carnegie Mellon University, March 1, 2002
6 Acknowledgements This paper would not possible without commitment of and support from the top management team whose members were İsmail Berkan, Hakan Erdem, Köksal Ataman, Umut Altınay, Azim Aydınlı, Osman Çiftçi, Sarit Dinmez. Many thanks should go to the process members: Requirements Management: Emel Saygın, Zerrin Sadi, Berkin Enbatan, Hakan Erdem, Kerim Önder, Necmi Şentuna Project Management: Serden Ferhatoğlu, Aydan Kantar, Şenay Çalışkan, Habil Şenocak, Gökhan Dağhan Configuration Management: Gülfer Akgün, Gökmen Eren, Hasan Özkeser, Hülya Küçükyörü, Özge Yılmazkurt,
51

Real Life Experience – XP Practice: First Test then Coding
Orhan KALAYCI Nitelik Danışmanlık Ltd.
Şenol BOLAT
Hasan ÖZKESER BİMAR Bilgi İşlem Hizmetleri A.Ş.
[email protected] UH [email protected]
Abstract
In December 2003, BIMAR has initiated an SPI project to reach CMMI L2 in 2004 using XP practices. Nitelik Danışmanlık Ltd. has planned and conducting the project. Total of seven processes described in CMMI L2 has been divided into two groups. The first group was including four process, namely, Requirements Management, Project Planning, Configuration Management, Supplier Agreements Management. Design of the first four processes was completed in March 2003. The newly developed CMMI L2 processes and XP Practices have been tested in a pilot project. One XP practice, namely, “First Test then Coding” was so interesting and useful in terms of end results that all the engineering department appreciated it so much. We decided to share this experience with this paper. 1 Acknowledgements
This paper would not possible without commitment of and support from the top Umanagement team Uwhose members were İsmail Berkan, Hakan Erdem, Köksal Ataman, Umut Altınay, Azim Aydınlı, Osman Çiftçi, Sarit Dinmez. Many thanks should go to the process members: URequirements Management:U Emel Saygın, Zerrin Sadi, Berkin Enbatan, Hakan Erdem, Kerim Önder, Necmi Şentuna UProject Management: U Serden Ferhatoğlu, Aydan Kantar, Şenay Çalışkan, Habil Şenocak, Gökhan Dağhan
UConfiguration Management:U Gülfer Akgün, Gökmen Eren, Hasan Özkeser, Hülya Küçükyörü, Özge Yılmazkurt,
2 Introduction
At first glance, the idea “let’s first code the test scenarios then begin to coding” was not sound as a practical thing to follow. When we think the project will be coded in AS/400 the idea sound even more difficult to implement. However, after some brain storming how this approach could work, we found a way to do it. This paper is explaining the way we found and trying to give courage to other software houses in Turkey for attemping the first test then code approach in their own project because we found it is very much useful and beneficial.
3 First Test then Coding Practice
Besides the other Extreme Programming practices and our newly designed processes, the most challenging practice was writing the test code before coding the program. In this section, we want to share our approach to the subject in the beginning and our experience while implementing this pactice.
3.1 The Pilot Project In our pilot project, after the scope was cleared according to our newly designed processes, we started to implement the extreme programming practices together with the customer. During the pilot project we worked according to many new
52

approaches. The most important ones were pair programming, using cards and working with the customer as a team member. Besides working according to our new processes and XP practices, as the pair programmers we were expected to write easy to understand and high quality code. The following XP ptactices were out of scope in the project;
- Collective ownership - Coding standards - Simple design - Refactoring - Metaphor
Although these 5 practices were out of scope, we will share our experience about our approach to them during the project, too. Below we want share our experience for each Extreme Programming practice.
1. Pair programmer: Pair programming means 2 programmers writing the same code at the same time. They work in one computer and they code in turn. While one of the programmers is coding the other one rewievs and inspects the code. We were worried about the difference in the knowledge level of the programmers about business, although during the project we found out that it was not very important. We can say that we were more motivated when we found out that this difference of level was not the most important issue.
Although it looks like it’s a waste of time to have 2 programmers for the same task, in practice different results were achieved. We saw that coding in pairs was definitely faster than a single programmer writing the same code. As we all know one of the major problems that we have is sticking to an issue. In this case it can take a long time to solve this issue. To have a pair that helps to look at the problem from a different perspective makes the time needed for solution much shorter. Also as the code is inspected and rewieved while it is written , the probability of making a mistake is lessened. Besides, as a
lot of code optimization effort is not needed, time to finish the task is shortened. The most important advantage of using this practice is high quality. Of course it is possible that 2 programmers can write a program faster if they work separately. But when we compare the difference between the time spent by the pair and the total time spent by the individual programmers including the solution of possible issues, we can see the importance of pair programming better. And also by pair programming we get a higher quality code. One of the things that should be in mind while using this practice is the business and technical knowledge level of the pair should better be close. When there is a big gap, it may affect the duration of the project. In spite of these issues, it also has a very special advantage. When we think of a new programmer as working in the pair, it’s an opportunity for him to learn the technical and the business subjects from the subject matter expert himself. This becomes an important advantage for the company to increase the level of knowledge and achieve homogenousity. While choosing the pairs, we think that people that don’t have personal problems with each other should be chosen. Although we did not experience this case, as people can have these kinds of problems, not only while coding, there is always a possibility of problems if this is ignored.
2. On-site Customer:
Before implementing the XP practice “On-site Customer “, meaning to work together with the customer during the project, in order to understand it clearly in BİMAR we initiated an internal project and one of the system analysts acted as the customer. We found out that working together with the customer had many advantages. Some of them are spending less time for communication, understanding the requirements clearly, increase in customer satisfaction and decrese in requirement changes after deployement. Especially getting the answer immediately in a business issue fastens coding in a great extent. Besides, as the customer gets the screens, reports etc. just in the format he wanted, adaptation to the program is easier. It also strengthens cutomer’s ownership. As
53

we all know, a serious amount of time is spent for the deployment and the acceptance of the program, besides coding it. As the customer accepts all the outputs of the project during the project, this time spent at the end of the project is decreased. The most important thing for this system to work is to make the customer spares enough time for the project. Most of the times the customer may not be able to do this because of daily operational work. Top managements’ commitment should be taken and the importance of the customer in this system should be shared with them in the begining of the project. Especially when the customer and the pair are in different locations, this becomes a bigger issue. Our solution about this issue was to go to the locaton where the customer was, when he did not have time to come to our office. It is not possible to be successful with XP practices if this practice is not implemented. We were successful in decreasing the deployment time and after 2 minor changes we could close the project. As a result we can say that our internal project reached exactly to it’s aim.
3. Coding Standards :
We tried to use a simple structure in order to have a readable and easy to maintain code while writing the test code and the program itself.
4. Simple Design:
Customer cards are prioritized by the customer, and the cards that don't have the first priority are ignored while coding the chosen ones. The requirements that can be useful in future and is not written on the customer card are also ignored.
5. Testing : We aimed to think of every possible case to be dealed in the program by writing the test code and preparing the test data before starting to write our program in order to decrease the possibility of skipping one, and we were successful.
6. Collective Ownership :
We can say that anyone in the company can change the written code of the pilot project
and see the affects by running the test codes written in our project. This makes to keep the changes under control easier.
7. Refactoring : Refactoring is needed not only because of customer’s new requirements but also when the programmers get a better understanding of the subject, they would like to solve the business problem with a simpler design in order to have an easy to maintain code. Refactoring includes to rewrite a part of or all of the code written till then. As the requirement changes in our project were small and we didn’t find out a simpler way to solve the problem, we did not need refactoring.
8. Continuous Integration: The program pieces we coded while working on technical cards were first tested individually. Later we tested them together with the other program pieces that were already tested. The bugs were determined in this early stage of development and fixed. This continuous integration and testing process let us find out the bugs early in the project and fix them quickly.
9. Small Releases :
When we finished the major part of the project, we had a usable program that worked and was a meaningful whole for the customer. This iteration lasted for 2,5 weeks.
10. The Planning Game :
Cards helped a lot for planning the game. We used customer cards to divide the requirements into maximum two weeks periods then technical cards have been used to divide technical work into maximum of two days periods.
11. 40-Hour Week :
In our pilot project we assumed a week as 15 hours, working 5 days a week and 3 hours a day. During all the project we needed to do overtime juts twice and for 5 hours.
12. Metaphor :
54

We did not need to use a metaphor as the subject of the project was one of the ones that we were specializied on.
3.2 Customer Cards and Test Scenarios Another topics about customer we’re going to share with you, are customer cards and validation cards which are filled out by customers to describe their needs and how they will validate if their needs are fulfilled. With customer cards, customer describes the task he wants to be covered. Because that the customer fills out the card by himself with his own handwriting, the card can be an evidence for any later change request. Furthermore details that could be missed in an interview, are wrote down on cards. Also change requests must be recorded on customer cards with their date and explanation by customer. This participation of customer strengthens his ownership of project. Pairs develop only the tasks on customer cards and they don’t think about any other details. Simplicty, one of four values of XP, starts to be applicable here. While filling out the cards, they should be divided into parts as small as possible. By this way, project can be monitored easier, delays in project schedule can be realized earlier, resources can be seperated according to business domain. With the help of these cards, also the project plan can be obtained easily. In our project, after fulfillment of customer cards, completion of project plan took a little time. These cards prevent the time loss which arises from the detail design at the beginning of the project and software development can start rather early. Another card is a validation card. While working with customers, technical terms should not be used a lot. So we named this card as validation card. With this card, customer describes how the program sholud be tested. Customer writes his needs on customer cards and writes the test scenarios of the programs he wanted on validation cards. Customer explains how this program gives response in different circumstances.
While filling out the cards, customer gives priorities to cards. After giving priorities, scope of the project is decided with cutomer and pilot project starts with the working of technical persons.
3.3 Technical Cards
Technical cards are those which include the program parts that desribe the tasks that will be done and they are filled out related to customer cards and validation cards. Technical cards explain the preparation of independent program parts which are integrated to compose a whole. In a project, tecnical cards can be completed at different times, so small versions can be released. By interating these small versions at predefined iteration end dates, runable and functional versions of whole program can be released.
3.4 Test Modules in AS/400
At the project, program codes was written by RPG on the IBM AS/400 system.
Figure.1 The Main Program and the principle of
the Test Code Differently from the classical approaches, according to the XP practices, first the test code was written.
55

Figure.2 Voyage Entry Table
To write the test code, firstly inputs and outputs were defined.
Figure.3 Booking Entry Table
While the test code was written by RPG programming language on the AS/400 system, the most difficult task was how to get the inputs. The cause of this is that, in RPG language, screens run integrated with the code and without conditions in the source code, program doesn’t run in the test mode. This kind of changes in the main program was tried to minimize. Depending on the function keys, for the data that will be listed on the screen from any database, worked to get the inputs and test the outputs.(Figure.4)
Figure.4 The List of Freights We are going to describe in detail how the test modules run at the Section 3.5.
3.5 Automation for Test Process
The goal of the test method is to control the program by another program. First of all, all the inputs were defined and the dahabase was created. At the same time, this database was used as the test data. The outputs for these inputs were inserted to another database. The outputs are the data which is desired to be seen by the user. After inserting the output data to the database as a result of the test, at the end of the test program, the control list containing all the outputs of the program was constructed by comparing the data in these two databases.(Figure 5)
Figure.5 Control List of the Test Program
In this list, there were the erroneous data and accurate data. We concluded that every information entered by the user or on the lists should be controlled by the test program. In RPG like programs, to write the test code of the program, prepared to get lists, is more difficult than to write the test code for the screen controls. This difficulty increases as the lists get bigger and more complex. In spite of these difficulties, this method provides quality software and as a result high customer satisfaction.
3.6 Difficulties encountered
In Bimar, the software development platform is RPG programming language on the AS/400 system. This was the challenge to write first test code by using this text based language. Of
56

course, we can’t say that, there won’t be any problems at the other platforms based on only this experience. To write the test code, firstly inputs and outputs were defined. While writing the test code, at the beginning for the every test, some test data were defined as the constant. For example, to match the port number and the port names, they are defined as the constant data, and then port number is obtained from the database dynamically and verified. This method provides the long-lived test code, it can be used without any change in the future.
Besides that, for every test, the physical file is created on the AS400 and the test data is entered to this file. Samely, the data at the end of the test is saved to another physical file. Then at the end of the test, the control list was built by comparing the outputs of the main program with the test data. The outputs are the data which the user would like to obtain. This can cause some difficulties in file management, because the number of the files increases while testing the complex modules.
3.7 When is it most useful?
In addition to these, based on our expreinces during the pilot project, we concluded the following advantages to write the test code.
1- While writing the test code, it is possible to look at the program from different respects and the defective points of the program can be noticed.
2- With the different data, all the program conditions are tested.
3- Programs can be tested every time when desired with pressing only one key.
4- The test is made by the program and this provides the objectivity in testing.
5- It can be observed that, how the last changes in the program effects the old program.
4 Conclusion
We found that we are not using the technology for ourselves as we are using it for our customers. That is to say, we have technology to automate our testing processes for years but we were not using
it. Because we were not thinking it was possible and economical. Now, it is very clear that the automation of our test processes is very much possible and economical compared to doing them manually over and over. Moreover, without an automated testing process the XP practice “common code ownership” is not probable because nobody wants to touch somebody else’s code unless he knows there is an automated way of ensuring you will not corrupt his code. As a conclusion, we have tried the first test then coding approach we were succesfull in implementing it, we found it very usefull and return of investment made to create test codes is unbelievable donot hesitate to make this investment, you will not regret.
5 References
Kent Beck, “Extreme Programming Explained: Embrace Change,” Addison-Wesley ,October 5, 1999
Kent Beck, Martin Fowler, “Planning Extreme Programming” Addison-Wesley, October 13, 2000 Ron Jeffries, Ann Anderson, Chet Hendrickson, Extreme Programming Installed, Addison-Wesley, October 13, 2000 Orhan Kalaycı, CMM vs Extreme Programming, Impact of Software Process on Quality, Bilkent University, June 2003 S. Sarper, O. Kalaycı, How to Institutionalize CMM in a SW Organization: A CMM Compass, European Quality Congres, 2001 SEI, CMMI-SE/SW/IPPD/SS Version 1.1, Carnegie Mellon University, March 1, 2002
57

Experiences from Teaching PSP
N. Alpay Karagöz
Ali Yıldız Bilgi Grubu Yazılım Araştırma, Eğitim, Danışmanlık Ltd.
{alpay, yildiz}@bg.com.tr Abstract It has been almost 9 years Watts S. Humphrey introduced the Personal Software Process, an individual process improvement initiative and published his book on this topic entitled “A Discipline for Software Engineering” [1]. Personal Software Process is a method developed for improving the personal capabilities of the individual engineer. There are ongoing studies on PSPSM, however, most of them are limited with academia. In this study we will share our PSP teaching experience and try to point out the difficulties, which are possibly some of the barriers that prevent widespread usage of PSP. The study is based on the student data gathered in the context of a graduate course that has been offered since 2002, as a mandatory requirement for fulfilling Software Management program of the Informatics Institute.
1. Introduction
Being the citizens of the software city, we are looking forward to seeing the high quality, defect free software artifacts and well-managed organizations that produce such products. To accomplish this purpose, in the past decade a number of Software Process Improvement (SPI) methods have been introduced in addition to the elder ones, which were also called “heavy-weight” approaches. All of those methods have some goals in common not regarding their weights, effective software development processes that produce quality software. Although some positive results have been observed, many of the SPI efforts have fallen short of their expectations.
The industry’s first reaction to these shortcomings was putting the blame on the process definitions and the documentation required by these definitions. People did not want more paper work and bureaucracy. Then came the agile processes to the scene, and promised less documentation and more communication. The major mind shift was the increased attention on the importance of the people component of the process improvement approaches.
In 1995 Humphrey introduced the PSP method, which aims at improving individual software engineering skills, but generally not cited as a light-weight method, because it is a disciplined process and includes engineering practices. PSP has been taught in the universities all over the world and some experience reports have been published. Our major aim in this study is to reflect our experience on PSP courses and try to identify some of the problems in the application of the in the academia.
The paper has been organized as follows. The next section presents a very brief overview of the PSP approach. The following section presents the context of the research and the course setting. This section is followed by our findings from the evaluations of the PSP assignments and in-class discussions. In the following section these results are discussed and some proposals are presented to overcome these problems. The paper concludes with final remarks.
2. Overview of PSP
The Personal Software Process is explained in detail in the textbook ‘A Discipline for Software Engineering’ [1]. PSP aims to address the need for process improvement in small-to-medium sized software organizations and small project teams. Humphrey states that software development is a rich and sophisticated process therefore, a single set of defined activities would not be adequate [5]. It must be recognized that all engineers are different and each must adjust their practices to establish their own personal processes.
Taking the Capability Maturity Model (CMM) as a base, PSP defines a subset of the CMM key process areas to be used by individual software engineers. Some of the CMM items are excluded because they require team environment to be applied (e.g. requirements management, software configuration management) or they relate to organizational issues (e.g. software quality assurance, training program), or they cannot be practiced at the individual level (software subcontract management, inter-group coordination). The PSP coverage of CMM key process areas are depicted in Table 1.
58
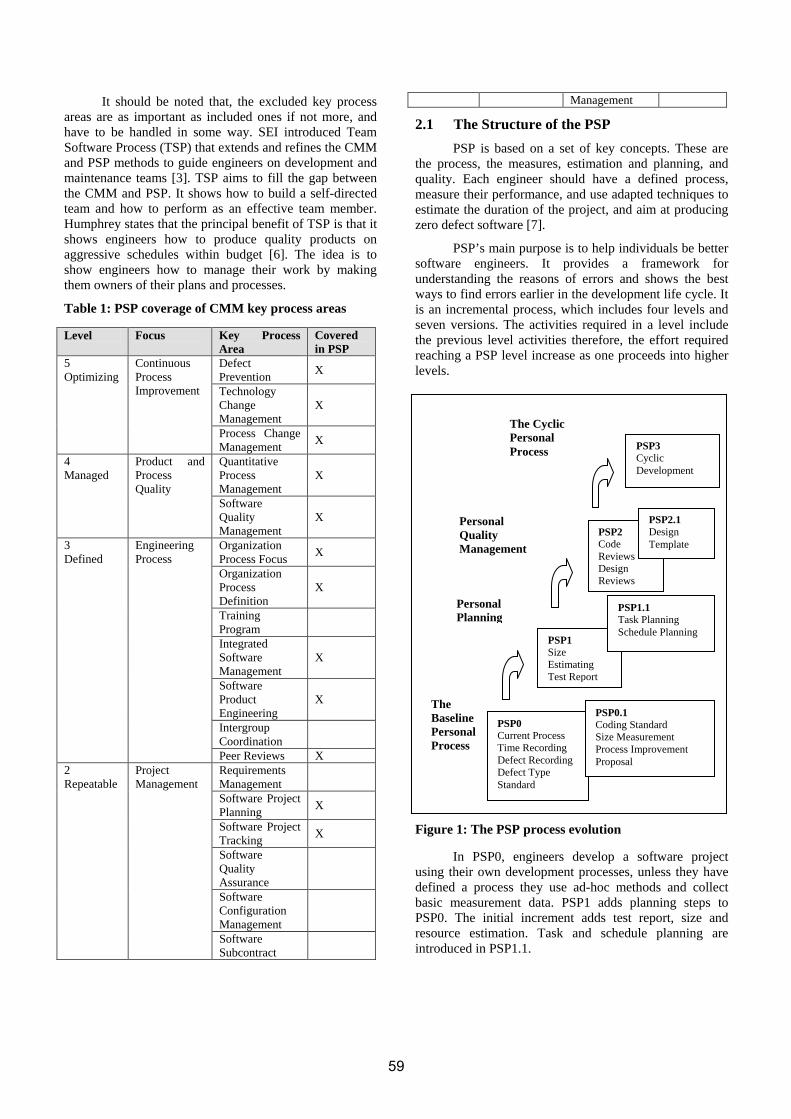
It should be noted that, the excluded key process areas are as important as included ones if not more, and have to be handled in some way. SEI introduced Team Software Process (TSP) that extends and refines the CMM and PSP methods to guide engineers on development and maintenance teams [3]. TSP aims to fill the gap between the CMM and PSP. It shows how to build a self-directed team and how to perform as an effective team member. Humphrey states that the principal benefit of TSP is that it shows engineers how to produce quality products on aggressive schedules within budget [6]. The idea is to show engineers how to manage their work by making them owners of their plans and processes.
Table 1: PSP coverage of CMM key process areas
Level Focus Key Process Area
Covered in PSP
Defect Prevention
X
Technology Change Management
X
5 Optimizing
Continuous Process Improvement
Process Change Management
X
Quantitative Process Management
X 4 Managed
Product and Process Quality
Software Quality Management
X
Organization Process Focus
X
Organization Process Definition
X
Training Program
Integrated Software Management
X
Software Product Engineering
X
Intergroup Coordination
3 Defined
Engineering Process
Peer Reviews X Requirements Management
Software Project Planning
X
Software Project Tracking
X
Software Quality Assurance
Software Configuration Management
2 Repeatable
Project Management
Software Subcontract
Management
2.1 The Structure of the PSP
PSP is based on a set of key concepts. These are the process, the measures, estimation and planning, and quality. Each engineer should have a defined process, measure their performance, and use adapted techniques to estimate the duration of the project, and aim at producing zero defect software [7].
PSP’s main purpose is to help individuals be better software engineers. It provides a framework for understanding the reasons of errors and shows the best ways to find errors earlier in the development life cycle. It is an incremental process, which includes four levels and seven versions. The activities required in a level include the previous level activities therefore, the effort required reaching a PSP level increase as one proceeds into higher levels.
Figure 1: The PSP process evolution
In PSP0, engineers develop a software project using their own development processes, unless they have defined a process they use ad-hoc methods and collect basic measurement data. PSP1 adds planning steps to PSP0. The initial increment adds test report, size and resource estimation. Task and schedule planning are introduced in PSP1.1.
PSP0 Current Process Time Recording Defect Recording Defect Type Standard
PSP1 Size Estimating Test Report
PSP2 Code Reviews Design Reviews
PSP3 Cyclic Development
PSP0.1 Coding Standard Size Measurement Process Improvement Proposal
PSP1.1 Task Planning Schedule Planning
PSP2.1 Design Template
The Baseline Personal Process
Personal Planning
Personal Quality Management
The Cyclic Personal Process
59

The PSP2 adds review techniques to PSP1 to detect defects earlier in the development cycle when they are less expensive to recover. Design process is added in PSP2.1. PSP2.1 establishes design completeness criteria and examines some number of design verification techniques.
Until the third phase, PSP concentrates on a linear process for building small programs. The cyclic personal process is effectively used for large programs. The idea is to subdivide large programs into pieces suitable for PSP2 and perform a complete PSP2.
2.2 Teaching PSP
Humphrey proposes a method for teaching PSP in [1]. Although he states that the book is self-contained and all of the supplementary material is provided within the book, he suggests taking a course to learn PSP. The main motivation for this suggestion is to guide engineers overcome the difficulties encountered during the learning process, which are mainly related to the self discipline of the learner.
Engineers practice the process descriptions described in the book through the set of assignments. Each assignment is expected to take 3 to 10 hours. Assignments are not optional and they have to be completed in the specified order. Humphrey states that the total time expected to learn and apply PSP concepts is about 120 to 150 hours [1]. Our experience shows that a total of 80 hours would be suitable in an industrial setting where the engineers should be allowed to study PSP for two full weeks.
PSP courses are generally included in the graduate computer science courses [8, 11, 17], but there are also experience reports on the integration of PSP across the undergraduate curriculum [14, 15, 16].
2.3 Gathering Data
PSP requires collection of a number of personal software development metrics. The common way for gathering data in PSP is manual data gathering. That is, individuals need to create forms for recording the data, have a place to keep data, and keep an engineering book. While some of the data are obtained as an output of this work, some will be extracted from the data and will be used as derived measures.
PSP suggests a set of forms and templates to gather data. Well-designed forms are helpful for gathering and using data. Forms will help individuals to easily determine whether there is missing data. PSP Forms are represented as tables and a blank field in a table cell can easily be captured. Both the estimated data and the actual data are kept on these forms. Forms are used when the amount of data individuals gathering is fixed, and templates are used when the volume of data is unpredictable.
It is suggested by Williams in [13] and many other researchers that these data should be gathered and analyzed with the help of a software tool, which is preferably invisible to the user and allowing the user to focus on the process execution rather than tedious calculations. Williams also present her experience with teaching PSP and proposes some improvements for teaching methods [13].
3. Context and Course Setting
At Middle East Technical University in Turkey, the Personal Software Process course was first given during the spring semester of 2002. It was included in the curriculum of the Software Management program [8] as a mandatory course in order to introduce students to a disciplined software engineering approach. A distinctive case for this program is that almost all of the students are software professionals from the software industry and thus, we think that the study results reflect the opinions of the software industry more than the opinions of ordinary students.
The course is designed to follow the PSP phases prescribed in the reference book without incorporating any change. Students are expected to criticize the method and suggest improvement proposals; however they are not allowed to change the process definitions during the learning process.
We used the PSP book by Humphrey as the course book. In order to complete the assignments and prepare reports, students were accompanied by a support tool, which provided help for gathering and analyzing their personal data [9]. The PSP concepts are introduced up to PSP2 and students are asked to complete the first 6 assignments among the 10 listed in the course book. At the end of the semester the students prepared a mid-term report that is based on R4 report and also described in the course book. While no specific programming language was enforced, the students most frequently used Java, C++, and Delphi.
The students had to submit each assignment in one week’s time and in the case of wrong or incomplete submission they have one week to rework and resubmit that assignment. Students gathered data using a software tool and thus the validity of the data is checked up to some point. Following the evaluation of each assignment, some of the values are presented to the class without deciphering the owner’s of the data, since the privacy of personal data is one of the major concerns in applying PSP.
Process Improvement Proposal (PIP) forms are intended for letting students to think about the process and propose ways for improvement. We slightly updated these PIP forms to include any improvement suggestions for the
60

support tool so that we would have chance to improve the tool.
4. Discussion
Our major concern in this paper is not to put forward the missing parts of the PSP and limit its usage, but realistically criticize the method and point out the parts suitable for improvement. In this study we used the process improvement proposals submitted by the students during the courses and in-class discussions for evaluating the PSP method. Also our humble experience on teaching and applying PSP helped us to organize these issues.
Disney and Johnson performed a study on the data quality issues in the PSP [10]. They conducted a PSP course, analyzed the data for 89 projects and found totally 1539 defects caused by using the PSP method incorrectly. These errors were significant and most of the time these errors lead to incorrect insights into the students’ development practices.
It is also noted that 34% of the errors caused calculation errors in multiple forms and multiple projects. One of the most important findings of this study was that automated support for the PSP is required for successful adoption and use of the PSP. However, it is very hard to protect against data entry errors, because they occur when the user does not understand the purpose of a process parameter.
Although we used automated support tools during the course, we believe that these data might be biased and incomplete, thus we prefer not to present the results showing the progress of the students. We explained the following assignment evaluation criteria many times, “Your process data must be accurate, precise, and self-consistent. Please remember that test results, not code, are evaluated”. Despite this fact, some of the students stated that they tend to feel uncomfortable when their estimations differ too much from the actual results, and modify their estimations to decrease these differences.
Disney and Johnson [11] also suggest not using PSP measures to evaluate the success of PSP itself, but providing some external measures. For example it would be valuable if you could compare the test defect density rates before and after PSP adoption.
It is obvious that the PSP results are valuable as accurately as they reflect the actual work of the engineer, and we believe that a graduate class data is not the most appropriate source. A thorough study on data quality problems in PSP is accomplished by Disney in [12], and it can be seen that further research should be carried on this subject. Thus, it is out of the scope of this paper to find the optimal work space to gather the most accurate PSP data.
The following sections summarize our findings, discussions, and proposals for solution.
4.1 Reactions to a disciplined software development approach
One of the aims of the PSP is to introduce software development as an engineering approach, where developers gather and analyze their personal data to produce more precise estimates and high quality products. This nature of the method revealed itself as an agitating experience for most of the students. The assignments were very easy to implement, if not trivial, but most of the students failed to successfully fulfill the requirements of the assignments. They tend to underestimate the importance of process steps such as executing all of the test cases provided or submitting the assignment in the requested order or filling in all of the fields in the project plan summary form. We think that this behavior is a consequence of our education system and cultural habits. Students pay too much attention to coding and moreover they generalize the software development life cycle to coding and perhaps include testing phase. Throughout the course we try to show the existence of other software development activities and especially emphasize the software process as the glue to hold these activities together.
4.2 The content and order of assignments
PSP is not a programming course and PSP assignments should be thought as means for practicing the learned processes. Thus, the first six assignments do not require too much effort to implement and all of them can be realized within a day. This may cause some problems as one of the students noted the following comment:
“the assignments are so trivial that implementing them takes almost the same amount of time as filling in the forms required by PSP process definitions, which leads to overestimate the percentage of effort needed to apply PSP method”
Another point is the content of the assignments. The first assignment is a warming exercise which requires implementation of simple formula. In the assignments 2A and 3A, students are asked to develop a program that counts the total new and changed lines of source code (LOC) of the programs they wrote. These programs are used throughout the PSP course for calculating LOC related measures. Rest of the assignments is related with the statistical estimation method used for time and size estimation utilized in PSP. These assignments are obviously suitable for code reuse and furthermore, it is clearly stated in some of the assignment definitions which parts may be reused. It is clear that these assignments’ content and order are designed on purpose to enable the application of the concepts taught in the class. However, this bias affects the validity of the measured data. PSP
61

data generally reveal increasing percents of reuse as a result of this structure.
We think that these problems may be overcome by designing a new set of assignments which provide potential for reuse but do not explicitly state the reusable parts. Also it would be wise to keep LOC counting assignments since they are used as part of the process.
4.3 Use of LOC as size measure
PSP uses LOC as the major unit of size and estimations are based on LOC values. A Proxy Based Estimation (PROBE) method is used to estimate both size and time. Objects are used as proxies in PROBE and the students determine relative sizes of the estimated objects. These relative size estimations are then converted to LOC values by making use of one of the two size tables provided in the book. These tables include empirical values for C++ and Object Pascal programming languages, and it is obvious that similar tables for other popular languages such as Java, Visual Basic and C should be provided. These tables are necessary for producing precise estimates since the students do not have enough data to establish their own relative size – LOC tables.
4.4 Proxy Based Estimation Method
Although PROBE method provides a means for precise estimations based on one’s historical data, it has some deficiencies. PROBE takes into account the type and relative size of the planned proxies (objects) but, does not consider the algorithmic complexities of the methods. One of the students noted that “The more the test cases you have the more time you spend in test phase, however this is also not considered in PROBE although we know the number of test cases in advance.” A quick fix to this problem may include updating the PROBE method to answer these questions. However, a radical approach would be designing the estimation process as a modular component of the PSP flow and providing different estimation methods that can be used optionally. Current view of PSP indicates a monolithic structure rather than a modular one.
4.5 Defect Recording
PSP requires that students record all of the defects found during software development phases. The defect recording log includes defect information such as phase defect is injected in, phase defect is removed, fix time, defect type, and date the defect is recorded. The problem arises with huge number of defects created during compile phase. Students do not find worth recording all of these defects some of which are carried off by the compiler as propagating defects. Our solution to this problem was to record all the defects that are corrected. By this way if an error results in three more error messages, you correct and
record that single event and the other errors disappear in the next compile saving you from recording propagation errors.
Albeit this practical solution, we doubt majority of the students do not record all of the defects they have corrected. We think that the main reason is the lack of driving force to record these defects. Students cannot see the benefits of honestly recording their defects during a one semester course; therefore they do not see any sense in recording these defects. Some of the obvious outcomes of consistently recording your defects are; to know your strengths and weaknesses, to face with the quality of the programs you write, to categorize the defects you make, to measure the time you spend to find and fix these defects etc. We believe that the outcomes of recording and analyzing personal defect data are more than the effort spent.
Defect data is analyzed in the R3 report; however R3 report is not adequate for showing the importance of this data. Therefore we should enrich the contents of the R3 Defect Analysis Report and underline the value of gathering and analyzing personal defect data.
4.6 Automated support tool and over automation
Using an automated support tool is a powerful means for boosting widespread use of PSP; however, the same means presents a risk for over automation of the process. People tend to expect too much from process automation support tools, and pay less attention to the essence of the process. In a recent scenario, our support tool made a wrong calculation in the R3 report generation phase and only one of the students was able to recognize this defect. Although the students were asked to comment on their defect data, and they analyzed the data, they were not able to identify the mistake. This case supports Disney and Johnson’s work on the validity of PSP data [11], even if an automated support tool is used.
5. Conclusion
In this paper we presented findings from our PSP teaching experience in order to evaluate the applicability of the PSP and proposed some tips to overcome these problems. We believe that PSP provides a powerful means for establishing an engineering framework for software development practices.
We did not present class data showing the progress of the students, because we think that this data might be incomplete and bias our discussion on the applicability of PSP. Therefore we evaluated the opinions and process improvement proposals of students who took this course. Our study claims that if necessary improvements are applied to the original PSP structure, it will be easier to
62

implement and thus, will reach to a wider spectrum of audience. We can conclude that PSP and similar disciplined approaches to software development are necessary to establish effective software organizations that develop quality software.
6. Acknowledgement
Thanks to spring 2002, Spring 2003, and Spring 2004 students of the course SM501 – Personal Software Process for their invaluable criticism and suggestions. The PSP support tool used during these courses is developed in the scope of a R&D project funded by Scientific and Technical Research Council of Turkey (TÜBİTAK), with project id, TIDEB-3020232.
7. References
[1] Humphrey, Watts S., (1995). “A Discipline for Software Engineering”, Addison Wesley, 1995
[2] Humphrey, Watts S., (2000). “The Personal Software Process: Status and Trends”, IEEE Software, November/December 2000, pp 71-75
[3] Humphrey, Watts S., (2000b). “Introduction to the Team Software Process”, Addison Wesley, 2000
[4] Humphrey, Watts S., (1998a). “Three Dimensions of Process Improvement Part I”, CROSSTALK, February 1998, pp 14-17
[5] Humphrey, Watts S., (1998b). “Three Dimensions of Process Improvement Part II”, CROSSTALK, March 1998, pp 13-15
[6] Humphrey, Watts S., (1998c). “Three Dimensions of Process Improvement Part III”, CROSSTALK, April 1998, pp 14-17
[7] Escala, D., Morisio M., Coleman G., McGowan C., Mercier C., Duncan H., O’Connor R., and Wang Y., (2000). “Improving Individual Software Engineering Skills”, Session-5 SPI and Personal Processes, EuroSPI 7-9 November 2000
[8] http://www.ii.metu.edu.tr/~sm/ , Middle East Technical University, Informatics Institute, Software Management
[9] Karagöz, Alpay N. (August 2001). “Improving Individual Software Engineering Skills: A tool to support Personal Software Process”, Masters Theses, Middle East Technical University, Informatics Institute, Department of Information Systems, Ankara.
[10] Disney, Anne M., and Philip, M. Johnson, (1998). “Investigating Data Quality Problems in the PSP” (Experience Paper)
[11] Disney, Anne M., and Philip, M. Johnson, (1998). “The Personal Software Process: A Cautionary Case Study”, IEEE Software, November/December 1998, pp 85-88
[12] Disney, Anne M. (1998). “Data Quality Problems in the Personal Software Process”, Master Theses, University of Hawaii, Department of Information and Computer Science.
[13] Williams, Laurie A. (1997). “Adjusting the Instruction of the Personal Software Process to Improve Student Participation”, IEEE Proceedings Conference on the Frontiers in Education, 1997, pp 154-156
[14] Olofsson, S., (1999). “Evaluation of PSP in the Undergraduate Education”, Masters Theses, Umea University, Faculty of Mathematics and Natural Sciences, Department of Computing Science, October 10, 1999.
[15] Runeson, Per, (2001). “Experiences from Teaching PSP for Freshman”, 14th Conference on Software Engineering Education and Training, 19-21 February 2001, Charlotte, North Carolina, USA. IEEE Computer Society, online publication: http://computer.org/proceedings/cseet/1059/1059toc.htm
[16] Towhidnejad, M., Hilburn, T., (1997), “Integrating the Personal Software Process (PSP) across the Undergraduate Curriculum”, IEEE Proceedings Conference on the Frontiers in Education, 1997, pp 162-168
[17] Abrahamsson, P., Kautz, K., (2002), “The Personal Software Process: Experiences form Denmark”, Proceedings of the 28 th Euromicro Conference (EUROMICRO’02), 2002
63

LIGHTHOUSE: A Practical Quality Management Information System
Özgür Tüfekçi Cybersoft Enformasyon Teknolojileri Ltd. Şti.
Abstract
Cybersoft follows a process-based quality management system based on the software life cycle processes defined in ISO 12207 and has received ISO 9001:2000 certification for provision of software development services. There has been an ongoing improvement effort based on plan-do-check-act approach and ISO 15504 assessment framework. The keywords deriving the established system are being practical, integrated, adaptive, participative, and self-improving, hence inevitably follows the need for automation. The in-house developed Web-based Communication and Quality Management System: LIGHTHOUSE has been implemented to overcome the documentation and workflow burden, facilitate communication and provide a central knowledgebase. This paper presents LIGHTHOUSE as a generic and easy to maintain information system that not only aids the application of the established process-based quality management system, but also evolves with the process improvement activities. Main functionality is mapped to the requirements of the above-mentioned standards. 1. Introduction Starting by September 2002, Cybersoft has initiated a software process improvement project mainly to achieve greater schedule predictability, higher product quality, productivity and consequently increased competitiveness. Cybersoft has defined its processes based on the software life cycle processes of ISO/IEC 12207 [1,2] and has established an ISO 9001:2000 [3] conformant quality management system which has been certified by ABS Quality Evaluations Inc. after the audit conducted on March 3-5, 2003.
The life cycle processes used by Cybersoft are classified into process categories (customer, engineering/training, organizational, support and management). Each process category has its own set of procedures, internal standards, method descriptions and forms to be used in an application. Internal standards are prepared by tailoring IEEE standards to the company’s experience.
The strategic objective of Cybersoft is the continual improvement of processes in order to enhance the organization's performance and customer satisfaction. ISO 15504 (SPICE) [4,5] is being used as a framework for the assessment of software processes in evaluating process capability on a continuous scale in a comparable and repeatable way. To this end, Cybersoft has certified ISO 15504 assessors. The in-house developed Web-based “Communication and Quality Management System“ LIGHTHOUSE is employed to increase the efficiency and effectiveness of the quality management system.
LIGHTHOUSE has been developed:
- to eliminate paperwork by managing quality system documentation and records
- to facilitate communication by keeping relevant personnel informed of both changes to and actions from the system
- to keep a process database and simplify metric collection
- to provide a central knowledgebase
The development of LIGHTHOUSE itself is one of the first implementations of the established quality system. Overall effort of the project is approximately 10 man-months. 2. Architecture LIGHTHOUSE has been designed by using the Java technologies, depicted in Figure 1, to run on a Web server enabling the access of project groups from different project sites. Upon login to the system from home page, user may list, view, update and sign the documents depending on his/her access rights by using the menu provided.
General information about the users, menu items, documents and other entities of the application are kept on a MySQL database. Documents and digital signatures are stored in the file system under the folder structure, which is known to the Web server.
Role-based authorization is used to define different levels of access to the system both in terms of document access and operation restriction. Implementation of role-based authorization system is built using an in-house developed component - CSAAS (CyberSoft Authentication and Authorization System).
64

Document
Form Format
Part 1
.
Part Format
Fields Field 1 Field 2
...
Repeating Field 1
Field 1 Field 2
Repeating Row
Figure 2. XML Structure of a Document
Figure 1. Java-based Architecture of LIGHTHOUSE The Quality Management System of Cybersoft is evolving and going to do so in the future, thus changes in LIGHTHOUSE should be handled easily without requiring much programming effort. Adding a new form to the system should be as easy as adding the form’s description to the system.
The need for document workflow and form automation has been solved together by using a generic design. Documents/records are defined as valid XML documents. Explicitly stating software quality assurance plan and corrective action requests are handled similarly. The XML structure of a document is illustrated in Figure 2. Each document/record is composed of “Parts”, which define an item filled up by one person. Each part has a name for referencing a type to include some pre-defined fields and a format section for defining the HTML structure of that part, and finally a “fields” section to define the properties of that part. The HTML structure of a part contains references to the fields to be replaced by the actual HTML form of that field. There are three different types defined for parts and the definition of each part is stored in a special XML document, named as “document base”. This XML document contains the default fields to be included in a type of a document part. The default fields, whose attributes can be altered in the XML document overwriting this field, are vital for flow redirection. Each field in an XML document is defined by an identifying name, type and attributes required by its type such as width, height, default value and possible values. Possible values can be defined statically or can be the values taken as a result after running a Java function at run-time. Flow of both creation and updating of a document is defined in a unique XML document. The XML definition includes some properties for execution of the events to be processed and the transitions between them.
Events are classified into three basic types: document preparation, document data addition and document approval. They are just like the document part types but employed for which method to be used in deciding the next event to be performed. The next event to be performed and who will do it are defined either statically or can be detected as a result of a Java function in run-time. In Figure 3, event definitions are represented as surrounding circles. The internal circles represent the data enclosed for execution of the event. Each event has at least one transition to another event or a termination. In order to achieve the objective of paper-free quality management system, document approval is handled electronically using digital signatures, which satisfy principal requirements of document-signature consistency, time stamping and verification. Each document is signed by the user who creates or edits it.
HTTPS Request
HTTPS Response
Web Server (Jakarta Tomcat)
Database Server (MySQL)
JDBC
File System (Linux)
Disk IO
Web Browser
65

Figure 3. Event Definition of a Document
name
nextEvent
Part name
event
name
nextEvent
Part name
event
name
nextApprovalEvent
nextDisapprovalEvent
Part name
At the end of executing each flow event, the user is required to enter his/her password to digitally sign the form input and documents added by the user.
At the Web server side, the information entered by that user is gathered to form an XML document. This XML document is then signed by the user's 1024 RSA key. The user is required to enter a PIN in order to reach his key and to activate the RSA signing process on the server. The resulting signature is Base-64 encoded, and attached to the XML document. The new document with the signature is kept as a whole. Any user can later check the authenticity and integrity of a document by verifying the signature it contains. 3. Main Functionality The main functionality of LIGHTHOUSE may be grouped into six features as Quality System Documentation Management, Internal Audit Management, Problem Resolution Management, Project Documentation and Record Management, Knowledge Management and Communication Management. 3.1. Quality System Documentation Management (QDM) The documents required by quality management system are mainly quality manual, process definitions, internal standards, and forms. QDM:
- lists documents with document-IDs, names, versions, issue dates and status
- provides detailed meta data information (document owner, reviewer, approver, date of submission-review-approval, attached and linked
documents such as document change request forms)
- views or saves documents locally - enables review or approval of documents - links documents to other documents - enables upload or update / deletion of the
documents from the system by use of document change requests
- views current document list - enables navigation of the out-of-date versions of
documents and related document change requests - tracks document change request to closure.
3.2.Internal Audit Management (IAM) IAM: - automates the preparation, review and approval of
- audit programs - audit checklists - audit reports - corrective/preventive action requests
- sends reminders to the responsible people about the coming audit and follow-up dates
- reports the status of corrective/preventive action requests.
3.3. Problem Resolution Management (PRM) PRM automates:
- the preparation and lifecycle management of problem reports
- configuration status reporting - problem report status tracking
3.4. Project Documentation and Record Management (PDM) Cybersoft mainly accomplishes software development, training and mentoring projects. To this end, PDM has been structured accordingly. PDM includes: - project announcement - project definition (in terms of project name, start
date, planned end date, assignment of project sponsor, manager, auditor and other personnel)
- project status reports - project plans (SDP, SQAP, etc) - project documents (SRS, SDD, etc) - minutes of meetings - review records - test cases, logs and reports - configuration management records (status reports,
problem reports, etc) - project metrics
66

- purchasing records - training records (presentations, plans, trainee
records and reports) - mentoring records (follow-ups)
The functionality explained in Section 3.1 also applies to project documentation with the exception that problem reports are used for updates instead of document change requests. 3.5. Knowledge Management (KM) LIGHTHOUSE facilitates the knowledge management by making the company assets (quality manual, process definitions, internal standards, forms, etc) available when and where they are needed (see Section 3.1). Additionally, it includes:
- reuse library - external standards - library management system 3.6. Communication Management (COM)
Effectiveness of quality management system is largely dependent on the communication. COM enables:
- statement of quality policy, quality objectives, vision and mission statement, duties and responsibilities
- delivery of e-mail notification to the related parties new documents are created
- delivery of e-mail notification when workflow is directed to the related
- reporting documents or records waiting review/approval (submitted for each user upon their login)
4. Mapping LIGHTHOUSE Functionality to the Standards LIGHTHOUSE has been developed to support the Quality Management System of Cybersoft, which is conformant with ISO 9001:2000, ISO 12207 and the reference model of ISO 15504. Consequently the key functionally of LIGHTHOUSE, as explained in Section 3, maps to the requirements of these standards. For example, QDM supports mainly the documentation, quality assurance and improvement related requirements/processes. Mainly, Table 1 gives the comparative results apparently.
Table 1. Comparison of LIGHTHOUSE with Relevant ISO Standards
ISO 9001: 2000 ISO 12007 ISO 15504-2
QDM
4.2.3 Control of documents 4.2.4 Control of records 5.4.2 Quality management system planning 5.6.2 Review input 8.5.1 Continual improvement
6.1 Documentation process 6.3 Quality assurance process 7.3 Improvement process
SUP.1 Documentation Process SUP.3 Quality Assurance ORG.2 Improvement Process
IAM
8.2.2 Internal Audit 4.2.4 Control of records 5.6.2 Review input 8.5.2 Corrective action 8.5.3 Preventive action 5.5.3 Internal communication
6.7 Audit process 7.3 Improvement process
SUP.7 Audit Process ORG.2 Improvement Process
PRM
4.2.4 Control of records 5.6.2 Review input 8.2.4 Monitoring and measurement of product
6.2 Configuration management process 6.8 Problem resolution process
SUP.2 Configuration Management Process SUP.3 Quality Assurance SUP.8 Problem Resolution Process ORG.5 Measurement process
PDM
4.2.4 Control of records 5.4.2 Quality management system planning 7 Product realization
6.3 Quality assurance process 6.4 Verification process 5.3 Development process 7.1 Management process
SUP.4 Verification Process ENG Process Category MAN Process Category CUS.3 Customer Requirements Elicitation Process ORG.4 Infrastructure Process
KM
4.2.3 Control of documents 6.1 Documentation process F.3.6 Reuse Program Management Process
SUP.1 Documentation Process ORG 6 Reuse ORG.4 Infrastructure Process
67

COM
5.3 Quality policy 5.4.1 Quality objectives 5.5.1 Responsibility and authority 5.5.3 Internal communication
F.3.1.1 Organizational alignment F.3.1.4 Quality management
MAN.3 Quality Management Process ORG.1 Organizational Alignment Process ORG.4 Infrastructure Process
5. Conclusions This paper presents LIGHTHOUSE, as a practical quality management information system, developed and used by Cybersoft. The main functionality of the tool is mapped to the standards that constitute the foundations of the established quality system. Architecture is summarized to emphasize the ease of extendibility. “LIGHTHOUSE makes my job easier” has been the main slogan driving the overall effort. LIGHTHOUSE eliminates paperwork, facilitates communication, and supports mobility. From management perspective, it is a tool to track the status of projects, since all of the project information is available when and wherever needed. Upon widespread usage of digital signatures, expanding the system to include customers will be the main challenge in the future. Automation of process definitions, metric data management and sharing lessons learned/best practices among projects might be the other extensions. As a concluding remark, it should be made clear that automation only facilitates the utilization of systems. As Humphrey states, automation of a poorly defined process will produce poorly defined results [6]. The success depends largely on other factors such as involvement of people and management commitment. 6. References [1] ISO/IEC 12207:1995 Information technology -
Software life cycle processes [2] ISO/IEC 12207: 1995/Amd.1: 2002 Information
technology — Software life cycle processes [3] ISO 9001:2000 Quality management systems —
Requirements [4] ISO/IEC TR 15504:1998 (E) Information
Technology- Software Process Assessment [5] The Spire Handbook, European Community,
2000 [6] Watts S. Humphrey, Managing the Software
Process, Addison-Wesley, New York, 1989
68

Managing Variability in Product Line Scoping
using Design Space Models
Bedir Tekinerdogan & Mehmet Aksit
TRESE Software Engineering, Dept. of Computer Science, University of Twente, P.O. Box 217, 7500 AE,
Enschede, The Netherlands {bedir | aksit} @cs.utwente.nl
Abstract Product-line engineering aims to reduce the cost of manufacturing of software products by exploiting their common properties. Obviously, to define a product line, the product alternatives that need to be produced must be identified first. This is generally realized either by a product requirements analysis or a domain analysis process. Product requirements analysis focuses on specific products or product characteristics and therefore may fail short to identify those products that are not explicitly stated in the product requirements. Domain models on the other hand are inherently too abstract to identify the product alternatives and reason about these explicitly. To provide a balanced scoping we propose to integrate both approaches and present the so-called design space models (DSMs) as a complementary technique to existing product line scoping techniques. We explain our ideas using an illustrative example for scoping the product-line of insurance systems.
1. Introduction
Product-line engineering aims to reduce the costs of manufacturing of software products by exploiting their common properties and by managing the variabilities [1]. Obviously, to define a product line, the product alternatives that need to be produced must be identified first. A core activity of software product line development is therefore product line scoping, which seeks to define the right set of product alternatives.
An often-used approach for product line scoping is to define a domain model that includes reusable assets to configure the products. The advantage of adopting a domain model is that it is general enough to represent a large set of products. Due to this character, however, it may be difficult to identify and derive specific products from it. To tackle this
problem, product requirement analysis techniques can be used in which the specific products and their characteristics are explicitly specified [6]. This provides a concrete product-line scope but may fail in short in identifying those products that are not explicitly stated in the product requirements.
It appears that the adoption of only domain analysis or product requirements analysis techniques is not sufficient to define the right product line scope. In spite of this, both approaches are not sufficiently integrated yet. Although there are some approaches that aim to scope the domain model by considering the product requirements [6][7], their main focus is on the scoping process rather than deriving product alternatives. Approaches that mainly focus on product requirements on the other hand, however, can be too restrictive, because they may not cover a sufficient set of product alternatives. Moreover, both approaches usually do not address the implementation aspects of the products. Products may be implemented in various different ways and different implementations of the product may behave differently with respect to the aimed quality factors, such as adaptability and performance. It may, for example, appear that several implementation alternatives are not required or even not possible and therefore need to be ruled out. Other implementation alternatives may be favorable by the stakeholders due to some implementation specific requirements such as the choice of the platform, the implementation language, or quality criteria such as adaptability and performance. We therefore believe that in addition to the product line (specification) scoping, the product line implementation scoping (PLIS) is needed as well.
In this paper a systematic product line scoping approach is presented in which the products are gradually derived from the abstract domain models based on the specific product requirements. To represent the product line scope the concept of Design Space Models (DSMs) is introduced. Design
69

spaces represent a set of alternatives for a given design problem. Design space modeling as such consists of representing a design space and defining the semantic information for configuring and depicting the selection and elimination of alternatives within that space. For product line scoping we represent domain models as design space models, define the constraints and reduce the set of product alternatives with respect to the corresponding product requirements using the operations that we have defined for design space models. For product line implementation scoping the domain model is mapped to a design space that includes the set of possible implementation alternatives, and which can be reduced again with respect to the product requirements and the corresponding analysis and design heuristics. The utilization of design space models in product line scoping results not only in a more precise product line scope but also supports the reasoning on the product alternatives.
We will illustrate our ideas using an example from a real industrial project in which we have defined both the product line specification scope and the product line implementation scope using the design space modeling. Hereby we will also illustrate the tool environment Rumi that includes a set of tools for supporting the techniques of design space modeling.
The outline of the paper is as follows. In the following section we will describe the problem statement and describe the example from a real industrial project on the scoping of a product line for insurance systems. In section 3, the concept of design space models and its application to product line scoping is described in more detail. Section 4 describes the related work and section 5 provides the conclusions.
Insurance Product
Insured Object Coverage PremiumConditionsPayment
Person
Corporation
MovableProperty
Realty
Service
Amount
Own Risk
Acceptance Exception
Payee
Person Corporation
Direct Periodical
Legend:
optional featurealternative featuremandatory featureor-feature
Illness
Life
Loss
Unemployment
Damage
Figure 1. (Top-level) feature model for a product family of insurance systems
2. Problem Statement
2.1 Example: Domain Model of insurance systems
In the following section, we will describe a real world design example, which was developed in an industrial project between our faculty and a software company1. The goal of the project was to develop a software product-line for insurance systems. Over the years, the software company has developed an increasing number of insurance systems, whereby each system was practically developed from scratch.
1 This project has been carried out together with Utopics, The Netherlands [12].
This resulted in unnecessary repeating similar design and coding efforts. To save costs, a software product line approach for insurance systems was launched. The fundamental challenge hereby was the decision on the set of products that were to be delivered, i.e. the product line scope.
Numerous and various insurance systems exist, which share some common features that can be exploited for reuse [12]. Figure 1 shows the feature model of a product-line, which was defined through an extensive domain analysis effort. Each insurance product consists of the following (mandatory) sub-concepts (features): Insured Object, Coverage, Payment, Conditions, Premium and Payee. An insured object can either be a person, a corporation, realty or some moveable property. The feature Coverage defines the risk that is to be insured, which
70