Embed Size (px)
Citation preview

International Journal for Quality research UDK- 6585.5012.7(497.11)
Original Scientific Paper (1.01)
Vol.5, No. 2, 2011 109
Sanjit Ray1) Prasun Das2)
1) Indian Statistical Institute SQC and OR Division
8th Mile, Mysore Road, Bangalore 560 059, Karnataka,
India. Email: [email protected] 2) Indian Statistical Institute
SQC and OR Division 203 B.T. Road, Kolkata 700 108,
India Email: [email protected]
IMPROVE MACHINING PROCESS CAPABILITY BY USING SIX-SIGMA
Abstract: Abstract: Six-Sigma is an improvement strategy for achieving customer satisfaction by reducing variation and thus producing products and services better, faster and cheaper. This study presents a Six-Sigma project of an automotive plant illustrating how the DMAIC methodology and statistical techniques were applied to resolve the issue of manufacturing process capability. This project has substantially benefitted the organization by reducing the variation of bore size of crank case, achieving zero rejection and improving the on time delivery. By using appropriate qualitative and quantitative tools in different phases of the DMAIC methodology, the critical output, key process inputs and root causes were identified, analyzed and validated. This project methodology can be used in general to reduce process variation for any other manufacturing processes as well, which will help in improving customer satisfaction. Keywords: Six Sigma; DMAIC (Define – Measure – Analyze – Improve – Control), SIPOC; Critical to Quality (CTQ); Key Process Input Variable (KPIV); Repeatability, Reproducibility; Sigma Rating; Analysis of Variance (ANOVA).
1. INTRODUCTION
As customer expectation and competition continues
to become more intense, organizations worldwide are under pressure to improve their operational performance to meet the customer and market expectations (Hammer, 2002). In the pursuit of improving operational performance leading to higher customer satisfaction, Six-Sigma has been recognized as a unified approach. The roots of Six-Sigma as a measuring standard of process variation can be traced back to Walter Shewart, who showed that three sigma from the mean is the point where a process require attention (Pande et al., 2000). Six-Sigma has been recognized as a systematic and structured methodology for reducing defect rate by improving process capability (Harry, 1998). Motorola originally developed Six-Sigma in the 1980s and helped the company to win the Malcolm Baldrige Quality Award in 1988 (Coronado and Antony, 2002). There has been a significant increase in the application of Six-Sigma in industry over last 15 years because they have proven to be successful not only at improving quality but also at producing large cost benefits. Several companies, including Motorola, General Electric, Honeywell, Bombardier and Sony have reported significant benefits from Six-Sigma initiatives (Antony and Banuelas, 2001).
This paper details a Six-Sigma project which was implemented by using the DMAIC roadmap in an automotive manufacturing plant in India. This particular project was undertaken in the machining shop for the part crank case. The company was facing higher rejection at the honing operation of crankcase machining, seriously affecting the process yield. As a
result the company was incurring loss at the current production rate apart from resulting customer dissatisfaction due to delay in on-time delivery of machined crank cases for further operation. A Six-Sigma project was, therefore, created that specifically focused on resolving the rejection of crankcase at honing operation.
1.1. Quality improvement methods and six-sigma
Due to rapidly changing technology and business environments, the definition of quality improvement can include reducing process variability, improving product and service quality, decreasing cost, eliminating process waste and thus enhancing profitability and customer satisfaction. The quality improvement should be linked to a process, whether manufacturing or non-manufacturing, and capability of these processes markedly influences an organization’s achievements. Consequently, controlling and improving processes continuously is a critical issue to enhancing organizations capability (Stewart and Spancer, 2006). Numerous process improvement methodologies have been widely adopted by various industries, such as, 5S, ISO 9000, total quality management (TQM) and lean(Stewart and Spancer, 2006). Numerous process improvement methodologies have been widely adopted by various industries, such as, 5S, ISO 9000, total quality management (TQM) and lean manufacturing. The 5S principles provide simple and systematic techniques for improving work and process environments, and then further influences employee attitude towards work environment. The international

110 S. Ray, P. Das
quality management standard ISO 9000 is a widely accepted and implemented basic quality management system standard of an organization (Lin and Wu, 2005) which helped companies to effectively document the relevant system standards and implement it to maintain the processes effectively and efficiently.
TQM is a customer oriented approach that uses statistical techniques, follows the plan-do-check-act (PDCA) cycle, implements measures and continuously improves processes in order to improve the product quality (Rounce, 1998). TQM focuses on satisfying customer needs, identifying problems, building commitment and involves employees for process improvement. Lean concept deals with methodology and tools for transforming processes to deliver customer value faster by improving work flow and eliminating waste (Motwani, 2003). The concept has been borrowed from Toyota Production System (just-in-time movement) and most of the automobile and its part manufacturing units in the World implemented the principle and was rewarded with excellent results. Although these different methodologies apply different tools and techniques, the fundamental principles are very much similar. The ultimate objective of all quality improvement methodologies is to identify customer needs and then satisfy these needs effectively and efficiently. A good quality improvement methodology must be able to promote and accommodate all factors directly or indirectly influencing process performance by using suitable techniques. The improvement methodology should provide a systematic and logical structure that utilizes tangible and intangible information to track root causes, improves or eliminates root causes, and monitors and sustains improvement. Six-Sigma is a highly disciplined and rigorous data analysis based improvement approach for removing defects from products and redundancies from processes. Six-Sigma methodology demand detailed analysis, fact based decisions and an effective control of the improved process. Six-Sigma methodologies were originated as a set of practices designed to improve manufacturing processes; however, organizations realized the benefits of Six-Sigma, and its use is rapidly expanded to different functional areas such as marketing, engineering, purchasing, servicing, and administrative support (Ray and Das, 2009, 2010).
Six-Sigma was heavily inspired by six preceding decades of quality improvement methodologies such as Quality Control, TQM and Zero Defects based on the work of pioneers such as Shewhart, Deming, Juran, Ishikawa, Taguchi and others (Feigenbaum, 1986; Juran, 1988). Six-Sigma is a scientific and statistical quality assessment for all processes in the organization through measurement of quality level, which provides the opportunity and discipline to eliminate mistakes, improve moral and thus reduce cost (Park, 2002). In Six-Sigma, a defect is defined as any process output that does not meet customer specifications, or that could
lead to creating an output that does not meet customer specifications. Six-Sigma seeks to improve the quality of process outputs by identifying and removing the causes of defects (errors) and minimizing variation in manufacturing and business processes (Antony and Banuelas, 2001). It uses a set of quality management methods, including statistical methods, and creates a special infrastructure of people ("Black Belts", "Green Belts", etc.) within the organization. Each Six-Sigma project, carried out within an organization, follows a defined sequence of steps and has quantified targets. These targets can be financial (cost reduction or profit increase) or whatever is critical to the customer of that process (cycle time, safety, delivery, etc.).
In practice, the principal focus of Six-Sigma is to decrease potential variability in processes and products using a continuous improvement methodology, which proceeds through the DMAIC phases (Antony and Banuelas, 2001). Six-Sigma focuses on improving quality by helping an organization to produce products and services better, faster and cheaper (Mahanti and Antony, 2005). Park (2002) has stated that Six-Sigma is a scientific and statistical quality assessment for all processes through measurement of quality level which provide the opportunity and discipline to eliminate mistakes, improve morale and saves money. Doing things right and keeping those consistent are the ideas behind Six-Sigma. Therefore, an organization needs to have linkage of bottom line benefits to the Six-Sigma projects as the Six-Sigma drive for process improvement takes place project-by-project basis (Juran, 1989) by following these principles.
Identify the process for improvement. Every output is the result of a process. To improve quality of output, improve the process.
All processes have inherent variability. Data is used to understand the variability and
the sources thereof, and drive process improvement decisions.
The DMAIC framework of Six-Sigma is a serial analytical and statistical method for eliminating process variations and obtaining breakthrough improvements in products and service quality (Harry, 1998). It is a project-driven scheme that employs a well-structured methodology, called DMAIC, comprising of the five phases: Define, Measure, Analyze, Improve and Control. The DMAIC project methodology has five phases:
Define the problem, the voice of the customer, and the project goals, specifically.
Measure key aspects of the current process and collect relevant data.
Analyze the data to investigate and verify cause-and-effect relationships. Determine what the relationships are, and attempt to ensure that all factors have been considered. Seek out root cause of the defect under investigation.

Vol.5, No. 2, 2011 111
Improve or optimize the current process based upon data analysis using techniques such as design of experiments, pokayoke or mistake proofing, and standard work to create a new, future state process. Set up pilot runs to establish process capability.
Control the future state process to ensure that any deviations from target are corrected before they result in defects. Control systems are implemented such as statistical process control, production boards, and visual
workplaces and the process is continuously monitored.
The details of the five phases of the Six-Sigma DMAIC methodology are introduced as follows.
2. DEFINE PHASE
This phase defines the goals and boundaries of an improvement project in terms of customer requirements or business requirements and the process delivering these requirements (Porter, 2001)
. Table 1- Process Mapping of Honing Process
The main activities of define phase are the
following: 1. Define the project boundary (process and
machine) 2. Identify and define Critical to Quality (CTQ). One of the major objectives of any Six Sigma
project is to improve the selected process performance. At Define phase, the process is identified, which will be improved to reduce the defect rate with appropriate scope and boundaries. The process thus identified is given in Table 1. The high-level process mapping helps to define the project boundary (start and end), can identify where to collect data and clarify the scope. It also identifies the resources required to carry out the project / improvement. Based on the above objective and process definition, the CTQ for the project is selected. By measuring and monitoring the CTQ, the process quality and control can be ensured. In this particular project, the CTQ selected is the bore size with the specification of (111.257 - 111.277 mm).
The objective of this project is to reduce operational scrap of crankcase by improving the process capability of bore size. A project charter was then defined which states the project description, objectives, scope, potential benefits, team members, schedule and support required. With the above analysis and definitions, the project moves to the Measure phase of the DMAIC journey.
3. MEASURE PHASE
The Measure phase of a Six Sigma project deals with the following
Data collection plan and identification of stratification factors.
Measurement system analysis to validate the measurement uncertainty (if any) of the current measurement system.
Collection of existing data on liner bore size (if available) or collection of fresh data.
Analysis of liner bore size data for Sigma Level calculation.
Initial Process Analysis based on the Stratification factors.
It is essential for every Six Sigma project to prepare a Data Collection Plan, which will clarify the following:
Recording what data to be collected reminds what to be accomplished.
The data type will guide what analysis to be performed.
An operational definition defines how exactly data to be collected and recorded.
Ensure consistency of data collected over different time points and by people.
At present the company is using a single spindle honing machines with indexing table, which is equipped with the following features to achieve the required surface
112 S. Ray, P. Das
finish and bore size after the operation. Double expansion honing head is used for
rough and finish honing. Rough honing expansion is controlled by
stepper motor and finish honing expansion is controlled by hydraulic motor.
Bore size is controlled with the help of continuous air sizing by a transducer, which receives required air supply through a FRL (Filter Regulator Lubricator). The FRL unit ensures that the transducer receives air which is free from dust particles, moisture, abrasive materials etc. The transducer ensures that the pressure with which working parts of the honing tool are pressed against the bore wall is controlled during machining. The pressure per unit area of the working parts can thereby be kept constant or specifically varied, irrespective of the surface configuration of the bore wall. For this purpose, the honing machine includes a feed mechanism and electronic control device for predetermining the pressure of the working parts against the bore.
Temperature controllers are used for controlling temperature of cutting oil and hydraulic oil.
Each crankcase is having six bores, which are machined in single setting by each machine.
To formulate a data collection plan for the above process, a brain storming session was conducted by involving personnel from QA, Production, Maintenance, Safety and Design. The following data collection plan, as given in Table 2, was evolved for the project. Before collecting data on bore size, it was decided to
validate the measurement system. At present 2 inspectors are measuring the bore size by using a bore dial. It was decided to study the contribution of measurement system variation in the form of repeatability and reproducibility present in the process. Repeatability of a measurement system is the variation due to the measuring device observed when the same part is measured repeatedly with the same device, whereas reproducibility is the variability in measurements due to operators and the operator by part interaction. The Gage Repeatability and Reproducibility (R and R) studies determine how much of the observed process variation is due to measurement system variation and it should be less than 30% of total to be acceptable (MSA Reference Manual, AIAG, 2010). The R and R study was conducted by selecting parts (6 nos.) at random and measured by two inspectors, each twice. The study results were analyzed by the ANOVA method, which breaks down the overall variation into three categories: part-to-part, repeatability and reproducibility; and further breaks down reproducibility into its operator and operator by part components. Apart from calculating R and R%, the value of the Number of Distinct Categories (NDC) was also calculated. The NDC value of a measurement system represents the number of non-overlapping confidence intervals that will span the range of product variation. It can be also thought as the number of groups within the process data that the measurement system can discern.
This value of NDC is calculated by the following formula
41.1*)(
)(
gagesd
partsdndc
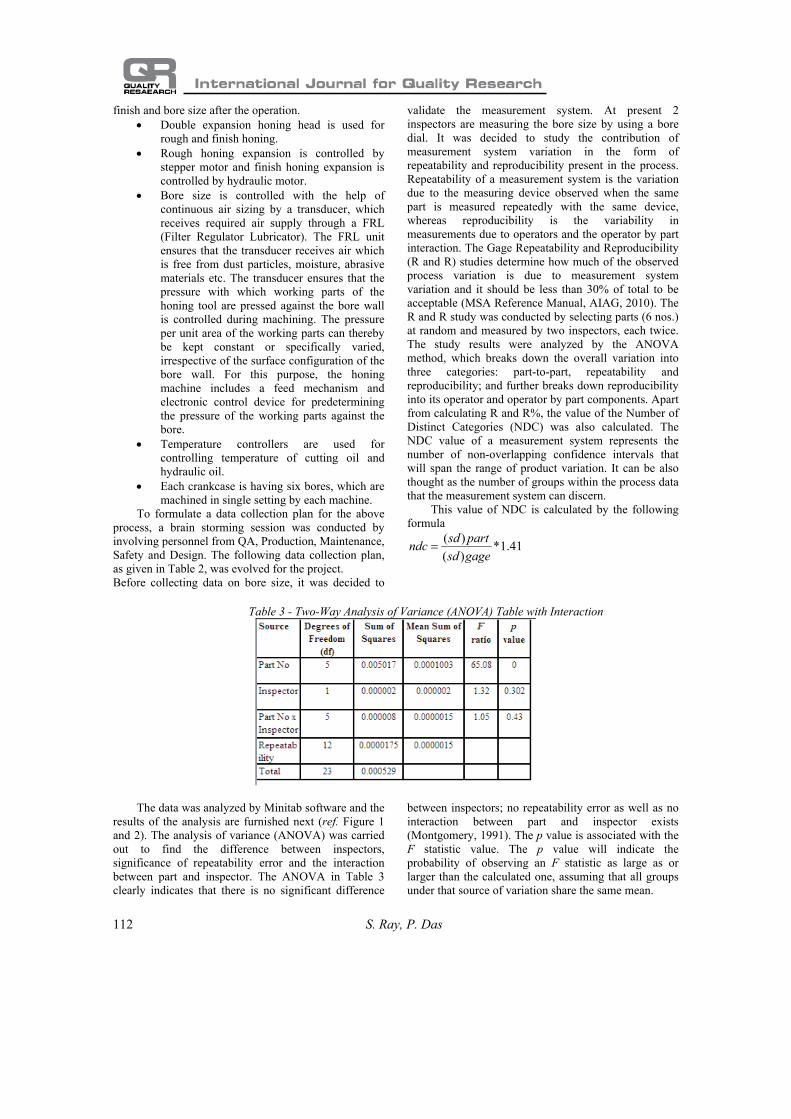
Table 3 - Two-Way Analysis of Variance (ANOVA) Table with Interaction
The data was analyzed by Minitab software and the results of the analysis are furnished next (ref. Figure 1 and 2). The analysis of variance (ANOVA) was carried out to find the difference between inspectors, significance of repeatability error and the interaction between part and inspector. The ANOVA in Table 3 clearly indicates that there is no significant difference
between inspectors; no repeatability error as well as no interaction between part and inspector exists (Montgomery, 1991). The p value is associated with the F statistic value. The p value will indicate the probability of observing an F statistic as large as or larger than the calculated one, assuming that all groups under that source of variation share the same mean.

Vol.5, No. 2, 2010 113
Table 4 - Summary of Gage R and R Study.
Table 2 - Data Collection Plan
DATA OPERATIONAL DEFINITION OF MEASURE What Data
Data Type How Measured
Related Conditions to
Record
Sampling Notes How / Where Recorded (Check
Sheet) Liner Bore Size
Continuous Bore Dial Bore Name (6 nos. – 1,2,3,4,5,6)
30 components produced and measured at all 6 Bore Positions for the finished bore size.
Check Sheet
Per
cent
P a r t- to - P a r tRe p r o dRe p e a tG a g e R& R
1 0 0
5 0
0
% C o n t r ib u t io n
% S t u d y V a r
Sam
ple
Ran
ge
0 .0 0 4
0 .0 0 2
0 .0 0 0
_R= 0 .0 0 1 2 5 0
U C L= 0 .0 0 4 0 8 4
LC L= 0
A B
Sam
ple
Mea
n
1 1 1 .2 7 0
1 1 1 .2 6 5
1 1 1 .2 6 0
__X = 1 1 1 .2 6 2 7 1
U C L= 1 1 1 .2 6 5 0 6
LC L= 1 1 1 .2 6 0 3 6
A B
P a rt N o654321
1 1 1 .2 7 0
1 1 1 .2 6 5
1 1 1 .2 6 0
Ins pe c t o rBA
1 1 1 .2 7 0
1 1 1 .2 6 5
1 1 1 .2 6 0
P a rt N o
Ave
rage
654321
1 1 1 .2 7 0
1 1 1 .2 6 5
1 1 1 .2 6 0
In sp e ct o r
AB
G a g e n a m e : B o re D ia lD a te o f s tu d y :
C o m p o n e n ts o f V a ria tio n
R C h a rt b y I n s p e cto r
X b a r C h a rt b y I n s p e cto r
B o re S ize b y P a rt N o
B o re S iz e b y I n s p e cto r
I n s p e cto r * P a rt N o I n te ra ctio n
Ga g e R & R ( A NO V A ) fo r B o r e S iz e
Figure 1 - Gage R and R Study Results for Bore Dial
S a m p l e
Sa
mp
le M
ea
n
2 82 52 21 91 61 31 0741
1 1 1 . 2 7 5
1 1 1 . 2 7 0
1 1 1 . 2 6 5
1 1 1 . 2 6 0
1 1 1 . 2 5 5
__X = 1 1 1 . 2 6 3 2 1
U C L = 1 1 1 . 2 6 8 3 8
L C L = 1 1 1 . 2 5 8 0 4
S a m p l e
Sa
mp
le R
an
ge
2 82 52 21 91 61 31 0741
0 . 0 2 0
0 . 0 1 5
0 . 0 1 0
0 . 0 0 5
0 . 0 0 0
_R = 0 . 0 1 0 7 0
U C L = 0 . 0 2 1 4 5
L C L = 0
11
11
11
2
22
2
1
221
11
1
1
X b a r - R C h a r t o f B 1 , . . . , B 6
Figure 2 - x and R Chart for Crank Case Bore Size produced in Honing Machine
114 S. Ray, P. Das
1 1 1 . 2 7 81 1 1 . 2 7 21 1 1 . 2 6 61 1 1 . 2 6 01 1 1 . 2 5 41 1 1 . 2 4 8
L S L U S LP ro c e s s D a ta
S a m p le N 1 8 0S tD e v (B e tw e e n ) 0 . 0 0 2 3 7 4 8 7S tD e v (W ith in ) 0 . 0 0 4 2 2 3 1 4S tD e v (B /W ) 0 . 0 0 4 8 4 5 0 9S tD e v (O v e ra ll) 0 . 0 0 6 7 9 9 2 2
LS L 1 1 1 . 2 5 7T a rg e t *U S L 1 1 1 . 2 7 7S a m p le M e a n 1 1 1 . 2 6 3
B /W C a p a b ilit y
C C p k 0 . 6 9
O v e ra l l C a p a b ilit y
P p 0 . 4 9P P L 0 . 3 0P P U 0 . 6 8P p k
C p
0 . 3 0C p m *
0 . 6 9C P L 0 . 4 3C P U 0 . 9 5C p k 0 . 4 3
O b s e rv e d P e rf o rm a n c eP P M < LS L 1 6 1 1 1 1 . 1 1P P M > U S L 3 3 3 3 3 . 3 3P P M T o ta l 1 9 4 4 4 4 . 4 4
E xp . B /W P e rf o rm a n ceP P M < LS L 9 9 9 3 2 . 0 0P P M > U S L 2 2 1 3 . 9 5P P M T o ta l 1 0 2 1 4 5 . 9 5
E xp . O v e ra l l P e rf o rm a n ceP P M < LS L 1 8 0 4 8 8 . 8 9P P M > U S L 2 1 2 7 9 . 5 9P P M T o ta l 2 0 1 7 6 8 . 4 7
B / WO v e r a ll
B e tw e e n / W i th i n C a p a b i l i t y o f B 1 -M C 1 , . . . , B 6 -M C 1
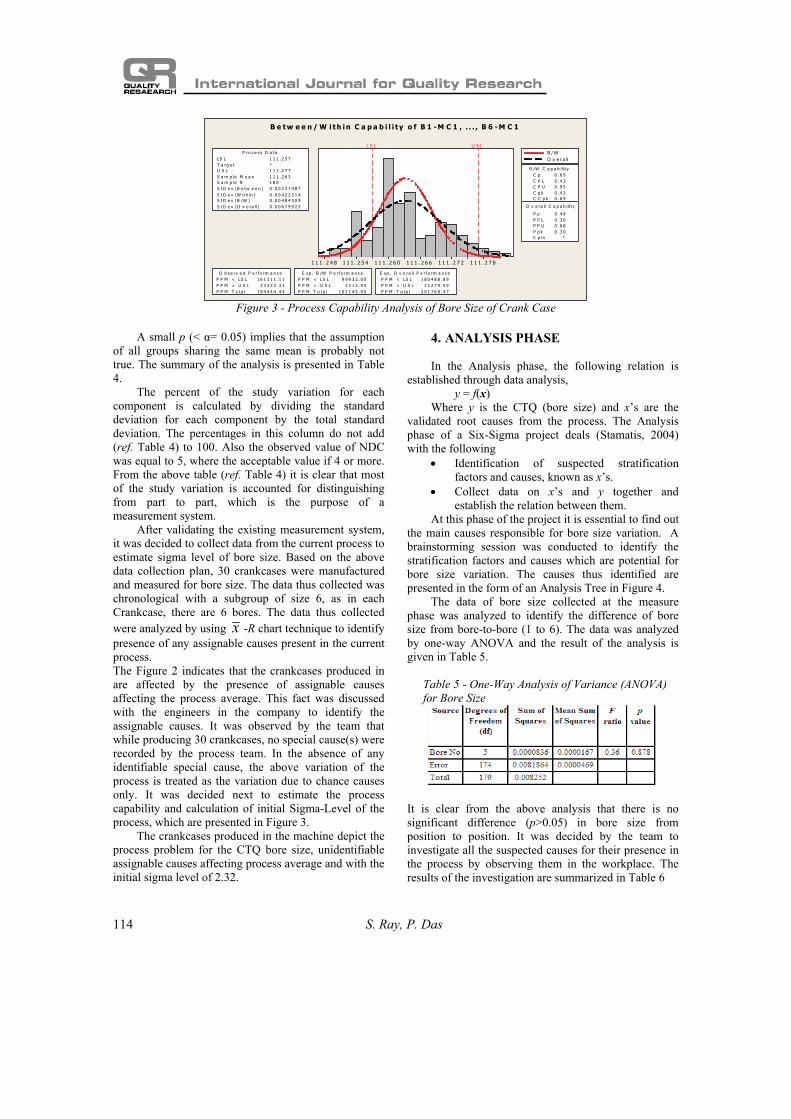
Figure 3 - Process Capability Analysis of Bore Size of Crank Case
A small p (< α= 0.05) implies that the assumption
of all groups sharing the same mean is probably not true. The summary of the analysis is presented in Table 4.
The percent of the study variation for each component is calculated by dividing the standard deviation for each component by the total standard deviation. The percentages in this column do not add (ref. Table 4) to 100. Also the observed value of NDC was equal to 5, where the acceptable value if 4 or more. From the above table (ref. Table 4) it is clear that most of the study variation is accounted for distinguishing from part to part, which is the purpose of a measurement system.
After validating the existing measurement system, it was decided to collect data from the current process to estimate sigma level of bore size. Based on the above data collection plan, 30 crankcases were manufactured and measured for bore size. The data thus collected was chronological with a subgroup of size 6, as in each Crankcase, there are 6 bores. The data thus collected were analyzed by using x -R chart technique to identify presence of any assignable causes present in the current process. The Figure 2 indicates that the crankcases produced in are affected by the presence of assignable causes affecting the process average. This fact was discussed with the engineers in the company to identify the assignable causes. It was observed by the team that while producing 30 crankcases, no special cause(s) were recorded by the process team. In the absence of any identifiable special cause, the above variation of the process is treated as the variation due to chance causes only. It was decided next to estimate the process capability and calculation of initial Sigma-Level of the process, which are presented in Figure 3.
The crankcases produced in the machine depict the process problem for the CTQ bore size, unidentifiable assignable causes affecting process average and with the initial sigma level of 2.32.
4. ANALYSIS PHASE
In the Analysis phase, the following relation is established through data analysis, y = f(x)
Where y is the CTQ (bore size) and x’s are the validated root causes from the process. The Analysis phase of a Six-Sigma project deals (Stamatis, 2004) with the following
Identification of suspected stratification factors and causes, known as x’s.
Collect data on x’s and y together and establish the relation between them.
At this phase of the project it is essential to find out the main causes responsible for bore size variation. A brainstorming session was conducted to identify the stratification factors and causes which are potential for bore size variation. The causes thus identified are presented in the form of an Analysis Tree in Figure 4.
The data of bore size collected at the measure phase was analyzed to identify the difference of bore size from bore-to-bore (1 to 6). The data was analyzed by one-way ANOVA and the result of the analysis is given in Table 5.
Table 5 - One-Way Analysis of Variance (ANOVA) for Bore Size
It is clear from the above analysis that there is no significant difference (p>0.05) in bore size from position to position. It was decided by the team to investigate all the suspected causes for their presence in the process by observing them in the workplace. The results of the investigation are summarized in Table 6

Vol.5, No. 2, 2011 115
Table 6: Results of GEMBA Study

116 S. Ray, P. Das
Figure 4 - Tree Diagram of Causes of Bore Size Variation
The root causes for variation in the bore size as
identified from the work place variation are following 1. Guide. 2. Ledges. 3. Oil Temperature variation. 4. Feed Rate variation. 5. Air Pressure variation. In the Measure phase of this project it was
observed from the x -R chart analysis that though there
are out of control situations in the x -chart, but no assignable causes could be identified. Probably the assignable causes are variation of the above root causes within their respective specifications. 6. IMPROVE AND CONTROL PHASE
The optimal solutions for improving the mean of
the bore size and reducing variation are determined and confirmed in the Improve phase. The Analysis phase could reveal four key process input variables (KPIV) responsible for variation in bore size. The Improve
phase considers the KPIVs identified and develops and selects solutions to eliminate the effect of these causes by optimizing them effectively. This stage of the Six-Sigma project involves:
1. Identification of Factor and Levels 2. Planning and Conduct of Experiments 3. Analysis of Results 4. Identification of Optimum Setting. 5. Trial Run and Sigma-Level Calculation. A design of experiment technique was employed to
identify the optimum setting of the KPIVs. The factors and the corresponding levels to be considered in the experiment are given in Table 7.
Table 7 - Factor and Levels for the Experiment

Vol.5, No. 2, 2011 117
The experiment was conducted by using full factorial experimentation techniques, in which all main effects and two factor interactions were considered.
One of the root causes, variation over Guide Ledges diameter was not considered in the experiments, but it was ensured that the diameter is corrected before the experiments were conducted, such that it does not add to the variation in the bore size during experimentation. It was decided to manufacture 5 crank cases for each experiment.
In each crank case there are 6 bores, therefore, for each experiment there will be 30 readings (5 crank cases, in each 6 bore sizes). The objective of the designed experiments was to reduce within piece variation (bore to bore in a crank case), between piece variations (crank case to crank case) and also to achieve the target bore size (nominal the base).
The experiments were conducted after randomizing the trial runs and the results from each experiment were documented.
The above experimental data were summarized to calculate the mean bore size for each crankcase, log10si
2
for within piece (crank case) variation and log10s2 for
between piece (crank case) variations. The above data were subjected to the following
analysis 1. Analysis of variance of the mean bore size for
each crank case. 2. Analysis of variance of within piece variation
(log10si2)
3. Analysis of variance of between piece variance (log10s
2). The mean bore size data was analyzed by ANOVA methodology and the result of the analysis is given in Table 8.
Table 8 - ANOVA of Mean Bore Size Data
It is clear from the above analysis that the mean bore size of crank case is affected by air pressure and feed
rate setting as the respective p values are less than 0.05. The level averages of mean bore size was plotted (ref. Figure 5) to select the best level of significant factors.
The within crank case variation (bore-to-bore) was analyzed by ANOVA methodology and the result of the analysis is given in Table 9. It is clear from the above analysis that the within piece variation of bore size of crank case is affected by only oil temperature. The level averages of bore size was plotted (ref. Figure 6) to select the best level of oil temperature.
Similarly, to study the between crank case variation for bore size, ANOVA analysis is conducted and the results of the analysis is given in Table 10.
No factor is significantly affecting the between crankcase to crankcase variation as p values of all suspected main effects and their interaction effects are found to be more than 0.05. The summary of the ANOVA analysis is given in Table 11.
Table 9 - ANOVA of Within Crankcase Variations of Bore Size
Table 10 - ANOVA of Between Crankcase Variations of Bore Size

118 S. Ray, P. Das
Table 11 - Summary of ANOVA analysis for Bore Size
Mea
n of
Mea
n
3 .002 .2 5
111 .27
111 .26
111 .25
111 .243525
2515
111 .27
111 .26
111 .25
111 .24
A ir P r. O il T e mp
Fe e d
Main Effects P lot (fitted means) for Mean
Figure 5- Level Averages of Factors for Mean Bore Size
Mea
n of
log
(si2
)
3.002.25
-4.50
-4.75
-5.00
-5.25
-5.503525
2515
-4.50
-4.75
-5.00
-5.25
-5.50
Air Pr. Oil Temp
Feed
Main Effects Plot (fitted means) for log (si2)
Figure 6 - Level Averages of Factors for Bore Size

Vol.5, No. 2, 2011 119
The honing process parameters were set as per the
optimum combination of the significant KPIVs and 8 crankcases were manufactured and measure for bore size for each of the 6 bores. The process was set by using a new honing tool and as well as by using an used
honing tool, which is almost at the end of its life, as it is a known fact that as the life of the honing tool reduces, it affect the process capability. The results of the process capability studies are given in Figure 7 and 8.
1 1 1 . 2 7 5
1 1 1 . 2 7 2
1 1 1 . 26 9
1 1 1 . 2 6 6
1 1 1 . 2 6 3
1 1 1 . 26 0
1 1 1 . 2 5 7
L S L U S LP r o c e s s D a t a
S a m p l e N 4 8S t D e v ( W i t h i n ) 0 . 0 0 2 5 2 8 2 2S t D e v ( O v e r a l l ) 0 . 0 0 2 3 4 6 1 9
L S L 1 1 1 . 2 5 7T a r g e t *U S L 1 1 1 . 2 7 7S a m p l e M e a n 1 1 1 . 2 6 6
P o t e n t i a l ( W i t h i n ) C a p a b i l i t y
C C p k 1 . 3 2
O v e r a l l C a p a b i l i t y
P p 1 . 4 2P P L 1 . 2 6P P U 1 . 5 8P p k
C p
1 . 2 6C p m *
1 . 3 2C P L 1 . 1 7C P U 1 . 4 7C p k 1 . 1 7
O b s e r v e d P e r f o r m a n c eP P M < L S L 0 . 0 0P P M > U S L 0 . 0 0P P M T o t a l 0 . 0 0
E x p . W i t h i n P e r f o r m a n c eP P M < L S L 2 3 0 . 7 7P P M > U S L 5 . 2 0P P M T o t a l 2 3 5 . 9 8
E x p . O v e r a l l P e r f o r m a n c eP P M < L S L 8 0 . 3 7P P M > U S L 1 . 0 1P P M T o t a l 8 1 . 3 9
W i t h i nO v e r a l l
P r o c e s s C a p a b i l i t y o f B o r e S i z e - N e w
Figure 7 - Process Capability of Bore Size by using a New Honing Tool
1 1 1 . 2 7 41 1 1 . 2 7 01 1 1 . 2 6 61 1 1 . 2 6 21 1 1 . 2 5 8
L S L U S LP ro c e s s D a t a
S a m p le N 4 8S t D e v (W it h in ) 0 . 0 0 3 5 0 3 3 2S t D e v (O v e ra l l ) 0 . 0 0 4 0 1 8 6
LS L 1 1 1 . 2 5 7T a rg e t *U S L 1 1 1 . 2 7 7S a m p le M e a n 1 1 1 . 2 6 8
P o t e n t ia l (W it h in ) C a p a b i l i t y
C C p k 0 . 9 5
O v e ra l l C a p a b i l i t y
P p 0 . 8 3P P L 0 . 9 1P P U 0 . 7 5P p k
C p
0 . 7 5C p m *
0 . 9 5C P L 1 . 0 4C P U 0 . 8 6C p k 0 . 8 6
O b s e rv e d P e r f o rm a n c eP P M < LS L 0 . 0 0P P M > U S L 0 . 0 0P P M T o t a l 0 . 0 0
E x p . W it h in P e r f o rm a n c eP P M < L S L 8 6 2 . 4 1P P M > U S L 5 0 1 2 . 9 4P P M T o t a l 5 8 7 5 . 3 5
E x p . O v e ra l l P e r f o rm a n c eP P M < LS L 3 1 4 6 . 7 3P P M > U S L 1 2 3 9 1 . 4 7P P M T o t a l 1 5 5 3 8 . 2 0
W ith inO v e r a ll
P r o c e s s C a p a b i l i t y o f B o r e S i z e - U s e d
Figure 8 - Process Capability of Bore Size by using a Used Honing Tool
Table 12 - Sigma Level of Bore Size before and after Improvement
Sl. No.
Performance Measure
Before Improvement
After Improvement New Honing Tool Used Honing Tool
1 Ppm 201768 82 15538 2 Sigma Level 2.32 5.27 3.65
The summary of the improvement thus achieved in
improving process capability of bore size of crank case is given in Table 12.
The main objective of control phase of a Six-Sigma project is to ensure that the changes are permanent and the gain obtained from the project remains permanent. Hence, at this stage, the optimum process conditions are documented in the manufacturing process control plan document and implemented in the system to make the changes irreversible. All root causes identified during Analysis phase and their optimum condition as identified in the Improve phase are documented at
control phase for the purpose of process monitoring and control.
The result thus obtained by this project is a multifold reduction of process ppm of bore size, which is the main objective of any Six-Sigma project. Apart from improvement of process capability, the project also saves Rs. 10 million per annum at the rated production. It was also established by this project that throughout the life of the honing tool there will be no rejection of crankcase due to bore size problem anymore.

120 S. Ray, P. Das
7. DISCUSSION This case illustrates the application of Six-Sigma to
resolve the problem of manufacturing process variation affecting bore size of crankcase. The DMAIC approach of Six Sigma is a systematic methodology utilizing training, measurement and data analysis tools to identify the root causes and eliminate these causes by improving the current process and thus achieving better results. The qualitative and quantitative tools helped to identify, prioritise and validate the possible root causes and their interrelationship to the CTQ’s (y). Specifically, Six-Sigma DMAIC methodology allows effective problem definition, allows for use of data rather than trials and conjecture during critical decision making, helps study team to think about the process, and provides an approach for managing real improvement. It describes how the project was specified, how the tools were employed in the different phases to identify, improve and control the correct sources of variation resulting into scrap and rework. This study demonstrates a project in which DMAIC scheme with logical analysis, statistical validation, design of experiments and hypothesis testing were employed to identify the KPIVs that affect the process capability of bore size. This
project has substantially benefitted the organization by reducing the bore size variation of crankcase, making the loss due to rejection and rework to zero and finally improving customer satisfaction by supplying better quality product.
This paper will be of interest to academic researchers and practical managers. It describes the justification and selection of the project, how the tools and techniques of DMAIC methodology were employed in the different phases and how the improvement actions were implemented. This project methodology can be used to solve any process issue resulting in improving business results and finally improve customer satisfaction. However, people can modify the detailed contents and tools according to the organizational condition, selection of variables for analysis and availability of data.
Additional benefits were observed in this work, including the employee participation in Six Sigma project. The management was impressed with the analysis generated by the Six Sigma project. To make the Six Sigma principle a culture of the organization, a guideline was developed to ensure that problem solving of similar nature should be tackled in similar fashion.
REFERENCES:
[1] Antony, J. and Banuelas, R. (2001). Six Sigma: A business strategy for manufacturing organizations. Manufacturing Engineering, 8093), 119-121.
[2] Coronade, R. and Antony, J. (2002). Critical success factors for the implementation of Six Sigma projects in organization. The TQM Magazine, 14(2), 92-99.
[3] Feigenbaum, A. V., (1986), Total Quality Control, McGraw Hill. [4] Hammer, M. (2002). Process management and the future of Six Sigma, MIT Sloan Management
Review, 43(2), 26-32. [5] Harry, M. (1998). Six Sigma: A breakthrough strategy for profitability. Quality Progress, 31(5), 60-64 [6] Juran J. M., (1988), Juran on Planning for Quality, The Free Press. [7] Juran, J.M. (1989). Juran on Leadership for Quality, The Free Press. [8] Lin, C. and Wu, C. (2005). A knowledge creation model for ISO 9001:2000. Total Quality
Management and Business Excellence, 16(5), 657-670. [9] Mahanti, R. and Antony, J. (2005). Confluence of Six Sigma simulation and software development.
Managerial Auditing Journal, 20(7), 739-762. [10] Measurement System Analysis Reference Manual, AIAG, 2010. [11] Montgomery, D. C., (1991). Design and Analysis of Experiments, Third Edition. John Wiley & Sons. [12] Motwani, J. (2003). A business process change framework for examining lean manufacturing: A case
study. Industrial Management and Data Systems, 103(5), 339-349. [13] Pande, P.S., Neuman, R. and Cavanagh, R.R. (2000). The Six Sigma way: How GE, Motorola and other
top companies are honing their performance. New York: McGraw-Hill. [14] Park, S.H. 92002). Six Sigma for productivity improvement: Korean business corporation. Productivity
Journal, 43(2), 173-183. [15] Porter, L. (2001). Six Sigma excellence. Quality World, 1, 20-25. [16] Ray, S. and Das, P. (2009). Improving efficiency and effectiveness of APQP process by using DFSS
tools. International Journal of Six-Sigma and Competitive Advantage, 5(3), 222–236. [17] Ray, S. and Das, P. (2010). Six-Sigma Project Selection Methodology, International Journal of Lean
Six Sigma, 1(4), 293-309, 2010.

Vol.5, No. 2, 2011 121
[18] Rounce, G. (1998). Quality, waste and cost consideration in architectural building design management. International Journal of Project Management, 16(2), 123-127.
[19] Stamatis, D.H. (2004). Six-Sigma Fundamentals: A Complete Guide to the System, Methods, and Tools, New York, Productivity Press.
[20] Stewart, R.A. and Spencer, C.A. (2006). Six Sigma as a strategy for process improvement on construction projects: a case study. Construction Management and Economics, 24(April), 523-531.
[21] Vujović, A., Krivokapić, Z., & Jovanović, J. (2010). Top prioriti QMS principles for achieving business excellence. International Journal for Quality Research, 4(2), 117-124.
Received: 01.02.2011 Accepted: 10.04.2011 Open for discussion: 1 Year

122 S. Ray, P. Das


![Early history of the DEMING CONFERENCE begins at the post ...Walter A. Shewhart and S. S. Wilks Founding editors John t]o Ç^^ ] ] ^ ] _ 1946 Princeton Applied Statistics seminar becomes](https://img.pdfslide.net/doc/110x75/5e7e71bc0153f11c6c4d60cb/early-history-of-the-deming-conference-begins-at-the-post-walter-a-shewhart.jpg)