Embed Size (px)
Citation preview
Improved Hybrid Geoid Modelingand the FY 2000 Geoid Models
Dr. Daniel R. Roman
January 16, 20019:30 - 10:30
Conference Room 9836
OUTLINE
• Introduction• G99SSS• GPSBM’s, alternative
geoid height point data• Residual values from
GPSBM’s - G99SSS• Overview of LSC• GEOID99
• Overview of studies• Iterative-LSC• Multi-Matrix-LSC• Summary of Modeling• FY2000 Geoid Models• Conclusions• Future Research
Introduction
• GEOID90/GEOID93 used gravimetric data
• GEOID96/GEOID99 were hybrids created from gravimetric & other geoid height data
• FOCUS: on the approach taken to combine these different data sources and the best solutions for modeling remaining signal
• Data are the same as used for the GEOID99 computation to facilitate comparison
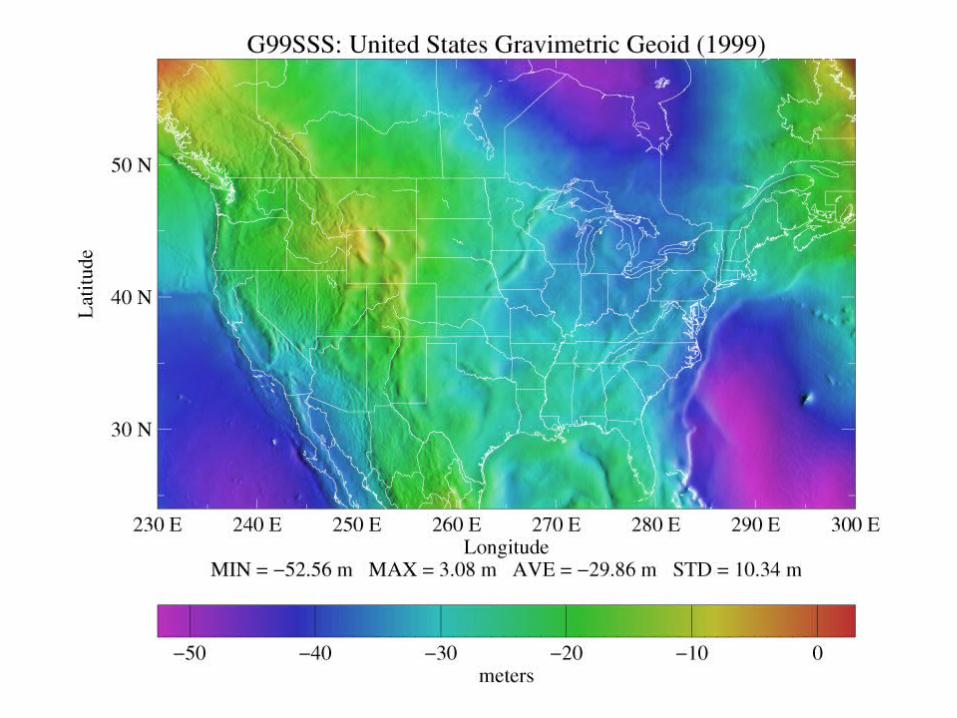
The gravimetric geoid model, G99SSS
• Derived from more than three million terrestrial, marine and altimeter gravity data
• EGM96 gravity removed to create residuals• Gridded at one arcminute to maximize the
resolution of the gravity field• Reference datum is ITRF96(1997.0) • Converted to residual geoid height grid with
1D FFT and restored EGM96 geoid values
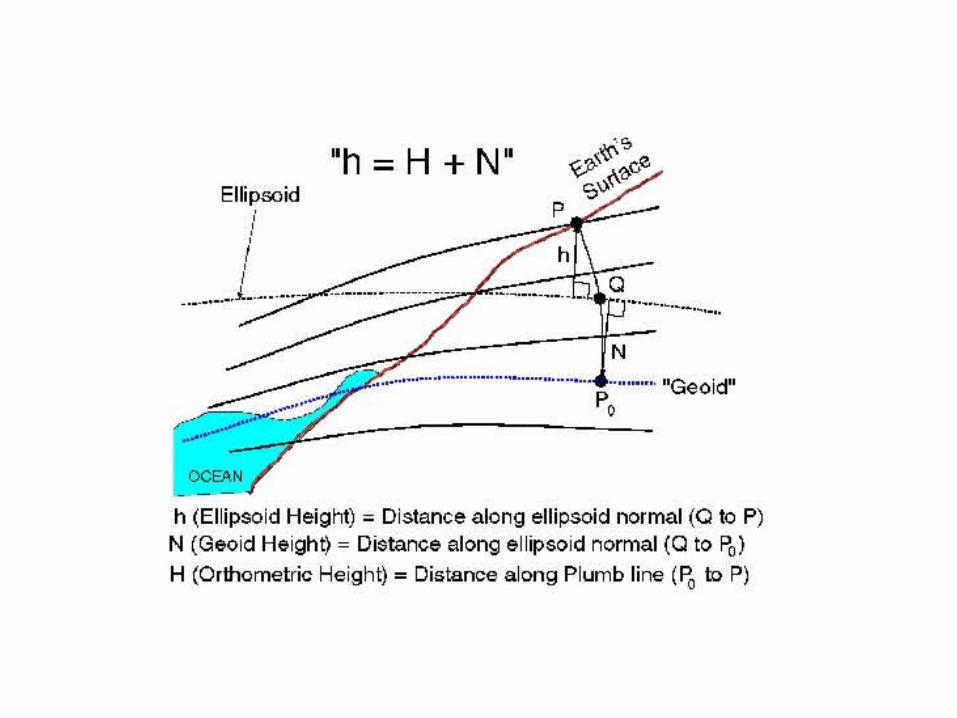
GPSBM’s, alternative geoid height point data
• GPS-derived ellipsoid heights on spirit-leveled Bench Marks (GPSBM’s) give a spot estimate of the geoid height
• GPS heights are WRT NAD 83 (ellipsoidal)
• Leveling is WRT NAVD 88 (orthometric)
• Accuracy of geoid heights is dependent on the quality of the ellipsoid and orthometric point values
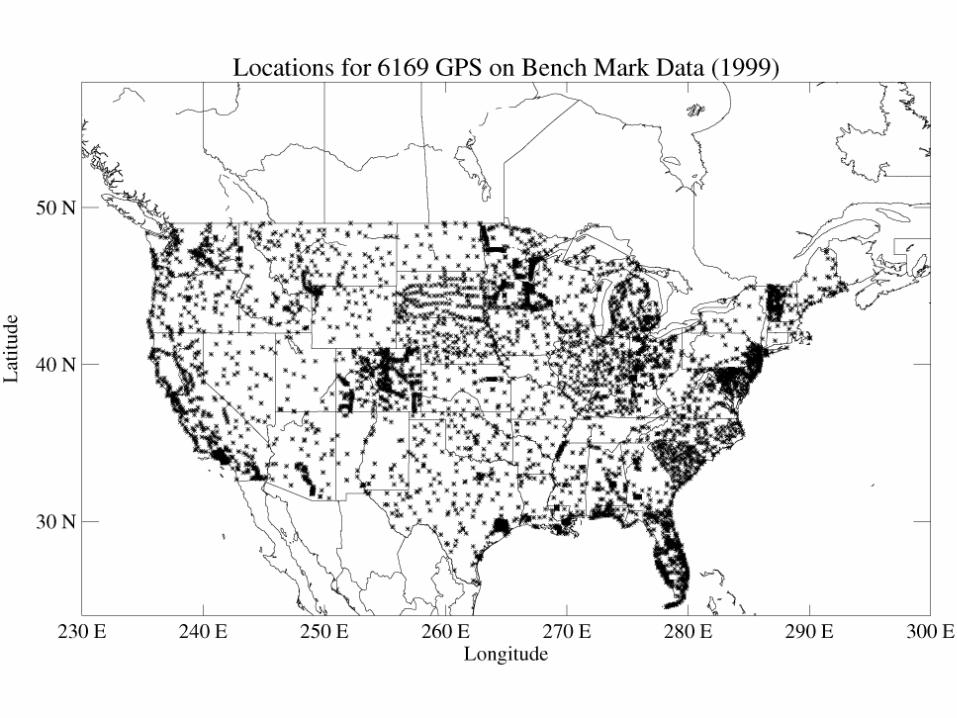
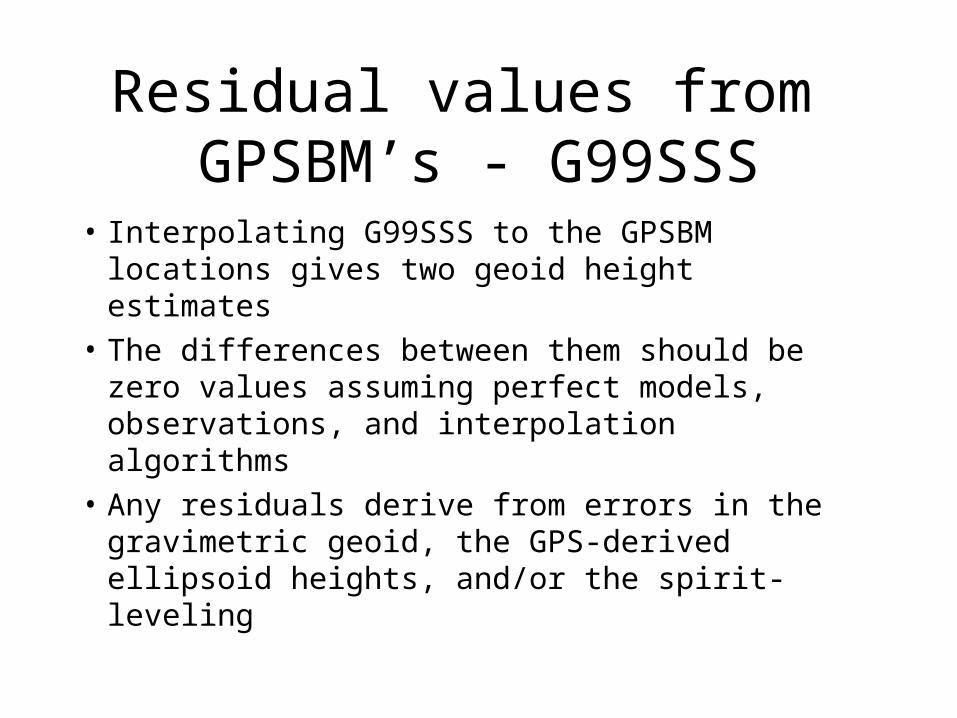
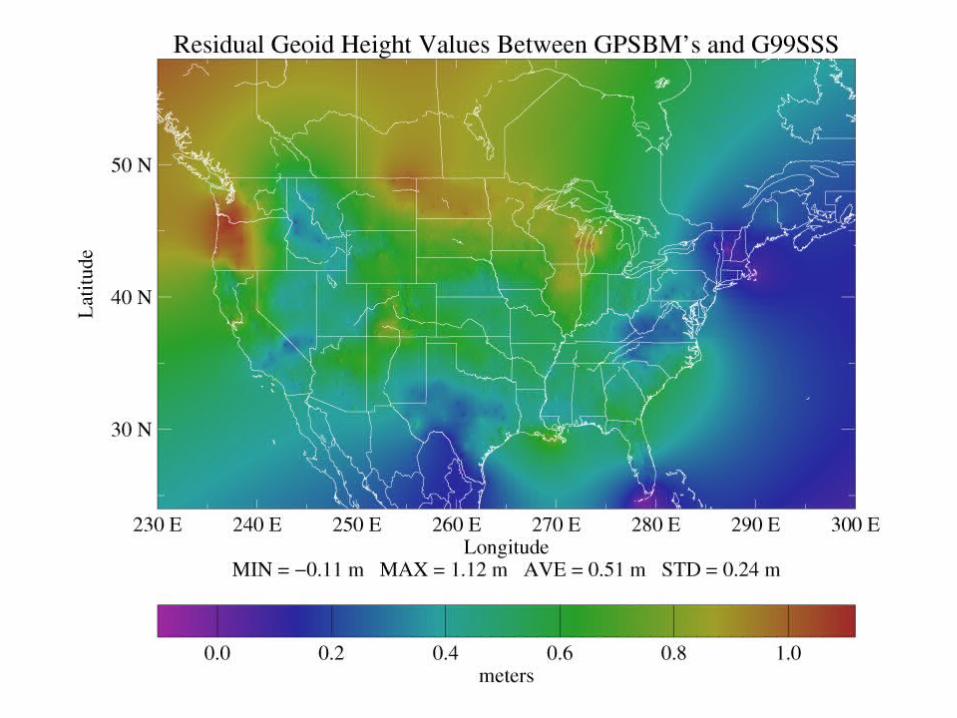
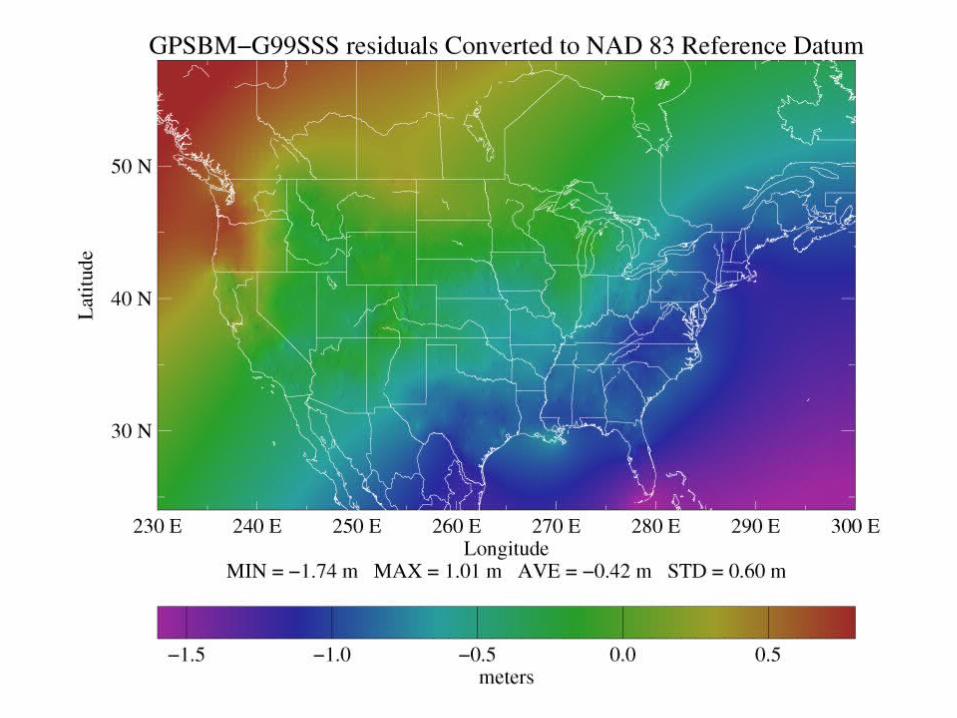
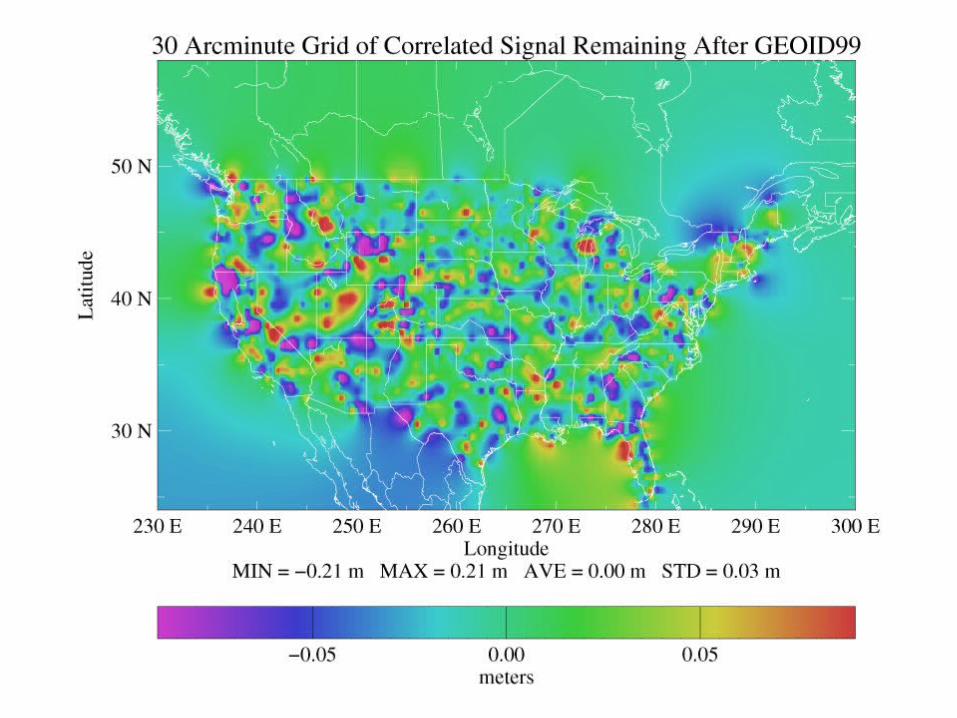
Residual values from GPSBM’s - G99SSS
• Interpolating G99SSS to the GPSBM locations gives two geoid height estimates
• The differences between them should be zero values assuming perfect models, observations, and interpolation algorithms
• Any residuals derive from errors in the gravimetric geoid, the GPS-derived ellipsoid heights, and/or the spirit-leveling
• Simply gridding residuals yields no error analysis - what is signal and what is noise?
• Must find broader signal in the residuals that correlates over longer distances
• Signal amplitude matches the auto-correlated variance (A0) of the residuals
• The character of the correlated signal drop off with distance (D) is defined by A0, the correlation length (L) and a constant ()
Overview of LSC
100%
50%
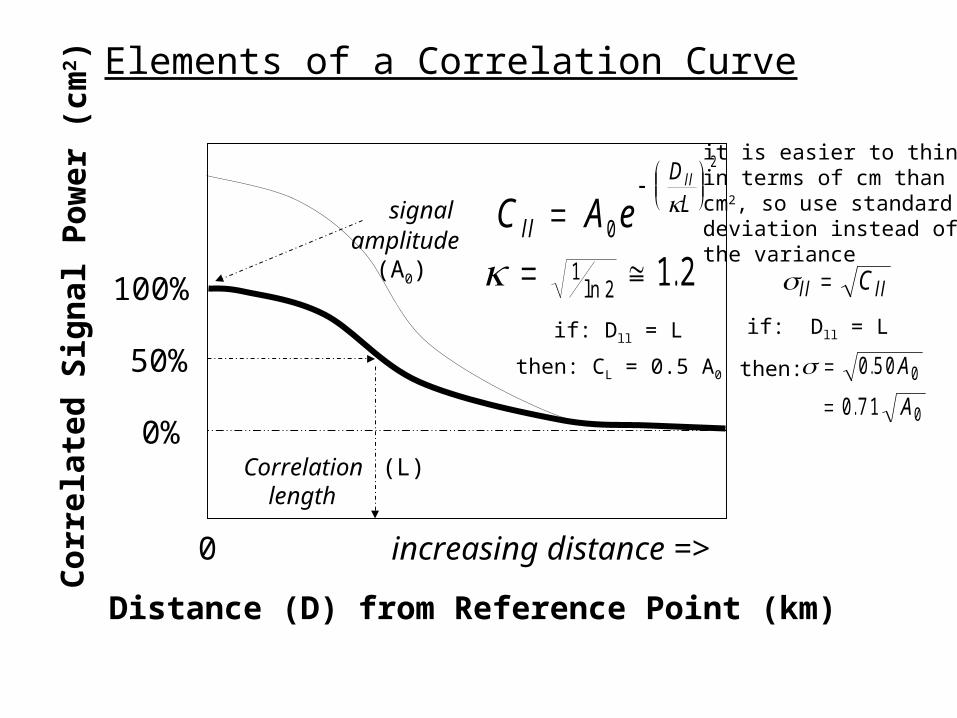
Correlation (L) length
Cor
rel a
ted
Si g
nal
Pow
er (
cm2 )
Distance (D) from Reference Point (km)
Elements of a Correlation Curve
0%
signal amplitude (A0)
0
if: Dll = L
then: CL = 0.5 A0
increasing distance =>
ll llC
if: Dll = L
then:
0 5 0
0 7 1
0
0
.
.
A
A
it is easier to thinkin terms of cm than cm2, so use standarddeviation instead ofthe variance
C A ell
DLll
0
2
12 1 2ln .
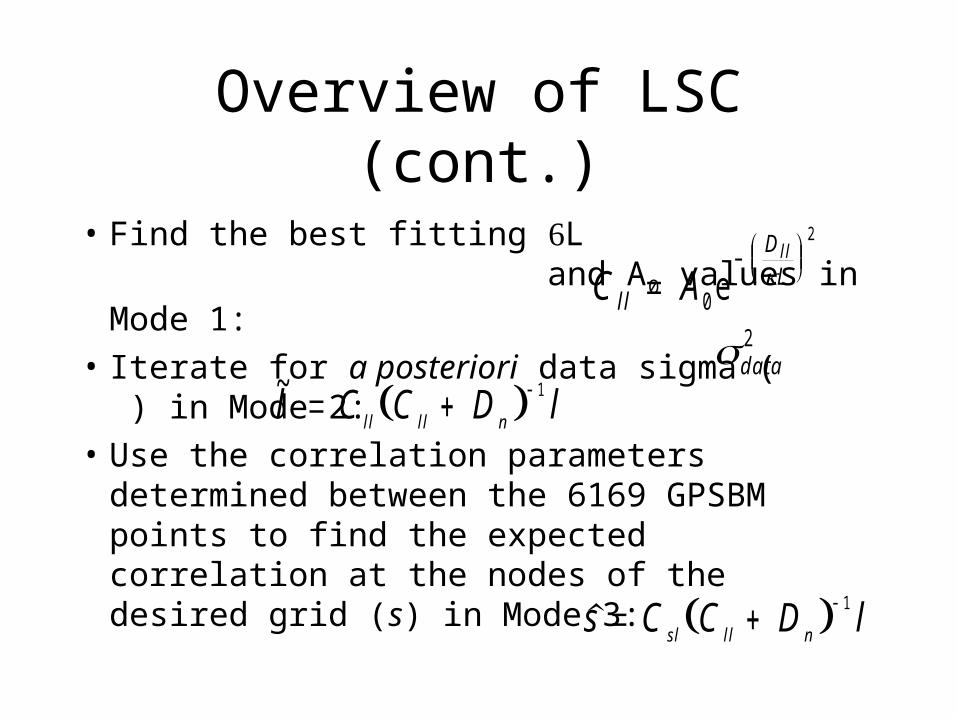
Overview of LSC (cont.)
• Find the best fitting L and A0 values in Mode 1:
• Iterate for a posteriori data sigma ( ) in Mode 2:
• Use the correlation parameters determined between the 6169 GPSBM points to find the expected correlation at the nodes of the desired grid (s) in Mode 3:
C All
DLll
0
2
e
~l C C D lll ll n 1
s C C D lsl ll n 1
da ta2
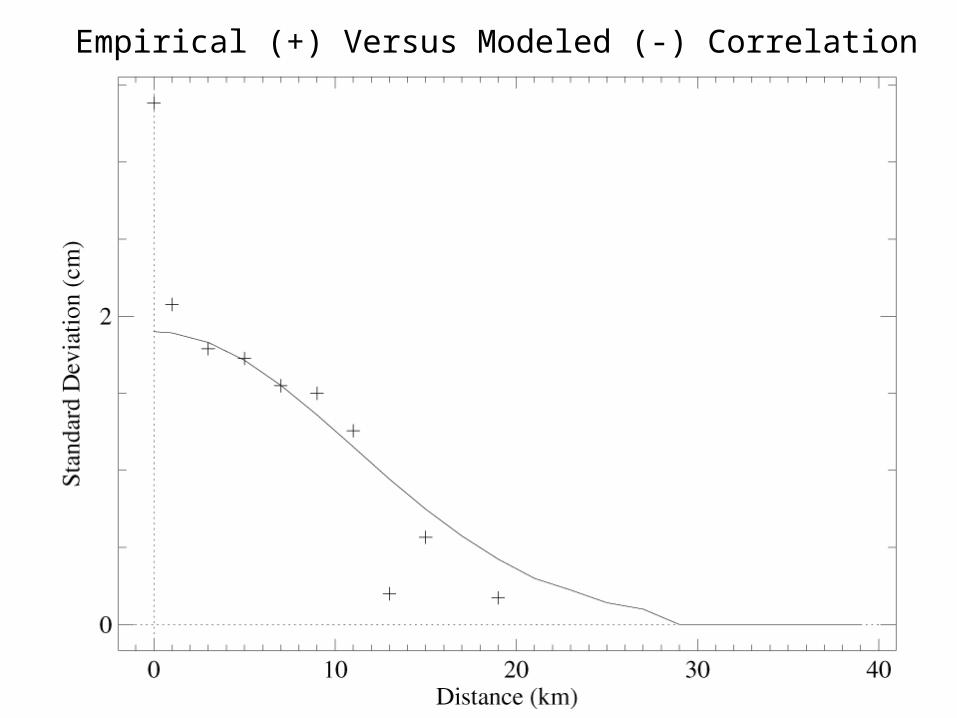
• A national bias of 51.7 cm & trend of 0.15 ppm (azimuth = 327o) were removed from the GPSBM-G99SSS residuals
• Best fit parameters of A0 = (18.2 cm)2, L = 400 km & = (4.6 cm)2 were determined for the remaining residual signal
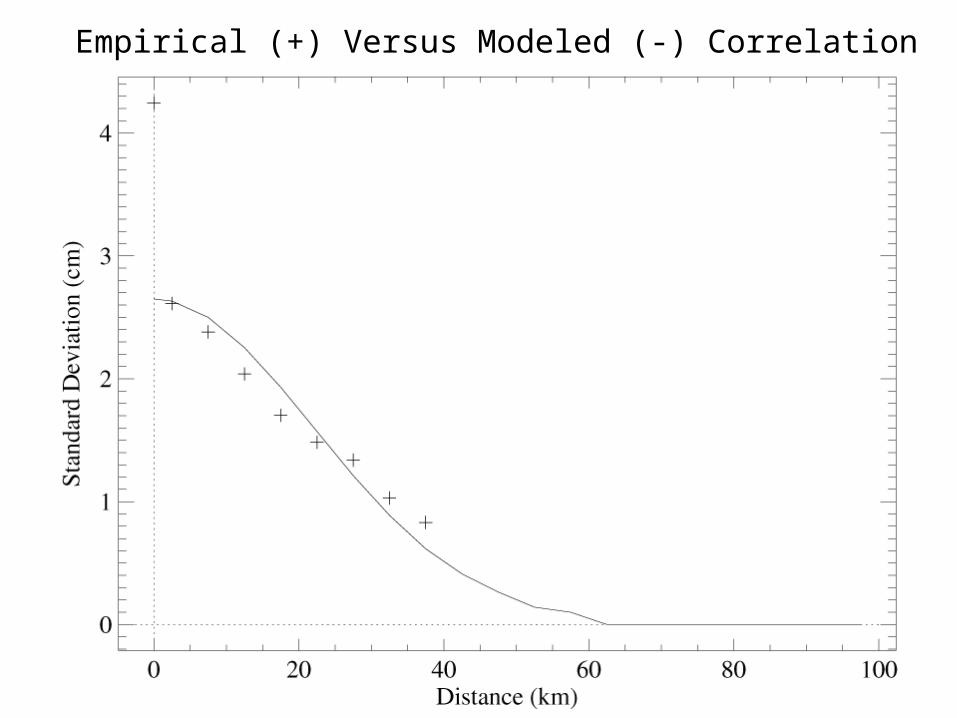
• Note the discrepancy between the empirical data (+) and the modeled values (line)
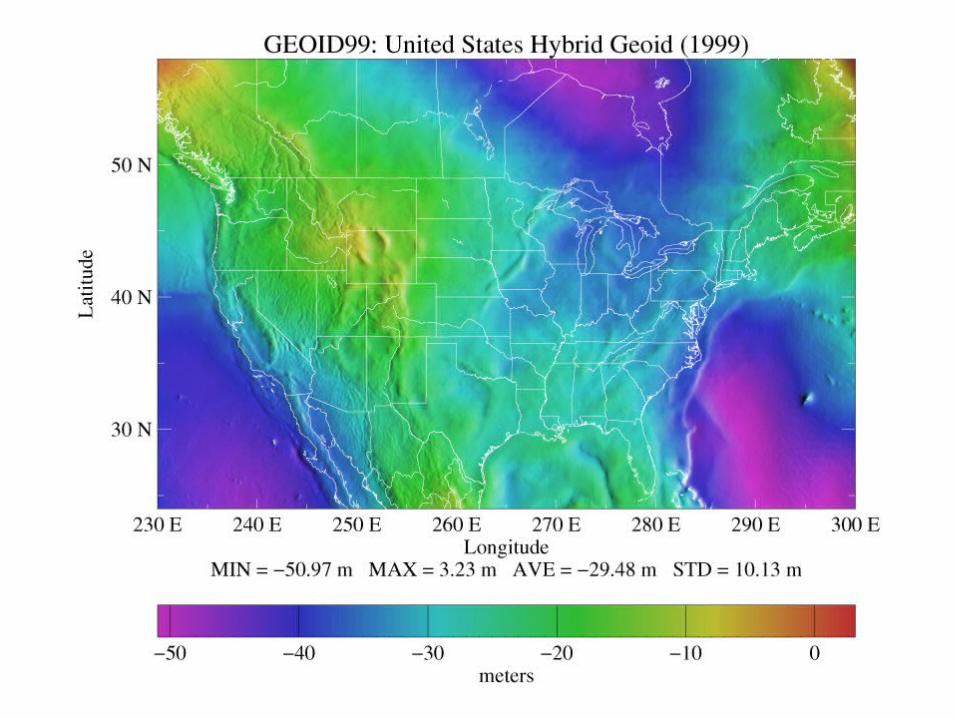
GEOID99
da ta
2
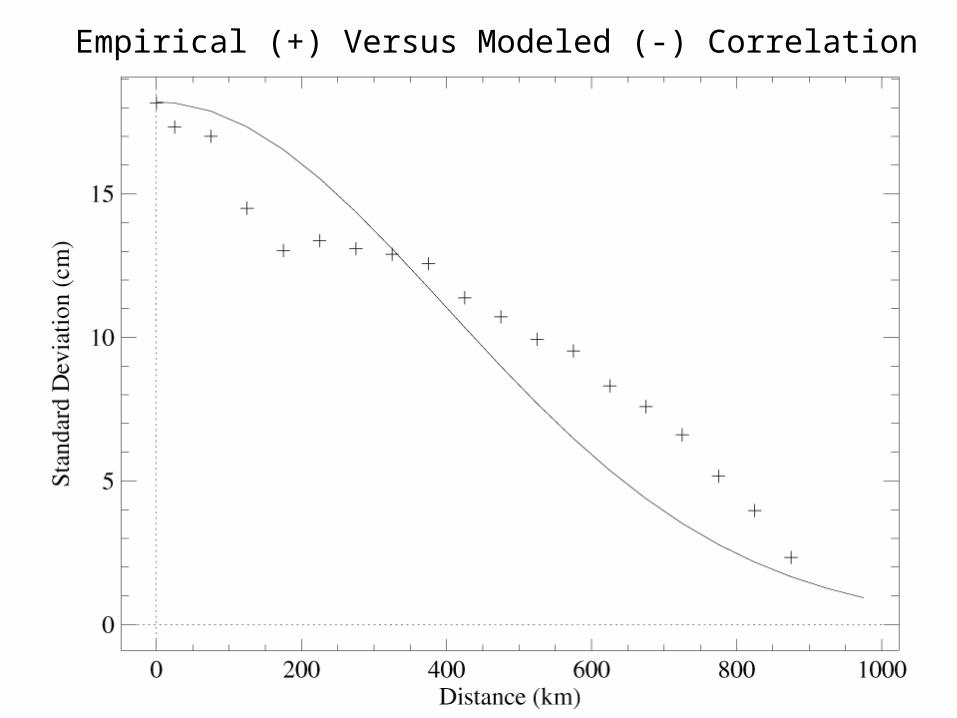
Empirical (+) Versus Modeled (-) Correlation
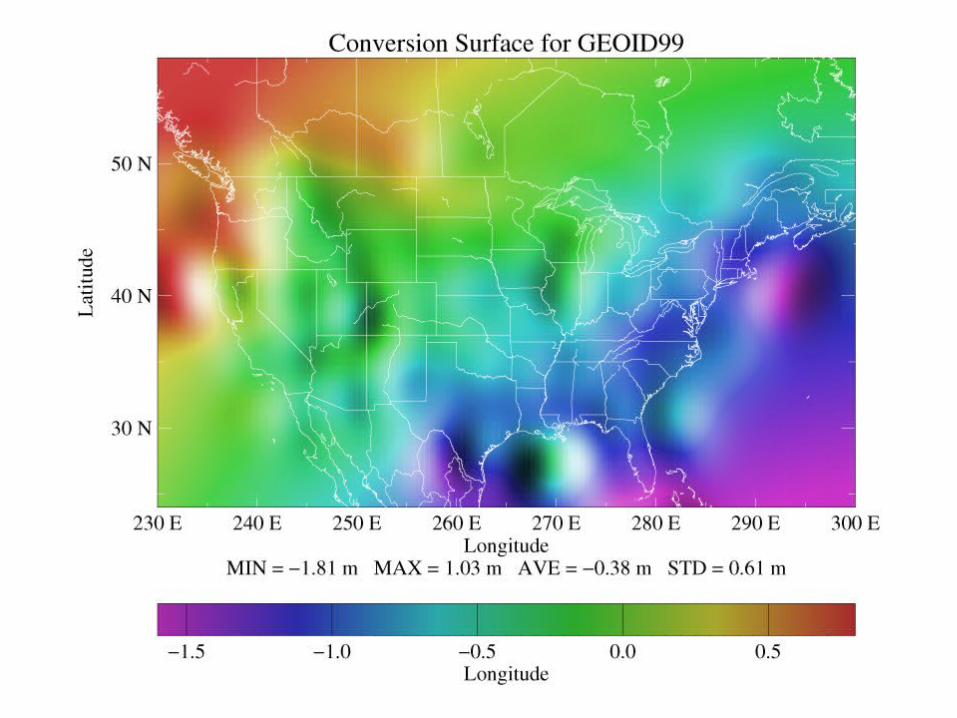
GEOID99 (cont.)
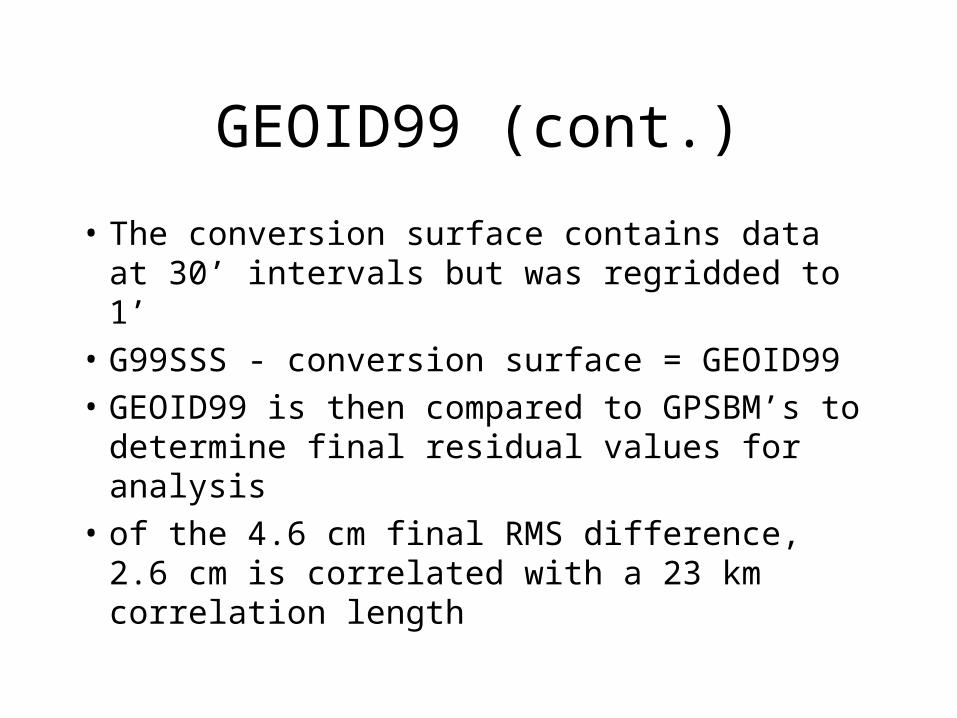
• The conversion surface contains data at 30’ intervals but was regridded to 1’
• G99SSS - conversion surface = GEOID99
• GEOID99 is then compared to GPSBM’s to determine final residual values for analysis
• of the 4.6 cm final RMS difference, 2.6 cm is correlated with a 23 km correlation length
Empirical (+) Versus Modeled (-) Correlation
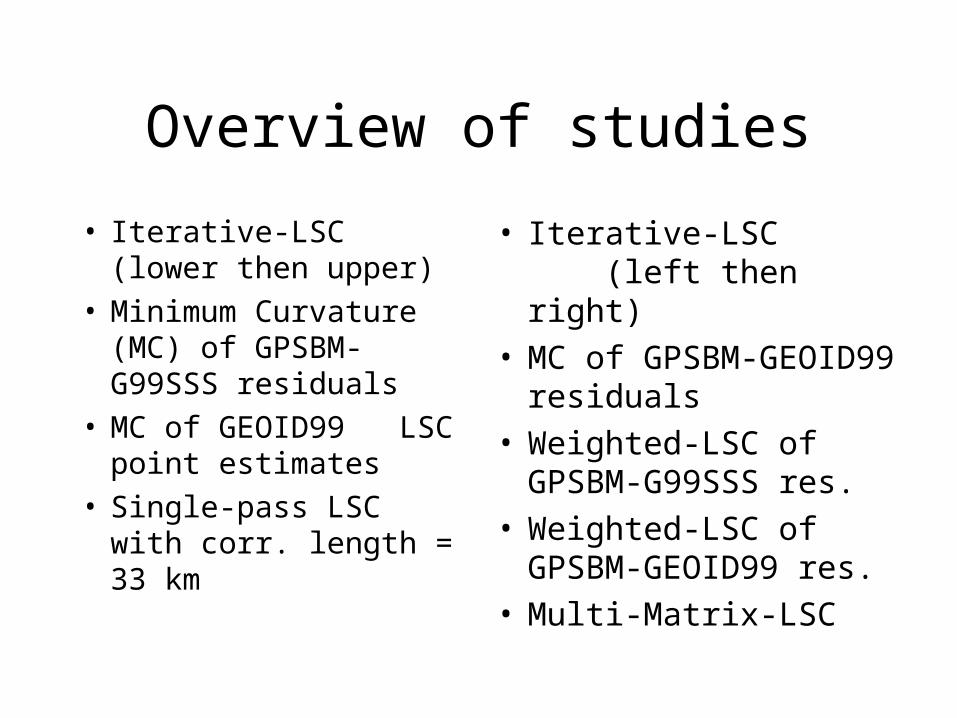
Overview of studies
• Iterative-LSC (lower then upper)
• Minimum Curvature (MC) of GPSBM-G99SSS residuals
• MC of GEOID99 LSC point estimates
• Single-pass LSC with corr. length = 33 km
• Iterative-LSC (left then right)
• MC of GPSBM-GEOID99 residuals
• Weighted-LSC of GPSBM-G99SSS res.
• Weighted-LSC of GPSBM-GEOID99 res.
• Multi-Matrix-LSC
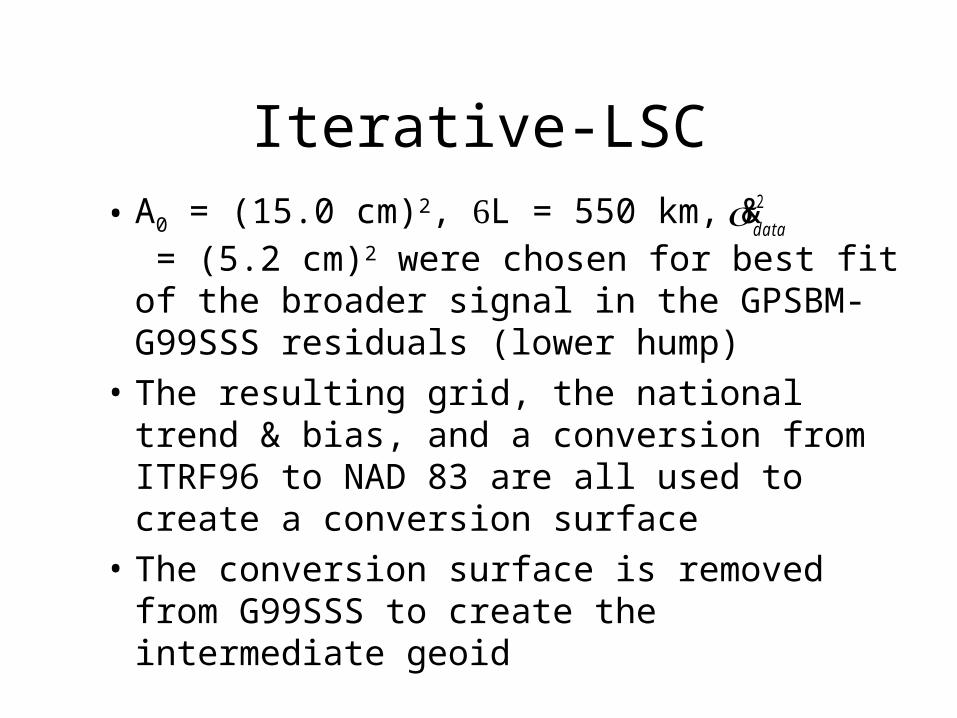
• A0 = (15.0 cm)2, L = 550 km, & = (5.2 cm)2 were chosen for best fit of the broader signal in the GPSBM-G99SSS residuals (lower hump)
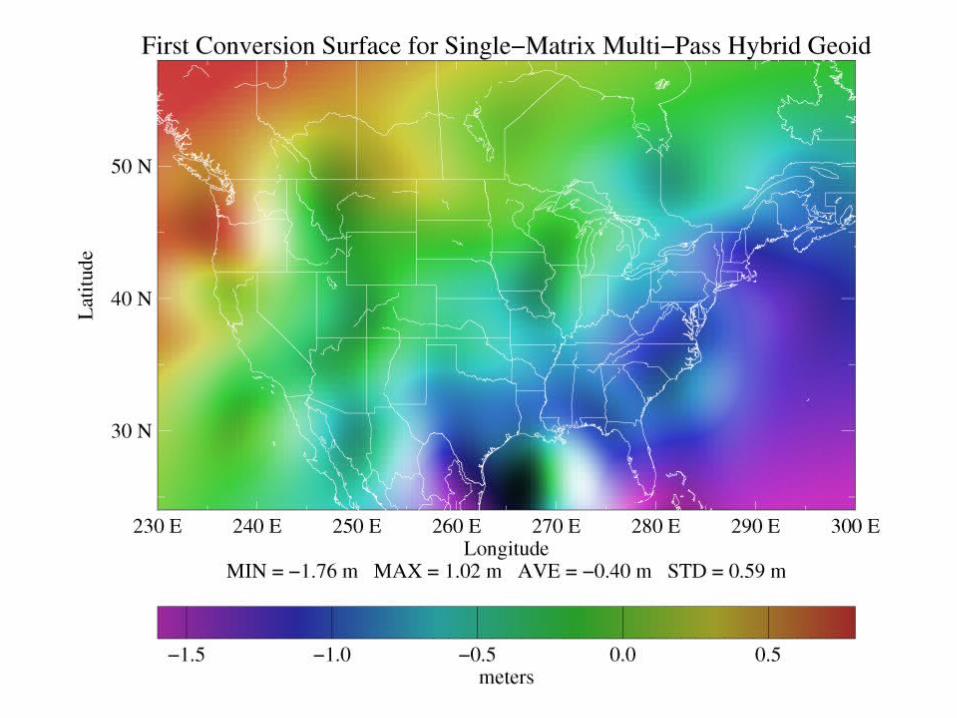
• The resulting grid, the national trend & bias, and a conversion from ITRF96 to NAD 83 are all used to create a conversion surface
• The conversion surface is removed from G99SSS to create the intermediate geoid
Iterative-LSCda ta
2
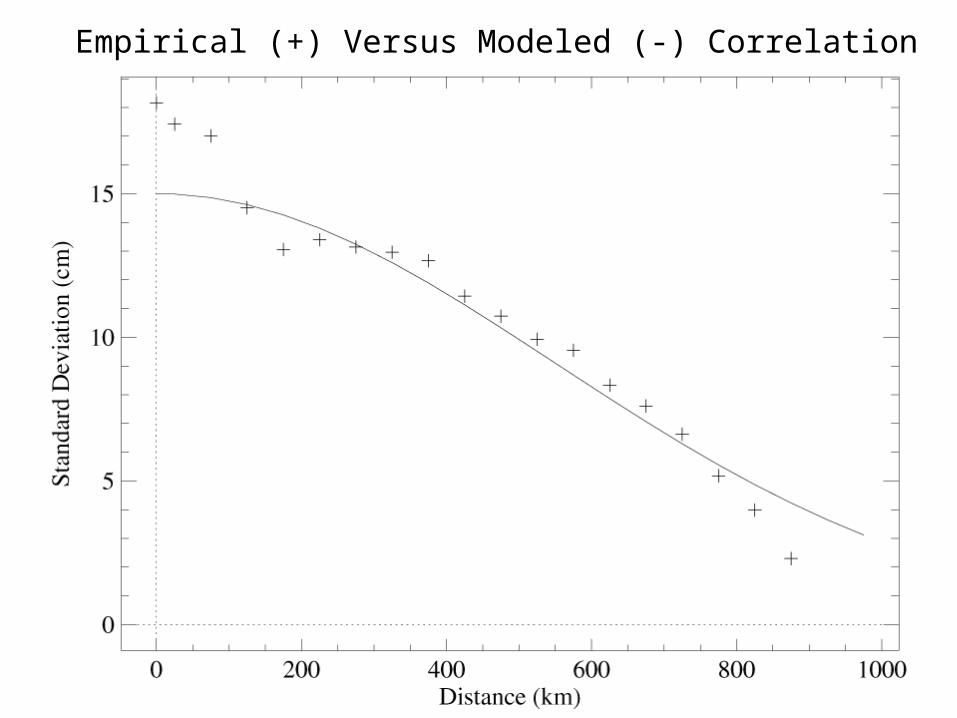
Empirical (+) Versus Modeled (-) Correlation
Iterative-LSC (cont.)
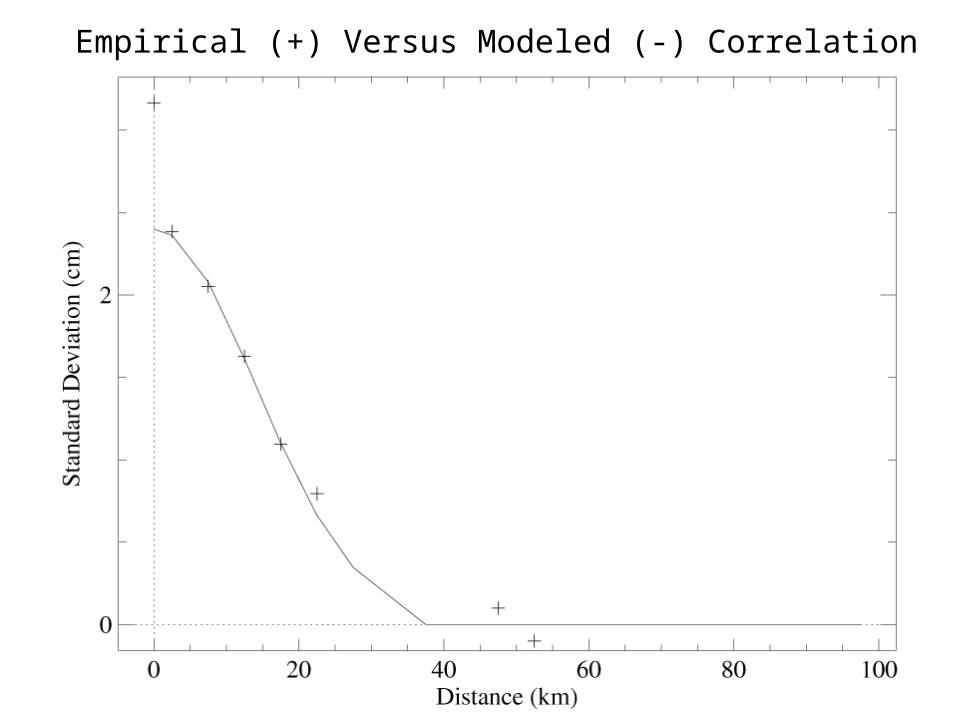
• Revised residuals are generated by removing interpolated values from the intermediate geoid from the GPSBM’s (GPSBM’s - inter. geoid = rev. residuals)
L=33 km, A0=(3.0 cm)2 and = (2.3 cm)2
were selected to best fit these residuals
• Note the uncorrelated signal component
• Resulting grid = 2nd conversion surface
da ta
2
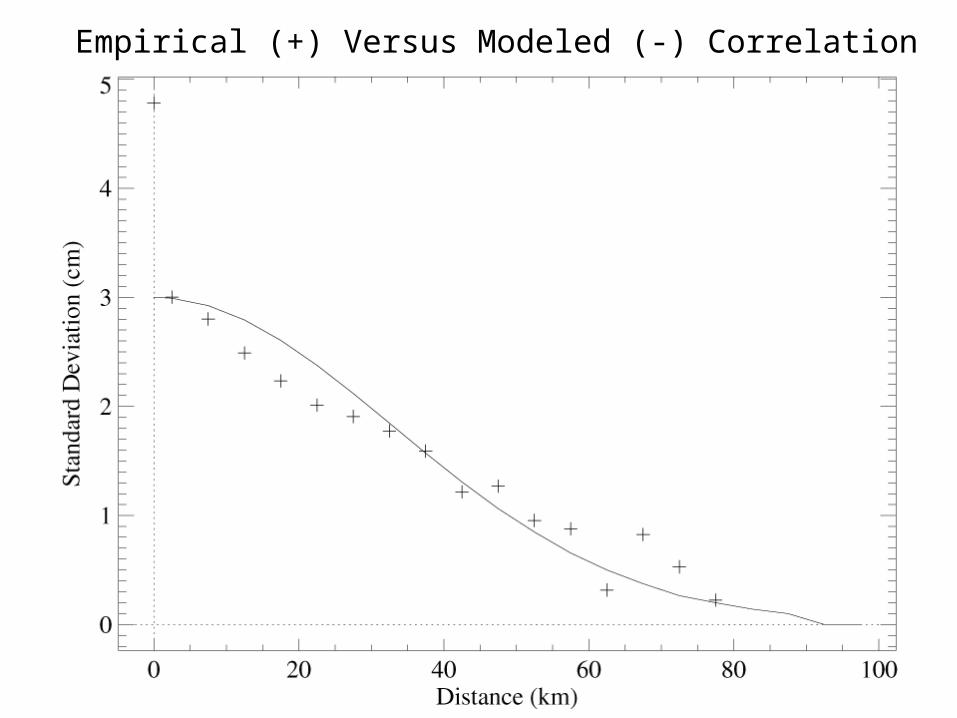
Empirical (+) Versus Modeled (-) Correlation
Iterative-LSC (cont.)
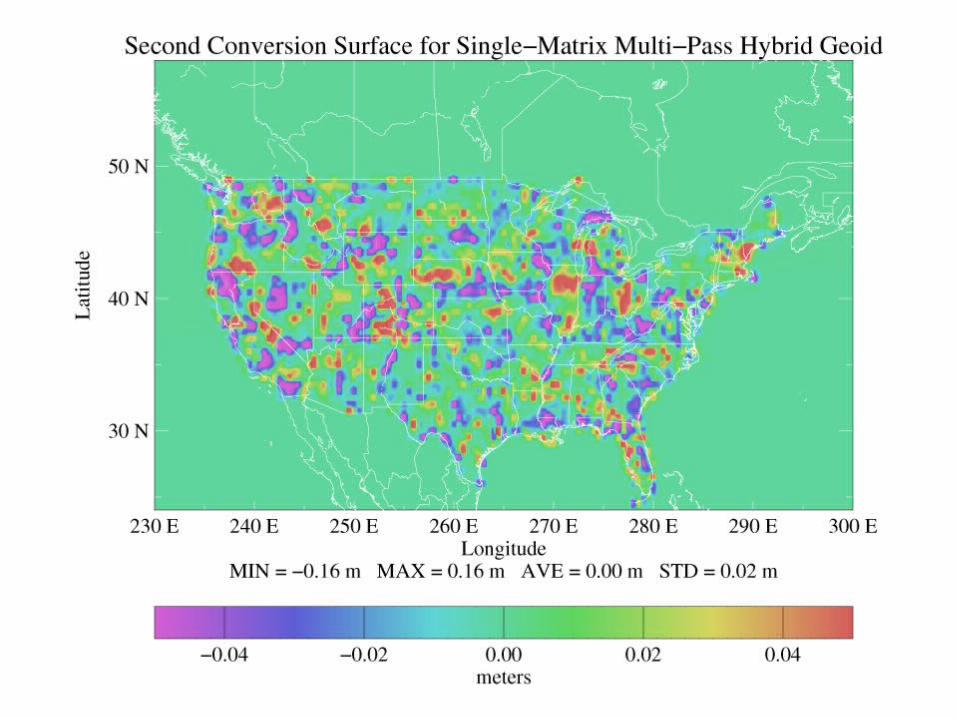
• The second conversion surface is removed from the intermediate hybrid geoid to create the final hybrid geoid model
• Heights from this model are removed from the GPSBM’s for final residuals
• of the 3.3 cm final RMS difference, 2.4 cm is correlated with a 14 km correlation length

Empirical (+) Versus Modeled (-) Correlation
Multi-Matrix-LSC
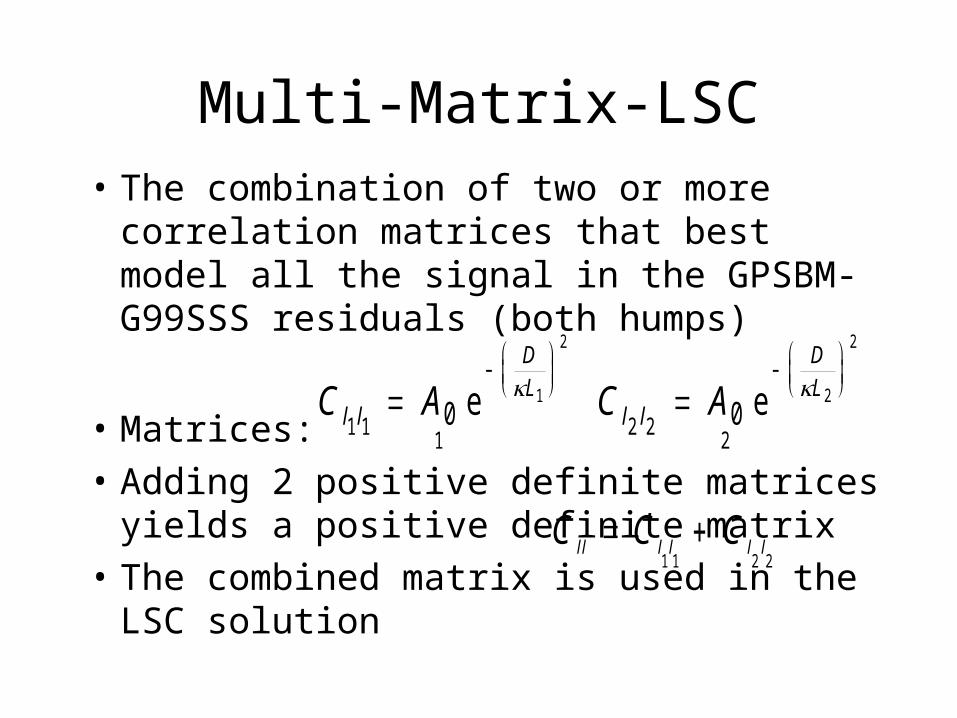
• The combination of two or more correlation matrices that best model all the signal in the GPSBM-G99SSS residuals (both humps)
• Matrices:
• Adding 2 positive definite matrices yields a positive definite matrix
• The combined matrix is used in the LSC solution
C Al l
DL
1 110
1
2
e
C C Cll l l l l 1 1 2 2
C Al l
DL
2 220
2
2
e
Multi-Matrix-LSC (cont.)
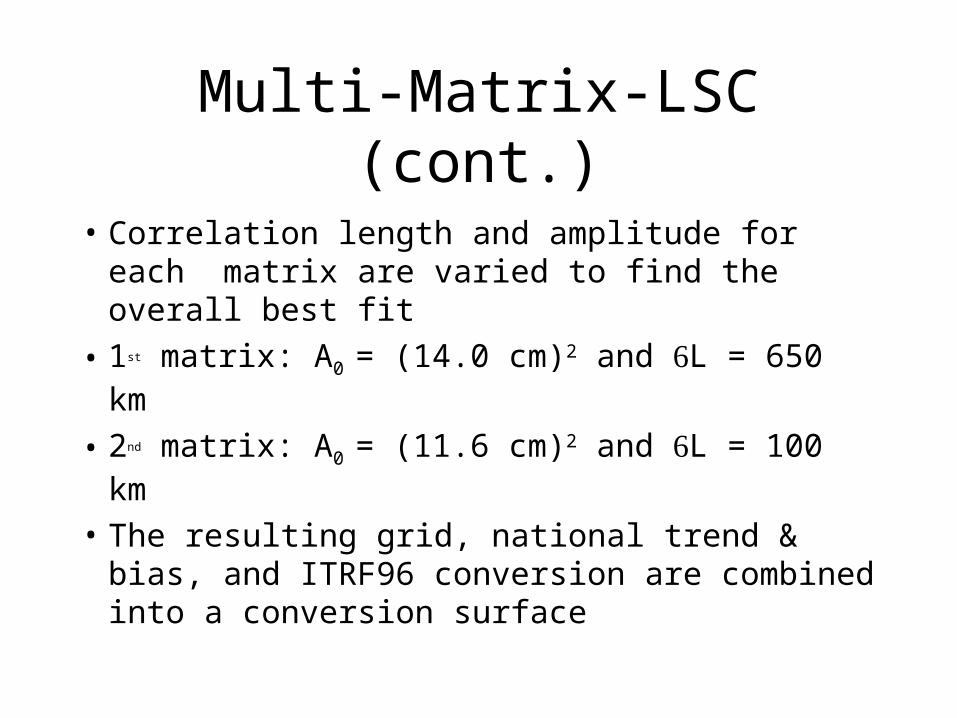
• Correlation length and amplitude for each matrix are varied to find the overall best fit
• 1st matrix: A0 = (14.0 cm)2 and L = 650 km
• 2nd matrix: A0 = (11.6 cm)2 and L = 100 km
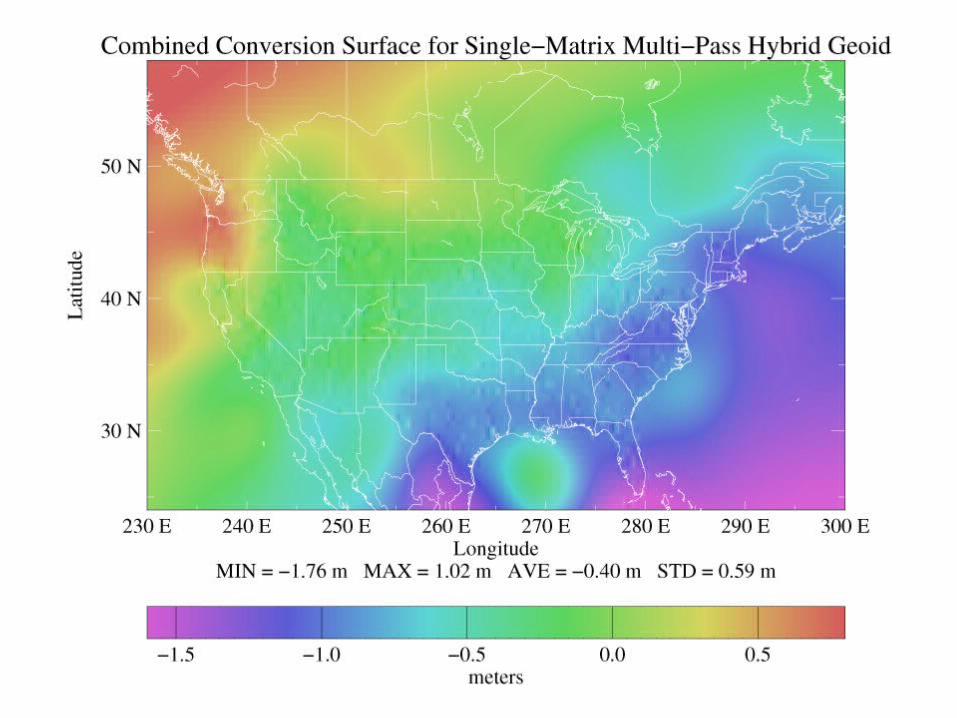
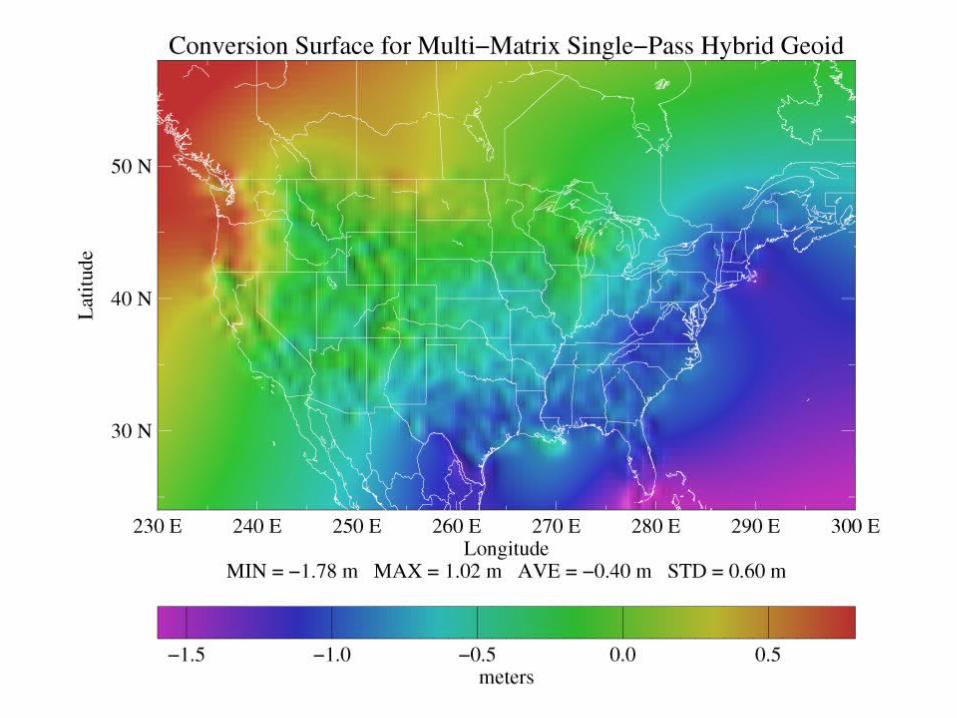
• The resulting grid, national trend & bias, and ITRF96 conversion are combined into a conversion surface
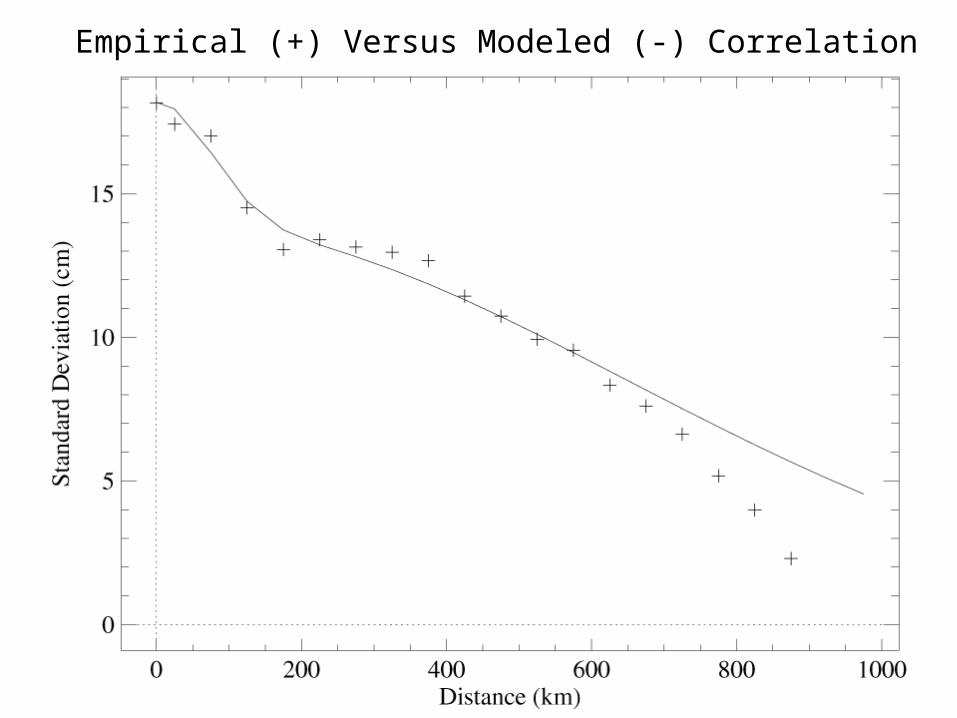
Empirical (+) Versus Modeled (-) Correlation
Multi-Matrix-LSC (cont.)
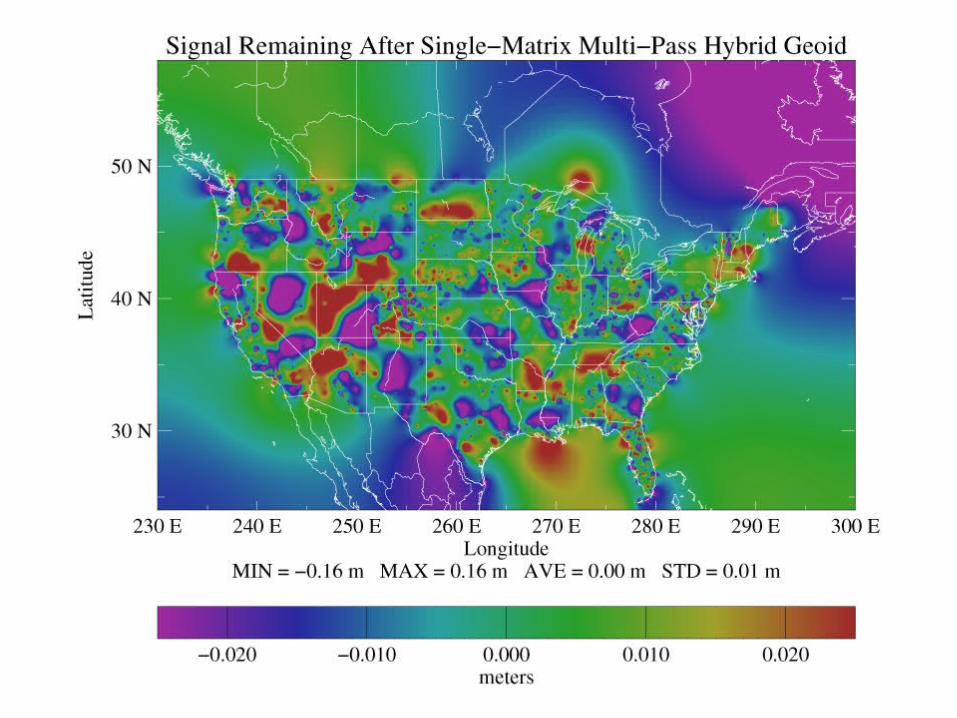
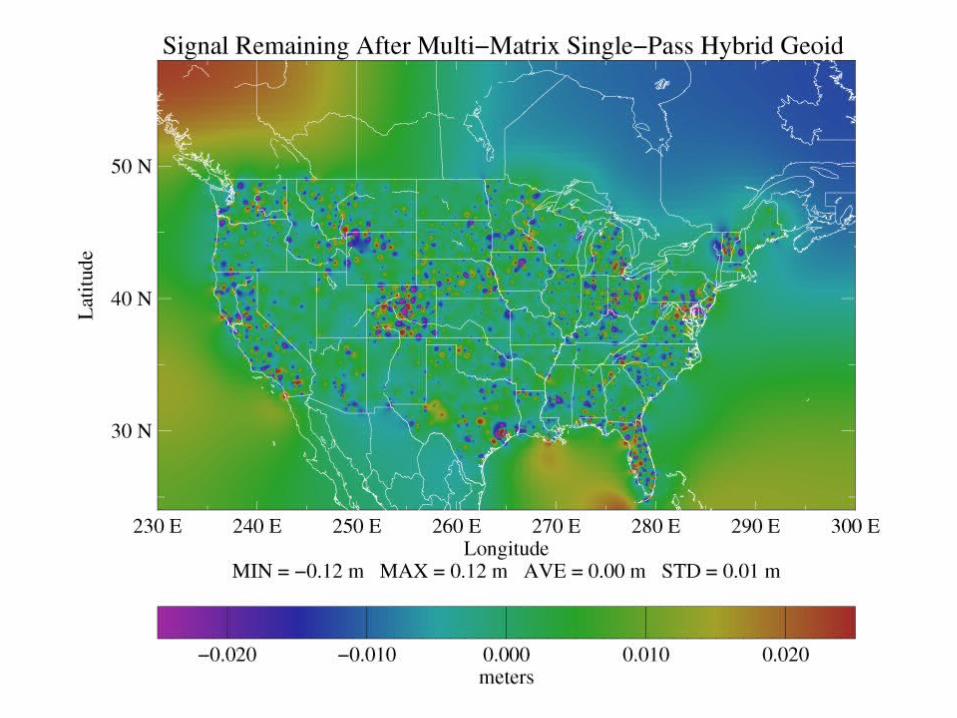
• This conversion surface is removed from G99SSS to create the final hybrid geoid
• Heights from this model are removed from the GPSBM’s for final residuals
• of the 3.0 cm final RMS difference, 1.7 cm is correlated with an 8 km correlation length

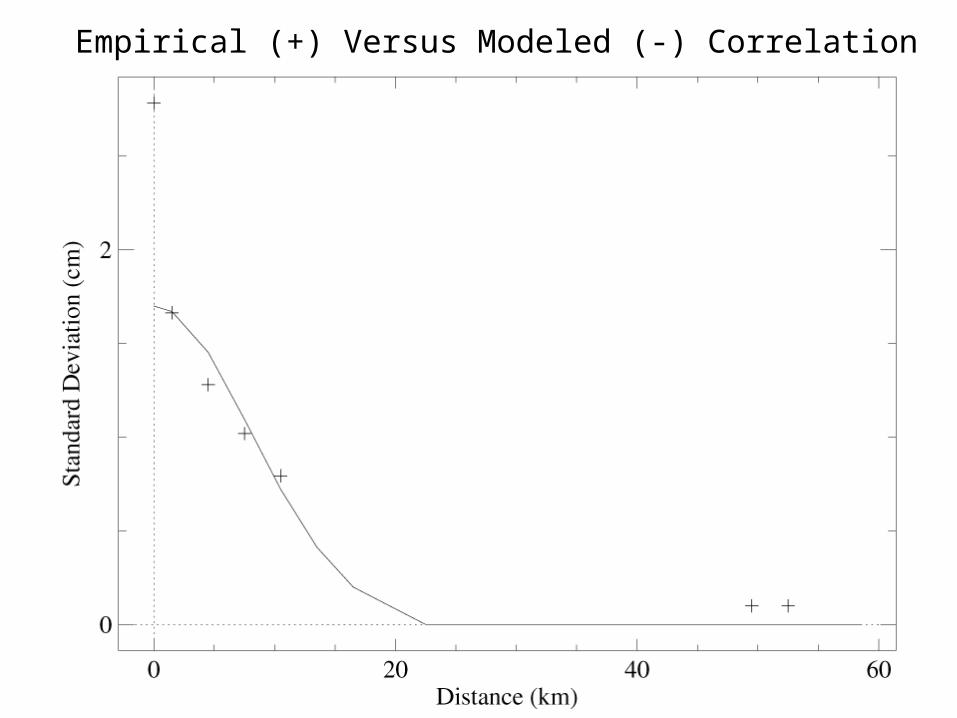
Empirical (+) Versus Modeled (-) Correlation
Summary of Modeling Studies
• Two approaches gave improved results in modeling GPSBM-G99SSS residual signals
• The iterative-LSC process models broader signal with a single matrix, generating an intermediate geoid and revised residuals that are modeled with another single matrix
• Multi-Matrix-LSC uses multiple matrices in a single pass to best fit the initial residuals
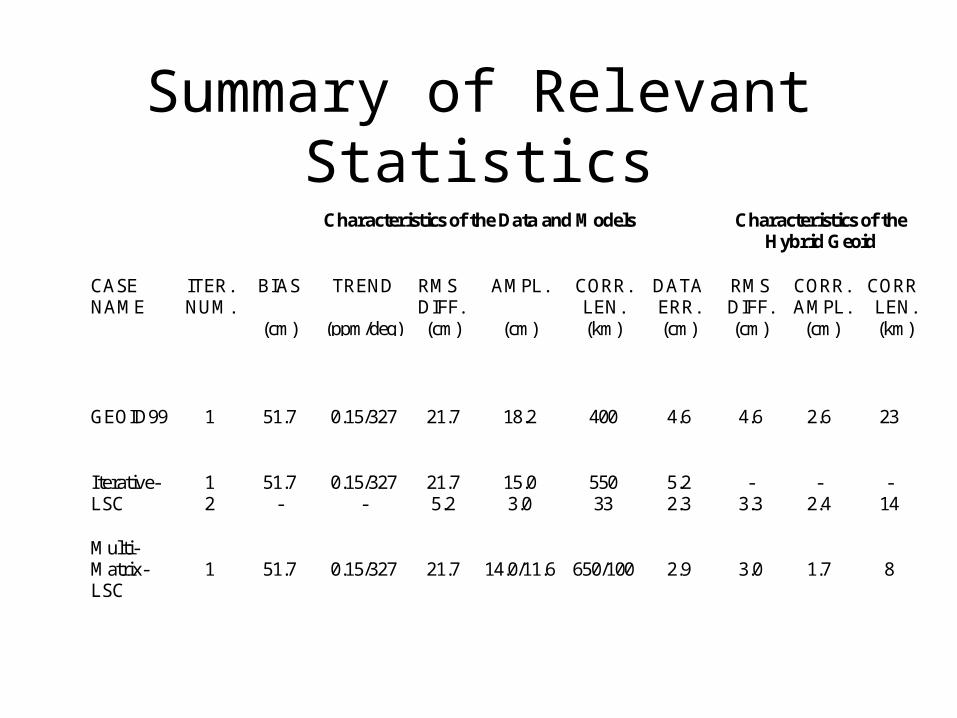
Summary of Relevant StatisticsCharacteristics of the Data and Models Characteristics of the
Hybrid Geoid
CASENAME
ITER.NUM.
BIAS
(cm)
TREND
(ppm/deg)
RMSDIFF.(cm)
AMPL.
(cm)
CORR.LEN.(km)
DATAERR.(cm)
RMSDIFF.(cm)
CORR.AMPL.
(cm)
CORR.LEN.(km)
GEOID99 1 51.7 0.15/327 21.7 18.2 400 4.6 4.6 2.6 23
Iterative-LSC
12
51.7-
0.15/327-
21.75.2
15.03.0
55033
5.22.3
-3.3
-2.4
-14
Multi-Matrix-LSC
1 51.7 0.15/327 21.7 14.0/11.6 650/100 2.9 3.0 1.7 8
FY 2000 Geoid Models
• Two hybrid geoids were created using FY 2000 GPSBM data and G99SSS
• The first, XUSHG2000A, was generated using the same methods as for GEOID99 (single-pass and single-matrix)
• The other, XUSHG2000B, was generated using Iterative-LSC (multi-pass and single-matrix)
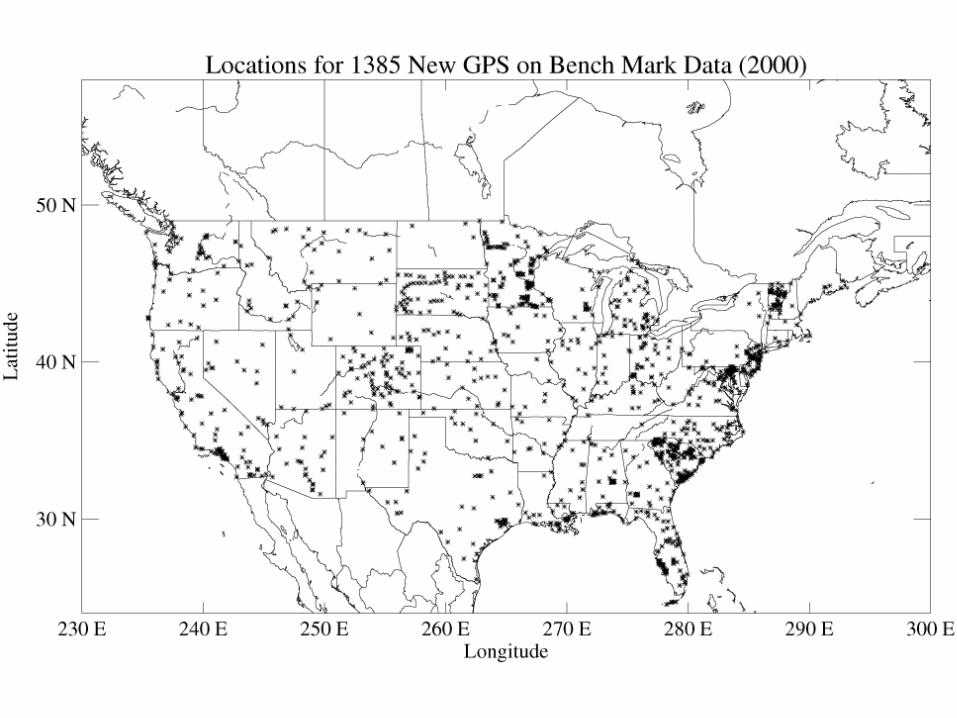
FY 2000 GPSBM Data
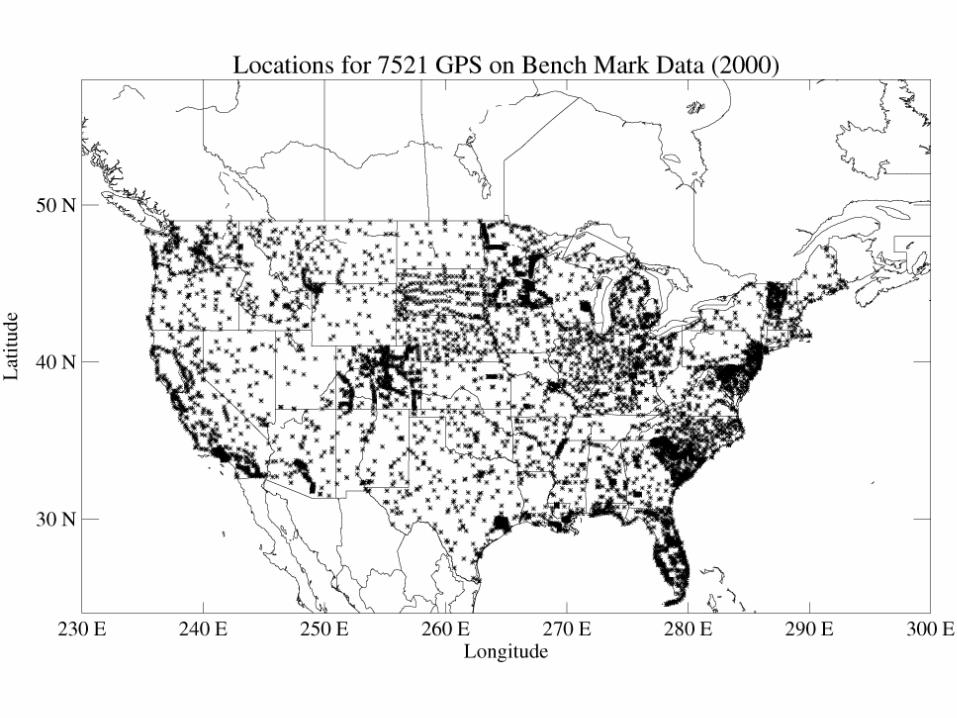
• Pulled on September 15, 2000
• 7775 total points = 254 rejected + 7521 kept
• Of the 7521 retained points, 1358 were new covering more regions than FY 1999
• More FBN/CBN values with increased accuracies for ellipsoid heights (12 states)
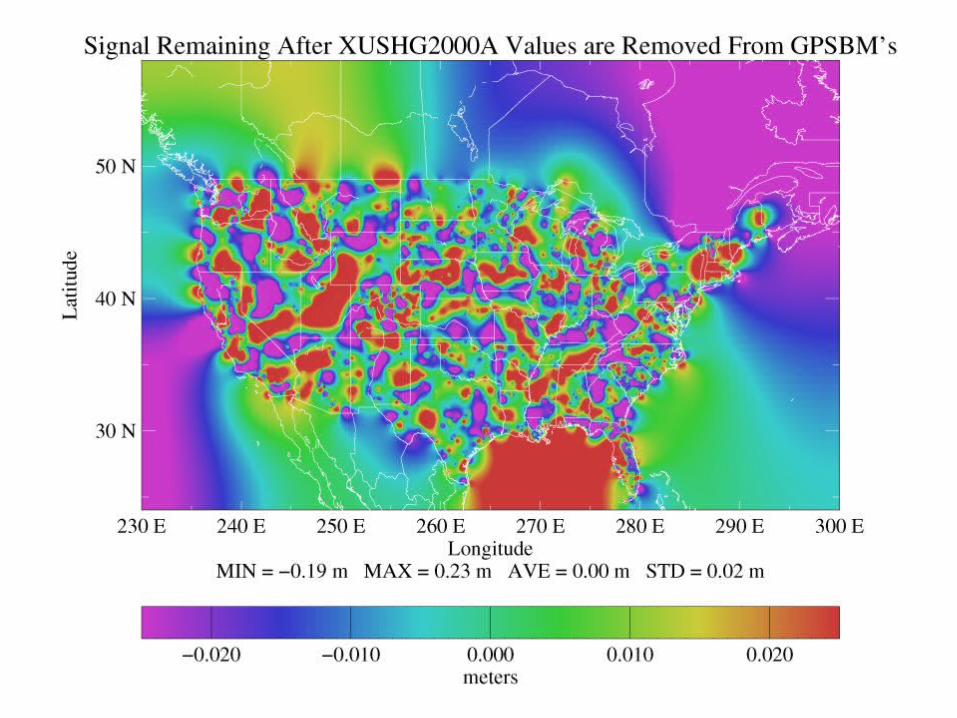
XUSHG2000A
• Model: single-pass, single-matrix
• Correlation Parameters: A0 = (17.7 cm)2, L = 400 km and = (4.5 cm)2
• Comparison with FY 2000 GPSBM’s: of the final 4.5 cm RMS difference, 2.7 cm correlated with a 22 km correlation length
da ta
2
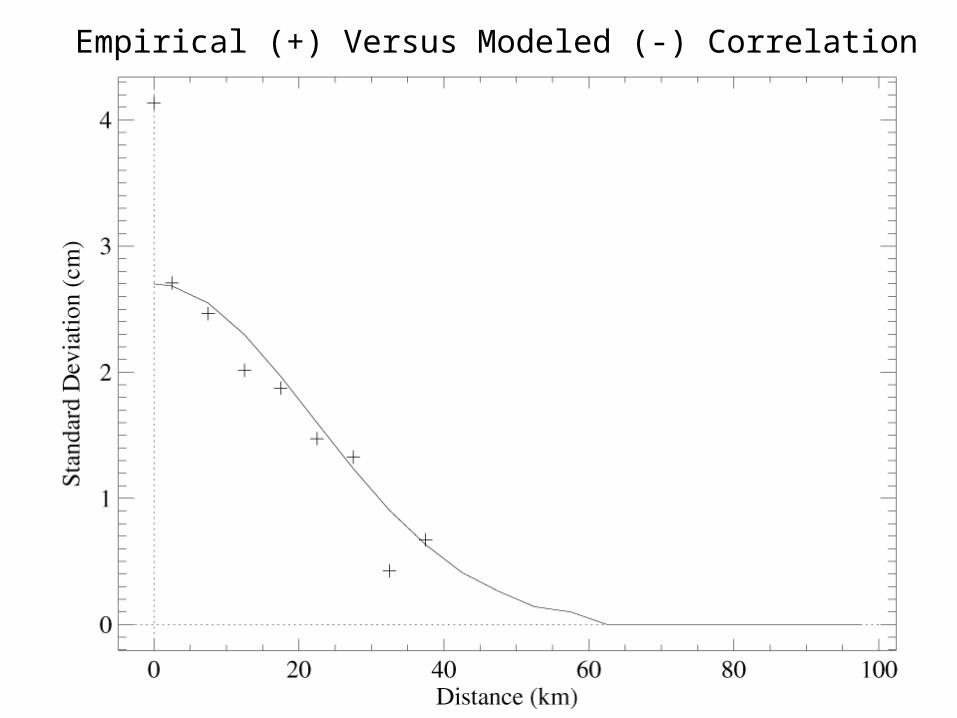
Empirical (+) Versus Modeled (-) Correlation
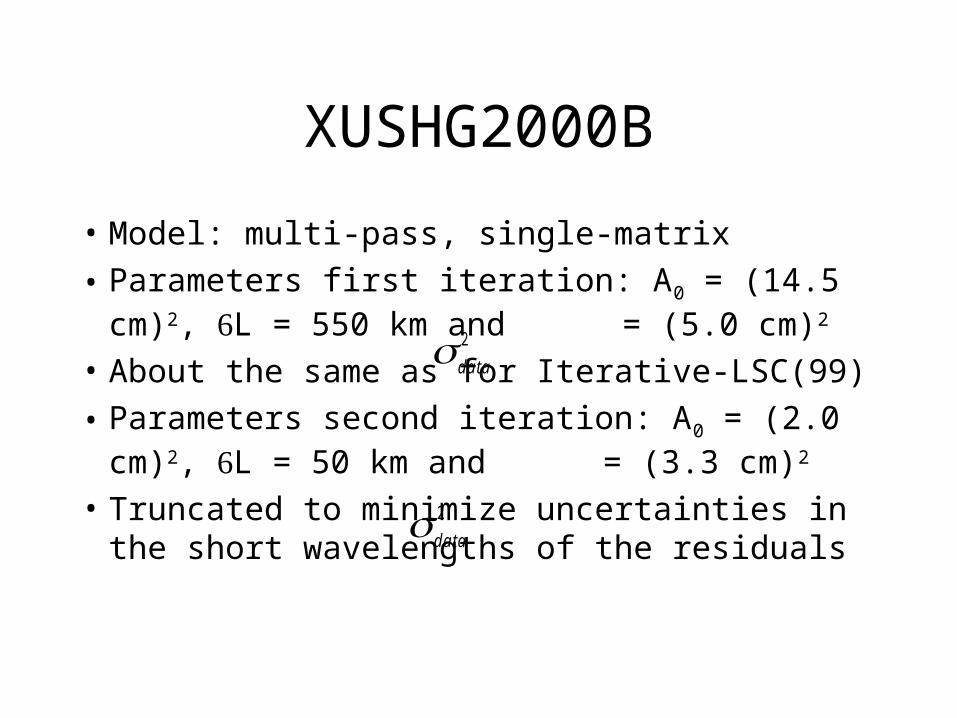
XUSHG2000B
• Model: multi-pass, single-matrix
• Parameters first iteration: A0 = (14.5 cm)2, L = 550 km and = (5.0 cm)2
• About the same as for Iterative-LSC(99)
• Parameters second iteration: A0 = (2.0 cm)2, L = 50 km and = (3.3 cm)2
• Truncated to minimize uncertainties in the short wavelengths of the residuals
da ta
2
da ta
2
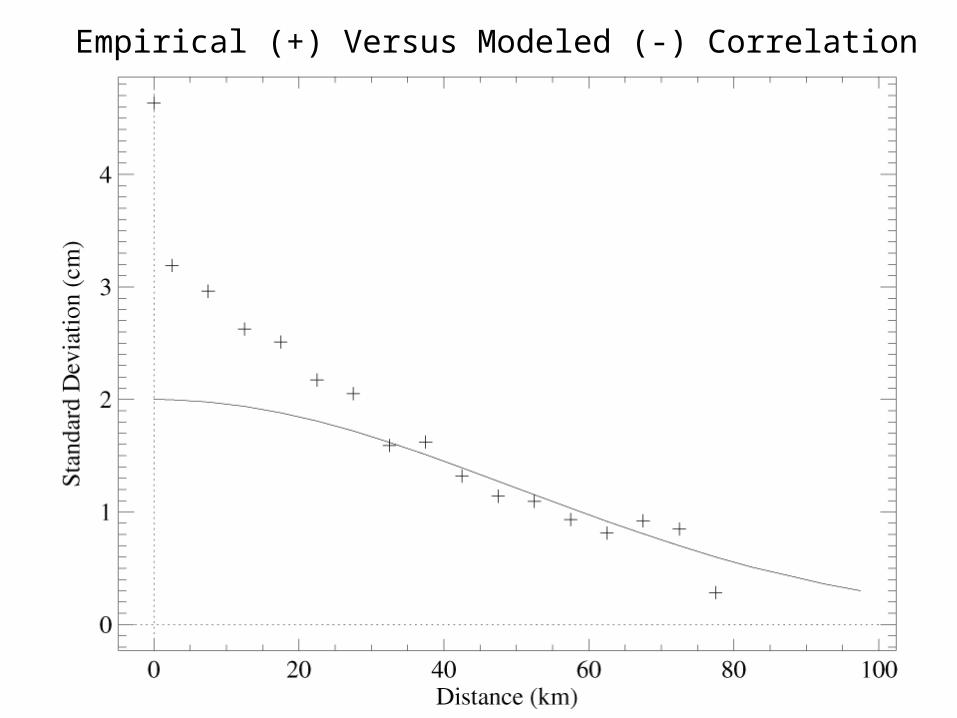
Empirical (+) Versus Modeled (-) Correlation
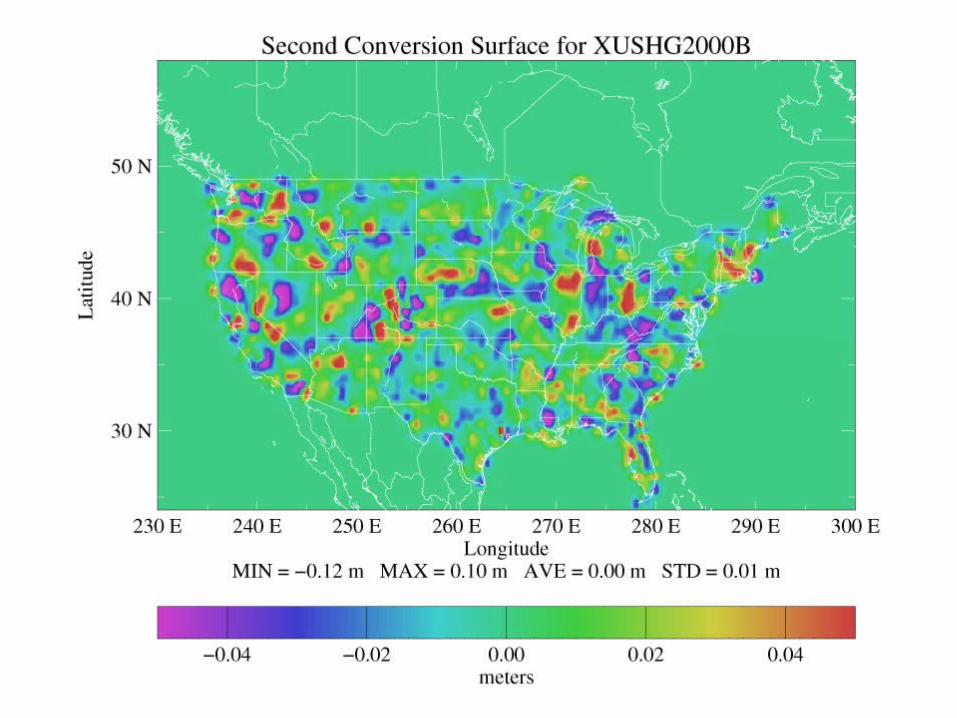
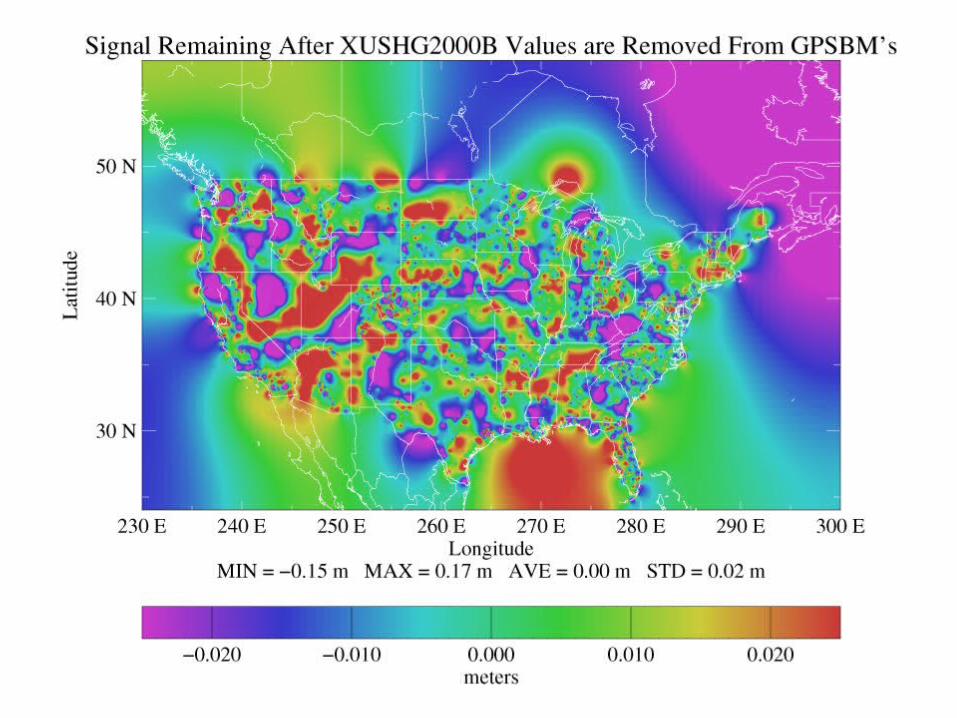
XUSHG2000B (cont.)
• The two conversion surfaces are removed from G99SSS to create XUSHG2000B
• Heights from this model are removed from the GPSBM’s for final residuals
• of the final 3.5 cm RMS difference, 1.9 cm correlated with an 11 km correlation length
Empirical (+) Versus Modeled (-) Correlation
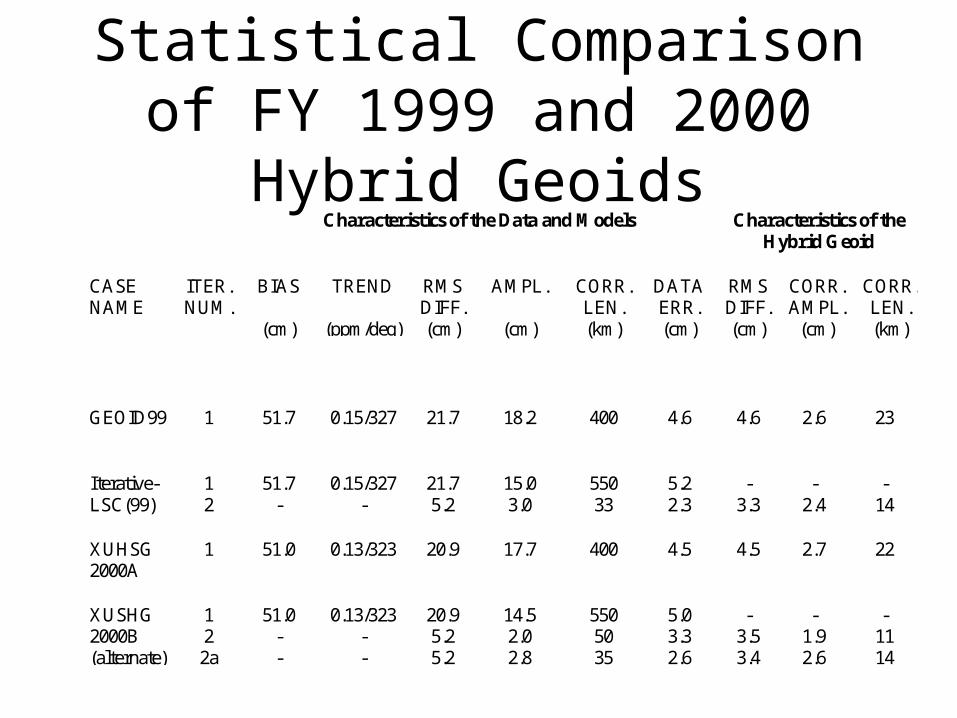
Statistical Comparison of FY 1999 and 2000 Hybrid Geoids
Characteristics of the Data and Models Characteristics of theHybrid Geoid
CASENAME
ITER.NUM.
BIAS
(cm)
TREND
(ppm/deg)
RMSDIFF.(cm)
AMPL.
(cm)
CORR.LEN.(km)
DATAERR.(cm)
RMSDIFF.(cm)
CORR.AMPL.
(cm)
CORR.LEN.(km)
GEOID99 1 51.7 0.15/327 21.7 18.2 400 4.6 4.6 2.6 23
Iterative-LSC(99)
12
51.7-
0.15/327-
21.75.2
15.03.0
55033
5.22.3
-3.3
-2.4
-14
XUHSG2000A
1 51.0 0.13/323 20.9 17.7 400 4.5 4.5 2.7 22
XUSHG2000B(alternate)
122a
51.0--
0.13/323--
20.95.25.2
14.52.02.8
5505035
5.03.32.6
-3.53.4
-1.92.6
-1114
Conclusions for Modeling
• It is possible to incorporate more of the residual signal between gravimetric and GPSBM data into a hybrid geoid model
• Iterative-LSC modeled increasingly shorter correlation lengths, which also aided in analyzing signals in different bandwidths
• Multi-Matrix-LSC modeled the most of the signal in one pass with the best results
Conclusions for FY 2000 Geoids
• FY 1999 and 2000 GPSBM data have been culled to about the same level
• XUSHG2000A is very similar to GEOID99
• Use of iterative-LSC permits selective inclusion of residual signal
• XUSHG2000B does incorporate more of the correlated residual signal than the FY 1999 iterative-LSC model.

Future Research
• Source(s) of residual values
• Focus will be on relationship with nodes in Basic Net A of NAVD 88
• Better understanding of sources will aid in determining how much of the signal to use in future hybrid models