Embed Size (px)
Citation preview

i
Improved Inspection Techniques for Steel Prestressing/Post-tensioning Strand
FDOT Contract No. BDK80 977-13
Final Report- Volume I
June 2012
Atorod Azizinamini, Ph.D., P.E., Florida International University
Jawad Gull, Florida International University

ii
DISCLAIMER
The opinions, findings, and conclusions expressed in this publication are those of the authors and not
necessarily those of the State of Florida Department of Transportation.

iii
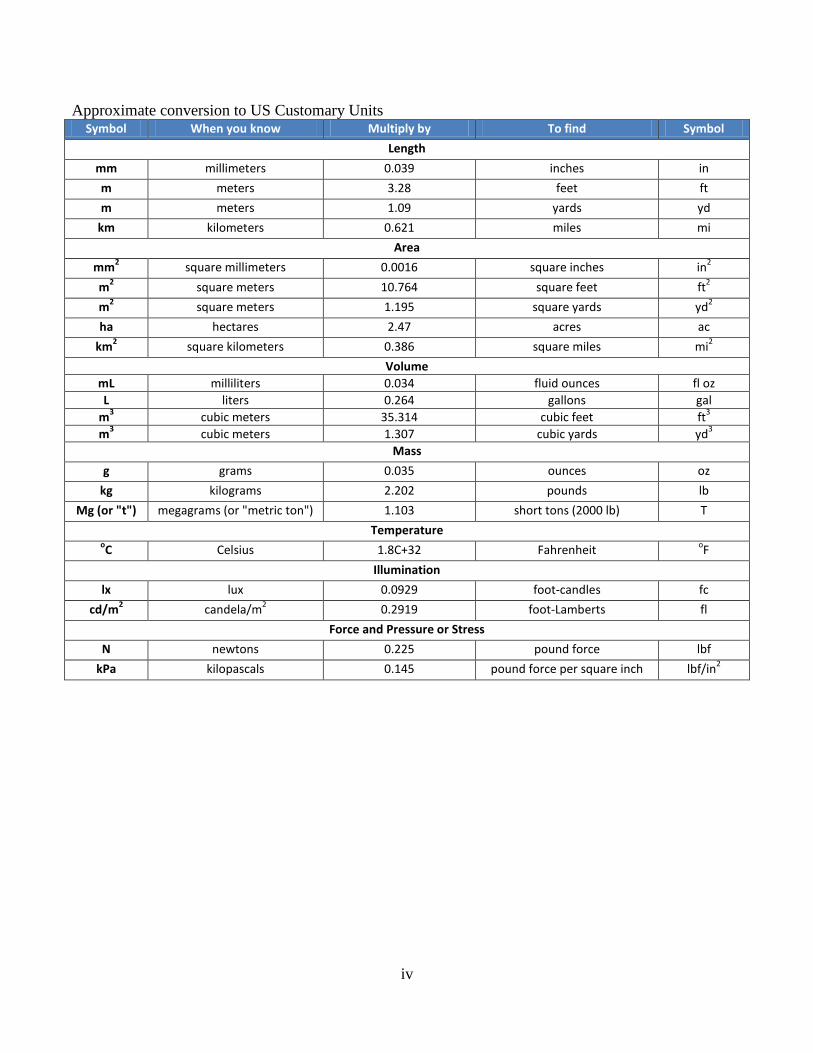
CONVERSION TABLES
Approximate conversion to SI Units Symbol When you know Multiply by To find Symbol
Length
in inches 25.4 millimeters mm
ft feet 0.305 meters m
yd yards 0.914 meters m
mi miles 1.61 kilometers km
Area
in2 square inches 645.2 square millimeters mm
2
ft2 square feet 0.093 square meters m
2
yd2 square yard 0.836 square meters m
2
ac acres 0.405 hectares ha
mi2 square miles 2.59 square kilometers km
2
Volume
fl oz fluid ounces 29.57 milliliters mL
gal gallons 3.785 liters L
ft3 cubic feet 0.028 cubic meters m
3
yd3 cubic yards 0.765 cubic meters m
3
Mass
oz ounces 28.35 grams g
lb pounds 0.454 kilograms kg
T short tons (2000 lb) 0.907 megagrams (or "metric ton") Mg (or "t")
Temperature oF Fahrenheit 5 (F-32)/9 or (F-32)/1.8 Celsius
oC
Illumination
fc foot-candles 10.76 lux lx
fl foot-Lamberts 3.426 candela/m2 cd/m
2
Force and Pressure or Stress
lbf pound force 4.45 newtons N
lbf/in2 pound force per square inch 6.89 kilopascals kPa
iv
Approximate conversion to US Customary Units Symbol When you know Multiply by To find Symbol
Length
mm millimeters 0.039 inches in
m meters 3.28 feet ft
m meters 1.09 yards yd
km kilometers 0.621 miles mi
Area
mm2 square millimeters 0.0016 square inches in
2
m2 square meters 10.764 square feet ft
2
m2 square meters 1.195 square yards yd
2
ha hectares 2.47 acres ac
km2 square kilometers 0.386 square miles mi
2
Volume
mL milliliters 0.034 fluid ounces fl oz
L liters 0.264 gallons gal
m3 cubic meters 35.314 cubic feet ft
3
m3 cubic meters 1.307 cubic yards yd
3
Mass
g grams 0.035 ounces oz
kg kilograms 2.202 pounds lb
Mg (or "t") megagrams (or "metric ton") 1.103 short tons (2000 lb) T
Temperature oC Celsius 1.8C+32 Fahrenheit
oF
Illumination
lx lux 0.0929 foot-candles fc
cd/m2 candela/m
2 0.2919 foot-Lamberts fl
Force and Pressure or Stress
N newtons 0.225 pound force lbf
kPa kilopascals 0.145 pound force per square inch lbf/in2
v
1. Report No.
2. Government Accession No.
3. Recipient's Catalog No.
4. Title and Subtitle
Improved Inspection Techniques for Steel Prestressing/Post-tensioning Strand Volume I
5. Report Date
June 2012
6. Performing Organization Code
7. Author(s)
Atorod Azizinamini (PI), Jawad Gull 8. Performing Organization Report No.
9. Performing Organization Name and Address
Florida International University, Miami http://[email protected] University Park, Room P.C. 539 Miami, FL 33199-0000 USA
10. Work Unit No. (TRAIS)
11. Contract or Grant No.
BDK80 977-13
12. Sponsoring Agency Name and Address
Florida Department of Transportation 605 Suwannee Street Tallahassee, FL 32399 USA
13. Type of Report and Period Covered
Final Report Mar. 2011-Jun. 2012
14. Sponsoring Agency Code
15. Supplementary Notes
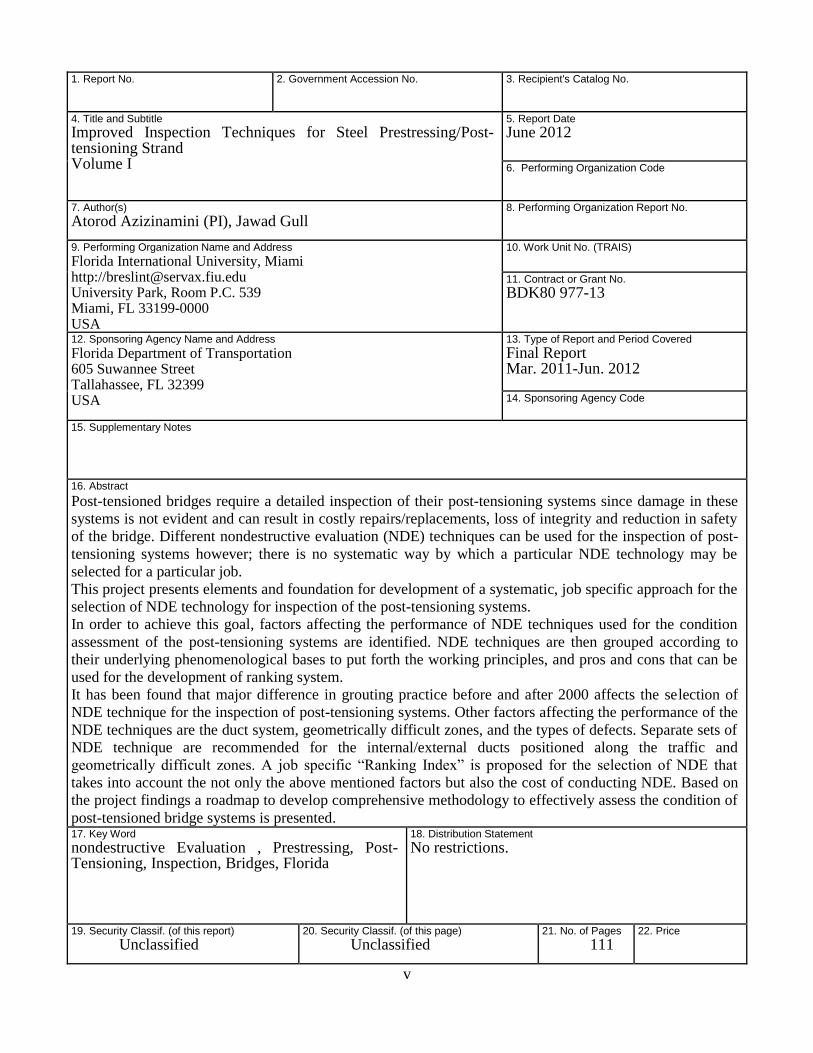
16. Abstract
Post-tensioned bridges require a detailed inspection of their post-tensioning systems since damage in these
systems is not evident and can result in costly repairs/replacements, loss of integrity and reduction in safety
of the bridge. Different nondestructive evaluation (NDE) techniques can be used for the inspection of post-
tensioning systems however; there is no systematic way by which a particular NDE technology may be
selected for a particular job.
This project presents elements and foundation for development of a systematic, job specific approach for the
selection of NDE technology for inspection of the post-tensioning systems.
In order to achieve this goal, factors affecting the performance of NDE techniques used for the condition
assessment of the post-tensioning systems are identified. NDE techniques are then grouped according to
their underlying phenomenological bases to put forth the working principles, and pros and cons that can be
used for the development of ranking system.
It has been found that major difference in grouting practice before and after 2000 affects the selection of
NDE technique for the inspection of post-tensioning systems. Other factors affecting the performance of the
NDE techniques are the duct system, geometrically difficult zones, and the types of defects. Separate sets of
NDE technique are recommended for the internal/external ducts positioned along the traffic and
geometrically difficult zones. A job specific “Ranking Index” is proposed for the selection of NDE that
takes into account the not only the above mentioned factors but also the cost of conducting NDE. Based on
the project findings a roadmap to develop comprehensive methodology to effectively assess the condition of
post-tensioned bridge systems is presented. 17. Key Word
nondestructive Evaluation , Prestressing, Post-Tensioning, Inspection, Bridges, Florida
18. Distribution Statement
No restrictions.
19. Security Classif. (of this report)
Unclassified 20. Security Classif. (of this page)
Unclassified 21. No. of Pages
111 22. Price

vi
ACKNOWLEDGEMENTS
The authors would like to thank Florida Department of Transportation (FDOT) and Project Manager
Richard Kerr.
vii
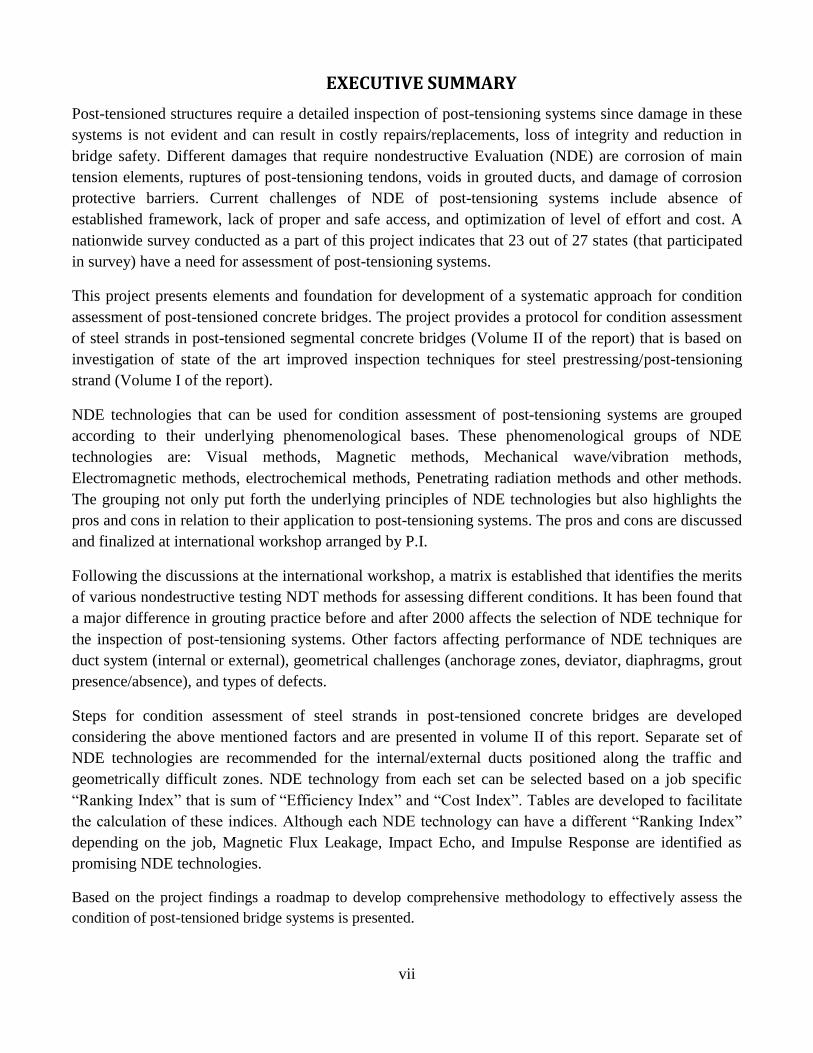
EXECUTIVE SUMMARY
Post-tensioned structures require a detailed inspection of post-tensioning systems since damage in these
systems is not evident and can result in costly repairs/replacements, loss of integrity and reduction in
bridge safety. Different damages that require nondestructive Evaluation (NDE) are corrosion of main
tension elements, ruptures of post-tensioning tendons, voids in grouted ducts, and damage of corrosion
protective barriers. Current challenges of NDE of post-tensioning systems include absence of
established framework, lack of proper and safe access, and optimization of level of effort and cost. A
nationwide survey conducted as a part of this project indicates that 23 out of 27 states (that participated
in survey) have a need for assessment of post-tensioning systems.
This project presents elements and foundation for development of a systematic approach for condition
assessment of post-tensioned concrete bridges. The project provides a protocol for condition assessment
of steel strands in post-tensioned segmental concrete bridges (Volume II of the report) that is based on
investigation of state of the art improved inspection techniques for steel prestressing/post-tensioning
strand (Volume I of the report).
NDE technologies that can be used for condition assessment of post-tensioning systems are grouped
according to their underlying phenomenological bases. These phenomenological groups of NDE
technologies are: Visual methods, Magnetic methods, Mechanical wave/vibration methods,
Electromagnetic methods, electrochemical methods, Penetrating radiation methods and other methods.
The grouping not only put forth the underlying principles of NDE technologies but also highlights the
pros and cons in relation to their application to post-tensioning systems. The pros and cons are discussed
and finalized at international workshop arranged by P.I.
Following the discussions at the international workshop, a matrix is established that identifies the merits
of various nondestructive testing NDT methods for assessing different conditions. It has been found that
a major difference in grouting practice before and after 2000 affects the selection of NDE technique for
the inspection of post-tensioning systems. Other factors affecting performance of NDE techniques are
duct system (internal or external), geometrical challenges (anchorage zones, deviator, diaphragms, grout
presence/absence), and types of defects.
Steps for condition assessment of steel strands in post-tensioned concrete bridges are developed
considering the above mentioned factors and are presented in volume II of this report. Separate set of
NDE technologies are recommended for the internal/external ducts positioned along the traffic and
geometrically difficult zones. NDE technology from each set can be selected based on a job specific
“Ranking Index” that is sum of “Efficiency Index” and “Cost Index”. Tables are developed to facilitate
the calculation of these indices. Although each NDE technology can have a different “Ranking Index”
depending on the job, Magnetic Flux Leakage, Impact Echo, and Impulse Response are identified as
promising NDE technologies.
Based on the project findings a roadmap to develop comprehensive methodology to effectively assess the
condition of post-tensioned bridge systems is presented.
viii
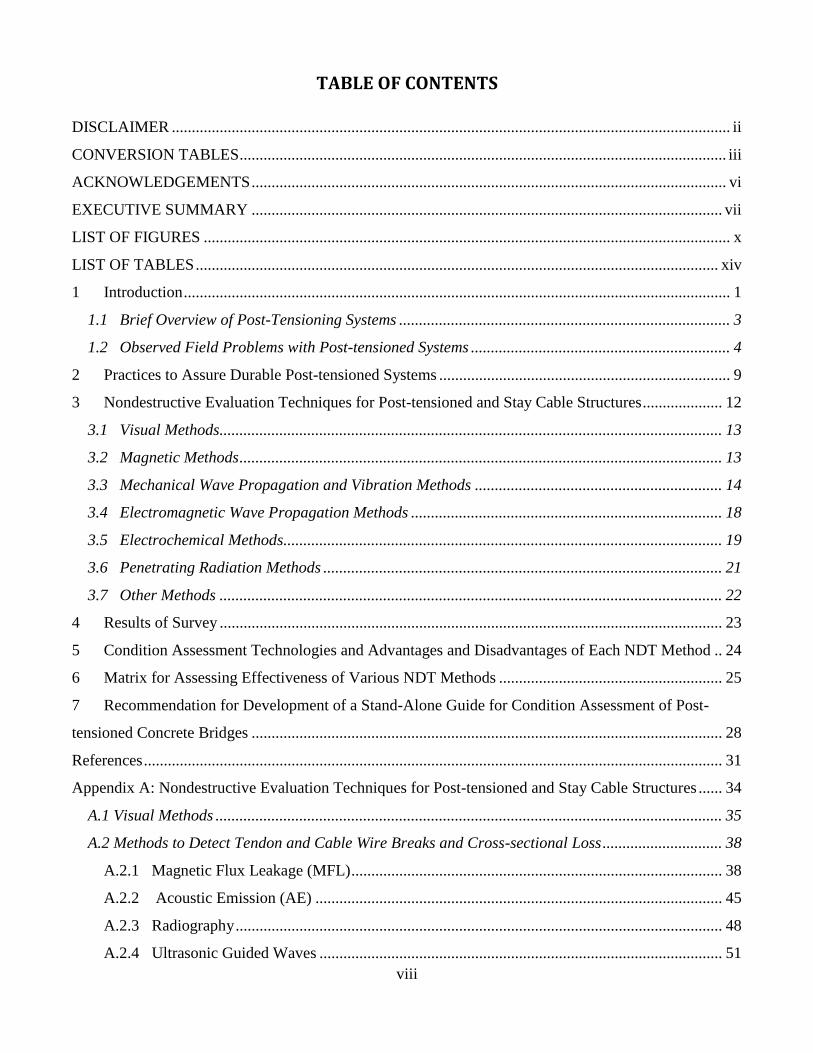
TABLE OF CONTENTS
DISCLAIMER ............................................................................................................................................ ii
CONVERSION TABLES .......................................................................................................................... iii
ACKNOWLEDGEMENTS ....................................................................................................................... vi
EXECUTIVE SUMMARY ...................................................................................................................... vii
LIST OF FIGURES .................................................................................................................................... x
LIST OF TABLES ................................................................................................................................... xiv
1 Introduction ......................................................................................................................................... 1
1.1 Brief Overview of Post-Tensioning Systems ................................................................................... 3
1.2 Observed Field Problems with Post-tensioned Systems ................................................................. 4
2 Practices to Assure Durable Post-tensioned Systems ......................................................................... 9
3 Nondestructive Evaluation Techniques for Post-tensioned and Stay Cable Structures .................... 12
3.1 Visual Methods.............................................................................................................................. 13
3.2 Magnetic Methods ......................................................................................................................... 13
3.3 Mechanical Wave Propagation and Vibration Methods .............................................................. 14
3.4 Electromagnetic Wave Propagation Methods .............................................................................. 18
3.5 Electrochemical Methods.............................................................................................................. 19
3.6 Penetrating Radiation Methods .................................................................................................... 21
3.7 Other Methods .............................................................................................................................. 22
4 Results of Survey .............................................................................................................................. 23
5 Condition Assessment Technologies and Advantages and Disadvantages of Each NDT Method .. 24
6 Matrix for Assessing Effectiveness of Various NDT Methods ........................................................ 25
7 Recommendation for Development of a Stand-Alone Guide for Condition Assessment of Post-
tensioned Concrete Bridges ...................................................................................................................... 28
References ................................................................................................................................................. 31
Appendix A: Nondestructive Evaluation Techniques for Post-tensioned and Stay Cable Structures ...... 34
A.1 Visual Methods ............................................................................................................................... 35
A.2 Methods to Detect Tendon and Cable Wire Breaks and Cross-sectional Loss .............................. 38
A.2.1 Magnetic Flux Leakage (MFL) ............................................................................................. 38
A.2.2 Acoustic Emission (AE) ...................................................................................................... 45
A.2.3 Radiography .......................................................................................................................... 48
A.2.4 Ultrasonic Guided Waves ..................................................................................................... 51
ix
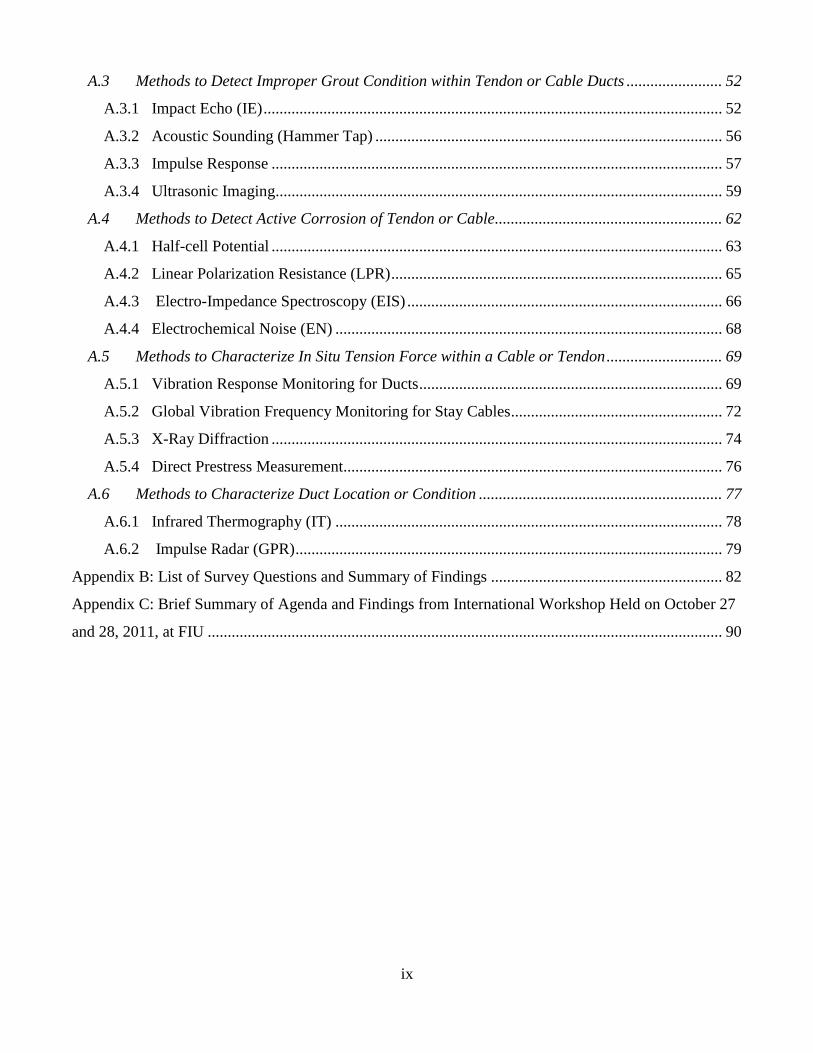
A.3 Methods to Detect Improper Grout Condition within Tendon or Cable Ducts ........................ 52
A.3.1 Impact Echo (IE) ................................................................................................................... 52
A.3.2 Acoustic Sounding (Hammer Tap) ....................................................................................... 56
A.3.3 Impulse Response ................................................................................................................. 57
A.3.4 Ultrasonic Imaging................................................................................................................ 59
A.4 Methods to Detect Active Corrosion of Tendon or Cable......................................................... 62
A.4.1 Half-cell Potential ................................................................................................................. 63
A.4.2 Linear Polarization Resistance (LPR) ................................................................................... 65
A.4.3 Electro-Impedance Spectroscopy (EIS) ............................................................................... 66
A.4.4 Electrochemical Noise (EN) ................................................................................................. 68
A.5 Methods to Characterize In Situ Tension Force within a Cable or Tendon ............................. 69
A.5.1 Vibration Response Monitoring for Ducts ............................................................................ 69
A.5.2 Global Vibration Frequency Monitoring for Stay Cables ..................................................... 72
A.5.3 X-Ray Diffraction ................................................................................................................. 74
A.5.4 Direct Prestress Measurement............................................................................................... 76
A.6 Methods to Characterize Duct Location or Condition ............................................................. 77
A.6.1 Infrared Thermography (IT) ................................................................................................. 78
A.6.2 Impulse Radar (GPR) ........................................................................................................... 79
Appendix B: List of Survey Questions and Summary of Findings .......................................................... 82
Appendix C: Brief Summary of Agenda and Findings from International Workshop Held on October 27
and 28, 2011, at FIU ................................................................................................................................. 90

x
LIST OF FIGURES
Figure 1.1: Multi-level corrosion protection of steel strands in tendons .................................................... 5
Figure 1.2: Final arrangement of steel strands inside duct after post-tensioning ....................................... 5
Figure 1.3: Elements of external ducts in segmental post-tensioning systems ........................................... 6
Figure 1.4: External duct............................................................................................................................. 6
Figure 1.5: Corrosion Activity in the Voided Area .................................................................................... 7
Figure 1.6: Examples of types of observed cracking of ducts .................................................................... 7
Figure 1.7: Condition of grout ten years after construction (photo courtesy of FDOT) ............................. 8
Figure 2.1: Plastic ducts .............................................................................................................................. 9
Figure 2.2: New generation of anchorage devices .................................................................................... 10
Figure 2.3: Older generations of anchorage devices; not permitted by some states ................................. 10
Figure 2.4: Multiple layer protection system for anchorage regions ........................................................ 10
Figure 3.1: Overview of NDE methods applied to inspect condition of post-tensioned cable systems and
cable stays ................................................................................................................................................. 12
Figure 3.2: Schematic representation of changes in flux in the location of the corroded area of the
strands in active (left) and residual (right) methods ................................................................................. 14
Figure 3.3: Illustration of impact-echo test method (Sansalone and Streett, 1998) .................................. 16
Figure 3.4: Illustration of ultrasonic s-wave array equipment (top) and data collection scheme (bottom)
................................................................................................................................................................... 17
Figure 3.5: Illustration of GPR b-scan image of grouted plastic duct. an occurrence of improper grouting
(voiding) is indicated by high reflection levels. ........................................................................................ 19
Figure 3.6: Fundamental measurement setup for electrochemical techniques ......................................... 20
Figure 6.1: Partial list of factors that influence the selection of most appropriate nde method for a given
case ............................................................................................................................................................ 26
Figure 6.2: Preliminary list of different conditions and regions of interest for post-tensioned systems .. 27
Figure A.1: Photos of the inside of post-tensioned duct taken by borescopes ......................................... 37
Figure A.2: Examples of hands-on inspection of cable with a traveling buggy (left) and a dissected
cable, revealing exposed steel cable wires (right) .................................................................................... 37
Figure A.3: Schematic representation of changes in flux in the location of the corroded area of the
strands in the active (left) and residual (right) methods ........................................................................... 38
Figure A.4: MFL equipment developed by the Atorod Azizinamini, P.I. of the proposed project ......... 40
Figure A.5: MFL test setup used by Atorod Azizinamini ........................................................................ 41

xi
Figure A.6: MFL test results from laboratory sample showing the effect of 19-strand breakage (large
event) and 4 transverse rebars (small ripples) along a concrete element .................................................. 42
Figure A.7: An example of major segmental post-tensioned bridge inspected by P.I. ............................. 43
Figure A.8: Typical cross section of the bridge ........................................................................................ 43
Figure A.9: MFL signals obtained from post-tensioned segmental bridge structure (circle indicates the
location of tendon fracture) ....................................................................................................................... 44
Figure A.10: Acoustic emission: illustration of fundamental concept (left) and source location with
multiple sensors (right) ............................................................................................................................. 46
Figure A.11: Acoustic emission field tests: installation of equipment on bank lane unit (left) and sensor
(right) ........................................................................................................................................................ 47
Figure A.12: The Zárate Bridge (left); x-ray radiographs from selected stay cables, showing location of
voids in the grout within the duct (right) .................................................................................................. 49
Figure A.13: X-Ray inspection of post-tensioned deck ramp D in Fort Lauderdale: x-ray inspection
equipment (left) and example film radiograph (right) .............................................................................. 50
Figure A.14: Ultrasonic guided wave (at 50 khz) testing in progress (left) and a sample signal showing
reflection from defect (right) .................................................................................................................... 52
Figure A.15: Illustration of impact-echo test method ............................................................................... 53
Figure A.16: Olson impact echo scanning equipment: handheld unit (left) and vehicle mounted unit
(right) ........................................................................................................................................................ 54
Figure A.17: Insertion of void (left) for Olson NCHRP idea 102 grant for impact echo scanning
sensitivity research and grout/void defect plan built for south wall of PT bridge girder (right). ............. 55
Figure A.18: Image created from impact-echo scan data collected with Olson equipment from the ie
results from the south wall with actual design defects of top duct Orwell bridge. void areas are indicated
by (apparent) increased thicknesses as shown in the thickness scale of 1 ................................................ 56
Figure A.19: Impulse response test equipment (left) and data acquisition software showing sensor
outputs and computed mobility signal ...................................................................................................... 58
Figure A.20: Obtained IR mobility plot collected from a segment of a post-tensioned bridge. Locations
of corrosion and damage are indicated by high mobility value. ............................................................... 59
Figure A.21: Illustration of ultrasonic s-wave array equipment (top) and data collection scheme (bottom)
................................................................................................................................................................... 60

xii
Figure A.22: Illustration of conventional SAFT image (top) and phase modified SAFT image (bottom)
collected from a PT girder. The color indicates the phase of the reflected wave in the phase modified
image. ........................................................................................................................................................ 61
Figure A.23: Fundamental measurement setup for electrochemical techniques ...................................... 62
Figure A.24: Half-Cell measurement equipment and connection setup (Naito et al. 2010) ..................... 64
Figure A.25: Evaluation of corrosion detection ability of half-cell measurement ................................... 65
Figure A.26: Comparison of total Icorr estimated by EIS and LPR for (a) P and (b) S assemblies. .......... 66
Figure A.27: Impedance spectrum (left) and electrical circuit (right) assumed to fit the spectrum data
(Taveira, Sagüés, & Lopez-Sabando, 2008) ............................................................................................. 67
Figure A.28: EIS behavior of p1 assembly (a) before and (b) after a water recharge event. the estimated
electrochemical parameters are shown in the graph. (Taveira, Sagüés, & Lopez-Sabando, 2008) ......... 67
Figure A.29: (a) Potential and (b) current trends of anchor-strand system for p3 assembly (the arrow
indicates the water addition) (Taveira, Sagüés, & Lopez-Sabando, 2008) ............................................... 69
Figure A.30: Example of waveform data recorded by accelerometer and FFT analysis (Sagüés & Kranc
2000) ......................................................................................................................................................... 70
Figure A.31: Tendon segment tension plotted as a function of position along the bridge (Sagüés & Kranc
2000) ......................................................................................................................................................... 71
Figure A.32: Laser vibrometer system for force measurement of tension elements (left) and a measured
frequency spectrum characterizing the cable vibration (right). ................................................................ 74
Figure A.33: Principles of X-ray diffraction stress measurement ............................................................ 75
Figure A.34: Sectional view of a prestressed concrete girder (Azizinamini et al. 1996) ......................... 76
Figure A.35: Infrared image of polyethylene cable duct, indicating split at surface ................................ 78
Figure A.36: IDS Aladdin radar on test pad ............................................................................................. 80
Figure A.37: Full-polar 2 GHz antenna .................................................................................................... 80
Figure A.38: 3-D image of rebar at 0.1 m deep ........................................................................................ 80
Figure A.39: Illustration of GPR B-scan image of grouted plastic duct. an occurrence of improper
grouting (voiding) is indicated by high reflection levels. ......................................................................... 81
Figure B.1: Participation in survey (green = participated; white = not participated) ............................... 85
Figure B.2: States having bridges with need for condition assessment (green = yes; red = no; white = not
participated) .............................................................................................................................................. 85
Figure B.3: Types of bridges that need corrosion inspection in different states ....................................... 86

xiii
Figure B.4: States having major corrosion challenges/problems (green = yes; red = no; white = not
participated) .............................................................................................................................................. 87

xiv
LIST OF TABLES
Table 1-1: States with More Than five Segmental Concrete Bridges ........................................................ 2
Table A-1: Summary of Inherent Characteristics and Applications of Visual Inspection ....................... 36
Table A-2: Summary of Inherent Characteristics and Application of MFL Method ............................... 45
Table A-3: Summary of Inherent Characteristics and Applications of Acoustic Emission Method ........ 48
Table A-4: Summary of Inherent Characteristics and Application of Radiography ................................ 50
Table A-5: Summary of Inherent Characteristics and Application of Ultrasonic Guided Waves ............ 51
Table A-6: Summary of Inherent Characteristics and Application of Impact-Echo Method ................... 55
Table A-7: Summary of Inherent Characteristics and Application of Acoustic Sounding Method ......... 57
Table A-8: Summary of Inherent Characteristics and Application of Impulse Response ........................ 59
Table A-9: Summary of Inherent Characteristics and Application of Ultrasonic Imaging ...................... 62
Table A-10: Summary of Inherent Characteristics and Applications of Electrochemical Methods ......... 63
Table A-11: Summary of Advantages and Disadvantages of Vibration Response Monitoring Technique
................................................................................................................................................................... 72
Table A-12: Summary of Inherent Characteristics and Application of Global Frequency Monitoring
Technique .................................................................................................................................................. 74
Table A-13: Summary of Inherent Characteristics and Application of Infrared Thermography ............. 79
Table A-14: Summary of Inherent Characteristics and Application of Impulse Radar (GPR) ................ 81
Table B-1: Major Corrosion Problems by States ...................................................................................... 88
Table C-1: Advantages and Disadvantages of some of the NDE Methods discussed during Oct 27 and
28, 2011 International workshop held at FIU and chaired by Atorod Azizinamini (P.I.) ........................ 95
1
1 Introduction
Despite all the advantages associated with post-tensioned structures, there have been several concerns
about the use of internal and external post-tensioning tendons due to corrosion. Damage related to these
events normally is not detected until it is significant and requires costly repairs/replacements. In the
meantime, safety and integrity of the bridge remain uncertain. As a result, there is a need for
implementing detailed inspections of post-tensioning systems using state-of-the-art condition assessment
technologies that utilize nondestructive evaluation (NDE) methods.
Discussion of Tendon Concerns—Reports of rust discovered on main tension elements, rusted and
ruptured post-tensioning tendons, voids and water-filled voids in grouted ducts, and damage to corrosion
protective barriers have created concern. These problems are not limited to the State of Florida and have
been found elsewhere here in the U.S. and abroad.
The Florida Department of Transportation has expended significant effort for inspection and
rehabilitation of post-tensioning tendons for the Sunshine Skyway Bridge and elsewhere in the state.
Field Inspection Challenges—The inspection of post-tensioned bridges provides major challenges for
the bridge owner, as post-tensioning elements are not easily accessed. It is impossible to visually assess
the condition of the embedded steel elements without using invasive methods, such as drilling a hole and
using a borescope. Much of the damage associated with the cables and tendons initiated and propagates
hidden from view. Further, local corrosion damage to embedded steel elements does not generally result
in visually noticeable changes to the external appearance of the bridge until it is too late. In general,
corrosion may result in complete collapse of the bridge without much warning.
There are several other challenges when one attempts to assess the condition of embedded steel elements
in post-tensioned bridges. The lack of proper and safe access to tendons adds difficulty to any inspection
method. Additionally, these bridges generally have long spans, and the level of effort needed to inspect
the entire bridge could be substantial. Therefore one must develop a strategy that can optimize the level
of efforts and cost. A single approach may not provide an optimum condition for every case. Having an
idea of what needs to be inspected will reduce the level of effort. Conducting certain tests during
construction can provide a roadmap on what to inspect during routine inspections. Ideally, the amount of
2
borescope validation by destructively drilling holes to visually confirm NDE-predicted problems should
be reduced.
Current Practice and Challenges—Every bridge in state, county and municipal inventories must be
inspected at least once every two years. Some require more efforts than others, such as bridges with
fracture critical members. Currently there is no established framework to inspect the condition of steel
tendons in post-tensioned segmental such that they can be seamlessly connected to condition rating in
National Bridge Inspection System (NBIS). It would be desirable to include the condition of embedded
steel tendons in post-tensioned bridges as obtained through use of NDE methods, when assigning the
condition rating for deck, superstructure and substructure components.
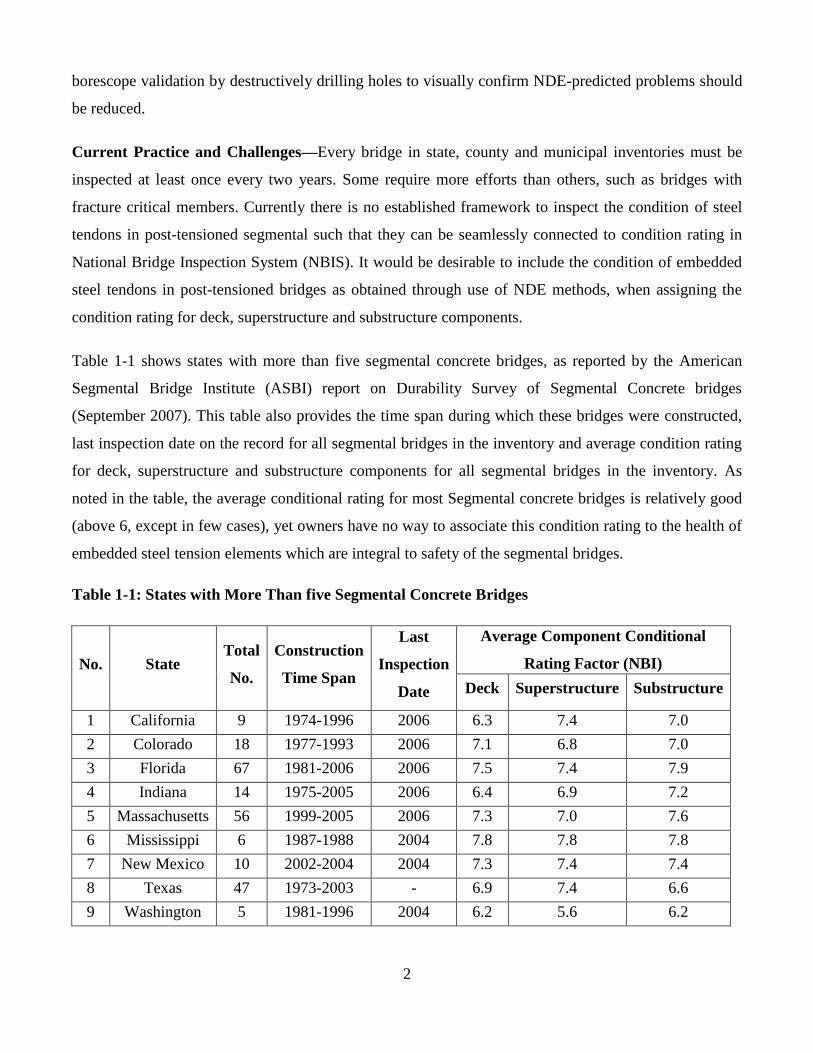
Table 1-1 shows states with more than five segmental concrete bridges, as reported by the American
Segmental Bridge Institute (ASBI) report on Durability Survey of Segmental Concrete bridges
(September 2007). This table also provides the time span during which these bridges were constructed,
last inspection date on the record for all segmental bridges in the inventory and average condition rating
for deck, superstructure and substructure components for all segmental bridges in the inventory. As
noted in the table, the average conditional rating for most Segmental concrete bridges is relatively good
(above 6, except in few cases), yet owners have no way to associate this condition rating to the health of
embedded steel tension elements which are integral to safety of the segmental bridges.
Table 1-1: States with More Than five Segmental Concrete Bridges
No. State Total
No.
Construction
Time Span
Last
Inspection
Date
Average Component Conditional
Rating Factor (NBI)
Deck Superstructure Substructure
1 California 9 1974-1996 2006 6.3 7.4 7.0
2 Colorado 18 1977-1993 2006 7.1 6.8 7.0
3 Florida 67 1981-2006 2006 7.5 7.4 7.9
4 Indiana 14 1975-2005 2006 6.4 6.9 7.2
5 Massachusetts 56 1999-2005 2006 7.3 7.0 7.6
6 Mississippi 6 1987-1988 2004 7.8 7.8 7.8
7 New Mexico 10 2002-2004 2004 7.3 7.4 7.4
8 Texas 47 1973-2003 - 6.9 7.4 6.6
9 Washington 5 1981-1996 2004 6.2 5.6 6.2
3
On the NDE Methods- Following are among the factors that need to be considered when selecting the
NDE method for inspecting post-tensioned bridges.
a) Defect sensitivity,
b) Test repeatability and consistency,
c) Test time and access requirements,
d) Test operator requirements,
e) Scale effect (laboratory scale vs. full scale),
f) Application cost, and
g) Capability to tie the developed information to NBIS conditional rating of deck, superstructure
and substructure conditional rating.
1.1 Brief Overview of Post-Tensioning Systems
According to a report published by the Federal Highway Administration (FHWA), in 1998, the cost of
corrosion in highway bridges in the U.S. was estimated to be $8.3 billion a year (FHWA 2001). The
owners of concrete bridges with various steel elements, especially with pre-tensioned or post-tensioned
bridges, in the U.S. and abroad face a serious problem. They have the responsibility of ensuring public
safety, but have no means to effectively detect corrosion in these bridges. In the U.S., Powers (1999)
had reported serious corrosion problems with post-tensioned bridges. Further, corrosion in post-
tensioned bridges with as few as five years of service life has been reported. Collapses of major post-
tensioned bridges have also been reported in Belgium and England (Pearson-Kirk 2004).
The post-tensioning method, originated in France by Professor Freyssinet, was used in the design and
construction of Veudre Bridge in 1908. The first post-tensioned segmental bridge was also built in
France over the River Marne in 1939. The use of post-tensioning in construction of bridges increased
significantly in Europe in the mid 1950’s and 1960’s, and the process gained momentum in the U.S. in
the 1970’s. A collapse of a post-tensioned bridge in 1967 in the U.K. gave an indication of potential
problems with post-tensioned bridges (Pearson-Kirk 2004). During the 1980’s, problems with post-
tensioned bridges in the U.K. were identified at an alarmingly increasing rate. The collapse of a
segmental post-tensioned bridge in Wales in 1985 was the most serious case in the U.K. that finally led
the U.K. Department of Transport to issue a memorandum prohibiting construction of post-tensioned

4
bridges for several years. In 1992, another post-tensioned bridge collapsed in Belgium (the Melle Bridge
on the Scheldt River) reinforcing the vulnerability of these structures.
The inspection of most bridges are generally achieved by visual inspection of deck, superstructure and
substructure components and assigning condition rating, ranging from zero to nine, with nine indicating
excellent condition. Assigning condition rating, in general is very subjective and two inspectors could
easily arrive at different conclusions. Within National Bridge Inspection System (NBIS) deck
components are generally inspected for cracking, leaching chloride contamination, delamination,
excessive wear and sounded for hollow areas. The superstructure inspection depends on type of bridges.
The substructure elements include inspection for scour if bridge is crossing waterways.
1.2 Observed Field Problems with Post-tensioned Systems
Early corrosion problems in post-tensioned structures were noticed during 1999 inspection of Niles
Channel Bridge, the Mid-Bay Bridge, and the Sunshine Skyway Bridge in Florida (Powers 1999,
Beitelman 2000, and DMJM 2003). This led the FHWA to issue a memorandum on January 12, 2001,
alerting the State Departments of Transportation of serious corrosion problems with post-tensioned
segmental concrete bridges, part of which reads: “… alert states to the post-tensioned corrosion
problems and recommend the expedited inspection of their highest risk post-tensioned structures”. As a
result, several states have taken a lead in comprehending the corrosion challenges in in-service post
tension and stay cable systems, and developing advanced technologies. State of Florida leads these
efforts.
Many of the problems associated with post-tensioned systems can be attributed to grouting which is
used to protect corrosion of steel strands inside the duct. Figure 1.1 shows a typical cross section of a
duct with steel strands.
5
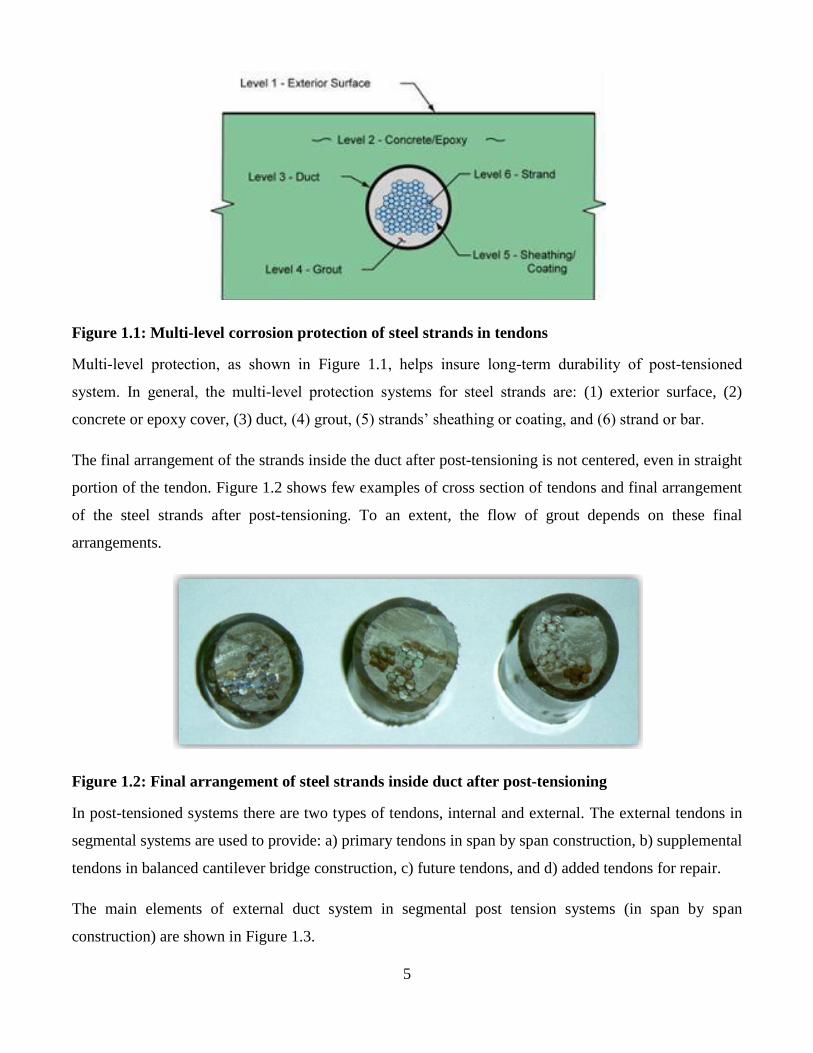
Figure 1.1: Multi-level corrosion protection of steel strands in tendons
Multi-level protection, as shown in Figure 1.1, helps insure long-term durability of post-tensioned
system. In general, the multi-level protection systems for steel strands are: (1) exterior surface, (2)
concrete or epoxy cover, (3) duct, (4) grout, (5) strands’ sheathing or coating, and (6) strand or bar.
The final arrangement of the strands inside the duct after post-tensioning is not centered, even in straight
portion of the tendon. Figure 1.2 shows few examples of cross section of tendons and final arrangement
of the steel strands after post-tensioning. To an extent, the flow of grout depends on these final
arrangements.
Figure 1.2: Final arrangement of steel strands inside duct after post-tensioning
In post-tensioned systems there are two types of tendons, internal and external. The external tendons in
segmental systems are used to provide: a) primary tendons in span by span construction, b) supplemental
tendons in balanced cantilever bridge construction, c) future tendons, and d) added tendons for repair.
The main elements of external duct system in segmental post tension systems (in span by span
construction) are shown in Figure 1.3.
6
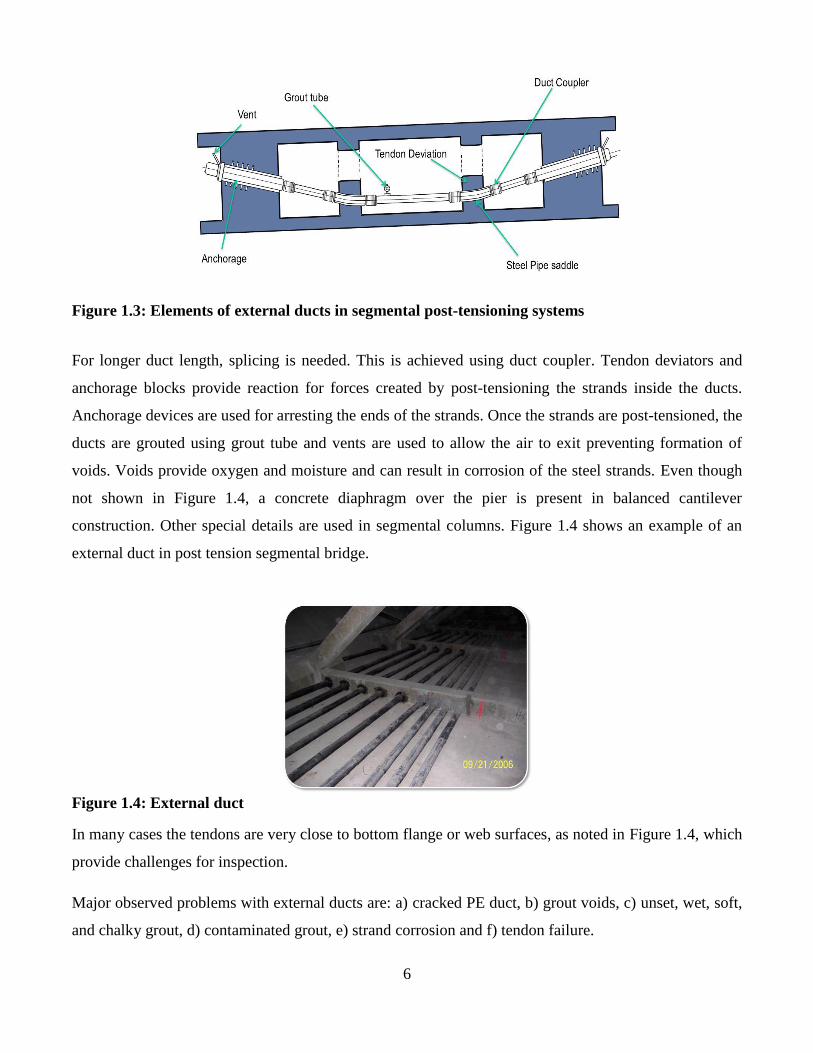
Figure 1.3: Elements of external ducts in segmental post-tensioning systems
For longer duct length, splicing is needed. This is achieved using duct coupler. Tendon deviators and
anchorage blocks provide reaction for forces created by post-tensioning the strands inside the ducts.
Anchorage devices are used for arresting the ends of the strands. Once the strands are post-tensioned, the
ducts are grouted using grout tube and vents are used to allow the air to exit preventing formation of
voids. Voids provide oxygen and moisture and can result in corrosion of the steel strands. Even though
not shown in Figure 1.4, a concrete diaphragm over the pier is present in balanced cantilever
construction. Other special details are used in segmental columns. Figure 1.4 shows an example of an
external duct in post tension segmental bridge.
Figure 1.4: External duct
In many cases the tendons are very close to bottom flange or web surfaces, as noted in Figure 1.4, which
provide challenges for inspection.
Major observed problems with external ducts are: a) cracked PE duct, b) grout voids, c) unset, wet, soft,
and chalky grout, d) contaminated grout, e) strand corrosion and f) tendon failure.
7
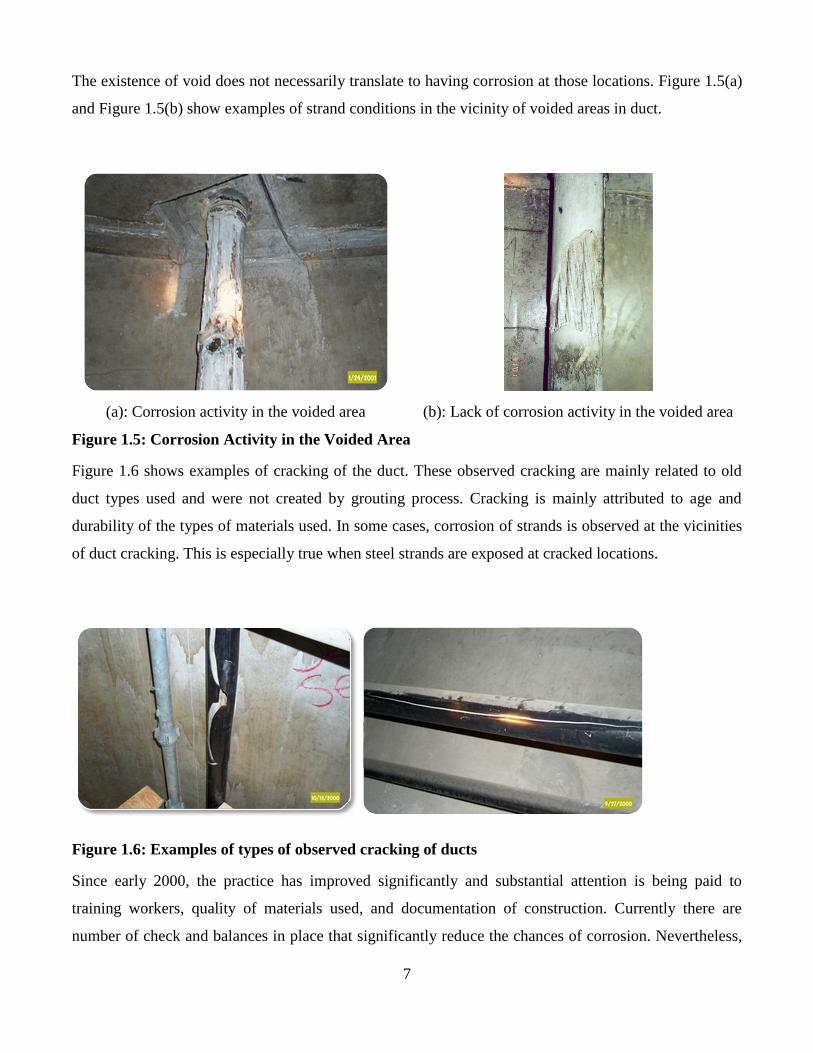
The existence of void does not necessarily translate to having corrosion at those locations. Figure 1.5(a)
and Figure 1.5(b) show examples of strand conditions in the vicinity of voided areas in duct.
(a): Corrosion activity in the voided area (b): Lack of corrosion activity in the voided area
Figure 1.5: Corrosion Activity in the Voided Area
Figure 1.6 shows examples of cracking of the duct. These observed cracking are mainly related to old
duct types used and were not created by grouting process. Cracking is mainly attributed to age and
durability of the types of materials used. In some cases, corrosion of strands is observed at the vicinities
of duct cracking. This is especially true when steel strands are exposed at cracked locations.
Figure 1.6: Examples of types of observed cracking of ducts
Since early 2000, the practice has improved significantly and substantial attention is being paid to
training workers, quality of materials used, and documentation of construction. Currently there are
number of check and balances in place that significantly reduce the chances of corrosion. Nevertheless,
8
some of the solutions that were thought to resolve the corrosion problems are creating additional
challenges. For instance, grout is used to prevent corrosion of steel strands in post tension concrete
bridges. Types of grouts used have gone through significant changes since early 2000. Ducts or stay
cables are filled with cementitious material. Most recent grout types used by FDOT are proprietary
products. Recently corrosion issues have also surfaced using new proprietary grout types. For instance,
Figure 1.7 shows the cross section of a tendon where a new grout type was used. Recent thinking among
some practitioners is that most recent corrosion problems observed in the field could be attributed to
ingredients used in the grout. More specifically certain characteristics of the grout and grouting
practices, which includes a) high chloride content, b) high water demand for new grout types and c) high
pressure that is used during grouting process.
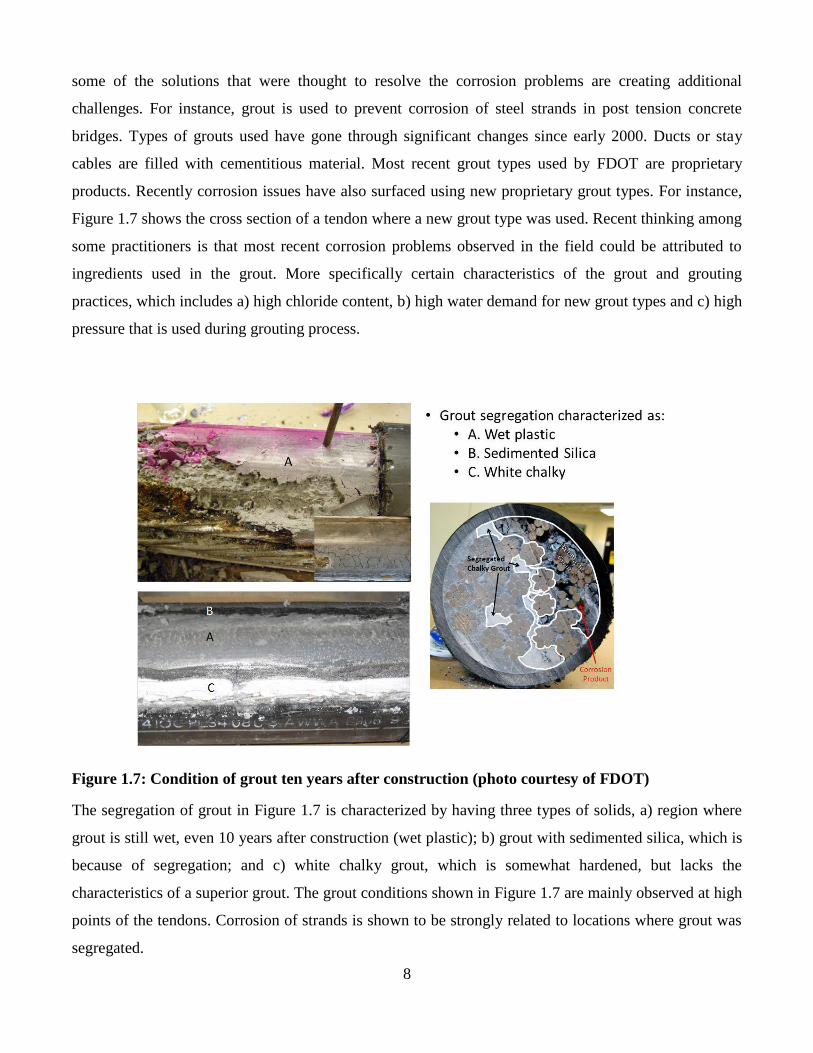
Figure 1.7: Condition of grout ten years after construction (photo courtesy of FDOT)
The segregation of grout in Figure 1.7 is characterized by having three types of solids, a) region where
grout is still wet, even 10 years after construction (wet plastic); b) grout with sedimented silica, which is
because of segregation; and c) white chalky grout, which is somewhat hardened, but lacks the
characteristics of a superior grout. The grout conditions shown in Figure 1.7 are mainly observed at high
points of the tendons. Corrosion of strands is shown to be strongly related to locations where grout was
segregated.
9
2 Practices to Assure Durable Post-tensioned Systems
As a result of observed corrosion issues with post-tensioned systems, state DOTs have made significant
changes in their practice. Quality of grout, workmanship, and hardware used has improved significantly.
Fortunately, the level of redundancies and safety factors used in design are high enough that the
observed corrosion issues have not created significant public safety concerns. FDOT implemented new
policies and procedures to enhance the long-term durability of their post-tensioned bridges in 2002.
These policies and procedures were developed through extensive research highlighted in a ten-volume
publication titled “New Directions for Florida Post-Tensioning Bridges” (Corven Engineering, Inc.
2002). The following five strategies have been adopted for providing corrosion protection for post-
tensioned bridges: (1) enhanced post-tensioned systems, (2) fully grouted tendons, (3) multi-level anchor
protection, (4) watertight bridges, and (5) multiple tendon paths.
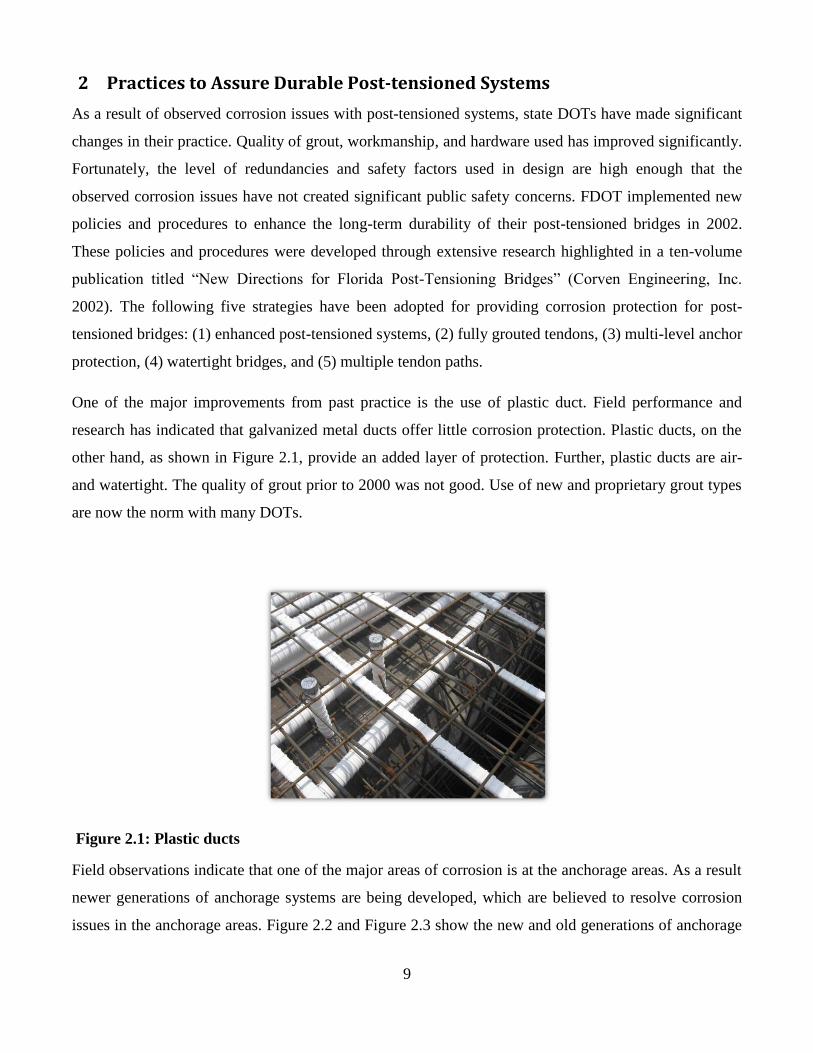
One of the major improvements from past practice is the use of plastic duct. Field performance and
research has indicated that galvanized metal ducts offer little corrosion protection. Plastic ducts, on the
other hand, as shown in Figure 2.1, provide an added layer of protection. Further, plastic ducts are air-
and watertight. The quality of grout prior to 2000 was not good. Use of new and proprietary grout types
are now the norm with many DOTs.
Figure 2.1: Plastic ducts
Field observations indicate that one of the major areas of corrosion is at the anchorage areas. As a result
newer generations of anchorage systems are being developed, which are believed to resolve corrosion
issues in the anchorage areas. Figure 2.2 and Figure 2.3 show the new and old generations of anchorage

10
devices, respectively. It is worth mentioning that many states no longer permit use of older generation of
anchorage devices.
Figure 2.2: New generation of anchorage devices
Figure 2.3: Older generations of anchorage devices; not permitted by some states
Similar to multiple protection layers for steel strands, recent practices are calling for multiple protection
of anchorage regions, as shown in Figure 2.4.
Figure 2.4: Multiple layer protection system for anchorage regions

11
For present practice (in the future, use of ungrouted duct may be a feasibility as it will be easier to
inspect and replace strands), the quality of grouting and workmanship is very important. The
“Specification for Grouting of Post-Tensioned Structures”, by PTI, provides comprehensive guidelines
for grouting. This document is presently undergoing updates. The observed tendon failure at the Niles
Channel Bridge, FL in 1999 was attributed the poor grouting practices, inferior design details, and
inadequate grout specifications. The key elements for good grouting practices are: a) being able to
completely fill the duct, b) low permeability, c) appropriate bleed resistance, and d) careful use of
admixtures.
Workmanship and quality control plays a major role in the development of high quality post tension
systems. Not too long ago, the grouting was performed by unskilled workers. Starting in early 2000, the
practice has changed significantly. It should also be mentioned that research to improve quality of grout
used in post tensioned systems are continuing.

12
3 Nondestructive Evaluation Techniques for Post-tensioned and Stay Cable
Structures
This section of the report provides a brief overview of meritorious, commonly available and commonly
applied nondestructive evaluation (NDE) technologies for condition assessment of post-tensioned and
stay cable systems. In this section the NDE technologies are grouped according to their underlying
phenomenological bases, as illustrated in Figure 3.1. More detail and application notes about each of
the NDE methods are provided in the Appendix A; there the NDE technologies are grouped according
to a specific inspection task goal, such as detection of tendon and cable wire breaks, cross-sectional
loss (thinning), or detection of improper grout condition (dry void formation, soft or chalky grout and
water intrusion) within tendon or cable ducts.
Figure 3.1: Overview of NDE methods applied to inspect condition of post-tensioned cable systems
and cable stays
Visual methodsDirect visual inspection; Long-term video monitoring
Magnetic methodsMagnetic flux leakage (MFL)
Mechanical wave/vibration methodsAcoustic sounding; acoustic emission; impact –echo (IE); Impulse response; ultrasonic imaging; ultrasonic guided wave (GWT); global vibration response
Electromagnetic wave methodsInfrared thermography (IR); Impulse Radar (GPR)
Electrochemical methodsHalf-cell potential; Linear polarization resistance (LPR); Electro-impedance sprectroscopy (EIS); Electrochemical noise
Penetrating radiation methodsRadiography; X-ray diffraction
Other methodsDirect pre-stress measurement
13
3.1 Visual Methods
Direct visual inspection is the oldest and the most common form of NDE. It can be used to inspect any
structural element and it is employed, in some form, in every inspection effort. By observing the
appearance of a component on the exterior, and the interior when possible, an inspector can infer the
component’s condition. Cracking, fretting, surface corrosion, exfoliation, pitting, and intergranular
corrosion can be detected visually when proper access to the inspection area is available. Advancements
in technology have extended the capability of visual inspection; devices like fiberscopes, borescopes,
magnifying glasses and mirrors, portable and permanent video monitoring equipment, and robotic
crawlers aid visual inspection where direct perspective is impractical; for example, the borescope
provides enhanced ability to inspect the interior portions of post-tensioned ducts for grout voiding and
strand corrosion. Visual inspection is inexpensive and readily applicable, and reliable information about
distress and condition is obtained. However, assessment of the condition of interior (hidden from view)
elements is not always feasible. Furthermore, borescope technology is time consuming, provides only
local information, and requires intrusive drilling.
3.2 Magnetic Methods
These methods make use of the interaction between magnetic (and associated electric) fields and their
interaction with matter. Magnetic flux leakage (MFL) is the principal magnetism-based nondestructive
testing method that has been applied to inspect distress in ferrous materials, such as that caused by
corrosion in strands or bars. It can be used to detect wire strand fracture and thinning in internal or
external ducts, as well as stays and ropes. When a magnetic field comes near ferromagnetic (steel)
material, the magnetic flux lines will develop within the steel strand. When corrosion disrupts the
metal’s continuity, this low resistance path becomes blocked and the remaining steel may become
magnetically saturated, forcing some of the flux to flow through the air, as illustrated in Figure 3.2. The
changes in the vertical components of the flux can be measured by magnetic field (Hall-effect) sensors.

14
Figure 3.2: Schematic representation of changes in flux in the location of the corroded area of the
strands in active (left) and residual (right) methods
There are two primary methods for detecting these field anomalies: active and residual. In the active
method, the sensors are placed between the poles of the magnet and readings are obtained as the device
is passed over the specimen. In the residual system, the specimen is first magnetized; it is important that
the strands become magnetically saturated. Then the device is passed over to read the residual magnetic
field. Active MFL is appropriate when large areas of corroded regions exist inside the ducts. However,
when the corroded area is small, active MFL is no longer effective (Marcel et al. 2009). Both types of
MFL are established test methods that can indicate local wire breaks (or member thinning) in near-
surface tendons. Furthermore, MFL is a contactless test that does not require connection to tendon, and
it works for both metal and plastic ducts. However, the application of MFL for investigating the
corrosion of steel strands embedded in concrete presents some challenges: some expertise may be
needed to interpret signals, the user may need many magnetizing pre-sessions before signals are reliable;
breaks in underlying tendons or in anchorage region cannot be detected readily; the masking effect of
the duct; the existence of different layers of reinforcement in the structure that cause disruption to the
MFL signal; and limited access to areas, such as the anchorage zone, that are prone to corrosion
activities.
3.3 Mechanical Wave Propagation and Vibration Methods
These methods make use of (small amplitude) mechanical motion that is set up in a material. Acoustic,
seismic, ultrasonic, and vibrational methods fall into this category. Perhaps the most basic mechanical
wave method is acoustic sounding (also known as hammer tap), a simple and common nondestructive
testing NDT method applied to different bridge components, including external post-tensioned (PT)
ducts and decks. The method is practical, relatively easy to carry out, and fairly accurate in detecting
“dry” voids in the grout. In this method, an inspector taps the surface of a structure with a small hammer
and then listens to the response. It relies on the experience of the inspector to differentiate the relative
sounds generated when the hammer strikes the surface of the tested object: delaminated or voided areas
are identified by a dull or hollow sound. Although the sounding method is not expensive, it can be
15
physically demanding for the inspector and time-consuming. Furthermore, the inspector must be familiar
with the tonal differences between undamaged and damaged concrete and be able to distinguish the
variations in the tones, so the test is subjective and operator dependent. Areas with high levels of
background noise, such as those with large traffic volume or adjacent airports, industry, or construction
sites, will make the sound variations difficult to distinguish. Furthermore the method is not able to
detect soft grout (unset grout), smaller voids or defects.
Acoustic Emission (AE) is a phenomenon of sonic and ultrasonic wave radiation in materials that
undergo deformation and fracture processes. For example, corrosion processes induce defects (in service
wire fractures) in post-tensioned tendons, which release wave energy that propagates within the tendon
and radiates outward. These radiated “acoustic emissions” are detected by surface mounted sensors and
the event is detected. When data are acquired by several sensors simultaneously the information is used
to locate the defect and, in some cases, provide additional information about the defect. AE is well
established technology and field studies have demonstrated the utility of it. Although the basic theory of
this technique is simple and well established, its application can be expensive and the process generates
large volumes of data that can be difficult to manage and interpret. Furthermore, individual signal may
be difficult to interpret or be disrupted by noise, so some expertise is needed; for example in field
application it may be difficult to distinguish the emission caused by defects from ambient emissions.
Finally, AE cannot detect existing damage; in other words only breaks occurring after the installation of
equipment can be detected, so AE sensors must be strategically mounted on structural members.
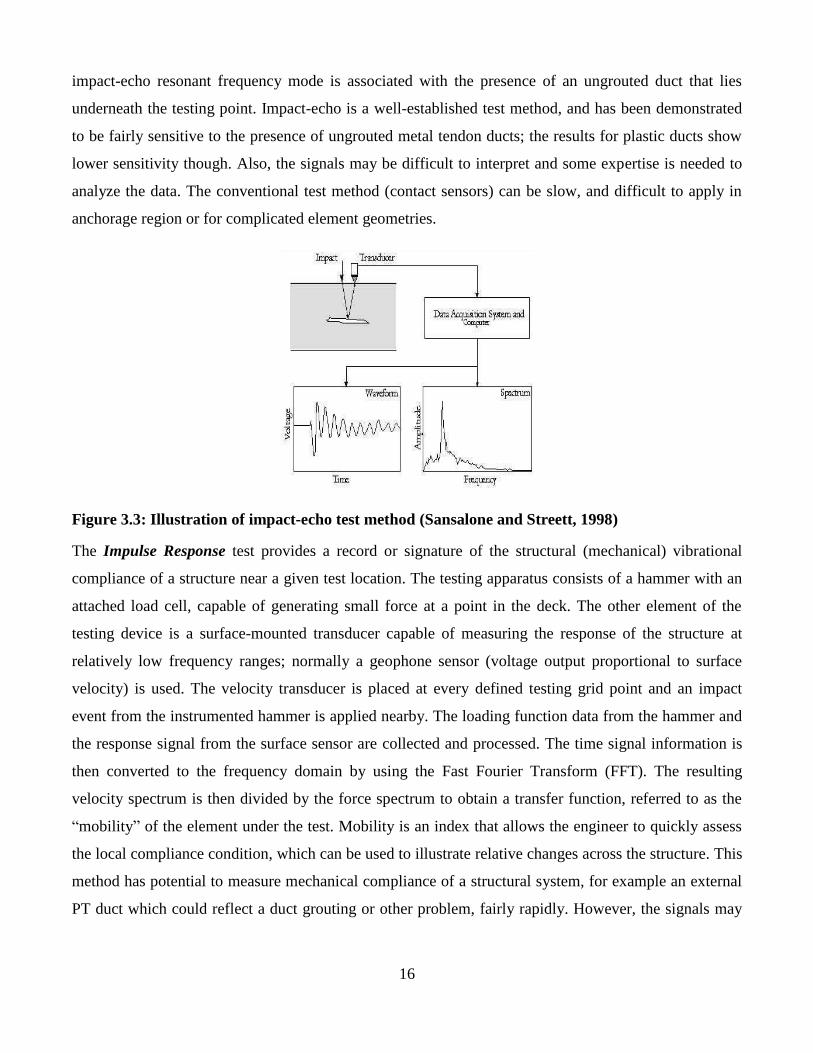
Impact-echo (IE) is a widely used NDT method that has been demonstrated to be effective for detecting
defects in concrete structures. IE is a mechanical-wave method based on the transient resonant vibration
response of a structure subjected to mechanical impact. The transient time response of the solid structure
is measured with a contact sensor (e.g., displacement sensor or accelerometer) mounted on the surface
close to the impact source. Recently researchers have developed impact-echo scanning systems, where
impact echo data are readily collected over a large area and then presented in an image for effective
interpretation. The Fourier transform (amplitude spectrum) of the time-signal will show maxima (peaks)
at certain frequencies, which represent particular resonant modes, as illustrated in Figure 3.3. Different
types of vibration modes can be set up. The thickness stretch mode normally dominates the spectral
response of a plate-like structure that does not contain any near-surface defects, or such structures with a
relatively deep defect like a voided post-tension tendon duct. In the former case, the frequency of the
fundamental thickness stretch mode can be related to the plate thickness; in the latter case a drop in the
16
impact-echo resonant frequency mode is associated with the presence of an ungrouted duct that lies
underneath the testing point. Impact-echo is a well-established test method, and has been demonstrated
to be fairly sensitive to the presence of ungrouted metal tendon ducts; the results for plastic ducts show
lower sensitivity though. Also, the signals may be difficult to interpret and some expertise is needed to
analyze the data. The conventional test method (contact sensors) can be slow, and difficult to apply in
anchorage region or for complicated element geometries.
Figure 3.3: Illustration of impact-echo test method (Sansalone and Streett, 1998)
The Impulse Response test provides a record or signature of the structural (mechanical) vibrational
compliance of a structure near a given test location. The testing apparatus consists of a hammer with an
attached load cell, capable of generating small force at a point in the deck. The other element of the
testing device is a surface-mounted transducer capable of measuring the response of the structure at
relatively low frequency ranges; normally a geophone sensor (voltage output proportional to surface
velocity) is used. The velocity transducer is placed at every defined testing grid point and an impact
event from the instrumented hammer is applied nearby. The loading function data from the hammer and
the response signal from the surface sensor are collected and processed. The time signal information is
then converted to the frequency domain by using the Fast Fourier Transform (FFT). The resulting
velocity spectrum is then divided by the force spectrum to obtain a transfer function, referred to as the
“mobility” of the element under the test. Mobility is an index that allows the engineer to quickly assess
the local compliance condition, which can be used to illustrate relative changes across the structure. This
method has potential to measure mechanical compliance of a structural system, for example an external
PT duct which could reflect a duct grouting or other problem, fairly rapidly. However, the signals may
17
be difficult to interpret and some expertise is needed to analyze the data. Furthermore, the method is
relatively insensitive to small defects, or defects located far beneath the tested surface.
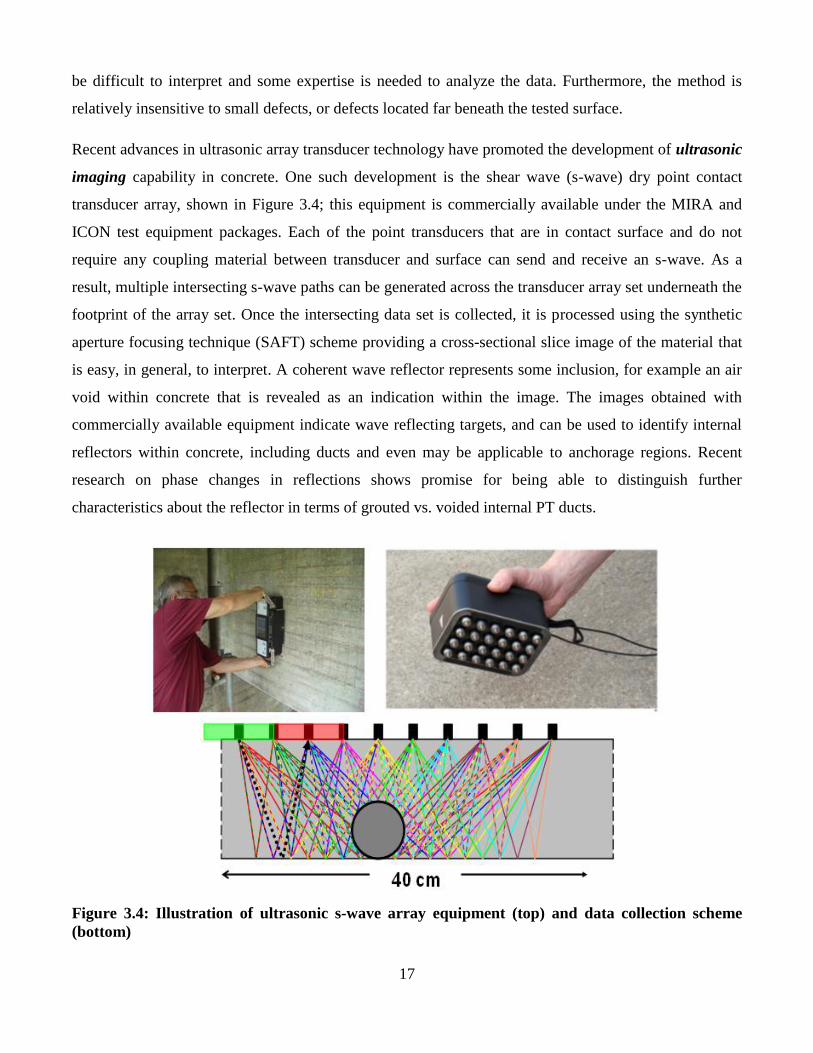
Recent advances in ultrasonic array transducer technology have promoted the development of ultrasonic
imaging capability in concrete. One such development is the shear wave (s-wave) dry point contact
transducer array, shown in Figure 3.4; this equipment is commercially available under the MIRA and
ICON test equipment packages. Each of the point transducers that are in contact surface and do not
require any coupling material between transducer and surface can send and receive an s-wave. As a
result, multiple intersecting s-wave paths can be generated across the transducer array set underneath the
footprint of the array set. Once the intersecting data set is collected, it is processed using the synthetic
aperture focusing technique (SAFT) scheme providing a cross-sectional slice image of the material that
is easy, in general, to interpret. A coherent wave reflector represents some inclusion, for example an air
void within concrete that is revealed as an indication within the image. The images obtained with
commercially available equipment indicate wave reflecting targets, and can be used to identify internal
reflectors within concrete, including ducts and even may be applicable to anchorage regions. Recent
research on phase changes in reflections shows promise for being able to distinguish further
characteristics about the reflector in terms of grouted vs. voided internal PT ducts.
Figure 3.4: Illustration of ultrasonic s-wave array equipment (top) and data collection scheme
(bottom)

18
Ultrasonic guided wave testing (GWT) utilizes ultrasonic guided waves, which are structure-borne
waves that propagate along a structural element, for example propagating along a tendon or stay cable,
confined and guided by its geometric boundaries. The propagating waves reflect from any local cross-
sectional area change, such as strand breaks or corrosion defects within the tendon itself. The defect
location is identified using the arrival time and the velocity of guided wave pulse, and estimates the
defect size with the pulse amplitude. GWT uses relatively low-frequency waves (from 5 to 250 kHz)
that have a long wavelength with respect to the tendon width in order to have less attenuation for long-
range inspection. Magnetostrictive type ultrasonic sensors have been used to apply GWT to free stay
cables along their full length. These types of sensors, which are based on the concept that magnetic
fields produce small changes in the physical dimensions of a ferromagnetic material (such as steel), are
easily applied to free cables: a coil or set of coils that surround the cable sends and receives guided wave
pulses along the cable length (Bartels et al. 1998). GWT also offers exciting potential to monitor tendon
condition near ends and anchorage zones for wire breaks and grout voids (Mehrabi and Telang, 2003).
However, the ends of tendons must be exposed and accessible to apply GWT, and the complicated
technology involved can be difficult to apply properly, and the signals are difficult to interpret. Thus
testing and analysis expertise are needed.
3.4 Electromagnetic Wave Propagation Methods
The Infrared Thermography (IT) method has been validated in the laboratory and proven to be
economically and technically viable to detect near-surface defects, such as near-surface voiding in
grouted PT ducts (Pollack et al. 2008). In this method, variations and disruptions to heat flow are used to
detect surface defects on the test object. Both passive (natural heat flow) and active (applied heat)
measurements are possible. The method relies on the detection of the variations in the surface
temperature profile, which are characterized in an infrared image captured with an infrared camera. IT is
a rapid and convenient contactless technique, but it cannot provide meaningful information about
internal ducts or other deeper defects.
Impulse Radar (or ground-penetrating radar, here represented by GPR) makes use of the interaction
of pulsed electromagnetic energy (microwave pulses) with matter. Normally an antenna (or antenna set)
is used to emit microwave and then detect any resulting reflections of that emission. GPR is an
established method, and test equipment is commercially available; recently 3-D tomographic imaging
capability for GPR data has been developed by several manufacturers. It is a contactless method (or
nearly contactless in the case of ground coupled antennae) and thus can be rapidly applied. GPR data are
19
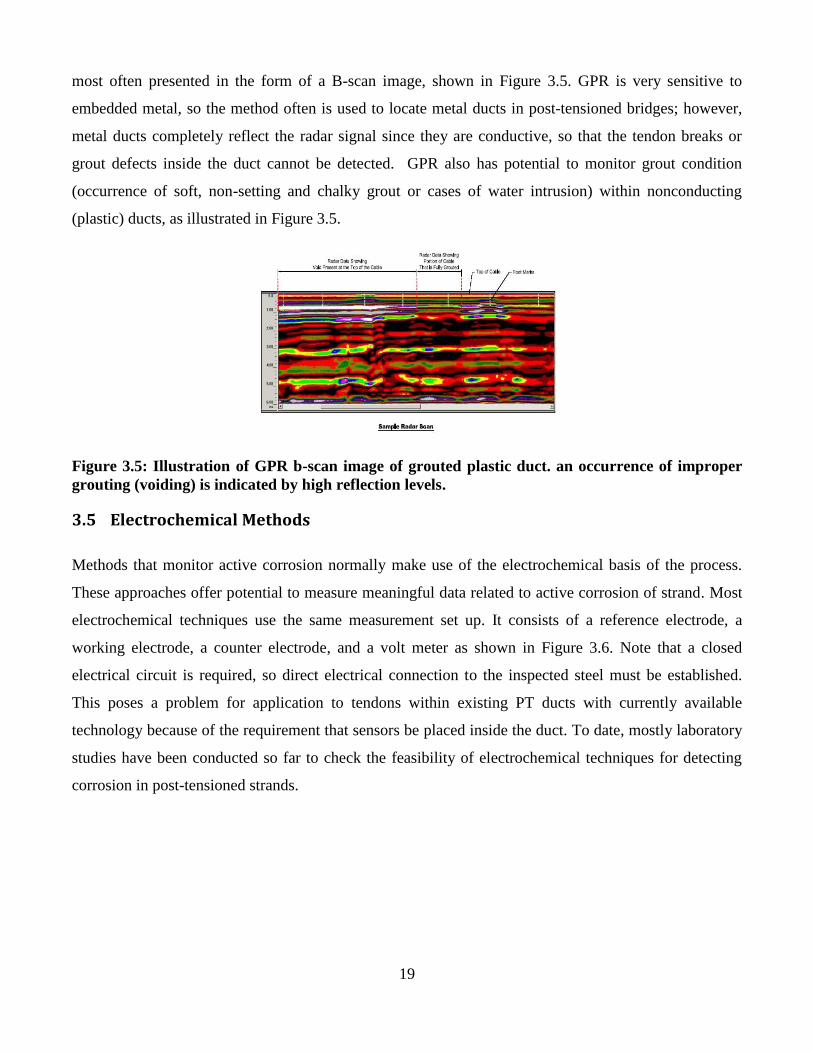
most often presented in the form of a B-scan image, shown in Figure 3.5. GPR is very sensitive to
embedded metal, so the method often is used to locate metal ducts in post-tensioned bridges; however,
metal ducts completely reflect the radar signal since they are conductive, so that the tendon breaks or
grout defects inside the duct cannot be detected. GPR also has potential to monitor grout condition
(occurrence of soft, non-setting and chalky grout or cases of water intrusion) within nonconducting
(plastic) ducts, as illustrated in Figure 3.5.
Figure 3.5: Illustration of GPR b-scan image of grouted plastic duct. an occurrence of improper
grouting (voiding) is indicated by high reflection levels.
3.5 Electrochemical Methods
Methods that monitor active corrosion normally make use of the electrochemical basis of the process.
These approaches offer potential to measure meaningful data related to active corrosion of strand. Most
electrochemical techniques use the same measurement set up. It consists of a reference electrode, a
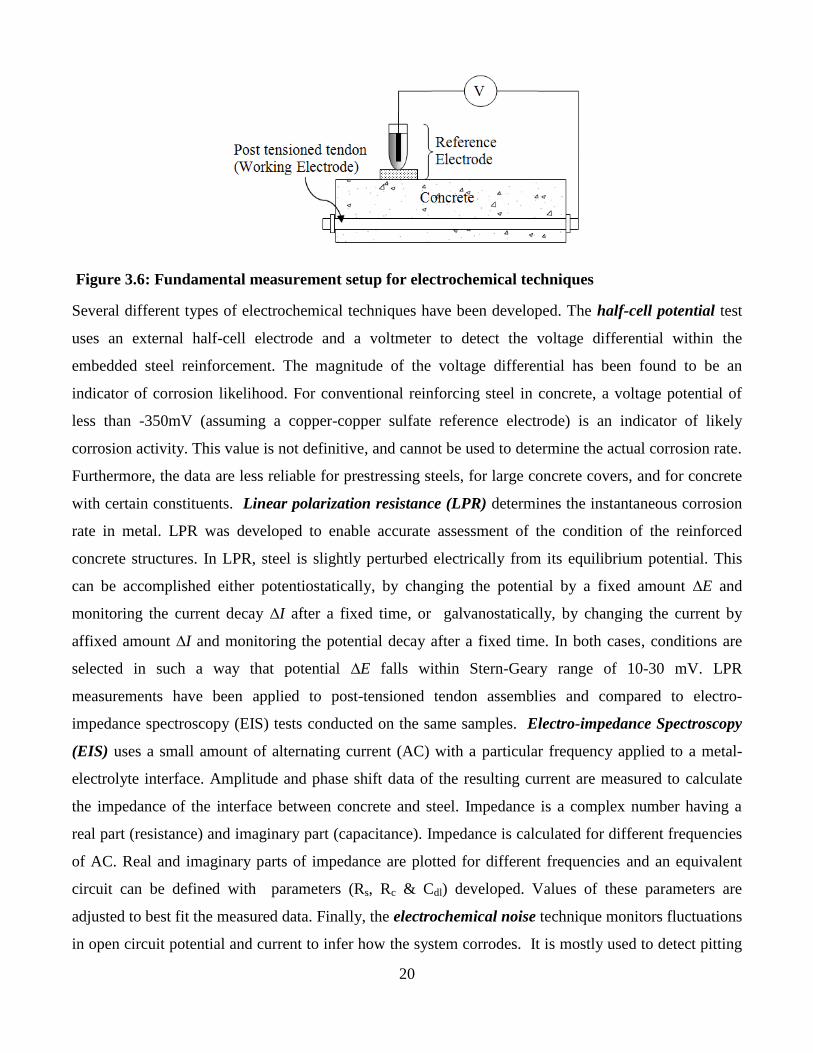
working electrode, a counter electrode, and a volt meter as shown in Figure 3.6. Note that a closed
electrical circuit is required, so direct electrical connection to the inspected steel must be established.
This poses a problem for application to tendons within existing PT ducts with currently available
technology because of the requirement that sensors be placed inside the duct. To date, mostly laboratory
studies have been conducted so far to check the feasibility of electrochemical techniques for detecting
corrosion in post-tensioned strands.
20
Figure 3.6: Fundamental measurement setup for electrochemical techniques
Several different types of electrochemical techniques have been developed. The half-cell potential test
uses an external half-cell electrode and a voltmeter to detect the voltage differential within the
embedded steel reinforcement. The magnitude of the voltage differential has been found to be an
indicator of corrosion likelihood. For conventional reinforcing steel in concrete, a voltage potential of
less than -350mV (assuming a copper-copper sulfate reference electrode) is an indicator of likely
corrosion activity. This value is not definitive, and cannot be used to determine the actual corrosion rate.
Furthermore, the data are less reliable for prestressing steels, for large concrete covers, and for concrete
with certain constituents. Linear polarization resistance (LPR) determines the instantaneous corrosion
rate in metal. LPR was developed to enable accurate assessment of the condition of the reinforced
concrete structures. In LPR, steel is slightly perturbed electrically from its equilibrium potential. This
can be accomplished either potentiostatically, by changing the potential by a fixed amount ∆E and
monitoring the current decay ∆I after a fixed time, or galvanostatically, by changing the current by
affixed amount ∆I and monitoring the potential decay after a fixed time. In both cases, conditions are
selected in such a way that potential ∆E falls within Stern-Geary range of 10-30 mV. LPR
measurements have been applied to post-tensioned tendon assemblies and compared to electro-
impedance spectroscopy (EIS) tests conducted on the same samples. Electro-impedance Spectroscopy
(EIS) uses a small amount of alternating current (AC) with a particular frequency applied to a metal-
electrolyte interface. Amplitude and phase shift data of the resulting current are measured to calculate
the impedance of the interface between concrete and steel. Impedance is a complex number having a
real part (resistance) and imaginary part (capacitance). Impedance is calculated for different frequencies
of AC. Real and imaginary parts of impedance are plotted for different frequencies and an equivalent
circuit can be defined with parameters (Rs, Rc & Cdl) developed. Values of these parameters are
adjusted to best fit the measured data. Finally, the electrochemical noise technique monitors fluctuations
in open circuit potential and current to infer how the system corrodes. It is mostly used to detect pitting
21
corrosion. During the initiation and nucleation stages of pitting corrosion, there is a rapid potential drop
as electrons accumulate at the metal surface due to the dissolution of metal during a predominantly
initial anodic stage. This stage terminates by pit repassivation or some other anodic stage. After
repassivation, a predominantly cathodic stage takes place. In the case of tendons, it has the limitation
that when current is applied, the surface area of the steel that is being affected cannot be accurately
determined and therefore the accuracy of the results in unknown.
3.6 Penetrating Radiation Methods
These methods monitor the interaction of high energy electromagnetic radiation, such as x-rays and
gamma rays, with matter to draw inferences about that material. Radiography involves placement of an
x-ray or gamma ray source on one side of the subject structure and a photographic film or digital
detector on the backside of the structure. The radiation energy from the source penetrates the subject
structure and exposes the film or detector. The amount of x-ray energy that passes through the subject
material is related to the line average of mass density along the energy penetration path. A radiograph
image is produced, representing a map of density that varies across the material thickness. For example,
areas of voiding in ducts show low density; metal tendons show high density, and grout is in between.
This graphical output is easy to interpret. This contrast allows for imaging of the conditions of both
plastic and metal ducts. Portable linear accelerator x-ray sources used successfully for radiographic
inspection of post-tensioning tendons or ducts in concrete have also shown success in detecting wire
breaks and voids in stay cable laboratory specimens. X-ray radiography can also be used to image
internal concrete conditions including corrosion and void/grout conditions of post-tensioning ducts, and
may be applicable to anchorage region with tomographic analyses. However, a primary drawback is
radiation exposure hazard to people, and the resulting cost needed to address this issue. Furthermore, it
takes more time to apply this method as compared to other NDE methods, and the test geometry and
access may be limited as the radiation source and film or digital receiver is on the opposite side. Finally
radiographs give no depth of field information unless tomography is used with angled exposures.
X-ray diffraction is used to measure stresses in advanced engineering materials such as thin metal lines
and interconnects on semiconductor devices, but is rarely applied to civil infrastructure materials. These
measurements are used to help solve material failure problems, check quality control, verify
computational results, and contribute to fundamental materials research. It precisely determines the
distance between planes of atoms in crystalline material through the measurement of peak positions. The
positions are then used to determine the elastic strains which can be converted to stresses using

22
appropriate elastic constants. Plastic deformation can be detected through changes in diffraction peak
widths rather than peak shifts.
3.7 Other Methods
A direct prestress measurement technique for concrete elements directly measures the available
prestress in existing girders and also the available prestress forces in the strands. (Azizinamini et al.
1996). The method is based on an investigation of the state of stress around a hole in a prestressed
concrete member. In this method, a cylindrical hole is drilled in the bottom flange of a prestressed girder
(assumed to be under compression). The key to application of this method to measure the available
prestress in compressed elements is accurate determination of the K factor, which is very specific to a
given geometry.
23
4 Results of Survey
As part of the project, a survey was conducted to state departments of transportation (DOTs). Objective
of the survey was to collect information from different states regarding need for corrosion inspection,
major corrosion related problems and challenges, research projects carried out on methodology of
corrosion detection, and usage of any non-destructive evaluation tools for inspecting prestressed or post-
tensioned strands or stays in bridges.
A total of 27 state DOTs in the survey out of which, 23 had bridges with need for corrosion inspection
associated with embedded steel strands or cable stays. Most of the state DOTs reported Bulb-tee or I-
beam bridges having a need for corrosion inspection. Ten state DOTs reported to have major corrosion
problems and challenges related with the bridges. Detail of these challenges is provided in Appendix B.
Seven state DOTs have carried out research projects to develop methodology of corrosion detection and
five have previously used nondestructive evaluation tools for inspecting prestressed or post-tensioned
strands or stays in bridges.
Appendix B provides a more detail about survey questions and responses by different state departments
of transportation.
24
5 Condition Assessment Technologies and Advantages and Disadvantages of
Each NDT Method
A two day long International workshop was held at Florida International University (FIU) with expert
participants from Germany, Switzerland, and Australia in addition to the U.S. experts and one researcher
from NASA. The workshop was organized and chaired by P.I. One of the objectives of this international
workshop was to develop a consensus on advantages and disadvantages of the available NDE
technologies; mainly in Civil Engineering field and applicable to condition assessments of post-
tensioned and stay cable systems.
As part of the Oct 27 and 28 workshop, significant discussions were carried out and set of conclusions
were drawn on advantages and disadvantages of several NDE techniques. Appendix C provides brief
summary of outcome from October 27 and 28, 2011 meeting at FIU.

25
6 Matrix for Assessing Effectiveness of Various NDT Methods
There is a need to select most appropriate NDT approach(s) for a given condition. For certain
conditions, more than one NDT method may be needed. The objective of this section of the report is to
establish a matrix, which identifies the merits of various NDT methods for assessing various conditions.
Conditions that demand use of NDT methods for condition assessment falls into following three general
categories:
a) Post-tensioned concrete bridges constructed prior to early 2000 using old grouting practice
b) Post-tensioned concrete bridges constructed after observing the corrosion challenges identified in
early 2000, using new grouting material.
c) New post-tensioned concrete bridges which will be constructed in future
There is a fourth category of post-tensioned concrete bridges that are currently under construction. It is
assumed that these bridges will be placed under category b with perhaps better conditions.
For each category listed above there are two general post-tensioning duct types:
a) Internal post-tensioned duct systems (both plastic and metal ducts),
b) External post-tensioned duct systems (plastic ducts),
For each duct type, there are several geometrical factors that dictate the types of NDT methods
employable in the field and listed below:
a) Anchorage zones
b) Deviators
c) Diaphragms
d) Grout type and presence/absence
The choice of NDT method is also influenced by other factors related to each specific method.
Figure 6.1 provides list of factors specific to each NDT method.
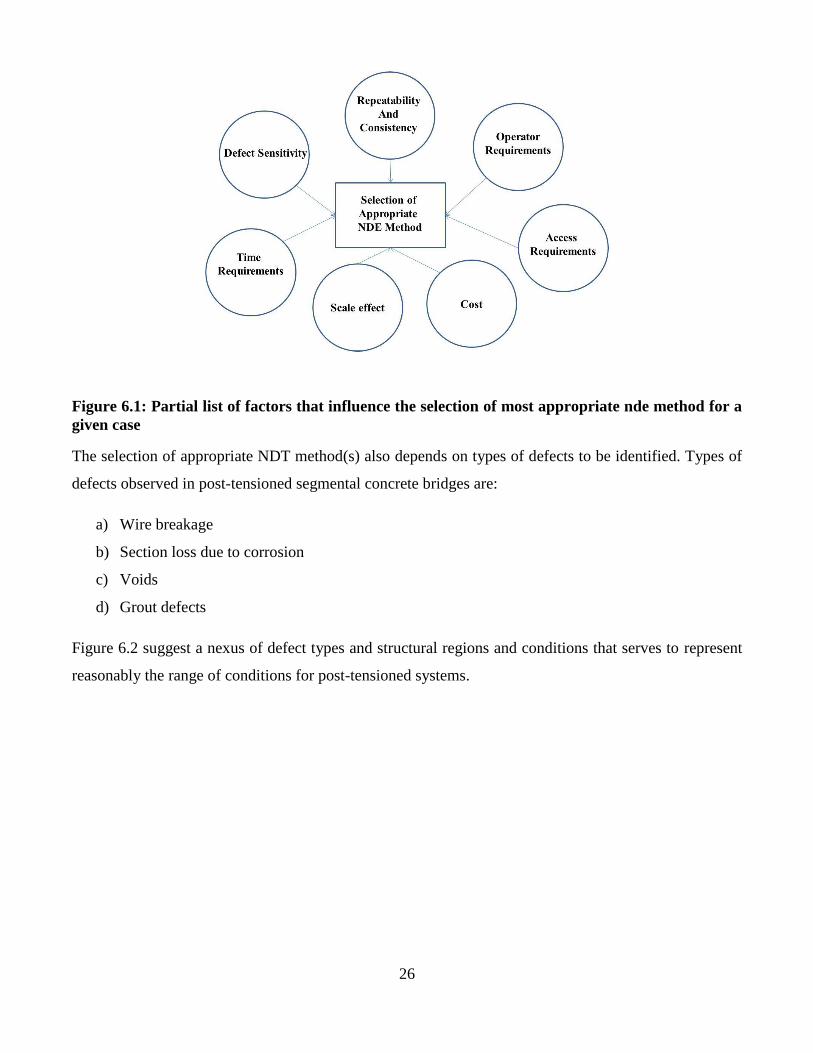
26
Figure 6.1: Partial list of factors that influence the selection of most appropriate nde method for a
given case
The selection of appropriate NDT method(s) also depends on types of defects to be identified. Types of
defects observed in post-tensioned segmental concrete bridges are:
a) Wire breakage
b) Section loss due to corrosion
c) Voids
d) Grout defects
Figure 6.2 suggest a nexus of defect types and structural regions and conditions that serves to represent
reasonably the range of conditions for post-tensioned systems.

27
Figure 6.2: Preliminary list of different conditions and regions of interest for post-tensioned
systems
Considering the discussion presented above, volume II of this project, entitled “FDOT Protocol and
Condition Assessment of Steel Strands in Post-tensioned Segmental Concrete bridges” provides steps in
health assessment of steel strands.

28
7 Recommendation for Development of a Stand-Alone Guide for Condition
Assessment of Post-tensioned Concrete Bridges
FDOT in recent years has carried out a significant amount of research on condition assessment of post-
tensioned concrete bridges. Level of knowledge developed by present and past research projects
demands development of a comprehensive guide for condition assessment of post-tensioned concrete
bridges.
It is recommended to develop a manual titled “Guide for Condition Assessment of Post-tensioned
Concrete Bridges” for condition assessment of post-tensioned concrete bridges. This guide can provide
detailed instructions, through a set of orderly steps illustrated by examples for the evaluation cases
encountered by FDOT. The following could be list of chapters to be included in this guide.
Chapter 1— Introduction—The objective of this chapter will be to introduce the guide, its
content, and philosophy. This chapter could provide general description of the guide, general
philosophies used for condition assessment, description of main elements involved in
condition assessment, and a brief description of contents of each chapter.
Chapter 2—Bridge Systems and Post-tensioned element Details—The objective of this
chapter will be to define the types of systems to which the guide is applicable. This chapter
would provide a list of various bridge systems for which the guide methodologies for
condition assessment could be utilized.
Chapter 3—Conditions Needing Inspection—The objective of this chapter could be to
introduce areas of post-tensioning prone to damage. This chapter will provide a
comprehensive list of problems needing condition assessment. This chapter will include a list
of field-observed problems common to various post-tensioned systems. The guide will be
developed such that it could easily be updated as more information and knowledge become
available. Case studies will be presented with photos, showing examples of observed field
problems.
Chapter 4—Available NDE Technologies—The objective of this chapter could be to
introduce various NDE methods and associated information. This chapter could provide
29
description of various NDE technologies, their advantages, disadvantages, limitations, and
any other relevant information with respect to various inspection conditions.
Chapter 5—Inspection Selection Strategy—The objective of this chapter could be to put the
various pieces of information together to prescribe an inspection system suitable for a given
scenario. The previous chapters will be used to educate the inspectors on different elements of
the inspection methodologies to be deployed. This chapter could provide guidelines for
selecting one or more appropriate NDE methods along with specific approaches for inspecting
a given bridge for a given condition. The conditions to be considered will, at a minimum,
contain corrosion, section loss, breakage, grout conditions, voids, water infiltration, and
anchorage zones.
Chapter 6—Record Keeping—This chapter will introduce a standard nomenclature for
elements, locations, and damage. It will attempt to establish procedures for recording the
observations, evaluation of historic data, and developing checklists for NDE method
applications and results, and inspection forms comparable to inspection results.
Chapter 7—Condition Assessment and Condition rating—The objective of this chapter
could be to translate the NDE and inspection results to a format that is interpretable for
condition assessment and condition rating purposes.
Chapter 8—Development of Maintenance Plan—The objective of this chapter will be to
develop level of severity, based on the information obtained through condition assessment and
produce maintenance plan, which should include plans for post retrofit and rehabilitation.
This chapter could also use life cycle cost analysis to conduct cost benefit analysis of various
risk level and select an optimum plan.
Chapter 9—Case Studies—A project with relevant work and application will be sought to be
included in the guide, as an illustrative example that can be followed by inspectors. This
chapter could include tools that could facilitate use of guide for in-service inspection of post-
tensioning systems. An example of this type of tool is SAULT
(http://138.47.78.37/sault/home.asp), which is a Web-based tool developed by Strategic

30
Highway Research Program 2 (SHRP2) renewal program for locating various classes of
utilities.
31
References
Azizinamini, A., Keeler, B., Rohde, J., & Mehrabi, A. (1996). Application of a New Nondestructive
Evaluation Technique to a 25-Year-Old Prestressed Concrete Girder. PCI Journal, Vol. 41, No. 3 .
Bartels, K. A., Dynes, C. P., & Kwun, H. (1998). Nondestructive evaluation of prestressing strands with
magnetostrictive sensors. Proc. SPIE Vol. 3400 (pp. 326-337). San Antonio, TX: Structural Materials
Technology III: An NDT Conference.
Beitelman, T. (2000). Tensile test results of post tensioning cables from Midbay Bridge. Tallahassee,
FL: Structures Research Center, Florida Department of Transportation.
Bergamini, A. (2001). Non-destructive testing of stay cables. Proc. IABSE Conf. On Suspended Bridges,
(pp. 312-313). Seoul, South Korea.
Corven Engineering, I. (2002). New Directions for Florida Post-Tensioning Bridges. Tallahassee, FL:
Report prepared for Florida Department of Transportation, Volume 1 – 10.
Cullington, D., MacNeil, D., Paulson, P., & Elliot, J. (2001). Continuous Acoustic Monitoring of
Grouted Post-Tensioned Concrete Bridges. NDT & E International Volume 34, Issue 2 , 95–105.
DaSilva, M., Javidi, S., Yakel, A., & Azizinamini, A. (2009). Nondestructive Method to Detect
Corrosion of Steel Elements in Concrete. Lincon, NE: The Nebraska Department of Roads.
DePinna, M. (2003). Focus: Applications of high energy X-ray inspection of post-tensioned concrete
structures and cable stay bridges. PTI Journal, 1(2) , 43-48.
DMJM Harris. (2003). Test and assessment of NDT methods for post tensioning systems in segmental
balanced cantilever concrete bridges. Tallahassee, FL: Report prepared for Florida Department of
Transportation.
Mariscotti, M. A., Jalinoos, F., Frigerio, T., Ruffolo, M., & Peter. (2009). Gamma-Ray Imaging for Void
and Corrosion Assessment. Concrete international (pp. 49-53). Oakland, CA: ACI.
Mehrabi, A. B. (2006). In-Service evaluation of cable-stayed bridges; Overview of available methods,
and findings. Journal of Bridge Engineering, Vol. 11, No. 6 , 716-724.

32
Mehrabi, A. B., & Ciolko, A. T. (2001). Health monitoring and problem solving for cable supported
bridges. Proc. 4th Symp. on Strait Crossing (pp. 55–60). Bergen, Norway: Balkema, Lisse, The
Netherlands.
Mehrabi, A., & Tabatabai, H. (1998). Unified finite difference formulation for free vibration of cables.
Journal of Structural Engineering, Vol. 124, No. 11 , 1313-1322.
Mehrabi, A., & Telang, N. (2003). Cable-stayed bridge performance evaluation- Lessons from the field.
Proc. of the 2003 Structures Congress & Exposition . Seattle, WA.: ASCE.
Mehrabi, A., Tabatabai, H., & Lotfi, H. R. (1998). Damage detection in structures using precursor
transformation method. J. of Intelligent Material Systems and Structures Vol. 9 , 808-817.
Naito, C., Jones, L., & Hodgson, I. (2010). Inspection Methods and techniques to determined non-visible
corrosion of prestressing strands in concrete bridge components Task 3 - Forensic evaluation and
rating methodology. Bethlehem, PA: Pennsylvania Department of Transportation.
Pearson-Kirk, D., Collard-Jenkins, S., & Solan, B. (2004). The post tensioned bridges. The 2004
Concrete Bridge Conference (p. 13p). Charlotte N.C.: National Concrete Bridge Council.
Pielstick, B. (2007). Durability Survey of Segmental Concrete Bridges. American Segmental Bridge
Institute.
Pollock, D. G., Dupuis, K. J., Lacour, B., & Olsen, K. R. (2008). Detection of Voids in Prestressed
Concrete Bridges using Thermal Imaging and Ground-Penetrating Radar. Pullman, WA: Washington
State Department of Transportation.
Powers, R. (1999). Corrosion evaluation of post-tensioned tendons on the Niles Channel Bridge.
Gainesville, FL: Florida Department of Transportation Report.
Prevéy, P. S. (1986). X-ray diffraction residual stress techniques . ASM International, ASM Handbook.
Vol. 10 , 380-392.
PTI Grouting Specifications Committee. (2001). Specification for Grouting of Post-Tensioned
Structures. Post-Tensioning Institute.
Sagüés, A. A., Kranc, S. C., & Hoehne, R. H. (2000). Initial development of methods for assessing
condition of post-tensioned tendons of segmental bridges. Tampa, FL: University of South Florida.
33
Sansalone, M. J., & Streett, W. B. (1998). The Impact-Echo Method. The online Journal of
Nondestructive Testing & Ultrasonics Vol.3 No.2 .
Schoefs, F., Abraham, O., & Popovics, J. (2012). Quantitative evaluation of contactless impact echo for
nondestructive assessment of void. Journal for Construction & Building Materials , In Press.
Tabatabai, H., Ciolko, A., & Dickson, T. (1995). Implications of test results from full-scale fatigue tests
of stay cables composed of seven-wire prestressing strands. Proc. of the Fourth International Bridge
Engineering Conference (pp. 266-277). San Francisco, CA: Transportation Research Board.
Taveira, L. V., Sagüés, A. A., & Lopez-Sabando, J. (2008). Detection of corrosion of post-tensioned
strands in grouted assemblies. NACE Corrosion Conference and Expo (pp. 1-19). Tampa, FL: NACE
Corrosion.

34
Appendix A: Nondestructive Evaluation
Techniques for Post-tensioned and Stay
Cable Structures
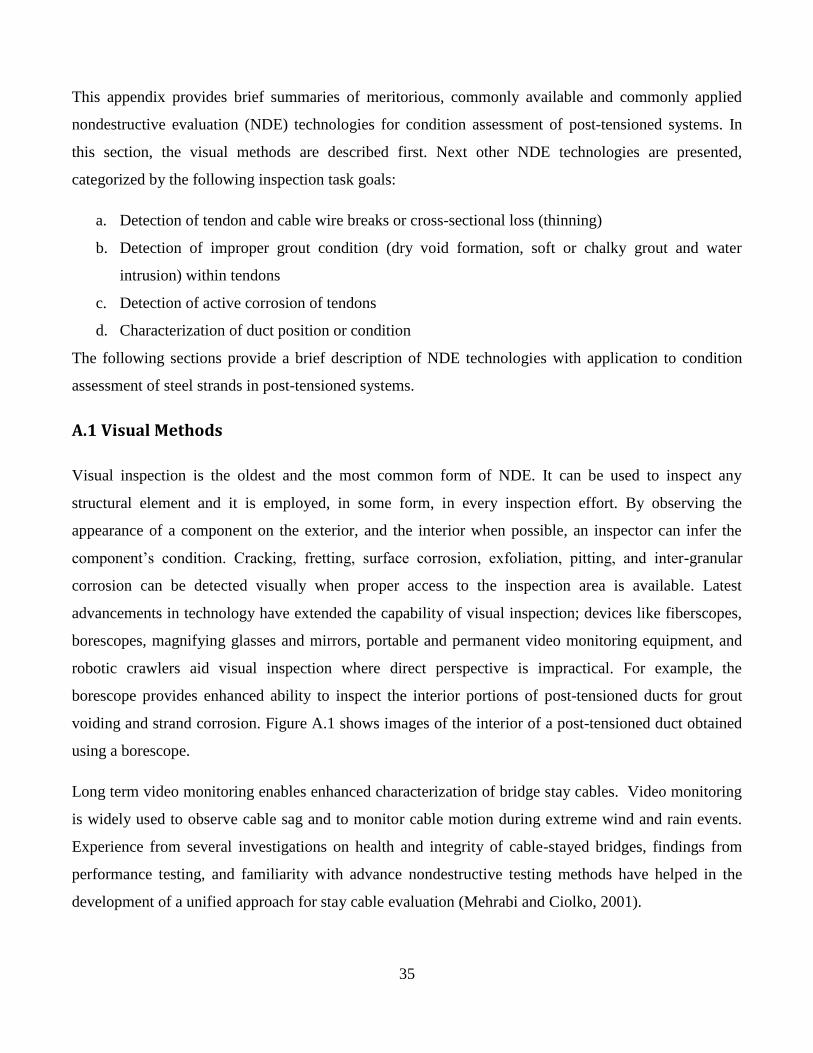
35
This appendix provides brief summaries of meritorious, commonly available and commonly applied
nondestructive evaluation (NDE) technologies for condition assessment of post-tensioned systems. In
this section, the visual methods are described first. Next other NDE technologies are presented,
categorized by the following inspection task goals:
a. Detection of tendon and cable wire breaks or cross-sectional loss (thinning)
b. Detection of improper grout condition (dry void formation, soft or chalky grout and water
intrusion) within tendons
c. Detection of active corrosion of tendons
d. Characterization of duct position or condition
The following sections provide a brief description of NDE technologies with application to condition
assessment of steel strands in post-tensioned systems.
A.1 Visual Methods
Visual inspection is the oldest and the most common form of NDE. It can be used to inspect any
structural element and it is employed, in some form, in every inspection effort. By observing the
appearance of a component on the exterior, and the interior when possible, an inspector can infer the
component’s condition. Cracking, fretting, surface corrosion, exfoliation, pitting, and inter-granular
corrosion can be detected visually when proper access to the inspection area is available. Latest
advancements in technology have extended the capability of visual inspection; devices like fiberscopes,
borescopes, magnifying glasses and mirrors, portable and permanent video monitoring equipment, and
robotic crawlers aid visual inspection where direct perspective is impractical. For example, the
borescope provides enhanced ability to inspect the interior portions of post-tensioned ducts for grout
voiding and strand corrosion. Figure A.1 shows images of the interior of a post-tensioned duct obtained
using a borescope.
Long term video monitoring enables enhanced characterization of bridge stay cables. Video monitoring
is widely used to observe cable sag and to monitor cable motion during extreme wind and rain events.
Experience from several investigations on health and integrity of cable-stayed bridges, findings from
performance testing, and familiarity with advance nondestructive testing methods have helped in the
development of a unified approach for stay cable evaluation (Mehrabi and Ciolko, 2001).

36
In some cases, visual inspection of stay cables includes hands-on detailed study, which includes the
removal of anchorage caps and visual inspection (with and w/o visual aid) of strand ends, sockets, and
locking plates, and visual inspection of cable free length. The process has been used to verify the
presence of water in and around anchorages and the severity of corrosion activity. It has also identified
locations along the cable free length where the extent of deterioration has made significant damage to
the corrosion protection barriers. The effectiveness of this method is limited to visible and accessible
areas. For visual inspection of fillers and steel wires/strands, and material sampling and testing along the
cable free length, cable dissection has also been performed on several bridges (Mehrabi and Telang,
2003). These detailed visual techniques are illustrated in Figure A.2. Table A-1 summarizes the inherent
characteristics and applications of visual inspection methods.
Table A-1: Summary of Inherent Characteristics and Applications of Visual Inspection
Advantages Disadvantages Best application
case
Application
with regard to
duct type
Inexpensive
method that is
readily
applicable.
Reliable
information
about distress
and condition is
obtained.
Cannot assess condition of
interior (hidden from
view) elements easily.
Borescope technology is
time consuming and
provides local
information, and requires
intrusive drilling.
Inspection of
interior of post-
tensioned ducts to
assess corrosion or
voiding condition
at one particular
location, using
borescope.
Applicable in
all inspection
cases, but
most effective
for external
ducts, both
metal and
plastic.
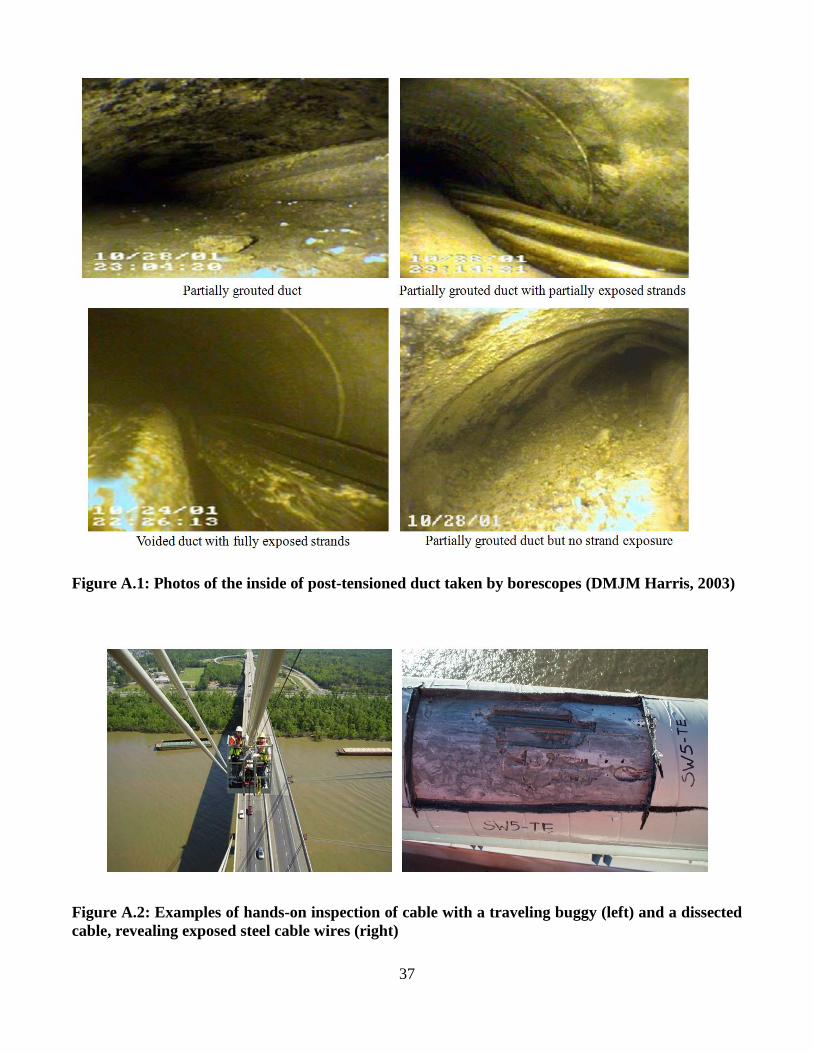
37
Figure A.1: Photos of the inside of post-tensioned duct taken by borescopes (DMJM Harris, 2003)
Figure A.2: Examples of hands-on inspection of cable with a traveling buggy (left) and a dissected
cable, revealing exposed steel cable wires (right)

38
A.2 Methods to Detect Tendon and Cable Wire Breaks and Cross-sectional Loss
Several NDT technologies have been developed to monitor tendon and wire condition with respect to
strand fracture or tendon thinning (loss of metal cross-section). The most prominent methods are
summarized below.
A.2.1 Magnetic Flux Leakage (MFL)
Magnetic flux leakage (MFL) is a nondestructive testing method to inspect ferrous materials to detect
distress caused by corrosion in strands or bars. It can be used to detect fiber fracture and thinning in
internal or external ducts, as well as stays and ropes. MFL is believed to be a promising nondestructive
technique, despite some shortcomings that could be improved.
When a magnetic field comes near ferromagnetic (steel) material, the magnetic flux lines will pass
through the steel bar. The steel offers a path of least resistance due to its high permeability, compared to
the surrounding air or concrete. When corrosion disrupts the metal’s continuity, this low resistance path
becomes blocked and the remaining steel may become magnetically saturated, forcing some of the flux
to flow through the air. Figure A.3 shows the schematic of this case. The changes in the vertical
components of the flux can be measured by magnetic field (Hall-effect) sensors. In fact, total saturation
is not required for detection, as orientation of the magnetic field can be altered by even small levels of
corrosion.
Figure A.3: Schematic representation of changes in flux in the location of the corroded area of the
strands in the active (left) and residual (right) methods (DaSilva, et al. 2009)
There are two primary methods for detecting these field anomalies: active and residual. In the active
method, the sensors are placed between the poles of the magnet and readings are obtained as the device
is passed over the specimen. Figure A.3 (left side) illustrates this method. Because the amount of the
flux in the ferrous materials depends on the magnetic field surrounding the materials, the location of the
magnet and the magnitude of the field are the main variables that affect the collected signal data. The
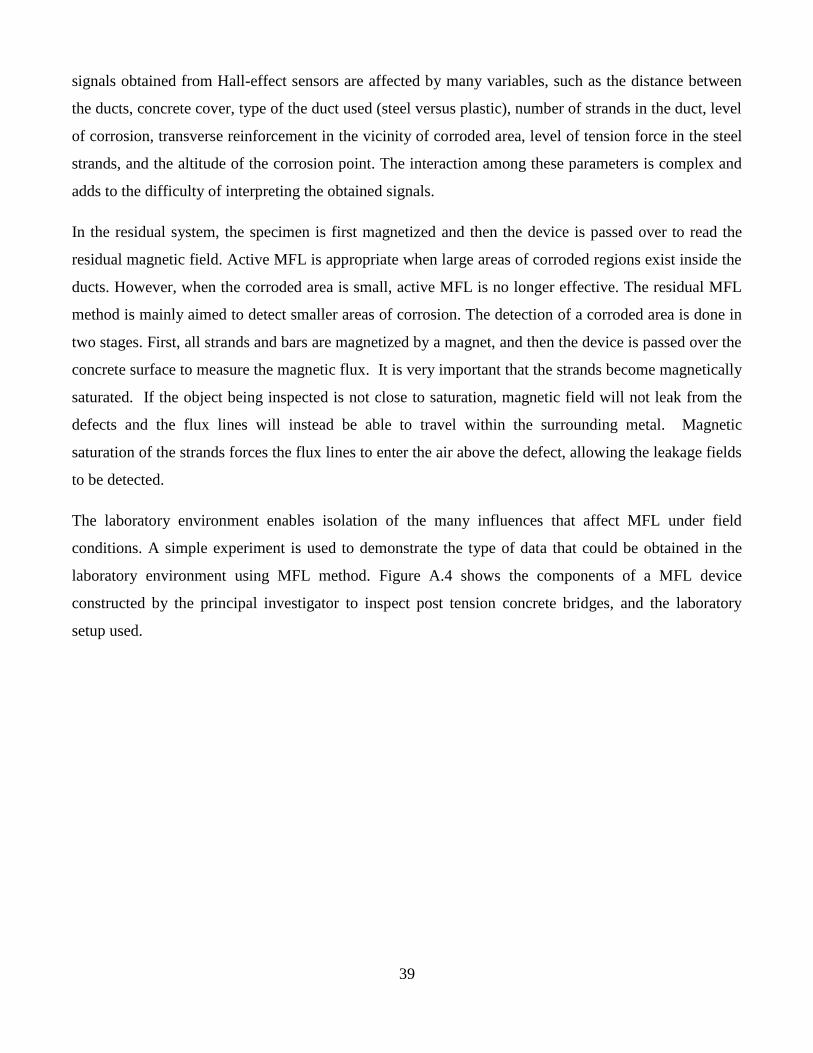
39
signals obtained from Hall-effect sensors are affected by many variables, such as the distance between
the ducts, concrete cover, type of the duct used (steel versus plastic), number of strands in the duct, level
of corrosion, transverse reinforcement in the vicinity of corroded area, level of tension force in the steel
strands, and the altitude of the corrosion point. The interaction among these parameters is complex and
adds to the difficulty of interpreting the obtained signals.
In the residual system, the specimen is first magnetized and then the device is passed over to read the
residual magnetic field. Active MFL is appropriate when large areas of corroded regions exist inside the
ducts. However, when the corroded area is small, active MFL is no longer effective. The residual MFL
method is mainly aimed to detect smaller areas of corrosion. The detection of a corroded area is done in
two stages. First, all strands and bars are magnetized by a magnet, and then the device is passed over the
concrete surface to measure the magnetic flux. It is very important that the strands become magnetically
saturated. If the object being inspected is not close to saturation, magnetic field will not leak from the
defects and the flux lines will instead be able to travel within the surrounding metal. Magnetic
saturation of the strands forces the flux lines to enter the air above the defect, allowing the leakage fields
to be detected.
The laboratory environment enables isolation of the many influences that affect MFL under field
conditions. A simple experiment is used to demonstrate the type of data that could be obtained in the
laboratory environment using MFL method. Figure A.4 shows the components of a MFL device
constructed by the principal investigator to inspect post tension concrete bridges, and the laboratory
setup used.
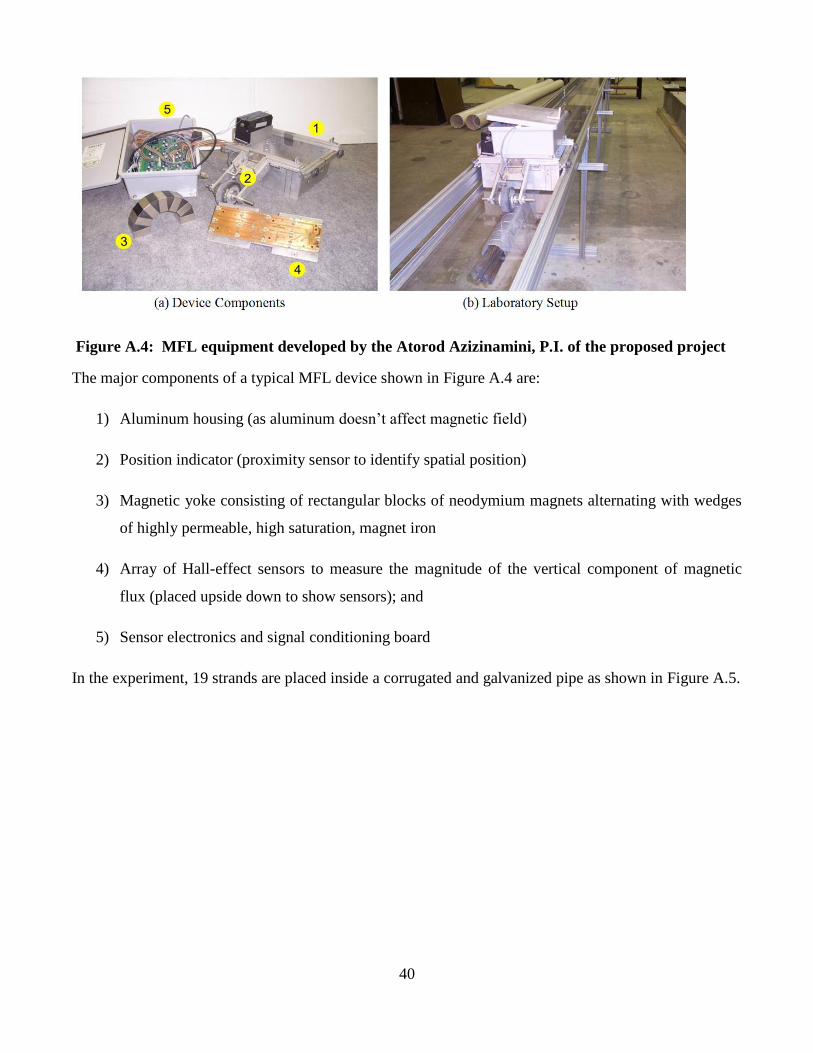
40
Figure A.4: MFL equipment developed by the Atorod Azizinamini, P.I. of the proposed project
The major components of a typical MFL device shown in Figure A.4 are:
1) Aluminum housing (as aluminum doesn’t affect magnetic field)
2) Position indicator (proximity sensor to identify spatial position)
3) Magnetic yoke consisting of rectangular blocks of neodymium magnets alternating with wedges
of highly permeable, high saturation, magnet iron
4) Array of Hall-effect sensors to measure the magnitude of the vertical component of magnetic
flux (placed upside down to show sensors); and
5) Sensor electronics and signal conditioning board
In the experiment, 19 strands are placed inside a corrugated and galvanized pipe as shown in Figure A.5.
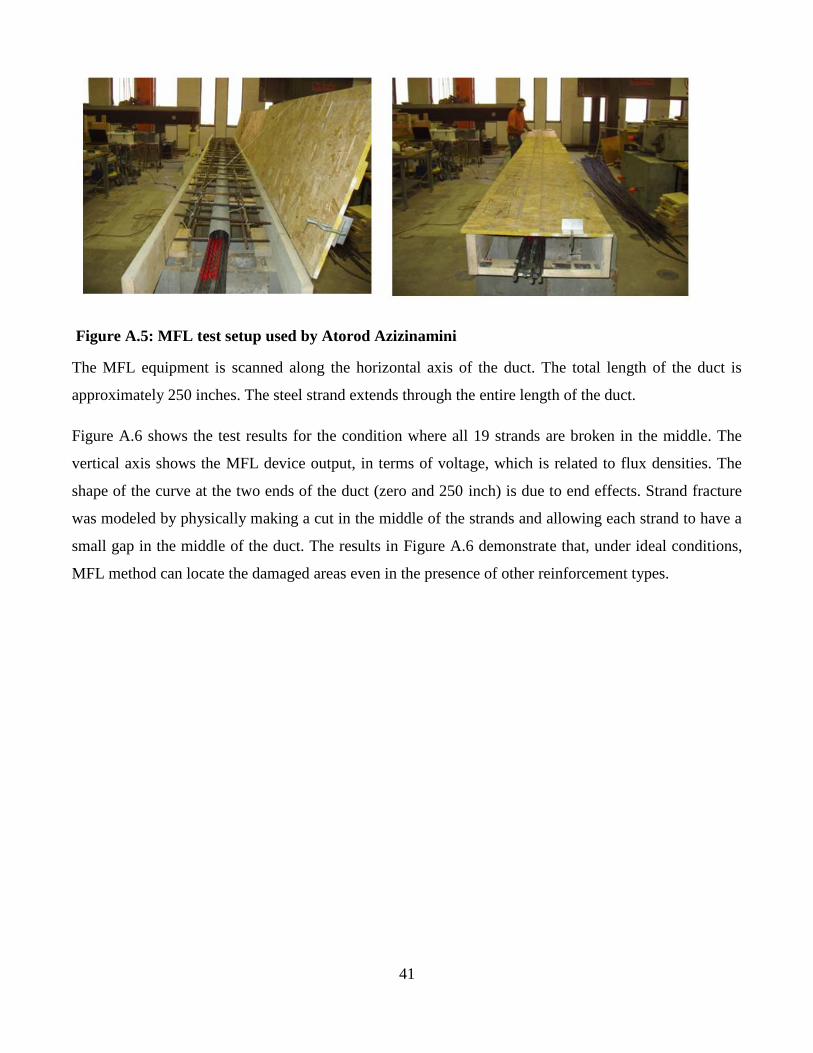
41
Figure A.5: MFL test setup used by Atorod Azizinamini
The MFL equipment is scanned along the horizontal axis of the duct. The total length of the duct is
approximately 250 inches. The steel strand extends through the entire length of the duct.
Figure A.6 shows the test results for the condition where all 19 strands are broken in the middle. The
vertical axis shows the MFL device output, in terms of voltage, which is related to flux densities. The
shape of the curve at the two ends of the duct (zero and 250 inch) is due to end effects. Strand fracture
was modeled by physically making a cut in the middle of the strands and allowing each strand to have a
small gap in the middle of the duct. The results in Figure A.6 demonstrate that, under ideal conditions,
MFL method can locate the damaged areas even in the presence of other reinforcement types.

42
Figure A.6: MFL test results from laboratory sample showing the effect of 19-strand
breakage (large event) and 4 transverse rebars (small ripples) along a concrete
element
In the field, the application of MFL for investigating the corrosion of steel strands embedded in concrete
presents the following challenges: the masking effect of the duct; the existence of different layers of
reinforcement in the structure that cause disruption to the MFL signal; and limited access to areas, such
as the anchorage zone, that are prone to corrosion activities. For instance, Figure A.7 shows a segmental
post-tensioned concrete bridge inspected by the P.I., having a number of post-tensioning ducts in top and
bottom flanges and a single row in the webs.

43
Figure A.7: An example of major segmental post-tensioned bridge inspected by P.I.
Figure A.8: Typical cross section of the bridge
The figure also shows an MFL signal for several ducts in bottom flange of the bridge. This signal is
more complicated than that obtained in the laboratory shown in Figure A.6. The different curves
represent different ducts across the section width in the bottom flange. Studying the differences among
the curves is an effective strategy for identifying the problem areas. The results are shown in Figure A.9.
For instance, the circled region in the figure indicates one duct that is different from the other ducts.
Such evidence could be used to conduct more detailed investigation of the subject area, including visual
inspection. As will be discussed in later sections, an overall strategy could be to use a hybrid approach,
where several nondestructive methods are used to make the final conclusions.
Another approach for effective use of MFL method is to collect the signals every two years or so and
look for changes over time. Ideally, the signals would not change with time. Therefore, changes in signal
levels over time could be an indication of corrosion activities. In this case, variation in MFL signature
will most likely be related to corrosion activity.
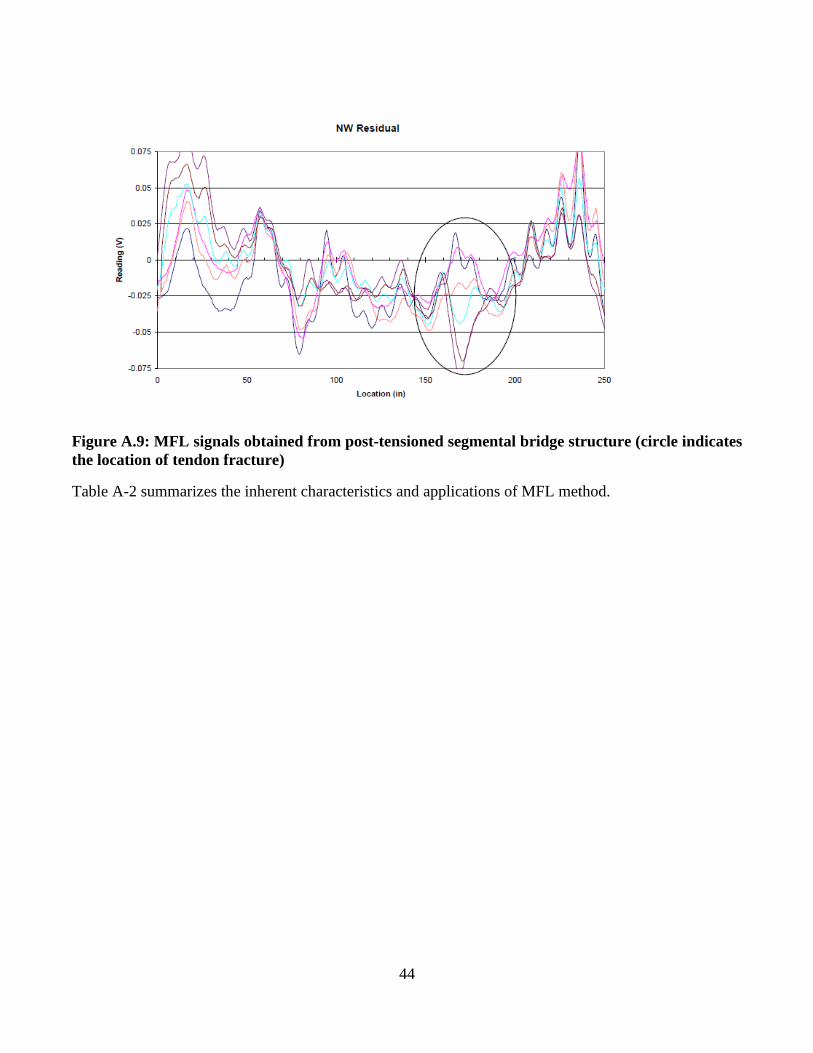
44
Figure A.9: MFL signals obtained from post-tensioned segmental bridge structure (circle indicates
the location of tendon fracture)
Table A-2 summarizes the inherent characteristics and applications of MFL method.
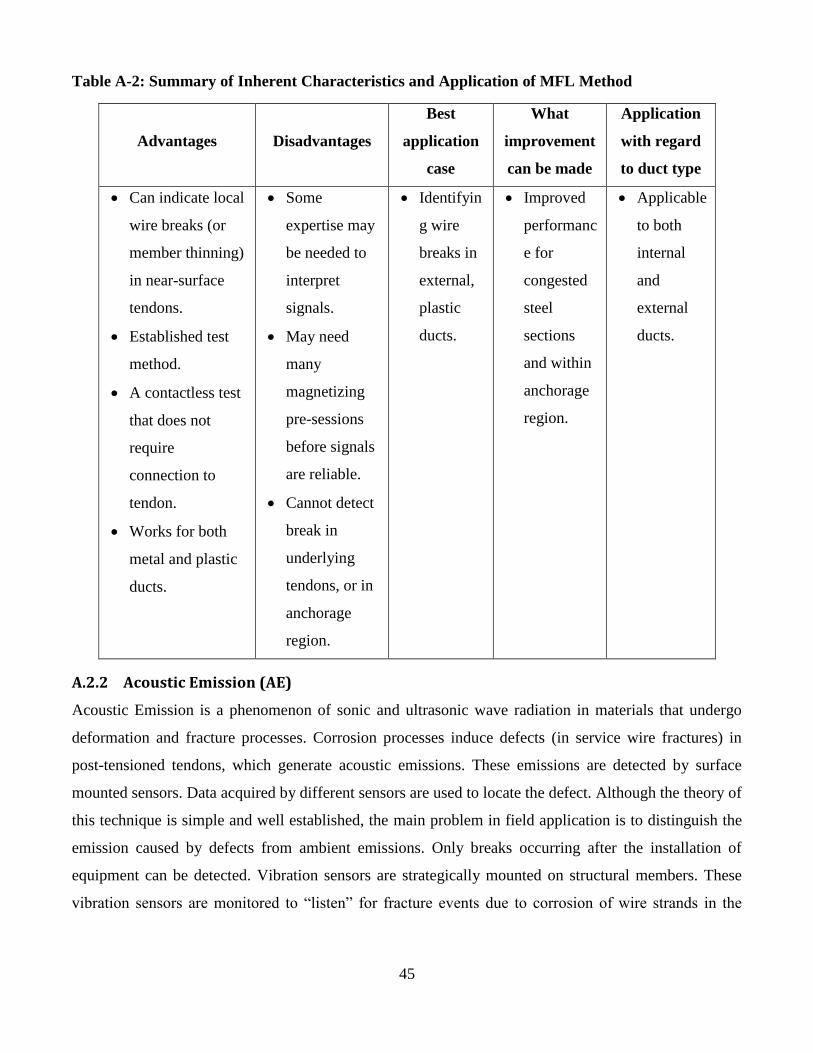
45
Table A-2: Summary of Inherent Characteristics and Application of MFL Method
Advantages Disadvantages
Best
application
case
What
improvement
can be made
Application
with regard
to duct type
Can indicate local
wire breaks (or
member thinning)
in near-surface
tendons.
Established test
method.
A contactless test
that does not
require
connection to
tendon.
Works for both
metal and plastic
ducts.
Some
expertise may
be needed to
interpret
signals.
May need
many
magnetizing
pre-sessions
before signals
are reliable.
Cannot detect
break in
underlying
tendons, or in
anchorage
region.
Identifyin
g wire
breaks in
external,
plastic
ducts.
Improved
performanc
e for
congested
steel
sections
and within
anchorage
region.
Applicable
to both
internal
and
external
ducts.
A.2.2 Acoustic Emission (AE)
Acoustic Emission is a phenomenon of sonic and ultrasonic wave radiation in materials that undergo
deformation and fracture processes. Corrosion processes induce defects (in service wire fractures) in
post-tensioned tendons, which generate acoustic emissions. These emissions are detected by surface
mounted sensors. Data acquired by different sensors are used to locate the defect. Although the theory of
this technique is simple and well established, the main problem in field application is to distinguish the
emission caused by defects from ambient emissions. Only breaks occurring after the installation of
equipment can be detected. Vibration sensors are strategically mounted on structural members. These
vibration sensors are monitored to “listen” for fracture events due to corrosion of wire strands in the
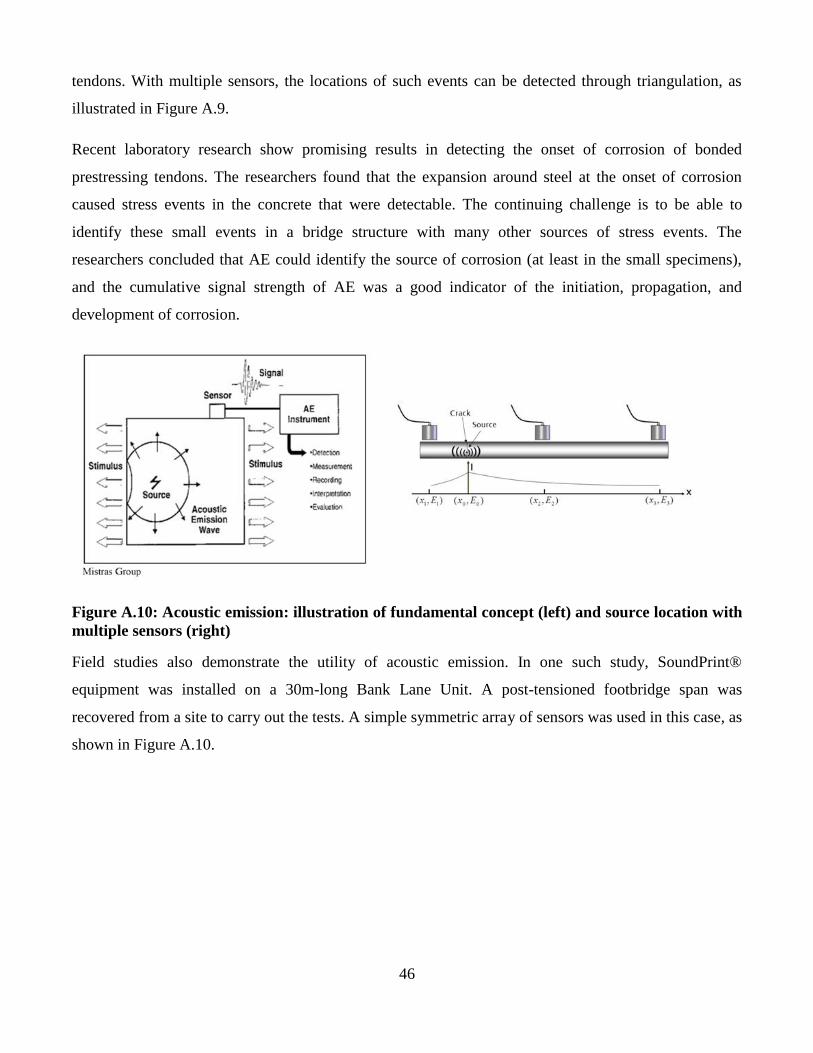
46
tendons. With multiple sensors, the locations of such events can be detected through triangulation, as
illustrated in Figure A.9.
Recent laboratory research show promising results in detecting the onset of corrosion of bonded
prestressing tendons. The researchers found that the expansion around steel at the onset of corrosion
caused stress events in the concrete that were detectable. The continuing challenge is to be able to
identify these small events in a bridge structure with many other sources of stress events. The
researchers concluded that AE could identify the source of corrosion (at least in the small specimens),
and the cumulative signal strength of AE was a good indicator of the initiation, propagation, and
development of corrosion.
Figure A.10: Acoustic emission: illustration of fundamental concept (left) and source location with
multiple sensors (right)
Field studies also demonstrate the utility of acoustic emission. In one such study, SoundPrint®
equipment was installed on a 30m-long Bank Lane Unit. A post-tensioned footbridge span was
recovered from a site to carry out the tests. A simple symmetric array of sensors was used in this case, as
shown in Figure A.10.
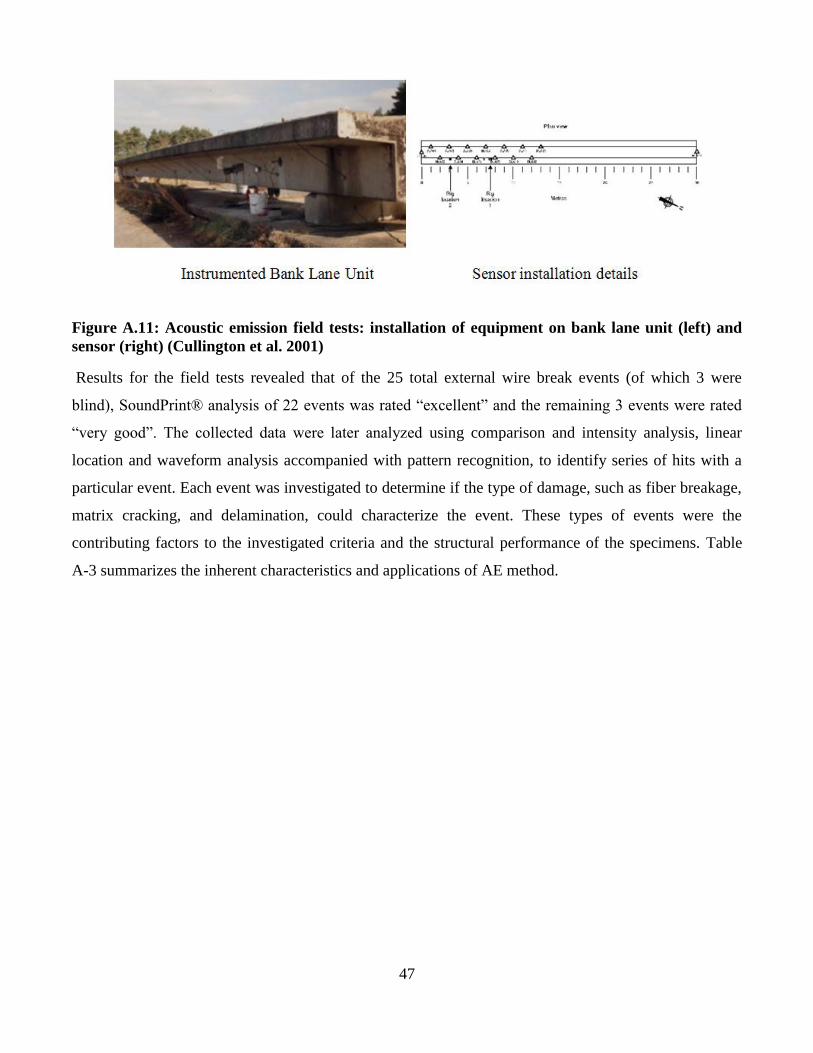
47
Figure A.11: Acoustic emission field tests: installation of equipment on bank lane unit (left) and
sensor (right) (Cullington et al. 2001)
Results for the field tests revealed that of the 25 total external wire break events (of which 3 were
blind), SoundPrint® analysis of 22 events was rated “excellent” and the remaining 3 events were rated
“very good”. The collected data were later analyzed using comparison and intensity analysis, linear
location and waveform analysis accompanied with pattern recognition, to identify series of hits with a
particular event. Each event was investigated to determine if the type of damage, such as fiber breakage,
matrix cracking, and delamination, could characterize the event. These types of events were the
contributing factors to the investigated criteria and the structural performance of the specimens. Table
A-3 summarizes the inherent characteristics and applications of AE method.
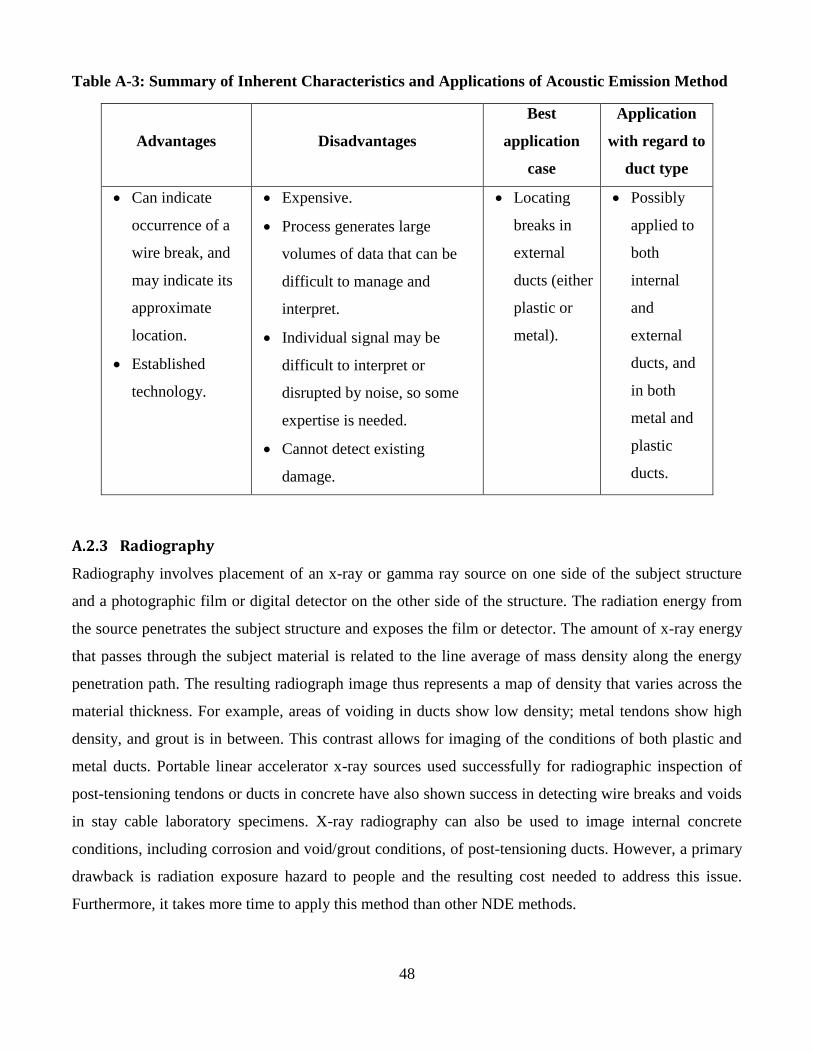
48
Table A-3: Summary of Inherent Characteristics and Applications of Acoustic Emission Method
Advantages Disadvantages
Best
application
case
Application
with regard to
duct type
Can indicate
occurrence of a
wire break, and
may indicate its
approximate
location.
Established
technology.
Expensive.
Process generates large
volumes of data that can be
difficult to manage and
interpret.
Individual signal may be
difficult to interpret or
disrupted by noise, so some
expertise is needed.
Cannot detect existing
damage.
Locating
breaks in
external
ducts (either
plastic or
metal).
Possibly
applied to
both
internal
and
external
ducts, and
in both
metal and
plastic
ducts.
A.2.3 Radiography
Radiography involves placement of an x-ray or gamma ray source on one side of the subject structure
and a photographic film or digital detector on the other side of the structure. The radiation energy from
the source penetrates the subject structure and exposes the film or detector. The amount of x-ray energy
that passes through the subject material is related to the line average of mass density along the energy
penetration path. The resulting radiograph image thus represents a map of density that varies across the
material thickness. For example, areas of voiding in ducts show low density; metal tendons show high
density, and grout is in between. This contrast allows for imaging of the conditions of both plastic and
metal ducts. Portable linear accelerator x-ray sources used successfully for radiographic inspection of
post-tensioning tendons or ducts in concrete have also shown success in detecting wire breaks and voids
in stay cable laboratory specimens. X-ray radiography can also be used to image internal concrete
conditions, including corrosion and void/grout conditions, of post-tensioning ducts. However, a primary
drawback is radiation exposure hazard to people and the resulting cost needed to address this issue.
Furthermore, it takes more time to apply this method than other NDE methods.
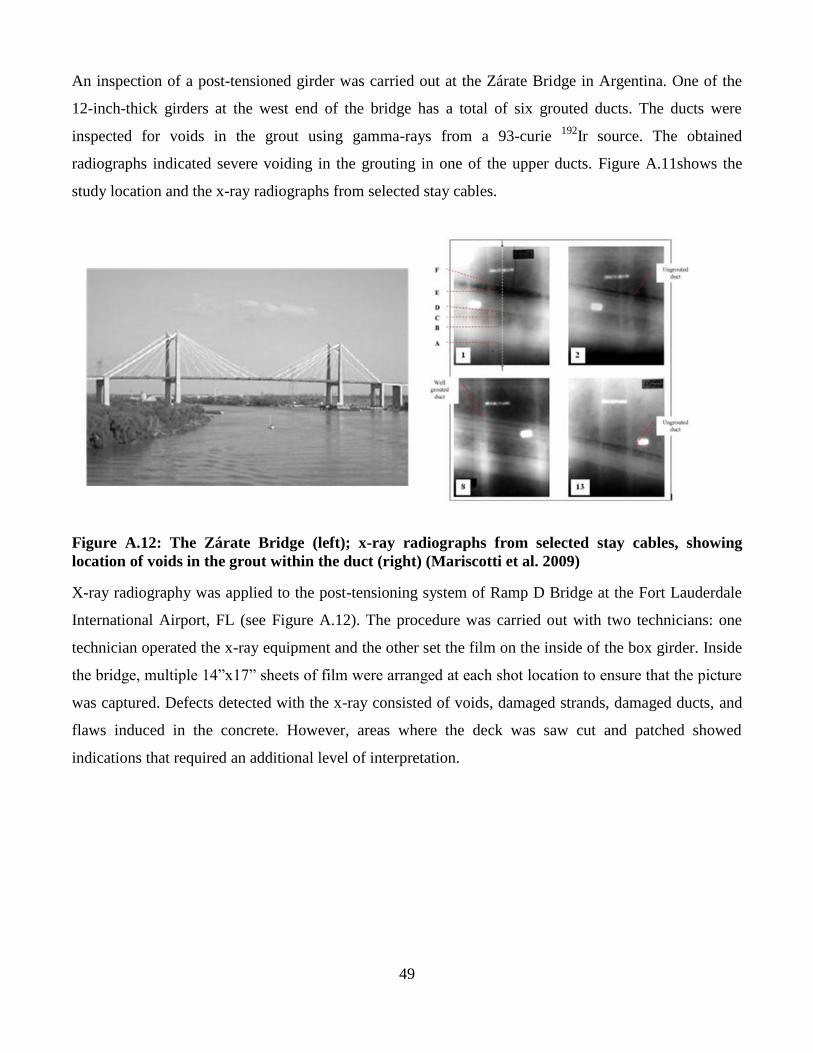
49
An inspection of a post-tensioned girder was carried out at the Zárate Bridge in Argentina. One of the
12-inch-thick girders at the west end of the bridge has a total of six grouted ducts. The ducts were
inspected for voids in the grout using gamma-rays from a 93-curie 192
Ir source. The obtained
radiographs indicated severe voiding in the grouting in one of the upper ducts. Figure A.11shows the
study location and the x-ray radiographs from selected stay cables.
Figure A.12: The Zárate Bridge (left); x-ray radiographs from selected stay cables, showing
location of voids in the grout within the duct (right) (Mariscotti et al. 2009)
X-ray radiography was applied to the post-tensioning system of Ramp D Bridge at the Fort Lauderdale
International Airport, FL (see Figure A.12). The procedure was carried out with two technicians: one
technician operated the x-ray equipment and the other set the film on the inside of the box girder. Inside
the bridge, multiple 14”x17” sheets of film were arranged at each shot location to ensure that the picture
was captured. Defects detected with the x-ray consisted of voids, damaged strands, damaged ducts, and
flaws induced in the concrete. However, areas where the deck was saw cut and patched showed
indications that required an additional level of interpretation.

50
Figure A.13: X-Ray inspection of post-tensioned deck ramp D in Fort Lauderdale: x-ray
inspection equipment (left) and example film radiograph (right) (DMJM Harris, 2003)
Although the technology in its current state is very expensive and cannot be recommended for all
inspection cases, it is likely that the technology will improve in the future due to mass production of
sensors and become a good candidate for infrastructure inspection. Table A-4 summarizes the inherent
characteristics and applications of radiography method.
Table A-4: Summary of Inherent Characteristics and Application of Radiography
Advantages Disadvantages
Best
application
case
What
improvement
can be made
Application
with regard to
duct type
Can identify
wire breaks and
grout voiding.
Graphical
output is easy to
interpret
May be
applicable to
anchorage
region.
Significant
safety and cost
concerns.
Test geometry
and access may
be limited.
Radiograph
gives no depth
of field
information
Very
broad
applicatio
n
Can be
improved
by
presenting
data in 3-D
visual
format
instead of a
single
radiograph
Applicable to
both internal
and external
ducts

51
A.2.4 Ultrasonic Guided Waves
Ultrasonic guided wave testing (GWT) techniques were applied to detect hidden flaws such as wire
breaks and grout voids in anchorage zones in the Cochrane Bridge in Mobile, AL, and the Talmadge
Bridge in Savannah, GA (Mehrabi and Telang, 2003). Ultrasonic guided waves are structure-borne
waves that propagate along a structural element, confined and guided by its geometric boundaries. The
propagating waves reflect from any local cross-sectional area change, such as fiber breaks or corrosion
defects. The GWT approach identifies defect location using the arrival time and the velocity of guided
wave pulse, and estimates the defect size with the pulse amplitude. GWT uses relatively low-frequency
waves (from 5 to 250 kHz) that have a long wavelength with respect to the tendon width in order to have
less attenuation for long-range inspection. The application of ultrasonic GWT to tendons at the
anchorage zone is shown in Figure A.13. Note that complete access to the ends of the tendons is
required. The data are interpreted through time domain signals, where reflected pulses from fracture
defects or other reflectors are located knowing the velocity of propagation of that particular guided wave
packet. Table A-5 summarizes the inherent characteristics and applications of this method.
Table A-5: Summary of Inherent Characteristics and Application of Ultrasonic Guided Waves
Advantages Disadvantages Best application case
Exciting
potential to
monitor
tendon
condition near
ends and
anchorage
zones.
Ends of tendons must be exposed and
accessible.
Complicated technology that can be difficult
to apply properly.
Frequency of waves must be adjusted to
account for wave velocity and attenuation
changes; as a result, the signals are difficult
to interpret.
Testing and analysis expertise are needed.
Technology is not
yet viable for
application to
embedded tendons
in concrete.
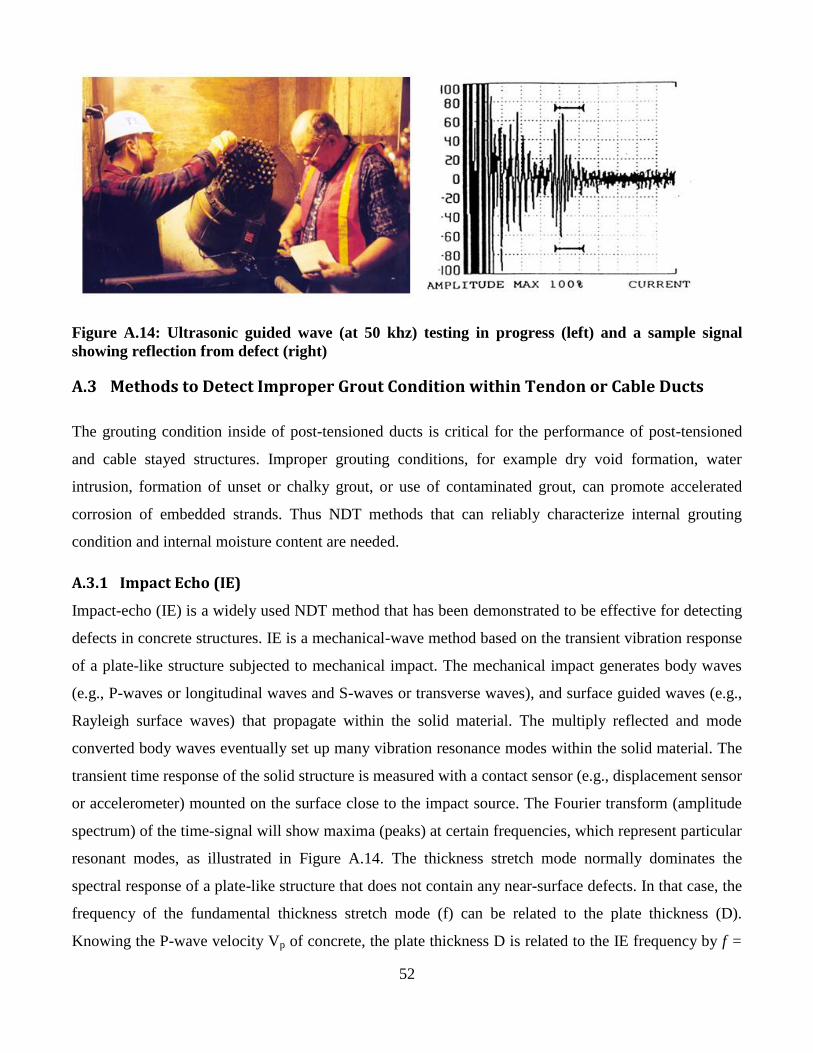
52
Figure A.14: Ultrasonic guided wave (at 50 khz) testing in progress (left) and a sample signal
showing reflection from defect (right)
A.3 Methods to Detect Improper Grout Condition within Tendon or Cable Ducts
The grouting condition inside of post-tensioned ducts is critical for the performance of post-tensioned
and cable stayed structures. Improper grouting conditions, for example dry void formation, water
intrusion, formation of unset or chalky grout, or use of contaminated grout, can promote accelerated
corrosion of embedded strands. Thus NDT methods that can reliably characterize internal grouting
condition and internal moisture content are needed.
A.3.1 Impact Echo (IE)
Impact-echo (IE) is a widely used NDT method that has been demonstrated to be effective for detecting
defects in concrete structures. IE is a mechanical-wave method based on the transient vibration response
of a plate-like structure subjected to mechanical impact. The mechanical impact generates body waves
(e.g., P-waves or longitudinal waves and S-waves or transverse waves), and surface guided waves (e.g.,
Rayleigh surface waves) that propagate within the solid material. The multiply reflected and mode
converted body waves eventually set up many vibration resonance modes within the solid material. The
transient time response of the solid structure is measured with a contact sensor (e.g., displacement sensor
or accelerometer) mounted on the surface close to the impact source. The Fourier transform (amplitude
spectrum) of the time-signal will show maxima (peaks) at certain frequencies, which represent particular
resonant modes, as illustrated in Figure A.14. The thickness stretch mode normally dominates the
spectral response of a plate-like structure that does not contain any near-surface defects. In that case, the
frequency of the fundamental thickness stretch mode (f) can be related to the plate thickness (D).
Knowing the P-wave velocity Vp of concrete, the plate thickness D is related to the IE frequency by f =

53
Vp/(2*D),where β is a correction factor that depends on material properties of concrete, ranging from
0.945 to 0.957. The thickness stretch mode may also dominate the spectral response when the test is
carried out over a relatively deep defect like a voided post-tension tendon duct.
Figure A.15: Illustration of impact-echo test method (Sansalone & Streett, 1998)
Olson Engineering and Dr. John Popovics of University of Illinois, have pioneered the development of
impact-echo scanning systems, where impact echo data are readily collected over a large area and then
presented in an image for effective interpretation. An effective application of Impact-Echo scanning
systems is to locate voids in PT ducts with one-sided access for testing, where a drop in the impact-echo
resonant mode is associated with the presence of an ungrouted duct.
Olson Engineering developed a scanning system based on a rolling transducer assembly incorporating
multiple sensors. When the test unit is rolled across the testing surface, an opto-coupler on the central
wheel keeps track of the distance. This unit is calibrated to impact and record data at intervals of 25 mm
(1 inch). The maximum frequency of excitation of the solenoid impactors in the scanner is 25 kHz. The
impactor in the scanning head can be replaced with one that generates higher frequencies if needed.
Typical scanning time for a line of 4 m (13 ft), approximately 160 test points, is 60 seconds. In an
Impact-Echo scanning line, the spatial resolution of the scan is about 25 mm (1 inch) between IE test
points. Raw data in the frequency domain are first digitally filtered using a Butterworth filter with a
band-pass range of 2 kHz to 20 kHz. Picks of dominant frequency were performed on each spectrum and
an Impact-Echo thickness was calculated based on the selected dominant frequency. A three-
dimensional plot (in either color or grayscale) of the condition of the tested specimens can also be
generated by combining the calculated Impact-Echo scan lines. Figure A.15 shows the Olson impact
echo scanning equipment, both handheld and vehicle mounted units.
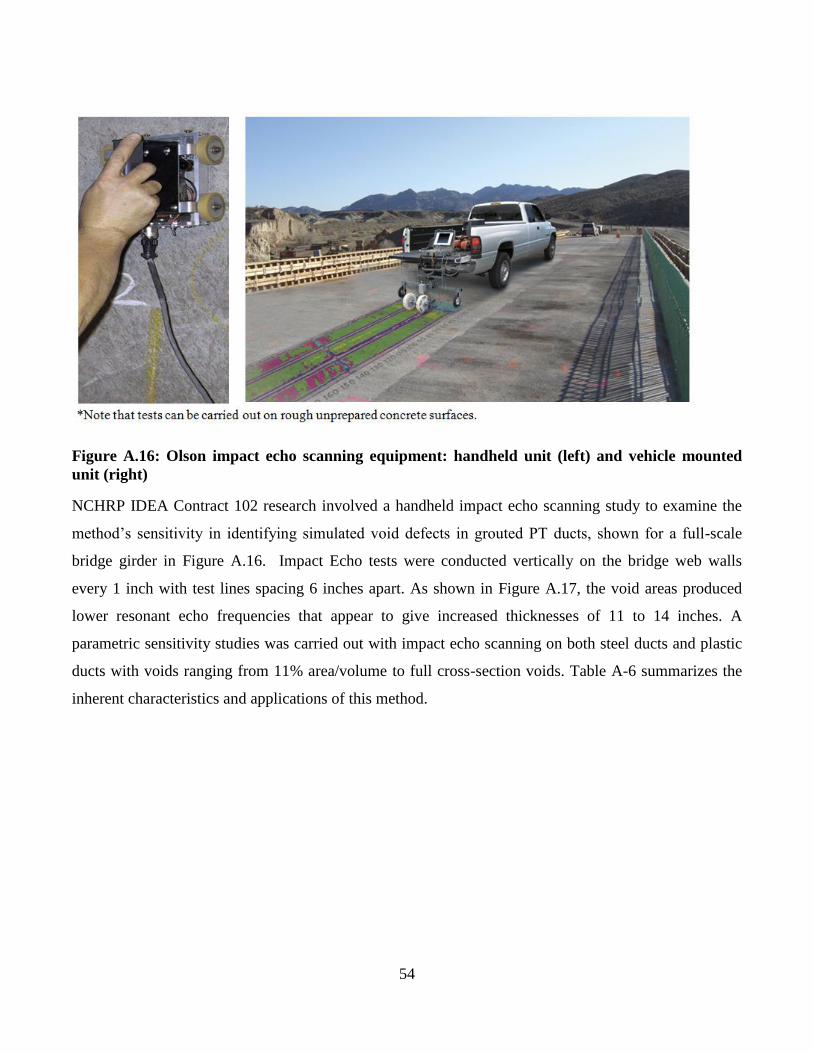
54
Figure A.16: Olson impact echo scanning equipment: handheld unit (left) and vehicle mounted
unit (right)
NCHRP IDEA Contract 102 research involved a handheld impact echo scanning study to examine the
method’s sensitivity in identifying simulated void defects in grouted PT ducts, shown for a full-scale
bridge girder in Figure A.16. Impact Echo tests were conducted vertically on the bridge web walls
every 1 inch with test lines spacing 6 inches apart. As shown in Figure A.17, the void areas produced
lower resonant echo frequencies that appear to give increased thicknesses of 11 to 14 inches. A
parametric sensitivity studies was carried out with impact echo scanning on both steel ducts and plastic
ducts with voids ranging from 11% area/volume to full cross-section voids. Table A-6 summarizes the
inherent characteristics and applications of this method.
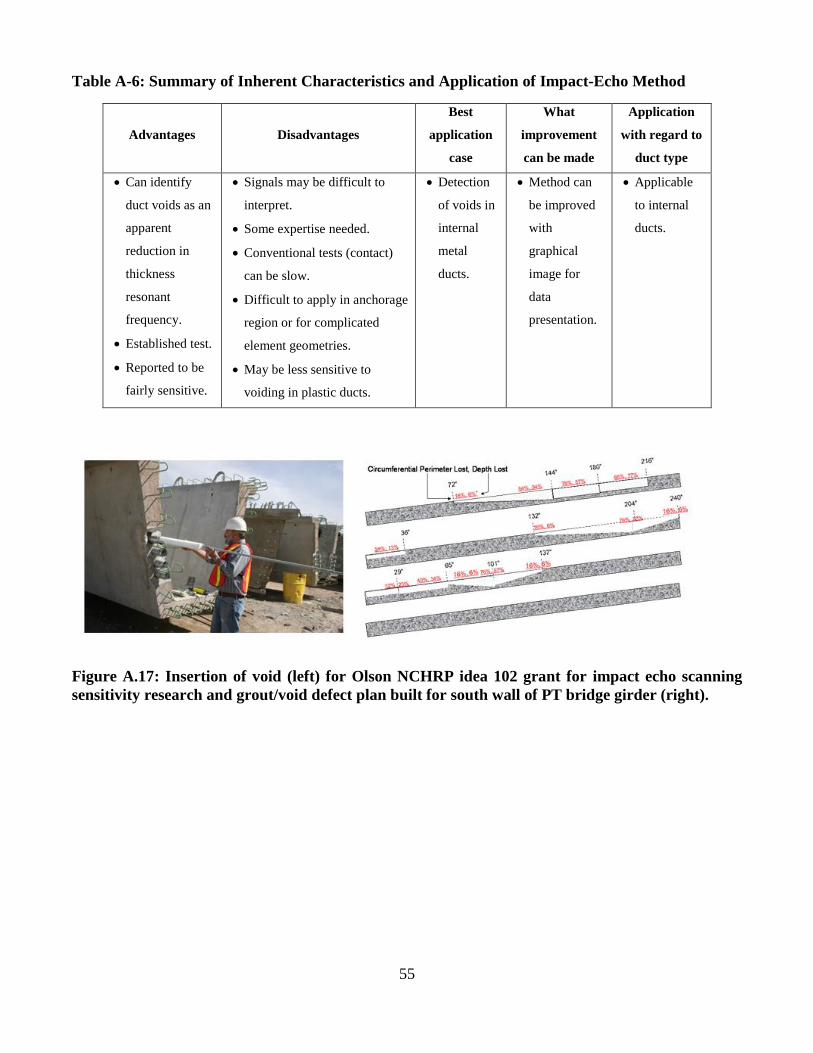
55
Table A-6: Summary of Inherent Characteristics and Application of Impact-Echo Method
Advantages Disadvantages
Best
application
case
What
improvement
can be made
Application
with regard to
duct type
Can identify
duct voids as an
apparent
reduction in
thickness
resonant
frequency.
Established test.
Reported to be
fairly sensitive.
Signals may be difficult to
interpret.
Some expertise needed.
Conventional tests (contact)
can be slow.
Difficult to apply in anchorage
region or for complicated
element geometries.
May be less sensitive to
voiding in plastic ducts.
Detection
of voids in
internal
metal
ducts.
Method can
be improved
with
graphical
image for
data
presentation.
Applicable
to internal
ducts.
Figure A.17: Insertion of void (left) for Olson NCHRP idea 102 grant for impact echo scanning
sensitivity research and grout/void defect plan built for south wall of PT bridge girder (right).
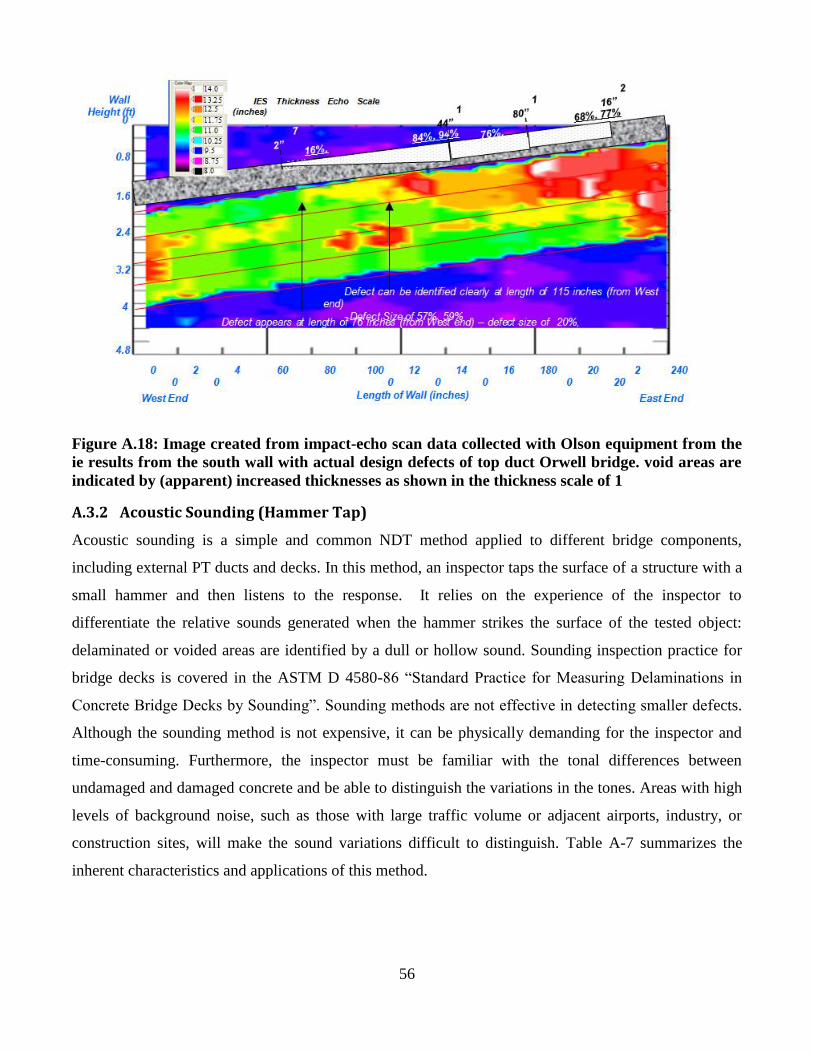
56
Figure A.18: Image created from impact-echo scan data collected with Olson equipment from the
ie results from the south wall with actual design defects of top duct Orwell bridge. void areas are
indicated by (apparent) increased thicknesses as shown in the thickness scale of 1
A.3.2 Acoustic Sounding (Hammer Tap)
Acoustic sounding is a simple and common NDT method applied to different bridge components,
including external PT ducts and decks. In this method, an inspector taps the surface of a structure with a
small hammer and then listens to the response. It relies on the experience of the inspector to
differentiate the relative sounds generated when the hammer strikes the surface of the tested object:
delaminated or voided areas are identified by a dull or hollow sound. Sounding inspection practice for
bridge decks is covered in the ASTM D 4580-86 “Standard Practice for Measuring Delaminations in
Concrete Bridge Decks by Sounding”. Sounding methods are not effective in detecting smaller defects.
Although the sounding method is not expensive, it can be physically demanding for the inspector and
time-consuming. Furthermore, the inspector must be familiar with the tonal differences between
undamaged and damaged concrete and be able to distinguish the variations in the tones. Areas with high
levels of background noise, such as those with large traffic volume or adjacent airports, industry, or
construction sites, will make the sound variations difficult to distinguish. Table A-7 summarizes the
inherent characteristics and applications of this method.

57
Table A-7: Summary of Inherent Characteristics and Application of Acoustic Sounding Method
Advantages Disadvantages
Best
application
case
What
improvement can
be made
Application
with regard to
duct type
Practical and
relatively
easy.
Fairly
accurate in
detecting
“dry” voids in
the grout.
Not
sensitive to
“soft” or
unset grout.
Subjective
test that is
operator
dependent.
External
plastic duct
looking for
dry voiding
in grout.
Automate
process and
quantify results
with acoustic
sensors and
appropriate data
analysis.
Applicable
to external
ducts only.
A.3.3 Impulse Response
The Impulse Response test provides a record or signature of the structural (mechanical) compliance of a
structure near a given test location. The testing apparatus consists of a hammer with an attached load
cell, capable of generating small force at a point in the deck. The other element of the testing device is a
surface-mounted transducer capable of measuring the response of the structure at relatively low
frequency ranges; normally a geophone sensor (voltage output proportional to surface velocity) is used.
The IR testing is mainly used for condition assessment of bridge deck. However, it should also be
applicable to external tendons. IR could also be used to assess the overall effect of corrosion in internal
tendons on global response of structure.
Figure A.18 shows typical apparatus and controlling software used to conduct impulse response tests.
The velocity transducer is placed at every defined testing grid point and an impact event from the
hammer is applied nearby. The loading function data from the hammer and the response signal from the
surface sensor are collected and processed. The time signal information is then converted to the
frequency domain by using the Fast Fourier Transform (FFT). The resulting velocity spectrum is then
divided by the force spectrum to obtain a transfer function, referred to as the “mobility” of the element
under the test. Mobility is an index that allows the engineer to quickly assess the local compliance
condition, which can be used to illustrate relative changes across the structure.
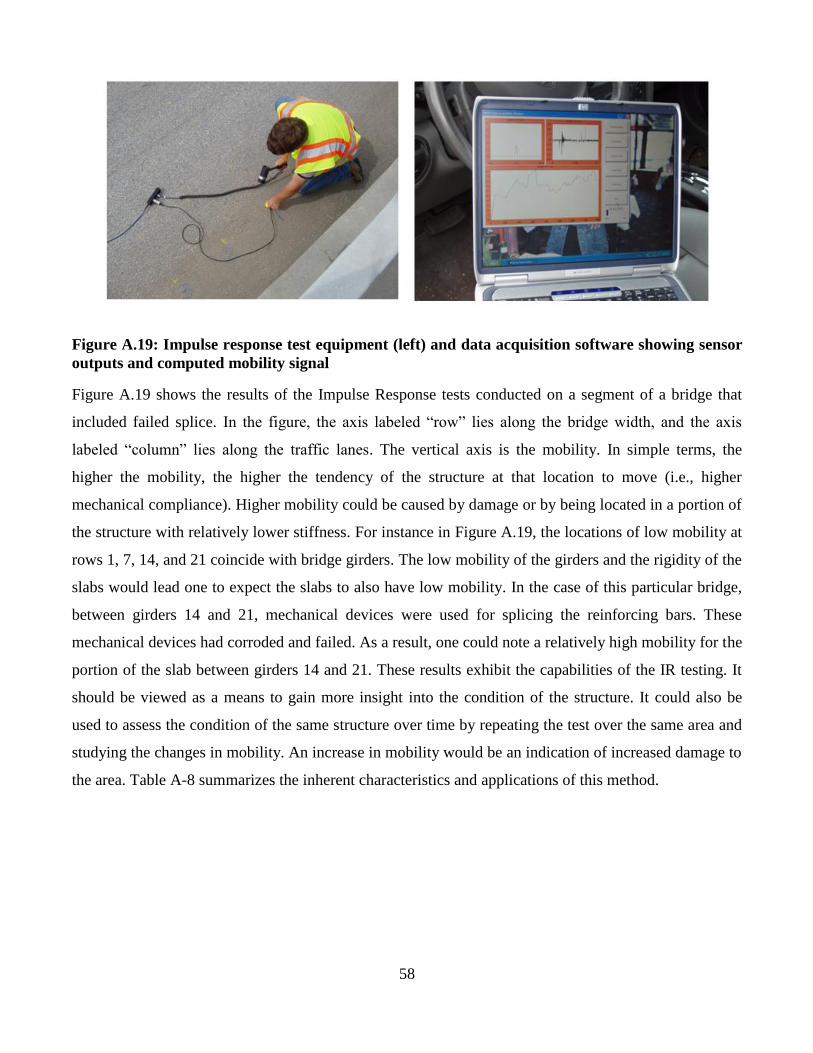
58
Figure A.19: Impulse response test equipment (left) and data acquisition software showing sensor
outputs and computed mobility signal
Figure A.19 shows the results of the Impulse Response tests conducted on a segment of a bridge that
included failed splice. In the figure, the axis labeled “row” lies along the bridge width, and the axis
labeled “column” lies along the traffic lanes. The vertical axis is the mobility. In simple terms, the
higher the mobility, the higher the tendency of the structure at that location to move (i.e., higher
mechanical compliance). Higher mobility could be caused by damage or by being located in a portion of
the structure with relatively lower stiffness. For instance in Figure A.19, the locations of low mobility at
rows 1, 7, 14, and 21 coincide with bridge girders. The low mobility of the girders and the rigidity of the
slabs would lead one to expect the slabs to also have low mobility. In the case of this particular bridge,
between girders 14 and 21, mechanical devices were used for splicing the reinforcing bars. These
mechanical devices had corroded and failed. As a result, one could note a relatively high mobility for the
portion of the slab between girders 14 and 21. These results exhibit the capabilities of the IR testing. It
should be viewed as a means to gain more insight into the condition of the structure. It could also be
used to assess the condition of the same structure over time by repeating the test over the same area and
studying the changes in mobility. An increase in mobility would be an indication of increased damage to
the area. Table A-8 summarizes the inherent characteristics and applications of this method.
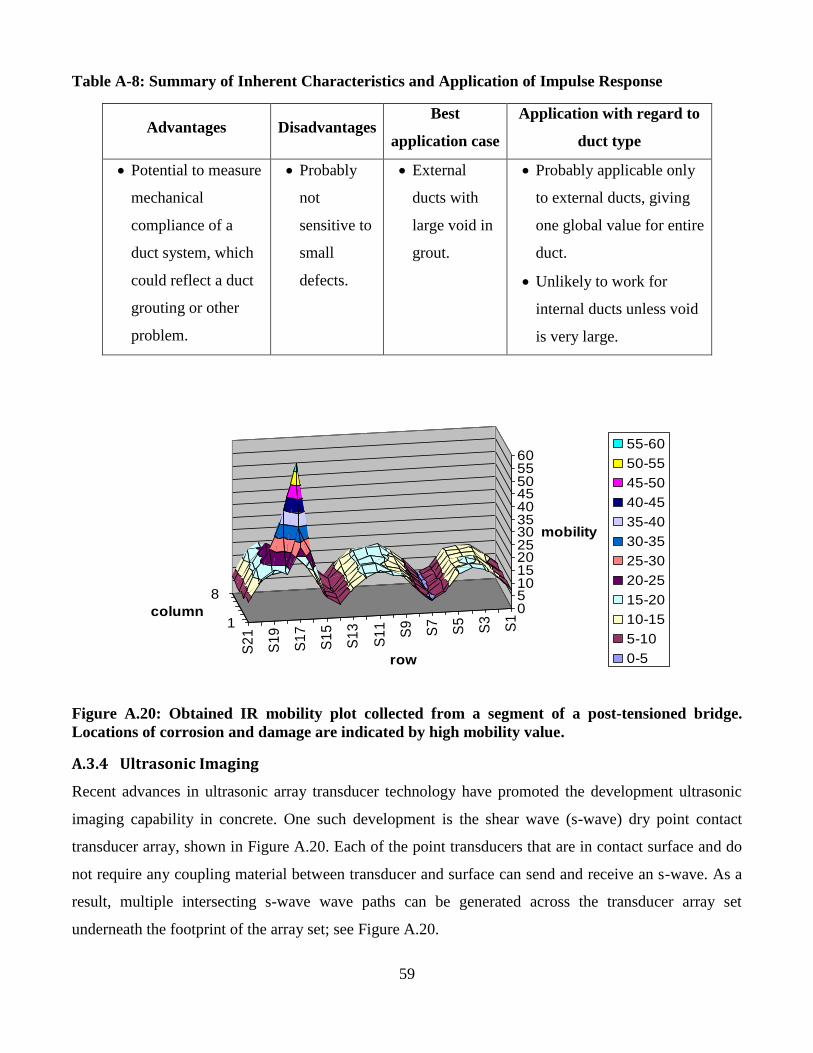
59
Table A-8: Summary of Inherent Characteristics and Application of Impulse Response
Advantages Disadvantages Best
application case
Application with regard to
duct type
Potential to measure
mechanical
compliance of a
duct system, which
could reflect a duct
grouting or other
problem.
Probably
not
sensitive to
small
defects.
External
ducts with
large void in
grout.
Probably applicable only
to external ducts, giving
one global value for entire
duct.
Unlikely to work for
internal ducts unless void
is very large.
Figure A.20: Obtained IR mobility plot collected from a segment of a post-tensioned bridge.
Locations of corrosion and damage are indicated by high mobility value.
A.3.4 Ultrasonic Imaging
Recent advances in ultrasonic array transducer technology have promoted the development ultrasonic
imaging capability in concrete. One such development is the shear wave (s-wave) dry point contact
transducer array, shown in Figure A.20. Each of the point transducers that are in contact surface and do
not require any coupling material between transducer and surface can send and receive an s-wave. As a
result, multiple intersecting s-wave wave paths can be generated across the transducer array set
underneath the footprint of the array set; see Figure A.20.
1
8
S1
S3
S5
S7
S9
S1
1
S1
3
S1
5
S1
7
S1
9
S2
1
051015202530354045505560
mobility
column
row
mobility
55-60
50-55
45-50
40-45
35-40
30-35
25-30
20-25
15-20
10-15
5-10
0-5
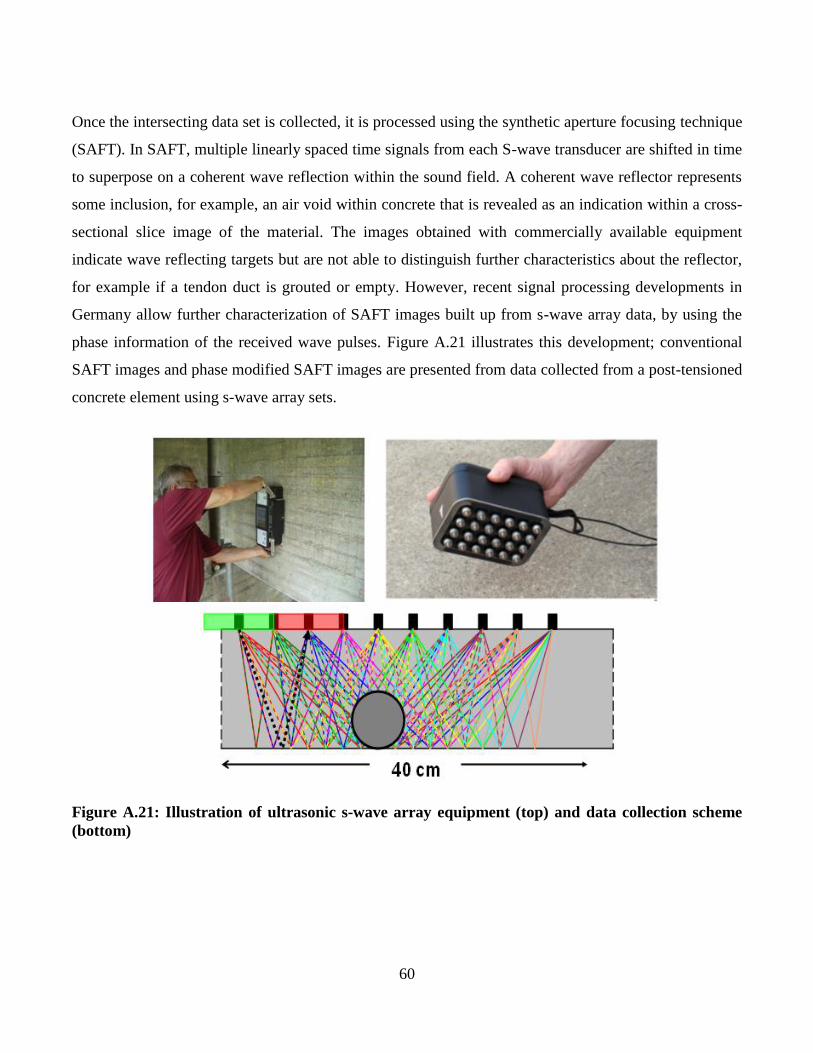
60
Once the intersecting data set is collected, it is processed using the synthetic aperture focusing technique
(SAFT). In SAFT, multiple linearly spaced time signals from each S-wave transducer are shifted in time
to superpose on a coherent wave reflection within the sound field. A coherent wave reflector represents
some inclusion, for example, an air void within concrete that is revealed as an indication within a cross-
sectional slice image of the material. The images obtained with commercially available equipment
indicate wave reflecting targets but are not able to distinguish further characteristics about the reflector,
for example if a tendon duct is grouted or empty. However, recent signal processing developments in
Germany allow further characterization of SAFT images built up from s-wave array data, by using the
phase information of the received wave pulses. Figure A.21 illustrates this development; conventional
SAFT images and phase modified SAFT images are presented from data collected from a post-tensioned
concrete element using s-wave array sets.
Figure A.21: Illustration of ultrasonic s-wave array equipment (top) and data collection scheme
(bottom)

61
Figure A.22: Illustration of conventional SAFT image (top) and phase modified SAFT image
(bottom) collected from a PT girder. The color indicates the phase of the reflected wave in the
phase modified image.
Both images indicate the presence of the PT duct within the element, but the phase modified image is
able to further characterize the duct as either filled or empty. However, it should be noted that signal
processing and imaging technology is not yet available in commercial s-wave testing equipment
packages. Recent advances in fully air-coupled ultrasonic tomographic imaging for concrete members
have also been reported by Popovics; he reports that internal voiding can be detected in concrete using
this approach. However, fully air-coupled ultrasonic tomography is still a developing technology, and
thus is relegated to the laboratory environment and not yet ready to be applied in the field. Table A-9
summarizes the inherent characteristics and applications of this method.
fully grouted partially
grouted
emptyfully groutedempty
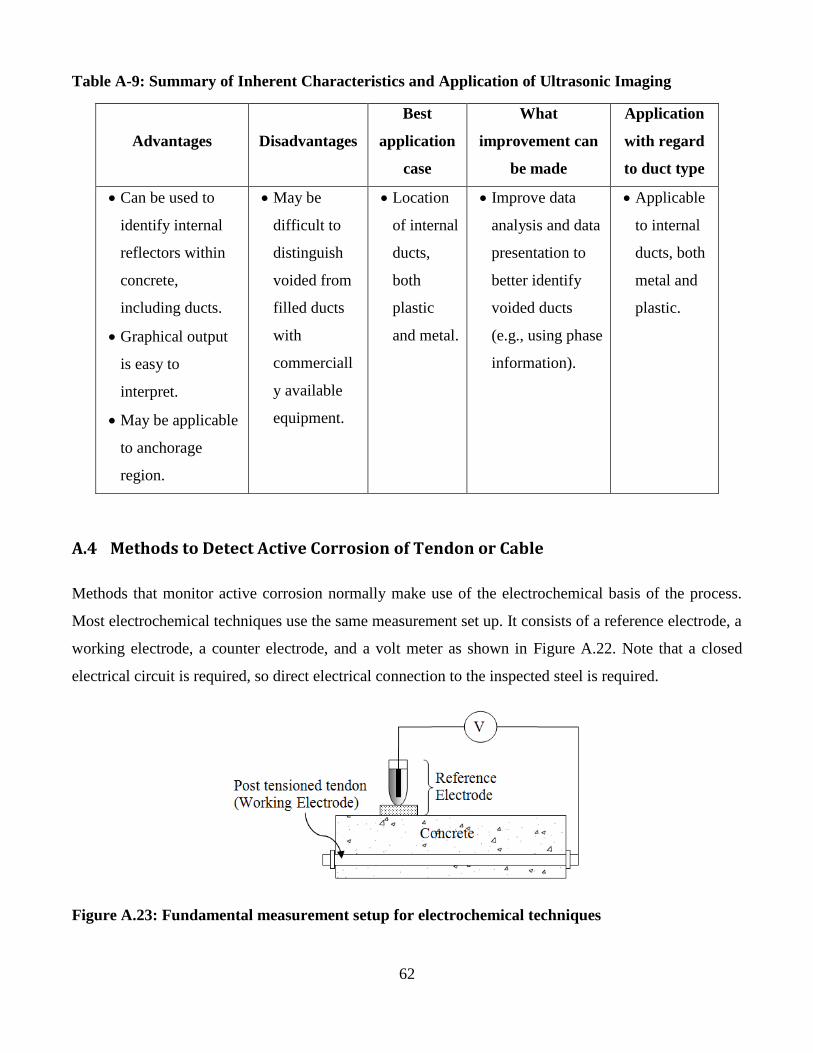
62
Table A-9: Summary of Inherent Characteristics and Application of Ultrasonic Imaging
Advantages Disadvantages
Best
application
case
What
improvement can
be made
Application
with regard
to duct type
Can be used to
identify internal
reflectors within
concrete,
including ducts.
Graphical output
is easy to
interpret.
May be applicable
to anchorage
region.
May be
difficult to
distinguish
voided from
filled ducts
with
commerciall
y available
equipment.
Location
of internal
ducts,
both
plastic
and metal.
Improve data
analysis and data
presentation to
better identify
voided ducts
(e.g., using phase
information).
Applicable
to internal
ducts, both
metal and
plastic.
A.4 Methods to Detect Active Corrosion of Tendon or Cable
Methods that monitor active corrosion normally make use of the electrochemical basis of the process.
Most electrochemical techniques use the same measurement set up. It consists of a reference electrode, a
working electrode, a counter electrode, and a volt meter as shown in Figure A.22. Note that a closed
electrical circuit is required, so direct electrical connection to the inspected steel is required.
Figure A.23: Fundamental measurement setup for electrochemical techniques

63
Only laboratory studies have been conducted so far to check the feasibility of electrochemical
techniques for detecting corrosion in post-tensioned strands. The most significant electrochemical test
procedures are summarized in Table A-10 and in the following sections.
Table A-10: Summary of Inherent Characteristics and Applications of Electrochemical Methods
Advantages Disadvantages
Best
application
case
What
improvement
can be made
Application
with regard
to duct type
Potential
to measure
meaningfu
l data
related to
active
corrosion
of strand.
Electrical connection to
tendon is required.
Sensors must be placed
within the duct to
monitor tendon.
Difficult to apply to the
existing PT ducts with
current available
technology because of
the requirement that
sensors must be inside
the duct.
Standard
steel
reinforcing
bar and
tendon
systems in
concrete
not within
ducts.
Develop
robust
sensors
and
sensing
systems
that are
applicable
within
ducts.
Probably
not
applicable
to external
or internal
ducts at
this time
A.4.1 Half-cell Potential
The half-cell potential test uses an external half-cell electrode and a voltmeter to detect the voltage
differential within the embedded steel reinforcement. The magnitude of the voltage differential has been
found to be an indicator of corrosion likelihood. For conventional reinforcing steel in concrete, a voltage
potential of less than -350mV (assuming a copper-copper sulfate reference electrode) is an indicator of
likely corrosion activity. This value is not definitive, and cannot be used to determine the actual
corrosion rate. Furthermore, the data are less reliable for prestressing steels, for large concrete covers,
and for concrete with certain constituents. Photos of half-cell potential equipment are shown in Figure
A.23.
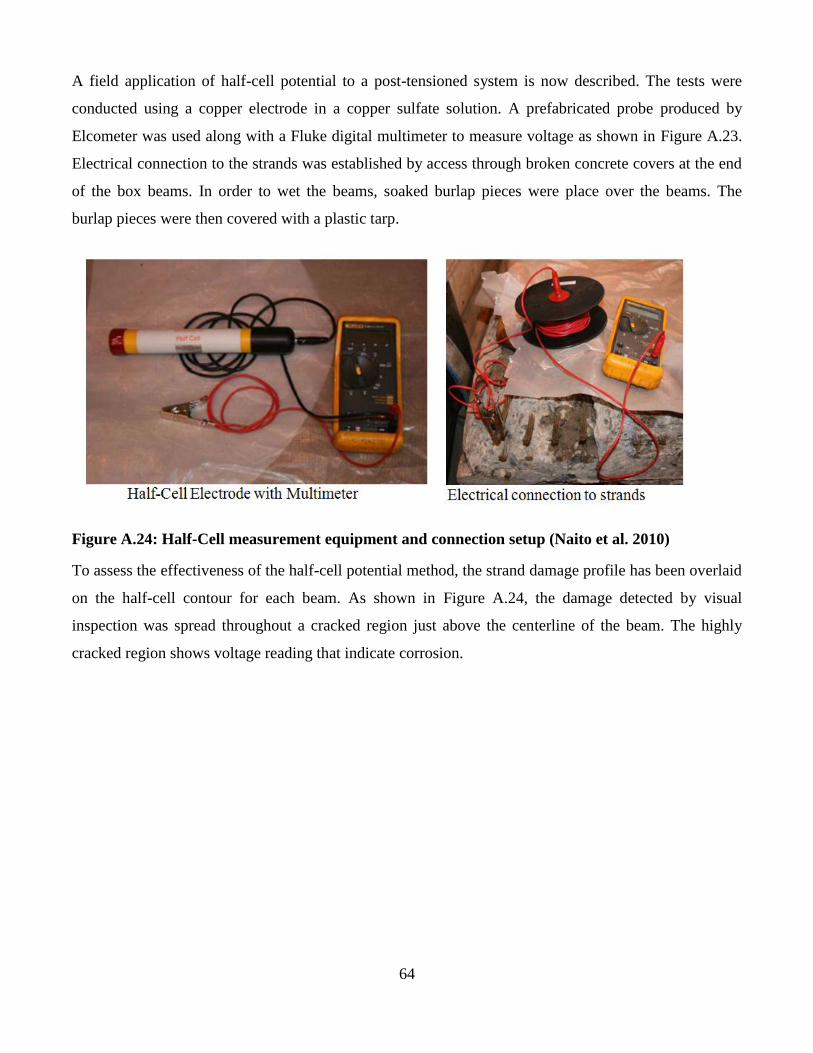
64
A field application of half-cell potential to a post-tensioned system is now described. The tests were
conducted using a copper electrode in a copper sulfate solution. A prefabricated probe produced by
Elcometer was used along with a Fluke digital multimeter to measure voltage as shown in Figure A.23.
Electrical connection to the strands was established by access through broken concrete covers at the end
of the box beams. In order to wet the beams, soaked burlap pieces were place over the beams. The
burlap pieces were then covered with a plastic tarp.
Figure A.24: Half-Cell measurement equipment and connection setup (Naito et al. 2010)
To assess the effectiveness of the half-cell potential method, the strand damage profile has been overlaid
on the half-cell contour for each beam. As shown in Figure A.24, the damage detected by visual
inspection was spread throughout a cracked region just above the centerline of the beam. The highly
cracked region shows voltage reading that indicate corrosion.

65
Figure A.25: Evaluation of corrosion detection ability of half-cell measurement (Naito et al. 2010)
The average half-cell reading tends to increase with the severity of damage. While the half-cell
measurement and the in situ strand corrosion damage were correlated, the coefficient of variation (COV)
was large: the COV values for different levels varied from 25% to 56%. Therefore, while half-cell
potential provides an indication of corrosion damage, it should not be explicitly applied to predict the
particular type of damage.
A.4.2 Linear Polarization Resistance (LPR)
LPR is a method to determine the instantaneous corrosion rate in metal. LPR was developed to enable
accurate assessment of the condition of the reinforced concrete structures. In LPR, steel is slightly
perturbed electrically from its equilibrium potential. This can be accomplished either potentiostatically,
by changing the potential by a fixed amount ∆E and monitoring the current decay ∆I after a fixed time,
or galvanostatically, by changing the current by affixed amount ∆I and monitoring the potential decay
after a fixed time. In both cases, conditions are selected in such a way that potential ∆E falls within
Stern-Geary range of 10-30 mV. Polarization resistance Rp is calculated by
Rp = ∆E/∆I.

66
The rate of corrosion, Icorr, is calculated as
Icorr= B/ Rp
where B is the Stern-Geary constant.
LPR measurements have been applied to post-tensioned tendon assemblies and compared to electro-
impedance spectroscopy (EIS) tests conducted on the same samples. The results are shown in Figure
A.25, and indicate good agreement between the two methods.
Figure A.26: Comparison of total Icorr estimated by EIS and LPR for (a) P and (b) S assemblies.
(Taveira et al. 2008)
A.4.3 Electro-Impedance Spectroscopy (EIS)
In this technique a small amount of alternating current (AC) with a particular frequency is applied to a
metal-electrolyte interface. Amplitude and phase shift data of the resulting current are measured to
calculate the impedance of the interface between concrete and steel. Impedance is a complex number
having a real part (resistance) and imaginary part (capacitance). Impedance is calculated for different
frequencies of AC. Real and imaginary parts of impedance are plotted for different frequencies as shown
in Figure A.26. An equivalent circuit can be defined with parameters (Rs, Rc & Cdl) as shown in Figure
A.26. Values of these parameters are adjusted to best fit the measured data. Selection of circuit
parameters depend on the nature of the data.
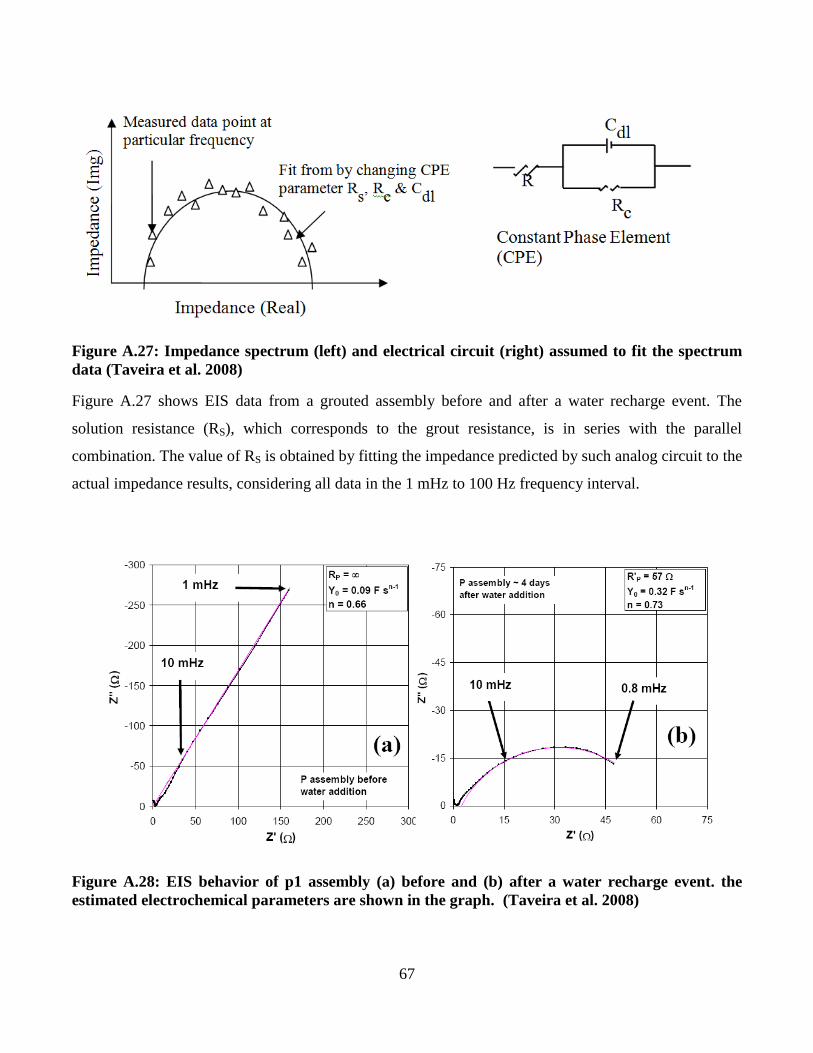
67
Figure A.27: Impedance spectrum (left) and electrical circuit (right) assumed to fit the spectrum
data (Taveira et al. 2008)
Figure A.27 shows EIS data from a grouted assembly before and after a water recharge event. The
solution resistance (RS), which corresponds to the grout resistance, is in series with the parallel
combination. The value of RS is obtained by fitting the impedance predicted by such analog circuit to the
actual impedance results, considering all data in the 1 mHz to 100 Hz frequency interval.
Figure A.28: EIS behavior of p1 assembly (a) before and (b) after a water recharge event. the
estimated electrochemical parameters are shown in the graph. (Taveira et al. 2008)
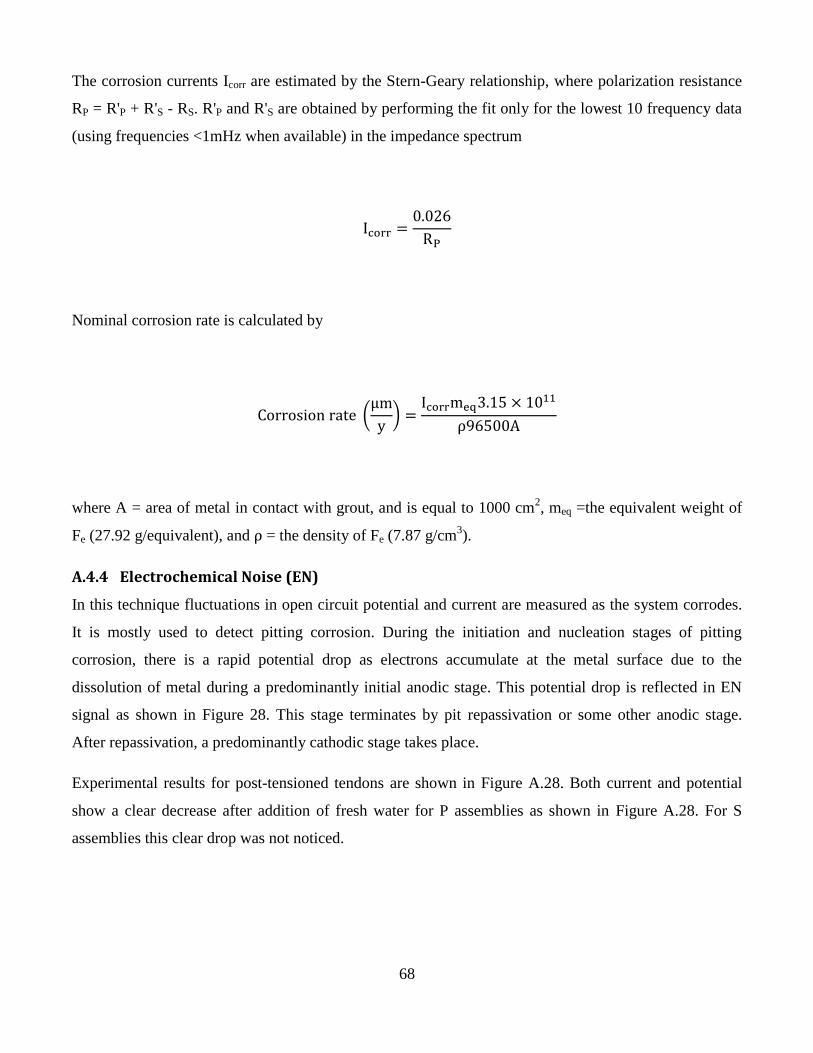
68
The corrosion currents Icorr are estimated by the Stern-Geary relationship, where polarization resistance
RP = R'P + R'S - RS. R'P and R'S are obtained by performing the fit only for the lowest 10 frequency data
(using frequencies <1mHz when available) in the impedance spectrum
Nominal corrosion rate is calculated by
(
)
where A = area of metal in contact with grout, and is equal to 1000 cm2, meq =the equivalent weight of
Fe (27.92 g/equivalent), and = the density of Fe (7.87 g/cm3).
A.4.4 Electrochemical Noise (EN)
In this technique fluctuations in open circuit potential and current are measured as the system corrodes.
It is mostly used to detect pitting corrosion. During the initiation and nucleation stages of pitting
corrosion, there is a rapid potential drop as electrons accumulate at the metal surface due to the
dissolution of metal during a predominantly initial anodic stage. This potential drop is reflected in EN
signal as shown in Figure 28. This stage terminates by pit repassivation or some other anodic stage.
After repassivation, a predominantly cathodic stage takes place.
Experimental results for post-tensioned tendons are shown in Figure A.28. Both current and potential
show a clear decrease after addition of fresh water for P assemblies as shown in Figure A.28. For S
assemblies this clear drop was not noticed.
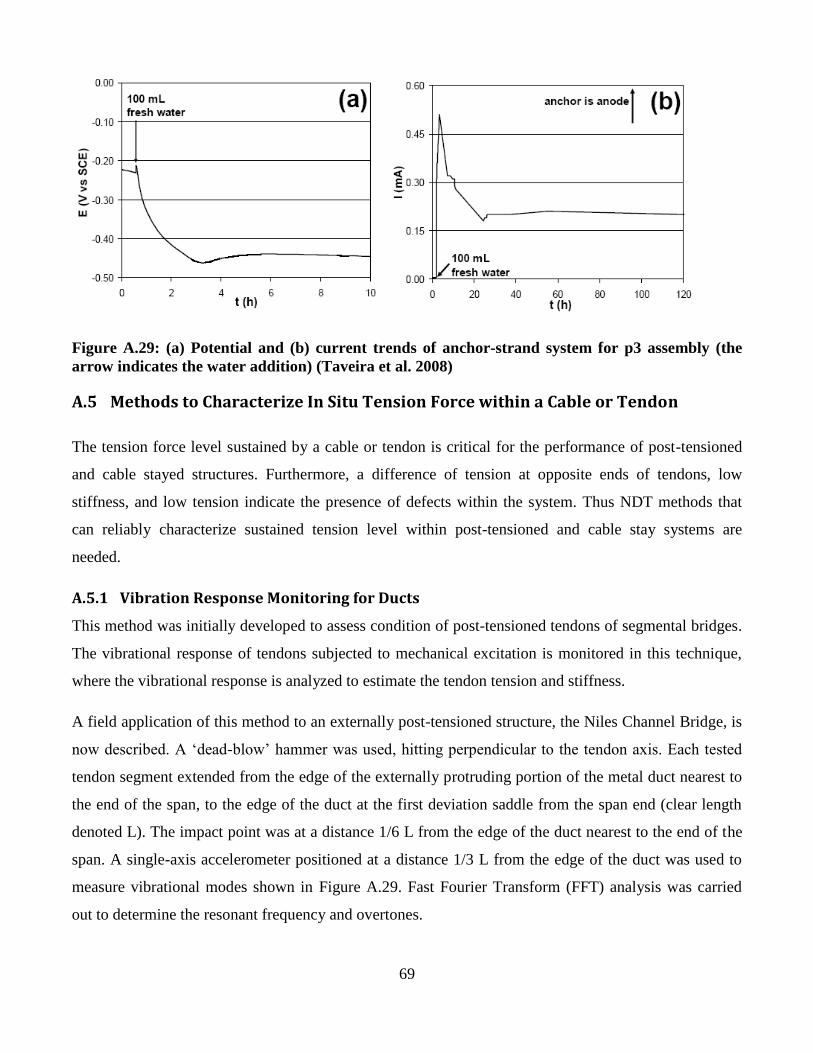
69
Figure A.29: (a) Potential and (b) current trends of anchor-strand system for p3 assembly (the
arrow indicates the water addition) (Taveira et al. 2008)
A.5 Methods to Characterize In Situ Tension Force within a Cable or Tendon
The tension force level sustained by a cable or tendon is critical for the performance of post-tensioned
and cable stayed structures. Furthermore, a difference of tension at opposite ends of tendons, low
stiffness, and low tension indicate the presence of defects within the system. Thus NDT methods that
can reliably characterize sustained tension level within post-tensioned and cable stay systems are
needed.
A.5.1 Vibration Response Monitoring for Ducts
This method was initially developed to assess condition of post-tensioned tendons of segmental bridges.
The vibrational response of tendons subjected to mechanical excitation is monitored in this technique,
where the vibrational response is analyzed to estimate the tendon tension and stiffness.
A field application of this method to an externally post-tensioned structure, the Niles Channel Bridge, is
now described. A ‘dead-blow’ hammer was used, hitting perpendicular to the tendon axis. Each tested
tendon segment extended from the edge of the externally protruding portion of the metal duct nearest to
the end of the span, to the edge of the duct at the first deviation saddle from the span end (clear length
denoted L). The impact point was at a distance 1/6 L from the edge of the duct nearest to the end of the
span. A single-axis accelerometer positioned at a distance 1/3 L from the edge of the duct was used to
measure vibrational modes shown in Figure A.29. Fast Fourier Transform (FFT) analysis was carried
out to determine the resonant frequency and overtones.
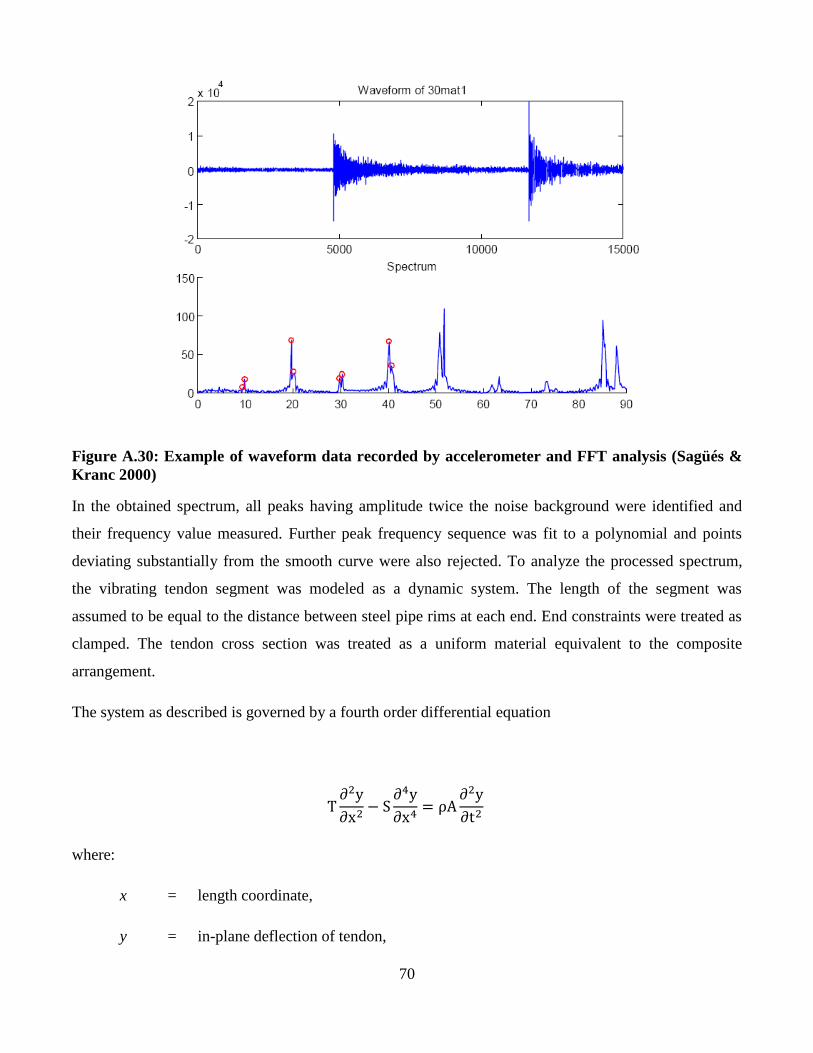
70
Figure A.30: Example of waveform data recorded by accelerometer and FFT analysis (Sagüés &
Kranc 2000)
In the obtained spectrum, all peaks having amplitude twice the noise background were identified and
their frequency value measured. Further peak frequency sequence was fit to a polynomial and points
deviating substantially from the smooth curve were also rejected. To analyze the processed spectrum,
the vibrating tendon segment was modeled as a dynamic system. The length of the segment was
assumed to be equal to the distance between steel pipe rims at each end. End constraints were treated as
clamped. The tendon cross section was treated as a uniform material equivalent to the composite
arrangement.
The system as described is governed by a fourth order differential equation
where:
x = length coordinate,
y = in-plane deflection of tendon,
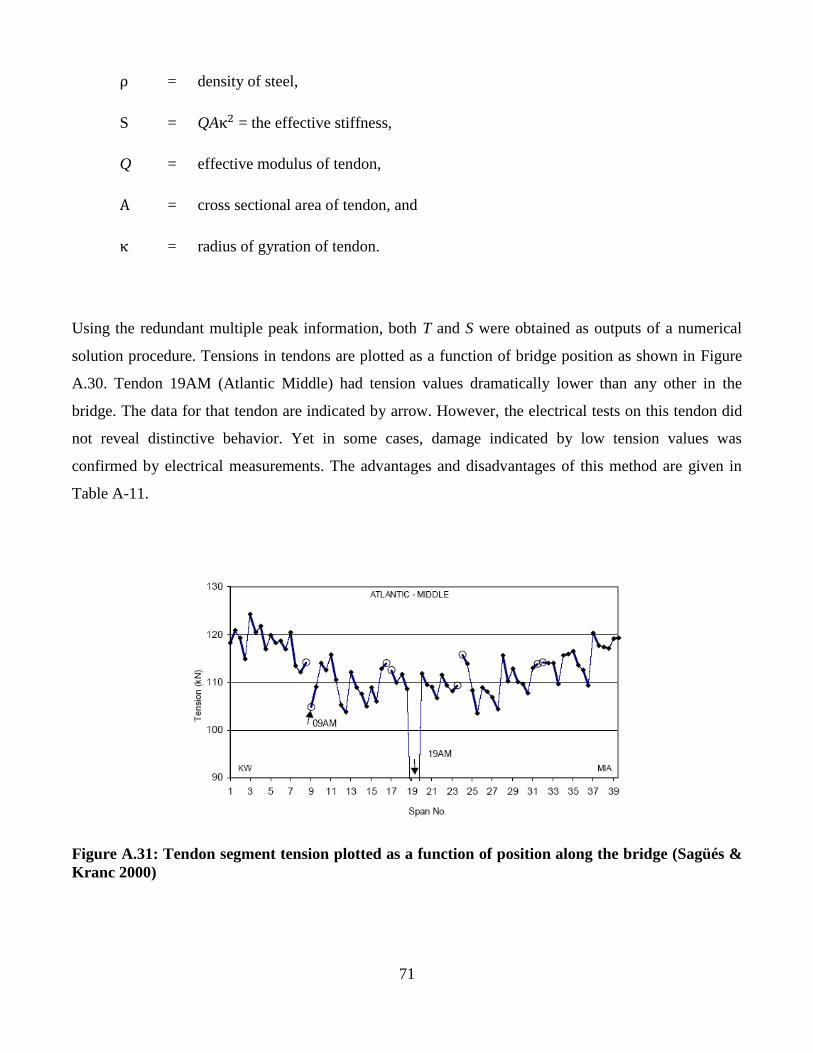
71
= density of steel,
S = QA = the effective stiffness,
Q = effective modulus of tendon,
= cross sectional area of tendon, and
= radius of gyration of tendon.
Using the redundant multiple peak information, both T and S were obtained as outputs of a numerical
solution procedure. Tensions in tendons are plotted as a function of bridge position as shown in Figure
A.30. Tendon 19AM (Atlantic Middle) had tension values dramatically lower than any other in the
bridge. The data for that tendon are indicated by arrow. However, the electrical tests on this tendon did
not reveal distinctive behavior. Yet in some cases, damage indicated by low tension values was
confirmed by electrical measurements. The advantages and disadvantages of this method are given in
Table A-11.
Figure A.31: Tendon segment tension plotted as a function of position along the bridge (Sagüés &
Kranc 2000)
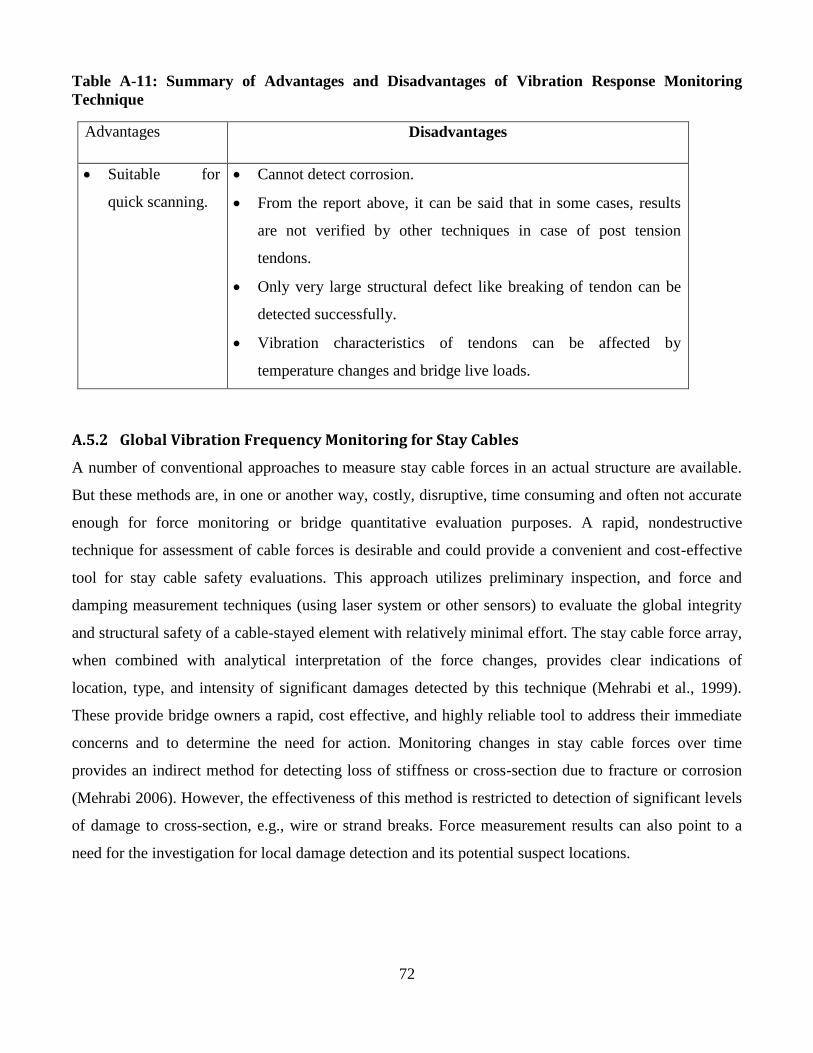
72
Table A-11: Summary of Advantages and Disadvantages of Vibration Response Monitoring
Technique
Advantages Disadvantages
Suitable for
quick scanning.
Cannot detect corrosion.
From the report above, it can be said that in some cases, results
are not verified by other techniques in case of post tension
tendons.
Only very large structural defect like breaking of tendon can be
detected successfully.
Vibration characteristics of tendons can be affected by
temperature changes and bridge live loads.
A.5.2 Global Vibration Frequency Monitoring for Stay Cables
A number of conventional approaches to measure stay cable forces in an actual structure are available.
But these methods are, in one or another way, costly, disruptive, time consuming and often not accurate
enough for force monitoring or bridge quantitative evaluation purposes. A rapid, nondestructive
technique for assessment of cable forces is desirable and could provide a convenient and cost-effective
tool for stay cable safety evaluations. This approach utilizes preliminary inspection, and force and
damping measurement techniques (using laser system or other sensors) to evaluate the global integrity
and structural safety of a cable-stayed element with relatively minimal effort. The stay cable force array,
when combined with analytical interpretation of the force changes, provides clear indications of
location, type, and intensity of significant damages detected by this technique (Mehrabi et al., 1999).
These provide bridge owners a rapid, cost effective, and highly reliable tool to address their immediate
concerns and to determine the need for action. Monitoring changes in stay cable forces over time
provides an indirect method for detecting loss of stiffness or cross-section due to fracture or corrosion
(Mehrabi 2006). However, the effectiveness of this method is restricted to detection of significant levels
of damage to cross-section, e.g., wire or strand breaks. Force measurement results can also point to a
need for the investigation for local damage detection and its potential suspect locations.
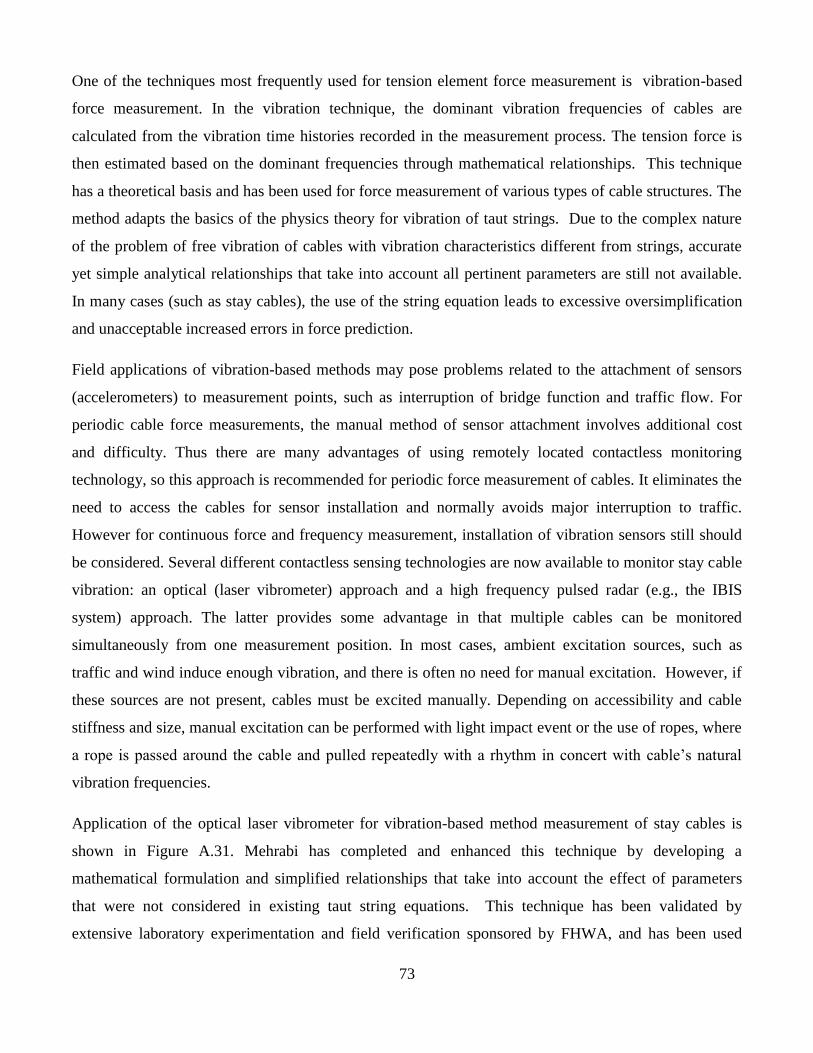
73
One of the techniques most frequently used for tension element force measurement is vibration-based
force measurement. In the vibration technique, the dominant vibration frequencies of cables are
calculated from the vibration time histories recorded in the measurement process. The tension force is
then estimated based on the dominant frequencies through mathematical relationships. This technique
has a theoretical basis and has been used for force measurement of various types of cable structures. The
method adapts the basics of the physics theory for vibration of taut strings. Due to the complex nature
of the problem of free vibration of cables with vibration characteristics different from strings, accurate
yet simple analytical relationships that take into account all pertinent parameters are still not available.
In many cases (such as stay cables), the use of the string equation leads to excessive oversimplification
and unacceptable increased errors in force prediction.
Field applications of vibration-based methods may pose problems related to the attachment of sensors
(accelerometers) to measurement points, such as interruption of bridge function and traffic flow. For
periodic cable force measurements, the manual method of sensor attachment involves additional cost
and difficulty. Thus there are many advantages of using remotely located contactless monitoring
technology, so this approach is recommended for periodic force measurement of cables. It eliminates the
need to access the cables for sensor installation and normally avoids major interruption to traffic.
However for continuous force and frequency measurement, installation of vibration sensors still should
be considered. Several different contactless sensing technologies are now available to monitor stay cable
vibration: an optical (laser vibrometer) approach and a high frequency pulsed radar (e.g., the IBIS
system) approach. The latter provides some advantage in that multiple cables can be monitored
simultaneously from one measurement position. In most cases, ambient excitation sources, such as
traffic and wind induce enough vibration, and there is often no need for manual excitation. However, if
these sources are not present, cables must be excited manually. Depending on accessibility and cable
stiffness and size, manual excitation can be performed with light impact event or the use of ropes, where
a rope is passed around the cable and pulled repeatedly with a rhythm in concert with cable’s natural
vibration frequencies.
Application of the optical laser vibrometer for vibration-based method measurement of stay cables is
shown in Figure A.31. Mehrabi has completed and enhanced this technique by developing a
mathematical formulation and simplified relationships that take into account the effect of parameters
that were not considered in existing taut string equations. This technique has been validated by
extensive laboratory experimentation and field verification sponsored by FHWA, and has been used
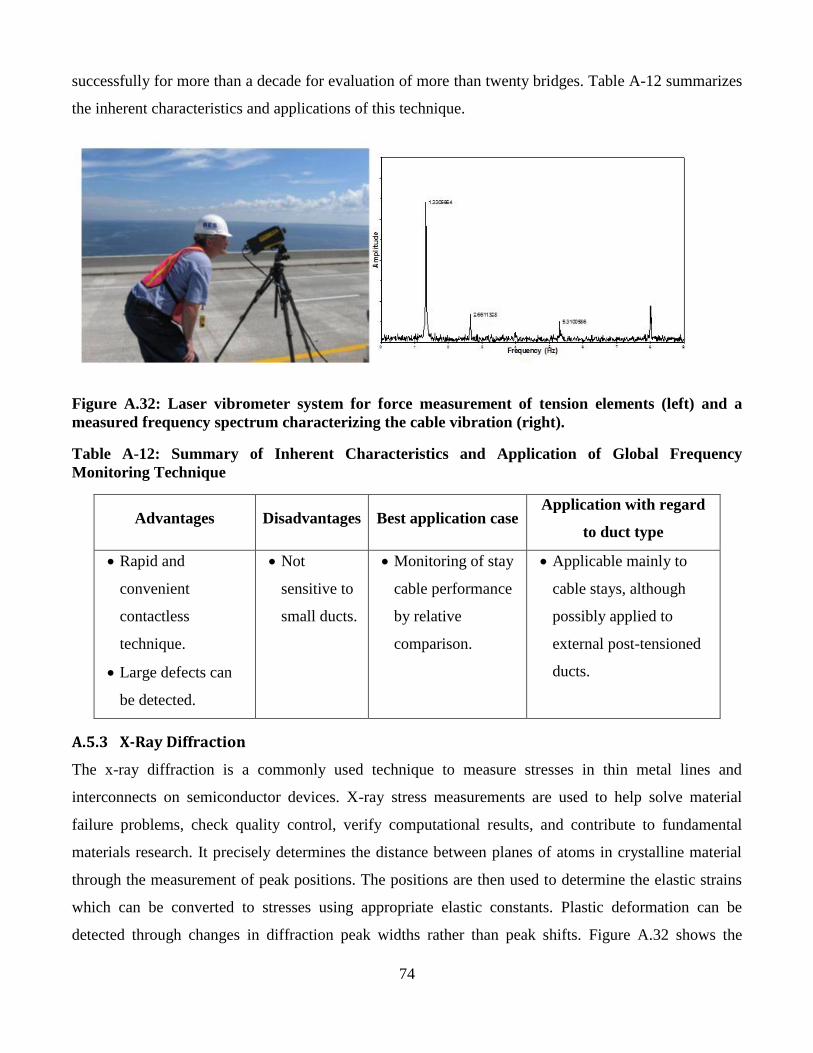
74
successfully for more than a decade for evaluation of more than twenty bridges. Table A-12 summarizes
the inherent characteristics and applications of this technique.
Figure A.32: Laser vibrometer system for force measurement of tension elements (left) and a
measured frequency spectrum characterizing the cable vibration (right).
Table A-12: Summary of Inherent Characteristics and Application of Global Frequency
Monitoring Technique
Advantages Disadvantages Best application case Application with regard
to duct type
Rapid and
convenient
contactless
technique.
Large defects can
be detected.
Not
sensitive to
small ducts.
Monitoring of stay
cable performance
by relative
comparison.
Applicable mainly to
cable stays, although
possibly applied to
external post-tensioned
ducts.
A.5.3 X-Ray Diffraction
The x-ray diffraction is a commonly used technique to measure stresses in thin metal lines and
interconnects on semiconductor devices. X-ray stress measurements are used to help solve material
failure problems, check quality control, verify computational results, and contribute to fundamental
materials research. It precisely determines the distance between planes of atoms in crystalline material
through the measurement of peak positions. The positions are then used to determine the elastic strains
which can be converted to stresses using appropriate elastic constants. Plastic deformation can be
detected through changes in diffraction peak widths rather than peak shifts. Figure A.32 shows the
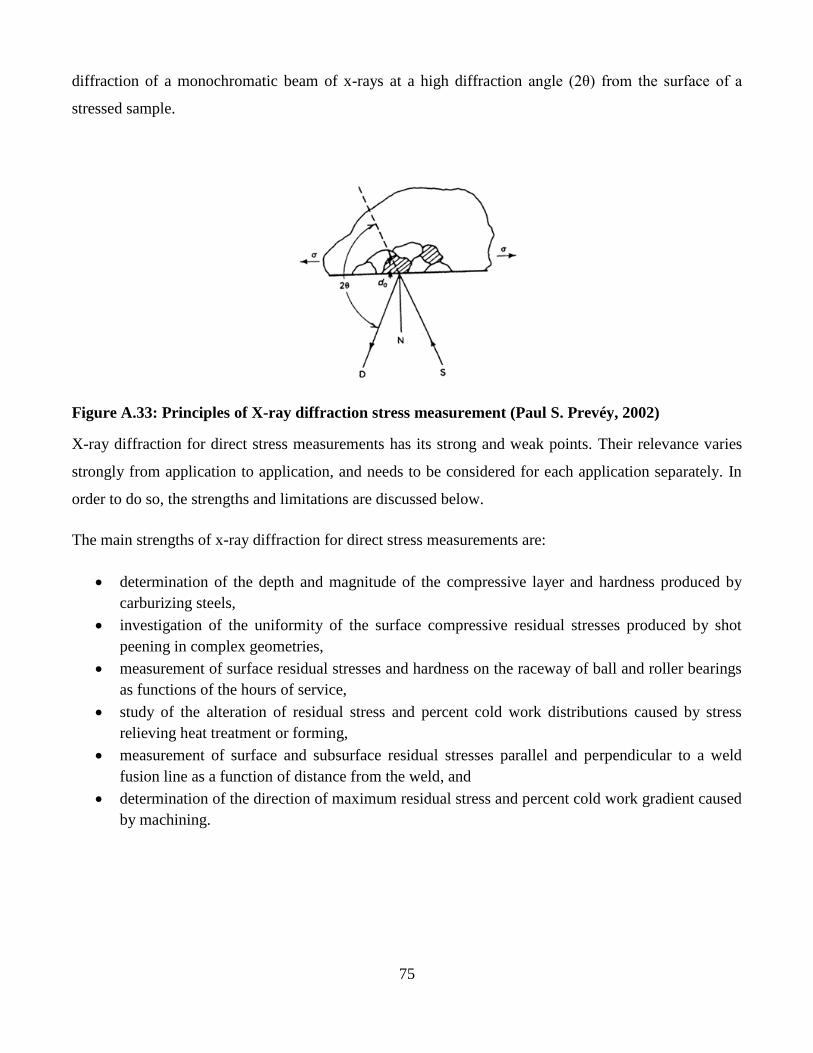
75
diffraction of a monochromatic beam of x-rays at a high diffraction angle (2θ) from the surface of a
stressed sample.
Figure A.33: Principles of X-ray diffraction stress measurement (Paul S. Prevéy, 2002)
X-ray diffraction for direct stress measurements has its strong and weak points. Their relevance varies
strongly from application to application, and needs to be considered for each application separately. In
order to do so, the strengths and limitations are discussed below.
The main strengths of x-ray diffraction for direct stress measurements are:
determination of the depth and magnitude of the compressive layer and hardness produced by
carburizing steels,
investigation of the uniformity of the surface compressive residual stresses produced by shot
peening in complex geometries,
measurement of surface residual stresses and hardness on the raceway of ball and roller bearings
as functions of the hours of service,
study of the alteration of residual stress and percent cold work distributions caused by stress
relieving heat treatment or forming,
measurement of surface and subsurface residual stresses parallel and perpendicular to a weld
fusion line as a function of distance from the weld, and
determination of the direction of maximum residual stress and percent cold work gradient caused
by machining.
76
A.5.4 Direct Prestress Measurement
A direct prestress measurement technique was first introduced by Hansen and Overman in 1980s at
Construction technology Laboratories, where the P.I. was employed from 1985 through 1989. In the
1990’s, the P.I. conducted (Azizinamini, A., Keeler, B, Rohde, J., Mehrabi, A, (1996)) research and
developed the direct stress measurement nondestructive testing method. He applied it to prestressed
girders to directly measure the available prestress in existing girders. The accuracy of the method is
excellent.
This technique can accurately measure the available prestress forces in the strands. Its effectiveness in
determining the prestress force measurement and making conclusions about corrosion activities in
embedded steel elements, such as strands in duct, has not been investigated. In the opinion of the P.I.,
this technique could be part of a hybrid approach in corrosion inspection strategy. It is feasible to modify
the technique and apply it to stays, ropes, and external tendons. This method, in its modified and new
form, has been used to accurately measure (within 3%) the available prestress in existing prestressed
girders. The following section provides an overview of the direct force measurement technique, its
development and application.
The method is based on an investigation of the state of stress around a hole in a prestressed concrete
member. In this method, a cylindrical hole is drilled in the bottom flange of a prestressed girder
(assumed to be under compression), as shown in Figure A.33.
Figure A.34: Sectional view of a prestressed concrete girder (Azizinamini et al. 1996)
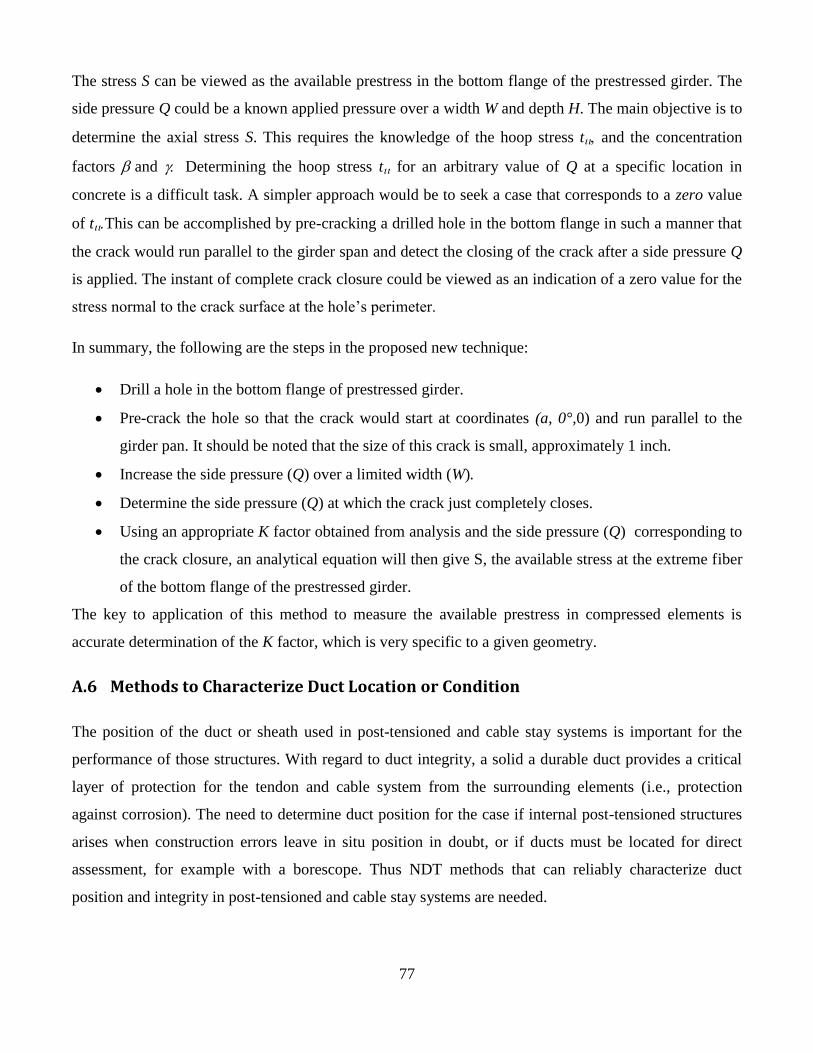
77
The stress S can be viewed as the available prestress in the bottom flange of the prestressed girder. The
side pressure Q could be a known applied pressure over a width W and depth H. The main objective is to
determine the axial stress S. This requires the knowledge of the hoop stress t and the concentration
factors and Determining the hoop stress t for an arbitrary value of Q at a specific location in
concrete is a difficult task. A simpler approach would be to seek a case that corresponds to a zero value
of tThis can be accomplished by pre-cracking a drilled hole in the bottom flange in such a manner that
the crack would run parallel to the girder span and detect the closing of the crack after a side pressure Q
is applied. The instant of complete crack closure could be viewed as an indication of a zero value for the
stress normal to the crack surface at the hole’s perimeter.
In summary, the following are the steps in the proposed new technique:
Drill a hole in the bottom flange of prestressed girder.
Pre-crack the hole so that the crack would start at coordinates (a, 0°,0) and run parallel to the
girder pan. It should be noted that the size of this crack is small, approximately 1 inch.
Increase the side pressure (Q) over a limited width (W).
Determine the side pressure (Q) at which the crack just completely closes.
Using an appropriate K factor obtained from analysis and the side pressure (Q) corresponding to
the crack closure, an analytical equation will then give S, the available stress at the extreme fiber
of the bottom flange of the prestressed girder.
The key to application of this method to measure the available prestress in compressed elements is
accurate determination of the K factor, which is very specific to a given geometry.
A.6 Methods to Characterize Duct Location or Condition
The position of the duct or sheath used in post-tensioned and cable stay systems is important for the
performance of those structures. With regard to duct integrity, a solid a durable duct provides a critical
layer of protection for the tendon and cable system from the surrounding elements (i.e., protection
against corrosion). The need to determine duct position for the case if internal post-tensioned structures
arises when construction errors leave in situ position in doubt, or if ducts must be located for direct
assessment, for example with a borescope. Thus NDT methods that can reliably characterize duct
position and integrity in post-tensioned and cable stay systems are needed.
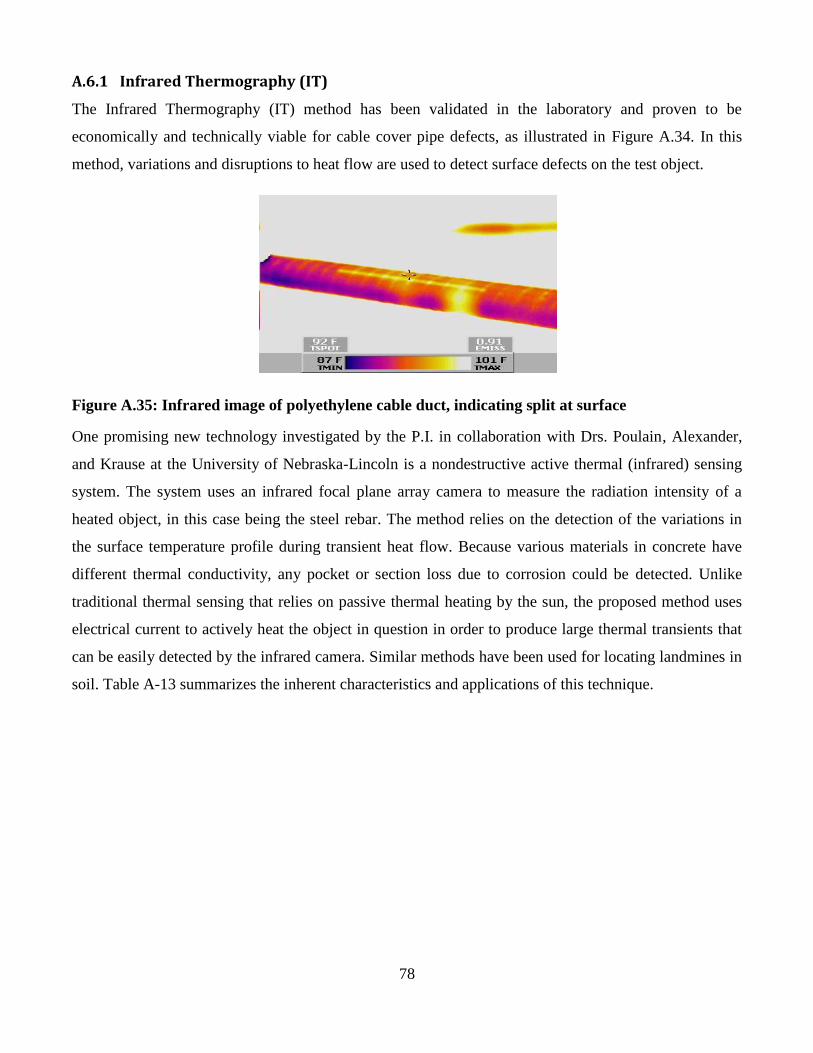
78
A.6.1 Infrared Thermography (IT)
The Infrared Thermography (IT) method has been validated in the laboratory and proven to be
economically and technically viable for cable cover pipe defects, as illustrated in Figure A.34. In this
method, variations and disruptions to heat flow are used to detect surface defects on the test object.
Figure A.35: Infrared image of polyethylene cable duct, indicating split at surface
One promising new technology investigated by the P.I. in collaboration with Drs. Poulain, Alexander,
and Krause at the University of Nebraska-Lincoln is a nondestructive active thermal (infrared) sensing
system. The system uses an infrared focal plane array camera to measure the radiation intensity of a
heated object, in this case being the steel rebar. The method relies on the detection of the variations in
the surface temperature profile during transient heat flow. Because various materials in concrete have
different thermal conductivity, any pocket or section loss due to corrosion could be detected. Unlike
traditional thermal sensing that relies on passive thermal heating by the sun, the proposed method uses
electrical current to actively heat the object in question in order to produce large thermal transients that
can be easily detected by the infrared camera. Similar methods have been used for locating landmines in
soil. Table A-13 summarizes the inherent characteristics and applications of this technique.
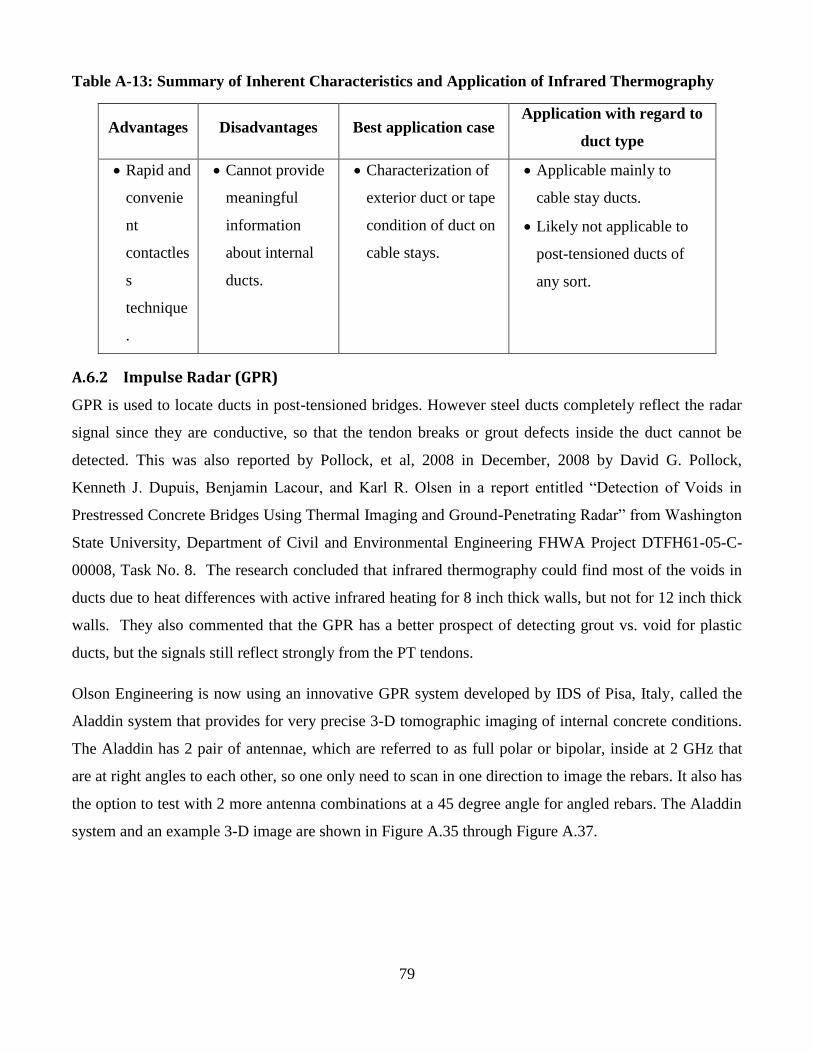
79
Table A-13: Summary of Inherent Characteristics and Application of Infrared Thermography
Advantages Disadvantages Best application case Application with regard to
duct type
Rapid and
convenie
nt
contactles
s
technique
.
Cannot provide
meaningful
information
about internal
ducts.
Characterization of
exterior duct or tape
condition of duct on
cable stays.
Applicable mainly to
cable stay ducts.
Likely not applicable to
post-tensioned ducts of
any sort.
A.6.2 Impulse Radar (GPR)
GPR is used to locate ducts in post-tensioned bridges. However steel ducts completely reflect the radar
signal since they are conductive, so that the tendon breaks or grout defects inside the duct cannot be
detected. This was also reported by Pollock, et al, 2008 in December, 2008 by David G. Pollock,
Kenneth J. Dupuis, Benjamin Lacour, and Karl R. Olsen in a report entitled “Detection of Voids in
Prestressed Concrete Bridges Using Thermal Imaging and Ground-Penetrating Radar” from Washington
State University, Department of Civil and Environmental Engineering FHWA Project DTFH61-05-C-
00008, Task No. 8. The research concluded that infrared thermography could find most of the voids in
ducts due to heat differences with active infrared heating for 8 inch thick walls, but not for 12 inch thick
walls. They also commented that the GPR has a better prospect of detecting grout vs. void for plastic
ducts, but the signals still reflect strongly from the PT tendons.
Olson Engineering is now using an innovative GPR system developed by IDS of Pisa, Italy, called the
Aladdin system that provides for very precise 3-D tomographic imaging of internal concrete conditions.
The Aladdin has 2 pair of antennae, which are referred to as full polar or bipolar, inside at 2 GHz that
are at right angles to each other, so one only need to scan in one direction to image the rebars. It also has
the option to test with 2 more antenna combinations at a 45 degree angle for angled rebars. The Aladdin
system and an example 3-D image are shown in Figure A.35 through Figure A.37.
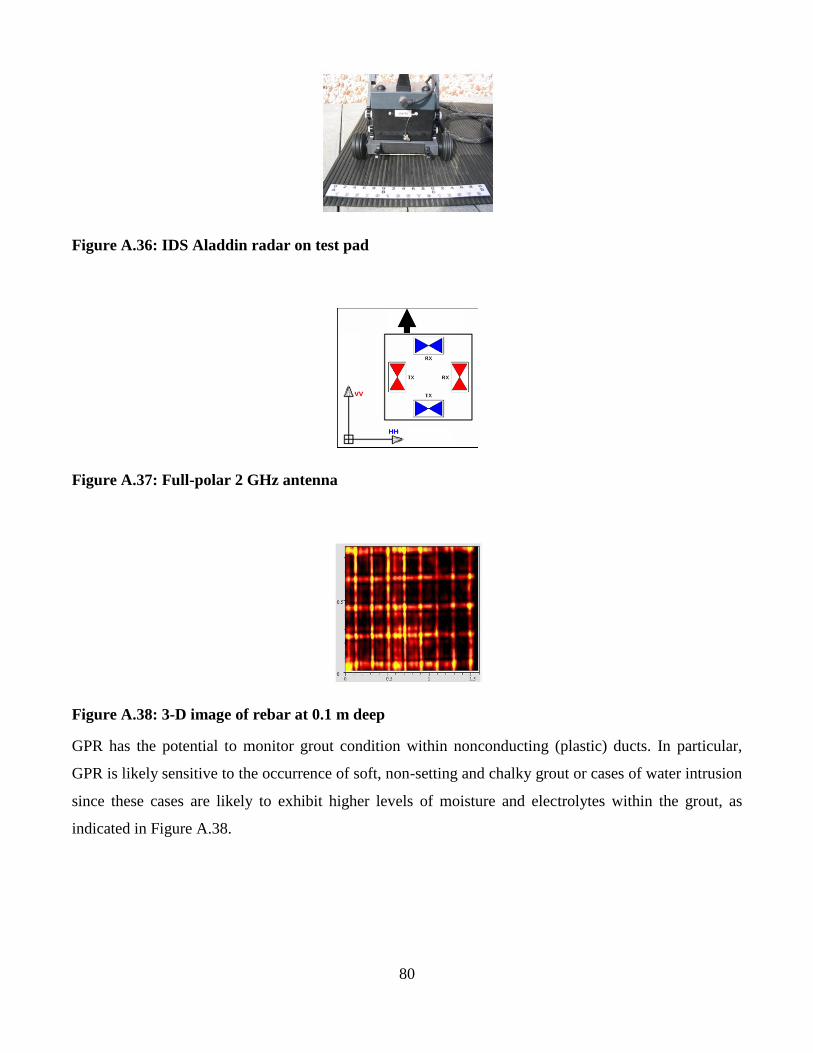
80
Figure A.36: IDS Aladdin radar on test pad
Figure A.37: Full-polar 2 GHz antenna
Figure A.38: 3-D image of rebar at 0.1 m deep
GPR has the potential to monitor grout condition within nonconducting (plastic) ducts. In particular,
GPR is likely sensitive to the occurrence of soft, non-setting and chalky grout or cases of water intrusion
since these cases are likely to exhibit higher levels of moisture and electrolytes within the grout, as
indicated in Figure A.38.
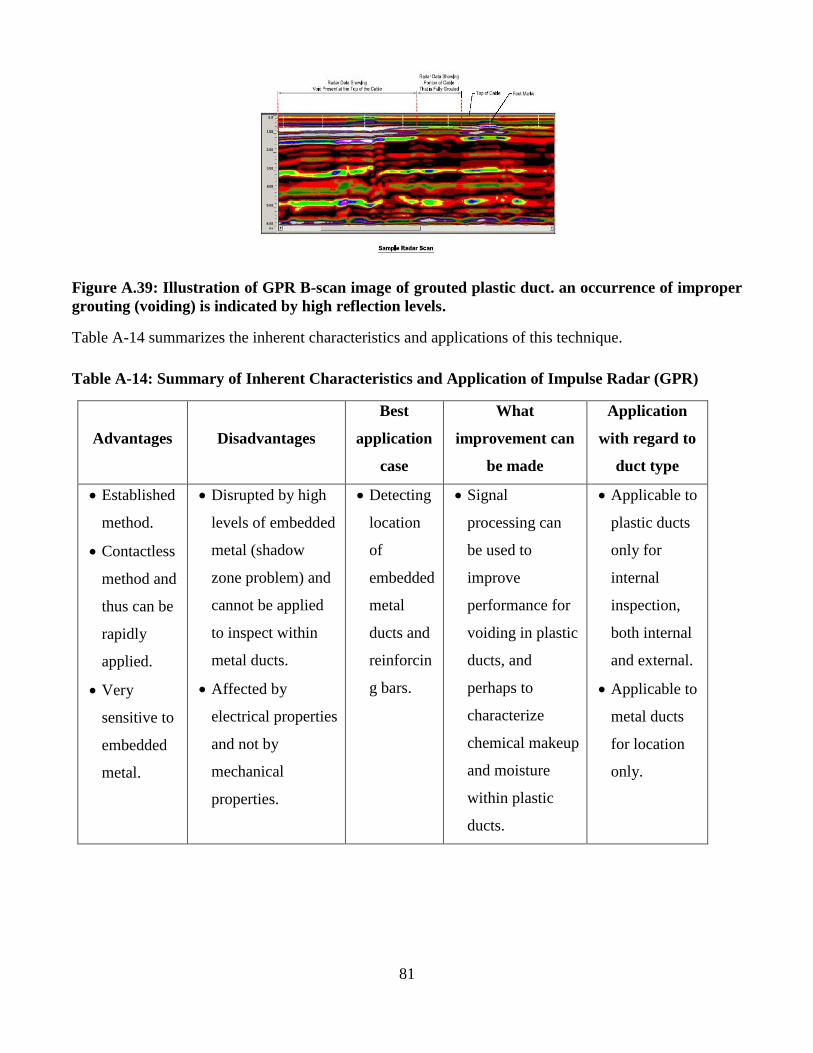
81
Figure A.39: Illustration of GPR B-scan image of grouted plastic duct. an occurrence of improper
grouting (voiding) is indicated by high reflection levels.
Table A-14 summarizes the inherent characteristics and applications of this technique.
Table A-14: Summary of Inherent Characteristics and Application of Impulse Radar (GPR)
Advantages Disadvantages
Best
application
case
What
improvement can
be made
Application
with regard to
duct type
Established
method.
Contactless
method and
thus can be
rapidly
applied.
Very
sensitive to
embedded
metal.
Disrupted by high
levels of embedded
metal (shadow
zone problem) and
cannot be applied
to inspect within
metal ducts.
Affected by
electrical properties
and not by
mechanical
properties.
Detecting
location
of
embedded
metal
ducts and
reinforcin
g bars.
Signal
processing can
be used to
improve
performance for
voiding in plastic
ducts, and
perhaps to
characterize
chemical makeup
and moisture
within plastic
ducts.
Applicable to
plastic ducts
only for
internal
inspection,
both internal
and external.
Applicable to
metal ducts
for location
only.

82
Appendix B: List of Survey Questions and
Summary of Findings

83
Questions
1- Do you have any bridges with need for corrosion inspection, associate with embedded steel strands or
cable stay?
Yes ___ No______
a. If yes, please identify the bridge types from the list stated below
__ Box beam bridges __Bulb-tee or I-beam bridges
__Double-stemmed beam bridges __Voided slab beam bridges
__ Post tension girder bridges __ Segmental bridges
__Cable stayed bridges __ Suspension bridges
__ Substructure elements
2- Have you had any major corrosion problems and related challenges in relation to the above?
__Yes __No
a. If yes, please briefly state type of problems or challenges
3- Have you carried out any research projects to develop methodology or approaches for detection of
corrosion of prestressed – post-tensioned strands or stays in bridges?
__ Yes __ No
a. If yes, please provide a reference or a contact name and phone number for us to contact
4- Have you used any non destructive evaluation tools for inspecting prestressed or post-tensioned strands
or stays in bridges either during biennial inspections or as part of special inspections?
__Yes __No
a. If yes, please provide a reference or a contact name and phone number for us to contact
5- Florida Department of Transportation in association with Florida International University has initiated a
research project to develop a roadmap for enhancing corrosion detection. Are you interested to be kept
informed of this project, its outcome, tools etc?
___ Yes ___ No
a. If yes, please provided a name and contact address (email, address and phone number) for us to
contact

84
Please send form back to:
Atorod Azizinamini, Ph.D., P.E.
Chair and Professor
Department of Civil and Environmental Engineering
Florida International University
10555 W. Flagler Street, EC 3677
Miami, FL 33174
Tel: (305) 348-2824
Fax: (305) 348-2802
E-Mail: [email protected]

85
Following are some of the excerpts from the May 2011 survey conducted by FIU.
The map shown in Figure B-1 identifies the 27 states that responded to the survey.
Figure B.1: Participation in survey (green = participated; white = not participated)
Out of the 27 responding states, 23 states were having bridges with need for corrosion assessment of
post-tensioning and stay cables. Figure B-2 shows the states having bridges with need for corrosion
inspection, associate with embedded steel strands or cable stay.
Figure B.2: States having bridges with need for condition assessment (green = yes; red = no; white
= not participated)
Survey questionnaire also provided information for identifying types of bridges needing condition
assessment. Figure B-3 shows the different types of bridges and the number of states that could use NDE
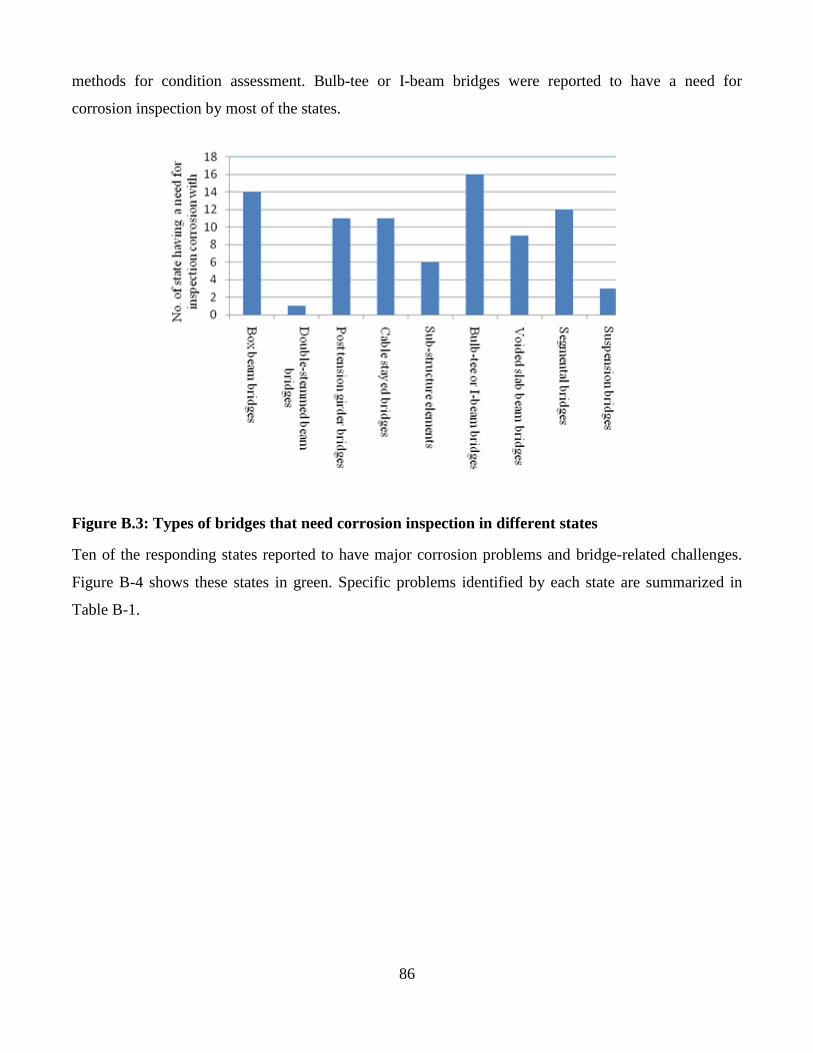
86
methods for condition assessment. Bulb-tee or I-beam bridges were reported to have a need for
corrosion inspection by most of the states.
Figure B.3: Types of bridges that need corrosion inspection in different states
Ten of the responding states reported to have major corrosion problems and bridge-related challenges.
Figure B-4 shows these states in green. Specific problems identified by each state are summarized in
Table B-1.
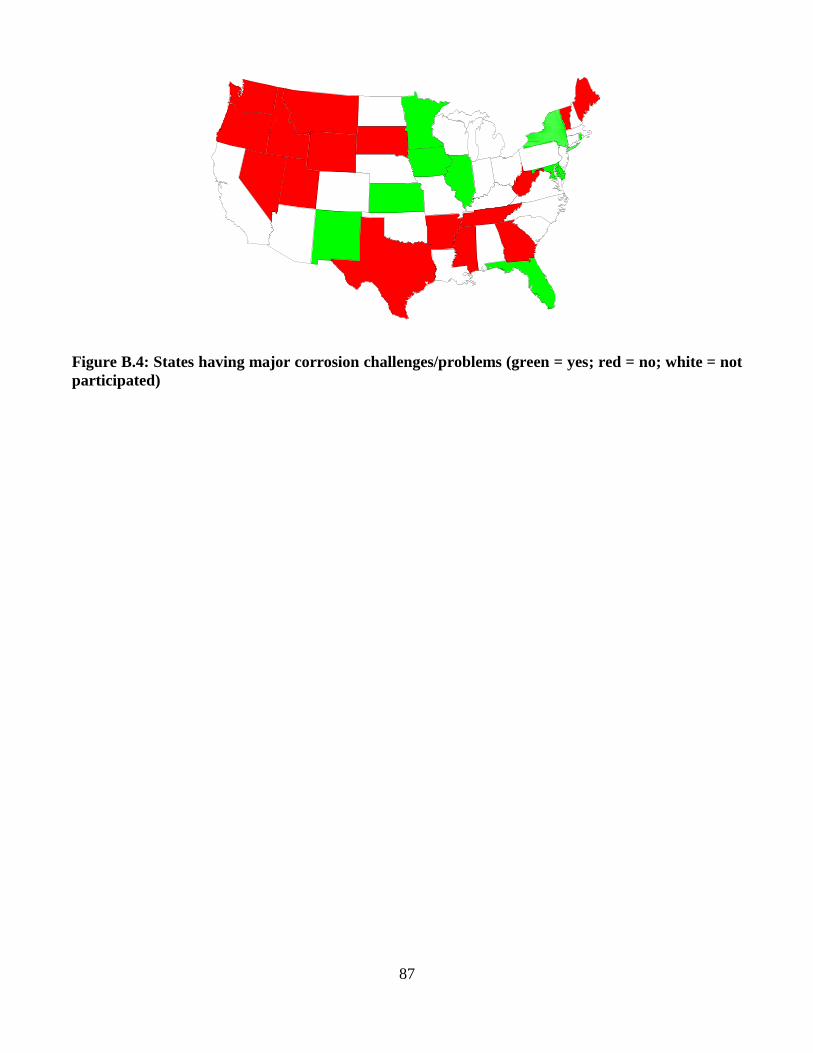
87
Figure B.4: States having major corrosion challenges/problems (green = yes; red = no; white = not
participated)
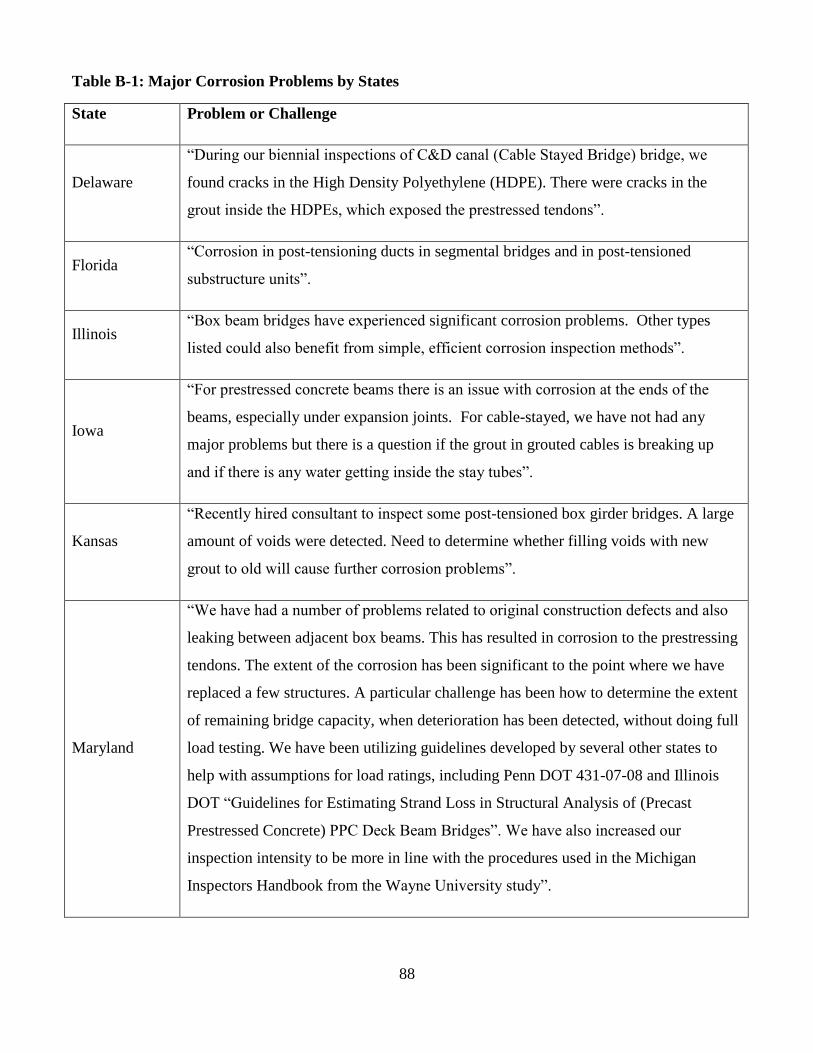
88
Table B-1: Major Corrosion Problems by States
State Problem or Challenge
Delaware
“During our biennial inspections of C&D canal (Cable Stayed Bridge) bridge, we
found cracks in the High Density Polyethylene (HDPE). There were cracks in the
grout inside the HDPEs, which exposed the prestressed tendons”.
Florida “Corrosion in post-tensioning ducts in segmental bridges and in post-tensioned
substructure units”.
Illinois “Box beam bridges have experienced significant corrosion problems. Other types
listed could also benefit from simple, efficient corrosion inspection methods”.
Iowa
“For prestressed concrete beams there is an issue with corrosion at the ends of the
beams, especially under expansion joints. For cable-stayed, we have not had any
major problems but there is a question if the grout in grouted cables is breaking up
and if there is any water getting inside the stay tubes”.
Kansas
“Recently hired consultant to inspect some post-tensioned box girder bridges. A large
amount of voids were detected. Need to determine whether filling voids with new
grout to old will cause further corrosion problems”.
Maryland
“We have had a number of problems related to original construction defects and also
leaking between adjacent box beams. This has resulted in corrosion to the prestressing
tendons. The extent of the corrosion has been significant to the point where we have
replaced a few structures. A particular challenge has been how to determine the extent
of remaining bridge capacity, when deterioration has been detected, without doing full
load testing. We have been utilizing guidelines developed by several other states to
help with assumptions for load ratings, including Penn DOT 431-07-08 and Illinois
DOT “Guidelines for Estimating Strand Loss in Structural Analysis of (Precast
Prestressed Concrete) PPC Deck Beam Bridges”. We have also increased our
inspection intensity to be more in line with the procedures used in the Michigan
Inspectors Handbook from the Wayne University study”.
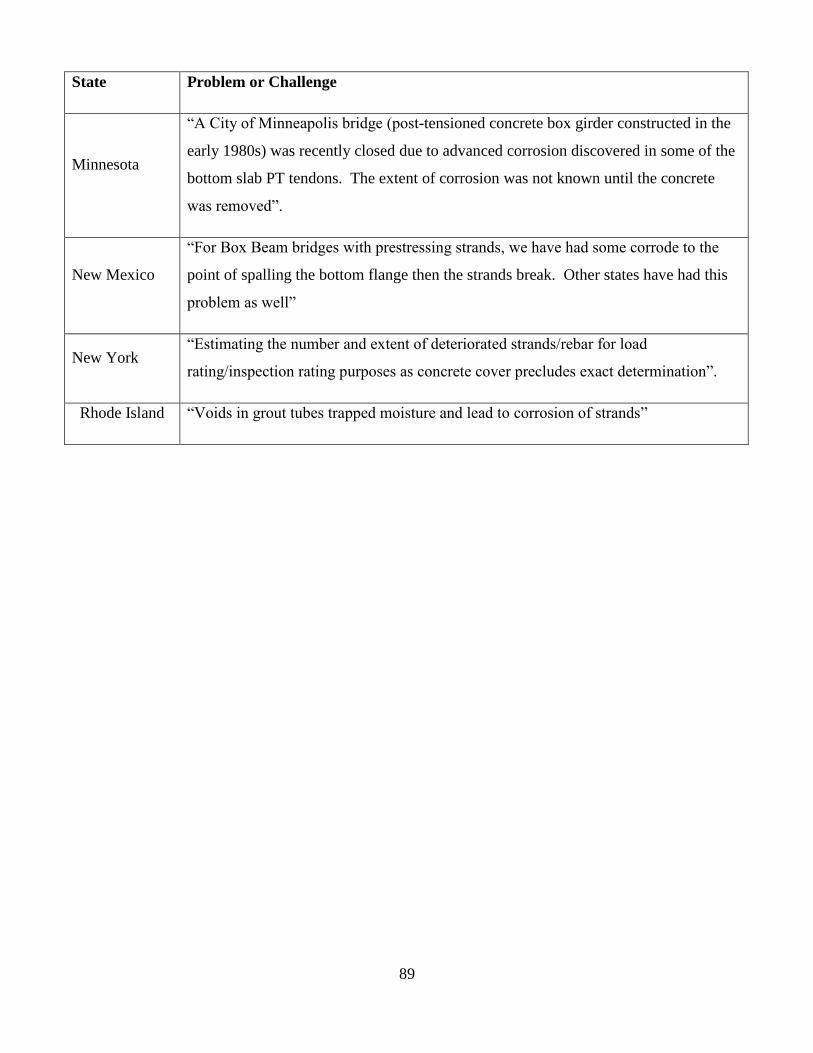
89
State Problem or Challenge
Minnesota
“A City of Minneapolis bridge (post-tensioned concrete box girder constructed in the
early 1980s) was recently closed due to advanced corrosion discovered in some of the
bottom slab PT tendons. The extent of corrosion was not known until the concrete
was removed”.
New Mexico
“For Box Beam bridges with prestressing strands, we have had some corrode to the
point of spalling the bottom flange then the strands break. Other states have had this
problem as well”
New York “Estimating the number and extent of deteriorated strands/rebar for load
rating/inspection rating purposes as concrete cover precludes exact determination”.
Rhode Island “Voids in grout tubes trapped moisture and lead to corrosion of strands”

90
Appendix C: Brief Summary of Agenda
and Findings from International
Workshop Held on October 27 and 28,
2011, at FIU

91
International Workshop
Nondestructive Testing Techniques for Detecting Corrosion or Factors Causing
Corrosion
In order to develop a roadmap for enhancing the detection of corrosion in steel strands in existing post-
tensioned bridges a workshop was organized at Florida International University, in Miami, Florida. The
objective of workshop was to review the latest technologies worldwide in various engineering fields and
applicable to bridges and developing a roadmap for future. The workshop was two days long from
Thursday October 27 (8:00 a.m. to 5:00 p.m.) to Friday October 28 (8:00 a.m. to noon), 2011. Workshop
was attended by experts from several countries.
The main agenda for the workshop was to:
a) Evaluate the available methodologies for detecting corrosion in post-tensioned bridges
b) Identify the technologies that are used in other engineering field, with promise for application in
bridge engineering, with or without additional research
c) Develop a consensus for future research direction
Complete agenda of the work shop was as follows
Thursday, October 27
FIU, Modesto A. Maidique Campus (MMC), 11200 S.W. 8th Street, Miami, Florida 33199
College of Business Complex, Room 300 (CBC 300)
8:00 to 8:10 a.m. Welcome – Atorod Azizinamini, FIU
Richard Kerr, FDOT
8:10 to 9:00 a.m. History of Corrosion Challenges in Florida
9:00 to 9:45 a.m. FDOT Corrosion Research- Past to Present
9:45 to 10:00 a.m. Break

92
10:00 to 10:30 a.m. Investigation of External Post-tensioning Tendons on a Segmental Bridge-
Jim Jacobsen, FDOT
10:30 – 11:00 ASBI – Corrosion- State of the practice in segmental post-tensioned
concrete bridges– Randy Cox
11:00 – 11:30 a.m. Current FDOT research project- Status and Workshop objectives-
Azizinamini, Ph.D.
11:30 – Noon Various NDT methods identified within current FDOT project – Larry
Olson
Noon- 1:00 p.m. Lunch
1:00 p.m. to 1:30 Radar Imaging- New Approach – Stavros Georgakopoulos, FIU
1:30 p.m. to 2:00 NASA Experience with Corrosion Detection Technologies- Luz Calle
2:00 p.m. to 2:30 Corrosion Detection- Frank Papworth- State of practice in Australia
2:30 p.m. to 3:15 Corrosion Detection- Horst Scheel- State of practice in Germany
3:15 p.m. – 3:30 Break
3:30 p.m. to 4:10 Corrosion Detection- Gnägi, Adrian- State of practice in Switzerland
4:10 p.m. to 4:40 Nondestructive testing methods- John Popovics- University of Illinois-
Urbana
4:40 p.m. to 5:00 p.m. Technologies to identify hidden elements

93
Friday Oct 28, 2011
8:00 a.m. to 9:00 Open Discussion- What Should we Consider- Developing consensus on
elements of effective inspection approaches for corrosion- Objective of
this segment of the workshop is to identify the elements of an effective
inspection approaches for detecting corrosion. Discussion will concentrate
on existing structure. However, steps that could be taken for new
structures will also be discussed.
9:00 a.m. to 10:00 Open discussion – What are Out There- Identifying promising
technologies within other industry- The objective of this segment of the
workshop is to brainstorm technologies and approaches used in other
industries that as is or with modification could have application for
developing an enhanced inspection methodologies
10:00 a.m. to 10:15 Break
10:15 to 11:00 Open Discussion- Let’s be Specific- Developing consensus on promising
technologies that could be utilized, as is, or with modifications, within
effective inspection approaches for corrosion. Elements of an effective
inspection approaches, will require utilizing nondestructive testing. This
segment of the workshop will concentrate on nondestructive techniques
that could be utilized within effective inspection strategies, their
limitation, additional work that should be conducted to enhance their
effectiveness, etc.

94
11:00 a.m. to Noon Open Discussion- Let’s put it All Together- Identifying elements of
roadmap for developing effective inspection approaches. This segment of
the workshop will concentrate on summarizing the entire outcome of the
workshop and developing a roadmap for future.
Noon- 12:30 p.m. Closing Remark – Lets Continue our Cooperation- Summary,
Conclusion, Future Get Together and Communication– FIU and FDOT
12:30 p.m. Meeting adjourn

95
Table C-1: Advantages and Disadvantages of some of the NDE Methods discussed during Oct 27 and 28, 2011 International
workshop held at FIU and chaired by Atorod Azizinamini (P.I.)
NDE Method Advantages Disadvantages Application case What improvement
can be made
Application with
regard to duct type
Electrochemical tests (half-cell
potential, Linear polarization
resistance (LPR), Electro-
impedance Spectroscopy (EIS)
Potential to measure
meaningful data related to
active corrosion of strand
Electrical connection to tendon
required; sensors must be
placed within the duct to
monitor tendon. Difficult to
apply to existing post-tensioned
(PT) ducts with current available
technology, because of the
requirement that sensors must
be inside the duct.
Best application: standard steel
reinforcing bar and tendon
systems in concrete not within
ducts.
Develop robust sensors and
sensing systems that are
applicable within ducts.
Probably not applicable to
either internal or internal ducts
at this time
Impulse response
Potential to measure
mechanical compliance of a
duct system, which could reflect
a duct grouting or other
problem.
Probably not sensitive to small
defects
Best application: external ducts,
looking for large void in grout
Probably applicable only to
external ducts, giving one global
value for entire duct. Unlikely to
work for internal ducts unless
void is very large.
Acoustic sounding (hammer
tap)
Practical and relatively easy;
fairly accurate for detecting
“dry” voids in the grout
Not sensitive to “soft” or unset
grout. Subjective test that is
operator dependent.
Best application: external
plastic duct looking for dry
voiding in grout
Automate process and quantify
results with acoustic sensors
and appropriate data analysis
Applicable to external ducts
only.
Magnetic flux leakage (MFL)
Can indicate local wire breaks
(or member thinning) in near-
surface tendons; Established
test method; a contactless test
that does not require
connection to tendon; works
for both metal and plastic ducts
Some expertise may be needed
to interpret signals. May need
many magnetizing pre-sessions
before signals are reliable.
Cannot detect break in
underlying tendons, or in
anchorage region
Best application: identifying
wire breaks in external, plastic
ducts.
Improved performance for
congested steel sections and
within anchorage region
Applicable to both internal and
external ducts
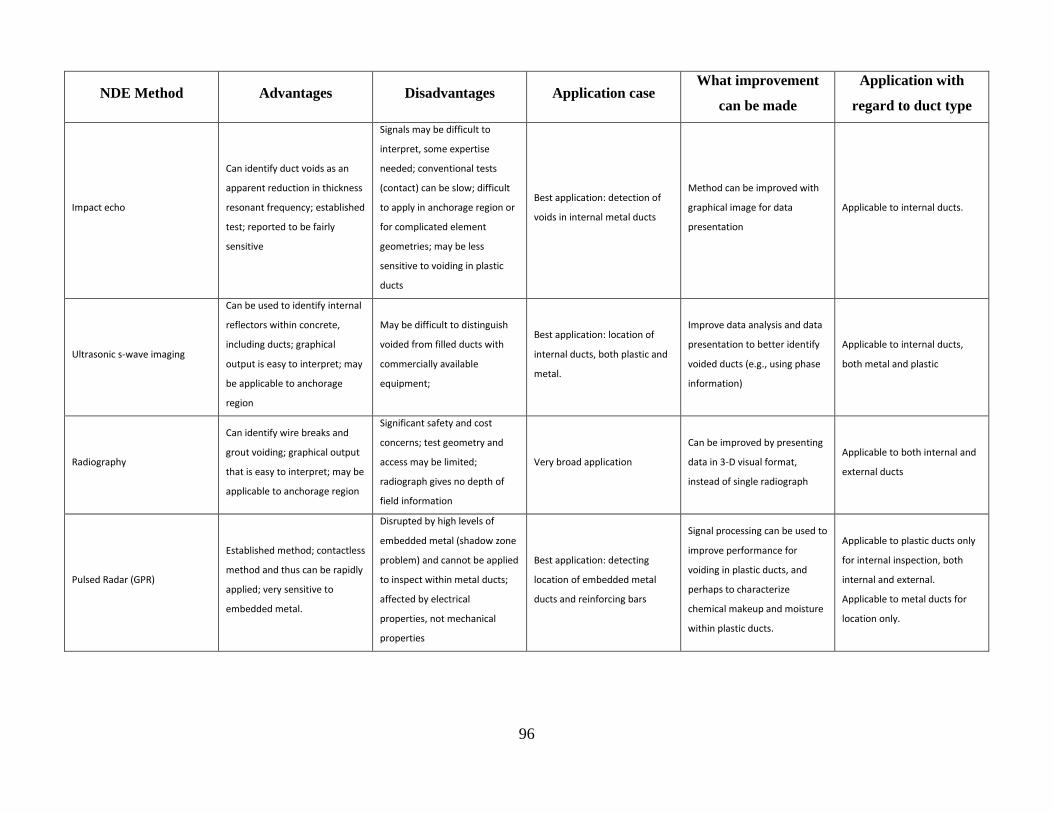
96
NDE Method Advantages Disadvantages Application case What improvement
can be made
Application with
regard to duct type
Impact echo
Can identify duct voids as an
apparent reduction in thickness
resonant frequency; established
test; reported to be fairly
sensitive
Signals may be difficult to
interpret, some expertise
needed; conventional tests
(contact) can be slow; difficult
to apply in anchorage region or
for complicated element
geometries; may be less
sensitive to voiding in plastic
ducts
Best application: detection of
voids in internal metal ducts
Method can be improved with
graphical image for data
presentation
Applicable to internal ducts.
Ultrasonic s-wave imaging
Can be used to identify internal
reflectors within concrete,
including ducts; graphical
output is easy to interpret; may
be applicable to anchorage
region
May be difficult to distinguish
voided from filled ducts with
commercially available
equipment;
Best application: location of
internal ducts, both plastic and
metal.
Improve data analysis and data
presentation to better identify
voided ducts (e.g., using phase
information)
Applicable to internal ducts,
both metal and plastic
Radiography
Can identify wire breaks and
grout voiding; graphical output
that is easy to interpret; may be
applicable to anchorage region
Significant safety and cost
concerns; test geometry and
access may be limited;
radiograph gives no depth of
field information
Very broad application
Can be improved by presenting
data in 3-D visual format,
instead of single radiograph
Applicable to both internal and
external ducts
Pulsed Radar (GPR)
Established method; contactless
method and thus can be rapidly
applied; very sensitive to
embedded metal.
Disrupted by high levels of
embedded metal (shadow zone
problem) and cannot be applied
to inspect within metal ducts;
affected by electrical
properties, not mechanical
properties
Best application: detecting
location of embedded metal
ducts and reinforcing bars
Signal processing can be used to
improve performance for
voiding in plastic ducts, and
perhaps to characterize
chemical makeup and moisture
within plastic ducts.
Applicable to plastic ducts only
for internal inspection, both
internal and external.
Applicable to metal ducts for
location only.
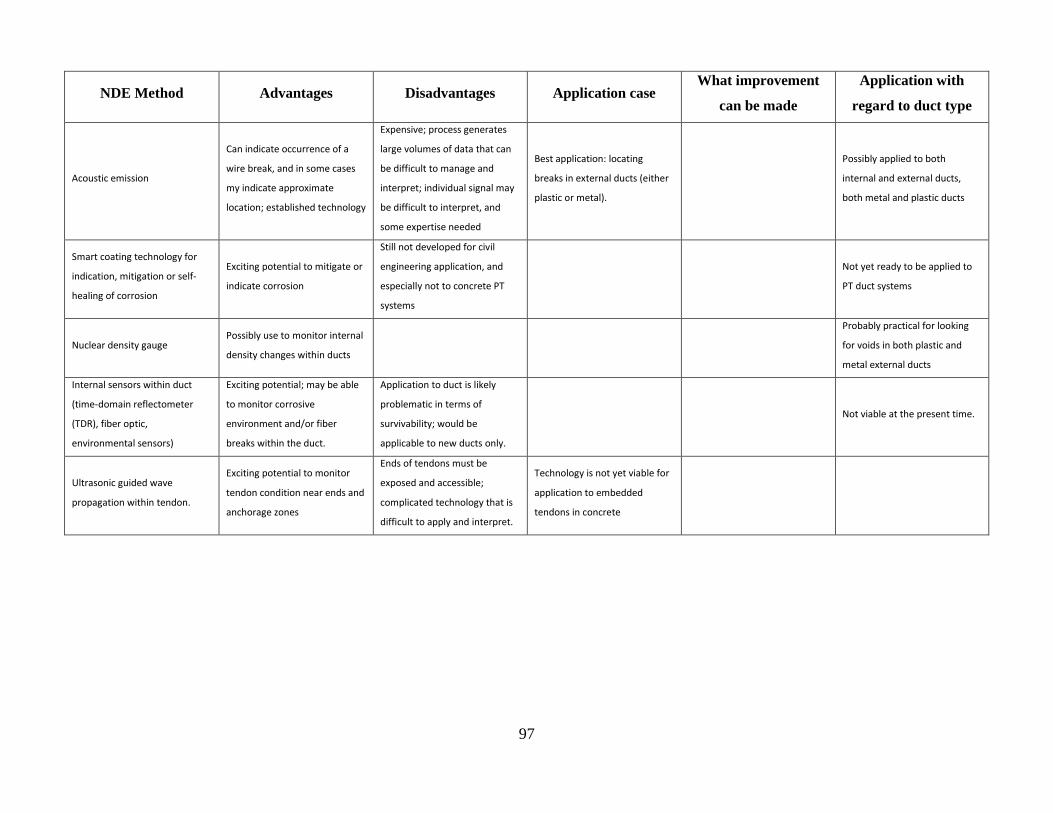
97
NDE Method Advantages Disadvantages Application case What improvement
can be made
Application with
regard to duct type
Acoustic emission
Can indicate occurrence of a
wire break, and in some cases
my indicate approximate
location; established technology
Expensive; process generates
large volumes of data that can
be difficult to manage and
interpret; individual signal may
be difficult to interpret, and
some expertise needed
Best application: locating
breaks in external ducts (either
plastic or metal).
Possibly applied to both
internal and external ducts,
both metal and plastic ducts
Smart coating technology for
indication, mitigation or self-
healing of corrosion
Exciting potential to mitigate or
indicate corrosion
Still not developed for civil
engineering application, and
especially not to concrete PT
systems
Not yet ready to be applied to
PT duct systems
Nuclear density gauge Possibly use to monitor internal
density changes within ducts
Probably practical for looking
for voids in both plastic and
metal external ducts
Internal sensors within duct
(time-domain reflectometer
(TDR), fiber optic,
environmental sensors)
Exciting potential; may be able
to monitor corrosive
environment and/or fiber
breaks within the duct.
Application to duct is likely
problematic in terms of
survivability; would be
applicable to new ducts only.
Not viable at the present time.
Ultrasonic guided wave
propagation within tendon.
Exciting potential to monitor
tendon condition near ends and
anchorage zones
Ends of tendons must be
exposed and accessible;
complicated technology that is
difficult to apply and interpret.
Technology is not yet viable for
application to embedded
tendons in concrete