Embed Size (px)
Citation preview

IMPROVING ACHIEVEMENT AND CLOSING GAPS BETWEEN GROUPS:How Can Researchers Help?
IES June, 2006

As a group, educators are a pretty conservative lot. It’s hard to get them to change
what they do.

Not clear that more and better research will cause many of them to do things differently, but it certainly
can help.

Would help, however, if it focused on the questions
most on the minds of educators today.
Here are the ones I get most often.

1. What differentiates the teachers who are most
effective in growing student learning from those who are
less effective?
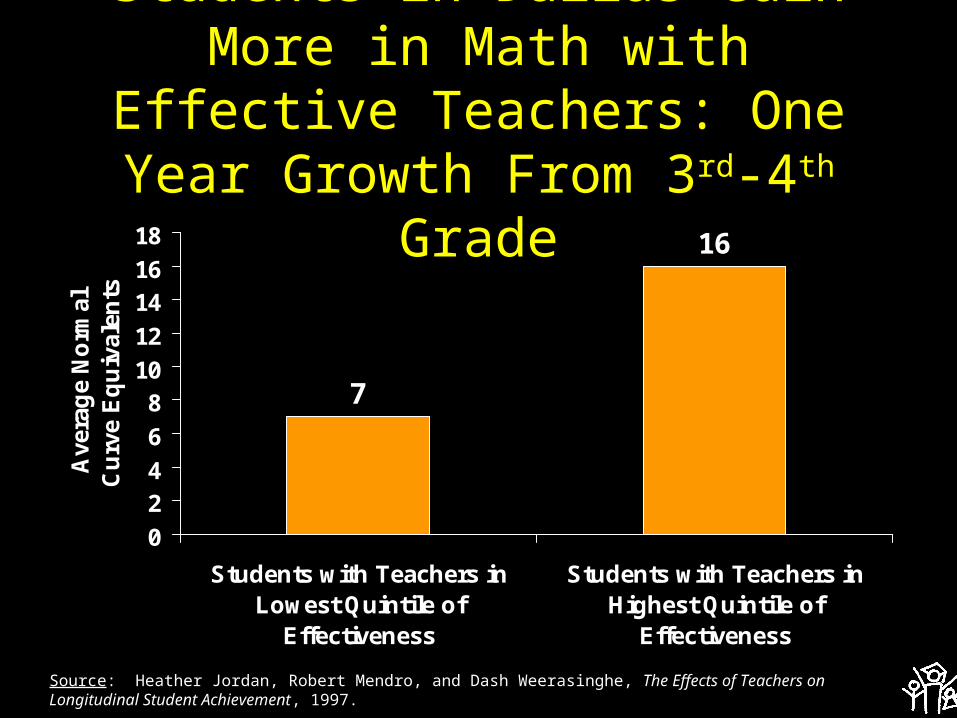
Students in Dallas Gain More in Math with Effective Teachers: One Year Growth From 3rd-4th
Grade
7
16
0
24
6
810
12
1416
18
Students with Teachers inLowest Quintile of
Effectiveness
Students with Teachers inHighest Quintile of
Effectiveness
Ave
rag
e N
orm
al
Cu
rve
Eq
uiv
alen
ts
Source: Heather Jordan, Robert Mendro, and Dash Weerasinghe, The Effects of Teachers on Longitudinal Student Achievement, 1997.

Cumulative Teacher Effects On Students’ Math Scores in
Dallas (Grades 3-5)
76
27
0
10
20
30
40
50
60
70
80
90
100
Ave
rag
e P
erce
nti
le R
ank
Dallas StudentsAssigned to 3Highly EffectiveTeachers in aRow
Dallas StudentsAssigned to 3IneffectiveTeachers in aRow
Source: Heather Jordan, Robert Mendro, and Dash Weerasinghe, The Effects of Teachers on Longitudinal Student Achievement, 1997.
Beginning Grade 3Percentile Rank= 55
Beginning Grade 3Percentile Rank= 57

Some of the things we most need to know…in order to
act:• Are teachers who are high value-added
on state assessment also same when second measure is introduced?
• How stable are value-added measures?• What are the characteristics and
practices of teachers with high value added?
• What can we do to produce/attract/select more of them?

#2. What is it about unusually effective schools—especially those serving low-
income students and students of color-- that
makes them so effective?

Source: Education Trust analysis of data from National School-Level State Assessment Score Database (www.schooldata.org).
Poverty vs. Achievement in Kentucky Elementary Schools
0
10
20
30
40
50
60
70
80
90
100
0 10 20 30 40 50 60 70 80 90 100
Percent FRPL
Ele
me
nta
ry M
ath
Pe
rce
nti
le S
co
re

Poverty vs. Achievement in Kentucky Elementary Schools
0
10
20
30
40
50
60
70
80
90
100
0 10 20 30 40 50 60 70 80 90 100
Percent FRPL
Ele
me
nta
ry M
ath
Pe
rce
nti
le S
co
re
Source: Education Trust analysis of data from National School-Level State Assessment Score Database (www.schooldata.org).

Source: Education Trust analysis of data from National School-Level State Assessment Score Database (www.schooldata.org).Data are from 2002.
Poverty vs. Achievement in Michigan Elementary Schools
0
10
20
30
40
50
60
70
80
90
100
0 10 20 30 40 50 60 70 80 90 100
Percent Low-Income Students
Pe
rce
nt
4th
Gra
de
rs M
ee
tin
g S
tan
da
rd i
n M
ath

Not all these schools are consistently high performers
in multiple years and subjects. But some certainly
are.

Centennial Place Elementary School
Atlanta, Georgia
• 528 students in grades K-5• 92% African American• 62% Low-Income
Source: School Information Partnership, http://www.schoolmatters.com

Centennial PlaceHigh Achievement for All Students
Grade 5 Math, 200592 92 92 92
0
20
40
60
80
100
Overall AfricanAmerican
Poor Non-Poor
Perc
en
t P
rofi
cie
nt
Source: School Information Partnership, http://www.schoolmatters.com

Centennial PlaceHigh Achievement for All Students
Grade 5 Reading, 200591 91 90 92
0
20
40
60
80
100
Overall AfricanAmerican
Poor Non-Poor
Perc
en
t P
rofi
cie
nt
Source: School Information Partnership, http://www.schoolmatters.com

Frankford ElementaryFrankford, Delaware
• 29% African-American• 34% Latino• 34% White• 76% Low-Income
Source: Delaware Department of Education Online School Profiles,
http://issm.doe.state.de.us/profiles/EntitySearch.ASPX

Frankford ElementaryClosing Gaps, Grade 5 Math
70
9696 94
0
20
40
60
80
100
2003 2005
Pe
rce
nt
Me
eti
ng
or
Ex
ce
ed
ing
Sta
nd
ard
s
Poor
Non-Poor
Source: Delaware Department of Education, DSTP Online Reports, http://dstp.doe.k12.de.us/DSTPmart/default.asp

University Park High SchoolWorcester, MA
• Grades 7-12;• 70+% poverty;• 50% ELL;• Most students enter at least two
grade levels behind.

University Park Results: 2004
• 100% of 10th graders passed MA high school exit exam on first attempt.
• 87% passed at advanced or proficient level.
• Fifth most successful school in the state, surpassing many schools serving wealthy students.

#3. What explains the big differences in how the
“same” groups of children perform across different
districts and states?

Low-Income African American Students
do Better in Some Districts (Urban NAEP Grade 4 Reading, 2005)
170
180
190
200
210
220
230
New
Yor
k C
ity
Bos
ton
Cha
rlot
te
San
Die
goN
atio
nal P
ublic
Cle
vela
nd
Atla
nta
Chi
cago
Dis
tric
t of C
olum
bia
Los
Ang
eles
Ave
rag
e S
cale
Sco
re
Source: National Center for Education Statistics, NAEP Data Explorer, http://nces.ed.gov/nationsreportcard/nde
Proficient Scale Score = 238
Houston and Austin are not included due to high exclusion rates for students with disabilities and English Language Learners

Low-Income African American Students
do Better in Some Districts (Urban NAEP Grade 8 Math, 2005)
220
230
240
250
Bos
ton
New
Yor
k C
ity
Aus
tin
Cha
rlot
te
Chi
cago
San
Die
goN
atio
nal P
ublic
Hou
ston
Cle
vela
nd
Atla
nta
Dis
tric
t of C
olum
bia
Los
Ang
eles
Ave
rag
e S
cale
Sco
re
Source: National Center for Education Statistics, NAEP Data Explorer, http://nces.ed.gov/nationsreportcard/nde
Proficient Scale Score = 281

Latino Students Do Better In Some Districts
(Urban NAEP Grade 4 Reading, 2005)
170
180
190
200
210
220
230
Cha
rlot
te
New
Yor
k C
ityN
atio
nal P
ublic
Chi
cago
Cle
vela
nd
Bos
ton
San
Die
goD
istr
ict o
f Col
umbi
a
Los
Ang
eles
Ave
rag
e S
cale
Sco
re
Source: National Center for Education Statistics, NAEP Data Explorer, http://nces.ed.gov/nationsreportcard/nde
Proficient Scale Score = 238
Houston and Austin are not included due to high exclusion rates for students with disabilities and English Language Learners. Latino scores are not available for Atlanta

NAEP 2005 Grade 8 Math, African American Scale
Scores
235
245
255
265
275
285
295
Ala
ska
Del
awar
eM
assa
chus
etts
Sou
th C
arol
ina
Ariz
ona
New
Yor
kO
rego
nN
ew M
exic
o
Iow
aG
eorg
ia
Ohi
oLo
uisi
ana
Min
neso
taP
enns
ylva
nia
Illin
ois
Rho
de Is
land
Mic
higa
nM
isso
uri
Tenn
esse
eA
rkan
sas
Ala
bam
a
Ave
rag
e S
cale
Sco
re
Source: National Center for Education Statistics, NAEP Data Explorer, http://nces.ed.gov/nationsreportcard/nde
Proficient Scale Score: 299
MARI

NAEP 2005 Grade 8 Math, Latino Scale Scores
235
245
255
265
275
285
295
Ala
ska
Virg
inia
Del
awar
eA
rkan
sas
Flor
ida
Mas
sach
uset
tsN
orth
Car
olin
aW
yom
ing
New
Jer
sey
Mar
ylan
dW
ashi
ngto
n
Idah
oN
ebra
ska
Col
orad
oG
eorg
iaO
klah
oma
Nev
ada
Uta
hC
onne
ctic
ut
Ave
rag
e S
cale
Sco
re
Source: National Center for Education Statistics, NAEP Data Explorer, http://nces.ed.gov/nationsreportcard/nde
Proficient Scale Score: 299TXCA

#4. None of these educators, schools, districts or states are yet achieving
what we need them to achieve, especially for the
kids who enter behind. What do we know—from learning science, psychology, brain research and the like—that could help them go further,
faster?

Average High School: Percent of Instructional Time in Reading Intensive Courses
Below Grade Level Students
On Grade Level Students
Advanced Students
24% 29% 35%

Surprise: Gaps Grow.

We know that this isn’t smart. But what, exactly,
is?

What many educators think they know from “research”:
• If they’re not good at reading or math, let them “express themselves” with another “intelligence”;
• If you don’t get them by the time they are 3 (or 3 months) those “synapses” will never grow or connect;
• If the students are black or brown, virtually every lesson must be “culturally relevant” (and if that means taking the content or rigor out, well then so be it).

You can do better!
Really important to both get research out there AND to guard against deeply “dumbed down”
versions of your research.

Getting Results USED: What DOESN’T Work
• Writing it up in journals;• Expecting Ed School faculty to
integrate your findings into their instruction.

Getting Results Used: What CAN work
• First, get Russ Whitehurst to give you lots of money to ensure that the findings are solid;
• Then, get the federal government (or, if you prefer) the Gates Foundation to put lots of money behind training people to do it; and,
• Make really, really sure that your trainers don’t dumb it down.

The Education TrustDownload this Presentation
www.edtrust.orgWashington, DC: 202-293-1217
Oakland, CA: 510-465-6444