Embed Size (px)
Citation preview

Interested in conducting your own webinar? Email [email protected]
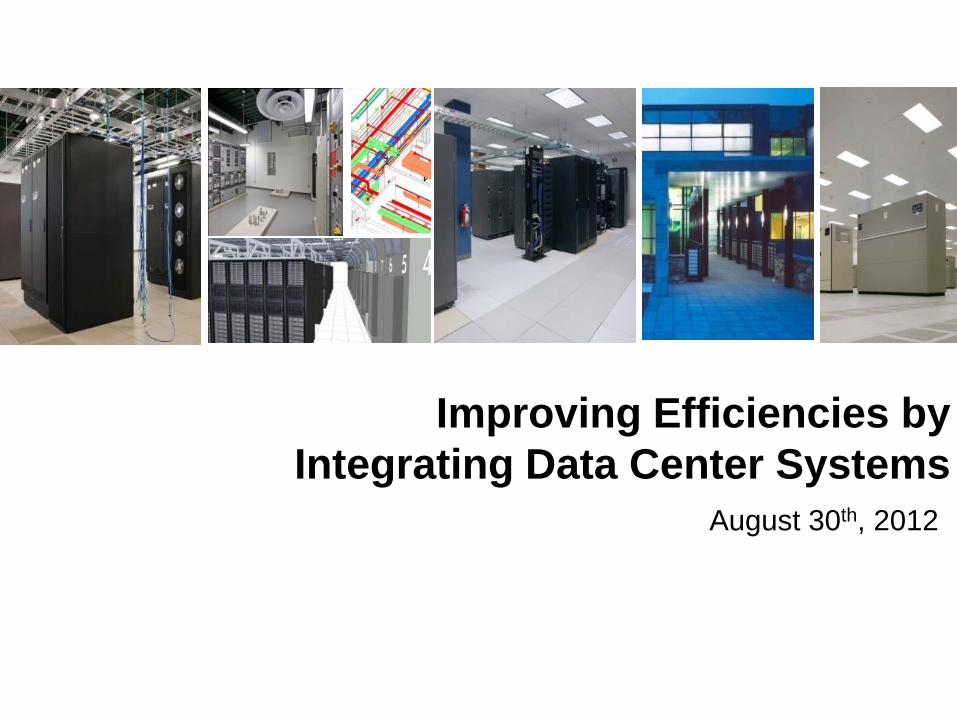
Improving Efficiencies by Integrating Data Center Systems
August 30th, 2012
Archive www.missioncriticalmagazine.com
Add to your favorites
Audio
Abstract
Live Twitter Feed
Group Chat
Presenter Info
Slides
Q & A
Handouts
Help
Survey

Improving Efficiencies by Integrating Data Center Systems
August 30th, 2012
Architectural Effects on Efficiencies
• Raised floor and room air tightness • Humidity control – vapor barrier • Ceilings as return air plenums • Raised floor as supply air plenums • Containment – coordination, tightness • Large areas required to reduce static
pressure and accommodate ducts and louvers
Controls
• Pressurization • Contamination – Smoke, Pollen, Diesel • Temperature reset on cooling equipment
to control Humidity. • Select controls based on type of air
management
Electrical
• High voltage distribution – 208, 230, 277V • High efficiency equipment (or Eco mode
UPS) • Take heat producing equipment out of
computer room • Let Electrical and UPS rooms operate at
higher temperatures • Lighting control

Mechanical
• Raise Computer room temperatures to ASHRAE recommendations/allowable limits
• Increase allowable humidity levels – consider cost to add humidity
• Raise chilled water temperatures • Use VSD pumps and fans to reduce power • Use redundant equipment to increase
efficiencies
Mechanical
• High efficiency economizer systems – Air – Water – Refrigerant
• Adiabatic cooling systems • Right size cooling system operation • ASHRAE 90.1-2010 code requirements
– Typical DX type units may not meet minimum efficiencies
Mechanical
• PUE varies by system and geography • Fan power is a big influence
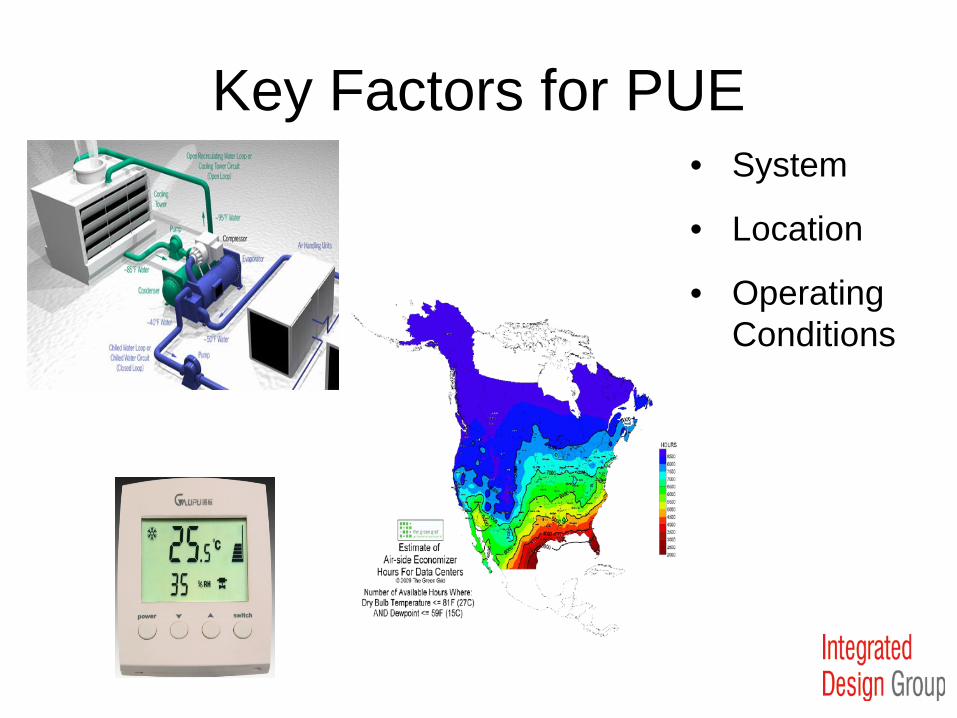
Key Factors for PUE • System
• Location
• Operating Conditions
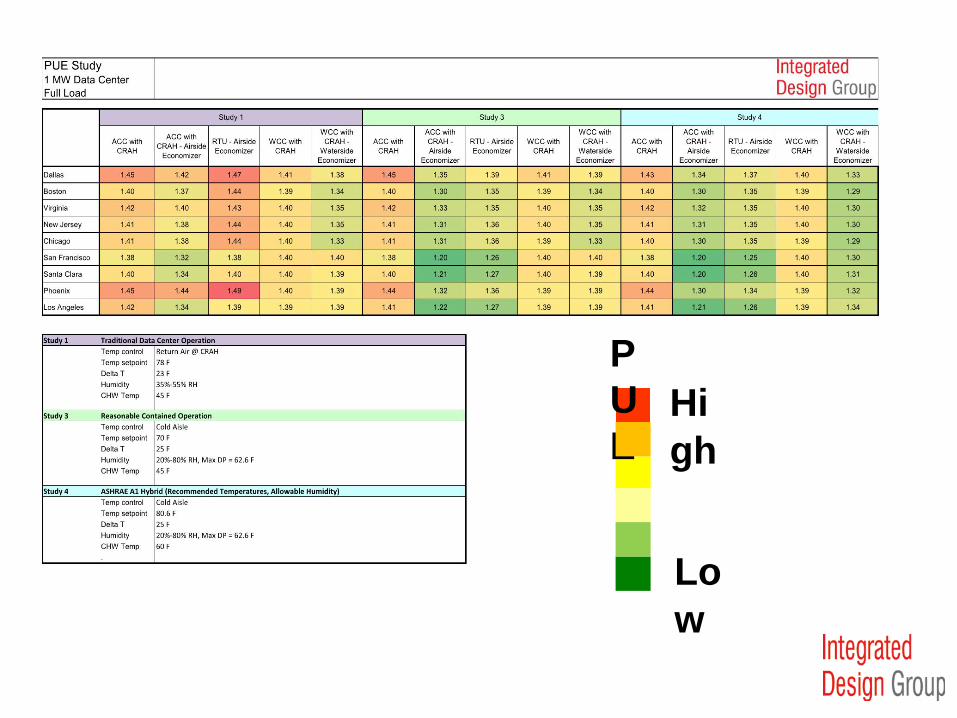
High
Low
PUE
Mechanical
• Hot/Cold aisle containment systems – Similar operational costs – Different control strategies – How to keep hot and cold air separated
• Doors at end of aisles • Barriers from cabinets to ceiling • Duct from cabinet to ceiling
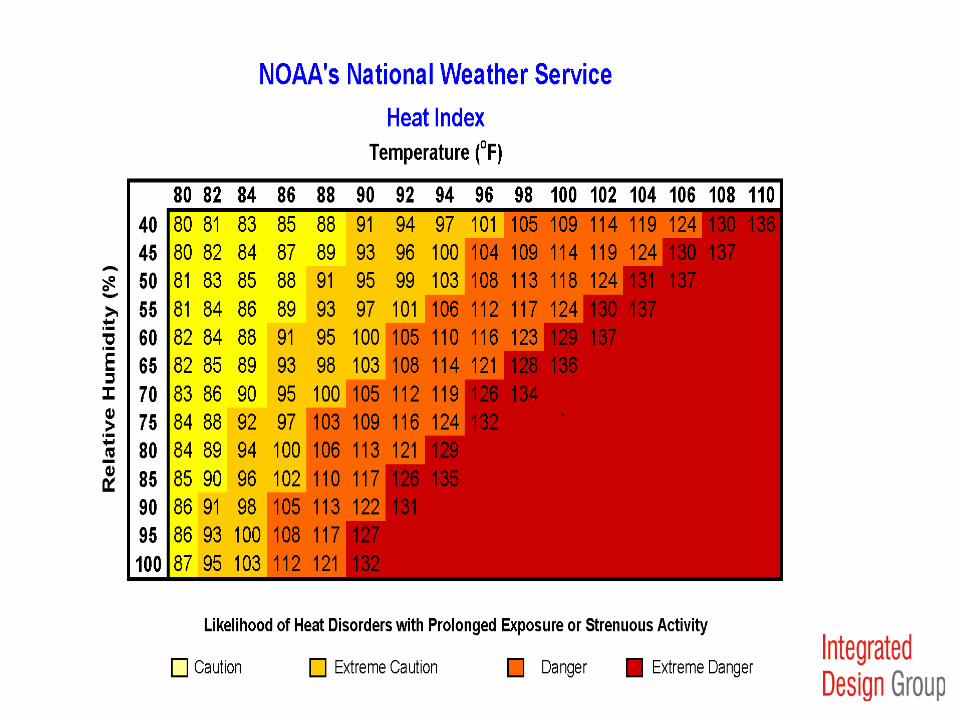
– Consider temperature in room • OSHA limits on heat exposure
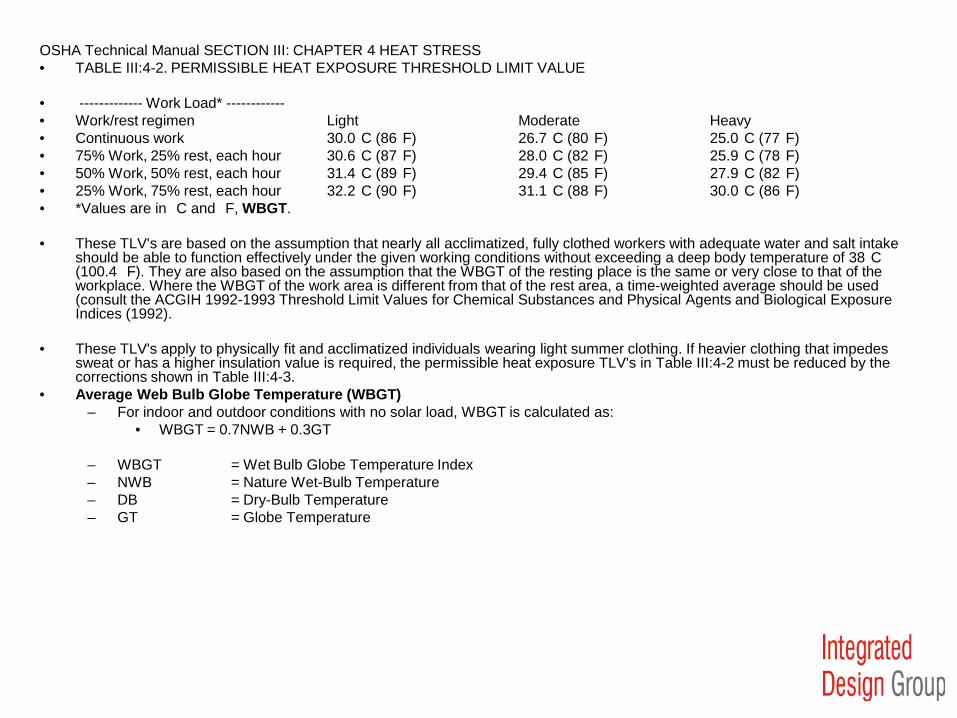
OSHA Technical Manual SECTION III: CHAPTER 4 HEAT STRESS • TABLE III:4-2. PERMISSIBLE HEAT EXPOSURE THRESHOLD LIMIT VALUE
• ------------- Work Load* ------------ • Work/rest regimen Light Moderate Heavy • Continuous work 30.0 C (86 F) 26.7 C (80 F) 25.0 C (77 F) • 75% Work, 25% rest, each hour 30.6 C (87 F) 28.0 C (82 F) 25.9 C (78 F) • 50% Work, 50% rest, each hour 31.4 C (89 F) 29.4 C (85 F) 27.9 C (82 F) • 25% Work, 75% rest, each hour 32.2 C (90 F) 31.1 C (88 F) 30.0 C (86 F) • *Values are in C and F, WBGT.
• These TLV's are based on the assumption that nearly all acclimatized, fully clothed workers with adequate water and salt intake
should be able to function effectively under the given working conditions without exceeding a deep body temperature of 38 C (100.4 F). They are also based on the assumption that the WBGT of the resting place is the same or very close to that of the workplace. Where the WBGT of the work area is different from that of the rest area, a time-weighted average should be used (consult the ACGIH 1992-1993 Threshold Limit Values for Chemical Substances and Physical Agents and Biological Exposure Indices (1992).
• These TLV's apply to physically fit and acclimatized individuals wearing light summer clothing. If heavier clothing that impedes sweat or has a higher insulation value is required, the permissible heat exposure TLV's in Table III:4-2 must be reduced by the corrections shown in Table III:4-3.
• Average Web Bulb Globe Temperature (WBGT) – For indoor and outdoor conditions with no solar load, WBGT is calculated as:
• WBGT = 0.7NWB + 0.3GT
– WBGT = Wet Bulb Globe Temperature Index – NWB = Nature Wet-Bulb Temperature – DB = Dry-Bulb Temperature – GT = Globe Temperature
Data Center Infrastructure Management (DCIM) Monitoring and Modeling for the Future
M+W U.S., Inc. A Company of the M+W Group August 30, 2012
18 © M+W Group M+W U.S., Inc. Corporate Overview
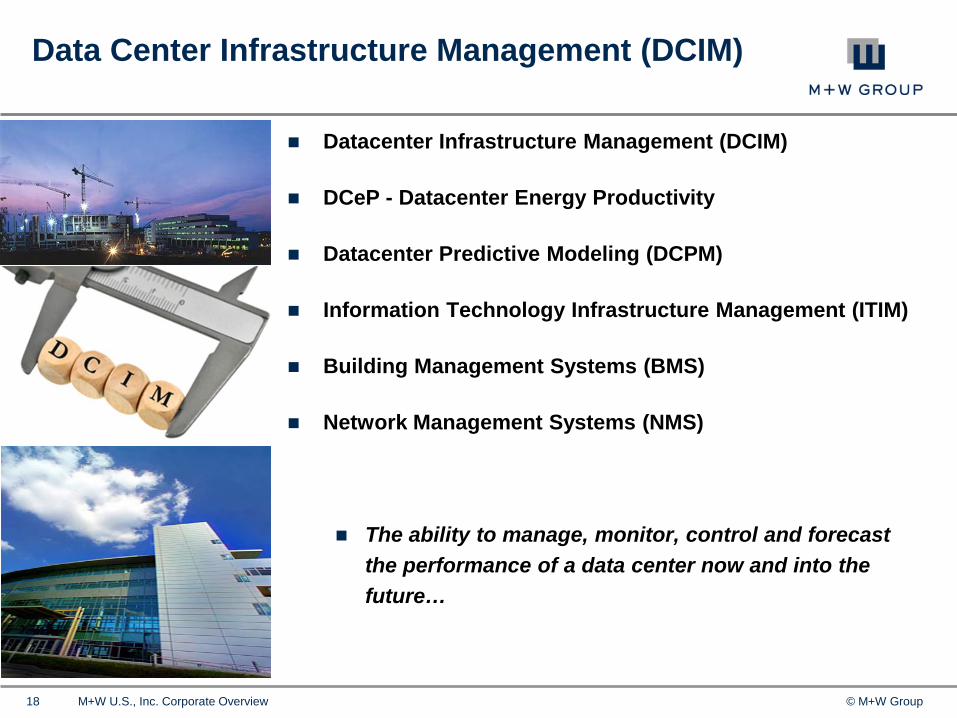
Data Center Infrastructure Management (DCIM)
Datacenter Infrastructure Management (DCIM)
DCeP - Datacenter Energy Productivity
Datacenter Predictive Modeling (DCPM)
Information Technology Infrastructure Management (ITIM)
Building Management Systems (BMS)
Network Management Systems (NMS)
The ability to manage, monitor, control and forecast the performance of a data center now and into the future…
19 © M+W Group M+W U.S., Inc. Corporate Overview
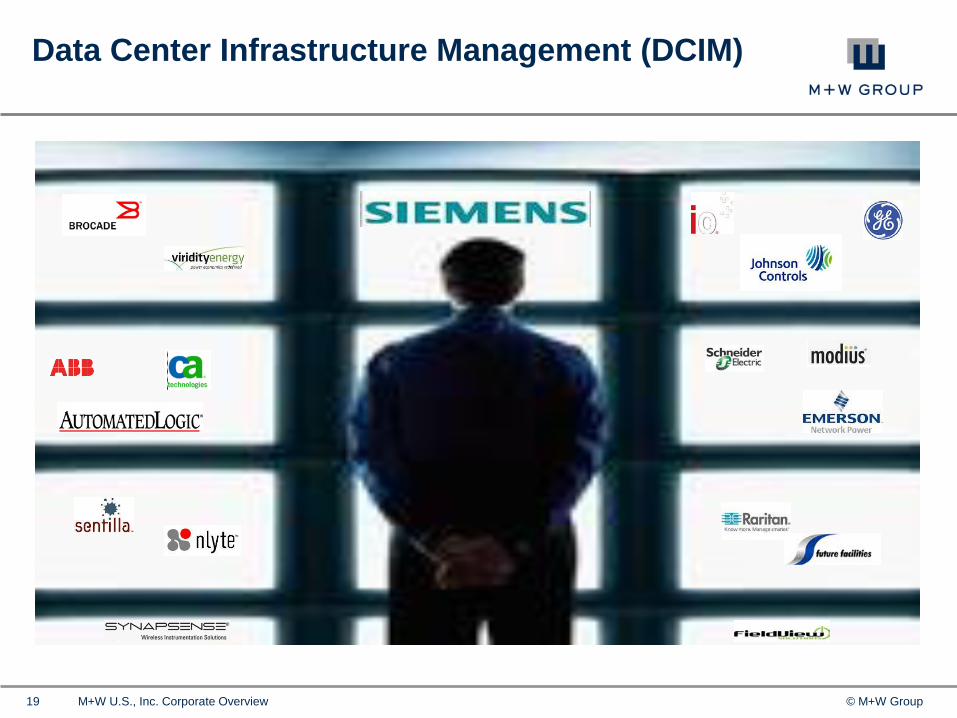
Data Center Infrastructure Management (DCIM)
20 © M+W Group M+W U.S., Inc. Corporate Overview
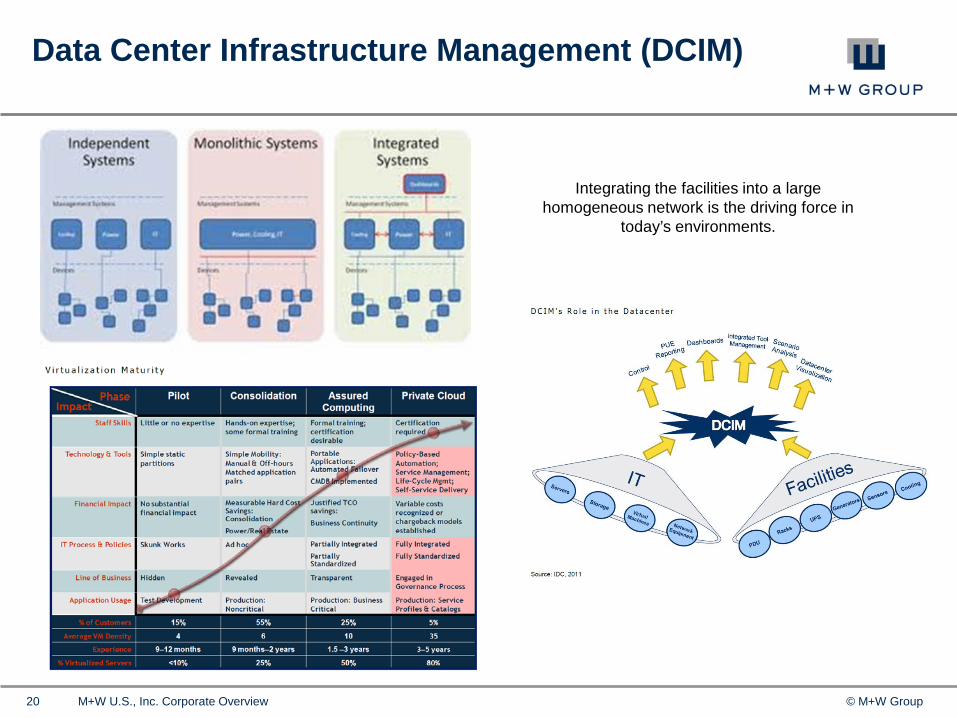
Data Center Infrastructure Management (DCIM)
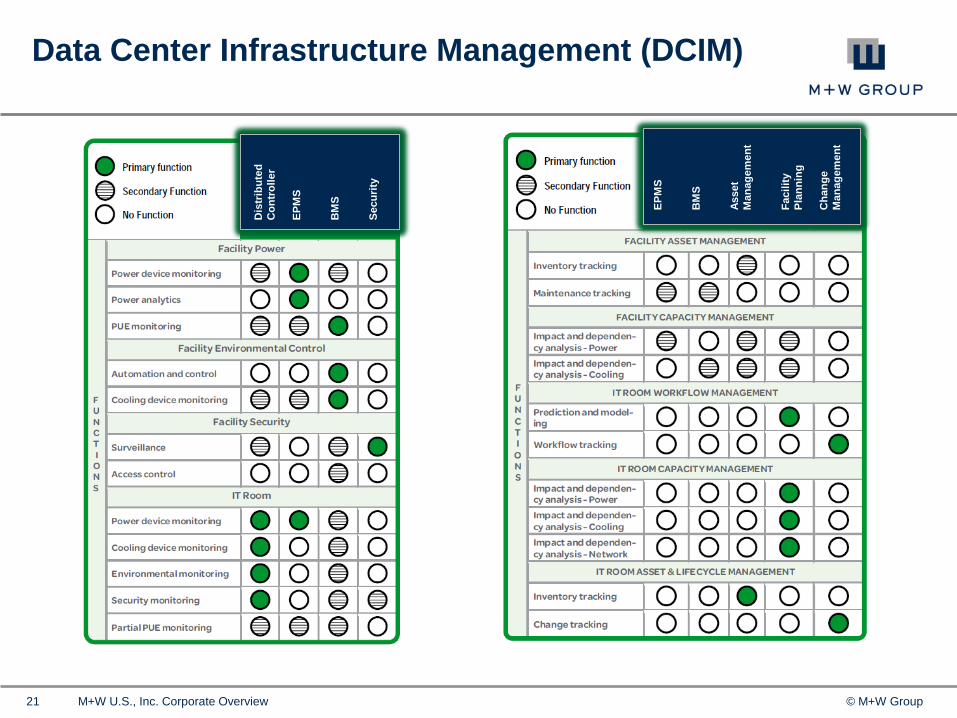
Integrating the facilities into a large homogeneous network is the driving force in
today’s environments.
21 © M+W Group M+W U.S., Inc. Corporate Overview
Data Center Infrastructure Management (DCIM)
Dis
trib
uted
C
ontr
olle
r EP
MS
BM
S Se
curit
y
EPM
S
BM
S As
set
Man
agem
ent
Faci
lity
Plan
ning
C
hang
e M
anag
emen
t
22 © M+W Group M+W U.S., Inc. Corporate Overview
Data Center Infrastructure Management (DCIM)
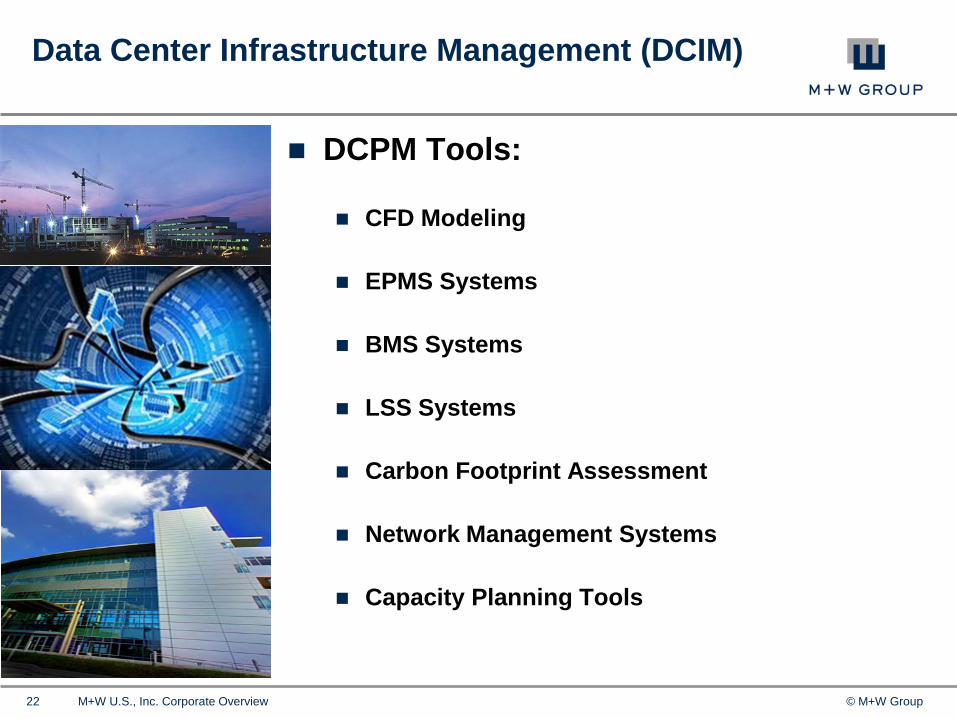
DCPM Tools:
CFD Modeling
EPMS Systems
BMS Systems
LSS Systems
Carbon Footprint Assessment
Network Management Systems
Capacity Planning Tools
23 © M+W Group M+W U.S., Inc. Corporate Overview
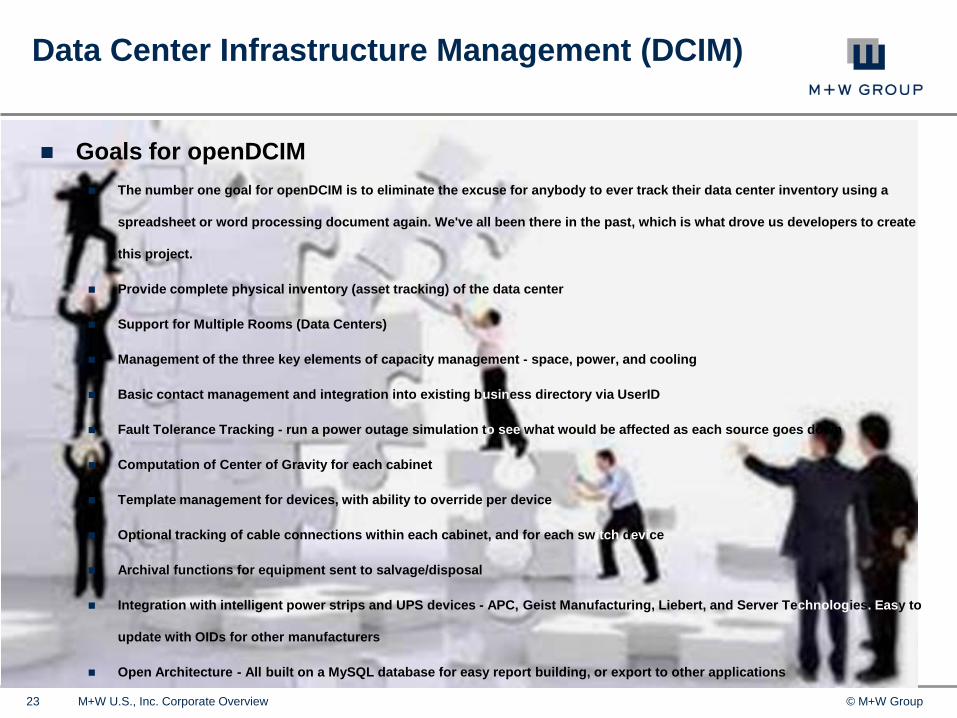
Goals for openDCIM The number one goal for openDCIM is to eliminate the excuse for anybody to ever track their data center inventory using a
spreadsheet or word processing document again. We've all been there in the past, which is what drove us developers to create
this project.
Provide complete physical inventory (asset tracking) of the data center
Support for Multiple Rooms (Data Centers)
Management of the three key elements of capacity management - space, power, and cooling
Basic contact management and integration into existing business directory via UserID
Fault Tolerance Tracking - run a power outage simulation to see what would be affected as each source goes down
Computation of Center of Gravity for each cabinet
Template management for devices, with ability to override per device
Optional tracking of cable connections within each cabinet, and for each switch device
Archival functions for equipment sent to salvage/disposal
Integration with intelligent power strips and UPS devices - APC, Geist Manufacturing, Liebert, and Server Technologies. Easy to
update with OIDs for other manufacturers
Open Architecture - All built on a MySQL database for easy report building, or export to other applications
Data Center Infrastructure Management (DCIM)
24 © M+W Group M+W U.S., Inc. Corporate Overview
Data Center Infrastructure Management (DCIM)
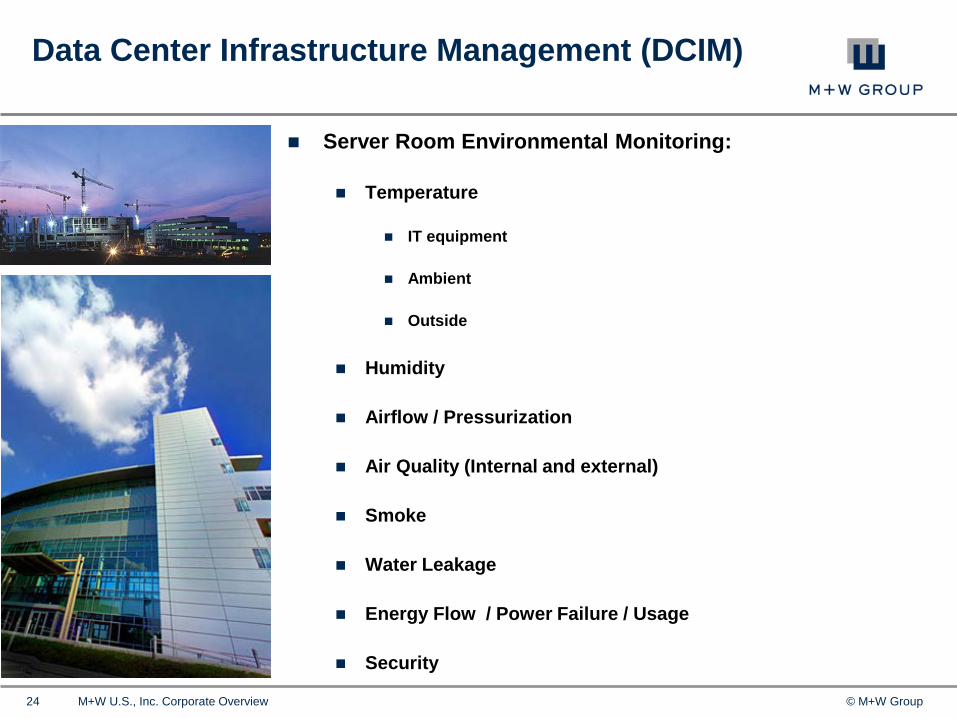
Server Room Environmental Monitoring:
Temperature
IT equipment
Ambient
Outside
Humidity
Airflow / Pressurization
Air Quality (Internal and external)
Smoke
Water Leakage
Energy Flow / Power Failure / Usage
Security
25 © M+W Group M+W U.S., Inc. Corporate Overview
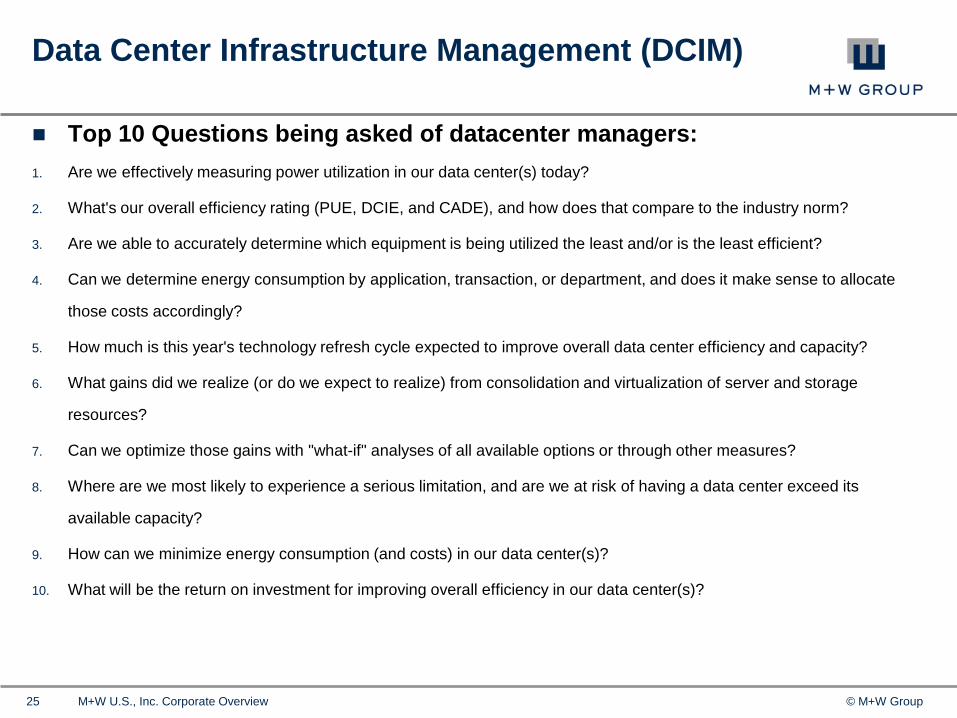
Top 10 Questions being asked of datacenter managers: 1. Are we effectively measuring power utilization in our data center(s) today?
2. What's our overall efficiency rating (PUE, DCIE, and CADE), and how does that compare to the industry norm?
3. Are we able to accurately determine which equipment is being utilized the least and/or is the least efficient?
4. Can we determine energy consumption by application, transaction, or department, and does it make sense to allocate
those costs accordingly?
5. How much is this year's technology refresh cycle expected to improve overall data center efficiency and capacity?
6. What gains did we realize (or do we expect to realize) from consolidation and virtualization of server and storage
resources?
7. Can we optimize those gains with "what-if" analyses of all available options or through other measures?
8. Where are we most likely to experience a serious limitation, and are we at risk of having a data center exceed its
available capacity?
9. How can we minimize energy consumption (and costs) in our data center(s)?
10. What will be the return on investment for improving overall efficiency in our data center(s)?
Data Center Infrastructure Management (DCIM)
26 © M+W Group M+W U.S., Inc. Corporate Overview
Data Center Infrastructure Management (DCIM)
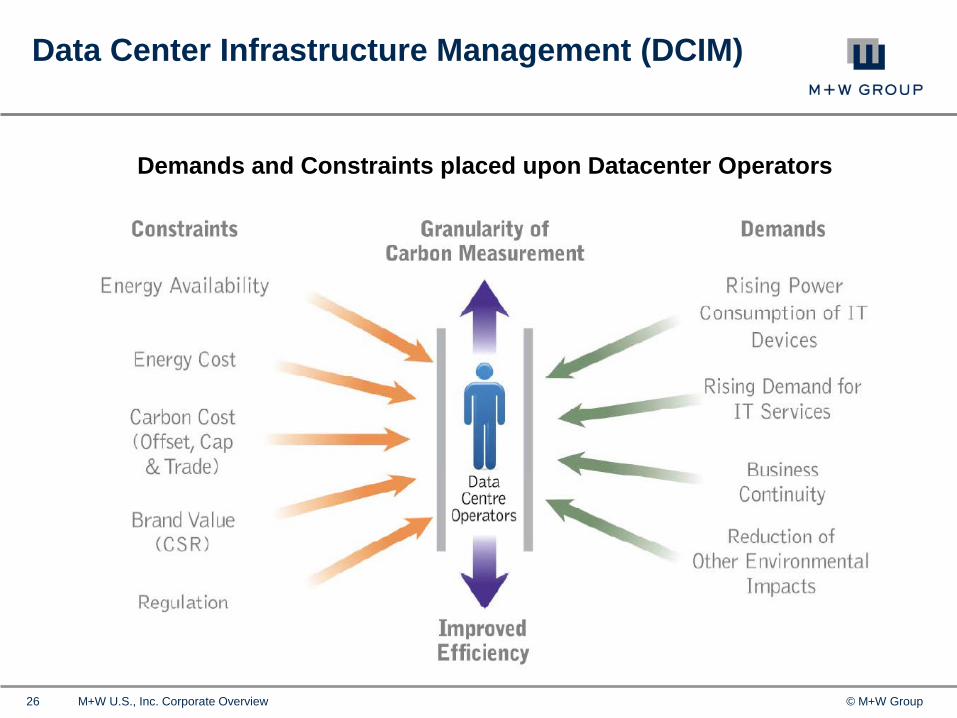
Demands and Constraints placed upon Datacenter Operators
27 © M+W Group M+W U.S., Inc. Corporate Overview
Data Center Infrastructure Management (DCIM)
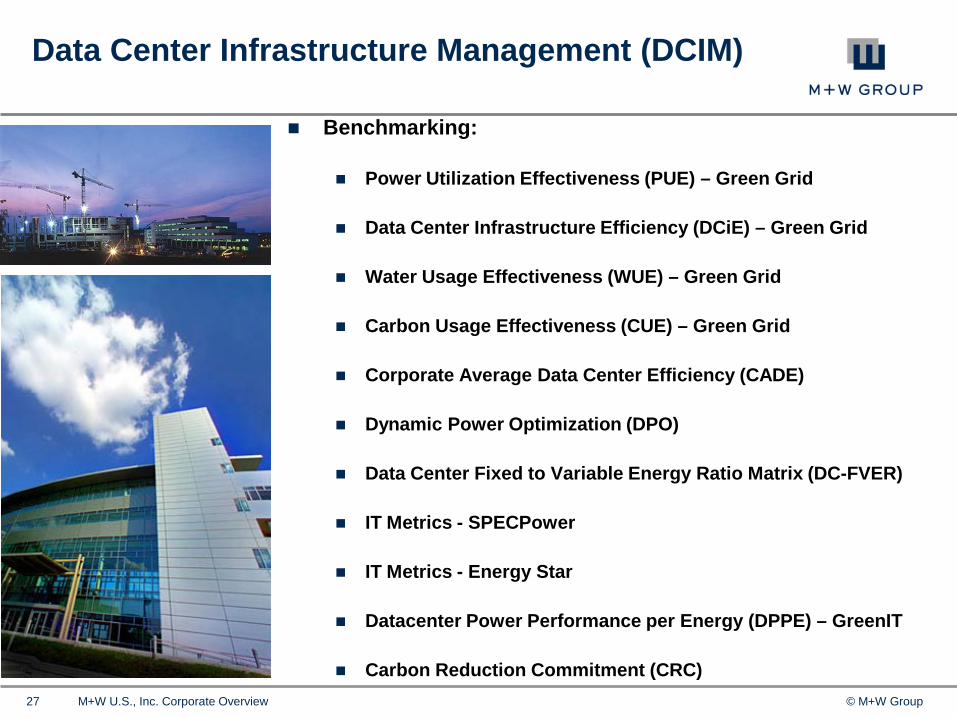
Benchmarking:
Power Utilization Effectiveness (PUE) – Green Grid
Data Center Infrastructure Efficiency (DCiE) – Green Grid
Water Usage Effectiveness (WUE) – Green Grid
Carbon Usage Effectiveness (CUE) – Green Grid
Corporate Average Data Center Efficiency (CADE)
Dynamic Power Optimization (DPO)
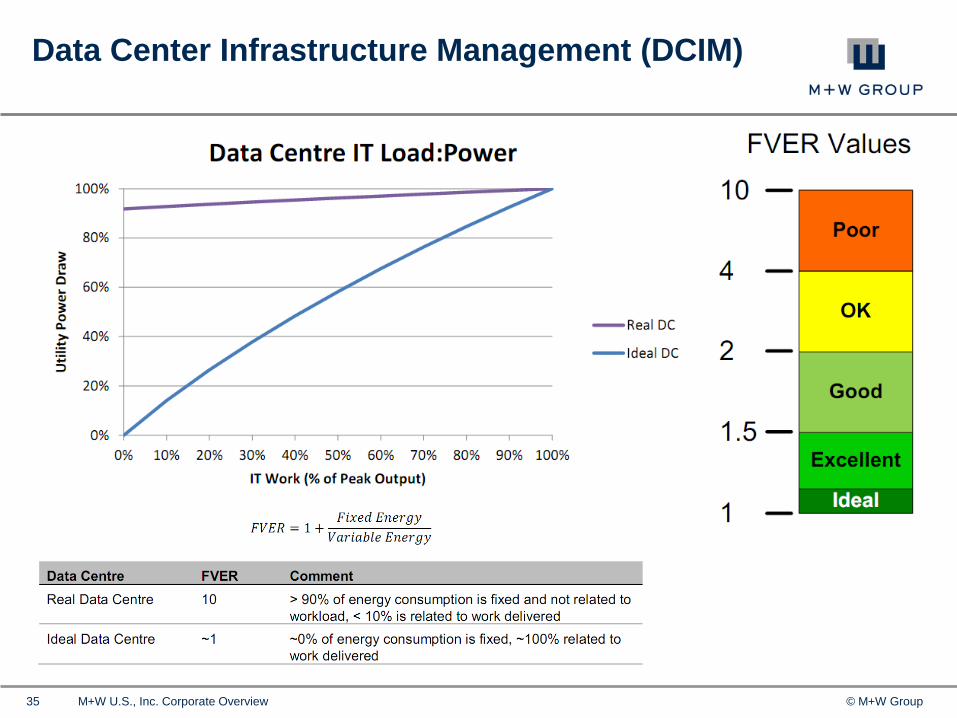
Data Center Fixed to Variable Energy Ratio Matrix (DC-FVER)
IT Metrics - SPECPower
IT Metrics - Energy Star
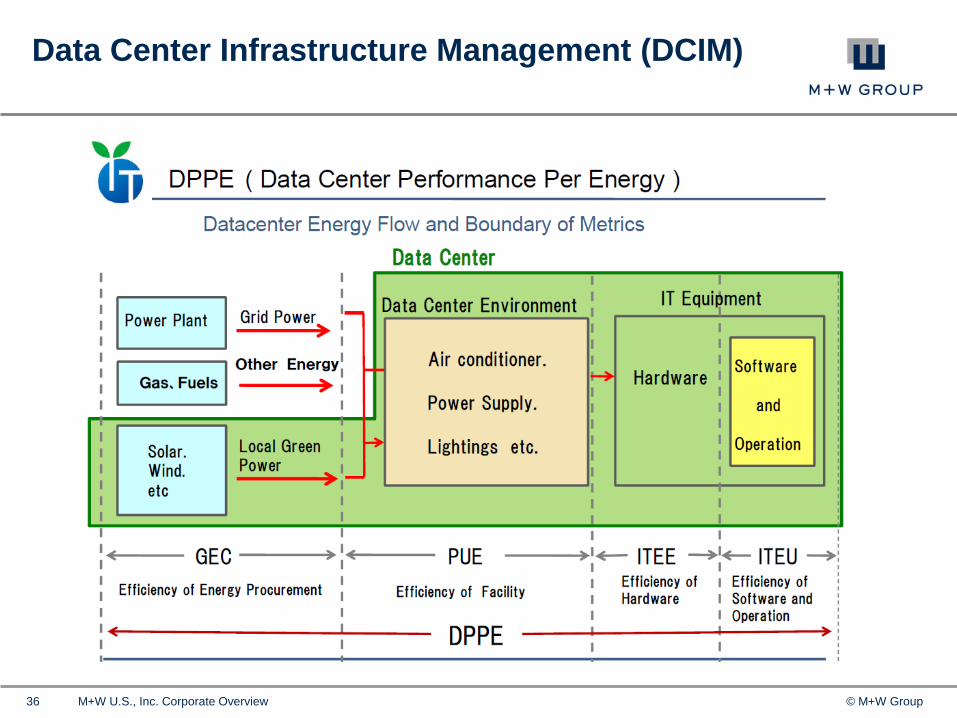
Datacenter Power Performance per Energy (DPPE) – GreenIT
Carbon Reduction Commitment (CRC)
28 © M+W Group M+W U.S., Inc. Corporate Overview
Data Center Infrastructure Management (DCIM)
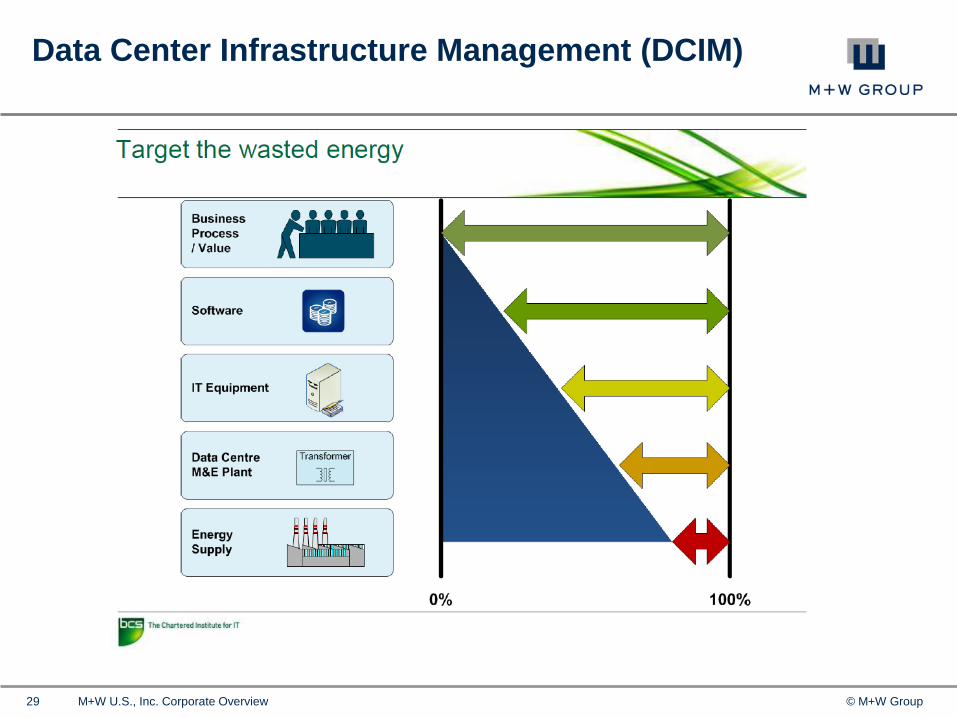
29 © M+W Group M+W U.S., Inc. Corporate Overview
Data Center Infrastructure Management (DCIM)
30 © M+W Group M+W U.S., Inc. Corporate Overview
Data Center Infrastructure Management (DCIM)
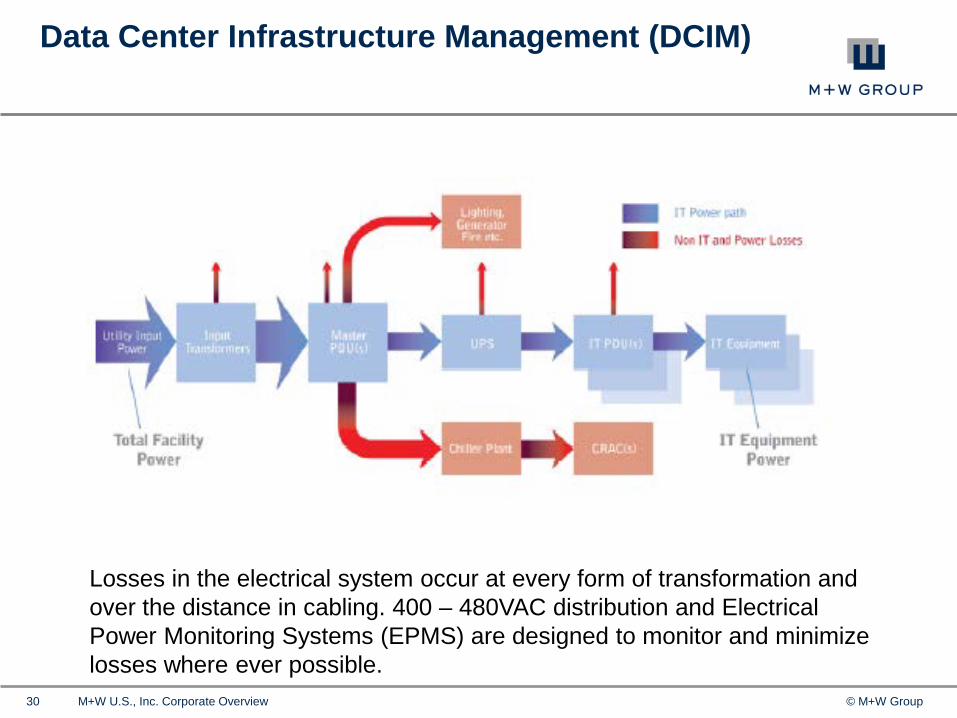
Losses in the electrical system occur at every form of transformation and over the distance in cabling. 400 – 480VAC distribution and Electrical Power Monitoring Systems (EPMS) are designed to monitor and minimize losses where ever possible.
31 © M+W Group M+W U.S., Inc. Corporate Overview
Data Center Infrastructure Management (DCIM)
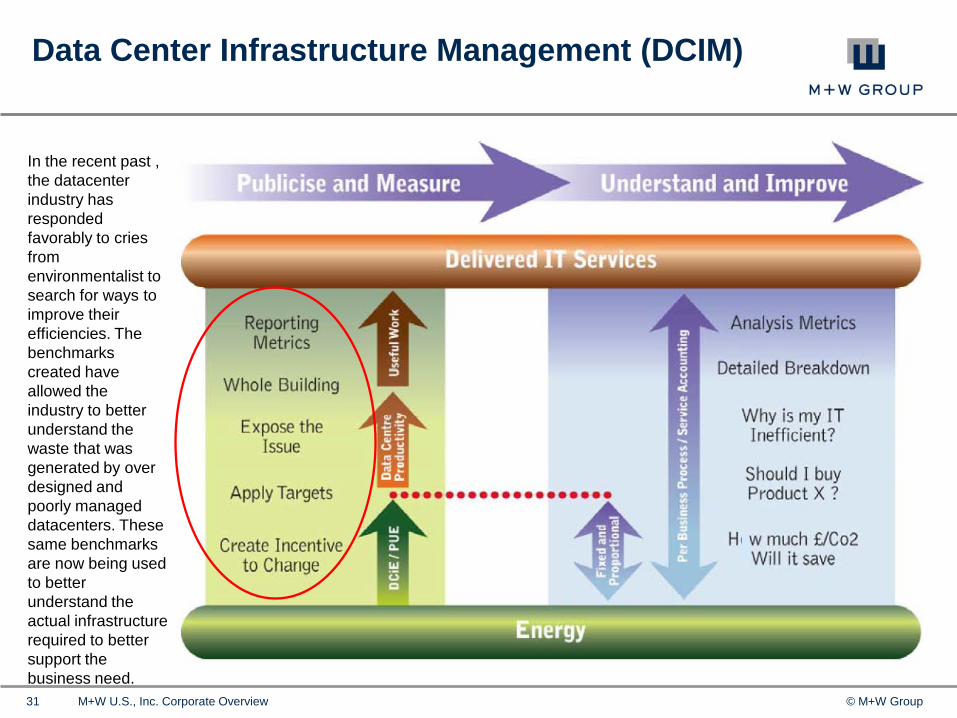
In the recent past , the datacenter industry has responded favorably to cries from environmentalist to search for ways to improve their efficiencies. The benchmarks created have allowed the industry to better understand the waste that was generated by over designed and poorly managed datacenters. These same benchmarks are now being used to better understand the actual infrastructure required to better support the business need.

32 © M+W Group M+W U.S., Inc. Corporate Overview
Data Center Infrastructure Management (DCIM)
With the use a well developed set of DCIM tools, the datacenter manager will be able to commission the facility to function as designed and then recheck that facility yearly to be sure the operating parameters do not deviate from the optimal criteria developed for the facility It’s critical to be sure that when the facility is measured yearly that the facilities’ baseline never changes.
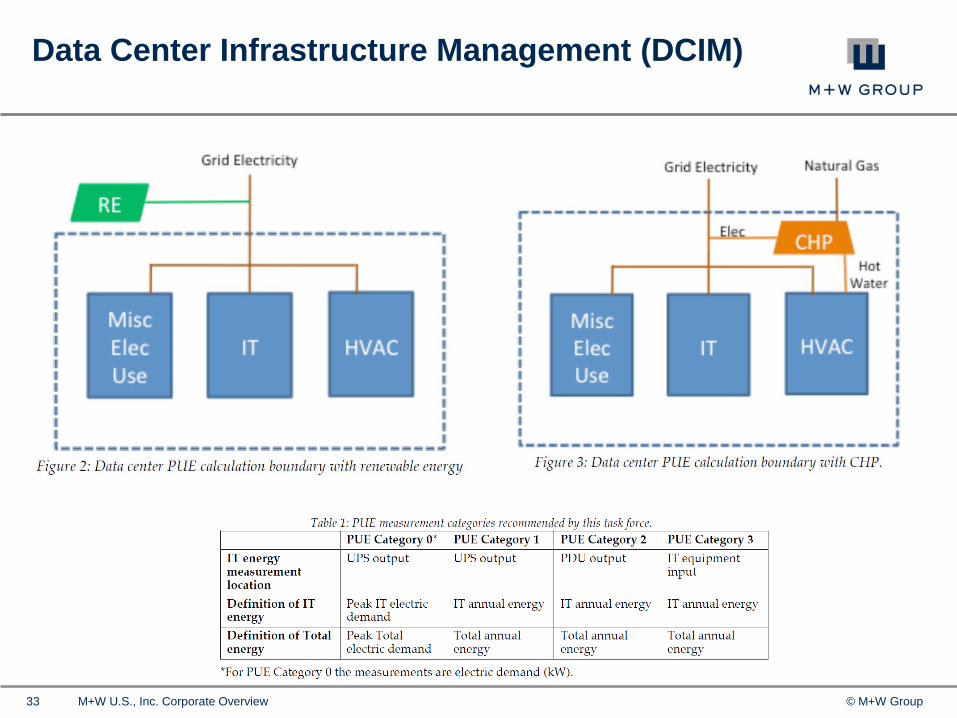
33 © M+W Group M+W U.S., Inc. Corporate Overview
Data Center Infrastructure Management (DCIM)
34 © M+W Group M+W U.S., Inc. Corporate Overview
Data Center Infrastructure Management (DCIM)
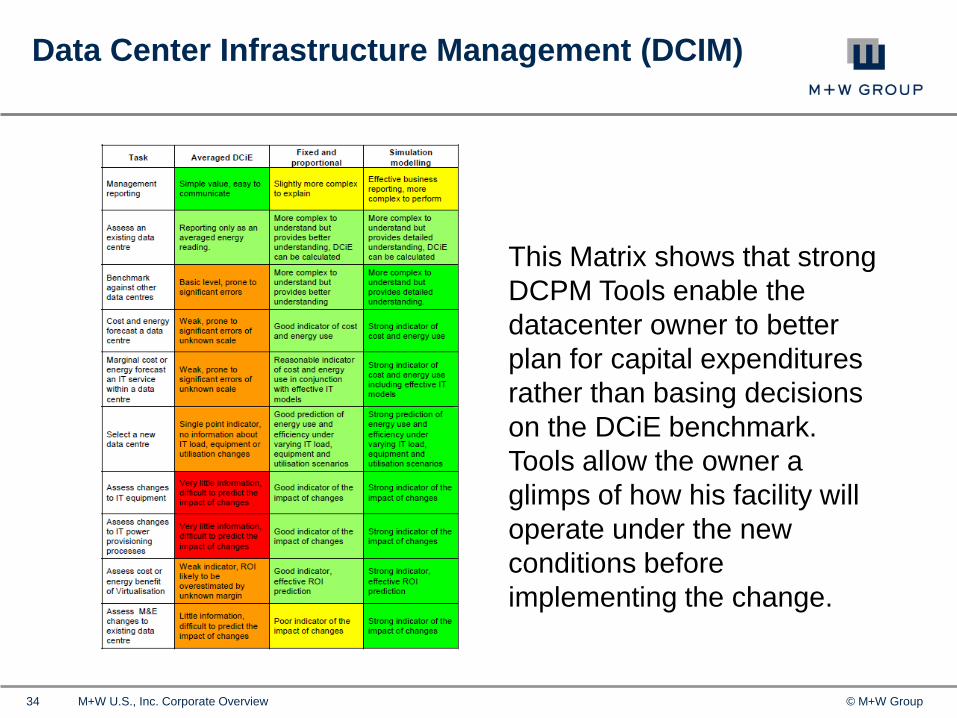
This Matrix shows that strong DCPM Tools enable the datacenter owner to better plan for capital expenditures rather than basing decisions on the DCiE benchmark. Tools allow the owner a glimps of how his facility will operate under the new conditions before implementing the change.
35 © M+W Group M+W U.S., Inc. Corporate Overview
Data Center Infrastructure Management (DCIM)
36 © M+W Group M+W U.S., Inc. Corporate Overview
Data Center Infrastructure Management (DCIM)
37 © M+W Group M+W U.S., Inc. Corporate Overview
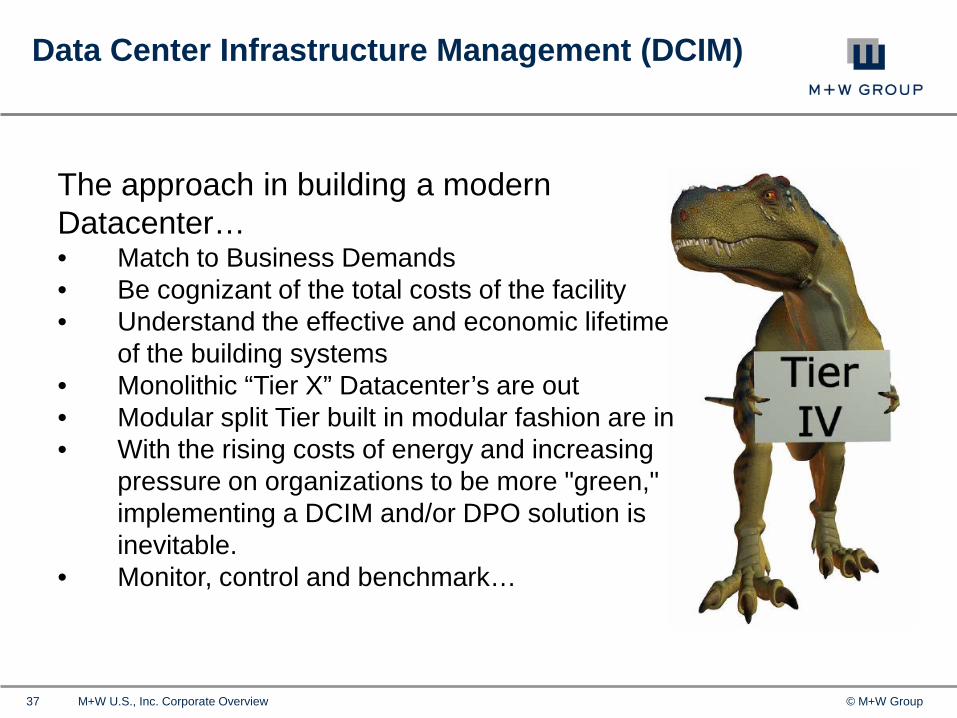
The approach in building a modern Datacenter… • Match to Business Demands • Be cognizant of the total costs of the facility • Understand the effective and economic lifetime
of the building systems • Monolithic “Tier X” Datacenter’s are out • Modular split Tier built in modular fashion are in • With the rising costs of energy and increasing
pressure on organizations to be more "green," implementing a DCIM and/or DPO solution is inevitable.
• Monitor, control and benchmark…
Data Center Infrastructure Management (DCIM)

Type your question in the box and hit submit