Embed Size (px)
Citation preview

1
Improving Safety in School Zones for Students in the Main South
Neighborhood of Worcester, Massachusetts
A Major Qualifying Project Submitted to the Faculty
of
WORCESTER POLYTECHNIC INSTITUTE
in partial fulfillment of the requirements for the
Degree of Bachelor of Science
by
Sarah Brown
Submitted:
December 13, 2018
Advisors:
Suzanne LePage, Brenton Faber, and Joseph Cullon
This report represents work of a WPI undergraduate student submitted to the faculty as evidence of a degree
requirement. WPI routinely publishes these reports on its web site without editorial or peer review. For more
information about the projects program at WPI, see http://www.wpi.edu/Academics/Projects

2
ABSTRACT
The goal of this project was to improve safety for students in Worcester, MA. Researching
other communities with safety improvements, interviewing stakeholders, and conducting site
observations of arrival and dismissal operations helped determine challenges of existing
infrastructure. An engineering-based design for a traffic calming measure in the school zone was
implemented through a temporary demonstration. Recommendations were also provided to
improve the data collection, coordination, and implementation of a Safe Routes to School program
throughout Worcester.
3
ACKNOWLEDGEMENTS
I would like to express my appreciation to my advisors Suzanne LePage, Brenton Faber, and
Joseph Cullon for their insightful and constructive suggestions during the planning and
development of this project. Thank you for giving me guidance and challenging me to push myself
to reach my goal. I am so grateful to have pursued a project that I am passionate about, and I will
never forget this project experience.
I would also like to thank Casey Starr of Main South Community Development Center for giving
me the opportunity to work on this project. My efforts culminated into something that I am proud
of, and I hope it allows you to continue to improve student safety throughout Main South. I will
never forget the lessons learned.
A special thank you to members of the Worcester community for taking the time to be a part of
this project:
Patricia Padilla and Sarah Belisea, School Staff, Woodland Academy
Winston Montalvo, Crossing Guard, Woodland Academy
Jack Foley, Vice President of Government and Community Affairs, Clark University
Jim Kempton, P.E., Director of Streets, City of Worcester Department of Public Works
Engineering Department
Karin Valentine Goins of, Co-Chair, WalkBike Worcester
Dan Daniska, Transportation Planner, Central Massachusetts Regional Planning Commission
Nicole Edmonds, Central Mass Safe Routes to School Coordinator, MassDOT
WPI Facilities

4
CAPSTONE DESIGN STATEMENT
In order to meet the criteria set forth by the Accreditation Board for Engineering and
Technology (ABET) this project met the requirements of the capstone design experience for Major
Qualifying Projects. According to ABET General Criterion 4, “students must be prepared for
engineering practice through the curriculum culminating in a major design experience based on
knowledge and skills acquired in earlier course work and incorporating engineering standards and
realistic constraints that include most of the following considerations: economic; environmental;
sustainability; manufacturability; ethical; health and safety; social; and political.” 1 A portion of
this Major Qualifying Project applied a health and safety approach to improve the quality of life
of students in the Main South neighborhood of Worcester, Massachusetts. The goal of the project
was to improve infrastructure by providing recommendations to the built environment as well as
to the collection of data about existing infrastructure, organization of stakeholders, and
implementation of recommended designs. The project incorporated the following constraints
covered in the capstone design statement: sustainability, environmental, ethical, political,
constructability, health and safety, and social.
Sustainability
Adequate walking and biking conditions can make people feel safe and can encourage more
people to use alternate modes of transport. Sustainability and quality of life was considered through
the impacts of increasing alternative modes and the overall reduction of vehicles on the road.
Environmental
This project focused on the design of the built environment and the potential to encourage
alternative modes of transportation to the private vehicle. Safer walking and biking conditions can
encourage alternate modes of transport and reduce the number of children being dropped off at
school. The reduction of the number of private vehicles on the road can result in a reduction in the
amount of fuel used, pollution from emissions, and infrastructure related resources.
Ethical
This project used technology and knowledge to better the existing built environment of the
community. It is recognized that the health, safety, and welfare of the public relies on ethical
engineering judgements, decisions, practices, and the product of the services. Additionally, this
project worked to “seek opportunities to be of constructive service in civic affairs and…the
protection of the environment through the practice of sustainable development.”2
Political
Input from the Main South Community Development Center, Woodland Academy school
officials and crossing guards, the City of Worcester Engineering Department, and various other
stakeholders within Worcester were used when designing recommendations. Collaboration
1 Criteria for Accrediting Engineering Programs (2008). 2 ASCE Code of Ethics (2017).
5
between the City of Worcester and all stakeholders is necessary for the funding and
implementation of the proposed recommendations.
Constructability
This project produced realistic traffic management and traffic calming designs that fit
student needs in the Main South neighborhood. The measures were designed to be feasible for
various stakeholders within the community to implement. From the proposed designs,
improvements to infrastructure can be made to increase student walking and biking ability and
reduce the number of children being dropped off at school.
Health and Safety
In 2016 there were 5,987 pedestrians killed in traffic crashes in the United State – a nine
percent increase from 2015.3 Creating environments that encourage reduced speeds of vehicles
and encourage alternative modes of transport can increase pedestrian safety. Additionally,
improving safety can increase more non-motorized transportation to school and reduce the amount
of traffic in school zones during arrival and dismissal times. Further, encouraging students to walk
and bike can inspire more healthy and active lifestyles at an early age.
Social
Data regarding the infrastructure and the travel modes of students in the school zone were
previously collected, but no further coordination or implementation came of past efforts. This
project analyzed, organized, and updated the data collection process. Recommendations were also
provided to improve coordination and communication of the data collection process between
stakeholders in Worcester for the future success of the Safe Routes to School program.
3 “Pedestrian Traffic Safety Facts,” National Highway Safety Traffic Administration (2018).

6
PROFESSIONAL LICENSURE STATEMENT
The requirements for achieving Civil or Environmental Engineering licensure vary state-
by-state, and Massachusetts has its own requirements as laid out in the Massachusetts General
Laws and the Code of Massachusetts Regulations. Particularly, the 250 CMR 2.00: General
Provisions, Procedures and Definitions aims to “protect the public health, safety, and welfare by
establishing requirements and procedures” by requiring engineers and land surveyors to become
licensed before being able to sign off on work.
The first step in the licensure process is to obtain a degree from an ABET-accredited
program. Upon graduation, a person can become classified as an Engineer-in-Training (EIT) by
taking and passing the Fundamentals of Engineering (FE) exam. This test proves that the person
has a thorough understanding of the basics of engineering. There are many resources available to
help prospective EITs succeed with this step.
The next step is to gain professional experience, usually by working under a licensed
engineer at a firm. The general timeframe for this is four years. During this time, it is important to
become familiar with your state’s specific requirements for licensure. A detailed application must
be submitted that documents this experience.
Finally, the Principles and Practice of Engineering (PE) Exam can be taken. Again, there
are many resources available to help people prepare for the PE exam to ensure success.
There are several reasons why it is beneficial to obtain the title of Professional Engineer.
With this distinction, future employers are aware of the skill a person possesses and the time that
has been invested. Additionally, clients can be assured that the work you provide is sound and
reliable. Being licensed is more than just knowing the technical aspects; by taking the PE exam, a
person is committing to follow the ethical obligations of the profession, as well.
The National Council of Examiners for Engineering and Surveying (NCEES) stresses that
this step in a professional career marks the point where an engineer is solely responsible for the
work they put their seal on, and therefore must work hard to uphold the quality of the work.

7
EXECUTIVE SUMMARY
Urban design literature has shown that a fundamental way to increase the safety of
pedestrian environments, apart from completely removing cars, is to reduce drivers’ false sense of
security. In other words, while it may seem counter-intuitive, urban environments with straight
roads, numerous signs, and highly visible crosswalks incentivize fast and dangerous driving
because drivers do not anticipate potential dangers. Environments should be designed to signal
unpredictability, randomness, and potential hazard to the driver. Increased unpredictability leads
to slower and more careful driving behavior.
The goal of this project was to improve safety for students at Woodland Academy by
implementing a temporary traffic calming measure in the school zone. It is becoming increasingly
important to improve safety for non-motorized transport because of the variety of benefits for a
community at large. School zones and the student demographic provide a logical starting point for
innovative infrastructure to improve driver behavior and pedestrian safety that may require more
political traction. Creating safer spaces in school zones can become a starting point for the
community to start addressing safer neighborhoods, but in the end, the benefits create a safer
network for all users. Building a successful city for children can build a successful city for all
people.
Designing quick, low-cost, and high impact urban improvements can support future
change, particularly in communities where resources are strained. Demonstrations are a unique
approach to community engagement and can reinvigorate the discussion on building better
communities. They are tool for education and encouragement that allow residents brainstorm,
create, and express ideas and ways to take ownership of their neighborhoods. Projects that focus
on connecting community members with educational resources have shown an increase in social
capital for community members and an increased interest in their community’s well-being.
The objectives of this project were:
Objective 1: Collect and evaluate data from the school zone: The MQP team obtained previously
collected data from stakeholders in the community, observed arrival and dismissal operations,
interviewed stakeholders, and facilitated a community planning workshop. Each data set was
analyzed separately and then synthesized to bring forth reoccurring themes.
Objective 2: Determine challenges presented by existing infrastructure that have high impact on
the safety and efficiency of student mobility: A high impact area was chosen based on high student
foot-traffic, proximity to the school entrances/exits, lack of clear and effective student drop-off
system, high amount of negatively observed driver behavior, and positive observed arrival and
dismissal operations that must continue to be supported.
Objective 3: Develop an engineering-based design for at least one high impact area in the
neighborhood: An engineering-based traffic calming measure was designed for the school zone
using information from Objectives 1-2, feedback from stakeholders, and standard engineering
practices. A median design was chosen because it designates a student drop-off lane, reduces lane
widths, serves as a midblock crossing, and has potential to become permanent in the future.

8
Objective 4: Implement the design temporarily in the school zone and evaluate: The traffic calming
measure was implemented temporarily in the school zone using low-cost materials. The design
was set up and broken down daily by the MQP team and a Woodland Academy crossing guard.
The design was evaluated through observation, feedback from school staff, and parent surveys.
Objective 5: Provide recommendations to future Safe Routes to School initiatives in Worcester:
Suggestions for how to continue to increase student safety at Woodland Academy were provided.
Additionally, a ‘Toolkit for Improving Student Safety’ was created as a guide for how to
implement similar initiatives at other schools in Worcester.
The design was well received by the parents, school staff, and crossing guards. Parents
were not notified prior to the demonstration, and the design was not verbally explained the morning
of. The drivers were able to use the visual cues of the redesign to navigate the space. A student
drop-off lane was organized, and the design was able to negate a large amount of bad driver
behaviors by simply not giving the space to do so. With the median and street parking on
Woodland, the lane widths were narrowed and vehicles were observed to slow down as soon as
they approached the traffic calming measure. Because the median slowed down traffic and pushed
most traffic to only one lane of the street, pedestrians felt comfortable crossing the road because
they perceived the street as less overwhelming and dangerous to cross.
The idea to put the design on Woodland St was to reduce negative behaviors while
supporting the good behaviors already in place. In doing so, the intent was to create a safer
environment directly around the school because of its potential to radiate outwards. With good
examples set around the school through the involvement of parents, students, teachers, residents,
and crossing guards, this combination of design, encouragement, and education will hopefully gain
traction as they are intended to encourage people to be more conscious of their actions.
Through the traffic calming demonstration project, a temporary and creative solution was
implemented to raise community awareness and start the conversation with a variety of
stakeholders. Teaching the community members about how to improve neighborhood safety opens
opportunities to learn. Through this strategy, neighborhoods can catalyze efforts that prioritize
safety, health, and pleasant streets over moving traffic. With the large amount of support from
stakeholders within the community and the need to improve safety in the neighborhood, continuing
work at Woodland Academy can be used as a case study to highlight the importance of such
initiatives and inspire future safety work at other schools within Worcester.

9
TABLE OF CONTENTS
Abstract ........................................................................................................................................... 2
Acknowledgements ......................................................................................................................... 3
Capstone Design Statement ............................................................................................................ 4
Professional Licensure Statement ................................................................................................... 6
Executive Summary ........................................................................................................................ 7
List of Figures ............................................................................................................................... 11
List of Tables ................................................................................................................................ 13
Chapter 1: Introduction ................................................................................................................. 15
Chapter 2: Background ................................................................................................................. 19
2.1 Woodland Academy ............................................................................................................ 19
2.2 Infrastructure ....................................................................................................................... 19
2.2.1 The Role of Chaos ........................................................................................................ 19
2.2.2 Understanding Elements of Urban Design ................................................................... 22
2.2.3 Improving Crossings..................................................................................................... 24
2.2.4 Traffic Calming ............................................................................................................ 28
2.2.5 Streetscape .................................................................................................................... 38
2.3 The Safe Routes to School Movement ................................................................................ 40
2.3.1 Federal Safe Routes to School ...................................................................................... 42
2.3.2 Case Study— Worcester, Massachusetts...................................................................... 42
2.4 Tactical Urbanism ............................................................................................................... 43
2.4.1 Case Study—Hamilton, Ontario ................................................................................... 44
2.4.2 Benefits of Demonstration Projects .............................................................................. 45
2.4.3 Planning Demonstration Projects ................................................................................. 46
Chapter 3: Methodology ............................................................................................................... 49
3.1 Objective 1: Collect and evaluate data from the school zones in Main South. .................. 49
3.1.1 Existing infrastructure and operations .......................................................................... 49
3.1.2 Stakeholder interviews ................................................................................................. 49
3.1.3 Community workshop .................................................................................................. 50
3.2 Objective 2: Determine challenges presented by existing infrastructure that have high impact
on the safety and efficiency of student mobility. ...................................................................... 50
3.3 Objective 3: Develop engineering-based designs for at least one high impact area in the
neighborhood. ............................................................................................................................ 51
3.4 Objective 4: Implement the design temporarily in the school zone and evaluate. .............. 51

10
3.4.1 Implementation ............................................................................................................. 51
3.4.2 Evaluation ..................................................................................................................... 51
3.5 Objective 5: Provide recommendations to challenges of creating a Safe Routes to School
plan. ........................................................................................................................................... 51
Chapter 4: Results and Analysis ................................................................................................... 52
4.1 Objective 1: Collect and evaluate data from the school zones in Main South. .................. 52
4.1.1 Previously Collected Data ............................................................................................ 52
4.1.2 Analysis ........................................................................................................................ 53
4.1.3 Arrival and Dismissal Observations: ............................................................................ 54
4.1.4 Stakeholder interviews ................................................................................................. 56
4.1.5 Community workshop .................................................................................................. 57
4.2 Objective 2: Determine challenges presented by existing infrastructure that have high impact
on the safety and efficiency of student mobility. ...................................................................... 58
4.3 Objective 3: Develop engineering-based designs for at least one high impact area in the
neighborhood. ............................................................................................................................ 58
4.4 Objective 4: Implement and evaluate the design temporarily in the school zone. .............. 59
4.4.1 Driver behavior ............................................................................................................. 60
4.4.2 Vehicle speed ................................................................................................................ 61
4.4.3 Pedestrians .................................................................................................................... 62
4.4.4 Analysis ........................................................................................................................ 62
4.4.5 Suggestions to Stakeholders for Continued Success at Woodland Academy .............. 63
4.5 Objective 5: Provide recommendations to challenges of creating a Safe Routes to School
plan. ........................................................................................................................................... 66
Chapter 5: Toolkit for Improving Student Safety ......................................................................... 67
Appendices A: MQP Proposal ...................................................................................................... 72
Appendix B: Arrival and Dismissal Observations .................................................................... 88
Appendix C: Interviews with Stakeholders ............................................................................... 99
Appendix D: Survey/ Circulation Flyer Template .................................................................. 103

11
LIST OF FIGURES
Figure 1: Woodland Academy and Claremont Academy in Main South neighborhood of Worcester, MA
Figure 2: Main Street in the Main South neighborhood of Worcester, MA
Figure 3: May street in Worcester, MA
Figure 4: Woodland Academy entrance on Woodland Street
Figure 5: Relationship between design and community life
Figure 6: Driving speed fatality risk chart
Figure 7: Curb extension at a midblock crossing
Figure 8: Schematic of bus bulb in a commercial district
Figure 9: Pedestrian crossing island
Figure 10: Advanced yield markings at a midblock crossing
Figure 11: Curb radius reduction with additional landscaping
Figure 12: Effective radius in relation to actual curb radius
Figure 13: Angled choker in a residential area
Figure 14: Road diet with a landscaped center
Figure 15: Chicane used to horizontally divert traffic
Figure 16: Landscaped median
Figure 17: Mini circle in a residential area
Figure 18: Diverter with bicycle access in a residential area
Figure 19: Gateway to a district in an urban area
Figure 20: Yield street in a residential neighborhood
Figure 21: Street furniture in a commercial district
Figure 22: Mapped plinth
Figure 23: Illuminated crosswalk
Figure 24: Landscaped buffer complemented by on-street parking
Figure 25: Intersection repair in Hamilton, Ontario
Figure 26: Summary of arrival and dismissal observations at Woodland Academy
Figure 27: Proposed median design on Woodland Street
Figure 28: Implemented median design
Figure 29: Median design during arrival when Woodland functions as a one-way street
Figure 30: Median design when Woodland functions as a two-way street

12
Figure 31: Success during a demonstration day
Figure 32: Main South neighborhood in Worcester, MA
Figure 33: Entrance to Claremont Academy
Figure 34: Designated school bus drop-off and pick-up area on Woodland Street
Figure 35: Public space in front of Woodland Academy
Figure 36: Lack of buffer zone on Claremont Street
Figure 37: No Parking observed on Woodland St
Figure 38: Crosswalk on Claremont Street with blocked off staircase
Figure 39: Back alleyway with sign about parent/teacher meeting that morning/evening
Figure 40: Asphalt patch and retaining wall next to staff parking lot on Woodland Street
Figure 41: Community garden on corner of Claremont Street and Claremont Square
Figure 42: Lack of curb cuts on corner of Oberlin and Claremont Sq
Figure 43: Beginning/end of school zone at intersection of Woodland Street and Norwood Street
Figure 44: Curved road adjacent to Clark University
Figure 45: Survey template (English)
Figure 46: Survey template (Spanish)

13
LIST OF TABLES
Table 1: Costs for MassDOT SRTS Project at Elm Park Community School
Table 2: Stakeholders involved in improving student safety at Woodland Academy
Table 3: Suggestions for Stakeholders for Continued Success at Woodland Academy
Table 4: SRTS Prompt List

14

15
CHAPTER 1: INTRODUCTION
The safety of students and pedestrians needs to be improved in the Main South
neighborhood of Worcester, Massachusetts. The Main South and Piedmont neighborhoods of
Worcester, Massachusetts are the most densely populated in the city. They have the highest
number of minority residents, the lowest per capita income, and the highest crime rate within the
city.4
Woodland Academy (K-6) and Claremont Academy (7-12) share a school building at 93
Woodland Street in the Main South neighborhood (Figure 1). There are 597 students enrolled in
Woodland Academy and 552 students enrolled at Claremont Academy.5
Figure 1: Woodland Academy and Claremont Academy in Main South neighborhood of Worcester, MA6
The school is in a residential area, and school transportation is not provided except for children
with disabilities. Students are expected to walk, bike, or be dropped off. However, the existing
infrastructure design of the neighborhood including the street (width, layout, and purpose),
sidewalks, intersections and crosswalks, and signals and signs create unsafe conditions for student
travel. The current urban design leads to inattentive and unsafe driver behaviors, especially during
the two schools' arrival and dismissal times.
Within the catchment area of the school, students walking and biking to school must cross
streets with high traffic volumes. Approximately 1310 reported crashes were within the ¼ mile
radius within the catchment area of Woodland Academy from 2002 to 2016.7As Figure 2 shows,
Main Street connects the neighborhood to the downtown. The street is home to businesses, Clark
University, and a large amount of pedestrian traffic. It cuts through the center of the Main South
4 Downs, Timothy, Ross, Laurie, Patton, Suzanne, “Complexities of holistic community-based participatory research
for a low income, multi-ethnic population exposed to multiple built-environment stressors in Worcester,
Massachusetts,” Environmental Research. (2009): 1028. 5 “Woodland Academy School Profile,” “Claremont Academy School Profile,” Worcester Public Schools (2018). 6 Google Maps (2018). 7 MassDOT Crash Portal (2016).

16
neighborhood and is crossed by many pedestrians (including students) as they travel to different
anchors in the neighborhood.
Figure 2: Main Street in the Main South neighborhood of Worcester, MA8
May street, shown in Figure 3 poses similar threats to pedestrians. May Street connects
Park Avenue to Main Street. Aspects of the built environment that reduce safety on these streets
include wide lanes and straight street layouts, line-of-sight obstructions limiting pedestrians from
seeing vehicles and vehicles from seeing pedestrians, and a lack of separation between pedestrians
and vehicles.
Figure 3: May street in Worcester, MA9
8 Google Maps (2018). 9 Google Maps (2018).

17
Driver behavior at intersections, making high number of turns, failing to stop for pedestrians,
entering crosswalks before looking for pedestrians, and running red lights also place pedestrians
in danger.
While Main and May streets have the highest crash volumes and traffic incidents, the
residential streets directly surrounding the school are similarly unsafe. As Figure 4 demonstrates,
the surrounding infrastructure shares similar characteristics with Main and May Streets.
Specifically, the impact of the built environment on driver behavior is one of the most notable
threats to the safety of students, especially during the two schools’ arrival and dismissal times.
Figure 4: Woodland Academy entrance on Woodland Street
Parents dropping students off in the travel lane, vehicles stopping within crosswalks, and drivers
speeding through the school zones make the time spent getting to and from school stressful. Those
who must walk or bike to school experience unpredictable, uncomfortable, and unsafe conditions.
Students who get dropped off at school do so at a cost; as more students are dropped off, more
traffic during arrival and dismissal times impacts the safety of other students walking and biking.
The cycle between safety and traffic in the neighborhood will continue indefinitely until action is
taken to improve conditions.
Urban design literature has shown that a fundamental way to increase the safety of pedestrian
environments, apart from completely removing cars, is to reduce drivers’ false sense of security.
In other words, while it may seem counter-intuitive, urban environments with straight roads,
numerous signs, and highly visible crosswalks incentivize fast and dangerous driving because
drivers do not anticipate potential dangers. Environments should be designed to signal
unpredictability, randomness, and potential hazard to the driver. Increased unpredictability leads
to slower and more careful driving behavior.
Intrigue and spontaneity are a part of everyday life in urban areas; urban spaces are attractive
and exciting because they can be chaotic and unpredictable. To emphasize that drivers are heading
toward areas that could become unpredictable, designers should increase the ambiguity within the
space. Mobility must be designed to be chaotic instead of controlled and separate; neighborhood

18
activity and vehicle movement must coexist spontaneously in the same space. Design signals the
vitality of community and economic life desired by the community and hence the degree of
unpredictability inherent in the environment. It also sends a message to drivers that the street is a
shared space: a space for both movement and public life. Slowing traffic down by increasing
intrigue and uncertainty can complement the community and economic activity on the street and
encourage even higher levels of social and economic activity.10
The Federal Safe Routes to School program was created to improve student-pedestrian
safety. The program work to collect data about safety conditions of children walking and biking
in school zones to the National Center for Safe Routes to School (NCSRTS). The program uses
education, encouragement, engineering, and enforcement to create safer pedestrian school
environments. Research from the Federal Safe Routes to School program has shown that many
initiatives take place within low-resourced areas. The Main South neighborhood meets most
criteria established by these programs and, as such, is an ideal location for addressing unsafe
pedestrian school routes. Creating safety awareness in the school zone can become a starting point
for the community to start addressing safer neighborhoods, but in the end, the benefits create a
safer network for all users. Building a successful city for children can build a successful city for
all people.11
The goal of this project is to improve safety for students at Woodland Academy. Research
will review other communities and organizations that have implemented safety improvements,
analyze existing collected data from the neighborhood, interview stakeholders, and conduct site
observations of arrival and dismissal operations. Recommendations will focus on ways to create
safer arrival and dismissal times as well as how to improve the data collection, coordination, and
implementation of a Safe Routes to School plan. By improving the safety of students in the
neighborhood, youth-centered safety initiatives can spark further movement to create spaces where
safety is not a barrier to mobility.
Objectives:
1. Collect and evaluate data from the school zone.
2. Determine challenges presented by existing infrastructure that have high impact on the
safety and efficiency of student mobility.
3. Develop an engineering-based design for at least one high impact area in the neighborhood.
4. Implement the design temporarily in the school zone and evaluate.
5. Provide recommendations to future Safe Routes to School initiatives in Worcester.
10 Engwicht, David, “Intrigue & Uncertainty: Towards New Traffic-Taming Tools.” 11 David Byrne, Bicycle Diaries, 283.

19
CHAPTER 2: BACKGROUND
2.1 Woodland Academy Woodland Academy is a Title 1 school within the Main South neighborhood with a student
base that is predominantly lower-income. Transportation is not provided to Woodland Academy
(with some exceptions made for students with disabilities). Students enrolled live within a one-
mile radius of the school and must walk, bike, or be dropped off. While the Commonwealth works
to provide all students in Title 1 schools with access to the same academic content, regardless of
zip code, background, or abilities, it is also important to consider the responsibility of the
Commonwealth in protecting student safety in face of built environment stressors within school
zones.
Woodland Academy students and parents must draw attention to how to get to and from school
safely within the school’s catchment area. A network of heavy traffic volumes and lack of
sufficient infrastructure for pedestrians has created a stressful environment that is unsafe for
students to walk or bike to and from school and other anchors in the community (parks, community
centers, etc). Arrival and dismissal times at Woodland Academy are spent battling driver behavior.
Existing conditions on streets in the neighborhood such as wide lane widths and lack of bends or
curvature in the road allow for high vehicle speeds. Additionally, with many parents dropping off
students, many bad driver behaviors take place as a result of an improper balance between the
right-of-way, vehicles, and pedestrians. This creates chaos during arrival, and existing
infrastructure enables drivers rather than prioritizing the pedestrian.
2.2 Infrastructure
2.2.1 The Role of Chaos
Intrigue and spontaneity are a part of everyday life in urban environments; they are
beautiful and exciting because they are chaotic and unpredictable. Radical connectivity thrives
within the physical framework of compact urbanism because the city is one of the most complex
and basic human technologies.12 The quality of life of a community can be increased when
neighborhood activity and car movement can coexist spontaneously in the same space. The health
of any city can be judged by the health of its ‘spontaneous exchange realm’ – the amount of ‘good
things’ that happen accidentally as people move through public space.
Design signals the vitality of community and economic life desired by the community and
hence the degree of unpredictability inherent in the environment. It also sends a message to drivers
that the street is a shared space: a space for both movement and public life. Slowing traffic down
by increasing the intrigue and uncertainty factor can complement the community and economic
activity on the street and encourage even higher levels of social and economic activity.
Considering the human body, sense, and mobility are the key to good urban planning for
people. It is not an option to neglect the human scale, especially when designing for transportation.
However, humancentric urban areas are a rare commodity when compared to places designed to
accommodate the vehicle. In the early 1900s the emerging traffic engineering profession,
automobile manufacturers, oil producers, and insurance companies collectively hijacked streets
12 Gehl, Jan Cities are for People (2010): 76.

20
for a century of relentless car-centric development.13 Designing cities for cars has caused a
misunderstanding of scale.14 Although safety should always be a designer’s top priority, design
differences for vehicle safety and pedestrian safety have created the rhetoric of a safety paradox.15
One common myth in traffic engineering is the only way to improve safety is to increase
predictability by reducing the number of spontaneous events the driver may be exposed to.
Increasing predictability would give vehicles more room, physically and figuratively, to make
mistakes and be able to recover. Roadways are designed to be predictable. In doing so, the driver
drives with the perception that it is highly unlikely to encounter anything unpredictable. However,
this is not possible within an urban environment; it creates a false sense of security. Making the
travel environment safer, and the driver will travel faster.
A driver’s senses no longer need to be on high alert when the unpredictable is taken away and
predictability is increased. This becomes dangerous if something unpredictable were to occur, such
as a pedestrian crossing the street, and adds the same amount of risk to the safety level. The driver
could be too zoned out or driving too fast to deal with the unexpected distraction. It is important
that roadways have the certain risk factor of intrigue and uncertainty to prevent risk caused by
negligence. Make the travel environment less predictable, and the driver will travel slower. The
same amount of risk will be taken as before, but drivers will be going slower.
Another important point to understand is safety is maximized when the perceived risk is equal
to, or higher than the actual risk. Actual unsafe environments are when the actual risks are
statistically higher than the perceived risk because drivers are reassured into a false sense of
security about the degree of danger present. When a driver is on a street and sees unexpected
activity, they will naturally slowdown in order to take in visual clues to decipher what is happening
ahead. Questions of 'What is happening?’ will be raised. If the 'normative state' of a street is that
the unexpected should be expected, then all of the visual clues must point in this direction. The
key to safety is to reduce the differential between actual and perceived risk.
Lastly, community vision, not design criterion, must determine the amount of intrigue and
uncertainty built into a space. Cities that are working to increase the vitality and health of their
neighborhoods while making the design of their streets more predictable end up with the worst of
both worlds: diminished neighborhood life and unsafe streets. Vibrant neighborhoods with safe
streets equals high levels of ambiguity in the street design (Figure 5).
13 Speck, Jeff. Tactical Urbanism (2012). 14 Gehl, Jan Cities are for People (2010): 55. 15 Engwicht, David, “Intrigue & Uncertainty Towards New Traffic Taming Tools (2012).

21
Figure 5: Relationship between design and community life16
The loss of streets started with feeling intimidated and retreating. No accident at a pedestrian
crossing, where the pedestrian is obeying the law, should be blamed on the pedestrian, regardless
of whether they are feeling a ‘false sense of security’ or not. It is the driver who is not taking due
care, and this is partly because the motorist has already been lulled into a false sense of security.
Refusing to be intimidated and highly valuing the street for spontaneous social and cultural activity
can help communities win them back. Using activity and design to reclaim streets from traffic
involves a reversal of the surrender and erosion process – a gradual moving of human activities
back towards the street.
The fundamental ways to increase the safety of environments is to reduce the driver’s false
sense of security and reducing driver speeds by introducing new design elements. However, simply
listing the rules of etiquette on signs destroy uncertainty, depersonalize the space, and convey the
message that the space is owned primarily by traffic. With the main goal of design creating intrigue
and uncertainty, ambiguity can be an important part of this message of consistency. Traffic signs
insult the intelligence of the driver, and the roads should tell the story of their surroundings.17
Engineers must design environments that signal to the driver that they are most likely to encounter
high levels of unpredictability; the greater the level of unpredictability likely to be encountered,
the greater the ambiguity required in the design.
Because safety plays to the predictableness of an environment, ever-changing streetscapes
must be created. Streets with high levels of human activity will not need to change its streetscape
as often because the human activity becomes the major source of intrigue and uncertainty. It is
therefore important to not only promote high levels of human activity in the street (which has a
high intrigue factor and is often unpredictable), but to have design elements that are unique,
movable and change on a regular basis. Increasing levels of human activity increases intrigue and
uncertainty and can overpower other design elements.18
16 Engwicht, David, “Intrigue & Uncertainty Towards New Traffic Taming Tools (2012). 17 Monderman, Hans, Project for Public Spaces, (2008). 18 Engwicht, David, “Intrigue & Uncertainty Towards New Traffic Taming Tools (2012).

22
2.2.2 Understanding Elements of Urban Design
Roadways
Roadways are used to transport various modes efficiently and safely. Lane widths should
be designed with consideration for all needs including travel lanes, safety islands, bike lanes, and
sidewalks. In urban settings, every foot counts, and restrictive policies that favor the use of wider
travel lanes have no place. Narrower streets help promote slower driving speeds which, in turn,
reduce the severity of crashes. Narrower streets have other benefits as well, including reduced
crossing distances, shorter signal cycles, less stormwater, and less construction material to build.
Lane widths of 10 feet are appropriate in urban areas for street safety without impacting
traffic operations. Lane widths of more than 11 feet should not be used as they may cause
unintended speeding and assume valuable right of way at the expense of other modes.19 In select
cases, narrower travel lanes (9–9.5 feet) can be effective as through lanes in conjunction with a
turn lane.
Sidewalks
Sidewalks and walkways were invented to separate pedestrians from motor vehicles and
are associated with significant reductions in collisions. Sidewalks should be continuous and act as
a part of a system that provides access to facilities such as work, schools, businesses, and
recreational areas20. Sidewalks can be categorized into four zones: curb, furniture, pedestrian, and
frontage.
1. The curb zone provides a barrier from the street and a transition to the street from the
sidewalk.
2. The furniture zone is where items that can be an obstacle to pedestrian traffic or obscure
driver or pedestrian views (poles, signposts) are placed.
3. The furniture zone also becomes a buffer zone from the roadway and the pedestrian
zone.
4. The pedestrian zone is people walk to and from. The frontage zone provides a space
between pedestrians and buildings.
Where a sidewalk is directly adjacent to moving traffic, the desired minimum is 8 feet so there can
be a minimum buffer of 2 feet for street furniture or other utilities.21 This can be created through
street furniture, street parking, or bicycle lanes.22 The use of shoulders as a substitute for sidewalks
is never justified in urban areas.
Curbs
Curb ramps provide access to street crossings and improve accessibility for people with
mobility restrictions. To design mobility equitably, it is essential to plan for those who have
difficulty when moving from sidewalk to the level of the roadway due to differences in height of
the surfaces. The Americans with Disabilities Act (ADA) created the Rehabilitation Act in 1973
19 “Urban Design Guideline,” National Association of City Transportation Officials. 20 “Facility Design,” Pedestrian Bicycle Information Center (2018). 21 “Urban Design Guideline,” National Association of City Transportation Officials. 22 “Facility Design,” Pedestrian Bicycle Information Center (2018).

23
mandating curb ramps be installed at all intersections and midblock locations where there are
pedestrian crossings.23 Curb ramps must have a slope of no more than 1:12 and a maximum slope
on any side flares of 1:10.24
On-Street Parking
Parking lane widths of 7-9 feet are recommended. Where loading and double parking is
required, wide parking lanes of up to 15 feet can be used.25 Street parking is favored in urban areas
because cars protect pedestrians from errant vehicles and act as buffer between roadway and
sidewalk. On-street parking narrows the road and can help to reduce traffic speeds.
Street Trees
Street trees are used for both function and aesthetics. Street trees can slow traffic speeds,
especially when placed on a curb extension in line with on-street parking. Larger trees protect
pedestrians from errant vehicles by creating a buffer between pedestrians and the roadway. Trees
also provide shade to homes, businesses, and pedestrians and may increase pavement life by
avoiding extreme heat. Aesthetically, street trees frame the street and the sidewalk as discrete
public realms, enriching each with a sense of rhythm and human scale. Tree spacing depends upon
a number of key factors such as species characteristics, standard (or desired) tree pit size, fixed
property lines, setback from curb, and integration with street lights and other furniture.
Removal of roadside impediments (trees, street furniture, etc.) has an ambiguous safety
record in urban environments. Street trees have been removed in many contexts to satisfy sight
distance or clear zone requirements. However, this concept is at odds with city policies striving to
increase pedestrian traffic and spur economic activity. Street trees and other roadside features are
superior to wide shoulders or run-off zones, as they can decrease overall speeds and encourage
pedestrian-friendly environments.26
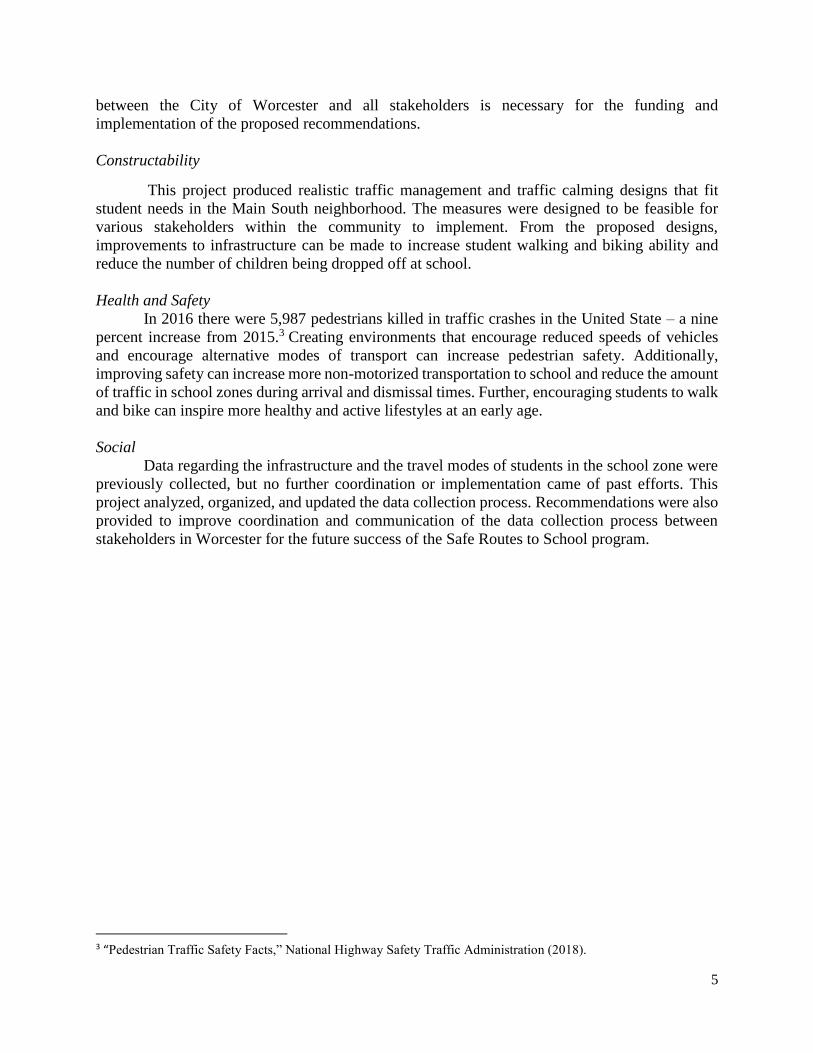
Design Speed
In order to counteract unjust and unnecessary injuries and fatalities, urban areas should use
speed controlling interventions to influence driver behavior and reduce speeds. Lower design
speeds reduce observed speeding behavior, providing a safer place for people to walk, park, and
drive. Higher design speeds correlate with larger curb radii, wider travel lane widths, on-street
parking restrictions, guardrails, and clear zones. Reducing speeds may be the most consequential
intervention in reducing conflicts; prioritize forgiving speeds rather than forgiving design (Figure
6).
23 ADA 24 ADA 25 “Urban Street Design Guidelines,” National Association of City Transportation Officials. 26 “Urban Street Design Guidelines,” National Association of City Transportation Officials.
24
Figure 6: Driving speed fatality risk chart27
2.2.3 Improving Crossings
Crosswalk
Crosswalks are a marked area of the road where pedestrians have the right of way to cross.
Crosswalk locations should be convenient for pedestrians. However, it is important to note that
crosswalk markings alone are unlikely to benefit pedestrian safety. Additionally, on streets with
low volume (<3000 ADT), low speeds (<20 mph), and few lanes (1–2), marked crosswalks are not
always necessary at intersections. On streets with higher volumes, higher speeds, or more lanes,
crosswalks should be at intersections.28
The context of the area and the relationship with other crossing design measures is essential
to improving safety of the pedestrian crossing. There is no absolute rule for crosswalk spacing, but
the block length, street width, building entrances, traffic signals must be taken into consideration.
120-200 feet has been shown to be sufficient.29 Marked crosswalks also have an important role in
designing for pedestrians with vision loss and people with mobility restrictions.30 Crosswalks
should extend to the sidewalk curb ramps. Crosswalks should be at least six feet wide and white
lines outlining the crosswalk should be six to 24 inches in width if needed.31
27 “Urban Street Design Guidelines,” National Association of City Transportation Officials. 28 “Urban Street Design Guidelines,” National Association of City Transportation Officials. 29 “Urban Street Design Guidelines,” National Association of City Transportation Officials. 30 “Facility Design,” Pedestrian Bicycle Information Center (2018). 31 “Slow your street: A How-To Guide for Pop-Up Traffic Calming,” Trailnet (2016).

25
Curb extension (bulb outs, neck downs, bus bulbs)
Curb extensions (Figure 7) are used to reduce street width and crossing distance. In doing
so, it reduces the amount of time a pedestrian is in the street. Curb extensions physically and
visually narrow the roadway. They work to reduce the speed of drivers because their perception of
what speed to drive changes. Curb extensions can only be used when there is an on-street parking
lane. They should not extend more than 6 feet from the curb or extend into travel lanes, bicycle
lanes, or shoulders.
Curb extensions improve the human-scale and the ability of pedestrians and drivers to see
each other. The extensions prevent motorists from parking in or too close to a crosswalk; when
vehicles park too close to a crosswalk or corners they block sightlines and obscure the visibility of
pedestrians and other vehicles. They can also be used as midblock crossings.
The level of service of the area should be considered in terms of everyday turning needs of
large vehicles, such as school buses, or other vehicles that normally drive through the area. Curb
extensions also provide space for the installation of a curb ramp when the space from existing
infrastructure is limited.32 It should be noted that they can make it difficult for emergency vehicles
and large trucks to make turns.33
Figure 7: Curb extension at a midblock crossing34
Another type of curb extension is a bus bulb (Figure 8). These are curb extensions that
align the bus stop with the parking lane, allowing buses to stop and board passengers without ever
leaving the travel lane. Bus bulbs help to keep buses moving efficiently without decreasing the
amount of time lost when merging in and out of traffic. They have a desired length of 140 feet for
frequent service and may have lengths of 30 feet for routes with less frequent service. The bus
bulb should be equal to the width of the parking lane present and should have a return angle of 45
degrees.
32 “Facility Design,” Pedestrian Bicycle Information Center (2018). 33“Facility Design,” Pedestrian Bicycle Information Center (2018). 34 “Curb Extensions,” PEDSAFE.

26
Figure 8: Schematic of bus bulb in a commercial district35
The cost of a curb extension can range from $2,000 to $20,000 depending on the design
and site condition with an average cost of approximately $12,000. It is important to consider
drainage and storm water management impacts. Additionally, if the curb extension area is large
and requires moving utilities, special pavement, street furnishings costs will be significantly
higher—a green/vegetated curb extension can vary from $10,000 to $40,000.36
Midblock Crossings and Crossing Islands
Midblock crosswalks facilitate crossings to places that people want to go but that are not
well served by the existing traffic network. Midblock crosswalks are placed where there is a
significant pedestrian desire line. Crossing islands, or refuge islands (Figure 9), are in the center
of the roadway and given the view of oncoming traffic. Crossing islands complement crosswalks
by calling greater attention to them. Crossing high-volume roads can be difficult and dangerous
without safety in the middle of the roadway. Crossing islands enhance the safety of pedestrian
crossings and reduce vehicle speeds approaching pedestrian crossings. Pedestrians can focus on
one direction of traffic at a time and wait for a gap in traffic before crossing the second half of the
street and are reduced to exposure time in the roadway.37
35 “Urban Street Design Guidelines,” National Association of City Transportation Officials. 36 “Facility Design,” Pedestrian Bicycle Information Center (2018). 37 “Facility Design,” Pedestrian Bicycle Information Center (2018).

27
Figure 9: Pedestrian crossing island38
Islands should be at least four feet wide (eight feet for additionally pedestrian comfort and
safety) and have an adequate length (ideally 40 feet long) for pedestrians to stand.39 The cut-
through or ramp should equal the width of the crosswalk.40 The design of the island curvature can
influence driver behavior and reduce conflicts. Vertical elements such as trees, landscaping, and
overhead signage help to identify crosswalks and islands to drivers.41 All crossing islands should
have a nose which extends past the crosswalk to protect people waiting on the median. It also
slows the turning speed of drivers. Crossing islands have been demonstrated to decrease
pedestrian-vehicle incidents by 46% at crosswalks and by 39% at unmarked crossings.42
Costs of installing a raised concrete pedestrian island with landscaping can range from
$535 to $1,065 per foot, and the total cost of construction can range from $3,500 to $40,000
depending on the design, site conditions, and whether the islands can be added as a part of another
construction project. However, the cost of an asphalt island or one without landscaping can be
much less. Asphalt and concrete have a service life of 20 and 40 years respectively.43
Advanced stop lines/yield markings
Advanced stop lines or yield markings are a design component used to reduce the
likelihood of a multiple-threat crash at crossings where there is no signal to alert drivers where to
stop to let a pedestrian cross (Figure 10).44The markings are used placed 20 to 50 feet ahead of the
crosswalk.45 Markings should be accompanied by ‘Stop (or Yield) Here for Pedestrians’ signs that
meet MUTCD standards: R1-5, R1-5a, R1-5b, or R1-5c. However, the use of advance stop or yield
38 “Proven Safety Countermeasure,” FHWA Safety. 39 “Proven Safety Countermeasure,” FHWA Safety. 40 “Urban Street Design Guideline,” National Association of City Transportation Officials. 41 “Urban Street Design Guideline,” National Association of City Transportation Officials. 42 “Proven Safety Countermeasure,” FHWA Safety. 43 “Facility Design,” Pedestrian Bicycle Information Center (2018). 44 MUTCD 45 “Urban Street Design Guideline,” National Association of City Transportation Officials.

28
line depends on state law. Massachusetts state law allows yield lines (12 in. by 18 in.) used in
advance of pedestrian crossings to emphasize pedestrian priority.46
Figure 10: Advanced yield markings at a midblock crossing47
The success of the markings depends on driver compliance. If placed too far in advance of
the crosswalk, drivers might ignore the line. One study found that use of a "sign alone reduced
conflicts between drivers and pedestrians by 67 percent, and with the addition of an advanced stop
or yield line, this type of conflict was reduced by 90 percent compared to baseline levels.”48 The
cost to install lines is approximately $200 to $800 per intersection when a part of a new
paving/repaving project. When adding just markings, the cost is approximately $1000 to $2000
and adding signage will cost approximately $200 each.49
2.2.4 Traffic Calming
Traffic calming is used to design streets with physical and visual cues to encourage drivers
to drive more slowly and more aware of surroundings. Techniques aim to reduce traffic speeds,
the number and severity of crashes, and noise levels. Most importantly, traffic calming is self-
enforcing; the design of the roadway results in the desired effect, without relying on compliance
with traffic control devices such as signals and signs, and without relying on enforcement.50
Curb Radius Reduction
Curb radius reduction (Figure 11) is a traffic calming technique that considers the effective
radius over the actual radius of the curb to influence driver behavior. Curb radii reductions are
often used if the functional class of a roadway has changed. Actual curb radius refers to the
curvature along the curb line; effective radius refers to the curvature vehicles follow when turning
(Figure 12). Curb radii should be as small as practical. Larger curb radii can result in high-speed
46“Separated Bike Lane Planning and Design Guide,” MassDOT (2017). 47 “Advanced Yield Signs,” PEDSAFE. 48 Van Houten, Malenfant (1992). 49 “Facility Design,” Pedestrian Bicycle Information Center (2018). 50 “Facility Design,” Pedestrian Bicycle Information Center (2018).

29
turning movements by drivers while smaller radii force drivers to reduce vehicle speed by making
sharper turns. Decreasing the speed at which turns are made can decrease the risk of pedestrians
being struck by right-turning vehicles. Smaller radii also provide larger pedestrian waiting areas
at corners, improve sight distances, and allow for greater flexibility of curb ramp placement.51
While standards for curb radii are 10-15 feet, many cities use corner radii as small as 2 feet. In
urban settings, smaller corner radii are preferred. Turning speeds should be limited to 15 mph or
less. Additional lane width may also be necessary for receiving lanes at turning locations with tight
curves, as vehicles take up more horizontal space at a curve than a straightaway.52
Figure 11: Curb radius reduction with additional landscaping 53
Figure 12: Effective radius in relation to actual curb radius54
51 “Facility Design,” Pedestrian Bicycle Information Center (2018). 52 “Urban Street Design Guideline,” National Association of City Transportation Officials. 53 “Reduced Corner Radii,” Safe Routes to School Guide. 54 “Reduced Corner Radii,” Safe Routes to School Guide.

30
During curb radius reduction, it is important to balance the turning needs of the design
vehicle with consideration for nearby land uses and the diversity and prevalence of roadway users
(pedestrians, bikers, large vehicles, trucks, emergency vehicles, etc.). An inadequate turning radius
in areas where there are high volumes of large vehicles making turns could cause vehicles to drive
over the curb onto the sidewalk and put waiting pedestrians at risk. Adding parking and/or bicycle
lanes can increase the effective radius of the corner. A popular technique is varying the actual curb
radius over the length of the turn to create a compound curve where the radius is smaller, slowing
vehicles as they approach a crosswalk and becoming larger after the crosswalk to allow for the
turn. Construction costs for reconstructing tighter turning radii are approximately $15,000 to
$40,000 per corner, depending on site conditions (e.g., drainage and utilities may need to be
relocated).55
Chokers (Pinch points)
Chokers (Figure 13) are a traffic calming technique that narrows the street width at a
specific location to slow vehicles at a midpoint, or pinch point, along the street. This kind of design
is usually only appropriate for low-volume, low-speed streets. For this design to function
effectively, the width of the roadway cannot allow two cars to pass side-by-side. Sixteen feet is
generally effective and will still allow emergency vehicles to pass unimpeded.56
Figure 13: Angled choker in a residential area57
One-way to Two-way conversion
Converting roadways to one-way or two-way have different functions and depend on the
context of the area and what must be achieved. Consideration must be given to the impacts on
other streets and overall circulation. One-way streets tend to encourage higher motor vehicle
speeds, and intersections involving one-way streets may be more confusing for some roadway
users, especially non-local residents and child pedestrians. However, studies have shown that
converting two-way streets to one-way generally results in fewer crashes involving pedestrians
55 “Facility Design,” Pedestrian Bicycle Information Center (2018). 56 “Facility Design,” Pedestrian Bicycle Information Center (2018). 57 “Traffic Calming,” FHWA Safety.

31
because there are fewer turning movements. Redesign or traffic-calming measures may be required
to address vehicle speed. 58
Converting a one-way street to a two-way street can help reduce motor vehicle speeds and
vehicle miles traveled and lessen the need to circumnavigate multiple streets to reach destinations
in dense mixture of land uses. They can improve access and economic activity in areas such as
downtowns and commercial streets. Caution is required to minimize potential speeding problems
where a two-way street is changed to a one-way street.59
Road diet
Road diets (Figure 14) are used to narrow the road way and typically reduce the number of
travel lanes. They are used to improve safety and comfort for bicyclists and pedestrians, reduce
pedestrian exposure to motor vehicle traffic, and reduce vehicle speeds. Extra roadway space from
lane narrowing or reduction can be reallocated for other roadway users to improve safety, comfort,
and convenience. In return, this creates space for bicycle, transit, and/or parking lanes. Other
improvements can include widening sidewalks, adding street trees, and curb extensions at
crossings where on-street parking is present. Road diets are commonly used on roadways with
wider cross sections and one-way streets that may have excess capacity. They also are designed to
improve sight distances for left-turning vehicles. Design can provide space for widening sidewalks
and installing curb extensions, which reduces pedestrian crossing distance and time. Road diets
can reclaim pavement for other uses such as buffers between traffic and pedestrians.60
Figure 14: Road diet with a landscaped center61
When determining the feasibility of a road diet, a traffic analysis should be conducted to
see if vehicle capacity exceeds existing and projected volumes. Traffic analyses help determine if
width and the number of travel lanes are necessary or not. Additionally, the volumes and types of
58 “Facility Design,” Pedestrian Bicycle Information Center (2018). 59 “Facility Design,” Pedestrian Bicycle Information Center (2018). 60 “Facility Design,” Pedestrian Bicycle Information Center (2018). 61 “East Boulevard Road Diet,” North Carolina DOT Complete Streets.

32
traffic, left turn movements, multimodal crash data, roadway widths, sight distance, and the
number of driveways should be considered. When designing road diets, 10 feet for vehicular travel
lanes and 10 feet for turning lanes and 11 feet for lanes to accommodate large vehicles (where
volumes of large vehicles are greater than eight percent) are recommended minimums for urban
areas.62The level of service of the roadway users should be estimated. Higher or lower LOS for
vehicles, pedestrians, transit riders, bicyclists must be accommodated. Other factors may include
the importance a street plays in the community network, and the relationship between creating
more livable streets and supporting economic development.63
The type of road diet and the measures used affect the cost of the measure. Adding striped
shoulders on-street bike lanes can cost as little as .15-.20 per linear foot, or approximately $750 to
$1000 per mile. The estimated cost of extending sidewalks or building a raised median is much
higher and can cost $100,000 per mile or more.64
Speed Humps
Speed humps are parabolic vertical interventions intended to slow traffic speeds on low
volume and low speed roads on either one-way or two-way streets. Speed humps are generally 3-
4 inches high and 12-14 feet wide with a ramp of 3-6 feet depending on the speed that is intended.
Slopes should not exceed 1:10, side slopes on tapers should not be greater than 1:6, and the vertical
lip should be no more than a quarter inch high. Speed humps are used to reduced speeds to 15-20
mph. They should not be placed in front of driveways or other areas of access.65 Vertical speed
control elements shall be accompanied by a sign warning driver of the upcoming device.66 Speed
humps should be spaced no more than a maximum of 500 feet apart. To achieve greater speed
reductions, speed humps should be placed closer together.
Chicanes
Chicanes (Figure 15) are used to reduce vehicle speed. Chicanes are used to shift a travel
lane and doesn’t allow a driver to maintain speed. They are a horizontal diversion of traffic and
can be minor or drastic depending on design; they reflect the desired speed which should be posted
along the street prior to this addition. Chicanes can also be offset curb extensions on a residential
or low volume downtown street, and this can increase the amount of public space available and
can be activated using benches, landscaping, and other amenities.67 Chicanes can be used in both
low volume residential streets as well as collectors or minor arterials. Chicanes can also be used
in addition to a lane restriction as described within the choker section. This usually consists of a
series of curb extensions that narrow the street at selected points and force motorists to slow down
(this use intended only for use in residential streets with low traffic volumes). A chicane design
may warrant additionally signing to ensure drivers are aware of a slight bend in the roadway.
62 “Green Book,” AASHTO. 63 “Facility Design,” Pedestrian Bicycle Information Center (2018). 64 “Facility Design,” Pedestrian Bicycle Information Center (2018). 65 “Urban Street Design Guidelines,” National Association of City Transportation Officials. 66 MUTCD W17-1 67 “Urban Street Design Guidelines,” National Association of City Transportation Officials.

33
Figure 15: Chicane used to horizontally divert traffic68
Chicanes may be designed using a return angle of 45 degrees, or a more gradual taper and
transition, resulting in an S-shaped roadway.69 Chicanes work best on a two-way street that is at
least 40 feet wide or a one-way street that is at least 23.3 feet wide. However, it should be noted
that chicanes could reduce on-street parking, have the potential to restrict bike lanes and do not
work well on low-traffic two-way streets. Chicanes should also be designed with a one-foot or 2-
foot gap from the curb for drainage. The cost of a landscaped chicane can range from
approximately $2,000 to $26,000, depending on landscaping, drainage requirements and the need
for utility relocation.70
Medians
Medians (Figure 16) are the center blocks in the middle of the street. Medians narrow the
driving lane and can have landscaping that can beautify a neighborhood. People also sometimes
use medians as a refuge when crossing the street when there is no midblock crossing. Medians are
recommended for use on streets wider than 35 feet. Medians that are used for traffic calming should
be constructed to 40 feet in length while the width of the median will be based on existing street
conditions. The width should allow for the driving lanes on either side to be 10 feet. It is also
recommended that landscaping should not block visibility for drivers, pedestrians, or bicyclists.
68 “Chicane,” PEDSAFE. 69 “Urban Street Design Guidelines,” National Association of City Transportation Officials. 70 “Facility Design,” Pedestrian Bicycle Information Center (2018).

34
Figure 16: Landscaped median71
Traffic Circles (Roundabouts)
Traffic circles (mini-circles) (Figure 17) are raised circular islands that are constructed in
the center of residential street intersections to reduce vehicle speeds and force drivers to maneuver
around them. They are both a traffic calming technique and an intersection improvement at
intersections where volumes do not warrant a stop sign or signal. Many cases have shown
unwarranted four-way stop signs as a result of demand of action from the community where a yield
control could be more beneficial. Many can be landscape in the center, but where landscaping is
not feasible, traffic circles can be constructed through other materials. Traffic circles should be
designed with a minimum of 15 feet of clearance from the corner of the intersection to the widest
point on the circle.72
Figure 17: Mini circle in a residential area73
71 “Medians and Islands,” San Francisco Public Works. 72 “Urban Street Design Guidelines,” National Association of City Transportation Officials. 73 “Neighborhood Traffic Circles,” Safe Routes to School Guide.
35
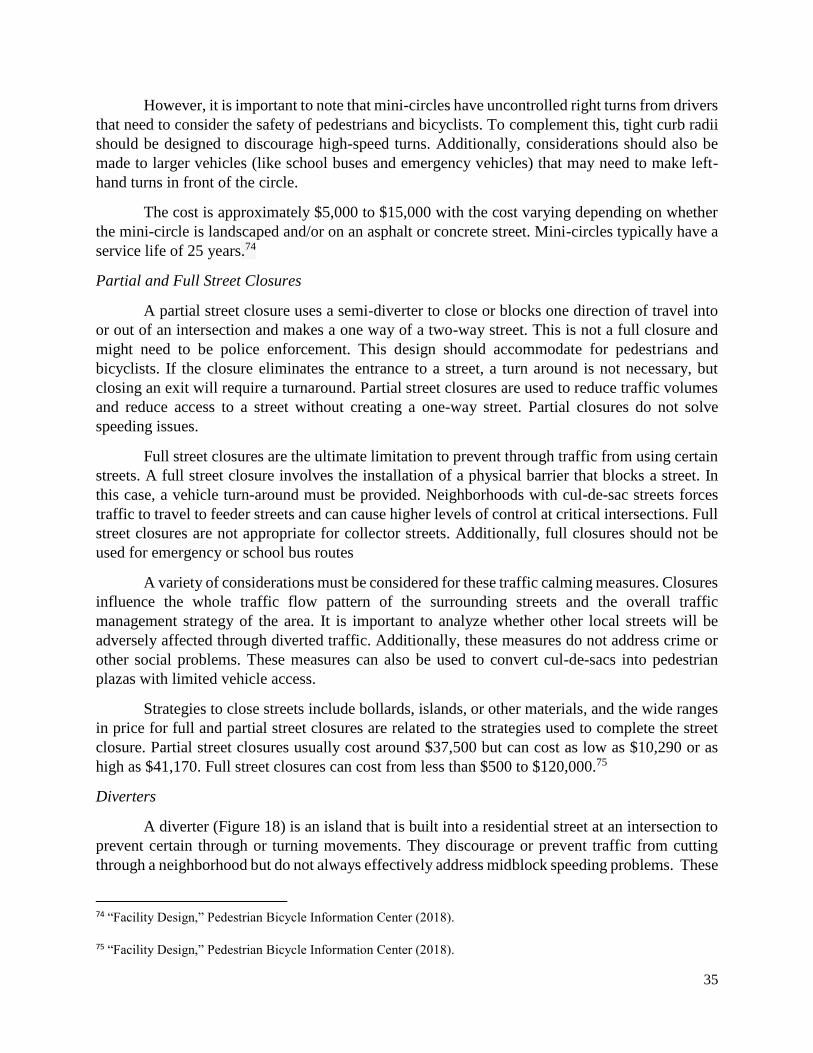
However, it is important to note that mini-circles have uncontrolled right turns from drivers
that need to consider the safety of pedestrians and bicyclists. To complement this, tight curb radii
should be designed to discourage high-speed turns. Additionally, considerations should also be
made to larger vehicles (like school buses and emergency vehicles) that may need to make left-
hand turns in front of the circle.
The cost is approximately $5,000 to $15,000 with the cost varying depending on whether
the mini-circle is landscaped and/or on an asphalt or concrete street. Mini-circles typically have a
service life of 25 years.74
Partial and Full Street Closures
A partial street closure uses a semi-diverter to close or blocks one direction of travel into
or out of an intersection and makes a one way of a two-way street. This is not a full closure and
might need to be police enforcement. This design should accommodate for pedestrians and
bicyclists. If the closure eliminates the entrance to a street, a turn around is not necessary, but
closing an exit will require a turnaround. Partial street closures are used to reduce traffic volumes
and reduce access to a street without creating a one-way street. Partial closures do not solve
speeding issues.
Full street closures are the ultimate limitation to prevent through traffic from using certain
streets. A full street closure involves the installation of a physical barrier that blocks a street. In
this case, a vehicle turn-around must be provided. Neighborhoods with cul-de-sac streets forces
traffic to travel to feeder streets and can cause higher levels of control at critical intersections. Full
street closures are not appropriate for collector streets. Additionally, full closures should not be
used for emergency or school bus routes
A variety of considerations must be considered for these traffic calming measures. Closures
influence the whole traffic flow pattern of the surrounding streets and the overall traffic
management strategy of the area. It is important to analyze whether other local streets will be
adversely affected through diverted traffic. Additionally, these measures do not address crime or
other social problems. These measures can also be used to convert cul-de-sacs into pedestrian
plazas with limited vehicle access.
Strategies to close streets include bollards, islands, or other materials, and the wide ranges
in price for full and partial street closures are related to the strategies used to complete the street
closure. Partial street closures usually cost around $37,500 but can cost as low as $10,290 or as
high as $41,170. Full street closures can cost from less than $500 to $120,000.75
Diverters
A diverter (Figure 18) is an island that is built into a residential street at an intersection to
prevent certain through or turning movements. They discourage or prevent traffic from cutting
through a neighborhood but do not always effectively address midblock speeding problems. These
74 “Facility Design,” Pedestrian Bicycle Information Center (2018). 75 “Facility Design,” Pedestrian Bicycle Information Center (2018).

36
measures highly affect residents and should only be considered when less restrictive measures are
not effective. Because of the implications on residents rather than through traffic, community
support is essential. When considering one of the four types of diverters, (diagonal, star, forces
turn, truncated), the traffic patterns must be evaluated to determine what other streets within the
neighborhood would be adversely affected. Additionally, diverters should still allow access of
bicycle, pedestrian, and service and emergency vehicle access.
Figure 18: Diverter with bicycle access in a residential area76
Costs can range from approximately $10,000 to $51,000 each, depending on the type of
diverter and the need to accommodate drainage. On average the cost is around $26,000.77
Gateways
Gateways (Figure 19) are physical or geometric landmarks that are used to show a change
in the environment. Gateways should send a clear message about the transition from high speed
arterial or collector roads to lower speed residential. They can help prepare drivers for a shift in
driving environment and to watch for pedestrians. Gateways can be a combination of measures
such as street narrowing, medians, signing, archways, roundabouts, or another identifiable
feature. In doing so, certain areas can be identified within the larger urban context. However, it is
important to note that gateways are an introduction to the shift and should be complemented by
other traffic calming measures.
76 “Diverters,” Pedestrian Bicycle Information Center. 77 “Facility Design,” Pedestrian Bicycle Information Center (2018).

37
Figure 19: Gateway to a district in an urban area78
The cost of a gateway sign can range from approximately $100 to $500 while the cost of
gateway structures can range depending on what is chosen. Some options could include monument
signs (approximately $19,000), street spanning arches supported by metal posts within bulb outs
(approximately $64,000), and gateway columns ($10,000).
Parking Lanes
Parking lanes are designated areas for people driving to park their vehicles and can be used
to narrow the street. Narrowing the street can reduce the perception of safety for drivers and
encourage slower speeds. On-street parking also creates a barrier between sidewalks and
roadways.79
Yield Streets
Yield streets (Figure 20) are narrow two-way streets where the on-street parking requires
people who drive to yield to one another from approaching opposite directions. Two-way yield
streets are appropriate in residential environments where drivers are expected to travel at low
speeds. Many yield streets have on-street parking utilization of 40-60% or less with a checkered
parking scheme.80 Yield streets should be intuitive and allow for vehicles to pass without crashing
into one another. Yield streets with parking on both sides work best on streets that are 24 to 28 feet
wide while streets with parking on only one side can be as narrow as 16 feet wide.81
78 “Carmel Art and Design District,” City of Carmel. 79 “Slow your street: A How-To Guide for Pop-Up Traffic Calming,” Trailnet (2016). 80 “Urban Street Design Guidelines,” National Association of City Transportation Officials. 81 “Urban Street Design Guidelines,” National Association of City Transportation Officials.

38
Figure 20: Yield street in a residential neighborhood 82
Serpentine Design
Serpentine design is a traffic calming measure that uses a winding street pattern and other
obstacles or built-in visual enhancements that forces vehicles to slow down. Depending on material
used, this can be more expensive than other traffic calming measures. The cost of retrofitting a
street may range from $60,000 to $90,000 per block but may be no extra to build a new street with
this design if adequate right-of-way is available.83
2.2.5 Streetscape
Street Furniture
Street furniture (Figure 21) is mainly used in commercial districts to enliven the area by
making sidewalks functional and pleasant places for pedestrians. However, street furniture has an
important role to play in building strong communities that have eyes on the street. Street furniture
can show the community values its public spaces.
Figure 21: Street furniture in a commercial district
82 PEDSAFE 83 “Facility Design,” Pedestrian Bicycle Information Center (2018).

39
Wayfinding
Wayfinding (Figure 22) uses pedestrian-oriented maps and directional signs to create a
sense of place. Wayfinding helps pedestrians discover new places and encourage high rates of
walking. Maps can be used to show a current location in relation to surrounding streets and
destinations. In some cases, an estimation of the time and arrows showing direction to another
destination can be posted on signs for pedestrians to see.84
Figure 22: Mapped plinth85
Lighting
Lighting (Figure 23) can enhance the aesthetic of an urban area as well as increase comfort
and safety. Lighting should be used to ensure walkways and crosswalks are well lit. Lighting can
increase the visibility of pedestrians by motorists. Properly placed street lighting at crosswalks can
reduce glare. In commercial and downtown areas, pedestrian-level lighting can provide comfort,
security, and safety.
Figure 23: Illuminated crosswalk86
84 “Facility Design,” Pedestrian Bicycle Information Center (2018). 85 “City of Adelaide Wayfinding,” Samantha Curcio (2015). 86 “Upgrades to Innovative LED Streetlighting,” OSRAM

40
Pedestrian-scale lighting can range from 12 to 16 feet and is much lower in height than
standard streetlighting (about 60 feet). Lighting of this height can be categorized as street furniture
and can be places just inside the curb. Additionally, lighting should be placed 10 feet from the
crosswalk in order to adequately illuminate pedestrians from drivers.
Pedestrian-level streetlight costs range from approximately $300 to $13,900 each,
depending on the fixture type and service agreement with the local utility company. Crosswalk
lighting can range from approximately $10,750 to $42,000 per crosswalk, and in-pavement
lighting from $6,500 to $40,000 as a total cost.87
Landscaping
Landscaping (Figure 24) can provide a physical separation between pedestrians and the
roadway. Landscaping can also be used as a traffic calming strategy because it can visually reduce
the width of a roadway and encourage drivers to drive more slowly. Additionally, landscaping
such as street trees, can become a barrier for pedestrians from vehicles in case of cars going off
the road. However, one of the hardest aspects of landscaping is the upkeep is required. It is
important that landscaping does not compromise sight distances and personal security.88
Figure 24: Landscaped buffer complemented by on-street parking89
2.3 The Safe Routes to School Movement In efforts to draw attention to the relationship between design and impacts on the safety of
children, the Safe Routes to School (SRTS) movement began. In the 1970s, SRTS began in
Denmark to combat a growing number of traffic fatalities. It is best defined by the name itself:
safely walking and bicycling to and from school. The City of Odense began to implement the
innovative initiative when it experienced the highest rate of traffic fatalities among children in
87 “Facility Design,” Pedestrian Bicycle Information Center (2018). 88 “Facility Design,” Pedestrian Bicycle Information Center (2018). 89 “Curbside Parking footways in Downtown Naples, FL” Towncrafting (2013).
41
Western Europe. The initiative saw lowered speed limits, separated bike paths from car and
pedestrian traffic, improved mass transit, and other infrastructure improvements. Today,
approximately 4 out of 5 students in Odense use non-motorized transport when traveling to school.
90 The SRTS concept spread internationally, with programs developing in other parts of Europe,
Australia, New Zealand, Canada and the United States.
In 1997, New York City had the first SRTS in the United States, and the state of Florida
implemented a pilot program. In 2000, two more SRTS pilot projects were funded by Congress.
Additionally, grassroots SRTS efforts began throughout the United States. The success of the
initiatives created incentive for a federally-funded national program. In 2003, advocates and
experts in transportation gathered to discuss SRTS and the potential of a national program. The
Federal Safe Routes to School program began in 2005 when the Safe, Accountable, Flexible,
Efficient Transportation Equity Act: A Legacy for Users (SAFETEA-LU) was passed.
The National Center for Safe Routes to School (NCSRTS) provides resources on how to
start and maintain a SRTS program from start to end. The NCSRTS is part of the UNC Highway
Safety Research Center (HSRC) and works closely with the Pedestrian and Bicycle Information
Center (PBIC), which serve as the US Department of Transportation’s clearinghouse for pedestrian
and bicycle research and tools.91 The program has brought awareness to the walking and biking
safety in school zones where youth is present, and it provided the Federal Highway Administration
(FHWA) with over $1 billion in dedicated funding for implementation through State departments
of transportation (DOTs). Safe Routes to School program has expanded to many communities and
has encouraged State DOTs, metropolitan planning organizations (MPOs), and regional planning
organizations (RPOs) to prioritize pedestrian safety in transportation planning. 92 In 2018,
Massachusetts alone had over 800 registered SRTS school programs.
However, the decline of children moving around neighborhoods by foot or bike is still
apparent throughout the United States. In 1969, 48% of children 5 to 14 years of age usually
walked or bike to school. In 2009, that percentage dropped to 13%. 93 According to the National
Highway Traffic Safety Administration, in 2013, 288 pedestrians and bicyclists ages 14 and under
were killed, and approximately 15,000 children in this same age group were injured while walking
or bicycling.94 And while the response has been for students to be driven to school, motor vehicle
crashes are one of the leading causes of death for school-age children. In 2013, 1,149 children ages
14 and under were killed and 172,000 children in this age group were injured as motor vehicle
occupants.95 Parents driving students to school increases traffic in school zones where other
students must still walk or bike. As motor vehicle traffic continues to increase, students no longer
feel safe using non-motorized modes. This sentiment does not go unnoticed; environments have
been created where safety of pedestrians has not been a priority.
Various safety benefits from the SRTS program have been identified. In New York City,
researchers found there was a 44 percent decrease in school-aged pedestrian injury rates after
90 “The Decline of Walking and Biking,” National Center of Safe Routes to School (2011). 91 National Center for Safe Routes (2018). 92 “Creating Healthier Generations: A Look at the 10 Years of the Federal Safe Routes to School Program,” National
Center of Safe Routes to School, 2015. 93 “The Decline of Walking and Biking,” National Center of Safe Routes to School (2011). 94 National Highway Traffic Safety Administration (2015). 95 National Highway Traffic Safety Administration (2015).

42
infrastructure improvements were made in areas with SRTS interventions relative to sites without
interventions.96 Researchers also found broader benefits such as “reduced transportation costs,
more connectivity within communities, and how SRTS could serve as a tool to help combat
truancy, to improve readiness to learn, and enhance community life.”97 With the information
collected, the National Center for Safe Routes to School has been able to further Vision Zero, a
movement in cities around the world to eliminate traffic death and serious injuries to make cities
safe for all road users.98
2.3.1 Federal Safe Routes to School
The Federal Safe Routes to School program collects and submits data to NCSRTS
regarding safety conditions of children walking and biking in school zones. One essential part of
the data collection happens through observing and mapping routes in the school zone. Collecting
traffic counts and crash history can help identify driver-related safety issues and observing arrival
and dismissal times can gather information on issues unique to the school zone. This requires the
participation of various stakeholders including transportation, public health, and planning
professionals, school administrations, police officers, community organizations, and families.99
The second aspect of the data collection is determining the number of students who walk
and bike to school, which can be assessed through NCSRTS surveys. The National Center provides
a data system for local, regional, and state SRTS partners to enter and view data collected using
the standardized Student Travel Tally and Parent Survey questionnaires. As of March 2015, the
data system surpassed 1.58 million data records, including 1,313,534 Parent Surveys and 267,779
Student Travel Tally questionnaires from 12,384 schools.100 Use of the data system is free and
available to any school. The system generates summary reports to make it easy to share findings
with community stakeholders and others interested in understanding walking and biking rates for
students.
From the information collected, potential solutions for education, encouragement,
engineering and enforcement strategies can be identified. A SRTS plan does not need to be lengthy,
but it is important to incorporate encouragement, enforcement, education, and engineering
strategies. It describes the recommendations while providing a time schedule, map, and
explanation of how to evaluate the program. Once the plan is ready, the SRTS program can apply
for funding from a variety of agencies such as federal, state, municipal, environmental, health, and
philanthropic organizations. 101
2.3.2 Case Study— Worcester, Massachusetts
Similar data collection is necessary to submit for funding from MassDOT SRTS. Needed
data consists of statistics on student travel mode, existing infrastructure and identified issues, and
community initiatives. A large variety of expensive infrastructure improvements (such as rapid
96 “Creating Healthier Generations: A Look at the 10 Years of the Federal Safe Routes to School Program,” National
Center of Safe Routes to School (2015). 97 “Creating Healthier Generations: A Look at the 10 Years of the Federal Safe Routes to School Program,” National
Center of Safe Routes to School (2015). 98 “Safe Routes,” National Center of Safe Routes to School (2018). 99 “Safe Routes,” National Center of Safe Routes to School, 2018. 100 “Creating Healthier Generations: A Look at the 10 Years of the Federal Safe Routes to School Program,” National
Center of Safe Routes to School, 2015. 101 “Steps to Creating a Safe Routes to School Program,” Safe Routes Info (2018).

43
flashing beacons, raised crosswalks, sidewalk improvements, signal timing changes etc) have
mainly been provided for past SRTS programs. A MassDOT SRTS project was conducted at Elm
Park Community School in Worcester, MA in 2014. Improvements in the school zone included
reconstruction of sidewalks and wheelchair ramps, installing a raised intersection, installing a
raised crosswalk, pavement overlay and installing school zone flashers and pedestrian crossing
warning signs. Work for the project consisted of engineering design and review services to
MassDOT on a task order basis for various statewide highway and bridge projects. Costs for the
Elm Park School SRTS project are provided in Table 1.102
Table 1: Costs for MassDOT SRTS Project at Elm Park Community School Construction Contract Value $746,635.54
Construction Bid Price $483,531.75
Initial Construction Estimate $444,236.00
These improvements are costly—and often ineffective. Additionally, MassDOT SRTS
improvement projects are competitive, and large amounts of funding are provided to a small
number of projects rather than dispersing the money to more communities for less expensive
infrastructure improvements. This can cause frustration and loss of hope as communities are forced
to pinpoint funding for resources and implementation elsewhere. Without a designated community
champion and organizer to support such efforts, the voices of students may never be heard.
Additionally, there can be a disconnect in the communication within State DOTs, MPOs, and
RPOs about the program and effective infrastructure improvements. These agencies often have
“silos of existence” where various departments (planning, engineering, housing, public works)
have “created a type of discordant government software (culture, codes, policy) that eventually
translates to the creation of the city’s hardware (buildings, streets, parks).”103
2.4 Tactical Urbanism The formal process to facilitate change in communities is often out of date and frustrating,
and this can leave communities feeling they have little to no ability to legally use the system, local
or otherwise, to enact positive change in their neighborhoods or beyond.104 Navigating the layers
of government departments for projects small and large has become thick, and the convoluted
process of receiving permission to build makes it inefficient to see change.105 Given the variety of
competing interest and jurisdictions, the current system of planning puts interests against one
another—public vs private, individual vs collective, rich vs poor—rather than seeking a way to
recognize all roles in creating change.106 And although it is common knowledge that this model is
no longer useful, municipal governments continue to adopt an overall pattern of development with
little public input. As a result, the ability to effectively deliver walkable neighborhoods at a scale
102 MassDOT, “Worcester- Safe Routes to School (Elm Park Community School),” Project 607243 (2014).
103 Garcia, Anthony, Lydon Mike. Tactical Urbanism (2015): 21. 104 Garcia, Anthony, Lydon Mike. Tactical Urbanism (2015): 80. 105 Garcia, Anthony, Lydon Mike. Tactical Urbanism (2015): 83. 106 Garcia, Anthony, Lydon Mike. Tactical Urbanism (2015): 84.

44
that can match the current and coming demand is nonexistent.107 Organizing the initial SRTS
organizers and keeping momentum can be ineffective when the communication is disconnected.
Tactical urbanism is an approach to neighborhood building and activism using short-term,
low-cost, and scalable interventions and policies. Tactical is defined as small-scale actions serving
a larger purpose, and they are “adroit in planning and maneuvering to accomplish a purpose.”108
These interventions do not propose one-size fits all solutions. Instead, they invite intentional and
flexible responses. This approach invites a new conversation about local resiliency; “communities
can explore a nuanced approach to city making—one that can envision long-term transformation
but also adjust as conditions inevitably change.”109 Tactical urbanism is breaking through the
gridlock of municipal governments with incremental projects and policies that can be adjusted
while never losing sight of long-term and large-scale goals. This approach makes use of an open
development processes, the efficient use of resources, and the creative potential unleashed when
communities come together to discuss issues. 110 Power is given back to communities by turning
the opposition, private and public, into a motive.
2.4.1 Case Study—Hamilton, Ontario
Tactical urbanism projects blur the lines between city planning, public art, design,
architecture, advocacy, policy, and technology. Today, there are various citizen-led and creative
placemaking projects. Stories of intersection repair, wayfinding, park-making, and pavement to
plazas are becoming more popular as communities begin to see success.
An intersection repair demonstration was executed in Hamilton, Ontario (Figure 25).
Activists used the project to move policy and implementation. A two-week effort included a
workshop to develop low-cost interventions for five intersections and implementation. Money was
donated from the Hamilton/Burlington Society of Architects (HBSA) and Ontario Architects
Association (OAA).
107 Garcia, Anthony, Lydon Mike. Tactical Urbanism (2015): 81. 108 Garcia, Anthony, Lydon Mike. Tactical Urbanism (2015): 2. 109 Garcia, Anthony, Lydon Mike. Tactical Urbanism (2015): 3. 110 Garcia, Anthony, Lydon Mike. Tactical Urbanism (2015): 2.

45
Figure 25: Intersection repair in Hamilton, Ontario111
The project consisted of ‘guerilla bump-outs on intersections with large curb radii and long
crossings with a total cost of $5000. News spread quickly following coverage of the project in a
local newspaper. Resistance was met from city hall, the project was removed, and tactical was
deemed “vandalism, with the potential for serious health and safety consequences for citizens,
particularly pedestrians.” 112 Following a public meeting with key city councilors and municipal
officials where explanations for the design behind the bump-outs were offered, the city abruptly
changed its tune. Within 2 weeks of the meeting, curb extensions were outline with paint and
temporary bollards. Today, the city continues to develop pilot projects.
2.4.2 Benefits of Demonstration Projects
Demonstrations are a unique approach to community engagement and can reinvigorate the
discussion on building better communities. They are tool for education and encouragement that
allow residents brainstorm, create, and express ideas and ways to take ownership of their
neighborhoods. Projects that focus on connecting community members with educational resources
have shown an increase in social capital for community members and an increased interest in their
community’s well-being
They are ways to use low-cost, short-term solutions to have a large impact on communities.
Low-cost items can be used to create alternative versions of expensive infrastructure materials.
Additionally, materials that can be moved and stored also have the potential to be used at various
other locations within the community to continue the energy in different environments and tackling
different problems. Successful demonstration projects can create buy-in for permanent projects by
facilitating discussions that begin from the bottom up instead of the top down.
Through pop-up traffic calming demonstrations, temporary and creative solutions can be
set up to raise community awareness and start the conversation with a variety of stakeholders.
Teaching the community members about traffic calming measure open opportunities to learn.
111 Garcia, Anthony, Lydon Mike. Tactical Urbanism (2015): 105. 112 Garcia, Anthony, Lydon Mike. Tactical Urbanism (2015): 105.

46
Through this strategy, neighborhoods can catalyze efforts that prioritize safety, health, and pleasant
streets over moving traffic.
2.4.3 Planning Demonstration Projects
There are many key questions to consider during the planning process:
1. What is the purpose of the demonstration project?
Determining goals and defining success is essential to a demonstration project because it
shapes the project. The goal of the project could be many things: shaping future policy,
empowering community members to advocate for improvements, increasing safety.
2. Who is funding the demonstration project?
Before a project can get off the ground, it is important to understand if there are funds
available. Where will funding be coming from? The local government? Other community
stakeholders? Grants? Cost estimates can include the design and determination of location and
best practices, materials, permits, and data collection and analysis. Additionally, it is important
to consider the big picture: demonstrations want a goal of permanent. What is financially
feasible at the end goal? Some permanent traffic calming features may be cheaper to implement
than others. Cost of permanent changes include design, reconstruction, infrastructure changes,
stormwater improvements, or maintenance costs.
3. How will you determine which site location to implement the pop-up traffic calming
demonstration?
a. Who are the primary community stakeholders who can help select the site location
and site plan?
b. What data is available to support the site location chosen for the demonstration?
c. What type of traffic calming design should be implemented at the site location?
d. Who will design the site plan?
Determining where the demonstration project should take place has to do with a combination
of the various factors of the built environment and how it has shaped driver behavior and impacted
the overall safety of the area. This includes street width, traffic volumes, traffic crashes and/or
fatalities, and other factors that can be achieved through street and sidewalk audits. Other data
should be collected from understanding the traffic pattern and driver behavior of the area through
site observation. The purpose of the street in the context of the community should also be
identified. Is it residential? Business? Schools? Stakeholder input should be a priority when
selecting a site location because engineering, planning, or consultants for walking and biking can
help identify where tangible outcomes could come from best practices. Also, it is important to
support the findings with a document or site plan that shows where and why the traffic calming
measure(s) was chosen.
4. Who are the stakeholders to work with in the city to gain necessary permits and approve
the site location and plan?
For a demonstration project to be sanctioned, it is important to have the permission and
permits from the government. This can include site plan approval and permits from the
47
Department of Public Works Engineering Department, Fire Department, and Police
Department. Understanding this process is important because it can be one of the most
confusing and time-consuming parts of the demonstration project. It is often recommended to
have someone in a position of power in the local government or a specific department contact
as an advocate for the project. They are often able to ask the right people the right questions
and move the process along.
5. How will the demonstration project affect the residents of the area?
a. How will you best inform the neighborhood around the site location about the
upcoming demonstration?
b. What type of outreach is needed to implement the demonstration?
Neighborhood residents should be engaged. It is important to evaluate how the demonstration
project may disturb the natural patterns of residents. Evaluating how the project could impact
residents can help to eliminate or lessen conflicts on the day of. Examples of this may include
taking away on-street parking spaces, accidentally blocking driveways, and impacts on morning
commute. It is also important to consider how the residents in the neighborhood will be informed.
Will a community meeting be done with parents as well as residents? Will there be a press release?
It is subjective and depends on what will be the form of action in the context of the neighborhood.
6. Who will implement the traffic calming demonstration?
a. Will volunteers be needed?
b. How will they be instructed?
c. How do we keep volunteers safe?
d. When will set up and take down take place?
i. Will there be enough daylight for set up and take down
ii. Will there be heavy traffic?
Determining who will help with the set up and clean up of the demonstration project sets the
minimum/maximum of what can be accomplished. It is important to consider whether the school
has an established traffic plan for arrival and dismissal times and who assists this. Are there
crossing guards every morning who would like to be involved? Are there other stakeholders in the
city who are concerned about the safety during arrival and dismissal times and would like to
volunteer? Do student clubs or classes from nearby universities have an interest?
After determining who will be involved, communication of how the demonstration project will
come together should be established. This can be through distributing the site plan or how to guide
of the project. Having a group leader who is very familiar with the goal and set up of the
demonstration should be picked. This person can offer guidance and leadership on the day of the
demonstration. Volunteers from the group should also be familiar with set up and take down
strategies before the demonstration. Most importantly, it is important to consider how the
volunteers will be kept safe on the day. This may require a police detail when setting up the
demonstration in the street. Additionally, volunteers should be wearing reflective vests and
instructed on safety best practices.

48
7. What materials are needed for the demonstration?
Traffic calming measures do not have to be made from asphalt, cement, or white lines; they do
not have to be ugly. A variety of low-cost materials can be used to create traffic calming
interventions that are temporary but still effective. After understanding what traffic calming
measure is appropriate and where it is being implemented, the creative side of art and design can
begin. This can involve other stakeholders who were not a part of the more technical side of the
project but would still like to be involved. Brainstorming what materials (such as cones, tape, paint,
chalk) that could substitute more expensive materials can make the demonstration vibrant and
colorful.
8. When will the demonstration take place?
The actual date of the event will be determined by how long the permitting process is and how
long it takes for the other aspects of the project to come together. However, a timeline should be
created with tentative dates with goals to meet. Having a timeline can help the process stay active
and transparent.

49
CHAPTER 3: METHODOLOGY
It is becoming increasingly important to improve safety for non-motorized transport because
of the variety of benefits for a community at large.113 School zones and the student demographic
provide a logical starting point for innovative infrastructure to improve driver behavior and
pedestrian safety that may require more political traction. Additionally, improving safety where
youth walk and bike supports safety for all, which can in turn encourage broad support from the
community.114 Designing quick, low-cost, and high impact urban improvements can support future
change, particularly in communities where resources are strained. With the large amount of support
from stakeholders within the community and the need to improve safety in the neighborhood,
continuing work at Woodland Academy can be used as a case study to highlight the importance of
such initiatives and inspire future safety work at other schools within Worcester.
3.1 Objective 1: Collect and evaluate data from the school zones in Main South.
3.1.1 Existing infrastructure and operations
Stakeholders from past Safe Routes to School efforts at Woodland Academy collected a variety
of data from 2015-2017. This data was obtained from WalkBike Worcester and Central
Massachusetts Regional Planning Commission and organized into a digital folder. The files
included existing infrastructure audits, maps of where families lived and the mode of transportation
used to get to school, regional high crash locations in the school catchment area, and proposed safe
walking routes and demonstration project. This data was analyzed by the MQP team.
Data was also collected through observation and documentation of arrival and dismissal. Site
observations were conducted twice a week over a period of three weeks during arrival and
dismissal times, 7:30AM-8:15AM and 1:45PM-2:30PM respectively. Observations included
arrival/dismissal set-up and operations, driver behavior, how students walked to school, existing
infrastructure, and how the system worked holistically. The site observations documented how
people, vehicles, and buses moved through the school zone on the four streets directly surrounding
the school building (Woodland Street, Claremont Square, Claremont street, and Oberlin Street).
Additionally, both good and bad recurring driver behavior in the school zone were observed and
documented. Notes were written in a field book and pictures were taken. This data was documented
and is provided in Appendix B. Arrival and dismissal data was then compiled into a map that
included an AutoCad drawing of the site plan of the school, existing operations, and observed good
and bad behaviors.
3.1.2 Stakeholder interviews
Stakeholder interviews were conducted (Table 2), and the summaries of the interviews are
provided in Appendix C. Interviews were semi-structured and not recorded.
113 Garcia, Anthony, Lydon Mike. Tactical Urbanism (2015): 64. 114 “Focusing on the Safety of Children can Propel Vision Zero Initiatives,” National Center of Safe Routes to School,
2016.

50
Table 2: Stakeholders involved in improving student safety at Woodland Academy Name Role Organization
Karen Valentine Goins Co-chair WalkBike Worcester
Dan Daniska Transportation Planner Central Massachusetts Regional
Planning Commission
Patricia Padilla Principal Woodland Academy
Sarah Belisea Guidance Counselor Woodland Academy
Winston Montalvo Crossing Guard Woodland Academy
Nicole Edmonds Safe Routes to School
Coordinator
MassDOT
Jack Foley Vice President of Government
and Community Affairs
Clark University
Jim Kempton P.E., Director of Streets City of Worcester Department of
Public Works Engineering
Department
Questions asked included the stakeholder’s past involvement with student safety in the
neighborhood, the interest in a low-cost and short-term approach, and the ability to contribute time
and resources in the future.
3.1.3 Community workshop
A small community-planning meeting was conducted on 11/08/18 for feedback on documented
site observations and to assess the interest of the school on allowing the traffic calming
demonstration to take place for a few days during the week of 11/26/18 to 11/30/18. An AutoCad
drawing of the site plan of the school was printed on a 12” x 18” paper, and markers and scrap
paper were provided. Participants were given the freedom to draw on the map and pinpoint
problem areas. The first half of the meeting focused on observed driver behavior and clarification
on arrival and dismissal operations. The second half of the meeting was used to introduce traffic-
calming measures through example pictures of expensive infrastructure changes and the low-cost
counterpart. Questions focused on the community’s interest in allowing one to be temporarily
implemented on Woodland St.
3.2 Objective 2: Determine challenges presented by existing infrastructure that
have high impact on the safety and efficiency of student mobility. Challenges were determined following the analysis of existing data, arrival and dismissal
observations, and feedback obtained from stakeholder interviews. The decision was weighed most
heavily by the potential to reduce conflicts between vehicles and pedestrians in the immediate
school zone.

51
3.3 Objective 3: Develop engineering-based designs for at least one high impact
area in the neighborhood. Following the determination of the high impact area in the school zone, a traffic calming
measure was designed. The design was influenced by existing conditions, other low-cost
improvement case studies, and standard traffic-calming engineering practices. Input was provided
by the City of Worcester DPW Engineering Department. The design was drawn onto the AutoCad
site plan of the school zone with Microsoft PowerPoint.
3.4 Objective 4: Implement the design temporarily in the school zone and
evaluate.
3.4.1 Implementation
Following the determination of the engineering-based design, outreach was conducted to
gauge stakeholder interest in allowing the design to be implemented temporarily. Feedback was
gathered from the community workshop and from communication from the City of Worcester
DPW Engineering Department. Additionally, outreach to obtain the materials and man-power
necessary for the demonstration was also conducted at this time.
3.4.2 Evaluation
Following feedback from stakeholders, evaluation of the demonstration was conducted
through observation of arrival and dismissal operations and through parent surveys (see Appendix
E for survey flyer). Questions were asked regarding parents’ perceptions of safety before the
demonstration project was in place and perceptions of safety with the demonstration project in
place. Surveys were returned in person or via the email provided on the survey
3.5 Objective 5: Provide recommendations to challenges of creating a Safe Routes
to School plan. Objective 5 serves as an analysis of Objectives 1-4. Following the results of each method,
an analysis and discussion about the success, challenges, and lessons learned was presented.
Following this, recommendations and a new methodology were provided about how to
successfully continue Safe Routes to School initiatives throughout Worcester.

52
CHAPTER 4: RESULTS AND ANALYSIS
This section corresponds with the methodology and provides the findings from each
objective. The results were informative and will help to improve safety for students at Woodland
Academy.
4.1 Objective 1: Collect and evaluate data from the school zones in Main South.
4.1.1 Previously Collected Data
Data from past efforts was obtained:
• Fall 2017- Woodland Walking Routes
o This map displayed the suggested safest routes for students based off of existing
infrastructure, signalized intersections, crosswalks, and the presence of crossing
guards during arrival and dismissal hours.
• Regional High Crash Locations
o This map displayed the traffic volumes of the streets and the pedestrians, bike, and
vehicles crashes from 2004-2013 provided from the Highway Safety Improvement
Plan in the Woodland Academy catchment area. This map allowed the large
problem areas in the neighborhood to be clearly identified.
• Intersection Audit
o This excel file provided an audit of 68 intersections within the catchment area of
the school. The time the intersection was observed and questions were asked about
the number of crosswalks, signalization, existing infrastructure such as curb
extensions or medians, curb ramps, line of sight obstruction, parking, signage, and
any additional unsafe features of the intersection. Data was collected for the four
intersections surrounding the school: Oberlin St and Woodland St, Claremont Sqr
and Claremont St, Woodland St and Claremont St, and Oberlin St and Claremont
Sqr.
• Priority Snow Routes for Woodland Academy
o This map displayed the snow plow routes that are a priority for the success of safe
walking routes. This map coincides with the Woodland Walking Route Maps.
• Spring 2017 Demonstration Project
o This is a map of a suggested demonstration project within the Woodland Academy
school zone. The demonstration suggests the addition of stop signs at the
intersection of Woodland and Claremont and on Woodland St at the corner of
Oberlin. Additionally, bump outs are suggested at the crosswalks of these two
intersections. This demonstration project did not take place.
• Street & Sidewalk Audit
o A street and sidewalk audit was done for 47 streets within the Woodland Academy
catchment area. The time the street was observed was recorded and questions were
asked about sidewalks, separation of pedestrian from the roadway, line of sight
obstructions, number of driveways, number of travel lanes, signage, bike lanes,
53
traffic calming, curb height, driver behavior, abandoned buildings, and any
additional unsafe behaviors
• Woodland Signage Audit
o An inventory of the signage at the various schools throughout all of Worcester was
conducted. This document recorded any school street pavement, school speed limit
signs, and school crossing signs.
• Woodland Stop Sign Locations
o This map displayed the stop sign locations within the catchment area of Woodland
Academy.
• SRTS 2015 Parent Survey Data
o A parent survey was conducted and asked questions about the type of mode used
to travel to school most days. Out of 183 responses, it showed that 53.6% walked,
37.7% took a family vehicle, 3.8% carpool with another family, and 4.9% use other
(school bus).
• Crossing Guard Observations
o This document had observations regarding driver behavior, pedestrians,
infrastructure, and how the system worked holistically at Woodland Academy
during arrival/dismissal hours. Observation spots included backdoor of Woodland,
the intersection of Main and Kilby, the intersection of Woodland and May, and the
intersection of Woodland and Claremont.
• Student Locations and Mode Map
o This map documented the household locations of the parents that responded to the
travel mode survey.
• Student Locations and Mode Map/Regional High Crash Locations
o This map combined the data from the household locations underneath the HSIP
crash locations.
4.1.2 Analysis
This data covered a large variety of topics, and some pieces proved more valuable than others.
The audits of the intersection, street and sidewalks, and signage prove helpful in painting the larger
context of the Woodland Academy catchment area. This collected data was a result of responses
submitted by parents, and the audits function as a teaching tool while also collecting data about
existing infrastructure. This data functions as a foundation of checkpoints for what can make an
environment feel safe and what can make it feel unsafe and is a fundamental piece of deciding
what routes are safest and why. Additionally, this data stays relatively accurate for years to come
and does not have to go through an extensive updating process.
Another valuable piece of information is the arrival and dismissal observations. It is one thing
to understand the existing infrastructure, but it is essential to understand how drivers and
pedestrians move about the space together as a result of the built environment. Observations allow
the arrival/dismissal operations to be analyzed to understand what contributes to good
driver/pedestrian behavior and bad driver/pedestrian behavior. From here, suggestions for
improvements can be made to improve behavior and minimize bad behaviors in a context that is
unique to the school zone.

54
Lastly, one of the more valuable pieces of data to consider are the results of the HSIP Regional
Crash Locations. This is helpful in drawing attention to the dangers of the major roads within the
catchment area of Woodland Academy including May St and Main St. This supports the argument
of improving safety for students will also improving the safety of all pedestrians (or vice versa).
This also supports the idea that the results of this data is not necessarily the responsibility of the
SRTS team to solve this problem in the neighborhood. It is important for the City of Worcester to
recognize the on-going traffic safety issues in Main South and be receptive to that responsibility.
However, some pieces of data prove less valuable as time passes. Although the data collected
on modes of travel and household location allow people to see where the students are traveling
from, this data needs to be updated every year to be accurate. For example, as students grow older,
modes of transportation differ, or household locations move. This influences the best suggested
routes because student location would differ.
In short, the collected data was able to demonstrate the need to improve traffic safety within
the Woodland Academy catchment area because of its effects on students that walk to and from
school. From the various pieces of data, the theme that was most occurring was driver behavior.
Because of this, it is important to dedicate future time and resources to data that supports the
relationship between the built environment and its effects on good driver behavior and bad driver
behavior.
4.1.3 Arrival and Dismissal Observations:
What are the Problems within this Neighborhood?
At Woodland Academy, the environment immediately before and after school is chaotic as
a result of the existing design and driver behavior during the arrival and dismissal procedure (full
observation summary listed in Appendix B). This is a safety hazard to students who have no choice
but to walk to and from school. Additionally, a high-stress area in the school zone can encourage
‘parent pick-up and drop-off rage.’ An unsafe school zone full of bad driver behavior can
encourage more parents to drop students off at school instead of allowing students to walk or bike.
In doing so, more traffic in the school zone is created. On the other hand, more families on foot
can lead to greater chances for eyes on the street, positive interactions, community building, and
parent involvement in schools.
Main themes from arrival/dismissal observations were summarized and placed on a map
(Figure 26):
1. Geometric design of the roadway can encourage high speeds and reduce a driver’s
awareness. People determine how fast to drive by using cues from the road and
neighborhood.
1. Wide lane widths.
2. The straight road layout and lack of turns or bends in the road.
3. Clear-zones and lack of street landscaping and furniture.

55
2. Driver behavior can create a chaotic environment.
1. Parents do not pull up to the curb on the right side of the road, and students get
dropped off in the travel lane or on the side of the road opposite the school.
2. Students and/or parents are crossing in the middle of the street (mid-block
crossings) instead of using designated crosswalks.
3. Parents park in the bus zone in front of the school. This prevents buses from being
able to pull over into the unloading lane and can lead to a back-up in traffic and
cause a domino effect of other bad behaviors.
4. Vehicles pulling up to the curb from the wrong direction. Drivers do this when they
approach the school on the far side of a two-way street and angle across oncoming
traffic to get to the school curb.
5. Vehicles parking within 20 feet of the crosswalk. Parking too close to a corner or
crosswalk blocks the line of sight between drivers and pedestrians and increases the
risk of collision.
6. Vehicles not giving students the right-of-way in the crosswalk.
7. Vehicles stopping in the crosswalk and forcing students to walk in the roadway.
8. Drivers backing up, u-turning, and making similar maneuvers in the unloading
zones and adjacent streets. The combination of large cars and children make it more
likely that a driver will have difficulty seeing people.
9. Parents park and leave their cars in the drop-off area to walk students to the front
door. This disrupts the rest of the student drop-off line.
Figure 26: Summary of arrival and dismissal observations at Woodland Academy
3. Good habits should be maintained.
1. Woodland becomes a one-way street during arrival and dismissal.

56
2. Crossing guards at the crosswalk on Woodland and Claremont, May and Woodland,
and Main and Kilby.
3. Students getting dropped off on the right side of the road.
4. The unclear functional role of the street. Many stakeholders believe that the road is used as
a cut through to various other destinations. The simultaneous presence of a strong traffic
demand, especially during peak hours, and the nature of the neighborhood generates
conflicting interactions.
4.1.4 Stakeholder interviews
The analysis reflects ideas interpreted following the completion of interview. It represents
thoughts at that moment in time in the project and offers insight into how each interview influenced
the direction of the project.
Walk through with Dan Daniska (CMRPC) and Karen Valentine Goins (WalkBike Worcester),
9/10/18
This was the first meeting with members of the past Safe Routes to School movement at
Woodland Academy, and it was still unclear at this point why the initiative lost momentum. This
was also the first time that it was mentioned that there was a large amount of data already collected
by WalkBike Worcester and Central Mass Regional Planning Commission from 2015 to 2017. If
it had not been brought up in conversation, I would not have known about this, and I would not
have been able to analyze past data collection techniques.
Meeting with Sarah Belisea and Patricia Padilla (Woodland Academy), 9/12/18
After this meeting, it was still clear that the lack of effective communication between
stakeholders may have contributed greatly to the end of the momentum. Many people were unsure
of who was responsible for what. It was clear that the project did not have a ‘community
champion’—someone who was effectively coordinating all parties toward the end goal of
improving student safety. However, it was certain that the school was supportive of any future
infrastructure changes if it meant increasing student safety. Additionally, it seemed urgent to find
all existing data and have it located in one place for future use.
Meeting with Nicole Edmonds (MassDOT Safe Routes to School Coordinator for Central MA),
10/3/18
It became clear that the coordinator position is not involved with analyzing collected data or
determining engineering-based improvements to the school zone. The coordinator serves as a
liaison between school officials and MassDOT. However, the coordinator was not involved in the
communication between Woodland Academy, WBW, CMRPC, MSCDC, or the DPW. This was
likely due to employee turnover, which played a role in the disconnect between all parties.
The expected time frame of the MassDOT SRTS process was brought to light from the
meeting. Woodland Academy had already been involved for years with many SRTS initiatives to
educate and encourage more people to walk and bike to school, but these initiatives were not

57
known or documented by the MassDOT coordinator. With the school having to organize
initiatives for students and parents for a least six months with no guaranteed consideration for
funding after, how can the school prove that such efforts took place?
This demonstrated how the lack of communication between stakeholders could delay the
process and put student safety at risk. This became a turning point in the project because student
safety should always be a top priority, and this is not something that can wait. Student safety is
still at risk every day regardless of what MassDOT sets as an appropriate time frame for funding.
Arrival and dismissals operations still go on daily, and it is a lot of pressure to put on the school
to keep students safe inside and outside of the classroom. This plays a fine line between the
responsibility of the school in terms of time and resources Because of this, it should be the
responsibility of various stakeholders within the community working together to make the
neighborhood safer every day.
Meeting with Jack Foley (Vice President of Government and Community Affairs, Clark
University), 10/23/18
This meeting highlighted Clark’s on-going interest in being involved with student safety. Clark
wants to be a good neighbor, and it is important to the University to improve safety of all students
living in the neighborhood. The University is willing to contribute resources in efforts to improve
pedestrian safety. Clark University would be a good ally in future SRTS efforts in Main South,
and there is the potential for all students in the neighborhood to participate in future safety
initiatives that connect art, engineering, and public health.
Additionally, this meeting ultimately encouraged the project to transition from suggesting
changes to implementing the demonstration project. With the backing and resources of a large
stakeholder in the community, it was the first time the project felt possible in the time frame. The
next step was to reach out to the City of Worcester DPW for permission.
Phone call with James Kempton (City of Worcester DPW Engineering Department), 10/25/18
Following this discussion, it was decided to aim to implement the traffic calming
demonstration for a few days during the week of 11/26/18-11/30/18. With resources and support
of both Clark University and the DPW, the demonstration would be possible as long as the school
was still interested in the initiative and if the weather permitted. This was also an important
milestone in the project because it was already moving past previous efforts. Additionally, using
Woodland Academy as a starting point and spreading word about the initiative has the potential to
make waves in the neighborhood by inspiring future work.
4.1.5 Community workshop
Community Planning Meeting (Woodland Academy), 11/8/18
This meeting highlighted the importance of making suggestions to the existing arrival and
dismissal system inside and outside of the school. A discussion about the use of the doors students
are allowed to enter during arrival began when discussing causes of bad driver behaviors on
Woodland Street. The procedures for the opening/closing times of doors are most likely
contributing to the back up of cars on Woodland that encourages cars to stop in the crosswalk and
congest Oberlin. If the door further down on Woodland was allowed to open, the cars could

58
potentially pull up farther on Woodland St and free the space near the crosswalk. Additionally,
drivers blocking the driveway ramp entrance to Claremont Academy and causing backups in to
the crosswalks on Woodland and Claremont was discussed. The idea of opening the staircase on
Claremont was discussed because of its potential to lead cars to drop off at that section of the street
instead of 20 feet from the crosswalk.
With confirmation that the school and crossing guards are supportive of implementing the
demonstration, the reality of the initiative came to fruition. Having the demonstration successfully
executed now became the main concern because of its potential to create waves in the community
and spark more SRTS movement throughout Worcester. The project now became more than just
an engineering-based design because of its stake in social equity and neighborhood reclaiming.
4.2 Objective 2: Determine challenges presented by existing infrastructure that
have high impact on the safety and efficiency of student mobility. Following the analysis of past collected data, arrival and dismissal observations, and
stakeholder interviews, a high impact area within the Woodland Academy school zone was chosen.
The high impact area was Woodland St in front of the entrance to the school from Oberlin to
Claremont. Specific reasons chosen for this location were:
1. Proximity to the entrance of the school.
2. The lack of a clear and effective student drop-off system.
3. The high amount of negatively observed driver behavior.
4. Positively observed arrival/dismissal operations that must continue to be supported.
5. High speeds observed on the street both during and outside of arrival/dismissal.
6. High student foot-traffic and use of crosswalks on Woodland St.
4.3 Objective 3: Develop engineering-based designs for at least one high impact
area in the neighborhood. Following the decision to make this location the high impact area, a traffic-calming
measure was designed to mitigate negative driver behaviors and reduce overall vehicle speed. A
median design (Figure 27) was chosen because of its potential to impact both behavior and speed:
1. Designates a student drop-off lane during arrival when Woodland is a one-way street.
a. Organizes arrival
b. Reduces the amount of space that drivers have on Woodland St and can
eliminate observed negative driver behaviors and encourage parent
cooperation.
2. Reduces lane widths on Woodland when it is a two-way street.
a. Forces drivers to slow down because their perception of safety when traveling
through shifts
b. Becomes an obstacle and a new element that encourages drivers to be more
present and aware of surroundings
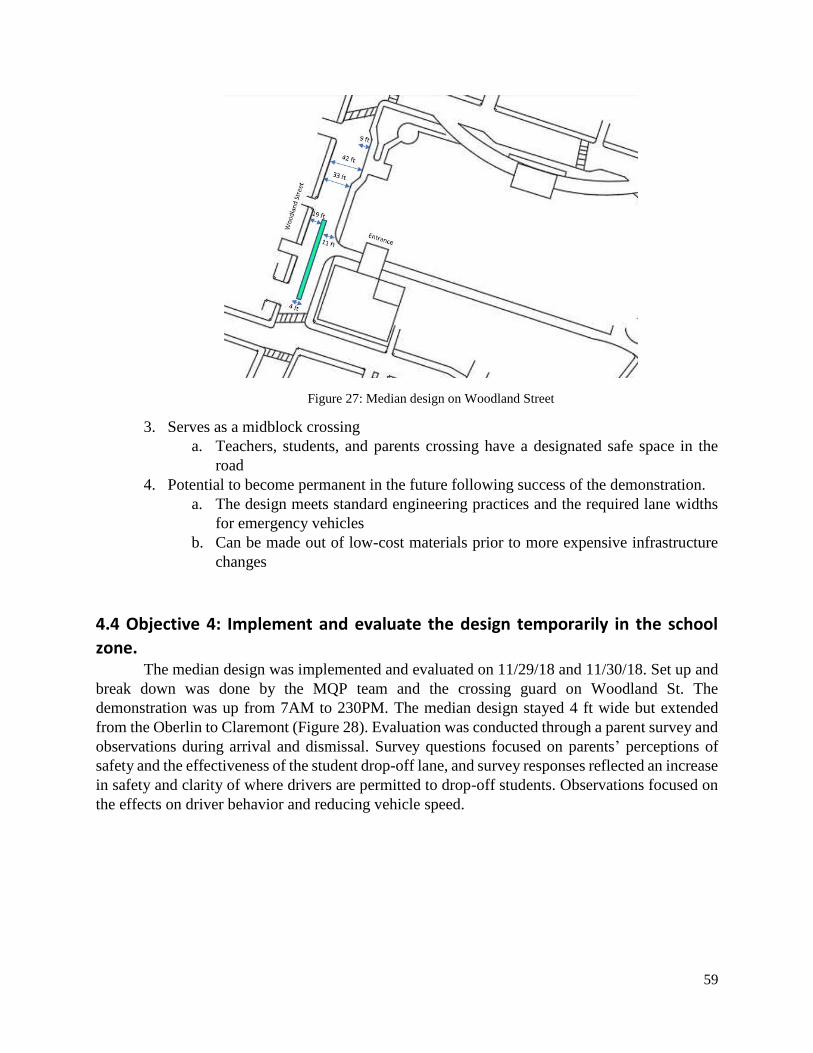
59
Figure 27: Median design on Woodland Street
3. Serves as a midblock crossing
a. Teachers, students, and parents crossing have a designated safe space in the
road
4. Potential to become permanent in the future following success of the demonstration.
a. The design meets standard engineering practices and the required lane widths
for emergency vehicles
b. Can be made out of low-cost materials prior to more expensive infrastructure
changes
4.4 Objective 4: Implement and evaluate the design temporarily in the school
zone. The median design was implemented and evaluated on 11/29/18 and 11/30/18. Set up and
break down was done by the MQP team and the crossing guard on Woodland St. The
demonstration was up from 7AM to 230PM. The median design stayed 4 ft wide but extended
from the Oberlin to Claremont (Figure 28). Evaluation was conducted through a parent survey and
observations during arrival and dismissal. Survey questions focused on parents’ perceptions of
safety and the effectiveness of the student drop-off lane, and survey responses reflected an increase
in safety and clarity of where drivers are permitted to drop-off students. Observations focused on
the effects on driver behavior and reducing vehicle speed.

60
Figure 28: Implemented median design
4.4.1 Driver behavior
The median design greatly impacted driver behavior on Woodland St during arrival
because it put vehicles in designated places (Figure 29 and Figure 30). When Woodland functions
as a one-way street, the median designated a student drop-off lane and a bus and thru traffic lane.
In doing so, parents dropping off students had to abide by the rule of dropping off students on the
school side of the street. Additionally, they were unable to pull up to the curb on the other side of
the road, could not drop students off in the middle of the road, and could not back up, u-turn, or
make similar maneuvers in the student drop-off zone.
Figure 29: Median design during arrival when Woodland functions as a one-way street

61
It was occasionally observed that parents would idle longer near the school entrance to unload
younger students. Additionally, it was occasionally observed that parents who did park and get out
of the vehicle did so when pulled over in the school-bus unloading zone which had little effect on
the continued flow of the student drop-off lane.
At the intersection of Woodland and Oberlin, it was observed that there was a long queue
of cars on Oberlin as a result of the slow (but steady) student drop-off line. At its peak, the queue
was observed to be approximately 30 cars long from the entrance and went down Oberlin to the
corner of Claremont Sq. There was also a queue of cars on Woodland St, but was only observed
to go to the corner of Norwood St. As a result of the student drop off lane, there was congestion at
the intersection. However, cars were moving slow and were observed to be able to negotiate. It
was also observed that vehicles did occasionally park in the crosswalk at this intersection. Street
parking and idling cars were still observed within 20 feet of the intersection.
At the intersection of Woodland and Claremont, cars were allowed to turn right onto
Claremont or were able to continue straight onto Woodland. A crossing guard stays at this
intersection during arrival and dismissal and was able to help lessen the confusion and help
students navigate the crosswalks. Because cars were traveling much slower on Woodland, merging
into this intersection did not appear to be an issue.
4.4.2 Vehicle speed
During arrival and dismissal when Woodland is a one-way, vehicle speed was very slow
as a result of the stop-and-go of drop-off. Following student drop-off, cars picked up a little speed
when traveling toward Claremont. However, it was still considerably slow as a result of the
reduced lane width all the way down the street.
During hours outside of arrival and dismissal, Woodland St functions as a two-way.
Vehicles were observed to slow down considerably as soon as the median began because of the
reduction in lane width. This was observed for cars traveling both northbound and south bound on
Woodland.
Figure 30: Median design when Woodland functions as a two-way street

62
4.4.3 Pedestrians
It was observed that teachers, students, and/or parents were able to use the median as a
mid-block crossing. It was also observed that pedestrians were still using the crosswalks at the
intersections on Woodland.
4.4.4 Analysis
The design was successful in organizing a student drop-off lane and was well received by
the school staff, crossing guards, and parents. Parents were not notified prior to the demonstration,
and the design was not verbally explained the morning of. The drivers were able to use the visual
cues of the redesign to navigate the space. Additionally, the parents did not seem to be angered by
the demonstration, and aggressive driver behavior was not observed on Woodland St. Additionally,
there were very few parents who idled in the lane, and this demonstrated the parents were accepting
of the responsibility to not park in the lane and create delays for other parents dropping off. The
school staff commented that less students were tardy as a result of this. The success of the drop-
off lane through the cooperation of the parents demonstrated the parents’ willingness to support
changes to improve safety if initiative is taken. This project shows the potential to educate and
encourage parents to be more conscious of their actions and potentially be open to alternative
modes of transport.
The design was able to negate a large amount of bad driver behaviors by simply not giving
the space to do so. Positive feedback was received from the crossing guard at the corner of
Woodland and Claremont because he did not have to worry about managing the drop-off line and
drivers making the environment unsafe for students walking in that section of the school zone. The
only maneuvers allowed in the student drop-off lane are stop and go. His focus was able to stay at
the intersection and make students crossing the road his top priority.
Because the median slowed down traffic and pushed most traffic to only one lane of the
street, pedestrians felt comfortable crossing the road because they perceived the street as less
overwhelming and dangerous to cross. Although everyone should be encouraged to use a
designated crosswalk, this midblock crossing did increase safety for people that wanted a direct
route to the entrance of the school and were not going to be convinced otherwise.
Congestion at the intersection on Woodland and Oberlin was considerable. However, the
congested intersection slowed cars down to a crawl. Although cars were idling in the crosswalks,
students were still able to cross. However, the visibility and obstructed sight distances of
pedestrians and vehicles in this intersection could become an issue. It is important to try to mitigate
this, and it might be beneficial to restrict street parking within 20 ft of the intersection.
Additionally, the congestion at this intersection may have delayed residents commuting to work.
However, drivers understanding that this congestion might become an everyday occurrence from
730AM-800AM may deter them from cutting through the school zone. The less cars commuting
to work through this neighborhood will lessen the congestion.
The reduction in vehicle speed when Woodland functions as a two-way also demonstrated
how the community can take back its space even while students are inside the building. Before the
median was in place, high vehicle speeds were observed on Woodland when school was in session.

63
It is important for all drivers to respect the posted school zone speed limits, but the wide road
widths and lack of bends in the road made drivers feel safe enough to drive well over the posted
speed limit. With the median and street parking on Woodland, the lane widths were narrowed.
Additionally, the median served as a gateway by reminding drivers that this neighborhood holds a
school. Drivers are a guest in the space and should be aware of their actions because of its effects
on everyone’s safety.
In short, the idea to put the design on Woodland St was to reduce negative behaviors while
supporting the good behaviors already in place. In doing so, the intent was to create a safer
environment directly around the school because of its potential to radiate outwards. With good
examples set around the school through the involvement of parents, students, teachers, residents,
and crossing guards, this combination of design, encouragement, and education will hopefully gain
traction and encourage people to be more conscious of their actions. Additionally, this project did
not serve to make it easier for parents to drop students off at school. Quite the contrary, the drop-
off lane restricts more than it allows. Through this, there is potential that the inconvenient idling
time spent in the drop-off line will encourage less drop-off and more walking. The parents aren’t
simply stuck in traffic; they are the traffic. On top of this, with the cars moving slower around the
school and an increase in foot traffic, hopefully parents will see that there is less of a threat from
the vehicles and allow students to walk as a result.
4.4.5 Suggestions to Stakeholders for Continued Success at Woodland Academy
Upon completing the evaluation of the demonstration project, suggestions were created for
the community to continue to improve safety at Woodland Academy (Table 3). The suggestions
are a way for stakeholders to work together toward a safer school zone.
Table 3: Suggestions for Stakeholders for Continued Success at Woodland
Academy Suggestion Explanation Who Could Potentially
Implement
Implement median
design daily with
movable materials or
construct a permanent
structure.
Moveable materials may be the only feasible
option at this time due to funding. However, if
continued success is seen, the school and
neighborhood could come together and push
for funding for permanent infrastructure from
organizations within Worcester.
Woodland Academy staff,
City of Worcester
Restrict street parking
20ft within the
intersection of
Woodland and
Oberlin and
Woodland and
Claremont.
It is important to keep sight distances clear for
drivers, pedestrians, and bicyclists, especially
with the congestion at the intersection of
Woodland and Oberlin. Keeping these spaces
free of street parking would allow pedestrians
to be seen in the intersection by drivers and
also allow pedestrians to see oncoming traffic.
City of Worcester

64
Suggestion Explanation Who Could Potentially
Implement
Continue to park on
Woodland St in
permitted spaces to
narrow the roadway
and create a buffer
for the sidewalk from
the road.
The median design was observed to work best
in addition to street parking on Woodland St
because this narrowed the road to the extent it
could be while still allowing emergency
vehicles to pass through. Without the cars,
drivers would feel less obligated to slow down
because they would have more space and feel
safer to drive faster.
Neighborhood residents
Keep crossing guard
at Woodland and
Claremont.
It is important to have a crossing guard at this
corner because Woodland is shut down as a
one-way. A large traffic volume turns onto
Woodland from May St, and it is important to
have someone at this location to enforce the
road closure (in addition to the materials that
shut down the street). It was observed that cars
occasionally disregard the closure and travel
around the blockade.
It is also important to have the crossing guard
there to ensure that students can cross the road
safely. This intersection has a high traffic
volume during arrival and dismissal and
continuing to keep the crossing guard here will
keep eyes on the street to protect students from
traffic. Because of this, the crossing guard
cannot be given the burden of trying to manage
student drop-off at the intersection of
Woodland and Oberlin.
Woodland Academy staff
Change doors
students are allowed
to enter during
arrival.
It was observed that there was a long queue of
cars in the Oberlin and Woodland intersection.
Although it slowed down the cars in the
intersection to a crawl, this could be
problematic for the visibility of pedestrians in
the crosswalk and the visibility of on-coming
traffic. Not only is the queue caused by the
large number of parents dropping off, but the
start of the drop-off line starts at the back
entrance to Woodland instead of the front
entrance. This causes a back up in the
intersection that could be lessened by allowing
students on-time to enter at the main entrance
for arrival and ask students that are tardy to
enter at the back entrance.
Woodland Academy staff

65
Suggestion Explanation Who Could Potentially
Implement
Encourage Park-and-
Walks at Woodland
Academy to promote
incremental steps for
parents and students
to utilize
nonmotorized
transport to school.
Instead of driving to the school, families drive
to a designated areas in the neighborhood and
walk the remainder of the trip together. This
encourages neighborhood involvement,
includes families who have an unsafe route
from home, and reduces traffic congestion in
the immediate school zone. This requires
identifying on or off-street parking, mapping a
safe route from the parking area, and
promoting parents to try the initiative.
Woodland Academy Staff,
Parents, Main South
Community Development
Center, WalkBike
Worcester
Continue to
emphasize SRTS
awareness to
students, parents, and
faculty at Woodland
Academy.
It is essential to continue to encourage and
educate the community on the importance of
student safety. Past initiatives such as
WalktoSchool and pedestrian safety trainings
should be continued by the school. The median
design will not alone improve safety without
the cooperation of the community. Promoting
SRTS in various ways can work as one mass
movement toward a modal shift. Additionally,
this can help to keep SRTS presence in case an
opportunity to apply for MassDOT SRTS
funding arises.
Woodland Academy Staff,
Main South Community
Development Center,
WalkBike Worcester,
MassDOT SRTS
Figure 31: Success during a demonstration day
66
4.5 Objective 5: Provide recommendations to challenges of creating a Safe Routes
to School plan. Following the outcome of the project, it became clear that this project became a success
through feedback from stakeholders, observing arrival and dismissal operations, identifying a high
impact area, creating a design, and implementing and evaluating the idea through a temporary
demonstration project. However, the steps to get to these points were not always so clear. As a
result of this, a methodology has been made to provide a guide as to how to continue SRTS
initiatives at other schools throughout Worcester, MA. The toolkit was placed into Chapter 5.

67
CHAPTER 5: TOOLKIT FOR IMPROVING STUDENT SAFETY
1. Create a base map of the school zone.
• Create a birds-eye-view of the area in order to have a foundation for discussion and
documenting data. This can be done by anyone who is confident in their computer
skills. This can be achieved by tracing over a photo from Google Maps using
PowerPoint, AutoCAD, or another drawing tool accessible. An electronic version
of the map should be saved in order to add features on top of it later on following
data collection. Having a large printed version of the map is also useful for
workshops so participants can have a visual of the school zone and can easily
draw/document what they see directly on the map.
2. Create an observation document to understand how the infrastructure, pedestrians, and
vehicles work holistically in the school zone.
• A template for the prompt list is provided in Table 4. However, it is important to
note the system is being documented as a whole. Simply having a count of missing
ADA pads or school zone signs does not paint the story of what is happening in the
school zone and how everything works together to create/mitigate issues. Less time
should be spent on tallying and painstakingly documenting infrastructure, and more
time should be spent thinking about what makes students safe in the neighborhood
and what makes students unsafe in the neighborhood based upon the relationship
between existing conditions, vehicles, and pedestrians. Being able to accurately
communicate this story with other stakeholders will stream-line the process in the
future. Examples of things to be mindful of include:
i. Set traffic controls and operations during arrival/dismissal
ii. Crossing guards
iii. Existing conditions (curb extensions, crosswalks, signage, sidewalk
conditions)
iv. Street geometry (lane widths, curvature)
v. Accessibility (ADA pads, curb cuts)
vi. Parking (on-street and off-street)
vii. Vehicle speed
viii. Driver behavior
ix. Pedestrian foot traffic
x. Bike facilities

68
Table 4: SRTS Prompt List (adapted from the FHWA Pedestrian Safety Road Audit) Group Questions to Consider
Design and
Connectivity • Are lane widths wider than they need to be?
• Does the road have curves?
• Are sidewalks provided along the streets in the school zone?
• If no sidewalk is present, is there a walkable shoulder wide enough to
accommodate cyclists and pedestrians on the road?
• Is there a buffer or separation (grass strip, street trees, utilities) between the
sidewalk and roadway?
• Are sidewalks/walkable shoulder continuous on both sides of the street?
• Do pedestrian facilities provide connectivity to various anchors in the community
(residential areas, stores, transit, schools, parks)?
• Do sidewalks provide direct access to the school without crossing parking lots and
traffic lanes?
• Do wide curb radii lengthen pedestrian crossings distances and encourage high-
speed right turns?
• Are raised medians present and provide a safe waiting area for pedestrians in the
road?
• Are marked crosswalks present?
Traffic • Are there high traffic volumes on the surrounding streets?
• Are there high crash volumes reported in the neighborhood?
• Are high speeds observed in the neighborhood?
• Are there large and/or busy intersections in the neighborhood?
Quality and
Conditions • Is the walking surface adequate and well-maintained?
• Is the walking surface too steep? (For example, think about icy conditions or
people with mobility limitation)
• Are corners and curb ramps appropriately planned and designed at each approach
to the crossing
Obstructions
and
Visibility
• Are there obstructions such as fences, parked vehicles, or vegetation that would
prevent a driver from seeing a child at an approaching intersection or driveway?
• Can pedestrians see approaching vehicles at all legs of the intersection/crossing
and vice versa?
• Is the distance from the stop (or yield) line to a crosswalk sufficient for drivers to
see pedestrians?
• Are intersection traffic control devices (stop signs or signals) visible and
appropriately placed?
• Are there cars parking parked within 20 feet of nearby intersections?
• Does the number of driveways make the route undesirable for pedestrian travel?

69
Group Questions to Consider
Arrival and
Dismissal
Operations
• Is there a designated drop-off/pick up lane for vehicles during arrival and
dismissal?
• Are there crossing guards/staff present outside?
• Are supervised crossings adequately staffed by a qualified crossing guard?
• Are there any road closures?
• Are drop-off/pick up lanes separated from bus lanes?
• Will snow storage disrupt pedestrian access or visibility?
Driver
Behavior
During
Arrival and
Dismissal
• Do drivers stop for pedestrians in crosswalks?
• Do drivers park in or within 20 ft of the crosswalks?
• Do turning vehicles pose a hazard to pedestrians?
• Do drivers run red lights or stop signs?
• Do drivers obey drop-off lanes?
• Do drivers pull up to the curb on the school side of the road?
• Do drivers drop off students in the middle of the travel lane?
• Do drivers park in the bus zone?
• Do drivers pull up the curb from the wrong direction?
• Do drivers back up, u-turn, and make similar maneuvers in the unload zones?
• Do drivers park and leave their cars in the drop-off area?
Lighting • Is the sidewalk adequately lit?
• Are the crosswalks adequately lit?
• Does street lighting improve pedestrian safety at night?
Signals,
Signs, and
Pavement
Markings
• Is the visibility of signs and pavement markings adequate during the day and night?
• Is the school speed limit posted in the school zone?
• Are intersection traffic control devices (stop signs or signals) present?
3. Observe arrival and dismissal as it happens naturally through a baseline observation of the
immediate school zone.
• This can be done by parent volunteers rather than well-known school staff who
would likely affect the behaviors of others. Volunteers should be gathered at least
30 minutes prior to the start so that they can be oriented about the task. Placements
should be assigned and clipboards should be distributed. In the morning, observe
30 minutes before the bell and 15 minutes after. In the afternoon, observe 15
minutes before the bell and 30 minutes after.
• Collect information about arrival and dismissal by inquiring with the school
principal and staff about the operations/traffic management in place.
i. Ask what works, what doesn’t, and what changes they would like to see.
This is an opportunity to get insight from people who see the system every
day, and it is a great way to make the job easier. However, it could be most
helpful to orient oneself with the infrastructure first, ask school staff for a
brief overview of the operations, do observations, and then follow up with
specific questions.

70
• A debrief meeting/small workshop should be held within the next couple of days
to facilitate a discussion about what each volunteer documented. This can be
facilitated by a school staff member or volunteer that is knowledgeable about most
areas of arrival and dismissal. The printed map should be used to allow people to
orient themselves and document observations. If the story about the immediate
school zone can be accurately told, another observation may not be needed.
However, if data is missing, another observation day may be necessary.
• Have a volunteer document arrival and dismissal observations on the electronic
baseline map. This can be done easily through Microsoft PowerPoint. Categories
to document on the map include
i. Good observed behaviors
ii. Bad observed behaviors
iii. Problematic existing conditions
iv. Existing traffic control and operations (designated drop-off areas, road
closures, school staff/crossing guards present)
4. Brainstorm potential solutions
• Bring the right people to the table following the completion of the observation map:
i. Engineers
ii. Teachers
iii. Parents
iv. Crossing guards
v. Urban planners
vi. Local biking/walking advocacy groups
• Analyze mapped data and determine high impact areas. It is important to remember
that the top priority is how to improve safety for pedestrians—not how to improve
traffic flow and make it easier for drivers to take over the space. Decide what would
reduce speed, mitigate negative behaviors, and support positive behaviors already
in place. The design should be something that can preferably stay up all day.
• After deciding the high impact area, an improvement plan can be made.
i. A volunteer can add the engineering-based design to the electronic baseline
map following the brainstorm with other stakeholders. The drawing itself
does not have to be perfectly accurate, but the correct dimensions of the
design should be labeled. Follow up may be necessary with people that have
a more technical background.
ii. Following the design decision, a budget and the materials necessary to make
the design come to life should be decided within a week. This can be another
brainstorm session and students, parents, residents, and local artists should
be brought together. Depending on the urgency of implementing the design,
a budget can be built from donations from local advocacy groups or through
community fundraising. However, if money is tight and the time line is
small, borrowing materials from the DPW or local universities with
resources may be feasible. Once this is decided, this is a way to show off
neighborhood creativity and culture with the purpose of taking the space
back from the vehicle.

71
• Decide how the design should be evaluated through input from the local DPW or
advocacy groups. Surveys to document parent perceptions of safety before and after
could be distributed (template in Appendix E). However, the best evaluation may
be through documenting observations and seeing what works, what doesn’t, and
ways to improve the design. Upon observing if the design is useful or not, small
interviews with parents or school staff could be useful to document feedback in real
time. Documenting interviews are helpful and can be useful to paint the picture
later.
• Recruit man-power to implement the demonstration project. The availability of
volunteers dictates how many days the design can be implemented. This can either
be a small group of volunteers or a larger one depending on the size of the design
and the materials obtained.
5. Implement improvement plan
• The design should be implemented 30 minutes prior to the start of arrival and
should be broken down 30 minutes following dismissal. Coordinate with the school
to store materials in a place that can be accessed early in the morning and late in
the afternoon. Helpful materials to bring on the day include:
i. Reflective vests for volunteers to wear when in the roadway
ii. Print out of design with dimensions
iii. Measuring tape to measure dimensions
iv. Chalk to mark dimensions and where materials need to go
v. Duct tape for new signs
6. Evaluate improvement plan
• Regardless of what is chosen for evaluation, documenting what is observed during
arrival and dismissal is the most important. Volunteers should take pictures of the
design in the school zone, and a write up should be done of how the design interacts
with vehicles, pedestrians, and existing infrastructure.
7. Continue to encourage momentum in the community.
• It is essential to continue to encourage and educate the community on the
importance of student safety. Promoting SRTS in various ways can work as one
mass movement toward a modal shift. Additionally, this can help to keep SRTS
presence in case an opportunity to apply for MassDOT SRTS funding arises.
Examples include:
i. WalktoSchool Days
ii. ParkandWalks
iii. Traffic safety education

72
APPENDICES A: MQP PROPOSAL
Improving Safety for Students in the Main South Neighborhood of Worcester,
Massachusetts
A Major Qualifying Project Proposal Submitted to the Faculty
of
WORCESTER POLYTECHNIC INSTITUTE
in partial fulfillment of the requirements for the
Degree of Bachelor of Science
by
Sarah Brown
Date: 10/11/18
Advisor:
Suzanne LePage

73
TABLE OF CONTENTS Capstone Design Statement ......................................................................... Error! Bookmark not defined.
Introduction .................................................................................................. Error! Bookmark not defined.
Objectives ................................................................................................... Error! Bookmark not defined.
Background .................................................................................................. Error! Bookmark not defined.
Main South ................................................................................................. Error! Bookmark not defined.
Infrastructure ............................................................................................. Error! Bookmark not defined.
The Safe Routes to School movement ......................................................... Error! Bookmark not defined.
Improving safety for students in Main South ............................................. Error! Bookmark not defined.
Recommendations ...................................................................................... Error! Bookmark not defined.
Methodology ................................................................................................. Error! Bookmark not defined.
Objective 1: Identify, evaluate, and prioritize stakeholders significant to the project.Error! Bookmark
not defined.
Objective 2: Evaluate and collect data from school zones in the Main South.Error! Bookmark not
defined.
Objective 3: Determine challenges presented by infrastructure that has high impact on the safety and
efficiency of student mobility. .................................................................... Error! Bookmark not defined.
Objective 4: Provide recommendations to challenges of creating a Safe Routes to School plan. .... Error!
Bookmark not defined.
Objective 5: Develop engineering-based designs for at least one high impact area in the neighborhood.
................................................................................................................... Error! Bookmark not defined.

74
CAPSTONE DESIGN STATEMENT
In order to meet the criteria set forth by the Accreditation Board for Engineering and
Technology (ABET) this project will need to meet the requirements of the capstone design
experience for Major Qualifying Projects. According to ABET General Criterion 4, “students must
be prepared for engineering practice through the curriculum culminating in a major design
experience based on knowledge and skills acquired in earlier course work and incorporating
engineering standards and realistic constraints that include most of the following considerations:
economic; environmental; sustainability; manufacturability; ethical; health and safety; social; and
political.” 115 A portion of this Major Qualifying Project will apply a health and safety approach
to improve the quality of life of students in the Main South neighborhood of Worcester,
Massachusetts. The goal of the project is to improve infrastructure by providing recommendations
to the built environment as well as to the collection of data about existing infrastructure,
organization of stakeholders, and implementation of recommended designs. The project
incorporated the following constraints covered in the capstone design statement: sustainability,
environmental, ethical, political, constructability, health and safety, and social.
Sustainability
Adequate walking and biking conditions can make people feel safe and can encourage more
people to use alternate modes of transport. Sustainability will be considered through the impacts
of increasing alternative modes and the overall reduction of vehicles on the road on the quality of
life of the neighborhood.
Environmental
This project will focus on the design of the built environment and the potential to encourage
alternative modes of transportation to the private vehicle. Safer walking and biking conditions can
encourage alternate modes of transport and reduce the number of children being dropped off at
school. The reduction of the number of private vehicles on the road can result in a reduction in the
amount of fuel used, pollution from emissions, and infrastructure related resources.
Ethical
This project will use technology and knowledge to better the existing built environment of
the community. It is recognized that the health, safety, and welfare of the public relies on ethical
engineering judgements, decisions, practices, and the product of the services. Additionally, this
project will work to “seek opportunities to be of constructive service in civic affairs and…the
protection of the environment through the practice of sustainable development.”116
Political
115 Criteria for Accrediting Engineering Programs (2008). 116 ASCE Code of Ethics (2017).

75
Input from the Main South Community Development Center, the MassDOT Safe Routes
to School program, and various other organizational stakeholders within Worcester will be used
when designing recommendations. Collaboration between the City of Worcester and all
stakeholders may be necessary for the funding and implementation of the proposed
recommendations.
Constructability
This project will produce realistic safe route designs that fit student needs in the Main
South neighborhood. The routes will be designed to be feasible for various stakeholders within the
community to implement. From the proposed designs, improvements to infrastructure can be made
to increase student walking and biking ability and reduce the number of children being dropped
off at school.
Health and Safety
In 2016 there were 5,987 pedestrians killed in traffic crashes in the United State – a nine
percent increase from 2015.117 Creating environments that encourage reduced speeds of vehicles
and encourage alternative modes of transport can increase pedestrian safety. Additionally,
improving the safety can increase more non-motorized transportation to school and reduce the
amount of traffic in school zones during arrival and dismissal times. Further, encouraging students
to walk and bike can inspire more healthy and active lifestyles at an early age.
Social
Data regarding safety of students in Main South was previously collected by WalkBike
Worcester, the Central Massachusetts Regional Planning Commission, and MassDOT, but no
further coordination or implementation has come of past efforts. This project will analyze, update,
and organize data collected in the neighborhood to submit information to state and federal agencies
for further implementation. Recommendations will also be provided to improve coordination and
communication of the data collection process between stakeholders in Worcester for the future
success of the Safe Routes to School program.
117 “Pedestrian Traffic Safety Facts,” National Highway Safety Traffic Administration (2018).

76
INTRODUCTION
Within the Main South neighborhood of Worcester, Massachusetts (Figure 32), there is a
growing need to improve the safety of students. Transportation is not provided by schools within
the neighborhood, and students are expected to walk, bike, or be dropped off. Existing
infrastructure, such as sidewalks, streets, intersections, crosswalks, and signals, influence driver
behavior and how students move through the area.
Figure 32: Main South neighborhood in Worcester, MA118
Main Street in Worcester connects the neighborhood to the downtown. The street is home to
businesses, Clark University, and a large amount of pedestrian traffic. It cuts through the center of
Main South and is crossed by many pedestrians (including students) to travel to different anchors
in the neighborhood. Wide lanes on Main Street allow for illegal two lanes of traffic and there is a
lack of street trees and grass strips. Line of sight obstructions from pedestrian views, lack of
separation of pedestrians from vehicles, and driver behavior also affect various streets in the
neighborhood. The intersection of Main, Hammond, and May Street also creates a problem for
pedestrians due to lengthy crosswalks, parked cars blocking pedestrian views, and aggressive
driver behavior. A high number of turning movements, failure to stop for pedestrians, drivers
entering crosswalks before looking for pedestrians, and drivers running red lights are also common
themes at other intersections throughout the neighborhood.
The built environment creates barriers and impacts the safety of students in Main South.
Those who must walk or bike to school are forced to in unpredictable, uncomfortable, and unsafe
conditions. Students who have the ability to get dropped off at school do so at a cost; as more
students are dropped off, more traffic during arrival and dismissal times impacts the safety of other
students walking and biking. The cycle between safety and traffic in the neighborhood can
continue indefinitely until action is taken to improve conditions. Creating safety awareness in
schools can become a starting point for communities wishing to start addressing the need, but in
the end, the benefits can extend into the neighborhood, creating safer environments throughout a
118 Google Maps (2018).

77
network for all users. “If we can build a successful city for children, we can build a successful city
for all people.” 119
In efforts to draw attention to the safety of children, the Federal Safe Routes to School
program was created to collect and submit data to the National Center for Safe Routes to School
regarding safety conditions of children walking and biking in school zones. The goal of the
program is to work to create future environments where safety is not a barrier through education,
encouragement, engineering, and enforcement. Research from the Federal Safe Routes to School
program has shown that many initiatives take place within low resourced areas throughout the
United States. In Worcester, MA, the Main South neighborhood is also the ideal location.
The goal of this project is to improve safety for students in the Main South neighborhood
of Worcester, Massachusetts. Research will be based on assessing other communities and
organizations that have implemented improvements for the safety of students, analyzing existing
collected data of the neighborhood, interviewing stakeholders, and conducting site observations of
existing infrastructure. Recommendations will focus on ways to improve infrastructure as well as
how to improve the coordination and implementation of data collected to create a Safe Routes to
School plan. Through improving the safety of students in the neighborhood, the community can
focus on improving areas through youth-centered safety initiatives that can spark more movement
to create spaces where safety is not a barrier against mobility.
Objectives
1. Identify, evaluate, and prioritize stakeholders significant to the project.
2. Collect and evaluate data from school zones in the neighborhood.
3. Determine challenges presented by existing infrastructure that have high impact on the
safety and efficiency of student mobility.
4. Provide recommendations to challenges of creating a Safe Routes to School plan.
5. Develop engineering-based designs for at least one high impact area in the neighborhood.
119 David Byrne, Bicycle Diaries, 283.
78
BACKGROUND
Main South
The Main South and Piedmont neighborhoods of Worcester, Massachusetts have the most
densely populated areas, highest number of minority residents, the lowest incomes, and the highest
rates of crime within the city.120 The median household income in the City of Worcester was
$45,599 as of 2016, which is $21,500 below the median income compared to the rest of Worcester
County. 121 Main South is home to Title 1 schools: a student base that is predominantly lower-
income, and financial assistance is provided to schools to help bridge gaps between high resource
and low resource neighborhoods when working to meet challenging statewide academic standards.
Within the program, the Commonwealth works to provide all students with access to the same
academic content, regardless of zip code, background, or abilities. However, it is also important to
consider the effects of the built environment on the community that has formed life around it.
Most built environments where low income, multi-ethnic or minority communities live
have chronic built environment stressors. With limited resource capacity to respond, their
vulnerability to adverse health outcomes is magnified.122 Within Main South, a network of heavy
traffic and lack of sufficient infrastructure for pedestrians has created a stressful environment that
is unsafe for children to walk or bike to and from school and other anchors in the community
(parks, community centers, etc). Additionally, transportation is not provided to schools (some
exceptions are made for students with disabilities). Students must walk, bike, or be dropped off.
While time spent in school is for education, students and parents are forced to focus on how to get
to and from school safely and efficiently. Arrival and dismissal times are spent battling driver
behavior while trying to protect students from traffic.
Infrastructure
Communities are continuously accommodating to increased traffic volumes and have created
a focus on protecting the motorized infrastructure over the non-motorized. Throughout history, the
relationship between the automobile and the urban spatial structure has significantly affected the
quality of life within a community. Within older, denser cities there are lower automobile fatality
rates than newer, sprawling ones, and communities shaped around automobiles seem the most
effective at smashing them into each other.123 Additionally, too much accessibility through private
vehicles can contribute to social exclusion through environmental degradation, adverse public
health impacts, high accident rates, declining public transport, changes in land use and community
severance.124
120 Downs, Timothy, Ross, Laurie, Patton, Suzanne, “Complexities of holistic community-based participatory research
for a low income, multi-ethnic population exposed to multiple built-environment stressors in Worcester,
Massachusetts,” Environmental Research. (2009): 1028. 121 United States Census Bureau (2016). 122 Downs, Timothy, Ross, Laurie, Patton, Suzanne, “Complexities of holistic community-based participatory research
for a low income, multi-ethnic population exposed to multiple built-environment stressors in Worcester,
Massachusetts,” Environmental Research. (2009): 1028. 123 Speck, Jeff. Walkable City (2012): 25. 124 Preston, John, Raje, Fiona. “Accessibility, Mobility and Transport-Related Social Exclusion.” Journal of Transport
Geography. (May 2007): 154.

79
Throughout the United States, wide lane widths, big block, multilane systems, and trees
stripped from roadways have shaped urban areas. The desire for unimpeded traffic and the idea
that higher design speeds make for safer streets has become common ideology amongst traffic
engineers.125 However, it doesn’t take a traffic engineer to see the relationship between wider
lanes, lack of obstacles, and speeding drivers. Traffic engineers “design streets for speeds well
above the posted limit, so that speeding drivers will be safe—a practice that, of course, causes the
very speeding it hopes to protect against.”126 The idea of risk homeostasis, adjusting behavior to
maintain a comfortable level of risk, can be seen on roads. The safest roads are those that feel the
least safe because they demand more attention from drivers.127
As the disconnect from local officials on how to design fair streets is becoming more
prominent, the professionalization of the engineering and planning industry has also become an
increasingly top down and citizen-less approach. 128 The relationship between engineers and
planners, private vehicles, and the new urban spatial structure has significantly affected everyday
life, and the daily decisions of local officials are still, more often than not, making decisions that
are disconnected from the current need.129 Low-density patterns created by city zoning codes and
land use ordinances resulted from engineering for the automobile. Vested interest of city engineers
remains recalcitrant and outdated.130 The field of traffic engineering has created standards for
factors such as block size, land width, turning motions, direction of flow, signalization, and
roadway geometry that determine car speed and the likelihood of a pedestrian’s
safety.131Additionally, a disregard for the human scale and other modes of transportation placed
pedestrian safety on par with driver safety.132
The Safe Routes to School movement
In efforts to draw attention to the relationship between the built environment and the safety
of children, the Safe Routes to School (SRTS) movement began. In the 1970s, SRTS began in
Denmark to combat a growing number of traffic fatalities. It is best defined by the name itself:
safely walking and bicycling to and from school. The City of Odense began to implement the
innovative initiative when it experienced the highest rate of traffic fatalities among children in
Western Europe. The initiative saw lowered speed limits, separated bike paths from car and
pedestrian traffic, improved mass transit, and other infrastructure improvements. Today,
approximately 4 out of 5 students in Odense use non-motorized transport safely to school. 133 The
SRTS concept spread internationally, with programs developing in other parts of Europe,
Australia, New Zealand, Canada and the United States.
In 1997, New York City had the first SRTS in the United States, and the state of Florida
implemented a pilot program. In 2000, two more SRTS pilot projects were funded by Congress.
Additionally, grassroots SRTS efforts began throughout the United States. The success of the
125 Speck, Jeff. Walkable City (2012): 170. 126 Speck, Jeff. Walkable City (2012): 169. 127 Speck, Jeff. Walkable City (2012): 174. 128 Speck, Jeff. Walkable City (2012). 129 Speck, Jeff. Walkable City (2012): 3. 130 Garcia, Anthony, Lydon Mike. Tactical Urbanism (2015): 9. 131 Speck, Jeff. Walkable City (2012). 132 Speck, Jeff. Walkable City (2012): 225. 133 “The Decline of Walking and Biking,” National Center of Safe Routes to School (2011).
80
initiatives created incentive for a federally funded national program. In 2003, advocates and
experts in transportation gathered to discuss SRTS and the potential of a national program. The
Federal Safe Routes to School program began in 2005 when the Safe, Accountable, Flexible,
Efficient Transportation Equity Act: A Legacy for Users (SAFETEA-LU) was passed. The
program has brought awareness to the walking and biking safety in school zones where youth is
present, and it provided the Federal Highway Administration (FHWA) with over $1 billion in
dedicated funding for implementation through State departments of transportation (DOTs). Safe
Routes to School program has expanded to many communities and has encouraged State DOTs,
metropolitan planning organizations (MPOs), and regional planning organizations (RPOs) to
prioritize pedestrian safety in transportation planning.134 In 2018, Massachusetts alone has over
800 registered SRTS school programs.
However, the decline of children moving around neighborhoods by foot or bike is still
apparent throughout the United States. In 1969, 48% of children 5 to 14 years of age usually
walked or bike to school. In 2009, that percentage dropped to 13%. 135 According to the National
Highway Traffic Safety Administration, in 2013, 288 pedestrians and bicyclists ages 14 and under
were killed, and approximately 15,000 children in this same age group were injured while walking
or bicycling.136 And while the response has been for students to be driven to school, motor vehicle
crashes are one of the leading causes of death for school-age children. In 2013, 1,149 children ages
14 and under were killed and 172,000 children in this age group were injured as motor vehicle
occupants.137 Parents driving students to school increases traffic in school zones where other
students must still walk or bike. As motor vehicle traffic continues to increase, students no longer
feel safe using non-motorized modes. This sentiment does not go unnoticed; environments have
been created where safety of pedestrians has not been a priority.
The Federal Safe Routes to School program collects and submits data to the National
Center for Safe Routes to School (NCSRTS) regarding safety conditions of children walking and
biking in school zones. The National Center for Safe Routes to School is part of the UNC Highway
Safety Research Center (HSRC) and works closely with the Pedestrian and Bicycle Information
Center (PBIC), which serve as the US Department of Transportation’s clearinghouse for pedestrian
and bicycle research and tools.138
The National Center provides resources on how to start and maintain a SRTS program from
start to end. Before the beginning of program, a variety of stakeholders must come together to
share concerns, interest, and knowledge. Successful SRTS programs have had a program champion
— someone who has enthusiasm and time to provide leadership for the group and keep things
moving. One essential part of the data collection happens through observing and mapping routes
in the school zone. Collecting traffic counts and crash history can help identify driver-related safety
issues and observing arrival and dismissal times can gather information on issues unique to the
school zone. This requires the participation of various stakeholders including transportation, public
134 “Creating Healthier Generations: A Look at the 10 Years of the Federal Safe Routes to School Program,” National
Center of Safe Routes to School, 2015. 135 “The Decline of Walking and Biking,” National Center of Safe Routes to School (2011). 136 National Highway Traffic Safety Administration (2015). 137 National Highway Traffic Safety Administration (2015). 138 National Center for Safe Routes (2018).

81
health, and planning professionals, school administrations, police officers, community
organizations, and families.139
The second aspect of the data collection is determining the number of students who walk
and bike to school, which can be assessed through NCSRTS surveys. The National Center provides
a data system for local, regional, and state SRTS partners to enter and view data collected using
the standardized Student Travel Tally and Parent Survey questionnaires. As of March 2015, the
data system surpassed 1.58 million data records, including 1,313,534 Parent Surveys and 267,779
Student Travel Tally questionnaires from 12,384 schools.140 Use of the data system is free and
available to any school. The system generates summary reports to make it easy to share findings
with community stakeholders and others interested in understanding walking and biking rates for
students.
From the information collected, potential solutions for education, encouragement,
engineering and enforcement strategies can be identified. A SRTS plan does not need to be lengthy,
but it is important to incorporate encouragement, enforcement, education, and engineering
strategies. It describes the recommendations while providing a time schedule, map, and
explanation of how to evaluate the program. Once the plan is ready, the SRTS program can apply
for funding from a variety of agencies such as federal, state, municipal, environmental, health, and
philanthropic organizations. 141
Various safety benefits from the SRTS program have been identified. In New York City,
researchers found there was a 44 percent decrease in school-aged pedestrian injury rates after
infrastructure improvements were made in areas with SRTS interventions relative to sites without
interventions.142 Researchers also found broader benefits such as “reduced transportation costs,
more connectivity within communities, and how SRTS could serve as a tool to help combat
truancy, to improve readiness to learn, and enhance community life.”143 With the information
collected, the National Center for Safe Routes to School has been able to further Vision Zero, a
movement in cities around the world to eliminate traffic death and serious injuries to make cities
safe for all road users.144
Improving safety for students in Main South
As the world continues to rapidly urbanize, disparities amongst affluent and low-resourced
communities are continuing to grow. The growing disconnect highlights “increasing inequality
and social injustice, deteriorating social order, and a disproportionate environmental health burden
139 “Safe Routes,” National Center of Safe Routes to School, 2018. 140 “Creating Healthier Generations: A Look at the 10 Years of the Federal Safe Routes to School Program,” National
Center of Safe Routes to School, 2015. 141 “Steps to Creating a Safe Routes to School Program,” Safe Routes Info (2018). 142 “Creating Healthier Generations: A Look at the 10 Years of the Federal Safe Routes to School Program,” National
Center of Safe Routes to School, 2015. 143 “Creating Healthier Generations: A Look at the 10 Years of the Federal Safe Routes to School Program,” National
Center of Safe Routes to School, 2015. 144 “Safe Routes,” National Center of Safe Routes to School, 2018.
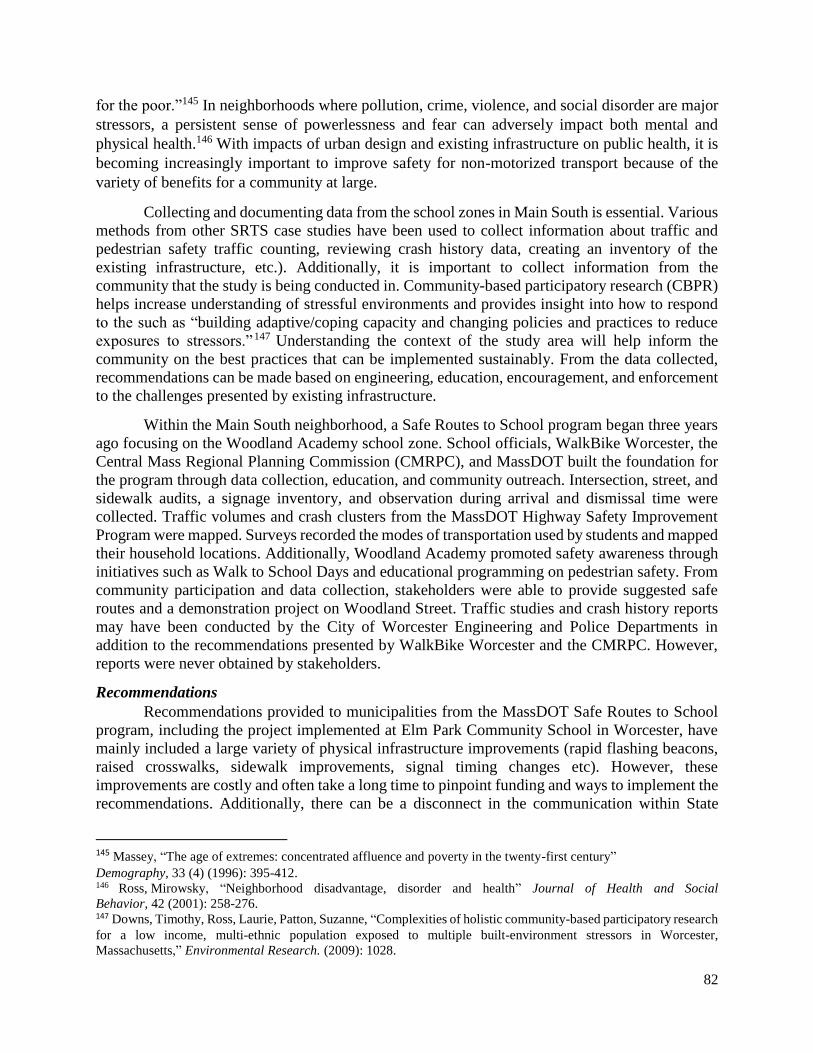
82
for the poor.”145 In neighborhoods where pollution, crime, violence, and social disorder are major
stressors, a persistent sense of powerlessness and fear can adversely impact both mental and
physical health.146 With impacts of urban design and existing infrastructure on public health, it is
becoming increasingly important to improve safety for non-motorized transport because of the
variety of benefits for a community at large.
Collecting and documenting data from the school zones in Main South is essential. Various
methods from other SRTS case studies have been used to collect information about traffic and
pedestrian safety traffic counting, reviewing crash history data, creating an inventory of the
existing infrastructure, etc.). Additionally, it is important to collect information from the
community that the study is being conducted in. Community-based participatory research (CBPR)
helps increase understanding of stressful environments and provides insight into how to respond
to the such as “building adaptive/coping capacity and changing policies and practices to reduce
exposures to stressors.”147 Understanding the context of the study area will help inform the
community on the best practices that can be implemented sustainably. From the data collected,
recommendations can be made based on engineering, education, encouragement, and enforcement
to the challenges presented by existing infrastructure.
Within the Main South neighborhood, a Safe Routes to School program began three years
ago focusing on the Woodland Academy school zone. School officials, WalkBike Worcester, the
Central Mass Regional Planning Commission (CMRPC), and MassDOT built the foundation for
the program through data collection, education, and community outreach. Intersection, street, and
sidewalk audits, a signage inventory, and observation during arrival and dismissal time were
collected. Traffic volumes and crash clusters from the MassDOT Highway Safety Improvement
Program were mapped. Surveys recorded the modes of transportation used by students and mapped
their household locations. Additionally, Woodland Academy promoted safety awareness through
initiatives such as Walk to School Days and educational programming on pedestrian safety. From
community participation and data collection, stakeholders were able to provide suggested safe
routes and a demonstration project on Woodland Street. Traffic studies and crash history reports
may have been conducted by the City of Worcester Engineering and Police Departments in
addition to the recommendations presented by WalkBike Worcester and the CMRPC. However,
reports were never obtained by stakeholders.
Recommendations
Recommendations provided to municipalities from the MassDOT Safe Routes to School
program, including the project implemented at Elm Park Community School in Worcester, have
mainly included a large variety of physical infrastructure improvements (rapid flashing beacons,
raised crosswalks, sidewalk improvements, signal timing changes etc). However, these
improvements are costly and often take a long time to pinpoint funding and ways to implement the
recommendations. Additionally, there can be a disconnect in the communication within State
145 Massey, “The age of extremes: concentrated affluence and poverty in the twenty-first century”
Demography, 33 (4) (1996): 395-412. 146 Ross, Mirowsky, “Neighborhood disadvantage, disorder and health” Journal of Health and Social
Behavior, 42 (2001): 258-276. 147 Downs, Timothy, Ross, Laurie, Patton, Suzanne, “Complexities of holistic community-based participatory research
for a low income, multi-ethnic population exposed to multiple built-environment stressors in Worcester,
Massachusetts,” Environmental Research. (2009): 1028.
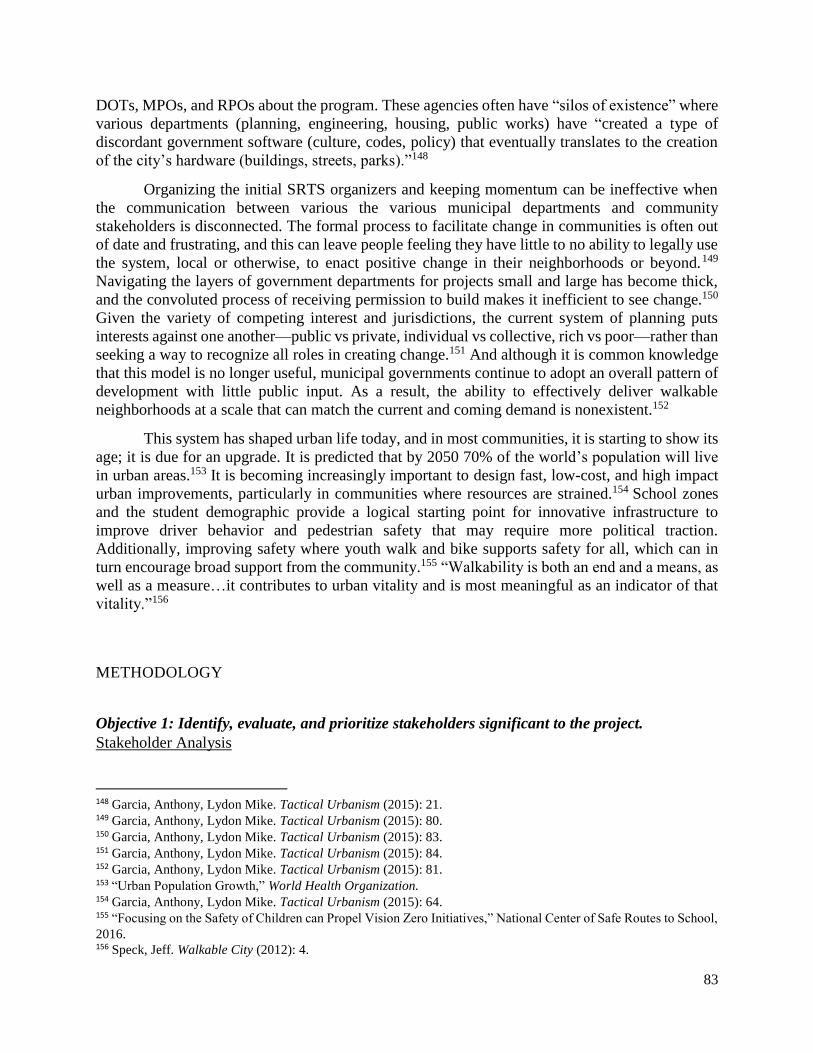
83
DOTs, MPOs, and RPOs about the program. These agencies often have “silos of existence” where
various departments (planning, engineering, housing, public works) have “created a type of
discordant government software (culture, codes, policy) that eventually translates to the creation
of the city’s hardware (buildings, streets, parks).”148
Organizing the initial SRTS organizers and keeping momentum can be ineffective when
the communication between various the various municipal departments and community
stakeholders is disconnected. The formal process to facilitate change in communities is often out
of date and frustrating, and this can leave people feeling they have little to no ability to legally use
the system, local or otherwise, to enact positive change in their neighborhoods or beyond.149
Navigating the layers of government departments for projects small and large has become thick,
and the convoluted process of receiving permission to build makes it inefficient to see change.150
Given the variety of competing interest and jurisdictions, the current system of planning puts
interests against one another—public vs private, individual vs collective, rich vs poor—rather than
seeking a way to recognize all roles in creating change.151 And although it is common knowledge
that this model is no longer useful, municipal governments continue to adopt an overall pattern of
development with little public input. As a result, the ability to effectively deliver walkable
neighborhoods at a scale that can match the current and coming demand is nonexistent.152
This system has shaped urban life today, and in most communities, it is starting to show its
age; it is due for an upgrade. It is predicted that by 2050 70% of the world’s population will live
in urban areas.153 It is becoming increasingly important to design fast, low-cost, and high impact
urban improvements, particularly in communities where resources are strained.154 School zones
and the student demographic provide a logical starting point for innovative infrastructure to
improve driver behavior and pedestrian safety that may require more political traction.
Additionally, improving safety where youth walk and bike supports safety for all, which can in
turn encourage broad support from the community.155 “Walkability is both an end and a means, as
well as a measure…it contributes to urban vitality and is most meaningful as an indicator of that
vitality.”156
METHODOLOGY
Objective 1: Identify, evaluate, and prioritize stakeholders significant to the project.
Stakeholder Analysis
148 Garcia, Anthony, Lydon Mike. Tactical Urbanism (2015): 21. 149 Garcia, Anthony, Lydon Mike. Tactical Urbanism (2015): 80. 150 Garcia, Anthony, Lydon Mike. Tactical Urbanism (2015): 83. 151 Garcia, Anthony, Lydon Mike. Tactical Urbanism (2015): 84. 152 Garcia, Anthony, Lydon Mike. Tactical Urbanism (2015): 81. 153 “Urban Population Growth,” World Health Organization. 154 Garcia, Anthony, Lydon Mike. Tactical Urbanism (2015): 64. 155 “Focusing on the Safety of Children can Propel Vision Zero Initiatives,” National Center of Safe Routes to School,
2016. 156 Speck, Jeff. Walkable City (2012): 4.

84
A stakeholder analysis will identify people and organizations involved in the project, in
addition to the target group and the implementing agency. Further, it will help to speculate
expected support or opposition to the program.157 This method is used during the preliminary
stages of a project to incorporate interests and expectations of groups significant to the project. It
is important to recognize that various organizations and authorities have different ways of thinking,
motives, and interests. Additionally, it is fundamental to analyze perspectives both in planning and
during implementation.
Stakeholders will be identified through research, brainstorming, and through
recommendations from other identified stakeholders.
1. A list will be created of all parties that are likely to be affected by the Safe Routes
to School program in Main South both positively or negatively, directly or
indirectly. This list consists of stakeholders concerned about the project, influential
positions, and groups that may be affected by the problems addressed in the
program.
2. Grouping will be identified by the different types of roles such as coordinator, data
collector, and implementor alongside the role the stakeholder plays in the past,
present, or future.
3. The groupings will be analyzed further, and an estimate of each stakeholder’s
interest and influence will be identified. It is important to incorporate the different
assumptions, interests, and biases of the groups. These groups will be analyzed by
the following:
a. Characteristics such as social, status, and structure
b. Problems facing the group such as economic, ecological, and cultural
c. Main needs, wishes, interests (expressed, hidden, vested), motives (hopes,
expectations, and fears), attitudes (friendly, neutral, hostile)
d. Potential strengths and weaknesses in terms of resources and what the group
could contribute
e. Linkages between groups including conflicts of interests, past relations, and
dependency on other groups158
4. Priorities will be set
a. Where is the highest need of external assistance?
b. What conflicts could arise by supporting specific interest groups? How can
those conflicts be avoided?
Through stakeholder mapping, the needs of the community and interest groups will be
represented and protected, and the internal needs of institutions are not merely the focus.
157“Participation Analysis” Upgrading Urban Communities, A Resource Framework, MIT (2001). 158 “Participation Analysis” Upgrading Urban Communities, A Resource Framework, MIT (2001).

85
Objective 2: Evaluate and collect data from school zones in the Main South.
Archival Research
Extensive research on the built environment and its effects on walking, biking, and overall
community vitality will be evaluated. This will focus on how engineers have designed streets,
intersections, and neighborhoods. The effects of characteristics of streets and intersections such as
lane width, the number of lanes, lack of crosswalks, signs, sight obstructions, and a lack of
separation of pedestrian from vehicles will be evaluated. The effects of existing infrastructure on
driver behavior will also be researched. There are many things a driver perceives as allowable due
to the infrastructure in place. This includes behavior such as speeding, turning right on red lights,
and pulling into crosswalks before checking for pedestrians. The risk to the quality of life of
residents can also be evaluated in the context of Main South.
Additionally, research on communities that have made improvements to pedestrian and
bicyclist safety will be conducted. Research will also be conducted on Safe Routes to School
programs and other similar case studies throughout the world that focus on improving safety. No
two programs are identical and vary depending on the context of the urban area. The logistics of
the process of each study will be assessed. This includes how data was collected, analyzed, shaped
into recommendations, funded, and implemented.
Content analysis
In Main South, past data collection has been conducted. This includes information such as
street, intersection, and signage audits, student surveys of travel modes, and traffic volumes in the
catchment area. As a result, two deliverables were created: mapped suggestions of the safest routes
for students and a potential demonstration project in the school zone. The collected data and its
role in shaping the deliverables will be evaluated to make valid inferences about the stakeholders’
perceptions. This method will also be used to compare past and present conditions of the
neighborhood. Inferences obtained from the content analysis will be used during the design of
recommendations to improve infrastructure.
Site Observation
This method will be used to make comparisons between past and existing conditions. To collect
data about the existing infrastructure, walkthroughs of the Main South neighborhood will be
conducted. Notes about conditions that impact safety will be documented in a field book as well
as in pictures. Checklists from the Pedestrian and Bicycle Information Center, National Safe
Routes to School, and the Federal Highway Agency Pedestrian Safety Road Audit will be
referenced. Observations documented will be related to:
• Presence, design, and placement of sidewalks
• Quality, conditions, and obstructions
• Continuity and connectivity
• Signs and pavement markings
• Traffic
• Signals

86
In addition to documenting physical infrastructure, natural observation of the study area will also
be conducted. Observing and taking field notes at arrival and dismissal times at the various schools
will provide insight into how the existing infrastructure is impacting the school zone.
Non-Structured Interviews
To collect data about the Main South neighborhood, non-structured interviews with
stakeholders will be held. These include personnel at organizations that have an interest in the
initiative (i.e. bike advocacy groups, urban planners, transportation engineers, school officials).
The experts will be chosen because they provide insights on current transportation infrastructure
and the unique economic and social factors of Main South; they are essential in formulating
feasible and creative recommendations based on the existing infrastructure. Questions asked will
be related to:
• Current concerns about conditions within the Main South
• The success of the previous Safe Routes to School program in Main South and any
information collected and documented
• Prior walking and biking initiatives within school zones
• Collaborations with other events/organizations
• Civil education and enforcement ideas
• Incentives of alternate modes of transport
Discussions or walkthroughs of the study area will have data collected with field notes.
Formal interviews will be collected by an audio recording and notes during the interview. From
the audio recording and field book, the data will be transcribed into a Word document. Interviews
will be held at their office locations, within the study area, or nearby cafes during the day. A
thematic content approach to analyze the transcriptions and field notes will be used to search for
broader themes that occurred throughout the various interviews.
Objective 3: Determine challenges presented by infrastructure that has high impact on the safety
and efficiency of student mobility.
Following the culmination of past tasks, a map will be created that displays high priority
areas within the safest routes for students to walk and bike to school. Determining safe routes will
be based off existing conditions such as catchment area, characteristics of streets and intersections,
traffic studies, and crash history of the area. From there, the high priority area(s) within the safest
routes will be determined. This will be based off where the highest need for improvement is due
to the most pressing infrastructure effects on students.
Objective 4: Provide recommendations to challenges of creating a Safe Routes to School plan.
Following the culmination of past tasks, a methodology will be created that displays how
to implement a successful Safe Routes to School plan at Woodland Academy and other schools
within Main South. Determining the methodology will be based off conclusions drawn from
collected data and the coordination, organization, and implementation efforts at Woodland. The
recommendations will also incorporate stakeholders within Worcester, MA and how to move
forward with communication and improvements if individuals leave positions at organizations.
These recommendations will also consider the social constraints placed on the neighborhood and

87
the SRTS process itself, and they will identify ways to collect, organize, determine, and submit for
further implementation. From there, defined steps on how to efficiently implement a SRTS plan
within the context of Main South will be presented.
Objective 5: Develop engineering-based designs for at least one high impact area in the
neighborhood.
Design
By using the information gathered from the previous tasks, incorporating ideas from other
case studies, and working with stakeholders, best practices will be designed that include
recommendations based on engineering. The proposed infrastructure improvements will focus on
a high impact area(s) that impacts the safety and efficiency of students walking or biking.
Recommendations will require further implementation and communication between stakeholders.
88
Appendix B: Arrival and Dismissal Observations Observations were conducted by the MQP team twice a week for 3 weeks from
approximately 7:30 AM to 8:15 AM and 1:45 PM and 2:30 PM.
Corner of Woodland and Claremont—Arrival
Existing Conditions (General)/Traffic Controls
There is an entrance to the Claremont Academy on Claremont Street and two entrances to
the building on Woodland Street. The entrance to Claremont Academy is at the top of a sloped
driveway while the entrances to Woodland are ground level (Figure 33). There are two crosswalks
in this intersection with one on Claremont and one on Woodland. Additionally, there is a crosswalk
placed across from the staircase of Claremont Academy. Both streets are not separated by a painted
centerline but allow for a travel lane in each direction.
Figure 33: Entrance to Claremont Academy
On Woodland street, there is a portion of the pavement that extends inward to allow for
school buses to pull over from through traffic (Figure 34). There is also a public space in front of
Woodland Academy where the flag is placed (Figure 35). During arrival and dismissal times,
Woodland Street becomes a one-way from Oberlin Street to Claremont Street with traffic only
being allowed to flow toward May Street. To prevent drivers from driving toward Oberlin Street
on Woodland, the school blocks off the street with a few cones and a stand -up white board with
the message “Do-not enter.” There is a ‘pedestrian crossing’ bollard in the crosswalk that
permanently stays there, but the rest of the arrival set up must be put in place and then broken
down everyday. There is a crossing guard at this intersection during these times.

89
Figure 34: Designated school bus drop-off and pick-up area on Woodland Street
Figure 35: Public space in front of Woodland Academy
Accessibility
There are no ADA pads connecting to the two crosswalks on Woodland and Claremont
Street. The sidewalks do not have steep slopes.
Sidewalks
There are sidewalks on both sides of Claremont Street approximately 6 feet wide and in
good condition. The street does not have many street trees and does not have grass strips that
separate the sidewalk from the roadway. There are few driveways (Figure 36).

90
Figure 36: Lack of buffer zone on Claremont Street
There are sidewalks on both sides of Woodland Street approximately 6 feet wide and in
good condition. The street does not have many street trees and does not have grass strips that
separate the sidewalk from the roadway. There are few driveways. However, the use of the
sidewalk on Woodland from May to Claremont is narrowed by cars that park on the right side of
the street. This could be a resident precaution to the large amount of traffic on Woodland during
school arrival and dismissal hours.
Signage
On Claremont between Woodland Street and Main Street there is signage for school zone
and children crossing. There is no posted speed limit sign on Claremont meaning the statutory
speed limit is 30 mph. However, municipal modernization law allows municipalities to designate
speed limits of 25 mph on roadways and 20 mph in safety zones. There are signs for ‘no-parking
on school days from 7 AM to 3PM’ signs on Claremont on the school building side of the street.
On Woodland between May Street and Oberlin Street there is signage for school zone,
children crossing, a deaf child, and no parking in front of the school. There is a posted speed limit
of 20mph but only during arrival and dismissal hours on school days. There are two crosswalks
and pedestrian crossing bollard in the crosswalk on Woodland.
Parking
Only one side of Claremont allows street parking. Parking on the school-side of Claremont
is not permitted during school hours. Woodland allows street parking on both sides from May to
Claremont during all hours. However, cars in this section park on the sidewalk on the right side of
the street and narrow the amount of room for students to walk. During school hours, parking on
the school-side of Woodland from Claremont Street to Oberlin Street is prohibited (Figure 37).
This allows for the street to be very wide during school hours, especially when there is no parked
cars on the opposite side of the school.

91
Figure 37: No parking permitted on school side of Woodland St
There is a large private parking lot located off Claremont Street that is owned by Clark
University and is designated as a commute permit parking area. It is generally empty during arrival
hours.
Vehicle speeds
Based on observation of the study area, travel speeds on Claremont Street generally appear
to be above 20 mph.
Because of the temporary one-lane on Woodland, speeds were generally observed to be
around 20mph or less during arrival. Traffic was also slow moving as a result of the traffic
congestion leading to the intersection of Woodland and May Street and the stop and go of drop
off. However, speeds were observed to be above 20mph soon after the arrival set up was broken
down and the street was clear of drivers dropping off.
Driver Behavior
It has been observed that parents stop at the corners of both Woodland and Claremont to
drop off students. On Claremont Street, drivers were also observed to stop on either side of the
road, and sometimes in the middle of the road, to let students out. Additionally, after dropping off
students, it was observed that drivers would not stop for pedestrians in the crosswalks in order to
leave the school zone quickly.
On Claremont Street, there is a driveway entrance that only allows only buses to enter to
drop of students at the door at the top of the sloped driveway. However, drivers often stop and let
students out at the driveway entrance. This is a popular spot because there is no other way for
students to get to the top of the sloped driveway to the main entrance of Claremont Academy
because the two sets of stairs on Claremont Street are closed off (Figure 38). This driveway
entrance is about 30 ft from the intersection of Woodland and Claremont and the crosswalk. When
drivers stop at this driveway, traffic traveling through the intersection can become backed up and
cause cars to idle in the crosswalks.

92
Figure 38: Crosswalk on Claremont Street with blocked off staircase
Vehicles traveling on Claremont Street were also observed to pull into the Clark University
parking lot to drop students off and use the lot as a turn around to avoid the Claremont and
Woodland intersection.
Generally, the driver behavior observed during arrival showed that most drivers were doing
what was most convenient for their route drop off.
Pedestrian Crossing
A large amount of pedestrian traffic was observed on Woodland Street. At the intersection
of Woodland and Claremont, pedestrian traffic from the north, northeast, east and south east
sections of the catchment area flow through. These students were generally observed to use the
sidewalks on Woodland Street and cross within crosswalks on Claremont or Woodland.
However, students that are dropped off have been observed to have different behavior.
Drop off encourages students to not use crosswalks, and students are not looking and crossing in
front of cars to get to the school side of the street, which causes them to be temporarily blocked
from the view of drivers behind the stopped car.
There was little pedestrian traffic observed on Claremont Street as a result of students from
other areas of the catchment areas using other entrances of the building.
Bike Facilities
There were no biking students observed using these entrances. There are no bike lanes on
either Claremont or Woodland. However, there is a bike rack for students if needed.
Woodland Street and Oberlin Street (Back door of Oberlin)—Arrival
Existing Conditions (General)/Traffic Controls

93
There is a second entrance to Woodland Academy that connects to Oberlin Street. There is
a driveway entrance on Woodland Street that leads to the door and connects through an alleyway
behind the school building. The alley connects Woodland Street to Claremont Square, but this
passageway does not allow vehicle use (Figure 39). This area is also where the school advertises
upcoming events.
Figure 39: Back alleyway with sign about parent/teacher meeting that morning/evening
The paved play area for students is located on this corner and is surrounded by trees and fence.
Additionally, there is an area of asphalt located next to the staff parking lot on Woodland that does
not serve as a full driveway and is used as a retaining wall (Figure 40).
There are three crosswalks at the intersection with two on Woodland and only one on
Oberlin. Cars from Oberlin are permitted to turn onto Woodland Street while it is a one way.
School buses have a designated drop-off area on Woodland Street at the main entrance. After
arrival, cones are placed in the street parking space on Oberlin within the ‘no-parking from 7 AM
to 3 PM on school days’ section.

94
Figure 40: Asphalt patch and retaining wall next to staff parking lot on Woodland Street
Accessibility
There are no ADA pads connecting to the two crosswalks on Woodland and Claremont
Street. The sidewalks do not have steep slopes.
Signage
At the intersection of Oberlin and Woodland, there are no stop signs on Woodland Street
while there are two stop signs on Oberlin.
Sidewalks
There are sidewalks on both sides of Oberlin Street approximately 6 feet wide. The
sidewalks are in fair condition and have some sections with root, bumps, and cracks. The street
has street trees and does have grass strips that separate the sidewalk from the roadway. There are
many driveways.
Parking
Parking is allowed on both sides of Oberlin Street. This narrows the street and vehicles
were observed to have to pull over to allow the other direction of traffic to pass. There is a staff
parking lot on Woodland that has cones set to allow cars to enter from Oberlin but direct exiting
traffic flow down Woodland toward Claremont Street.
Motor vehicle speeds
There is no posted speed limit sign on Oberlin Street meaning the statutory speed limit is
30 mph. Based on observation of the study area, travel speeds on Oberlin Street generally appear
to be below or at 20mph due parking narrowing the road.
Driver Behavior/ Pedestrian Crossing
On Woodland Street, drivers often pull over and drop students at the driveway entrance to
the alleyway behind the school. This is a popular spot because of the proximity to the second
entrance and there are no other curb cuts on this section of Woodland from Oberlin to Claremont.
This driveway is about 40 ft from the intersection of Woodland Street and Oberlin Street. When
drivers stop at this driveway, the cars frequently form a line behind drop-offs causing traffic at the
intersection and can prevent school buses from getting to the drop off area. This can also result in
cars stopping in the both crosswalks at the corner.
Drivers were observed to pause in the crosswalk to obey the stop sign and to sometimes
not allow students to have the right of way. Drivers were observed to pull over to both sides of the
road on Woodlands Street and block the driveway entrance to the staff parking lot to drop off
students. Drivers were also seen taking their eyes off the road to watch students enter the building
while driving; distracted drivers can become a danger to other vehicles and pedestrians. Drivers
have also been observed to cause traffic when they park within the school-bus drop off area
because the bus is prevented from pulling over.

95
On Oberlin Street, drivers were observed to stop on either side of the road, and sometimes
in the middle of the road, to let students out, which causes them to be temporarily blocked from
the view of drivers behind the stopped car. This encourages students to not use crosswalks and not
look before crossing in front of other cars. Additionally, after dropping off students, it was
observed that drivers would not stop for pedestrians in the crosswalks in order to leave the school
zone quickly.
Pedestrian Crossing
A large amount of pedestrian traffic was observed on Oberlin Street. At the intersection of
Woodland and Oberlin, pedestrian traffic utilized all legs of the crosswalks. Pedestrian traffic from
the north west, west, south west, and south areas of the catchment area were observed. Students
were observed to not always use the crosswalk on both Oberlin and Woodland. Students exit the
cars while they are parked in the middle of the road and cross in front of the cars dropping off
students next to the curb. Students were also observed to use the back alley behind the school
building after being dropped off on Claremont Square as a cut through to the entrance on
Woodland.
Bike Facilities
There were no biking students observed using this entrance. There are no bike lanes on
Oberlin. However, there is a bike rack for students if needed.
Claremont Street, Silver Street, and Claremont Square—Arrival
Existing Conditions (General)/Traffic Controls
At this intersection, there are two crosswalks, one located on Claremont Street and one on
Claremont Square. There are no stop signs on Claremont Street at the intersection between Silver
Street and Claremont Square. There is a crosswalk on Claremont located about 50 feet from this
intersection for students to cross to the school side of the street. There is a community garden on
Claremont Square on a grass section at the top of a retaining wall about 6 feet up from the sidewalk
(Figure 41). The entrance to the underground staff parking garage is off Claremont Street. The
dumpsters are located at the entrance to the alleyway from the Claremont Square side, and large
pieces of furniture were observed to be dumped there. There are no crossing guards at this location.

96
Figure 41: Community garden on corner of Claremont Street and Claremont Square
Accessibility
There are ADA pads connected to the crosswalk on Claremont Square, but none within the
crosswalk on Claremont Street. The sidewalks do not have steep slopes on both Claremont Square
and Claremont Street, but the poor condition of the sidewalks on Silver Street do raise concern.
Signage
There is no posted speed limit sign on Claremont Square or Silver Street meaning the
statutory speed limit is 30 mph.
Sidewalks
Sidewalks on Silver Street are in very poor condition, but the street trees and on-street
parking provide a buffer from the roadway.
Parking
On-street parking is allowed on both sides of Claremont Square and Silver Street during
school hours.
Motor Vehicle Speeds
Motor vehicle speeds on Claremont Street were generally observed to be at or above 20mph
but were generally slower with drop offs during arrival times. High speeds on Silver Street were
observed when turning off of May Street.
Driver Behavior
Drivers were observed to pull over and drop off students on Claremont Square in order for
students to use the alley way to get to the front of the school. This street was generally not very
busy during arrival time and most on-street parking appeared residential.

97
At the intersection, drivers were observed to slow down on Claremont Street before going
through the intersection, but no stopping is lawfully required. Generally, drivers on Claremont
Square
Pedestrian Crossing
There is a large amount of pedestrian traffic from Silver Street that then walks up
Claremont Street or uses the back alleyway off of Claremont Square to get to the front of the
school. Pedestrians were generally seen to use the crosswalks at this intersection.
Oberlin Street and Claremont Square
Existing Conditions
Two crosswalks are present at this intersection (Figure 42). The crosswalk on Oberlin does
not have curb cuts or ADA pads.
Figure 42: Lack of curb cuts on corner of Oberlin and Claremont Sq
Woodland Street
Existing Conditions
On Woodland Street, a sign signals the end of the school zone ends at the intersection of
Norwood (Figure 43). Woodland Street allows parking on both sides of the road until it reaches
Clark University (Figure 44).

98
Figure 43: Beginning/end of school zone at intersection of Woodland Street and Norwood Street
Figure 44: Curved road adjacent to Clark University

99
Appendix C: Interviews with Stakeholders Walk through with Dan Daniska (CMRPC) and Karen Valentine Goins (WalkBike
Worcester), 9/10/18
Summary
In the beginning of the project, it was known that a small group of people were involved
with the Safe Routes to School movement in Main South. This group worked to collect data about
the neighborhood and the catchment area for Woodland Academy and Claremont Academy. The
people involved in this group represented a wide variety of local stakeholders:
• Karen Valentine Goins of WalkBike Worcester (WBW)
• Dan Daniska of Central Massachusetts Regional Planning Commission (CMRPC)
• Casey Starr of Main South Community Development Center
• Sara Belisea of Woodland Academy
• Patricia Padilla of Woodland Academy
Due to past efforts, a logical starting point was to gather insight from the group. As a result of this,
a walkthrough of the catchment area for the school was conducted with Dan Daniska and Karen
Valentine Goins.
During this walkthrough, I was able to see the existing infrastructure for the first time.
Karen and Dan informed me of a variety of problem areas. Notable places of danger for students
are crossings on Main Street and May Street. Main Street is wide and has two lanes of travel. There
is also a lack of street trees and landscaped separation of the roadway from the sidewalk.
Additionally, the signalized intersection of Hammond, May, and Main is a problem area and is
difficult for pedestrians (including students) to cross, and no crossing guard is present during
arrival and dismissal times. With wide crossings, a long signal waiting time, and a variety of driver
turning movements, this intersection tends to be a place that drivers tend to try to avoid. This can
result in the drivers cutting through the Woodland Academy school zone to get to a variety of
destinations in this area.
Other intersections in the neighborhood with high traffic volumes pose similar threats to
pedestrian safety including the intersection of Main, Claremont, and Oberlin and the intersection
of May and Woodland. However, these intersections do have crossing guards during arrival and
dismissal times. Additionally, the intersection of Silver, May, and Kingsbury was discussed. It is
not a signalized intersection and there are no crosswalks, but large numbers of walking students
cross at this point because it is the most direct way to the school building from Kingsbury. This a
threat because of the high speeds on May. Other notable things about the neighborhood were
identified on the walkthrough including the bike route off of Tainter Street, the Boys and Girls
Club, Canterbury School, and the Crystal Street Overpass.

100
Meeting with Sarah Belisea and Patricia Padilla (Woodland Academy), 9/12/18
Summary
This meeting was with the second half of the Safe Routes to School group and was
scheduled following the walkthrough. However, this was still before previously collected data was
obtained and analyzed. While the walkthrough visually introduced the challenges presented by
existing physical infrastructure of the entire neighborhood, this meeting identified interesting facts
about the neighborhood. The rapid flashing beacons at the intersection of Main and Oberlin were
recently installed. The school separated arrival (7:30AM to about 8:15AM) and dismissal ( 1:45
PM to about 2:30 PM) time between schools from with a 15-minute delay between Claremont
Academy and Woodland Academy. Concerns about the school zone being used as a cut through
were discussed as a threat to student safety. Also, it became clear that the school is pursing multiple
efforts internally to increase the safety of students including Walk to School Days and police safety
trainings for fourth grade students.
This meeting also focused on the logistics of the past efforts and the coordination between
stakeholders. This meeting identified who the school believed was involved with the past effort:
WBW, CMRPC, the MassDOT Safe Routes to School Coordinator, and the City of Worcester
Engineering, Health, and Police Departments. The school also talked about the proximity of the
Clark University campus and the vested interest of the University in the safety of all students
walking in the neighborhood. It was again mentioned that there was a large amount of data
collected and potential reports. However, it was unclear who had the reports and where the data
collected was. This meeting also mentioned that there was even a proposed demonstration project
for the school zone, but the school was unsure why it did not come to fruition.
Meeting with Nicole Edmonds (MassDOT Safe Routes to School Coordinator for Central
MA), 10/3/18
Summary
This meeting was scheduled to understand the role of MassDOT in the Safe Routes to
School program in Worcester. This meeting primarily focused on the logistics of the SRTS
program and how the coordinator works with school officials to organize momentum. For a school
to be eligible to apply for funding, a SRTS education and encouragement program must be
established in the school for at least one year. Following this, a school can apply for assistance,
but the funding is not guaranteed. The coordinator works to encourage schools to act internally.
The PowerPoint used to educate teachers about SRTS to school was shown. The coordinator also
instructs teachers on the data that needs to be collected (requirements from the National Center for
Safe Routes to School) but does not participate in the data collection process. Success of SRTS in
other parts of Central Massachusetts were discussed. This included introducing the program into
schools and a couple of infrastructure improvements such as raised crosswalks.

101
Meeting with Jack Foley (Vice President of Government and Community Affairs, Clark
University), 10/23/18
Summary
This meeting was set to determine if Clark University would be interested in supporting a
future traffic-calming initiative in the neighborhood. An entrance to the Clark University campus
is on Woodland Street, and Clark also shares concerns about driver behavior and fast speeds
impacting student safety. The curve on Woodland Street near campus has a “Watch For Pedestrians
Crossing” sign that is placed in the crosswalk to narrow the road and force drivers to slow down
to avoid hitting it. Additionally, Clark has a new building that is across Main Street from the main
campus and requires students to use a crosswalk that has rapid flashing beacons. Because of this,
Clark now has a vested interest in improving pedestrian safety when crossing Main Street. Again,
this meeting touched upon the idea that the neighborhood is used as a cut through by drivers
familiar with the area to avoid Main Street intersections. As a way to prevent cut-throughs on
campus, Downing Street was closed by the University to lessen the amount of traffic traveling
through campus to increase safety. Additionally, it was suggested reach out to Woodland Academy
to ensure they wanted to move forward with an initiative like this.
Phone call with James Kempton (City of Worcester DPW Engineering Department),
10/25/18
Summary
This phone call was set up to gage the interest of the City of Worcester DPW Engineering
Department in allowing a temporary traffic calming demonstration at Woodland Academy. This
discussion focused on driver behavior. When drivers get frustrated, they take more risks to get out
of situations more quickly. This threatens pedestrian and another driver’s safety. This raised the
question of how we combat driver behavior and still prioritize safety; this is where the potential of
the benefits of a traffic calming project come in.
This phone call also asked about the permits of procedures required to temporarily change
the design of the roadway. It was explained that there were not any required permits to do this.
Additionally, DPW was involved in their own make shift redesign of the roadway with cones,
signs, and a pick-up truck before permanently installing the traffic circle at the intersection of
Lovell, Maywood, Englewood, and Ferdinand. However, the DPW was hesitant about non-
uniform traffic calming techniques because of the risks associated with introducing interventions
that drivers are unfamiliar with. After clarifying that the project would be a uniform technique
with temporary materials, DPW was accepting of the demonstration. DPW will be providing
resources.

102
Community Planning Meeting (Woodland Academy), 11/8/18
Summary
This meeting consisted of Sarah Belisea of Woodland Academy and two parents who
volunteer as crossing guards at the intersections of Woodland and Claremont and Main and Oberlin
every day. Concerns about driver behavior on the streets that closely surround the school building
were discussed, and the concerns closely matched the site observations during arrival and dismissal
times. However, a new concern was brought to the table about children cutting through backyards
on Woodland Street to get to school; this causes them to cross the street without a crosswalk.
Questions about arrival and dismissal procedures were also asked. Timing was clarified
during arrival for Woodland Academy. The back door near Oberlin is the main entrance during
arrival and is opened at 7:30 AM and closed at 8:00AM. The main entrance door down the street
is then opened at 8:00AM, and this forces late students to use this entrance to be marked tardy by
waiting teachers in the doorway. Additionally, the alley is not used during arrival time because of
service trucks and food deliveries. It was clarified that the students will only be allowed to use
entrances to the designated schools. It was also clarified that only school buses could use the top
entrance at Claremont Academy. However, it is used during dismissal time. However, a question
that remained unanswered was the reason the staircase at the entrance of Claremont was closed
off.
After the discussion of driver behavior and procedures winded down, the meeting turned
to the topic of the demonstration project. It was clarified that a pop-up will be implemented on top
of the existing arrival and dismissal set up. Traffic calming techniques were introduced in pictures
with expensive fixes beside the low-cost version. The idea for the choker on Woodland Academy
was presented. Concerns about on-street parking were brought up and will need to be addressed
through outreach. However, the idea was well received, and this traffic calming measure will most
likely be implemented in the following weeks. Topics discussed also included how to integrate
future creativity into the project through murals on the road. Additionally, the idea of providing
information about what the demonstration is aiming to accomplish is possible if information is
offered in other languages.

103
Appendix D: Survey/ Circulation Flyer Template
Figure 45: Survey template (English)
104
Figure 46: Survey template (Spanish)