Embed Size (px)
Citation preview
Journal of Statistics Education, Volume 18, Number 3 (2010)
1
Improving Self-efficacy in Statistics: Role of Self-explanation &
Feedback
Simin Hall
Eric A. Vance
Virginia Tech
Journal of Statistics Education Volume 18, Number 3 (2010),
www.amstat.org/publications/jse/v18n3/hall.pdf
Copyright © 2010 by Simin Hall and Eric Vance all rights reserved. This text may be freely
shared among individuals, but it may not be republished in any medium without express written
consent from the authors and advance notification of the editor.
Key Words: Statistics problem solving; Self-efficacy; Self-explanation; On-line technology;
Feedback; Pattern recognition.
Abstract
Novice problem solvers often fail to recognize structural similarities between problems they
know and a new problem because they are more concerned with the surface features rather than
the structural features of the problem. The surface features are the story line of the problem
whereas the structural features involve the relationships between objects in the problem. We used
an online technology to investigate whether students' self-explanations and reception of feedback
influenced recognition of similarities between surface features and structural features of
statistical problems. On average students in our experimental group gave 12 comments in the
form of self-explanation and peer feedback. Students in this Feedback group showed statistically
significantly higher problem scores over the No-Feedback group; however, the mean self-
efficacy scores were lower for both groups after the problem solving experiment. The
incongruence in problem scores with self-efficacy scores was attributed to students’ over-rating
of their abilities prior to actually performing the tasks. This process of calibration was identified
as an explanation for the statistically significant positive correlation between problem solving
scores and post self efficacy scores for the Feedback group (p<.01).
1. Introduction
Problem solving skills, according to Bessant (1992) and Stangl (2000), should be at the core of a
statistics curriculum. Bessant (1992) points out that most students are taught many statistical
procedures, but given a set of data, they usually face difficulties deciding which procedures to
Journal of Statistics Education, Volume 18, Number 3 (2010)
2
use. For example, in introductory statistics courses students may be presented with a variety of
word problems that require using procedures such as t-test, chi-squared test, or correlation.
Although students may know how to use these kinds of statistical procedures, a major challenge
is to learn when to use them given a new problem or a new data set.
Insufficient practice with a variety of problems (Jonassen, Rebello, Wexler, Hrepic, and Triplett,
2007) and low self-efficacy in statistics (Onwuegbuzie & Wilson, 2003) are two of the potential
blocks students face when attempting to solve statistics problems. Statistics instructors
commonly introduce new concepts by presenting definitions, associated concepts, theory, and
derivations of the corresponding mathematical representations. Then they demonstrate how to
solve a problem and often explicitly instruct students to perform certain procedures when solving
word problems or implicitly cue them to carry out specific operations in the context of the lesson
of the week (Lovett and Greenhouse, 2000). Students attempting to use this single-example
approach are likely to ignore differences in the semantic and structural characteristics of the new
problem. Novice problem solvers often fail to recognize structural similarities between problems
they know and a new problem because they are more concerned with the surface features (story
line) of the problem than with the structural features of the problem, which involve the
relationships between the objects in the problem (Mayer 1992).
According to social cognitive theory (Bandura, 1986/1997; Pintrich & Schunk, 2002; Schunk &
Pajares, 2005), students learn by observing others perform the same or similar tasks. This
learning is affected by the reciprocal interactions between (a) personal factors in the form of
cognitions and self-efficacy (perceived capabilities), (b) behaviors in the form of cognitive
strategies such as providing feedback and self-explanations, and (c) environmental influences
such as peer feedback, teacher feedback, and modeling. As students work on tasks and measure
their successful progress toward learning goals, their self-efficacy for continued learning is
enhanced and their motivation is influenced positively.
Self-efficacy beliefs are thoughts or ideas people hold about their abilities to perform those tasks
necessary to achieve a desired outcome. These beliefs can influence people’s behavior either
positively or negatively based on their perception of their abilities concerning a particular task.
Research has shown that epistemic beliefs affect how students approach learning tasks
(Schoenfeld, 1983), monitor comprehension (Schommer, Crouse, and Rhodes, 1992), and create
and carry out a plan for solving problems (Schommer, 1990). These researchers have provided
empirical data on causal relationships and associations between self-efficacy and performance in
subjects such as mathematics (Schommer et al., 1992; Pajares & Miller, 1994). Pajares and
Miller (1994) used path analysis to show the predictive and mediational role of self-efficacy in
the area of mathematics. Schommer (1990) and Schommer et al. (1992) replicated the factor
structure that belief in simple knowledge is negatively associated with comprehension and these
beliefs predicted test performance. Cleary (2006) showed that the strategies students use in
solving problems could be predicted based on their levels of self-efficacy. Students with higher
self-efficacy used more effective learning strategies.
Bandura (1986) introduced vicarious experiences, or modeling, as one of the sources for
developing self-efficacy beliefs by which individuals who are unsure of their abilities in a certain
area have the opportunity to observe others similar to themselves perform the task. Pintrich and
Journal of Statistics Education, Volume 18, Number 3 (2010)
3
Schunk’s (2002) research indicated that students are capable of learning complex skills through
observing modeled performances.
Recker and Pirolli (1995) modeled individual differences in students’ learning strategies and
found that self-explanation significantly affected students’ initial understanding and their
subsequent problem solving performance. Chi (1996) studied the effect of self-explanations in
tutoring. Her study showed that tutor actions that prompt for collaborative construction of
knowledge between tutor and tutee, such as prompting for self-explanation, may be the most
beneficial in providing deep learning. Actions such as providing feedback could trigger learning
partially due to removing students’ misconceptions of the problems.
The online environment has been shown to provide a more productive setting for students to post
written responses because it allows them to reflect more deeply on the materials and also
increases the likelihood of participation for shy students or students who may feel uncomfortable
talking with peers in a traditional classroom (Everson & Garfield, 2008). In our experiment, an
online technology provided an authentic setting for students to collaborate and share knowledge
in the form of self-explanation and peer feedback, which served as a modeling tool. The work of
a student with a higher skill level served as a model or standard for less skilled students without
creating undue pressure due to social comparison.
Guided by social cognitive theory, our study investigates the role of self-explanation and peer
feedback on improving students’ self-efficacy in the conceptual understanding of statistics
problems. We focused specifically on three research questions: (a) Do self-explanations and peer
feedback influence students’ self-efficacy beliefs about solving statistics problems? (b) Do self-
explanation and peer feedback impact students’ pattern recognition in problem solving in terms
of categorizing problems based on their structural and surface features? (c) Do feedback (self-
explanation and peer feedback) and problem solving together impact self-efficacy?
2. Method
2.1 Variables
Students self-reported their demographic data consisting of age, gender, major, classification in
college (freshman, sophomore, etc), and the number of math or statistics courses previously
taken in college. To assess the social cognitive variables of self-efficacy in statistics problem
solving, we measured the self-efficacy of both groups before and after the problem solving
sessions. The No-Feedback group had only one set of problem scores; the Feedback group had
pre and post problem scores. We chose to collect these data based on previous research on the
impact of self and peer feedback in improving students’ learning in the web-based environment
(Frederickson, Reed, and Clifford, 2005; Lin, Liu, & Yuan, 2001; Liu, Lin, Chiu, & Yuan, 2001;
Schunk & Pajares, 2002; Wang & Lin, 2007; Wigfield, Eccles, and Pintrich, 1996). We also
collected data on the number of comments, the change in problem scores, and the types of the
self-explanation provided by the students in the Feedback group.
Journal of Statistics Education, Volume 18, Number 3 (2010)
4
2.2 Participants and Setting
Bandura (1986) suggested that efficacy and performance be assessed together within as close a
time period as possible and that efficacy assessment precede performance assessment. Therefore,
in our experiment, we administered all four instruments within one class period of 50 minutes.
This assessment process ensured that absences would not create a situation whereby some
students completed one instrument but not another. Pilot testing demonstrated that one class
period provided ample time in which to complete all assessment measures.
The participants in this study were one hundred thirty-eight (138) undergraduate students out of
142 students in two sections of a large business computing course at a university in the southeast
United States. These participants represented three categories of majors: Business, Health
Sciences, and Others. We informed the students that their participation in the experiment was
voluntary and would result in the researcher evaluating how effectively students used feedback
sources in the web environment to exchange their ideas and collectively solve problems. No
remuneration for participation in the study was provided, but both instructors provided course
credit for participation. Only four students declined to participate.
Participants were randomly assigned to either the Feedback or the No-Feedback group. As
students arrived, they received a computer-generated random number, which assigned them to a
computer in either the feedback or the no-feedback lab.
2.3 Experiment
The instruments were group administered in individual labs. Both groups completed the
demographic and self-efficacy questionnaire first. Students in the No-Feedback group proceeded
to solve three problems comprised of five sub-questions each. Students in the Feedback group
were assigned randomly to groups of three to solve the same problems in a discussion forum
environment using an interactive online system. Both groups completed the posttest efficacy
measures in the last part of the survey. Table 1 shows the design of the study.
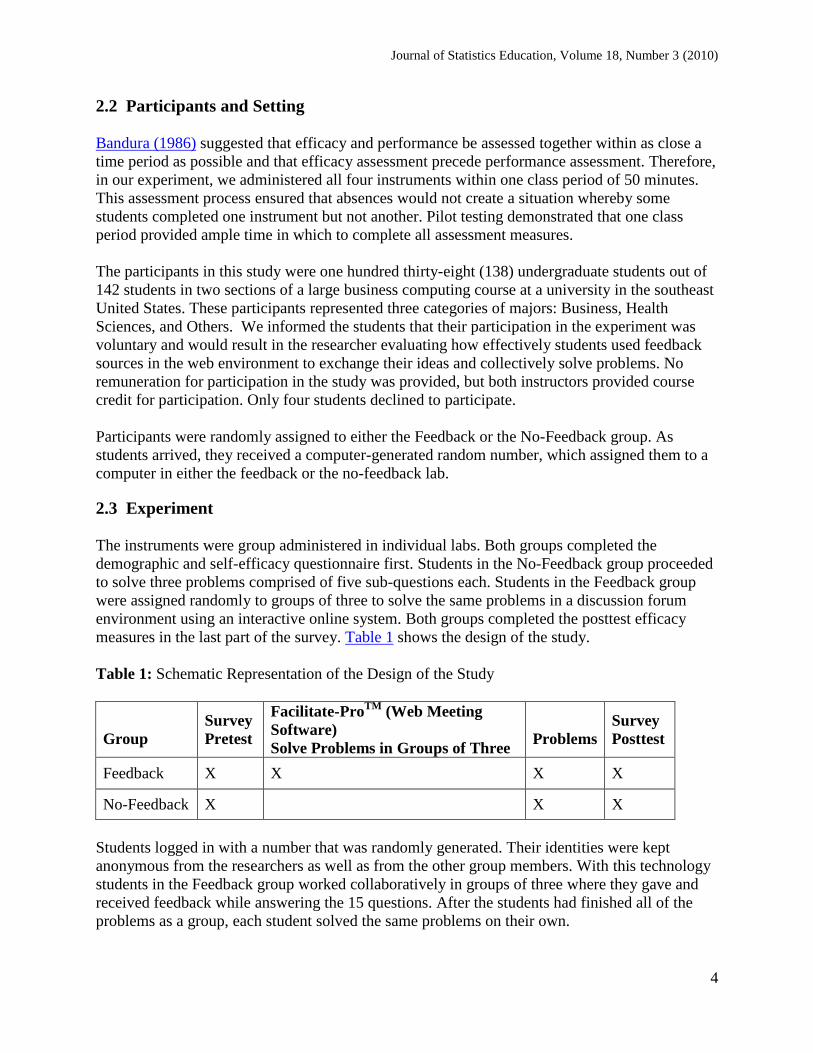
Table 1: Schematic Representation of the Design of the Study
Group
Survey
Pretest
Facilitate-ProTM
(Web Meeting
Software)
Solve Problems in Groups of Three
Problems
Survey
Posttest
Feedback X X X X
No-Feedback X X X
Students logged in with a number that was randomly generated. Their identities were kept
anonymous from the researchers as well as from the other group members. With this technology
students in the Feedback group worked collaboratively in groups of three where they gave and
received feedback while answering the 15 questions. After the students had finished all of the
problems as a group, each student solved the same problems on their own.
Journal of Statistics Education, Volume 18, Number 3 (2010)
5
We used word problems that in the domain of introductory statistics are categorized into t-test,
chi-squared test, and correlation problems (Quilici & Mayer, 1996). We did not use these terms,
nor were students asked to conduct these tests. For each of the three word problems students
answered five sub-questions: two questions tested students’ surface understanding (story line)
and three tested their understanding of the structure of the problems.
Students in the Feedback group chose one of the multiple choice answers and then provided a
self-explanation, or rationale, for their choice. After each team member provided their responses,
students could change their answers and/or provide additional feedback to the team members.
Students demonstrated a surface understanding of the problem if they could recognize the
dependent and independent variables using the story line. Students who recognized whether the
independent variable in the problem involved one or two groups and whether the dependent
variable was quantitative or categorical were deemed to have understood the structural features
of the problem. For example, for the question in Table 7, students who chose ―average words
typed per minute‖ as the response variable had correctly identified a surface feature of the
problem. Students who identified that ―average words typed per minute‖ was a quantitative
variable had demonstrated structural understanding of the problem.
2.4 Research Questions
In order to test the self-efficacy theory and understand the relationship between self-efficacy
beliefs, providing self-explanation, feedback and problem solving, we focused specifically on
three research questions: (a) Do self-explanations and peer feedback influence students’ self-
efficacy beliefs about solving statistics problems? (b) Do self-explanation and peer feedback
impact students’ pattern recognition in problem solving in terms of categorizing problems based
on their structural and surface features? (c) Do feedback (self-explanation and peer feedback)
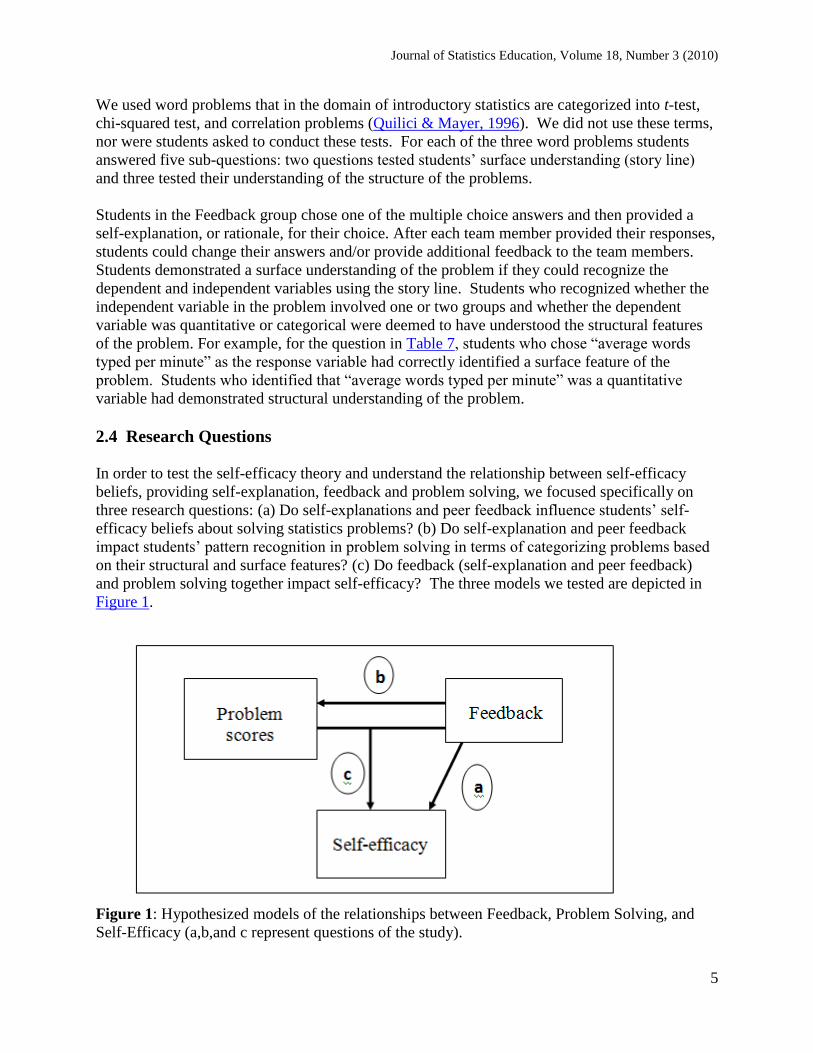
and problem solving together impact self-efficacy? The three models we tested are depicted in
Figure 1.
Figure 1: Hypothesized models of the relationships between Feedback, Problem Solving, and
Self-Efficacy (a,b,and c represent questions of the study).
Journal of Statistics Education, Volume 18, Number 3 (2010)
6
The experiment determined the influence of self-explanations and peer feedback on self-efficacy
beliefs about solving statistics problems. In addition, it determined whether and how self-
explanations and peer feedback influenced recognition of similarities between surface features
and structural features of the problems we used in our study. The third question determined why
and how both types of feedback and problem solving together influenced self-efficacy.
To answer the first question, we compared the differences in the self-efficacy scores for
Feedback and No-Feedback groups controlling for the students’ demographic variables. For the
second question, we compared the mean of post problem scores for the Feedback group with the
mean of problem scores for the No-Feedback group, again controlling for students’ demographic
variables. In addition, we analyzed with content analysis the Feedback group’s rationale for the
number and the kinds of self-explanation they provided, and we performed a correlation analysis
between post problem scores and post-efficacy scores for both groups. For the third question, the
differences in the students’ self-efficacy scores were modeled as a linear function of the two
explanatory variables—problem scores and group—as well as the students’ demographic
variables.
2.5 Instruments
Instrument 1 (Demographic Variables): Students were asked about their major, gender, age,
and number of math or statistics courses previously taken in college. There were 40 women and
29 men in Feedback group with the mean age of 21.07 (SD = 5.98) years and mean number of
previous math courses or statistics taken of 2.99 (SD =1.85). There were 31 women and 38 men
in No-Feedback group with the mean age of 20.55 (SD = 3.61) years and mean number of
previous math courses or statistics taken of 3.07 (SD = 1.67). The age range was 17 to 57 for the
Feedback group and 18 to 36 for No-Feedback group (Tables 2 & 3).
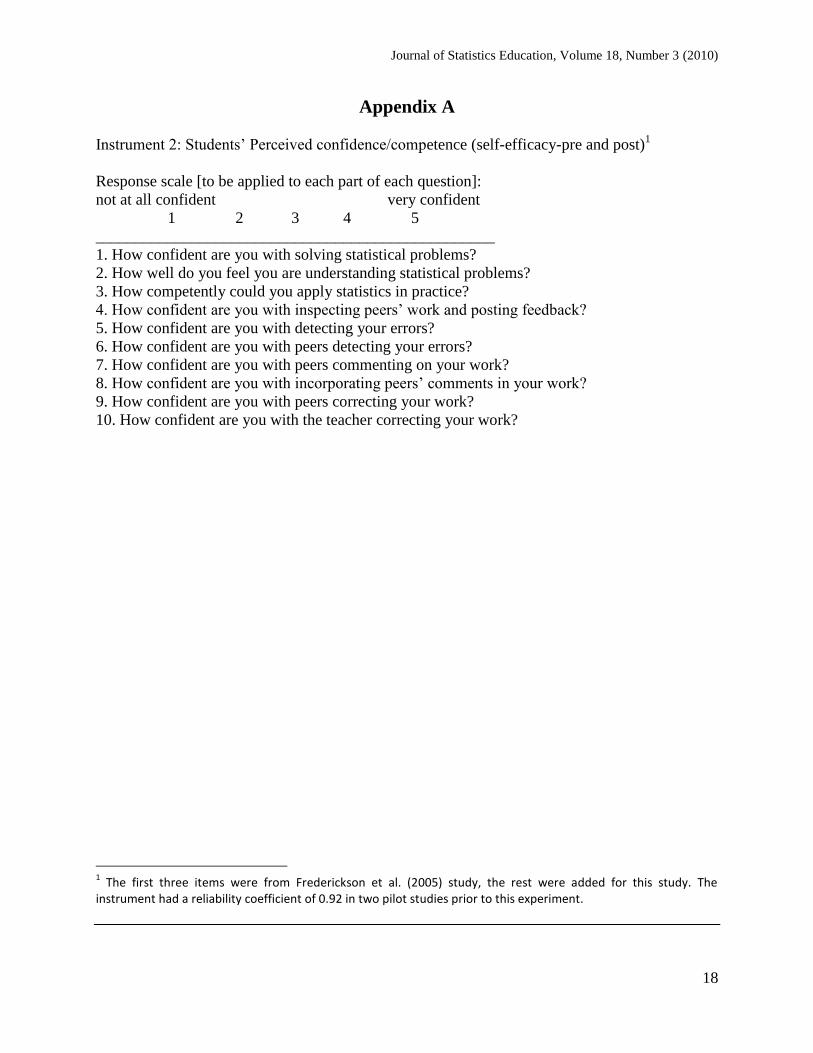
Instrument 2 (Self-efficacy): The first three items of the students’ self-competence/confidence
pretest and posttest in statistical problem solving, and in giving and receiving feedback, were
from the Frederickson et al. (2005) study. The rest were added for this study. ―How confident
are you with solving statistical problems?‖ is a sample item to test respondents’ efficacy in
solving statistical problems. ―How confident are you with peers detecting your errors?‖ is a
sample item for efficacy about receiving and giving feedback. Item responses to this 10 item
instrument (see Appendix A) were obtained on a 5-point Likert scale ranging from 1 (not at all
confident) to 5 (very much confident). The instrument had a reliability coefficient of 0.92 in two
pilot studies prior to this experiment. The reliability coefficient for the self-efficacy instrument
increased from pre- to posttest for both groups: 0.80 to 0.88 for the Feedback group and 0.76 to
0.87 for the No-Feedback group. Reliability is a measure of internal consistency between test
items. One common measure of test reliability is coefficient alpha by Cronbach (1951). The
closer the Cronbach alpha is to one, the less error between true and observed scores.
Self-efficacy scores were the sum of the students’ scores on 10 items shown in Appendix A. The
dependent variable representing self-efficacy in section 3.1 is the difference between students’
pre and post self-efficacy scores. The descriptive statistics for the dependent variable self-
efficacy is included in Tables 2 & 3.
Journal of Statistics Education, Volume 18, Number 3 (2010)
7
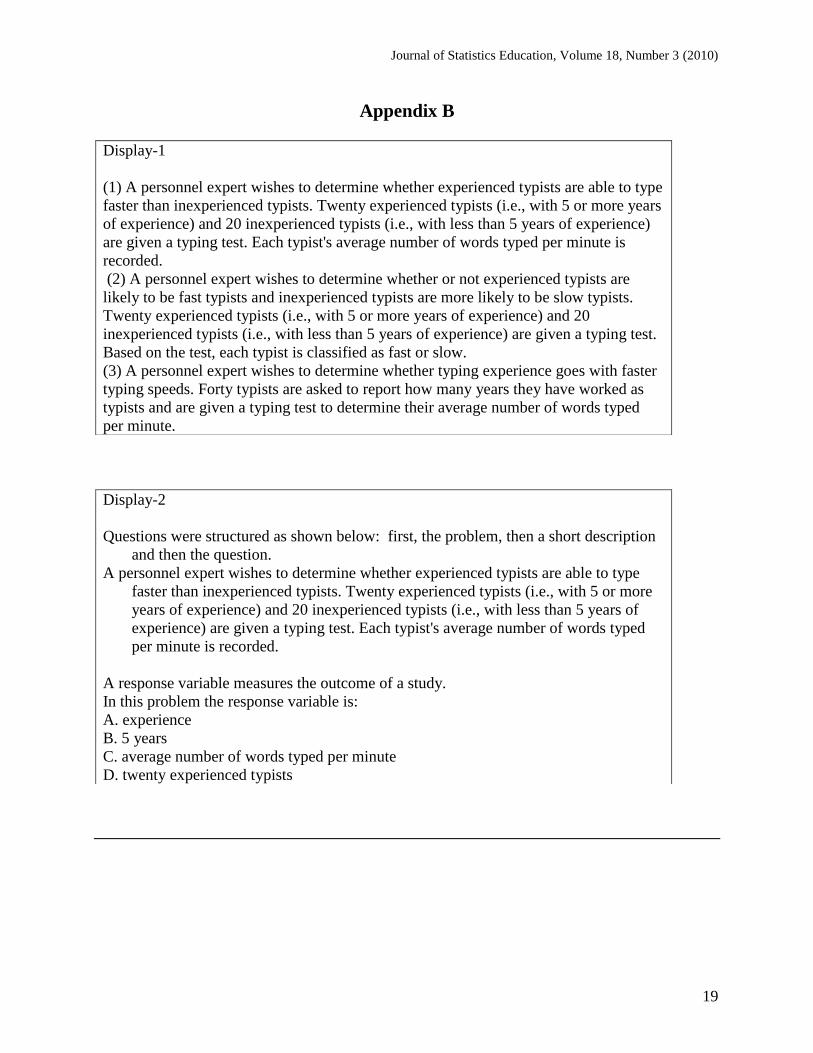
Instrument 3 (Statistical Problem solving): Students solved the three statistical problems shown
in Display-1 (see Appendix B). For each problem they answered five sub-questions. These three
problems shared a common set of surface features, or story line, in that each involved the
experience of typists as the independent variable and typing speed as the dependent variable
(Quilici & Mayer, 1996). The differences between the problems were in their structural features.
These problems exemplify the surface and structural similarities common in examples in
introductory statistics. Each correct answer received score of one, and incorrect answers received
a zero—no partial credit was given. We used the sum of students’ scores on 15 questions as the
dependent variable problem scores in section 3.2. The maximum total problem score was 15.
2.6 Data Analysis
Statistical methods used were: summary statistics, one-way analysis of covariance (ANCOVA),
correlational analysis, chi-squared test of independence, and content analysis. There were no
missing data or extreme outliers. The assumptions of normality and equal variance for ANCOVA
were met. The summary statistics for each group are presented in Tables 2 (Feedback) and 3
(No-Feedback), respectively.
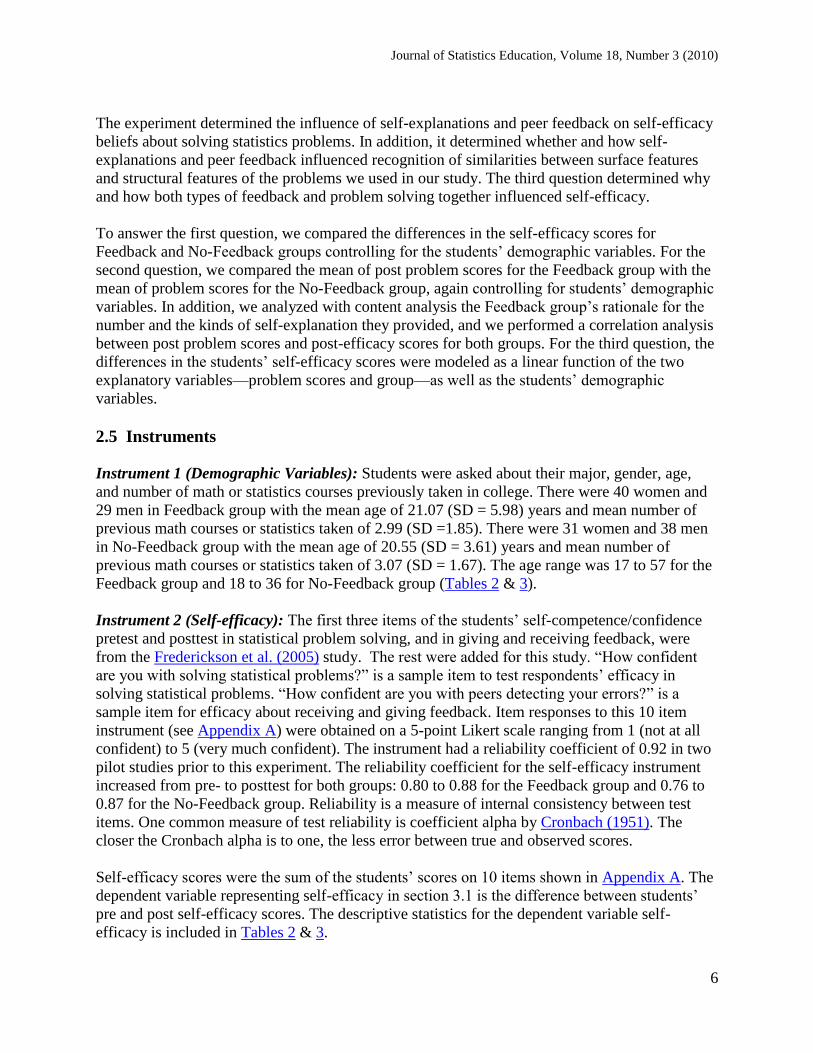
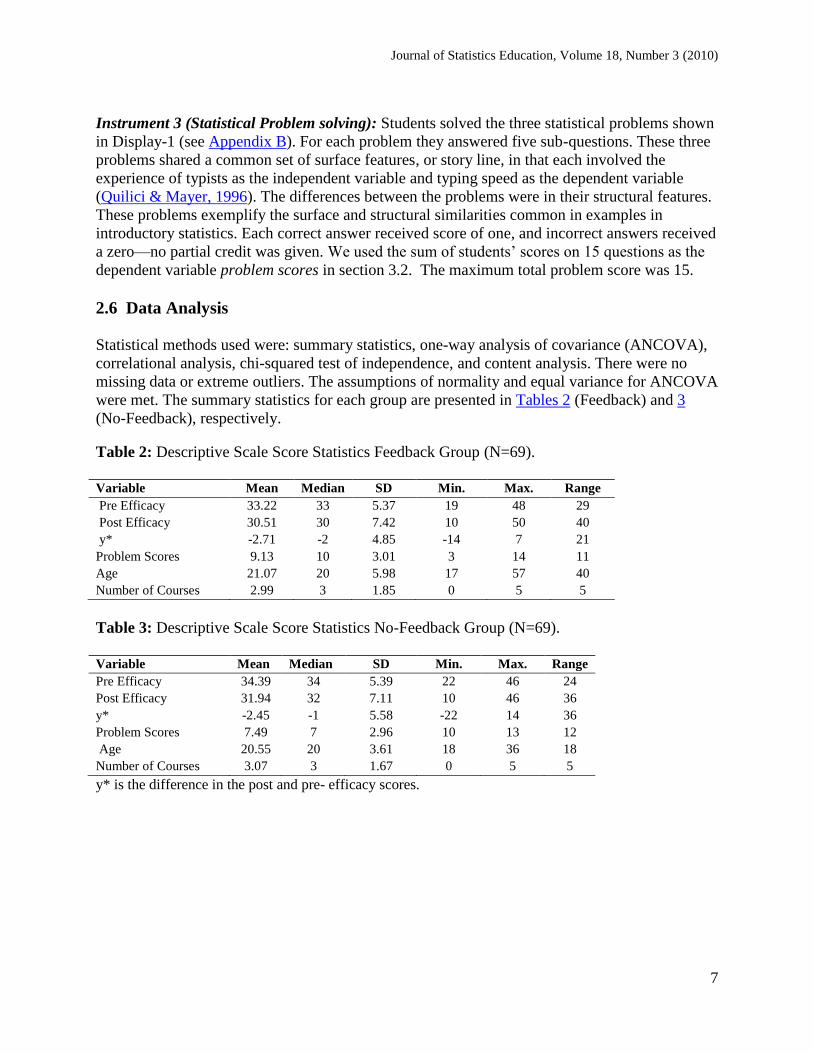
Table 2: Descriptive Scale Score Statistics Feedback Group (N=69).
Variable Mean Median SD Min. Max. Range
Pre Efficacy 33.22 33 5.37 19 48 29
Post Efficacy 30.51 30 7.42 10
50 40
y* -2.71 -2 4.85 -14 7 21
Problem Scores 9.13 10 3.01 3
14 11
Age 21.07 20 5.98 17 57 40
Number of Courses 2.99 3 1.85 0 5 5
Table 3: Descriptive Scale Score Statistics No-Feedback Group (N=69).
Variable Mean Median SD Min. Max. Range
Pre Efficacy 34.39 34 5.39 22 46 24
Post Efficacy 31.94 32 7.11
10 46 36
y* -2.45 -1 5.58 -22 14 36
Problem Scores 7.49 7 2.96 10 13 12
Age 20.55 20 3.61
18 36 18
Number of Courses 3.07 3 1.67
0 5 5
y* is the difference in the post and pre- efficacy scores.
Journal of Statistics Education, Volume 18, Number 3 (2010)
8
3. Results
3.1 Efficacy
Did feedback during problem solving influence self-efficacy in problem solving?
We modeled the differences in the post and pretest efficacy scores (yi) as a linear function of
method (F vs. NF), age, gender, number of math or statistics courses taken previously, and major
(1). All the covariates were centered versus the mean. We classified majors into three categories
Business, Health Sciences, and Others.
yi = (post efficacy)i – (pre efficacy)i for student i, i = 1,…,138.
0 1 2 3 4
5 6 7
* * * *
* * *
i i i i i
i i i i
y method age gender course
Business Health Other
(1)
i ~ N(0,2) was random error associated with the i
th student.
The mean of self-efficacy scores for the Feedback group at pretest was 33.22 (SD=5.37) and at
posttest 30.51 (SD=7.42). For the No-Feedback group, the mean at pretest was 34.39 (SD=5.39)
and at posttest 31.94 (SD=7.11). These results show a decrease in the mean of self-efficacy from
pre-to posttest for both groups.
We performed a one-way analysis of covariance for model (equation 1). The variable method
was not a significant predictor of the differences in post and pretest self-efficacy scores (R-
squared =.06). Age (p-value=.03) was the only predictor with moderate statistical significance.
The interaction effects between independent variables were not significant.
3.2 Problem Solving
Did feedback influence problem solving scores controlling for covariates?
We modeled the final problem scores as a linear function of method (F vs. NF), age, gender,
number of math or statistics courses taken previously and major as shown in (equation 2). All the
covariates were centered versus the mean.
for student i, i = 1,…,138;
0 1 2 3
4 5 6 7
_ * * *
* * * *
i i i i
i i i i i
problem scores method age gender
course Business Health Other
(2)
i ~ N(0,2) was random error associated with the i
th student.
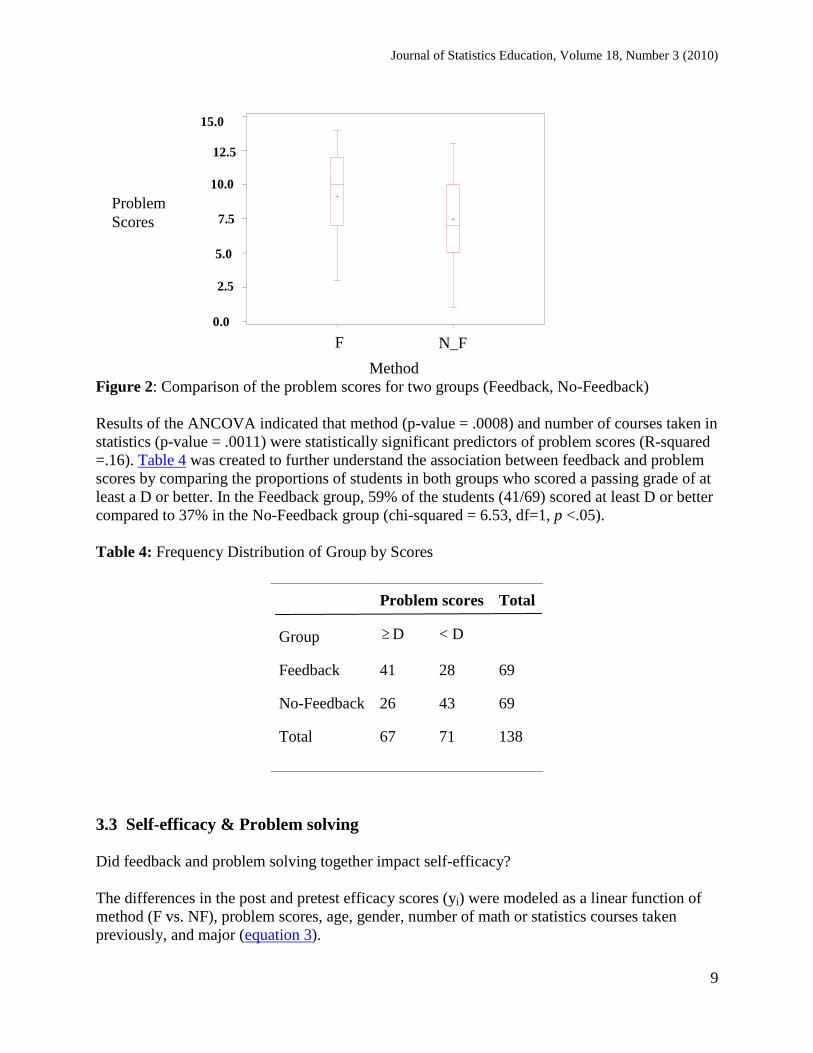
The mean problem score was 9.13 with a standard deviation of 3.01 for the Feedback group and
7.49 with a standard deviation of 2.96 for the No-Feedback group (Tables 2 & 3). The box plots
comparing the distribution of the scores of two groups are shown in Figure 2. There were no
outliers in these data. The mean of the problem scores was higher for the Feedback group;
however, both groups had similar standard deviations around the mean.
Journal of Statistics Education, Volume 18, Number 3 (2010)
9
Figure 2: Comparison of the problem scores for two groups (Feedback, No-Feedback)
Results of the ANCOVA indicated that method (p-value = .0008) and number of courses taken in
statistics (p-value = .0011) were statistically significant predictors of problem scores (R-squared
=.16). Table 4 was created to further understand the association between feedback and problem
scores by comparing the proportions of students in both groups who scored a passing grade of at
least a D or better. In the Feedback group, 59% of the students (41/69) scored at least D or better
compared to 37% in the No-Feedback group (chi-squared = 6.53, df=1, p <.05).
Table 4: Frequency Distribution of Group by Scores
Group
Problem scores Total
D < D
Feedback 41 28 69
No-Feedback 26 43 69
Total 67 71
138
3.3 Self-efficacy & Problem solving
Did feedback and problem solving together impact self-efficacy?
The differences in the post and pretest efficacy scores (yi) were modeled as a linear function of
method (F vs. NF), problem scores, age, gender, number of math or statistics courses taken
previously, and major (equation 3).
F N_F
0.0
2.5
5.0
7.5
10.0
12.5
15.0
Problem
Scores
Method
Journal of Statistics Education, Volume 18, Number 3 (2010)
10
yi =(post efficacy)i –(pre efficacy)I for student i, i = 1,…,138.
0 1 2 3 4
5 6 7 8
* * _ * *
* * * *
i i i i i
i i i i i
y method problem score age gender
course Business Health Other
(3)
i ~ N(0,2) was random error associated with the i
th student.
We performed a one-way analysis of covariance for model (equation 3). Neither method nor
problem scores were statistically significant predictors. Age (p-value = .04) was the only
statistically significant covariate.
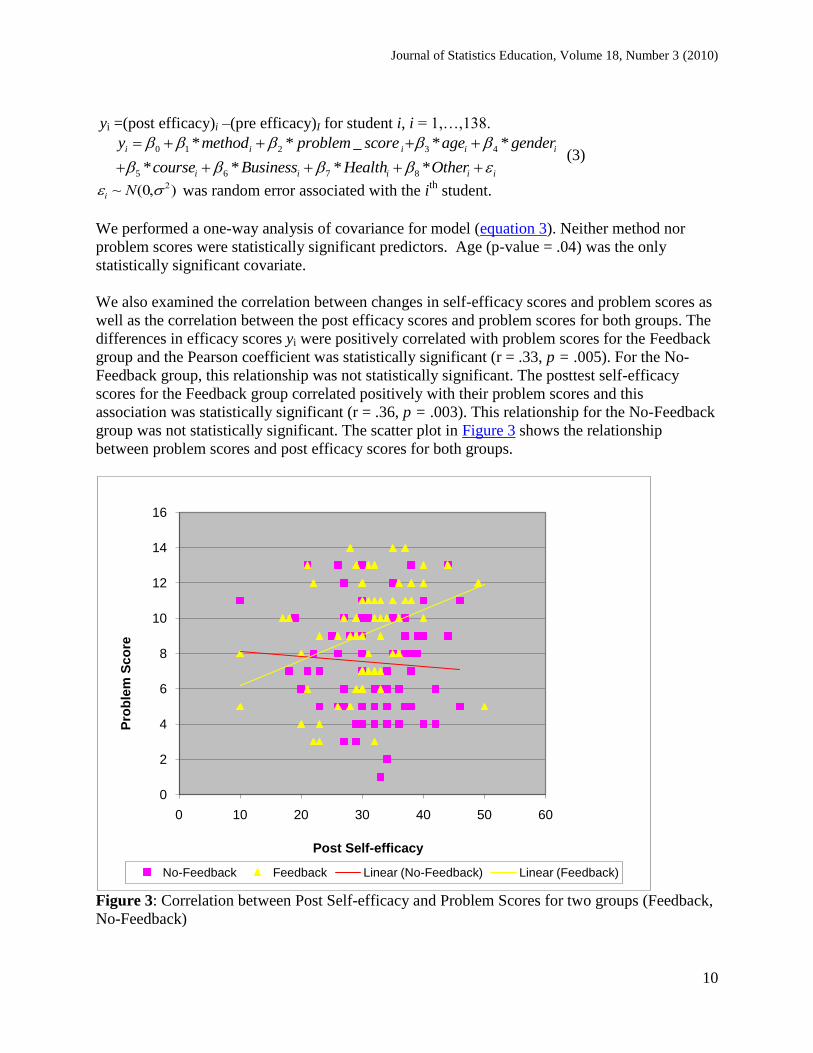
We also examined the correlation between changes in self-efficacy scores and problem scores as
well as the correlation between the post efficacy scores and problem scores for both groups. The
differences in efficacy scores yi were positively correlated with problem scores for the Feedback
group and the Pearson coefficient was statistically significant (r = .33, p = .005). For the No-
Feedback group, this relationship was not statistically significant. The posttest self-efficacy
scores for the Feedback group correlated positively with their problem scores and this
association was statistically significant (r = .36, p = .003). This relationship for the No-Feedback
group was not statistically significant. The scatter plot in Figure 3 shows the relationship
between problem scores and post efficacy scores for both groups.
Figure 3: Correlation between Post Self-efficacy and Problem Scores for two groups (Feedback,
No-Feedback)
0
2
4
6
8
10
12
14
16
0 10 20 30 40 50 60
Pro
ble
m S
co
re
Post Self-efficacy
No-Feedback Feedback Linear (No-Feedback) Linear (Feedback)
Journal of Statistics Education, Volume 18, Number 3 (2010)
11
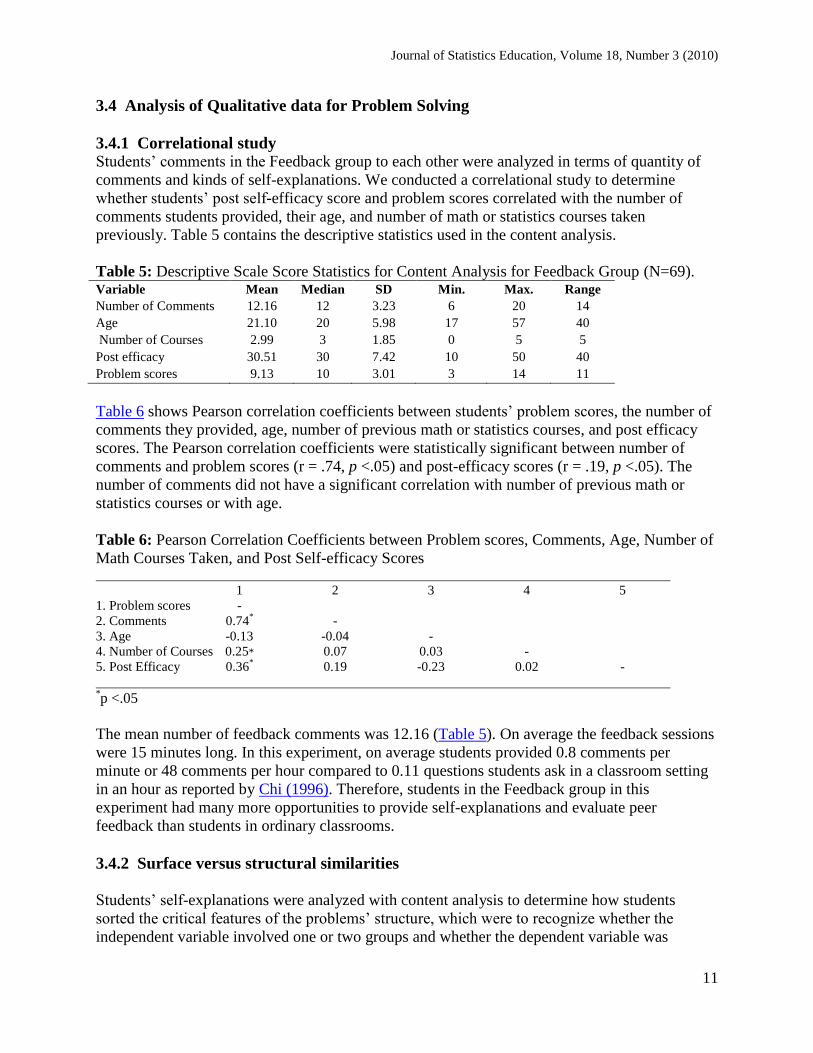
3.4 Analysis of Qualitative data for Problem Solving
3.4.1 Correlational study Students’ comments in the Feedback group to each other were analyzed in terms of quantity of
comments and kinds of self-explanations. We conducted a correlational study to determine
whether students’ post self-efficacy score and problem scores correlated with the number of
comments students provided, their age, and number of math or statistics courses taken
previously. Table 5 contains the descriptive statistics used in the content analysis.
Table 5: Descriptive Scale Score Statistics for Content Analysis for Feedback Group (N=69). Variable Mean Median SD Min. Max. Range
Number of Comments 12.16 12 3.23 6
20 14
Age 21.10 20 5.98 17 57 40
Number of Courses 2.99 3 1.85 0 5 5
Post efficacy 30.51 30 7.42 10 50 40
Problem scores 9.13 10 3.01 3
14 11
Table 6 shows Pearson correlation coefficients between students’ problem scores, the number of
comments they provided, age, number of previous math or statistics courses, and post efficacy
scores. The Pearson correlation coefficients were statistically significant between number of
comments and problem scores (r = .74, p <.05) and post-efficacy scores (r = .19, p <.05). The
number of comments did not have a significant correlation with number of previous math or
statistics courses or with age.
Table 6: Pearson Correlation Coefficients between Problem scores, Comments, Age, Number of
Math Courses Taken, and Post Self-efficacy Scores
1 2 3 4 5
1. Problem scores -
2. Comments 0.74* -
3. Age -0.13 -0.04 -
4. Number of Courses 0.25* 0.07 0.03 -
5. Post Efficacy 0.36* 0.19 -0.23 0.02 -
*p <.05
The mean number of feedback comments was 12.16 (Table 5). On average the feedback sessions
were 15 minutes long. In this experiment, on average students provided 0.8 comments per
minute or 48 comments per hour compared to 0.11 questions students ask in a classroom setting
in an hour as reported by Chi (1996). Therefore, students in the Feedback group in this
experiment had many more opportunities to provide self-explanations and evaluate peer
feedback than students in ordinary classrooms.
3.4.2 Surface versus structural similarities
Students’ self-explanations were analyzed with content analysis to determine how students
sorted the critical features of the problems’ structure, which were to recognize whether the
independent variable involved one or two groups and whether the dependent variable was
Journal of Statistics Education, Volume 18, Number 3 (2010)
12
quantitative or categorical. We employed content analysis, a qualitative data analysis
methodology (Creswell & Plano Clark, 2007), to analyze students’ comments in the Feedback
group to each other in terms of quantity and kinds of self-explanation. Cognitive studies of
analogical problem solving, or thinking by analogy, involves the three processes of recognition,
mapping, and abstraction (Quilici & Mayer, 1996). In this experiment, the focus was on
recognition. Students sorted each problem based on the story line of the problem, i.e., they
solved the problems based on the shared attributes of the objects in the problem (Quilici &
Mayer, 1996). Then they solved based on the structure, meaning the shared relations among
objects, e.g., problems involving t-tests involve two independent groups as the independent
variable and a quantitative measure as the dependent variable. We then read students’ rationale
to determine how their explanation described the characteristics of the independent and
dependent variables.
These problems involved t-tests, chi-squared tests, and correlation analysis; however, these
terminologies were not used, nor were students asked to conduct any tests. We wanted to know
if, for instance, students chose ―average words per minute‖ as the response variable to a question
in regard to the surface features of the problem, and if they would be able to correctly identify
the scale measurement of ―average words per minute‖ as a quantitative variable in the structure
question.
Table 7 illustrates one student’s response to a question. The elaboration provided by this student
contained key words that drew similarities between the objects of the story. This student first
defined the question in her own words; and then matched the key word from the story to her
newly defined phrase to answer the question. Liu, Lin, Chiu, & Yuan (2001) showed that
technology that provided an environment for students to record their reflection had a significant
impact on their learning. This recording of reflection or students’ self-explanation served as a
model for other students in the group (Bandura, 1997). Pintrich and Schunk's (2002) research
indicate that students are capable of learning complex skills through observing modeled
performances. In our study, self-explanation served as a modeling tool. The work of a student
with a higher skill served as a model or standard for less skilled students without creating undue
pressure due to social comparison.
It was quite likely that one student’s self-explanation helped remove a misconception for
another student in the group (Chi, 1996). The technology used for the discussion forum in this
study allowed the instructor to monitor students’ responses. However, during this experiment no
intervention was made as to avoid introducing biases in the results.
Journal of Statistics Education, Volume 18, Number 3 (2010)
13
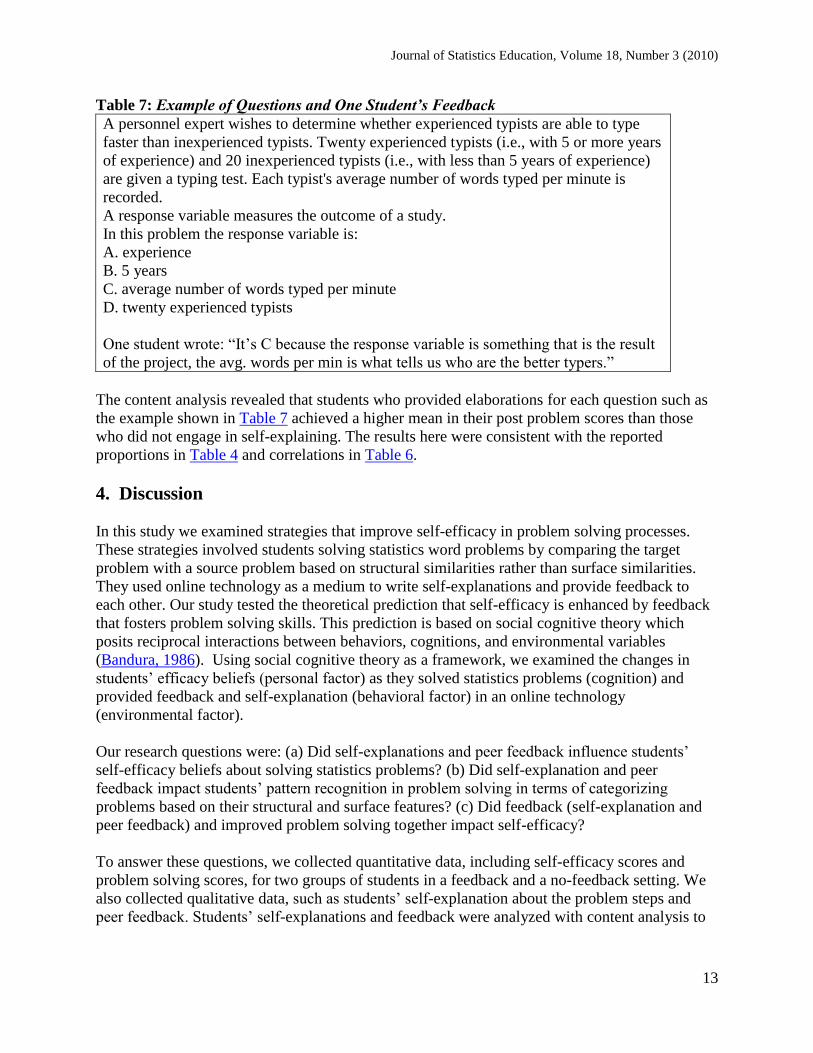
Table 7: Example of Questions and One Student’s Feedback
A personnel expert wishes to determine whether experienced typists are able to type
faster than inexperienced typists. Twenty experienced typists (i.e., with 5 or more years
of experience) and 20 inexperienced typists (i.e., with less than 5 years of experience)
are given a typing test. Each typist's average number of words typed per minute is
recorded.
A response variable measures the outcome of a study.
In this problem the response variable is:
A. experience
B. 5 years
C. average number of words typed per minute
D. twenty experienced typists
One student wrote: ―It’s C because the response variable is something that is the result
of the project, the avg. words per min is what tells us who are the better typers.‖
The content analysis revealed that students who provided elaborations for each question such as
the example shown in Table 7 achieved a higher mean in their post problem scores than those
who did not engage in self-explaining. The results here were consistent with the reported
proportions in Table 4 and correlations in Table 6.
4. Discussion
In this study we examined strategies that improve self-efficacy in problem solving processes.
These strategies involved students solving statistics word problems by comparing the target
problem with a source problem based on structural similarities rather than surface similarities.
They used online technology as a medium to write self-explanations and provide feedback to
each other. Our study tested the theoretical prediction that self-efficacy is enhanced by feedback
that fosters problem solving skills. This prediction is based on social cognitive theory which
posits reciprocal interactions between behaviors, cognitions, and environmental variables
(Bandura, 1986). Using social cognitive theory as a framework, we examined the changes in
students’ efficacy beliefs (personal factor) as they solved statistics problems (cognition) and
provided feedback and self-explanation (behavioral factor) in an online technology
(environmental factor).
Our research questions were: (a) Did self-explanations and peer feedback influence students’
self-efficacy beliefs about solving statistics problems? (b) Did self-explanation and peer
feedback impact students’ pattern recognition in problem solving in terms of categorizing
problems based on their structural and surface features? (c) Did feedback (self-explanation and
peer feedback) and improved problem solving together impact self-efficacy?
To answer these questions, we collected quantitative data, including self-efficacy scores and
problem solving scores, for two groups of students in a feedback and a no-feedback setting. We
also collected qualitative data, such as students’ self-explanation about the problem steps and
peer feedback. Students’ self-explanations and feedback were analyzed with content analysis to
Journal of Statistics Education, Volume 18, Number 3 (2010)
14
determine the extent of strategies involving self-explanation and peer feedback they used to
solve the problems.
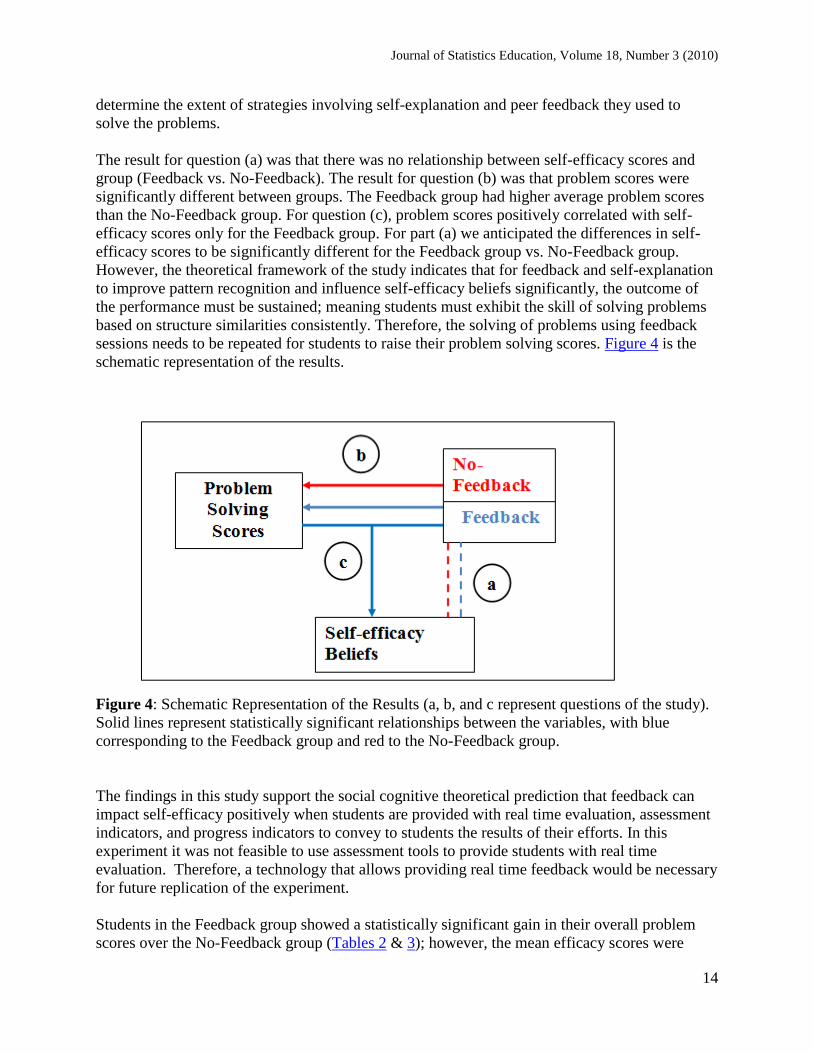
The result for question (a) was that there was no relationship between self-efficacy scores and
group (Feedback vs. No-Feedback). The result for question (b) was that problem scores were
significantly different between groups. The Feedback group had higher average problem scores
than the No-Feedback group. For question (c), problem scores positively correlated with self-
efficacy scores only for the Feedback group. For part (a) we anticipated the differences in self-
efficacy scores to be significantly different for the Feedback group vs. No-Feedback group.
However, the theoretical framework of the study indicates that for feedback and self-explanation
to improve pattern recognition and influence self-efficacy beliefs significantly, the outcome of
the performance must be sustained; meaning students must exhibit the skill of solving problems
based on structure similarities consistently. Therefore, the solving of problems using feedback
sessions needs to be repeated for students to raise their problem solving scores. Figure 4 is the
schematic representation of the results.
Figure 4: Schematic Representation of the Results (a, b, and c represent questions of the study).
Solid lines represent statistically significant relationships between the variables, with blue
corresponding to the Feedback group and red to the No-Feedback group.
The findings in this study support the social cognitive theoretical prediction that feedback can
impact self-efficacy positively when students are provided with real time evaluation, assessment
indicators, and progress indicators to convey to students the results of their efforts. In this
experiment it was not feasible to use assessment tools to provide students with real time
evaluation. Therefore, a technology that allows providing real time feedback would be necessary
for future replication of the experiment.
Students in the Feedback group showed a statistically significant gain in their overall problem
scores over the No-Feedback group (Tables 2 & 3); however, the mean efficacy scores were
Journal of Statistics Education, Volume 18, Number 3 (2010)
15
lower for both groups after the problem solving experiment (Tables 2 & 3). This incongruence
between self-efficacy beliefs and actual performances has been reported in previous studies
(Schunk & Pajares, 2002) and can be attributed to students’ lack of understanding of what they
do not know before they take the test (Chi, 1996) or to students not fully understanding what is
required to execute a task successfully. However, it is shown in Schunk and Pajares (2002, 2005)
that as students gain experience in problem solving, their assessment of their capabilities
improves. Feedback allowed students to match their problem solving performance in statistics to
their actual level of self-efficacy in the statistics. This process of acquiring experience to match
performance in a task with existing level of self-efficacy in that task is called calibration.
The students in the Feedback group solved the problems first in a group setting, then individually
with no feedback. On each step of the problems the students observed others similar to
themselves provide self-explanation and feedback. This process allowed students who were
unsure of solving the problems based on structural similarities rather than surface similarities to
read and learn from peers’ reasoning and feedback. For the Feedback group, problem scores
were positively correlated with post self-efficacy scores and also with the change in self-efficacy
scores. The Pearson correlation coefficients between each of these variable pairs were
statistically significant (section 3.3). However, for the No-Feedback group, these correlations
were not statistically significant. Bandura (1986) showed that learning from modeling and
observation from group members is using vicarious experiences to shape one’s beliefs. The
feedback environment in our experiment was a medium for students to improve self-efficacy in
problem solving. One of the limitations of this study is that the No-Feedback group only solved
the problems once.
Self-explanations may have served as a reason for the higher overall problem scores for the
Feedback group because feedback from some students may have helped remove misconceptions
for the others. In addition, self-explanation and receiving feedback is similar to providing and
receiving feedback between tutee and tutor. Chi (1996) showed that the tutee’s self-explanation
served as an effective means of learning because the tutor learned the tutee’s misconceptions. In
addition, the pattern of dialogue developed as a result of self-explanation and receiving feedback
and the interaction between the students allowed tutees to be more active in their learning.
In our study, the number of comments in the form of self-explanation that students in the
Feedback group made was positively correlated with their problem scores. Examination of the
qualitative data showed that the average number of comments for students in the Feedback group
whose problem scores were grade D or higher was above the mean number of comments 12.16
(Table 5).
In this study, the students in the Feedback group interacted much more often than students in
classrooms. On average, these students had the opportunity to provide self-explanation or
feedback comments more often than classroom students (Chi, 1996). According to Chi (1996), a
higher degree of communication among members of a group promotes collaborative construction
of the knowledge.
Both groups were instructed to solve multiple statistical problems by comparing each problem
with a given definition based on the surface and structure similarities. Our results are consistent
Journal of Statistics Education, Volume 18, Number 3 (2010)
16
with one of our hypotheses that students with low self-efficacy toward statistics problem solving
who are exposed to instruction which emphasizes solving problems based on structure and who
provide self-explanation are more likely to improve their problem scores than similar students
who are not exposed to providing explanation and feedback. However, the brief exposure to
examples emphasizing structure without supporting guidance or instruction does not yield a
lasting effect (Quilici & Mayer, 1996). Therefore, the problem solving sessions with feedback
need to be replicated over a period of time to improve students’ performance in categorizing
problems based on understanding of the underlying structure.
The analysis of the contents of the self-explanations that students provided for each question
indicated that those who provided more thoughtful responses and elaborated on the rationale for
their choices showed higher gains in problem scores from pre- to posttest than did those who
gave fewer comments or did not elaborate on their responses.
The students’ gain in problem solving in the Feedback group is in agreement with Clark and
Mayer’s (2003) research on the impact of collaborative learning on the web and its impact on
problem solving skills. Clark and Mayer emphasize the process of practice using collaboration
on the web in learning and effectively using metacognitive strategies of planning, monitoring,
regulating, and integrating to become successful in problem solving. According to Clark and
Mayer, when instruction allows students to reflect more deeply on the steps of problem solving,
they are more likely to use metacognitive strategies. Therefore, the Feedback group’s gain in
average problem solving scores may be attributed to the effect of giving or receiving feedback or
to the effect of practice in solving statistical problems.
The content analysis of students’ choices and their rationale revealed the misconceptions
students had and the knowledge pieces they lacked while sorting the similarities between surface
features and structural features in the statistical problems. In the Feedback group, 28 students
who scored less than grade D (Table 4) generally did not pay attention to the nature of two
structural features of the problems: whether the independent variable involved one or two
independent groups and whether the dependent variable was quantitative or categorical. Their
descriptions of quantitative and categorical types showed they did not have a firm grasp of their
differences and their meanings. These students scored correctly on the surface questions of these
problems but not on the structure questions. In addition, they were more confused about
classifying the correlation problem based on its structure than they were on the other two types
of problems. The problem regarding correlation involved comparing two variables for one group
(see Appendix B). An instructional implication that warrants further study is that students would
benefit from instruction and practice in identifying and describing the characteristics of the
independent and dependent variables in elementary statistics word problems.
Improvements could be made to enhance the reliability of constructs to enhance the reliability of
measures. For example, if self-efficacy measurements were improved, the change from pre- to
posttest may become a significant predictor in the impact of feedback on problem solving
between two methods of learning.
In summary, this study examined the effectiveness of web-based instruction in statistics problem
solving from a social cognitive perspective. The reciprocal nature of the variables in social
Journal of Statistics Education, Volume 18, Number 3 (2010)
17
cognitive theory makes it possible for teaching and learning efforts to be directed at personal,
environmental, or behavioral factors (Pajares, 2002). Using social cognitive theory as a
framework, instructors can work to improve students’ low efficacy beliefs (personal factor)
about a subject such as statistics or about learning in an on-line environment. They can improve
students’ academic skills (behavioral factor) by providing them with efficient models and
feedback. Those who construct web-based learning systems can alter technology (environmental
factor) that may undermine student success and design learning systems that accommodate
learners’ needs.
Journal of Statistics Education, Volume 18, Number 3 (2010)
18
Appendix A
Instrument 2: Students’ Perceived confidence/competence (self-efficacy-pre and post)1
Response scale [to be applied to each part of each question]:
not at all confident very confident
1 2 3 4 5
__________________________________________________
1. How confident are you with solving statistical problems?
2. How well do you feel you are understanding statistical problems?
3. How competently could you apply statistics in practice?
4. How confident are you with inspecting peers’ work and posting feedback?
5. How confident are you with detecting your errors?
6. How confident are you with peers detecting your errors?
7. How confident are you with peers commenting on your work?
8. How confident are you with incorporating peers’ comments in your work?
9. How confident are you with peers correcting your work?
10. How confident are you with the teacher correcting your work?
1 The first three items were from Frederickson et al. (2005) study, the rest were added for this study. The
instrument had a reliability coefficient of 0.92 in two pilot studies prior to this experiment.
Journal of Statistics Education, Volume 18, Number 3 (2010)
19
Appendix B
Display-1
(1) A personnel expert wishes to determine whether experienced typists are able to type
faster than inexperienced typists. Twenty experienced typists (i.e., with 5 or more years
of experience) and 20 inexperienced typists (i.e., with less than 5 years of experience)
are given a typing test. Each typist's average number of words typed per minute is
recorded.
(2) A personnel expert wishes to determine whether or not experienced typists are
likely to be fast typists and inexperienced typists are more likely to be slow typists.
Twenty experienced typists (i.e., with 5 or more years of experience) and 20
inexperienced typists (i.e., with less than 5 years of experience) are given a typing test.
Based on the test, each typist is classified as fast or slow.
(3) A personnel expert wishes to determine whether typing experience goes with faster
typing speeds. Forty typists are asked to report how many years they have worked as
typists and are given a typing test to determine their average number of words typed
per minute.
Display-2
Questions were structured as shown below: first, the problem, then a short description
and then the question.
A personnel expert wishes to determine whether experienced typists are able to type
faster than inexperienced typists. Twenty experienced typists (i.e., with 5 or more
years of experience) and 20 inexperienced typists (i.e., with less than 5 years of
experience) are given a typing test. Each typist's average number of words typed
per minute is recorded.
A response variable measures the outcome of a study.
In this problem the response variable is:
A. experience
B. 5 years
C. average number of words typed per minute
D. twenty experienced typists
Journal of Statistics Education, Volume 18, Number 3 (2010)
20
References
Bandura, A. (1986), Social Foundations of thought and action: A social cognitive theory.
Prentice Hall, Englewood Cliffs, NJ.
Bandura, A. (1997), Self-efficacy: The exercise of control, Freeman, New York.
Bessant, K. (1992), ―Instructional Design and the Development of Statistical Literacy,‖ Teaching
Sociology, 20, 143-149.
Chi, M. T .H. (1996), ―Constructing Self-explanations and Scaffolded Explanations in Tutoring,‖
Applied Cognitive Psychology, 10, S33-S49.
Clark, R. C., & Mayer, R. E. (2003), E-learning and the science of instruction, Pfeiffer, San
Francisco, CA.
Cleary, T. J. (2006), ―The Development and Validation of The Self-Regulation Strategy
Inventory-self-report,‖ Journal of School Psychology, 44, 307-322.
Cronbach, L. (1951), ―Coefficient alpha and the internal structure of tests,‖ Psychometrika, 16
(3): 297–334.
Creswell J. W. and Plano Clark, V. L. (2007), Designing and Conducting Mixed Methods
Research, Sage Publication.
Everson, M. G. & Garfield, J. (2008),“An innovative approach to teaching online statistics
courses,‖ Technology Innovations in Statistics Education, 2 (1), [Online]. Available:
http://repositories.cdlib.org/uclastat/cts/tise/vol2/iss1/art3
Frederickson, N., Reed, P., & Clifford, V., (2005), ―Evaluating web-supported learning versus
lecture-based teaching: Quantitative and qualitative perspectives,‖ Higher Education, 50, 645-
664.
Jonassen, D. H., Rebello, S., Wexler, C., Hrepic, Z., & Triplett, G. (2007), ―Learning to solve
problems by scaffolding Analogical encoding,‖ in Proceedings of the American Society of
Engineering Education, http://soa.asee.org/paper/conference/paper-view.cfm?id=3335
Lin, S. S., Liu, E. Z., & Yuan S. (2001), ―Web based peer assessment: Attitude and
achievement.‖ IEEE.
Liu, E. Z., Lin, S. S., Chiu, C., & Yuan, S. (2001), ―Web-Based Peer Review: The learner as
both adapter and reviewer,‖ Institute of Electrical and Electronics Engineers, 44(3), 246-251.
Liu, E. Z., Lin, S. S., & Yuan, S. (2001), ―Design of a networked portfolio system,‖ British
Journal of Educational Technology, 32(4), 492-494.
Journal of Statistics Education, Volume 18, Number 3 (2010)
21
Lovett, M. C., & Greenhouse, J. B. (2000), ―Applying cognitive theory to statistics instruction,‖
The American Statistician, 54(3), 196-211.
Mayer, R. E. (1992), Thinking, problem solving, cognition. New York: W. H. Freeman and
Company.
McKendree, J. (1990), ―Effective feedback content for tutoring complex skills‖ Human-
Computer Interaction, 5, 381-413.
Mejias, U. (2006), ―Teaching social software with social software,‖ Innovate [Online], 2(5),
Available: http://www.innovateonline.info/index.php?view=articleid=260.
Onwuegbuzie, A. J., & Wilson, V. (2003), ―Statistics anxiety: Nature, etiology, antecedents,
effects, and treatments-a comprehensive review of the literature,‖ Teaching in Higher Education,
8(2), 195-209.
Pajares, F. (2002), Overview of social cognitive theory and of self-efficacy, [Online]. Available:
http://www.des.emory.edu/mfp/eff.html
Pajares, F., & Miller, M. D. (1994), ―Role of self-efficacy and self-concept beliefs in
mathematical problem solving: A path analysis,‖ Journal of Educational Psychology, 86 (2),
193-203.
Pan, W., & Tang, M. (2004), ―Examining the effectiveness of innovative instructional methods
on reducing statistics anxiety for graduate students in the social science.‖ Journal of
Instructional Psychology, 31(2), 149-158.
Pintrich, P. R., & De Groot, E. V. (1990), ―Motivational and self-regulated learning components
of classroom academic performance.‖ Journal of Educational Psychology, 82, 33-40.
Pintrich, P. R., & Schunk, D. H. (2002), Motivation in education: Theory, research, and
applications (2nd ed.), Prentice Hall Englewood Cliffs, NJ.
Quilici, J. L., & Mayer, R. E. (1996), ―Role of examples in how students learn to categorize
statistics word problems,‖ Journal of Educational Psychology, 88(1), 144-161.
Recker, M. M., & Pirolli, P. (1995), ―Modeling individual differences in students’ learning
strategies,‖ The Journal of the Learning Sciences, 4(1), 1-38.
Schoenfeld , A. (1983), Beyond the purely cognitive: Belief systems, social cognitions, and
metacognitions as driving forces in intellectual performance, Cognitive Science: A
Multidisciplinary Journal, 7(4) pp 329-363.
Schommer, M. (1990), ―Effects of beliefs about the nature of knowledge on comprehension,‖
Journal of Educational Psychology, 82, 498-504.
Journal of Statistics Education, Volume 18, Number 3 (2010)
22
Schommer, M., Crouse, A., & Rhodes, N. (1992), Epistemological beliefs and mathematical text
comprehension: Believing it is simple does not make it so, Journal of Educational Psychology,
84, pp. 435-443.
Schunk, D. H., & Pajares, F. (2002), ―The development of academic self-efficacy. In W.
Wigfield & Eccles, J. S. (Eds.),‖ Development of achievement motivation, Academic Press, San
Diego, CA, 15-31.
Schunk, D. H., & Pajares, F. (2005), ―Competence perceptions and academic functioning. In A.
J. Elliot & C. S. Dweck (Eds.),‖ Handbook of competence and motivation (pp. 85-104). Guilford
Press, New York.
Stangl, D. (2000), ―Design of an internet course for training medical researchers in Bayesian
statistical methods,‖ In C. Batenero (Ed.), Training researchers in the use of statistics.
International Association for Statistical Education.
Wang, S. L., & Lin, S. L. (2007), The application of social cognitive theory to web-based
learning through NetPorts, British Journal of Educational Technology, 38, 4, 600-612.
Wigfield, A., Eccles, J. S., & Pintrich, P. R. (1996), ―Development between the ages of 11 and
25. In D. C. Berliner & R. C. Calfee (Eds.),‖ Handbook of educational psychology, Macmillan,
New York, 148-185.
Simin Hall
Department of Mechanical Engineering
306 Collegiate Square
College of Engineering (0238)
Virginia Tech
Blacksburg, VA 24061
Email: [email protected]
Eric A. Vance
Department of Statistics
212 Hutcheson Hall (0439)
Virginia Tech
Blacksburg, VA 24061
Email: [email protected]
Volume 18 (2010) | Archive | Index | Data Archive | Resources | Editorial Board |
Guidelines for Authors | Guidelines for Data Contributors | Guidelines for Readers/Data Users | Home Page | Contact JSE | ASA Publications