Embed Size (px)
Citation preview
University of South FloridaScholar Commons
Graduate Theses and Dissertations Graduate School
January 2012
Improving the Throughput and Reliability ofWireless Sensor Networks with Application toWireless Body Area NetworksGabriel ArroboUniversity of South Florida, [email protected]
Follow this and additional works at: http://scholarcommons.usf.edu/etd
Part of the Electrical and Computer Engineering Commons
This Dissertation is brought to you for free and open access by the Graduate School at Scholar Commons. It has been accepted for inclusion inGraduate Theses and Dissertations by an authorized administrator of Scholar Commons. For more information, please [email protected].
Scholar Commons CitationArrobo, Gabriel, "Improving the Throughput and Reliability of Wireless Sensor Networks with Application to Wireless Body AreaNetworks" (2012). Graduate Theses and Dissertations.http://scholarcommons.usf.edu/etd/4279
Improving the Throughput and Reliability of Wireless Sensor Networks
with Application to Wireless Body Area Networks
by
Gabriel Arrobo
A dissertation submitted in partial fulfillment
of the requirements for the degree of
Doctor of Philosophy
Department of Electrical Engineering
College of Engineering
University of South Florida
Major Professor: Richard D. Gitlin, Sc.D.
Huseyin Arslan, Ph.D.
Ravi Sankar, Ph.D.
Miguel Labrador, Ph.D.
Zygmunt Haas, Ph.D.
Date of Approval:
November 2, 2012
Keywords: In Vivo Communications, Real-time Traffic, Network Coding,
Diversity Coding, OFDM
Copyright © 2012, Gabriel Arrobo

DEDICATION
To my beloved wife, Carolina, who supported me each step of the way; my son, Gabriel,
who is my motivation to give and be amongst the best; my parents, who have taught me
invaluable lessons; and God who presents me challenging opportunities to grow personally and
professionally.

ACKNOWLEDGMENTS
I would like to express my deepest appreciation to my advisor Dr. Richard D. Gitlin, who
I also consider my mentor, for his invaluable guidance, support, patience, encouragement, and life
teachings. I will internalize all he has taught me in my future life, because it is something that will
help me to achieve even greater objectives. I am also grateful to Dr. Huseyin Arslan, Dr. Ravi
Sankar, Dr. Miguel Labrador and Dr. Zygmunt Haas for being part of my doctoral committee,
and for the knowledge that I acquired when interacting with them.
I am thankful to my friends and colleagues at the In vivo Wireless Information
Networking (iWINLAB) Laboratory. Also, my sincere thanks to all the staff at the Department of
Electrical Engineering at USF for their kindness and valued assistance.
My deepest gratitude to my wife Carolina and my darling son Gabriel for their love,
support and company. Finally, I thank God for giving me the opportunity to keep growing and
improving myself, with the ultimate goal of better serve the society.
i
TABLE OF CONTENTS
LIST OF TABLES ........................................................................................................................... v
LIST OF FIGURES ........................................................................................................................ vi
ABSTRACT .................................................................................................................................... xi
CHAPTER 1. INTRODUCTION .................................................................................................... 1 1.1 Wireless Sensor Networks and Wireless Body Area Networks ............................ 1 1.2 Insights and Constraints in Wireless Sensor Networks and Body Area
Networks ................................................................................................................ 3 1.3 Research Motivation .............................................................................................. 6 1.4 Contributions and Organization of this Dissertation.............................................. 9
CHAPTER 2. LITERATURE REVIEW ....................................................................................... 13 2.1 Introduction .......................................................................................................... 13 2.2 Error Detection Techniques ................................................................................. 13
2.2.1 Parity ........................................................................................................... 14 2.2.2 Checksum.................................................................................................... 14 2.2.3 Cyclic Redundancy Check .......................................................................... 14
2.3 Error Correction Techniques ............................................................................... 14 2.3.1 Forward Error Correction (at the bit level) ................................................. 15
2.3.1.1 Linear Block Codes ........................................................................ 15 2.3.1.2 Convolutional Codes ...................................................................... 16
2.3.2 Hybrid Techniques ...................................................................................... 16 2.3.2.1 Simple Hybrid ARQ: ...................................................................... 17 2.3.2.2 Hybrid ARQ with Soft Combining ................................................. 17
2.3.3 Forward Error Correction Techniques at the Packet Level ......................... 18 2.4 Diversity Coding .................................................................................................. 18 2.5 Network Coding ................................................................................................... 25
2.5.1 Network Coding Approaches ...................................................................... 27 2.5.2 Applications of Network Coding ................................................................ 31
2.5.2.1 Wireless Broadcast Networks ......................................................... 31 2.5.2.2 Peer to Peer File Sharing System .................................................... 32 2.5.2.3 Network Security Applications ....................................................... 32
2.6 Concluding Remarks............................................................................................ 33
CHAPTER 3. COOPERATIVE NETWORK CODING FOR WIRELESS SENSOR
NETWORKS ................................................................................................................................. 34 3.1 Introduction .......................................................................................................... 34 3.2 Cooperative Network Coding .............................................................................. 36 3.3 Simulation Scenario and Results for Wireless Ad Hoc Networks ....................... 44
3.3.1 Effect of the Number of Original Packets on the Performance of
Cooperative Network Coding .................................................................... 44
ii
3.3.2 Effect of the Probability of Link Error on the Performance of
Cooperative Network Coding .................................................................... 46 3.3.3 Effect of the Connectivity on the Performance of Cooperative Network
Coding ....................................................................................................... 48 3.3.4 Effect of the Number of Clusters on the Performance of Cooperative
Network Coding ........................................................................................ 51 3.4 Concluding Remarks............................................................................................ 55
CHAPTER 4. LINK LEVEL RETRANSMISSIONS FOR COOPERATIVE NETWORK
CODING AND COOPERATIVE DIVERSITY CODING ........................................................... 57 4.1 Introduction .......................................................................................................... 57 4.2 Effect of Retransmission from the Last Cluster ................................................... 60 4.3 Cooperative Network Coding Optimization – Selective Retransmissions to
Minimize Energy Consumption ........................................................................... 65 4.4 Simulation Scenario for Wireless Ad hoc Networks ............................................ 72
4.4.1 Cooperative Network Coding with Retransmission from the Last
Cluster ....................................................................................................... 73 4.4.2 Cooperative Diversity Coding and Cooperative Network Coding
Optimization - Minimizing Energy Consumption ..................................... 74 4.5 Concluding Remarks............................................................................................ 81
4.5.1 Cooperative Network Coding with Retransmissions .................................. 81 4.5.2 Cooperative Diversity Coding and Cooperative Network Coding
Optimization - Minimizing Energy Consumption ..................................... 82
CHAPTER 5. IMPROVING THE PERFORMANCE OF SINGLE SOURCE – SINGLE
DESTINATION WIRELESS BODY AREA NETWORKS VIA COOPERATIVE
NETWORK CODING ................................................................................................................... 83 5.1 Introduction and Motivation ................................................................................ 83 5.2 Literature Review ................................................................................................ 85 5.3 Extant Wireless Body Area Networks ................................................................. 86 5.4 Network Coding in Wireless Body Area Networks ............................................. 88 5.5 Cooperative Network Coding in Wireless Body Area Networks Model ............. 89
5.5.1 Network Coding at the Source Node .......................................................... 90 5.5.2 Operations at the Relay Nodes .................................................................... 91 5.5.3 Operations at the Destination Node ............................................................ 91
5.6 Simulation Results and Discussion ...................................................................... 92 5.7 Concluding Remarks............................................................................................ 98
CHAPTER 6. IMPROVING THE PERFORMANCE OF WIRELESS BODY AREA
NETWORKS THROUGH TEMPORAL DIVERSITY CODING ................................................ 99 6.1 Introduction and Motivation ................................................................................ 99 6.2 Literature Review .............................................................................................. 100 6.3 System Model .................................................................................................... 100 6.4 Temporal Diversity Coding for Increasing the Performance of In Vivo
Wireless Communications ................................................................................. 101 6.5 Simulation Results and Discussion .................................................................... 105 6.6 Concluding Remarks.......................................................................................... 109
iii
CHAPTER 7. IMPROVING THE PERFORMANCE OF WIRELESS BODY AREA
NETWORKS FOR MULTIPLE SOURCE – MULTIPLE RECEIVERS ................................... 111 7.1 Introduction and Motivation .............................................................................. 111 7.2 Literature Review .............................................................................................. 112 7.3 Cooperative Network Coding for Multiple Source – Multiple Destination ....... 114 7.4 Simulation Results and Discussion .................................................................... 116 7.5 Concluding Remarks.......................................................................................... 119
CHAPTER 8. IMPROVING THE RELIABILITY OF IN VIVO VIDEO WIRELESS
COMMUNICATIONS ................................................................................................................ 120 8.1 Introduction ........................................................................................................ 120 8.2 Orthogonal Frequency Division Multiplexing ................................................... 121 8.3 Diversity Coding - Orthogonal Frequency Division Multiplexing .................... 124 8.4 Preliminary Results ............................................................................................ 127 8.5 Concluding Remarks.......................................................................................... 129
CHAPTER 9. DC–OFDM FOR IMPROVING THE RELIABILITY OF VEHICULAR
COMMUNICATIONS ................................................................................................................ 130 9.1 Introduction ........................................................................................................ 130 9.2 Literature Review .............................................................................................. 131
9.2.1 Wireless Access in Vehicular Environments ............................................ 131 9.2.2 Orthogonal Frequency Division Multiplexing .......................................... 133 9.2.3 Diversity Coding ....................................................................................... 138
9.3 Related Work – Network Coding for OFDM-Based Systems ........................... 138 9.3.1 Network Coding in the MAC Layer ......................................................... 138 9.3.2 Network Coding in the PHY Layer .......................................................... 140
9.3.2.1 Rate Diverse Network Coding ...................................................... 140 9.3.2.2 CodePlay ....................................................................................... 142
9.3.3 Performance Evaluation of PHY Layer Network Coding Techniques ..... 142 9.4 Diversity Coded Orthogonal Frequency Division Multiplexing ........................ 145
9.4.1 System Model ........................................................................................... 146 9.4.2 Operation of Diversity Coding – OFDM .................................................. 151
9.5 Results ................................................................................................................ 155 9.6 Concluding Remarks.......................................................................................... 158
CHAPTER 10. CONCLUSION AND FUTURE DIRECTIONS ................................................ 160 10.1 Main Contributions and Conclusions................................................................. 161
10.1.1 Cooperative Network Coding for Improving the Performance of
Wireless Sensor Networks ....................................................................... 161 10.1.2 Link-level Retransmissions for Cooperative Network Coding
Architectures ........................................................................................... 162 10.1.3 Cooperative Network Coding for Improving the Performance of
Wireless Body Area Networks ................................................................ 163 10.1.4 Temporal Diversity Coding for Improving the Performance of
Wireless Body Area Networks ................................................................ 164 10.1.5 Diversity Coding for Orthogonal Frequency Division Multiplexing
(OFDM-based) Systems .......................................................................... 165 10.2 Future Directions ............................................................................................... 165
REFERENCES ............................................................................................................................ 167

iv
APPENDICES ............................................................................................................................. 174 Appendix A Copyright and Permissions ......................................................................... 175
ABOUT THE AUTHOR ……………………………………………………………... END PAGE
v
LIST OF TABLES
Table 1-1 Comparison of our approaches for wireless sensor networks ....................................... 10
Table 1-2 Comparison of our approaches for wireless body area networks .................................. 11
Table 3-1 System parameters [22] ................................................................................................. 39
Table 4-1 Minimum number of transmitted packets and probability of linear
independency of the transmitted packets ..................................................................... 68
Table 4-2 CNC performance for probability of link error of 0.10, connectivity among the
nodes equal to 6, and 11 combination packets ............................................................ 76
Table 4-3 CDC performance for probability of link error of 0.10, connectivity among the
nodes equal to 8, and 11 combination packets ............................................................ 76
Table 4-4 CNC performance for probability of link error of 0.05, connectivity among the
nodes equal to 6, and 11 combination packets ............................................................ 78
Table 4-5 CDC performance for probability of link error of 0.05, connectivity among the
nodes equal to 6, and 11 combination packets ............................................................ 78
Table 8-1 Diversity Coding as a function of the modulation scheme .......................................... 126
Table 9-1 Diversity Coding as a function of the modulation scheme for IEEE 802.11p ............. 149
Table 10-1 Comparison between Diversity Coding and Network Coding .................................. 161
vi
LIST OF FIGURES
Figure 1.1 Wireless sensor network ................................................................................................. 2
Figure 1.2 A wireless body area network and its possible communication links [8], © 2010
IEEE .............................................................................................................................. 3
Figure 1.3 Communication links for a wireless body area network ---WBAN ............................... 6
Figure 1.4 Trocar port used for surgical tools and placement of the MARVEL Camera
Module in the abdominal wall [38] ............................................................................... 8
Figure 2.1 for Diversity Coding system [13] .......................................................................... 19
Figure 2.2 Point-to-point system with M for N Diversity Coding [13] .......................................... 24
Figure 2.3 Multipoint-to-point Diversity Coding [13] ................................................................... 24
Figure 2.4 Multipoint-to-multipoint Diversity Coding [13] .......................................................... 25
Figure 2.5 Butterfly topology (Network Coding) .......................................................................... 26
Figure 2.6 Traditional network approach (No Network Coding) .................................................. 27
Figure 2.7 Network Coding packet format .................................................................................... 29
Figure 2.8 Wireless Network Coding (WNC) topology ................................................................ 30
Figure 3.1 The multihop network model ....................................................................................... 34
Figure 3.2 Probability of successful reception of a packet vs. the number of hops ....................... 35
Figure 3.3 Cooperative Network Coding model ............................................................................ 37
Figure 3.4 Node’s Network Coding operation ............................................................................... 41
Figure 3.5 The connectivity of Cooperative Network Coding ....................................................... 42
Figure 3.6 Probability of successful reception at the destination vs. number of nodes per
cluster as a function of the number of original packets and connectivity, the
probability of link error is 10-1
................................................................................. 45
Figure 3.7 Probability of successful reception at the destination vs. number of nodes per
cluster as a function of the probability of link error for a connectivity ...... 47
vii
Figure 3.8 Probability of successful reception at the destination vs. number of nodes per
cluster as a function of the connectivity rij for rs=m=10, the probability of link
error is 0.1 ................................................................................................................ 49
Figure 3.9 Probability of successful reception at the destination vs. number of nodes per
cluster as a function of the connectivity rij for rs=m=10, the probability of link
error is 0.25............................................................................................................... 49
Figure 3.10 Comparison of probability of successful reception at the destination for
probability of link error is 0.1, rs equal and rs equal for different
values of connectivity .................................................................................................. 50
Figure 3.11 Comparison of probability of successful reception at the destination for
probability of link error is 0.25, rs equal and rs equal for different
values of connectivity .................................................................................................. 50
Figure 3.12 Effect of connectivity between nodes in the last cluster and the destination node
for the probability of link error of 0.1 ...................................................................... 51
Figure 3.13 Probability of successful reception at the destination vs. number of clusters for
connectivity rs=rij=4, the probability of link error is 0.1 and different number
of nodes per cluster ...................................................................................................... 53
Figure 3.14 Probability of successful reception at the destination vs. number of clusters for
connectivity rij=4, the probability of link error is 0.25 and different number of
nodes per cluster .......................................................................................................... 53
Figure 3.15 Probability of successful reception at the destination vs. number of clusters for
connectivity rij=8, the probability of link error is 0.1 and different number of
nodes per cluster .......................................................................................................... 54
Figure 3.16 Probability of successful reception at the destination vs. number of clusters for
connectivity rij=8, the probability of link error is 0.25 and different number of
nodes per cluster .......................................................................................................... 54
Figure 4.1 The throughput vs. number of nodes per cluster of Cooperative Network
Coding (with rs=rij=10) and of Multihop Packet Network .......................................... 59
Figure 4.2 Probability VK that a node in the cluster correctly receives at least one coded
packet vs. number of nodes in a cluster for different values of connectivity
and for ............................................................................................................ 60
Figure 4.3 The probability of successful reception vs. number of nodes in a cluster for a
number of values of connectivity and for ................................................... 61
Figure 4.4 Probability VK that a node in the cluster correctly receives at least one coded
packet vs. number of nodes in a cluster for different values of connectivity
and for .......................................................................................................... 61
Figure 4.5 The probability of successful reception vs. number of nodes in a cluster for a
number of values of connectivity and for ................................................. 62
viii
Figure 4.6 Link-layer retransmission model .................................................................................. 63
Figure 4.7 Probability of successful reception vs. number of nodes in a cluster for
........................................................................................................................ 73
Figure 4.8 Probability of successful reception vs. number of nodes in a cluster for
...................................................................................................................... 74
Figure 4.9 CNC and CDC performance for probability of link error equal to , connectivity
equal to and coded packets ................................................................ 75
Figure 4.10 CNC performance for probability of link error equal to 0.10, connectivity equal
to 6 and original packets ................................................................................ 78
Figure 4.11 CNC and CDC performance vs. the number of nodes per cluster for probability
of link error equal to 0.05, connectivity equal to and original packets ....... 79
Figure 5.1 (a) Placement of the MARVEL Camera Module in the abdominal wall, and (b)
Two MARVEL CMs are inside of a porcine abdominal cavity [38] ........................... 83
Figure 5.2 Possible communication links for body area networking [68], © 2010 IEEE .............. 84
Figure 5.3 Network topology in [71] ............................................................................................. 86
Figure 5.4 Network topology in [72] ............................................................................................. 86
Figure 5.5 Cooperative Network Coding for wireless body area network..................................... 90
Figure 5.6 Probability of successful reception as a function of the Eb/N0 for U and UC
systems with modulation 4-PSK .................................................................................. 94
Figure 5.7 Probability of successful reception as a function of the Eb/N0 for NC systems with
modulation 4-PSK ....................................................................................................... 94
Figure 5.8 Probability of successful reception as a function of the Eb/N0 for CNC systems
with modulation 4-PSK ............................................................................................... 95
Figure 5.9 Probability of successful reception at the destination as a function of the Eb/N0 for
UC and for CNC with different number of coded packets with
modulation 4-PSK ....................................................................................................... 96
Figure 5.10 Probability of successful reception at the destination as a function of the Eb/N0
for UC and for CNC with different number of coded packets with
modulation 16-QAM ................................................................................................... 96
Figure 5.11 Probability of successful reception at the destination as a function of the number
of coded packets for CNC............................................................................................ 97
Figure 5.12 Probability of successful reception at the destination as a function of the Eb/N0
for U, UC, NC, and CNC systems with modulation 4-PSK ........................................ 97
ix
Figure 6.1 System with Diversity Coding [13] .............................................................. 100
Figure 6.2 Temporal Diversity Coding: System model for two relay paths ................................ 101
Figure 6.3 Temporal Diversity Coding: Network topology ......................................................... 102
Figure 6.4 Probability of successfully receiving information vs. Eb/N0 for an uncoded
and Temporal Diversity Coding schemes ................................. 106
Figure 6.5 Efficiency vs. Eb/N0 for an uncoded and Temporal Diversity Coding
schemes for a two-path system .................................................................................. 107
Figure 6.6 Utilization vs. Eb/N0 for an uncoded and Temporal Diversity Coding schemes for a two-path system .................................................................................. 108
Figure 6.7 Efficiency vs. Utilization for an uncoded and Temporal Diversity Coding
schemes for a two-path system ...................................................................... 108
Figure 6.8 Probability of success comparion for Temporal Diversity Coding and
the other 3 schemes ............................................................. 109
Figure 7.1 Wireless Body Area Network ..................................................................................... 111
Figure 7.2 Cooperative Network Coding for Wireless Body Area Networks ............................. 114
Figure 7.3 Cooperative Network Coding model for WBANs...................................................... 116
Figure 7.4 Throughput vs. probability of link error for two relays (R=2) and different
numbers of transmitted packets per source (m’) and per relay (rt) ............................ 117
Figure 7.5 Throughput vs. probability of link error as a function of the number of relays ......... 118
Figure 7.6 Throughput vs. probability of link error as a function of the number of relays and
the number of sinks .................................................................................................... 118
Figure 8.1 Overview of Diversity Coding OFDM ....................................................................... 120
Figure 8.2 Comparison between single carrier transmission and OFDM .................................... 122
Figure 8.3 System with DC–OFDM in vivo communication links ........................ 124
Figure 8.4 Schematic to implement DC–OFDM in vivo communication links ........................... 127
Figure 8.5 Performance of DC – OFDM system for an OFDM-QPSK ................. 127
Figure 8.6 Performance of DC – OFDM system for an OFDM-QPSK with
probaility of link error equal to 10-2
........................................................................... 128
Figure 8.7 Performance of DC – OFDM system for an OFDM-QPSK as a
function of the Eb/N0 .................................................................................................. 129
Figure 9.1 Protocol Data Unit (PPDU) frame format [79]........................................................... 132
x
Figure 9.2 OFDM block diagram ................................................................................................. 134
Figure 9.3 (a) Non-WNC multihop system and (b) WCN multihop system [82] ........................ 139
Figure 9.4 Rate diverse Network Coding [88] ............................................................................. 141
Figure 9.5 DC–OFDM communication system ........................................................................... 145
Figure 9.6 System with DC–OFDM communication links (Transmitter) ............. 146
Figure 9.7 System with DC–OFDM communication links (Receiver) .................. 147
Figure 9.8 DC – OFDM block diagram ....................................................................................... 150
Figure 9.9 DC – OFDM communication links ..................................................... 151
Figure 9.10 Performance of a DC – OFDM system as a function of the number
of subcarriers ............................................................................................................. 156
Figure 9.11 Performance of a DC – OFDM system for a probability of link
error pser of 10–3
......................................................................................................... 156
Figure 9.12 Performance of a DC – OFDM system for a probability of link
error pser of 10–1
......................................................................................................... 157
Figure 9.13 Performance of DC – OFDM system for an OFDM-QPSK in a
multi-path channel for various relative speeds .......................................................... 158
xi
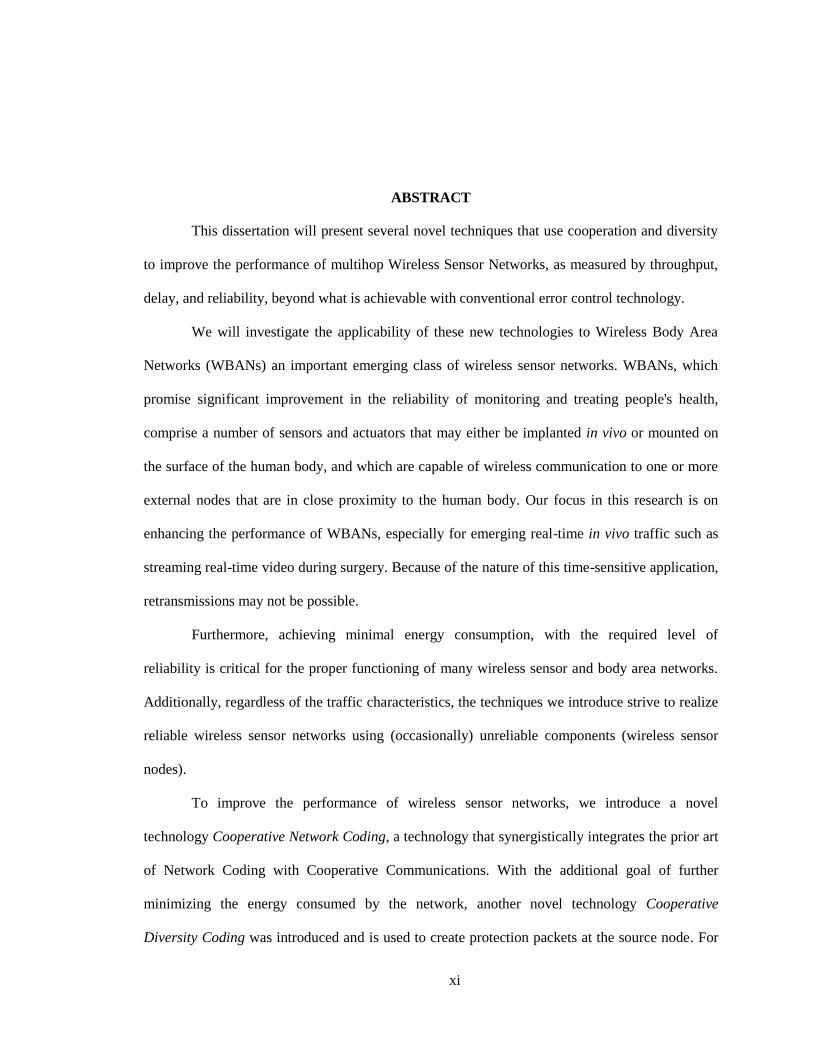
ABSTRACT
This dissertation will present several novel techniques that use cooperation and diversity
to improve the performance of multihop Wireless Sensor Networks, as measured by throughput,
delay, and reliability, beyond what is achievable with conventional error control technology.
We will investigate the applicability of these new technologies to Wireless Body Area
Networks (WBANs) an important emerging class of wireless sensor networks. WBANs, which
promise significant improvement in the reliability of monitoring and treating people's health,
comprise a number of sensors and actuators that may either be implanted in vivo or mounted on
the surface of the human body, and which are capable of wireless communication to one or more
external nodes that are in close proximity to the human body. Our focus in this research is on
enhancing the performance of WBANs, especially for emerging real-time in vivo traffic such as
streaming real-time video during surgery. Because of the nature of this time-sensitive application,
retransmissions may not be possible.
Furthermore, achieving minimal energy consumption, with the required level of
reliability is critical for the proper functioning of many wireless sensor and body area networks.
Additionally, regardless of the traffic characteristics, the techniques we introduce strive to realize
reliable wireless sensor networks using (occasionally) unreliable components (wireless sensor
nodes).
To improve the performance of wireless sensor networks, we introduce a novel
technology Cooperative Network Coding, a technology that synergistically integrates the prior art
of Network Coding with Cooperative Communications. With the additional goal of further
minimizing the energy consumed by the network, another novel technology Cooperative
Diversity Coding was introduced and is used to create protection packets at the source node. For

xii
representative applications, optimized Cooperative Diversity Coding or Cooperative Network
Coding achieves ≥25% energy savings compared to the baseline Cooperative Network Coding
scheme. Cooperative Diversity Coding requires lees computational complexity at the source node
compared to Cooperative Network Coding.
To improve the performance and increase the robustness and reliability of WBANs, two
efficient feedforward error-control technologies, Cooperative Network Coding (CDC) and
Temporal Diversity Coding (TDC), are proposed. Temporal Diversity Coding applies Diversity
Coding in time to improve the WBAN's performance. By implementing this novel technique, it is
possible to achieve significant improvement (~50%) in throughput compared to extant WBANs.
An example of an implementation of in vivo real-time application, where TDC can improve the
communications performance, is the MARVEL (Miniature Anchored Robotic Videoscope for
Expedited Laparoscopy) research platform developed at USF.
The MARVEL research platform requires high bit rates (~100 Mbps) for high-definition
transmission. Orthogonal Frequency Division Multiplexing (OFDM), a widely used technology
in fourth generation wireless networks (4G) that achieves high transmission rates over dispersive
channels by transmitting serial information through multiple parallel carriers. Combining
Diversity Coding with OFDM (DC–OFDM) promises high reliability communications while
preserving high transmission rates. Most of the carriers transport original information while the
remaining (few) carriers transport diversity coded (protection) information.
The impact of DC–OFDM can extend far beyond in vivo video medical devices and other
special purpose wireless systems and may find significant application in a broad range of ex vivo
wireless systems, such as LTE, 802.11, 802.16.
1
CHAPTER 1. INTRODUCTION
In the 21st century, wireless networks will forever alter how people access information
and will facilitate integration of the physical world with the Internet. According to the Wireless
World Research Forum (WWRF), seven trillion wireless devices will serve seven billion people
by 2020 [1], where all these devices are part of the internet. Wireless technology is rapidly
migrating from communications to a multitude of embedded real-world applications (Cyber
Physical Systems). On average, there will be 1000 wireless devices per person in 2020. However,
this does not necessarily mean that each person will own 1000 wireless devices because most of
the communications will be machine-to-machine communications including sensor related
communication [2]. An example of such an application is automated meter reading where sensor
nodes automatically and periodically (e.g. monthly) read, for example, the water meter or electric
meter at home and transmit that data to a processing center. Another such application is
surveillance or reconnaissance tasks in the military that exploit the rapid deployment of many
wireless sensor nodes. Also, wireless sensor and actuator nodes1 can be installed on or in the
soldier’s body to continuously monitor vital signs, and possibly initiate the actuation of node on
or in the human body when needed, during action in the battlefield.
1.1 Wireless Sensor Networks and Wireless Body Area Networks
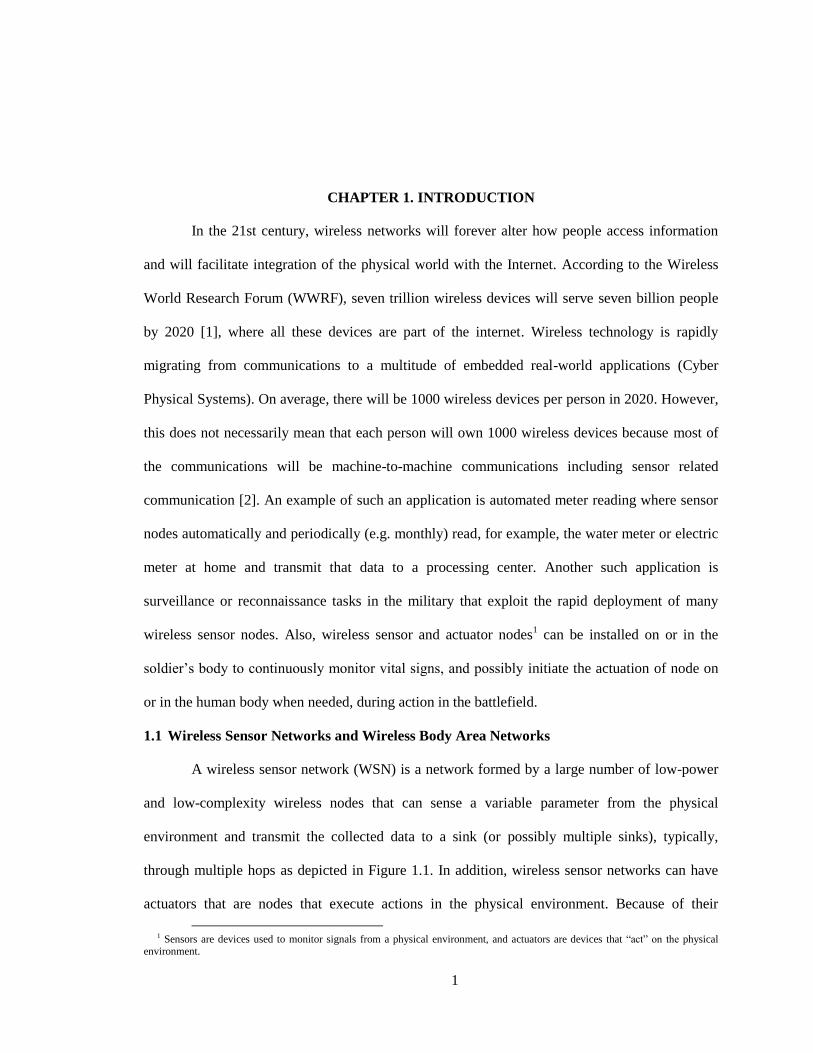
A wireless sensor network (WSN) is a network formed by a large number of low-power
and low-complexity wireless nodes that can sense a variable parameter from the physical
environment and transmit the collected data to a sink (or possibly multiple sinks), typically,
through multiple hops as depicted in Figure 1.1. In addition, wireless sensor networks can have
actuators that are nodes that execute actions in the physical environment. Because of their
1 Sensors are devices used to monitor signals from a physical environment, and actuators are devices that “act” on the physical
environment.
2
inherent functionality, the actuators have higher complexity than the sensors. The main desired
features of this type of network are [3]:
Robustness,
Scalability,
Self-organization,
Extended lifetime,
Low cost and size
Wireless sensor networks can be used for different applications, ranging from military
applications such as enemy intrusion detection and home automation [4].
Figure 1.1 Wireless sensor network
Wireless Body Area Networks (WBANs) are a special purpose wireless sensor networks
that are receiving considerable attention because they can provide ubiquitous real-time
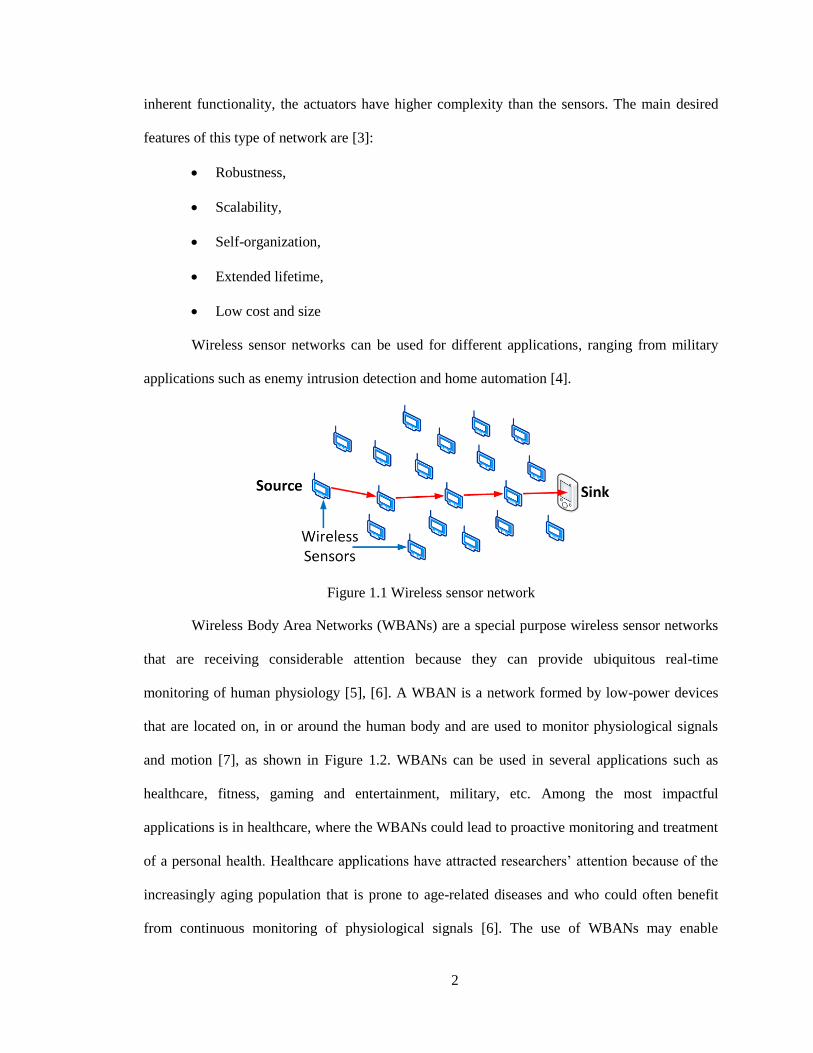
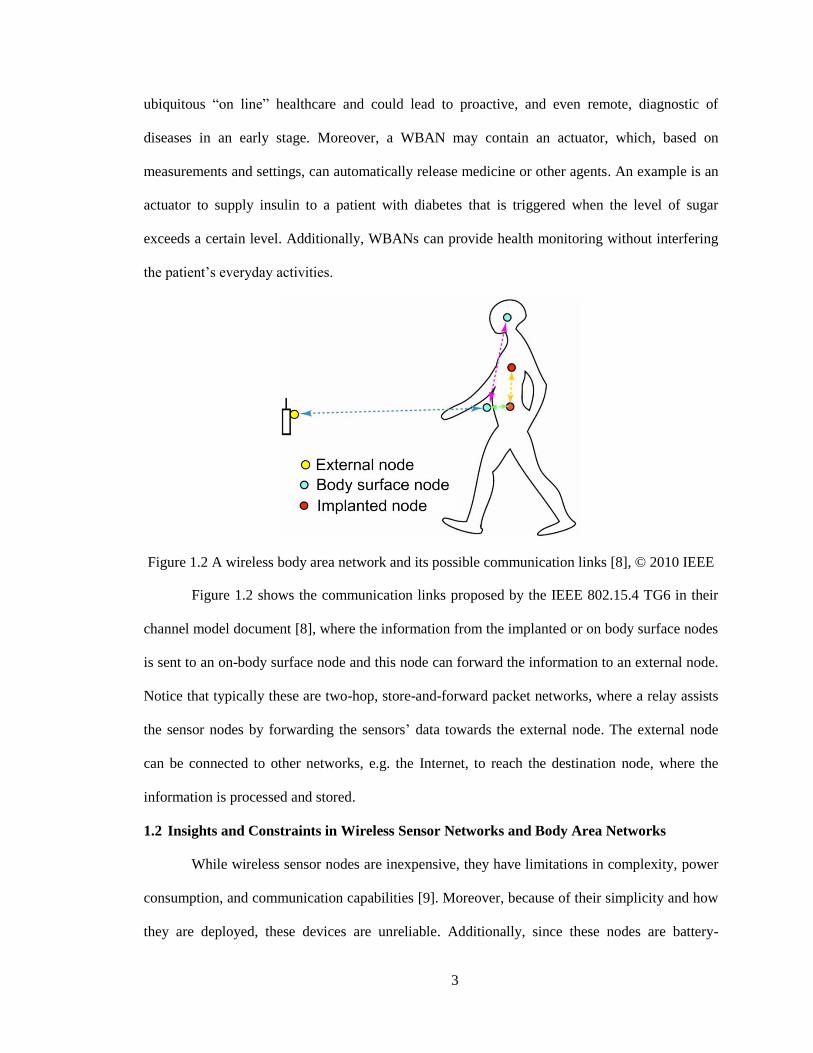
monitoring of human physiology [5], [6]. A WBAN is a network formed by low-power devices
that are located on, in or around the human body and are used to monitor physiological signals
and motion [7], as shown in Figure 1.2. WBANs can be used in several applications such as
healthcare, fitness, gaming and entertainment, military, etc. Among the most impactful
applications is in healthcare, where the WBANs could lead to proactive monitoring and treatment
of a personal health. Healthcare applications have attracted researchers’ attention because of the
increasingly aging population that is prone to age-related diseases and who could often benefit
from continuous monitoring of physiological signals [6]. The use of WBANs may enable
3
ubiquitous “on line” healthcare and could lead to proactive, and even remote, diagnostic of
diseases in an early stage. Moreover, a WBAN may contain an actuator, which, based on
measurements and settings, can automatically release medicine or other agents. An example is an
actuator to supply insulin to a patient with diabetes that is triggered when the level of sugar
exceeds a certain level. Additionally, WBANs can provide health monitoring without interfering
the patient’s everyday activities.
Figure 1.2 A wireless body area network and its possible communication links [8], © 2010 IEEE
Figure 1.2 shows the communication links proposed by the IEEE 802.15.4 TG6 in their
channel model document [8], where the information from the implanted or on body surface nodes
is sent to an on-body surface node and this node can forward the information to an external node.
Notice that typically these are two-hop, store-and-forward packet networks, where a relay assists
the sensor nodes by forwarding the sensors’ data towards the external node. The external node
can be connected to other networks, e.g. the Internet, to reach the destination node, where the
information is processed and stored.
1.2 Insights and Constraints in Wireless Sensor Networks and Body Area Networks
While wireless sensor nodes are inexpensive, they have limitations in complexity, power
consumption, and communication capabilities [9]. Moreover, because of their simplicity and how
they are deployed, these devices are unreliable. Additionally, since these nodes are battery-
4
powered, there is a trade-off between transmission/processing power and operational lifetime,
especially for nodes deployed in inaccessible environments such as the jungle or embedded in
infrastructures such as bridges, where it is very difficult to replace them in case of failure.
Another main parameter in wireless sensor networks is the traffic characteristics (e.g. real-time or
non-real-time). For non-real-time traffic, reliable transmission can be achieved by error detection
and retransmission techniques, such as automatic repeat request (ARQ). However, for real-time
traffic, well-known feedforward techniques such as forward error correction (FEC) at the bit level
[10–12], or relatively new feedforward techniques such as Diversity Coding (DC) [13–15] and
Network Coding (NC) [16–23] at the packet level are more appropriate. Regardless of the traffic
characteristics, the above techniques strive to realize reliable wireless (sensor) networks using
occasionally unreliable components (wireless links and nodes).
In past few years there has been considerable research in Network Coding to address the
need for a simple and efficient method of broadcasting packetized information over a lossy
wireless medium that improves upon the traditional method retransmission of errored or lost
packets. Traditionally, information transmission is accomplished by forwarding, or routing, the
data generated from the transmitting node through the intermediate nodes to the destination node.
For example if node and want to communicate with each other through node , A sends a
packet to and forwards to . When wants to transmit a packet , sends to
and then forwards to . This method requires 4 transmissions for message transfer between
and . In the case of multihop networks, this method increases the number of transmissions
needed for the message transfer between the two nodes resulting in increased congestion and
reduced throughput. Also, if one of the transmitted packets is lost in the intermediate nodes, the
data needs to be retransmitted from the source node. However, with Network Coding, the
intermediate nodes combine the received packets, create coded packets and send these coded
packets towards the destination. The received coded packets are then decoded to recover the
original data. As with the previous example, if and wants to communicate, sends packet
5
to and sends packet to . Now, upon receiving both packets and , it XORs the
received packets and sends the XORed packet to both and . By correctly receiving this
XORed packet, and can recover each other’s packet by XORing the received packet with its
own (transmitted) packet. In this way, the number of transmissions between and is reduced to
3 instead of 4 as in previous case. Because fewer transmissions are required, the throughput
increases. This method also increases the reliability of the network. These features are attractive
to increase the performance of different type of networks, especially for those who transport real-
time traffic and where with high reliability is required because, for example, a wireless body area
network (WBAN) that is monitoring the vital signs of a person, who is in chronic conditions or
emergency situations, must provide high reliability.
Wireless body area networks, similar to the wireless sensor networks, have certain
characteristics/requirements such as low-complexity nodes, limited transmission and processing
power, reduced latency, high reliability, mobility, and operating in a highly lossy and dispersive
radio frequency (RF) channel [24], [25]. In addition to these challenges, wireless body area
nodes, especially in vivo nodes, have a form factor constraint that make WBANs unique when
compared to other networks. The sensor nodes are restricted in complexity and processing power
because of their size and battery limitations. Their transmission power is limited to avoid
hazardous RF radiation to the human body, as well as to extend the node’s battery lifetime.
Moreover, the WBANs must transmit at low power to protect the patients against harmful health
effects associated with the radiofrequency (RF) emissions. Thus, the specific absorption rate
(SAR) should be low [26]. SAR is the rate at which the RF energy is absorbed by a body volume
or mass and has units of watts per kilogram (W/Kg). Due to this limitation on the specific
absorption rate, it is not possible to increase the transmission power beyond a certain level to
overcome the transmission loss or errors of the packets. The radio channel is continuously
changing because the dielectric characteristics of the human tissues and organs are themselves in
continuous variation, due to the movements of the body such as arms, legs, and the movement of
6
internal fluids such blood, which make the channel time varying. Because of these channel
variations, it is a challenge to realize a WBAN with reliable communications among the nodes
[27].
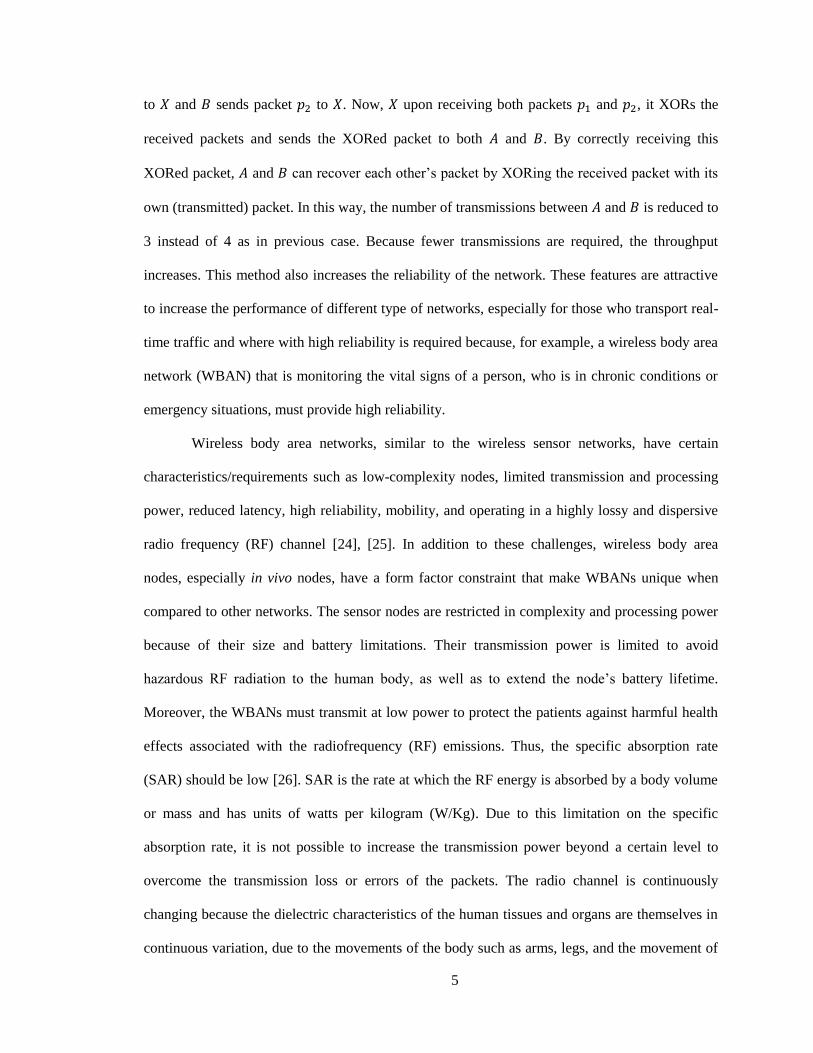
Furthermore, for real-time applications where the caregiver, or decision device, needs to
receive information about the patient’s health on a continuous basis, such as in vivo video
monitoring, the WBANs should provide, among other characteristics, reliable communications
that are relatively insensitive to link or node failures [28]. However, patient mobility increases the
probability of packet loss, and it is preferred that the packet error rate should be kept less than 1%
[29].
1.3 Research Motivation
The editors of the National Academy of Engineering’s publication The Bridge write that
“...Health care delivery today is in turmoil. Despite rapid advances in medical procedures and the
understanding of diseases and their treatment, the efficiency, safety, and cost-effectiveness of the
delivery of health care have not kept pace” [30].
Figure 1.3 Communication links for a wireless body area network ---WBAN
7
Certainly, one critical element for improving the delivery of advanced health care is the
application of technologies that can effectively monitor patient health and/or allow medical
professionals to administer procedures with increased efficiency and reduced invasion. For the
patient, a reduction in the invasiveness of the procedure means less pain/trauma to the body, less
scarring, reduction in healthcare costs, faster recovery, decreased risk of developing
complications after surgery and the opportunity to return to regular daily routines faster.
One possible application of technology in health care delivery that is gaining increased
attention in the research community is the use of wireless technology to allow communication
among near-body, on-body, or even in vivo sensors and actuators. For example, one interesting
concept is the use of a smart phone equipped with the proper application software to manage the
flow of data between a host of biomedical sensors and/or actuators and a central server that can
monitor the data and possibly specify sensor or actuator changes in response to the relayed
observations, as shown in Figure 1.3. Such a capability, enhanced perhaps by using a relay device
or multiple relay devices for improved communication, could allow adaptive drug delivery rates
that are based on observed body chemistry, appliance (canes, artificial limbs or organs) responses
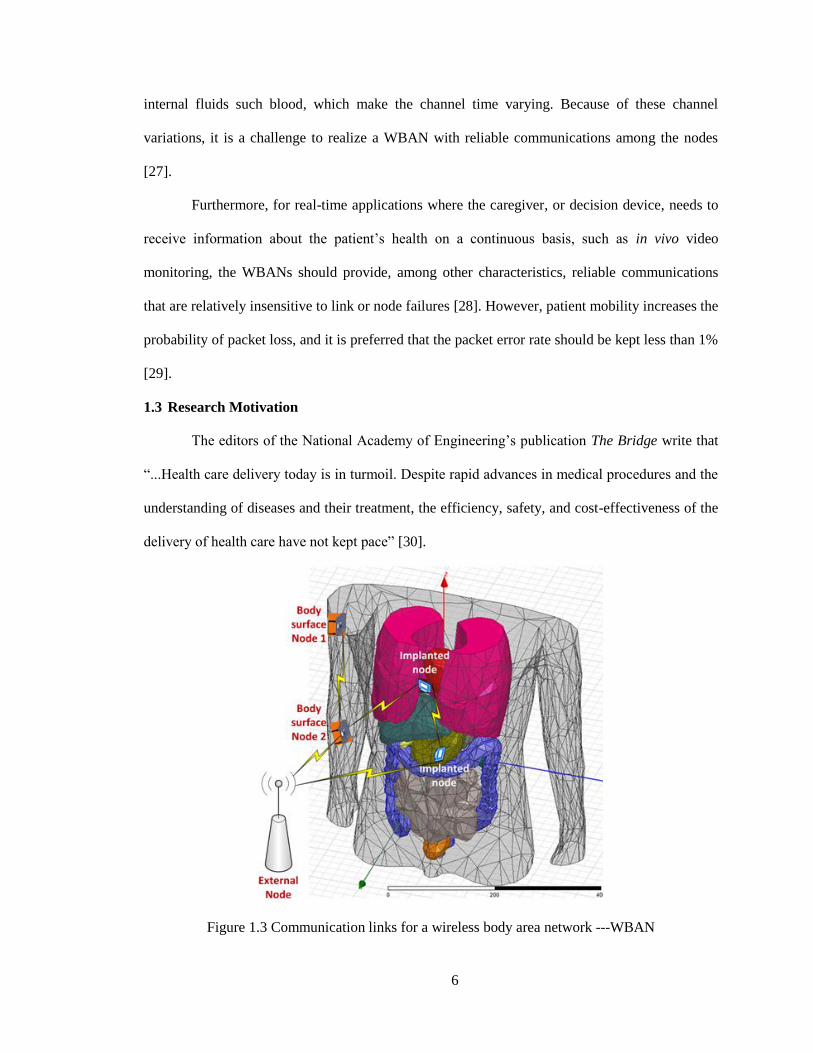
to monitored physical stresses, or manipulation of in vivo sensors and actuators. Furthermore,
allowing reception of high-quality video from implanted nodes or swallowed camera pills [31–
37] could assist not only in disease diagnosis but also in minimally invasive surgeries (MIS). To
utilize and network devices like the MARVEL (Miniature Anchored Robotic Videoscope for
Expedited Laparoscopy) [38] research platform at USF, which is a wireless controlled and
communication in vivo camera module, will need a highly reliable communication system. It is
expected that the novel communication techniques presented in this dissertation, will create a
paradigm shift in minimally invasive surgery (MIS) by freeing trocar ports currently used for
laparoscopes be used by other surgical instruments, as shown in Figure 1.4.
8
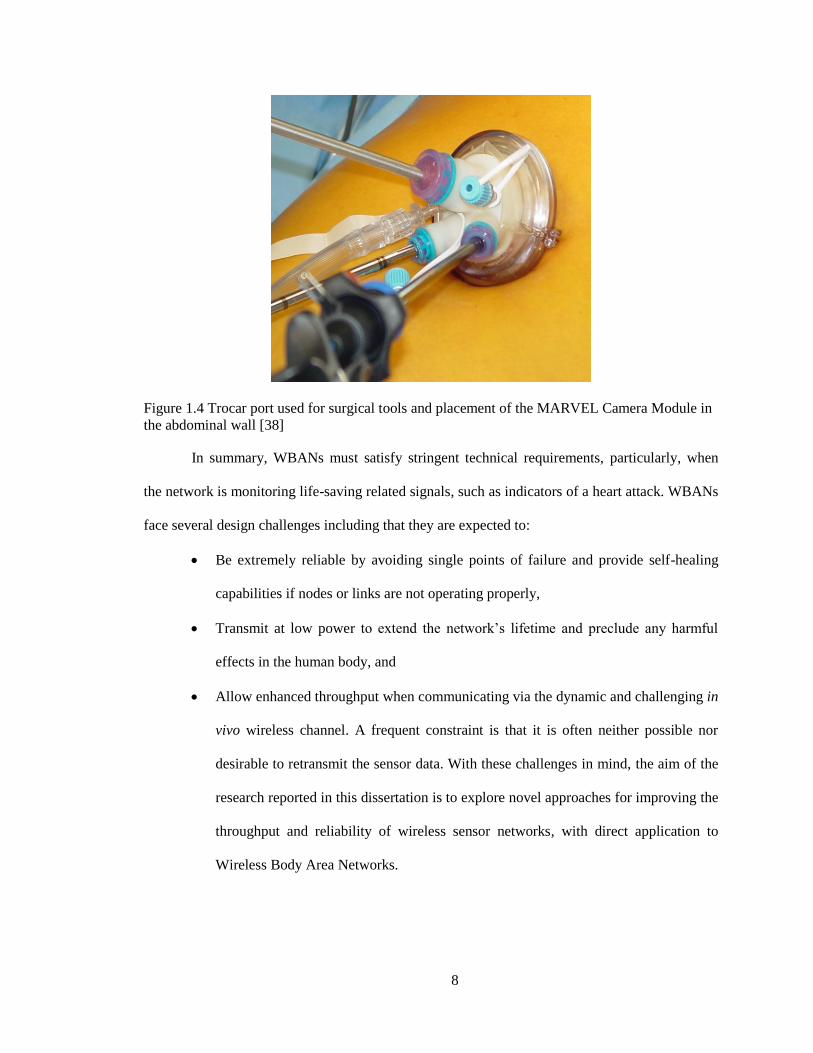
Figure 1.4 Trocar port used for surgical tools and placement of the MARVEL Camera Module in
the abdominal wall [38]
In summary, WBANs must satisfy stringent technical requirements, particularly, when
the network is monitoring life-saving related signals, such as indicators of a heart attack. WBANs
face several design challenges including that they are expected to:
Be extremely reliable by avoiding single points of failure and provide self-healing
capabilities if nodes or links are not operating properly,
Transmit at low power to extend the network’s lifetime and preclude any harmful
effects in the human body, and
Allow enhanced throughput when communicating via the dynamic and challenging in
vivo wireless channel. A frequent constraint is that it is often neither possible nor
desirable to retransmit the sensor data. With these challenges in mind, the aim of the
research reported in this dissertation is to explore novel approaches for improving the
throughput and reliability of wireless sensor networks, with direct application to
Wireless Body Area Networks.
9
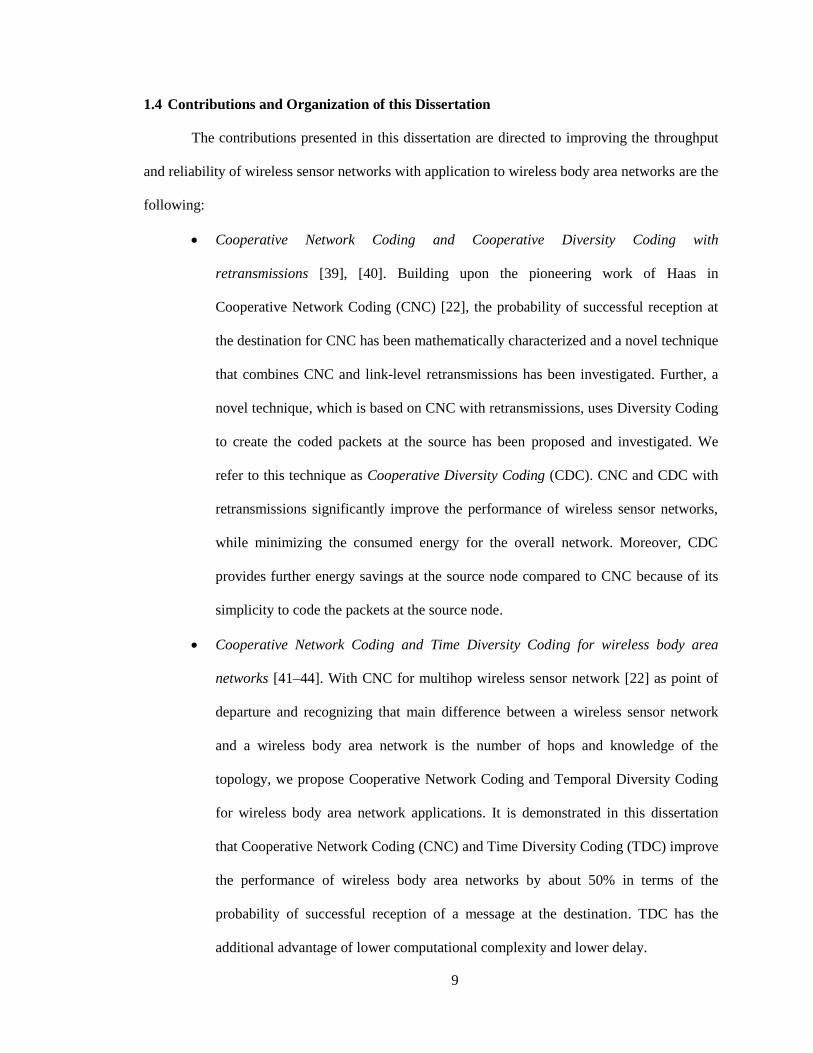
1.4 Contributions and Organization of this Dissertation
The contributions presented in this dissertation are directed to improving the throughput
and reliability of wireless sensor networks with application to wireless body area networks are the
following:
Cooperative Network Coding and Cooperative Diversity Coding with
retransmissions [39], [40]. Building upon the pioneering work of Haas in
Cooperative Network Coding (CNC) [22], the probability of successful reception at
the destination for CNC has been mathematically characterized and a novel technique
that combines CNC and link-level retransmissions has been investigated. Further, a
novel technique, which is based on CNC with retransmissions, uses Diversity Coding
to create the coded packets at the source has been proposed and investigated. We
refer to this technique as Cooperative Diversity Coding (CDC). CNC and CDC with
retransmissions significantly improve the performance of wireless sensor networks,
while minimizing the consumed energy for the overall network. Moreover, CDC
provides further energy savings at the source node compared to CNC because of its
simplicity to code the packets at the source node.
Cooperative Network Coding and Time Diversity Coding for wireless body area
networks [41–44]. With CNC for multihop wireless sensor network [22] as point of
departure and recognizing that main difference between a wireless sensor network
and a wireless body area network is the number of hops and knowledge of the
topology, we propose Cooperative Network Coding and Temporal Diversity Coding
for wireless body area network applications. It is demonstrated in this dissertation
that Cooperative Network Coding (CNC) and Time Diversity Coding (TDC) improve
the performance of wireless body area networks by about 50% in terms of the
probability of successful reception of a message at the destination. TDC has the
additional advantage of lower computational complexity and lower delay.
10
Diversity Coding – Orthogonal Division Frequency Multiplexing [45]. Implementing
Diversity Coding in OFDM-based systems provides reliable communication that is
quite tolerant of link failures, since the data and protection lines are transmitted via
multiple sub-channels. Moreover, only adding one protection line (subcarrier), DC–
OFDM provides significant performance improvement. Note that DC–OFDM is also
well suited for mobile communications because this type of communications often
has (raw) high symbol error rates.
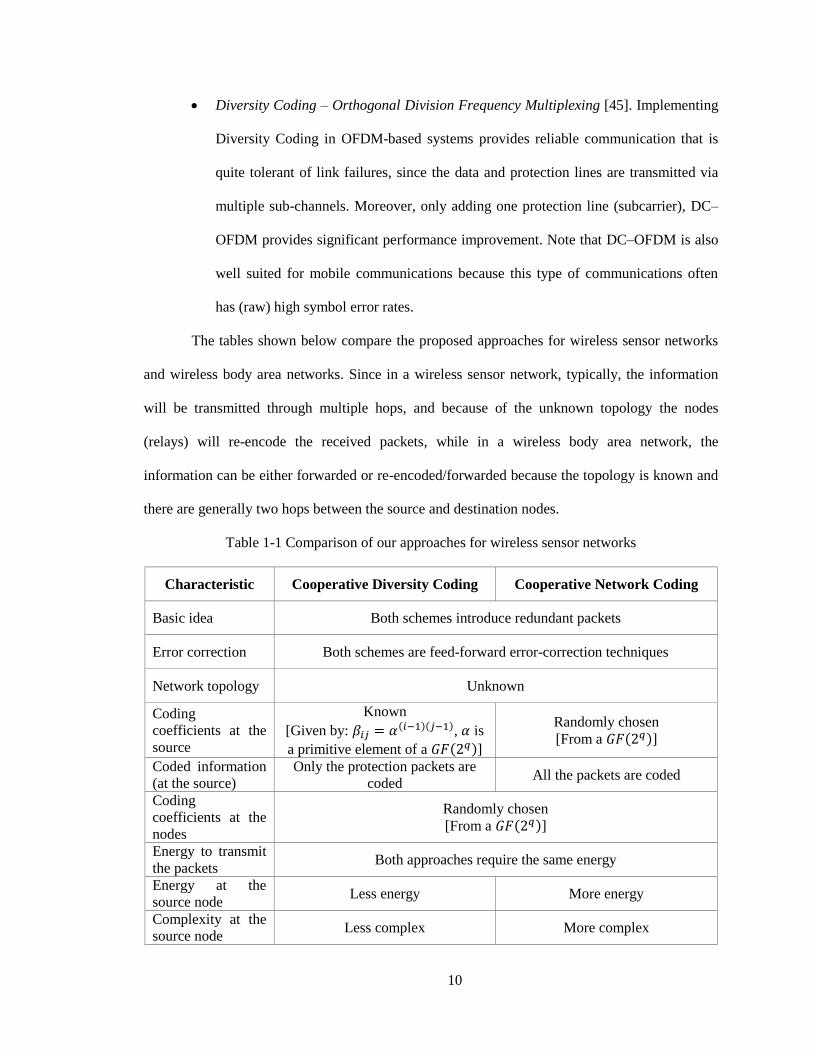
The tables shown below compare the proposed approaches for wireless sensor networks
and wireless body area networks. Since in a wireless sensor network, typically, the information
will be transmitted through multiple hops, and because of the unknown topology the nodes
(relays) will re-encode the received packets, while in a wireless body area network, the
information can be either forwarded or re-encoded/forwarded because the topology is known and
there are generally two hops between the source and destination nodes.
Table 1-1 Comparison of our approaches for wireless sensor networks
Characteristic Cooperative Diversity Coding Cooperative Network Coding
Basic idea Both schemes introduce redundant packets
Error correction Both schemes are feed-forward error-correction techniques
Network topology Unknown
Coding
coefficients at the
source
Known
[Given by: , is
a primitive element of a ]
Randomly chosen [From a ]
Coded information
(at the source)
Only the protection packets are
coded All the packets are coded
Coding
coefficients at the
nodes
Randomly chosen [From a ]
Energy to transmit
the packets Both approaches require the same energy
Energy at the
source node Less energy More energy
Complexity at the
source node Less complex More complex
11
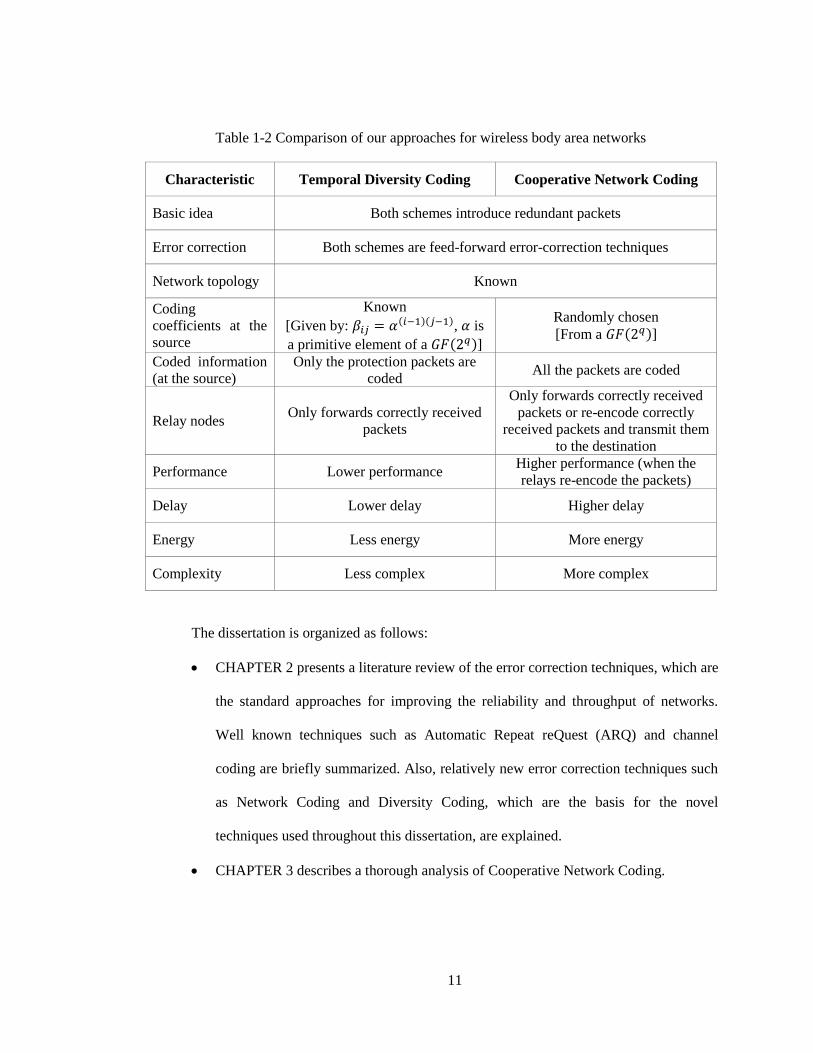
Table 1-2 Comparison of our approaches for wireless body area networks
Characteristic Temporal Diversity Coding Cooperative Network Coding
Basic idea Both schemes introduce redundant packets
Error correction Both schemes are feed-forward error-correction techniques
Network topology Known
Coding
coefficients at the
source
Known
[Given by: , is
a primitive element of a ]
Randomly chosen
[From a ]
Coded information
(at the source)
Only the protection packets are
coded All the packets are coded
Relay nodes Only forwards correctly received
packets
Only forwards correctly received
packets or re-encode correctly
received packets and transmit them
to the destination
Performance Lower performance Higher performance (when the
relays re-encode the packets)
Delay Lower delay Higher delay
Energy Less energy More energy
Complexity Less complex More complex
The dissertation is organized as follows:
CHAPTER 2 presents a literature review of the error correction techniques, which are
the standard approaches for improving the reliability and throughput of networks.
Well known techniques such as Automatic Repeat reQuest (ARQ) and channel
coding are briefly summarized. Also, relatively new error correction techniques such
as Network Coding and Diversity Coding, which are the basis for the novel
techniques used throughout this dissertation, are explained.
CHAPTER 3 describes a thorough analysis of Cooperative Network Coding.

12
Our approaches to improving the performance of wireless sensor networks using
Network Coding and/or Diversity Coding and cooperation with retransmissions,
while minimizing energy consumption is presented in CHAPTER 4.
CHAPTER 5 describes a novel Cooperative Network Coding approach to reliable
single source – single destination wireless body area networks.
A new approach to apply Diversity Coding in wireless body area networks, Temporal
Diversity Coding, is described in CHAPTER 6.
CHAPTER 7 describes novel Cooperative Network Coding approaches to reliable
multiple source – multiple receivers wireless body area networks.
A novel technique Diversity Coding - Orthogonal Frequency Division Multiplexing
(DC–OFDM) is shown to improve the reliability of in vivo video wireless devices
and is presented in CHAPTER 8.
CHAPTER 9 describes the performance of Diversity Coding - Orthogonal Frequency
Division Multiplexing (DC–OFDM) in a vehicular environment to demonstrate its
broader impact to a wide range of networks. Finally,
CHAPTER 10 summarizes the research contributions in this dissertation
(Chapters 3 to 9), along with recommendations for future work.
13
CHAPTER 2. LITERATURE REVIEW
2.1 Introduction
The aim of wireless communication systems is to reliably transport data from one node to
another under certain conditions. In unreliable communication channels, transmission errors are
very likely because of the channel impairments, e.g. noise. Errors can occur in different forms
such as isolated single bit error caused by thermal noise or burst errors because of deep fades on
wireless channels. To make a transmission over these channels reliable, error detection and
correction techniques are implemented. These error detection and correction techniques can be
done in a systematic and non-systematic manner. In a systematic manner, the original message is
not encoded. The parity bits, which are derived from the data bits, are attached to the original data
and transmitted. In non-systematic scheme the original message is encoded and transmitted. For
wireline channels, where the errors are less likely, error detection techniques could be sufficient.
But for wireless channels, where the error rate is very high, error correction techniques are
required.
This dissertation is focused on error correction techniques at packet level. That is,
Diversity Coding [13] and Network Coding [16] are emphasized and investigated in this
document. A summary of error detection and error correction techniques is presented below:
2.2 Error Detection Techniques
Error detection techniques [11] work by adding redundant bits to the data and detecting
the error caused during the transmission from the transmitter to the receiver. There are three
different schemes for error detection: Parity, Checksum, and Cyclic Redundancy Check (CRC).

14
2.2.1 Parity
In this technique, a single bit called the parity bit is added to the original data. The parity
bit value is chosen in such a way to make the number of 1 bit in the codeword to be even or odd.
This technique has the capacity to detect single bit error because its minimum Hamming distance
is 2. When the errors are in burst, this scheme is unreliable. The reliability can be improved by
using interleaving techniques in the presence of burst errors.
2.2.2 Checksum
A group of parity bits or check bits are called checksum. They are represented as the
compliment of modulo arithmetic sum of the codeword. Checksum is placed at the end of the
message and transmitted. In the receiver, the errors are detected by summing the received
codeword. If the output is 0, there is no error. Otherwise, error is detected. This is very simple
and efficient method of error detection but the problem with this method is that it does not detect
errors when the message is swapped or when the 0 data is added or deleted in the message.
2.2.3 Cyclic Redundancy Check
Cyclic Redundancy Check (CRC) is also known as polynomial code because bit
frames are represented as coefficients of polynomial ranging from to . The sender and
receiver know the generator polynomial that has a degree denoted by . With check bits,
CRC can detect burst errors of length less than or equal to bits. Even though, CRC requires
more calculations, it is easy to implement in hardware and is widely used.
2.3 Error Correction Techniques
These techniques allow reconstructing the original (source) information at the
destination/receiver when errors had been introduced during transmission over unreliable
channels. Error correction can be performed either in a feedforward manner, by adding extra bits
to the original information, or in a feedback manner, by retransmitting the packets that are in
error. Feedforward techniques are preferred for real-time applications because extra information
is already transmitted and, ideally, no retransmission of the information is required. However,
15
since the communications channel is not deterministic, there will be times that the extra
information will not be needed because no errors occur. In these cases, feedback techniques such
as retransmissions are preferred.
Feedforward error correction techniques can be implemented at packet, byte or bit levels,
while feedback error correction techniques, Automatic Repeat request (ARQ), are typically
implemented at packet (frame) level.
2.3.1 Forward Error Correction (at the bit level)
Error correction codes or Forward error correction codes [10–12], [46], [47] use parity
bits (redundancy bits) for each block of the message so that the receiver can recover the original
data. Since this is a feedforward technique, it does not request retransmission and is well-suited
for one-way communication systems like broadcasting and real-time applications where
retransmissions are not suitable. There are two main error correction codes groups: linear block
codes and convolution codes.
2.3.1.1 Linear Block Codes
In the linear block codes, the check/parity bits are formed as a linear function (XOR) of
data bits. The most widely used linear block code is Reed Solomon (RS) codes [12]. They are
widely used to correct burst errors. So they work on blocks rather than bits. The RS coder reads
input message samples and writes coded output samples where – and is the number
of bits per symbol. The parity symbols are and the coding rate is
.
The number of errors that the coder can correct is given by:
⌊
⌋ ⌊
⌋ ( 2–1 )
The parity symbols are calculated in the Galois Field . Given a message sequence
in the form of polynomial whose coefficients are taken from the finite field with
elements, then the codeword is constructed as , where is the generator
polynomial of the code. The received codeword is compared with the transmitted codeword. The
16
received codeword has an error polynomial along with the transmitted code word, i.e.
. So, to identify the error value and location of error , syndromes are
used. Syndromes can be represented as sum of product of and for { }. If
the syndrome is not equal to zero then there is error. Thus, the roots of error location polynomial
indicate the position of error and the error is corrected.
2.3.1.2 Convolutional Codes
This code is good for handling isolated errors. They work on bit by bit basis. The output
bit is based on the current and previous input bits. The constraint length tells the number of
previous bits the output should depend upon. The encoder has shift registers to encode the
information bits to coded bits at code rate of
based on constraint length .
The output is generated as XOR sum of inputs and internal states. The decoding is done
using Viterbi algorithm which considers the input sequence with fewer errors as most likely to be
the original message.
2.3.2 Hybrid Techniques
Hybrid ARQ [48], [49] is error correction mechanism that combines both ARQ and
Forward error correction coding (FEC). They are mainly used in high-speed downlink and uplink
packet access (HSDPA/HSUPA). FEC is used for correcting certain amount of errors using
redundancy bits, while ARQ is used for correcting errors that cannot be corrected by FEC using
retransmissions. Hybrid ARQ combines these two methods and outperforms ordinary ARQ
method in poor signal conditions. In the standard ARQ scheme, the redundancy bits (parity bits)
in the form of error detection codes are added to the message bits and then transmitted.
While in hybrid ARQ, the message bits are encoded using FEC and parity bits are either
added to the encoded bits before transmission or sent separately when error is detected in the
receiver. The hybrid ARQ can be explained in two ways. One is simple hybrid ARQ and the other
is hybrid ARQ with soft combining.
17
2.3.2.1 Simple Hybrid ARQ:
They are of two types: Type I and Type II hybrid ARQ.
Type I HARQ: The FEC redundant bits and error detection in the form of parity bits
are added to the message bits before transmitting the data. The FEC encoded bits are
first decoded at the receiver and the transmission errors are corrected at good channel
conditions. When channel quality is poor, and when the errors cannot be corrected, it
discards the packet and the receiver requests for new retransmission of erroneous
data until the correct data is received. Type I is not efficient when the channel quality
is good since there is channel capacity loss in transmission of FEC along with
message bits. This is because FEC has more redundant bits than the message bit
length.
Type II HARQ: In this method, the message bits are first transmitted with error
detecting parity bits. In the receiver if there is no error in transmission then the FEC
bits are not sent. If there is error in transmission then the FEC bits are sent along with
error detection. If there is transmission error, error correction is done by combining
the two received information bits. Type II HARQ does not suffer from capacity loss
under good signal conditions since FEC is not transmitted with message bits. This
method also has good sensitivity under poor signal conditions.
2.3.2.2 Hybrid ARQ with Soft Combining
The incorrectly received data blocks in the receiver are not discarded. They are combined
with retransmitted data block to get enough information for correct decoding. This is called
Hybrid ARQ with soft combining [50]. The two main soft combining methods are Chase
combining and Incremental redundancy.
Chase combining: The coded data that is sent during the first transmission is sent
repeatedly during the retransmissions. So, the retransmitted data contains the same
data bits and parity bits as the original transmitted data. The receiver decodes the
18
information by combining the received bits with retransmitted bits using Maximum
ratio combining.
Incremental redundancy: This method does not have the same retransmission
information as original transmitted message. For the same set of information bits,
multiple set of coded bits are generated. Thus every retransmission uses coded bit set
(relevant to the information bits) that are different from previous transmission by
puncturing. The receiver decodes on each retransmission by gaining some extra
information.
2.3.3 Forward Error Correction Techniques at the Packet Level
Diversity Coding and Network Coding are two feed-forward error correction techniques
at packet level and are the main techniques investigated throughout this dissertation to improve
the reliability of wireless sensor networks with emphasis on wireless body area networks. The
following two sections describe in detail the advantages of these techniques and how they work.
2.4 Diversity Coding
Diversity Coding [13–15] is a feed-forward spatial diversity technology that
enables near instant self-healing and fault-tolerance in the presence of wireless link failures. The
protection paths carry information that is the combination of the uncoded data lines .
Figure 2.1 shows a Diversity Coding system that uses a spatial parity check code for a point-to-
point system with data lines and protection line. If any of the data lines fail (e.g. ), through
the protection line , the destination (receiver) can recover the information of the data line that
was lost by taking the mod 2 sum of all of the received signals. This model can be
generalized to a – – Diversity Coding system as shown in [13].
A network is transparently self–healed when any combination of links survive among
diverse links. This technique is very efficient without the necessity of having the packets
reroute in other directions.

19
Figure 2.1 for Diversity Coding system [13]
Assuming there are links in the network, to be the information carrying bits in the
binary form and there is an extra line present to protect the network from fading or other failures.
( 2–2 )
⨁
( 2–3 )
where represents the XOR function and the extra line carries the checksum . If any
one of the lines between 1 and fails, then the receiver detects the line/channel with failure and
obtains :
⨁
( 2–4 )
According to Eq. ( 2–4 ), the estimated unknown variable can be calculated from the
logical XOR function performed on all the variables from to , except . After expanding
( 2–3 ), it is easy to obtain the information of the failed line as and .
⨁
⨁
( 2–5 )
Expanding Eq. ( 2–5 ), we have:
( 2–6 )
20
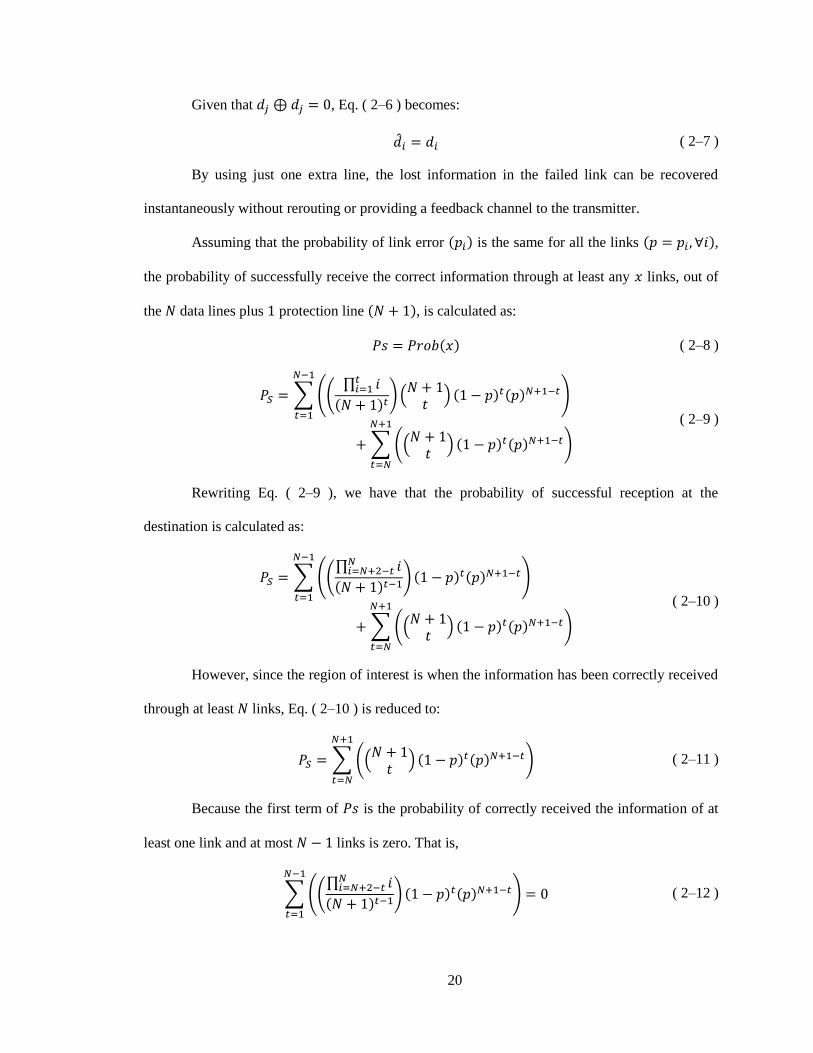
Given that , Eq. ( 2–6 ) becomes:
( 2–7 )
By using just one extra line, the lost information in the failed link can be recovered
instantaneously without rerouting or providing a feedback channel to the transmitter.
Assuming that the probability of link error is the same for all the links ,
the probability of successfully receive the correct information through at least any links, out of
the data lines plus protection line , is calculated as:
( 2–8 )
∑ ((∏
)(
) )
∑ ((
) )
( 2–9 )
Rewriting Eq. ( 2–9 ), we have that the probability of successful reception at the
destination is calculated as:
∑ ((∏
) )
∑ ((
) )
( 2–10 )
However, since the region of interest is when the information has been correctly received
through at least links, Eq. ( 2–10 ) is reduced to:
∑ ((
) )
( 2–11 )
Because the first term of is the probability of correctly received the information of at
least one link and at most links is zero. That is,
∑ ((∏
) )
( 2–12 )
21
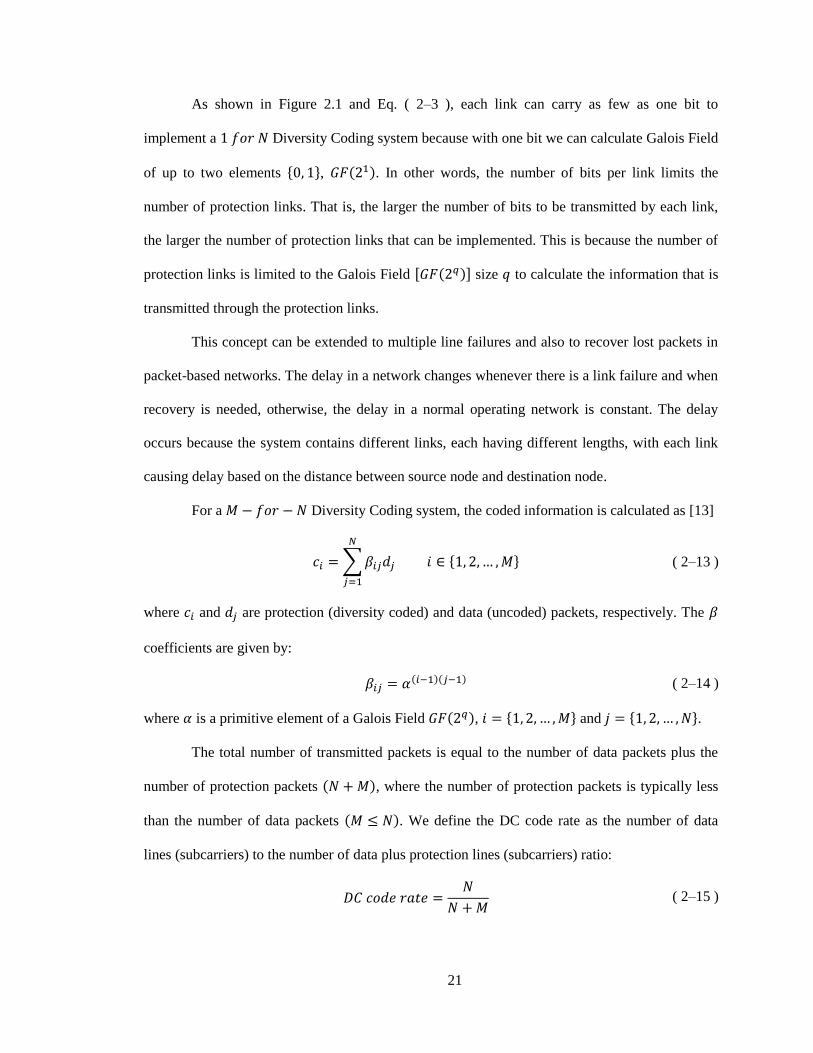
As shown in Figure 2.1 and Eq. ( 2–3 ), each link can carry as few as one bit to
implement a Diversity Coding system because with one bit we can calculate Galois Field
of up to two elements { }, . In other words, the number of bits per link limits the
number of protection links. That is, the larger the number of bits to be transmitted by each link,
the larger the number of protection links that can be implemented. This is because the number of
protection links is limited to the Galois Field [ ] size to calculate the information that is
transmitted through the protection links.
This concept can be extended to multiple line failures and also to recover lost packets in
packet-based networks. The delay in a network changes whenever there is a link failure and when
recovery is needed, otherwise, the delay in a normal operating network is constant. The delay
occurs because the system contains different links, each having different lengths, with each link
causing delay based on the distance between source node and destination node.
For a Diversity Coding system, the coded information is calculated as [13]
∑
{ } ( 2–13 )
where and are protection (diversity coded) and data (uncoded) packets, respectively. The
coefficients are given by:
( 2–14 )
where is a primitive element of a Galois Field , { } and { }.
The total number of transmitted packets is equal to the number of data packets plus the
number of protection packets , where the number of protection packets is typically less
than the number of data packets . We define the DC code rate as the number of data
lines (subcarriers) to the number of data plus protection lines (subcarriers) ratio:
( 2–15 )
22
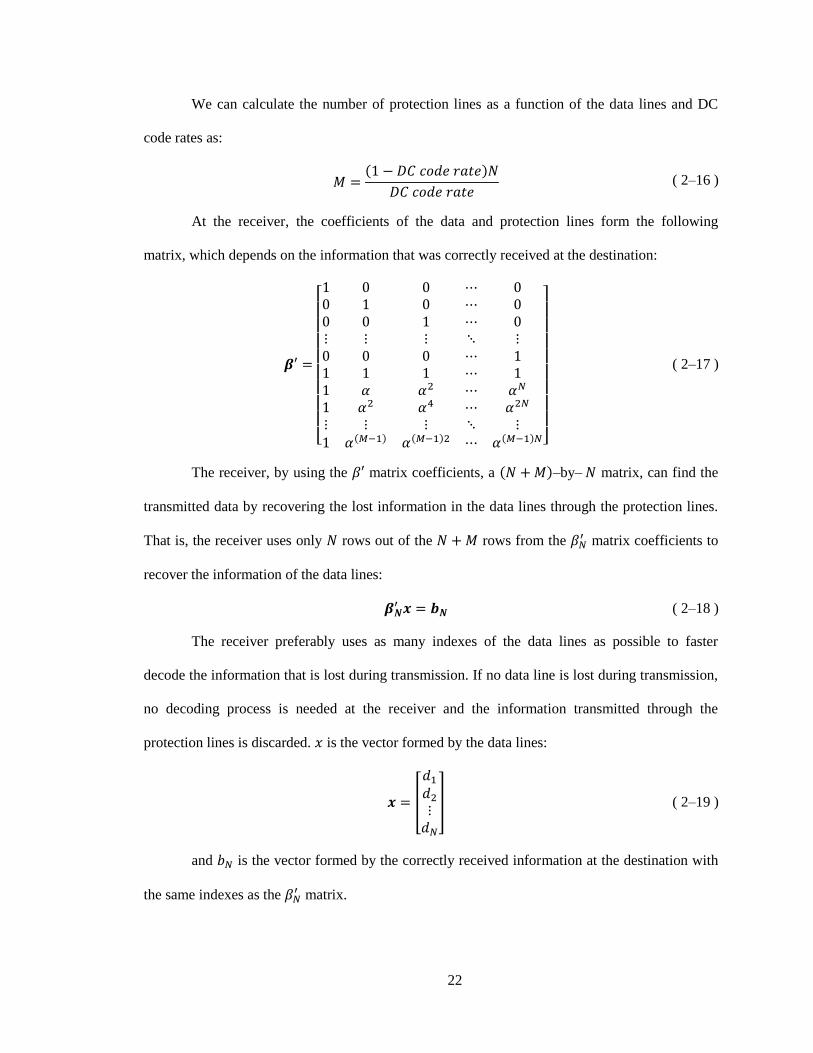
We can calculate the number of protection lines as a function of the data lines and DC
code rates as:
( 2–16 )
At the receiver, the coefficients of the data and protection lines form the following
matrix, which depends on the information that was correctly received at the destination:
[
]
( 2–17 )
The receiver, by using the matrix coefficients, a –by– matrix, can find the
transmitted data by recovering the lost information in the data lines through the protection lines.
That is, the receiver uses only rows out of the rows from the matrix coefficients to
recover the information of the data lines:
( 2–18 )
The receiver preferably uses as many indexes of the data lines as possible to faster
decode the information that is lost during transmission. If no data line is lost during transmission,
no decoding process is needed at the receiver and the information transmitted through the
protection lines is discarded. is the vector formed by the data lines:
[
] ( 2–19 )
and is the vector formed by the correctly received information at the destination with
the same indexes as the matrix.
23
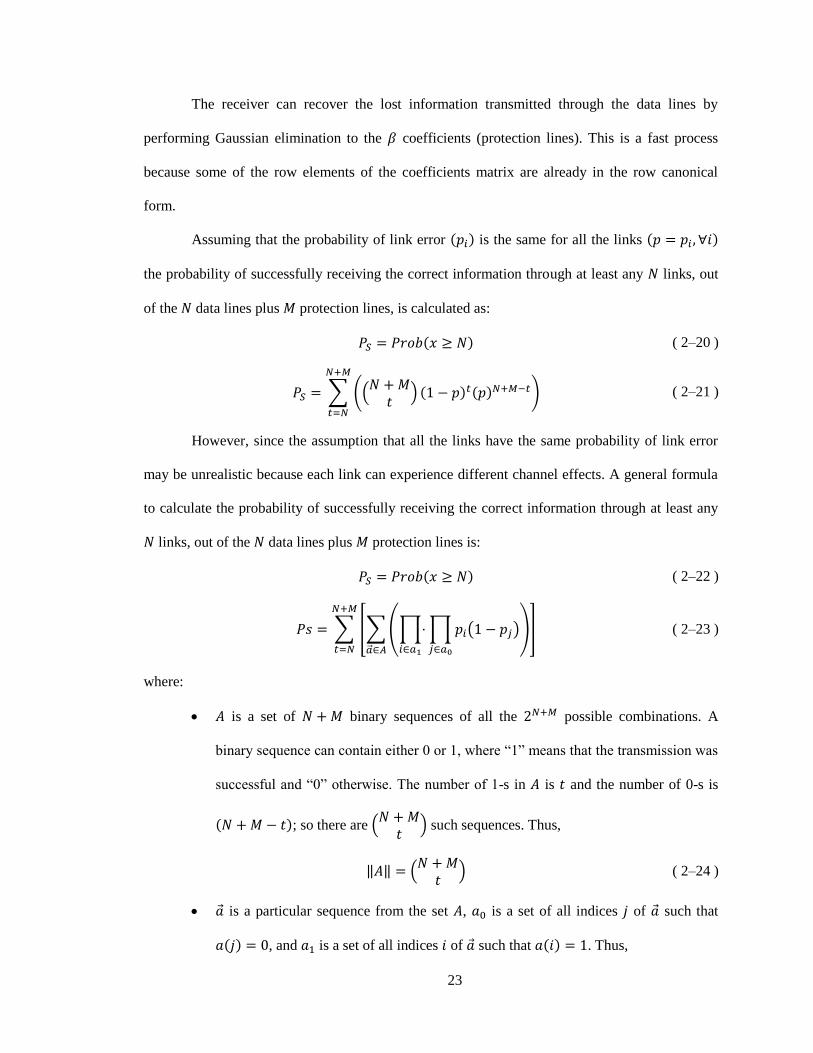
The receiver can recover the lost information transmitted through the data lines by
performing Gaussian elimination to the coefficients (protection lines). This is a fast process
because some of the row elements of the coefficients matrix are already in the row canonical
form.
Assuming that the probability of link error is the same for all the links
the probability of successfully receiving the correct information through at least any links, out
of the data lines plus protection lines, is calculated as:
( 2–20 )
∑ ((
) )
( 2–21 )
However, since the assumption that all the links have the same probability of link error
may be unrealistic because each link can experience different channel effects. A general formula
to calculate the probability of successfully receiving the correct information through at least any
links, out of the data lines plus protection lines is:
( 2–22 )
∑ [∑(∏
∏ ( )
)
]
( 2–23 )
where:
is a set of binary sequences of all the possible combinations. A
binary sequence can contain either 0 or 1, where “1” means that the transmission was
successful and “0” otherwise. The number of 1-s in is and the number of 0-s is
; so there are (
) such sequences. Thus,
‖ ‖ (
) ( 2–24 )
is a particular sequence from the set , is a set of all indices of such that
, and is a set of all indices of such that . Thus,
24
‖ ‖ ‖ ‖ ( 2–25 )
is the probability that the information transmitted through subcarrier is correctly
received at the destination.
The expected number of correctly received information packets can be calculated as
in Network Coding as:
( 2–26 )
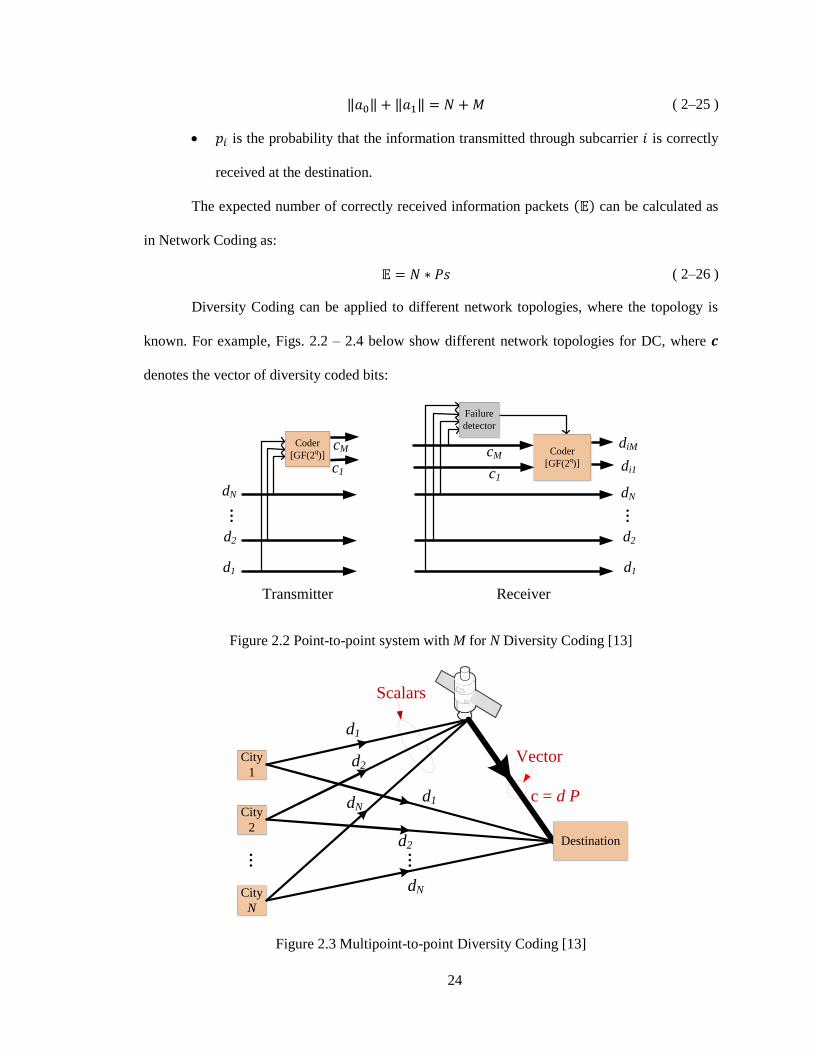
Diversity Coding can be applied to different network topologies, where the topology is
known. For example, Figs. 2.2 – 2.4 below show different network topologies for DC, where
denotes the vector of diversity coded bits:
d1
d2
dN
...
c1
Transmitter
cM
d1
d2
dN
...
diMcM
Failure
detector
Receiver
c1di1
Coder
[GF(2q)]
Coder
[GF(2q)]
Figure 2.2 Point-to-point system with M for N Diversity Coding [13]
City
1
City
2
City
N
d1
d2
dN
...
d1
d2
dN
...
Scalars
Vector
c = d P
Destination
Figure 2.3 Multipoint-to-point Diversity Coding [13]
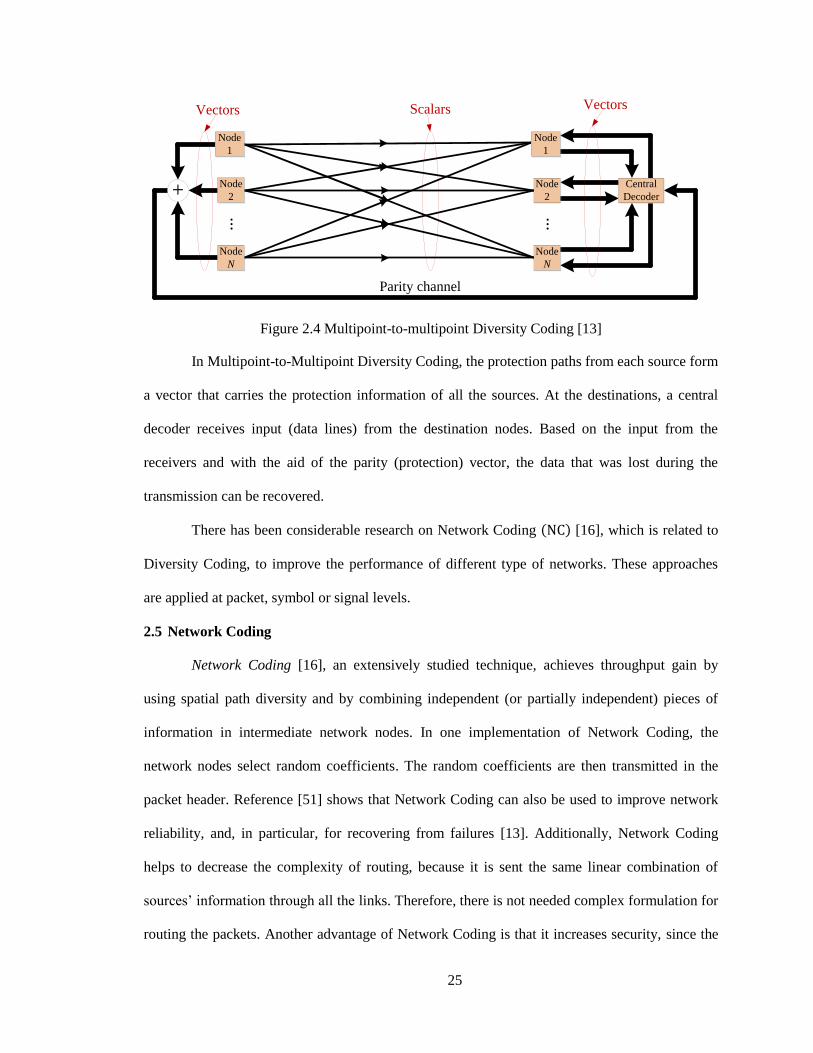
25
Parity channel
...
Scalars
...
Node
1
Node
2
Node
N
Vectors
+ Node
2
Node
N
Node
1
Central
Decoder
Vectors
Figure 2.4 Multipoint-to-multipoint Diversity Coding [13]
In Multipoint-to-Multipoint Diversity Coding, the protection paths from each source form
a vector that carries the protection information of all the sources. At the destinations, a central
decoder receives input (data lines) from the destination nodes. Based on the input from the
receivers and with the aid of the parity (protection) vector, the data that was lost during the
transmission can be recovered.
There has been considerable research on Network Coding [16], which is related to
Diversity Coding, to improve the performance of different type of networks. These approaches
are applied at packet, symbol or signal levels.
2.5 Network Coding
Network Coding [16], an extensively studied technique, achieves throughput gain by
using spatial path diversity and by combining independent (or partially independent) pieces of
information in intermediate network nodes. In one implementation of Network Coding, the
network nodes select random coefficients. The random coefficients are then transmitted in the
packet header. Reference [51] shows that Network Coding can also be used to improve network
reliability, and, in particular, for recovering from failures [13]. Additionally, Network Coding
helps to decrease the complexity of routing, because it is sent the same linear combination of
sources’ information through all the links. Therefore, there is not needed complex formulation for
routing the packets. Another advantage of Network Coding is that it increases security, since the
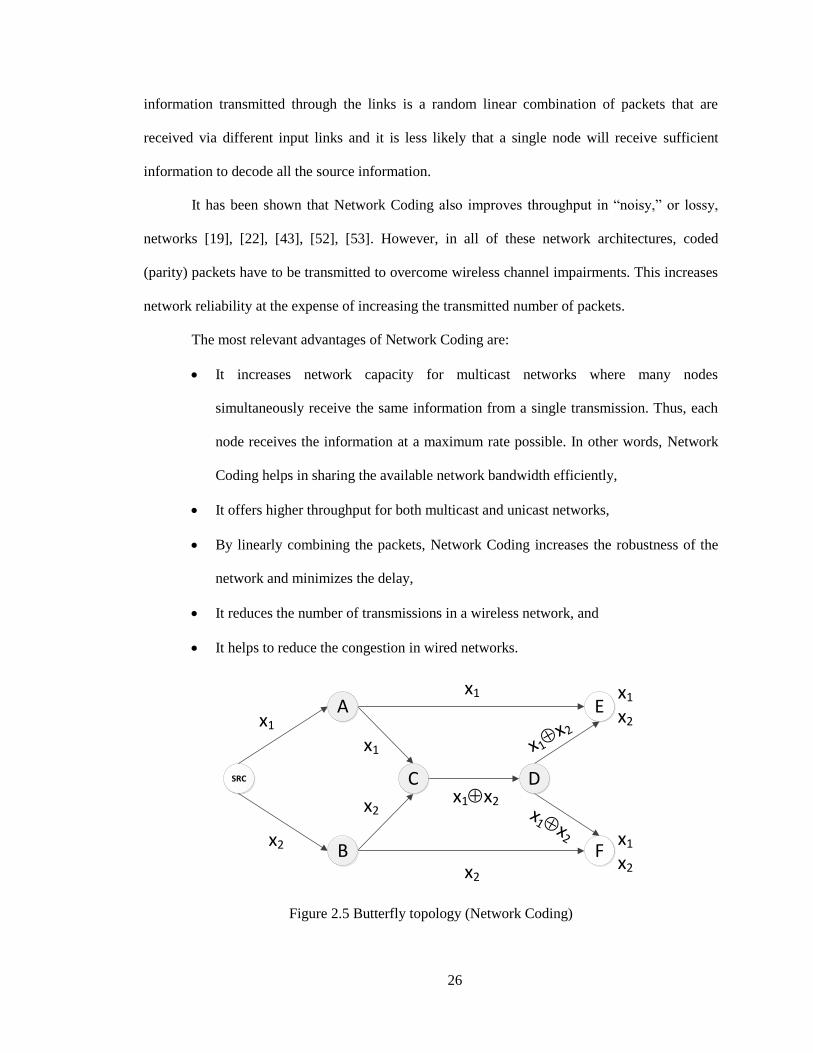
26
information transmitted through the links is a random linear combination of packets that are
received via different input links and it is less likely that a single node will receive sufficient
information to decode all the source information.
It has been shown that Network Coding also improves throughput in “noisy,” or lossy,
networks [19], [22], [43], [52], [53]. However, in all of these network architectures, coded
(parity) packets have to be transmitted to overcome wireless channel impairments. This increases
network reliability at the expense of increasing the transmitted number of packets.
The most relevant advantages of Network Coding are:
It increases network capacity for multicast networks where many nodes
simultaneously receive the same information from a single transmission. Thus, each
node receives the information at a maximum rate possible. In other words, Network
Coding helps in sharing the available network bandwidth efficiently,
It offers higher throughput for both multicast and unicast networks,
By linearly combining the packets, Network Coding increases the robustness of the
network and minimizes the delay,
It reduces the number of transmissions in a wireless network, and
It helps to reduce the congestion in wired networks.
SRC
F
E
x2
x1
x1Åx2
x1
x2
x1
x2
x1Åx2
x1Åx
2
x1
x2
x1
x2
C
B
A
D
Figure 2.5 Butterfly topology (Network Coding)

27
A typical example of the usefulness of Network Coding is shown in Figure 2.5, where the
links are considered error-free. The source transmits the messages, and . The node
receives those two messages, creates a message that is a linear combination of and and
transmits this single message to the node . At the destination nodes, receives the message
from and receives the message from . Additionally, the two destinations receive the
linear combination of the two messages, through . Therefore, each destination can
retrieve the original two messages, and . As opposed to networks without coding, the middle
link could only transmit one of the two messages, and , resulting a bottleneck of the network
the link between nodes and as is in Figure 2.6.
x2x1
x1
x1x2
x1x2
x1x1
x1
x2
x1
x2
B A
SRC
C
D
F E
x2x1
x2
x1x2
x1x2
x2x2
x1
x2
x2
x2
B A
SRC
C
D
F E
Figure 2.6 Traditional network approach (No Network Coding)
2.5.1 Network Coding Approaches
Network Coding can be done in different ways. Each Network Coding approach has its
own advantages and disadvantages. The usage of any Network Coding approach is therefore
mainly dependent on the applications and types of networks. The first approach is linear Network
Coding [23], [54], where one or many outgoing packets are generated by linear combination of
original or coded incoming packets. These linear combination operations such as addition and
multiplication are done over finite fields. Consider that the incoming packets are .
Their associated Galois Field coefficients (coding coefficients) are given as , .
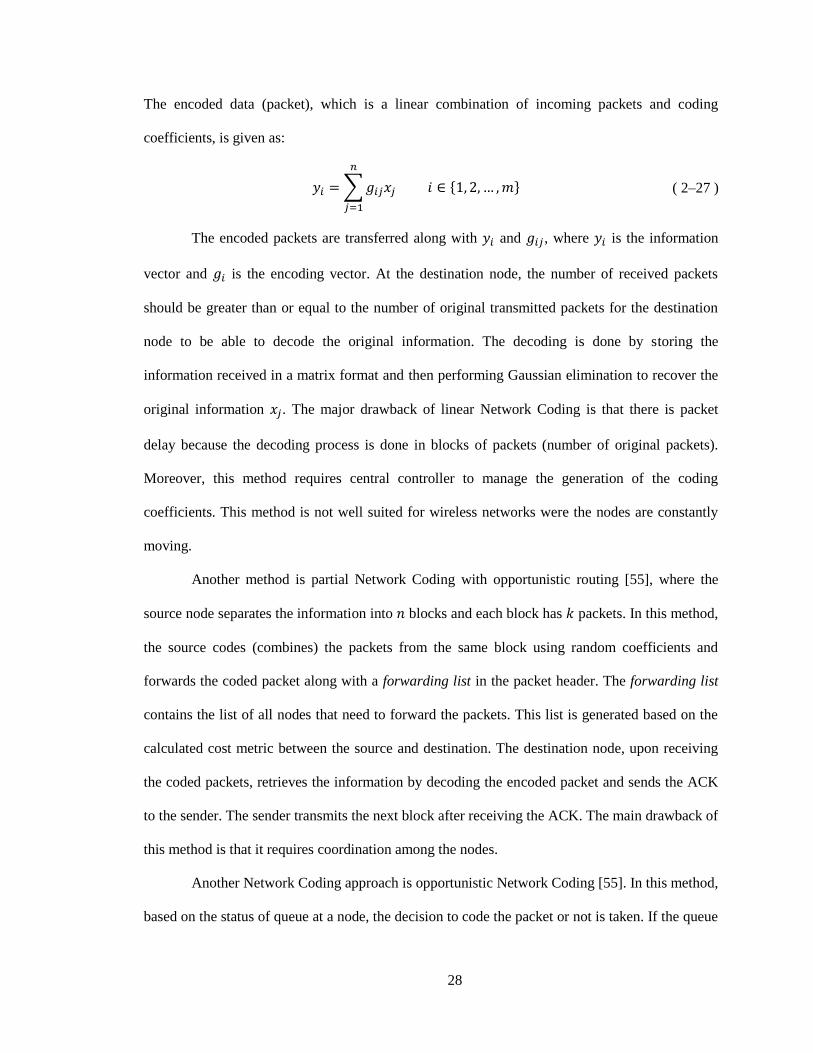
28
The encoded data (packet), which is a linear combination of incoming packets and coding
coefficients, is given as:
∑
{ } ( 2–27 )
The encoded packets are transferred along with and , where is the information
vector and is the encoding vector. At the destination node, the number of received packets
should be greater than or equal to the number of original transmitted packets for the destination
node to be able to decode the original information. The decoding is done by storing the
information received in a matrix format and then performing Gaussian elimination to recover the
original information . The major drawback of linear Network Coding is that there is packet
delay because the decoding process is done in blocks of packets (number of original packets).
Moreover, this method requires central controller to manage the generation of the coding
coefficients. This method is not well suited for wireless networks were the nodes are constantly
moving.
Another method is partial Network Coding with opportunistic routing [55], where the
source node separates the information into blocks and each block has packets. In this method,
the source codes (combines) the packets from the same block using random coefficients and
forwards the coded packet along with a forwarding list in the packet header. The forwarding list
contains the list of all nodes that need to forward the packets. This list is generated based on the
calculated cost metric between the source and destination. The destination node, upon receiving
the coded packets, retrieves the information by decoding the encoded packet and sends the ACK
to the sender. The sender transmits the next block after receiving the ACK. The main drawback of
this method is that it requires coordination among the nodes.
Another Network Coding approach is opportunistic Network Coding [55]. In this method,
based on the status of queue at a node, the decision to code the packet or not is taken. If the queue
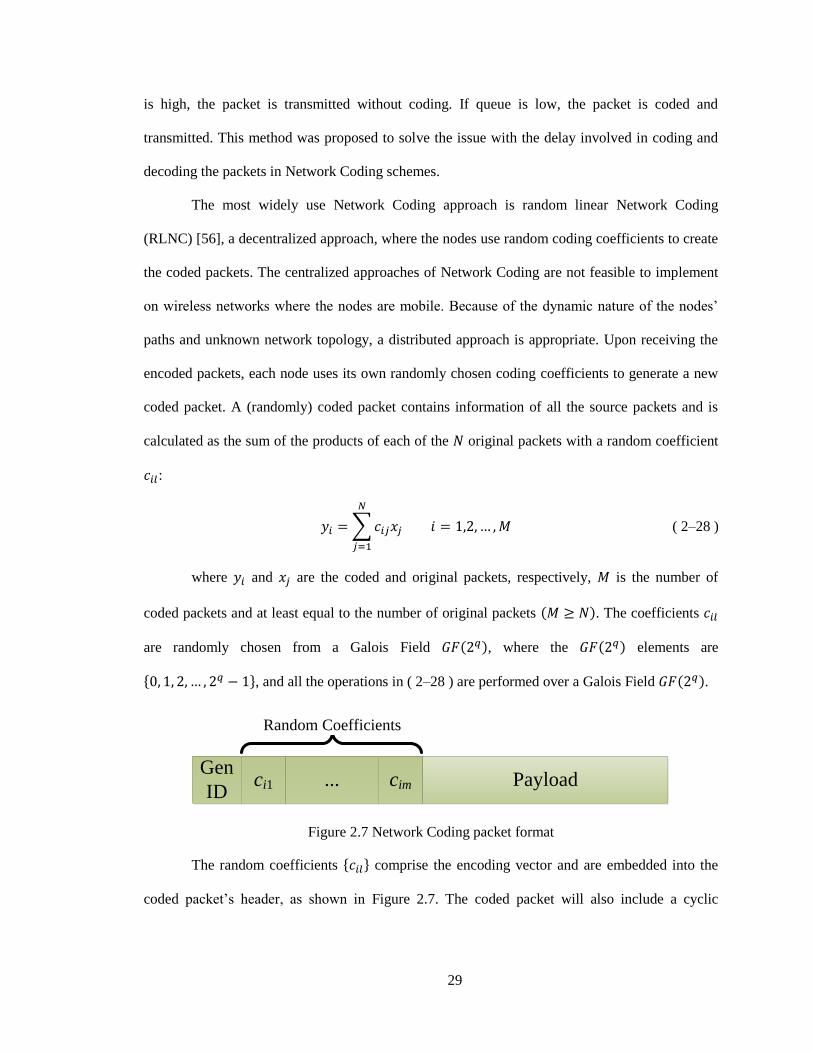
29
is high, the packet is transmitted without coding. If queue is low, the packet is coded and
transmitted. This method was proposed to solve the issue with the delay involved in coding and
decoding the packets in Network Coding schemes.
The most widely use Network Coding approach is random linear Network Coding
(RLNC) [56], a decentralized approach, where the nodes use random coding coefficients to create
the coded packets. The centralized approaches of Network Coding are not feasible to implement
on wireless networks where the nodes are mobile. Because of the dynamic nature of the nodes’
paths and unknown network topology, a distributed approach is appropriate. Upon receiving the
encoded packets, each node uses its own randomly chosen coding coefficients to generate a new
coded packet. A (randomly) coded packet contains information of all the source packets and is
calculated as the sum of the products of each of the original packets with a random coefficient
:
∑
( 2–28 )
where and are the coded and original packets, respectively, is the number of
coded packets and at least equal to the number of original packets . The coefficients
are randomly chosen from a Galois Field , where the elements are
{ }, and all the operations in ( 2–28 ) are performed over a Galois Field .
Gen
IDci1 ... cim Payload
Random Coefficients
Figure 2.7 Network Coding packet format
The random coefficients { } comprise the encoding vector and are embedded into the
coded packet’s header, as shown in Figure 2.7. The coded packet will also include a cyclic
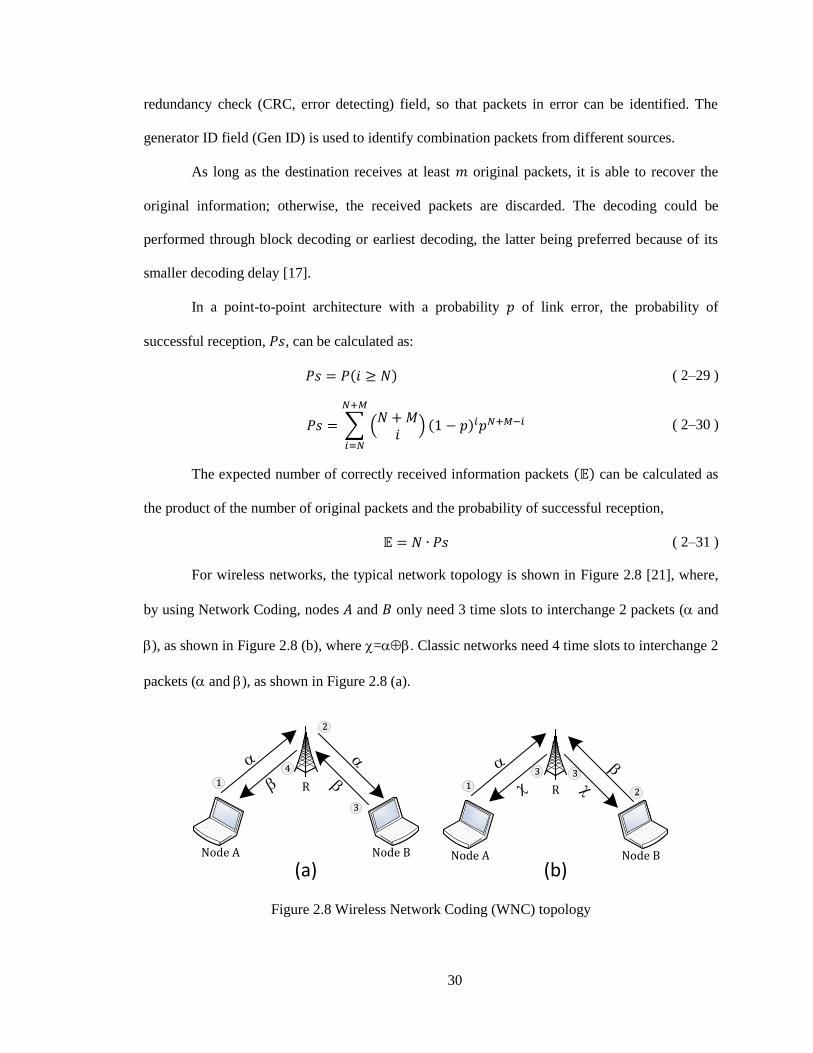
30
redundancy check (CRC, error detecting) field, so that packets in error can be identified. The
generator ID field (Gen ID) is used to identify combination packets from different sources.
As long as the destination receives at least original packets, it is able to recover the
original information; otherwise, the received packets are discarded. The decoding could be
performed through block decoding or earliest decoding, the latter being preferred because of its
smaller decoding delay [17].
In a point-to-point architecture with a probability of link error, the probability of
successful reception, , can be calculated as:
( 2–29 )
∑ (
)
( 2–30 )
The expected number of correctly received information packets can be calculated as
the product of the number of original packets and the probability of successful reception,
( 2–31 )
For wireless networks, the typical network topology is shown in Figure 2.8 [21], where,
by using Network Coding, nodes and only need 3 time slots to interchange 2 packets ( and
), as shown in Figure 2.8 (b), where =Å. Classic networks need 4 time slots to interchange 2
packets ( and ), as shown in Figure 2.8 (a).
Node A Node B
R
1
2
3
4
Node A Node B
R
12
33
(a) (b)
Figure 2.8 Wireless Network Coding (WNC) topology
31
In this method, also known as Wireless Network Coding (WNC), the Network Coding
operations are performed at the MAC layer to improve the quality of the communication. With
this Network Coding method, node transmits to intermediate node (relay) during time slot
T1. Then, node transmits to node during time T2. After that, node creates by combining
the packets received from nodes and , and , respectively. Then, node transmits to
nodes and during time T3. By receiving , node can decode and node can decode .
A technique to improve the performance of WNC is to use diversity. This approach takes
advantage of the broadcasting nature of the wireless medium. Because of this property of the
wireless medium, the packet sent by node to node is also received by node . But, the signal
is weak because of the longer distance from node . This weak signal is called the overreach
signal. Node stores this overreach signal in its memory during time slot T1. When node
transmits to node , node can also receive a overreach signal and stores it () in its memory
during time slot T2. During the time slot T3, nodes and receive . Node decodes by
combining the received packet (=Å) with its own packet (), which is stored in its memory,
and obtains ,
( 2–32 )
The extracted is diversity combined with the stored overreach signal and the receiver
(node B) can make a better decision about the received signal . Because of the diversity
combining, the communication quality is improved.
2.5.2 Applications of Network Coding
Network Coding can be used to improve the communications performance in different
applications. The most widely used applications are:
2.5.2.1 Wireless Broadcast Networks
Wireless systems generally broadcast information in multiple frequency channels and
follow the multihop pattern that tends to overcrowd the available frequency bandwidth. This
32
results in interference due to increase in the number of wireless devices used today. A system
with multiple hops reduces the resultant throughput of the system that is not desired. Wireless
Network Coding (WNC) helps a multihop system use fewer transmissions, in contrast to a
multihop system that does not use WNC.
The WNC scheme is typically a MAC layer oriented scheme where a relay node
combines (network code) packets from both the nodes A and B. As shown in Figure 2.8(b), both
A and B transmit their packet to the relay R which stores the packets and performs an XOR
operation on the packets and sends the resultant output to A and B. Since A and B know the
packet they transmitted, they decode the XORed output and obtain the necessary information.
Instead of sending the packets through four transmissions (time slots) to reach both A and B
(Figure 2.8(a)), using wireless Network Coding reduces it to three transmissions. This improves
the throughput of the system and the bandwidth. Also, the WNC scheme is found to have high
efficiency and very low packet transmission loss compared to traditional schemes.
2.5.2.2 Peer to Peer File Sharing System
The avalanche project from Microsoft [57–59] is one application that uses Network
Coding for peer to peer file distribution. When the file is large, the server splits the large file into
smaller blocks and sends them to the nodes. The peer nodes download the blocks of file from the
server and exchange the blocks among each other. In avalanche, the blocks are coded using
RLNC and then sent to the nodes. The peer nodes decode these blocks and also exchange these
RLNC blocks among themselves. By this method, the download time is reduced because the
block transmission between nodes is minimized.
2.5.2.3 Network Security Applications
With the use of Network Coding, the original packets are coded using random
coefficients and transmitted, preferable through multiple paths/routes. As a result, there is
protection against eavesdropper since the packets obtained by the eavesdropper do not provide
any information about the original packets transmitted [20].
33
2.6 Concluding Remarks
Error detection and error correction techniques enable reliable communication over
unreliable channels by adding extra bits. Error detection techniques allow detecting errors in the
original information at the receiver while error correction techniques allow correcting errors in
the original information at the receiver. Error correction can be applied at bit (codeword) or
packet level and can be feedforward such as Reed-Solomon codes and Diversity Coding or
feedback such as retransmissions (ARQ). With feedforward error correction techniques, extra
information is transmitted along with the original information. The extra information is useful
when the channel introduces errors into the original information. However, if the channel
performs in good conditions and no errors are introduced into the original information, the extra
information is wasted.
Diversity Coding and Network Coding are the error correction techniques used in the
work presented in this dissertation to improve the network performance of wireless sensor and
wireless body area networks. The advantage of Diversity Coding and Network Coding over the
forward error correction at bit level is that enable near-instant self-healing and fault-tolerance in
the presence of link and node failures using spatial diversity to transmit information through
different paths (links). A mathematical analysis for Diversity Coding and Network Coding is
presented to shown the coding process and performance analysis. Forward error correction
techniques at bit level have the capability of correcting a finite number of errors and when the
link completely fails, it is not possible to recover the original information.
In multicast transmissions, Network Coding and Diversity Coding perform better than in
unicast transmissions, as is shown in the Butterfly diagram, Figure 2.5. Network Coding and
Diversity Coding also achieve capacity gain in many–to–many transmissions. The many–to–
many topology is similar to the Butterfly diagram, but the difference is instead of one source
transmitting many packets there are many sources transmitting only one packet.
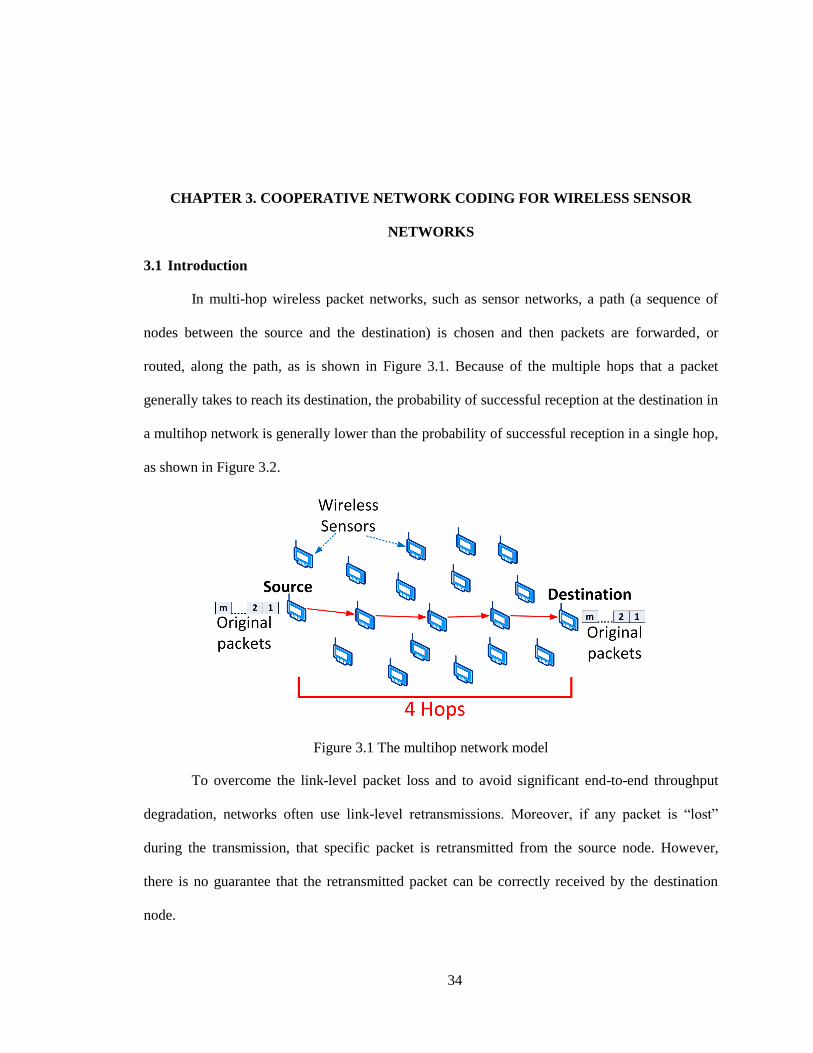
34
CHAPTER 3. COOPERATIVE NETWORK CODING FOR WIRELESS SENSOR
NETWORKS
3.1 Introduction
In multi-hop wireless packet networks, such as sensor networks, a path (a sequence of
nodes between the source and the destination) is chosen and then packets are forwarded, or
routed, along the path, as is shown in Figure 3.1. Because of the multiple hops that a packet
generally takes to reach its destination, the probability of successful reception at the destination in
a multihop network is generally lower than the probability of successful reception in a single hop,
as shown in Figure 3.2.
Figure 3.1 The multihop network model
To overcome the link-level packet loss and to avoid significant end-to-end throughput
degradation, networks often use link-level retransmissions. Moreover, if any packet is “lost”
during the transmission, that specific packet is retransmitted from the source node. However,
there is no guarantee that the retransmitted packet can be correctly received by the destination
node.
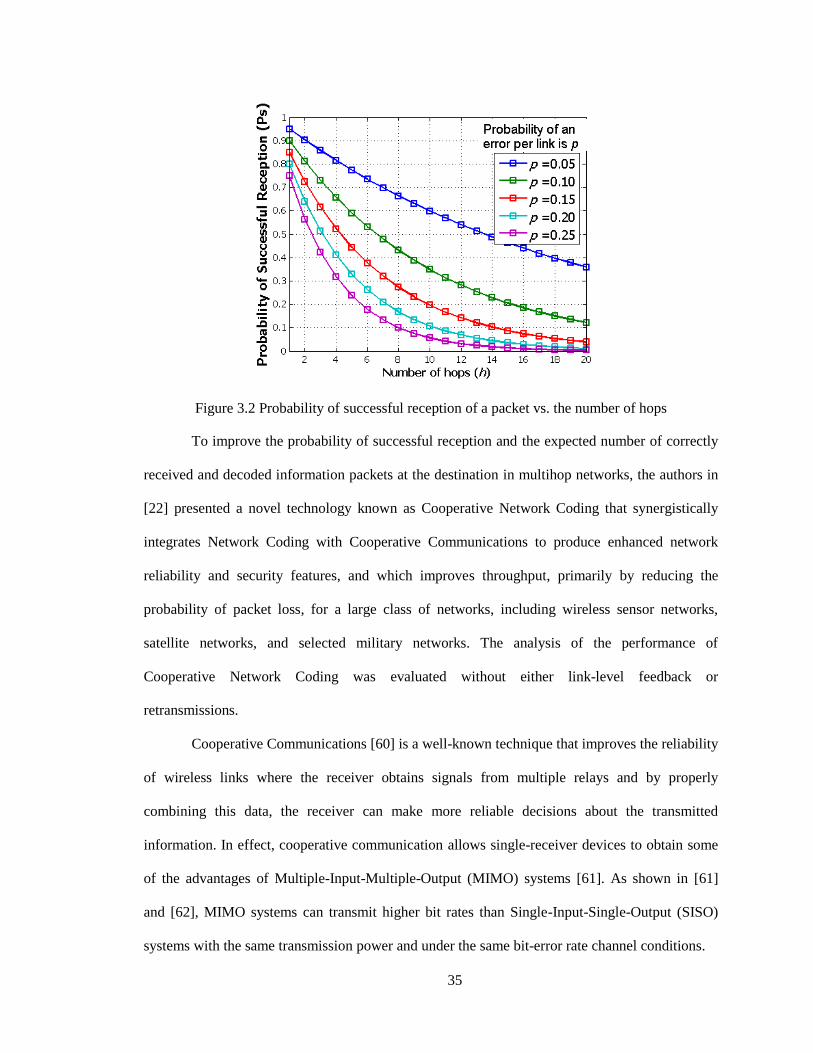
35
Figure 3.2 Probability of successful reception of a packet vs. the number of hops
To improve the probability of successful reception and the expected number of correctly
received and decoded information packets at the destination in multihop networks, the authors in
[22] presented a novel technology known as Cooperative Network Coding that synergistically
integrates Network Coding with Cooperative Communications to produce enhanced network
reliability and security features, and which improves throughput, primarily by reducing the
probability of packet loss, for a large class of networks, including wireless sensor networks,
satellite networks, and selected military networks. The analysis of the performance of
Cooperative Network Coding was evaluated without either link-level feedback or
retransmissions.
Cooperative Communications [60] is a well-known technique that improves the reliability
of wireless links where the receiver obtains signals from multiple relays and by properly
combining this data, the receiver can make more reliable decisions about the transmitted
information. In effect, cooperative communication allows single-receiver devices to obtain some
of the advantages of Multiple-Input-Multiple-Output (MIMO) systems [61]. As shown in [61]
and [62], MIMO systems can transmit higher bit rates than Single-Input-Single-Output (SISO)
systems with the same transmission power and under the same bit-error rate channel conditions.
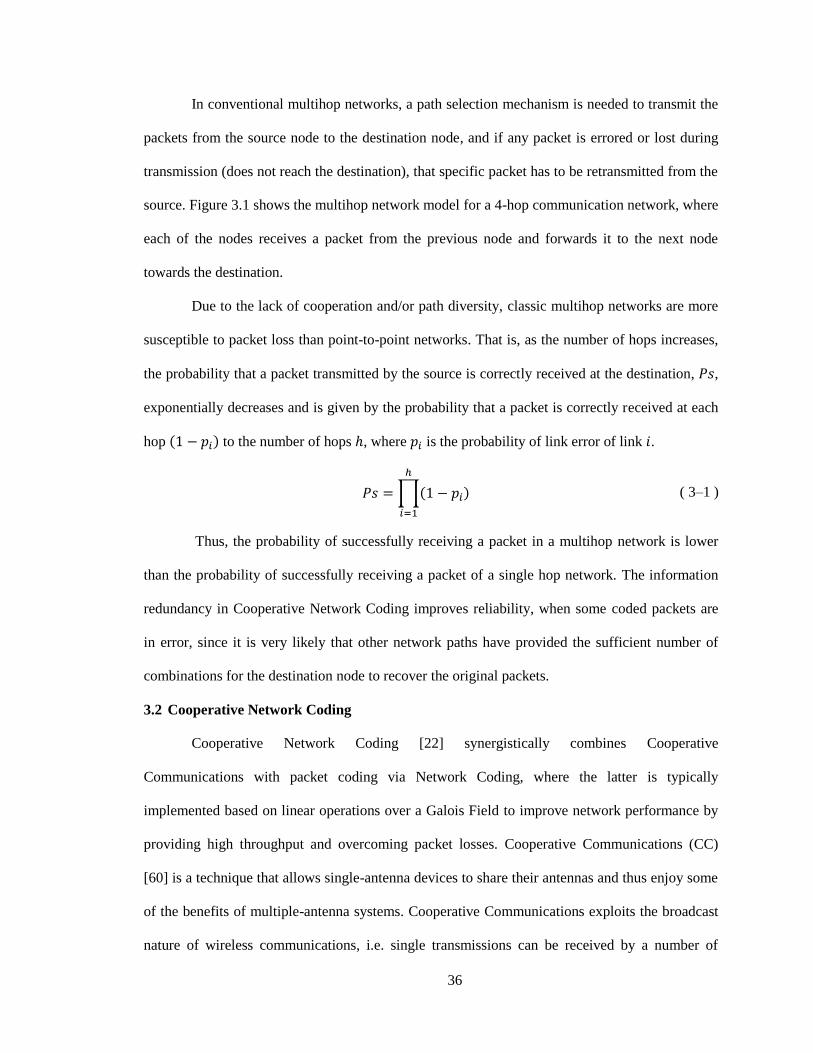
36
In conventional multihop networks, a path selection mechanism is needed to transmit the
packets from the source node to the destination node, and if any packet is errored or lost during
transmission (does not reach the destination), that specific packet has to be retransmitted from the
source. Figure 3.1 shows the multihop network model for a 4-hop communication network, where
each of the nodes receives a packet from the previous node and forwards it to the next node
towards the destination.
Due to the lack of cooperation and/or path diversity, classic multihop networks are more
susceptible to packet loss than point-to-point networks. That is, as the number of hops increases,
the probability that a packet transmitted by the source is correctly received at the destination, ,
exponentially decreases and is given by the probability that a packet is correctly received at each
hop to the number of hops , where is the probability of link error of link .
∏
( 3–1 )
Thus, the probability of successfully receiving a packet in a multihop network is lower
than the probability of successfully receiving a packet of a single hop network. The information
redundancy in Cooperative Network Coding improves reliability, when some coded packets are
in error, since it is very likely that other network paths have provided the sufficient number of
combinations for the destination node to recover the original packets.
3.2 Cooperative Network Coding
Cooperative Network Coding [22] synergistically combines Cooperative
Communications with packet coding via Network Coding, where the latter is typically
implemented based on linear operations over a Galois Field to improve network performance by
providing high throughput and overcoming packet losses. Cooperative Communications (CC)
[60] is a technique that allows single-antenna devices to share their antennas and thus enjoy some
of the benefits of multiple-antenna systems. Cooperative Communications exploits the broadcast
nature of wireless communications, i.e. single transmissions can be received by a number of
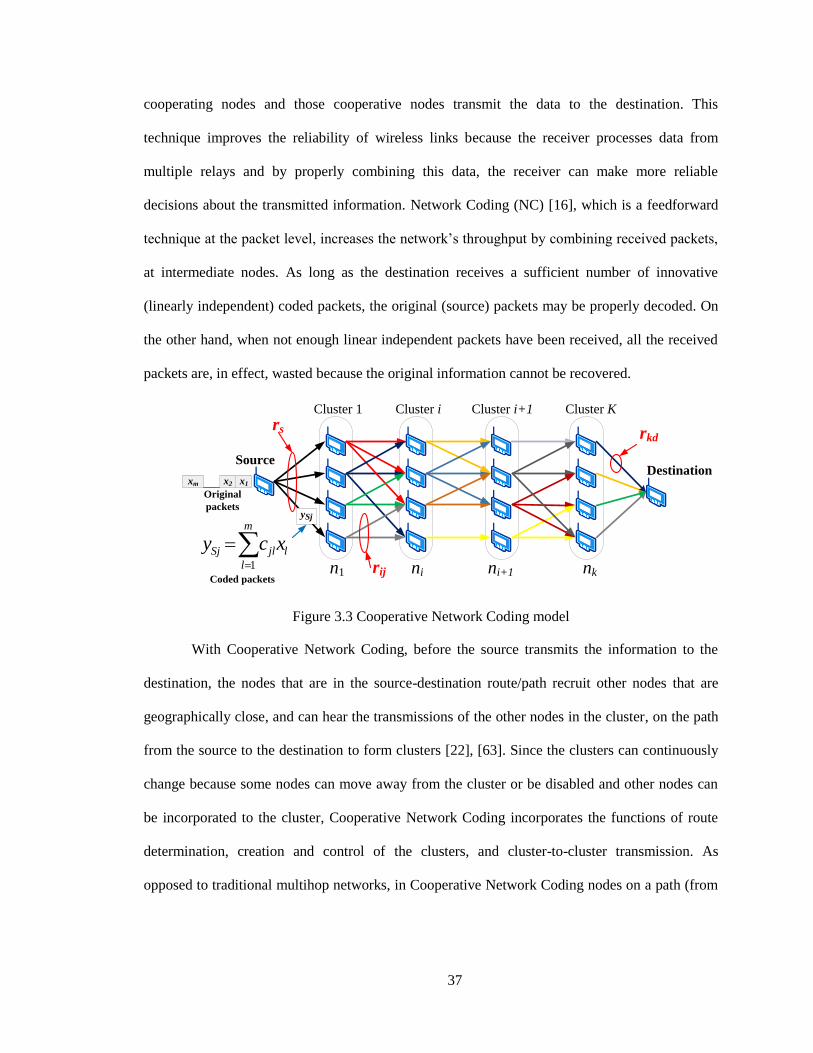
37
cooperating nodes and those cooperative nodes transmit the data to the destination. This
technique improves the reliability of wireless links because the receiver processes data from
multiple relays and by properly combining this data, the receiver can make more reliable
decisions about the transmitted information. Network Coding (NC) [16], which is a feedforward
technique at the packet level, increases the network’s throughput by combining received packets,
at intermediate nodes. As long as the destination receives a sufficient number of innovative
(linearly independent) coded packets, the original (source) packets may be properly decoded. On
the other hand, when not enough linear independent packets have been received, all the received
packets are, in effect, wasted because the original information cannot be recovered.
x1x2xm
Original
packets
Coded packets
m
l
ljlSj xcy1
rs
Cluster i Cluster K
SourceDestination
Cluster i+1
ni nkni+1
Cluster 1
n1
ySj
rij
rkd
Figure 3.3 Cooperative Network Coding model
With Cooperative Network Coding, before the source transmits the information to the
destination, the nodes that are in the source-destination route/path recruit other nodes that are
geographically close, and can hear the transmissions of the other nodes in the cluster, on the path
from the source to the destination to form clusters [22], [63]. Since the clusters can continuously
change because some nodes can move away from the cluster or be disabled and other nodes can
be incorporated to the cluster, Cooperative Network Coding incorporates the functions of route
determination, creation and control of the clusters, and cluster-to-cluster transmission. As
opposed to traditional multihop networks, in Cooperative Network Coding nodes on a path (from
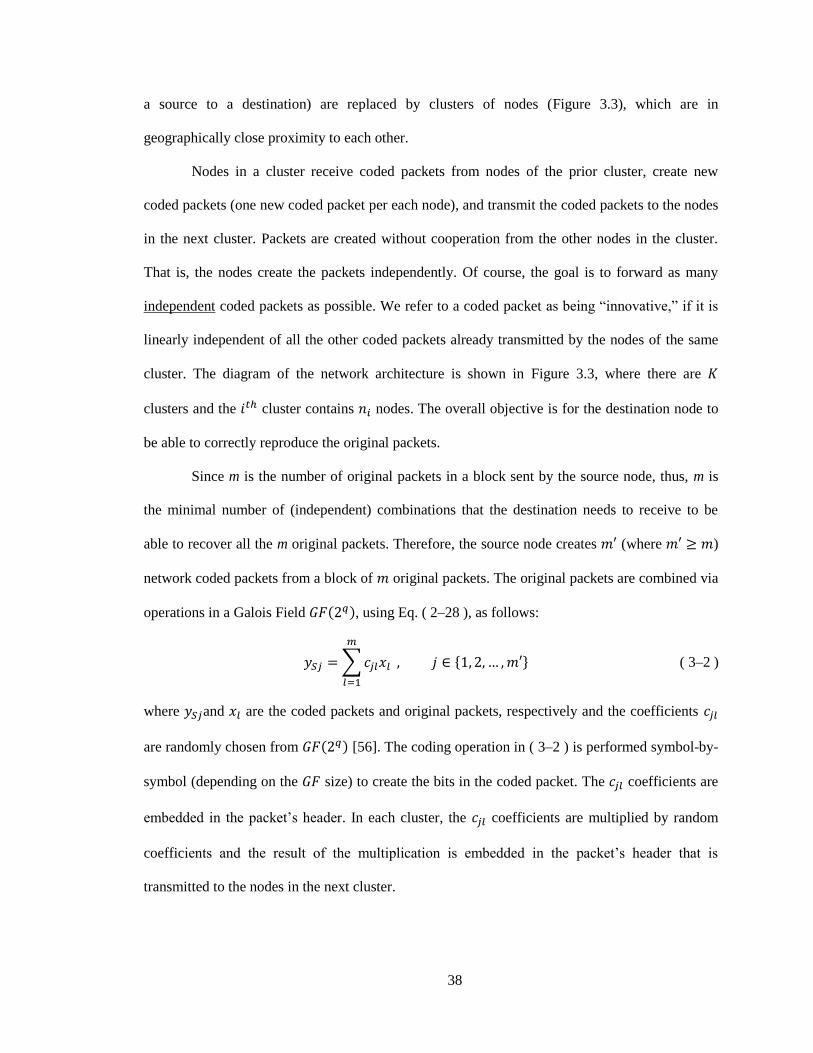
38
a source to a destination) are replaced by clusters of nodes (Figure 3.3), which are in
geographically close proximity to each other.
Nodes in a cluster receive coded packets from nodes of the prior cluster, create new
coded packets (one new coded packet per each node), and transmit the coded packets to the nodes
in the next cluster. Packets are created without cooperation from the other nodes in the cluster.
That is, the nodes create the packets independently. Of course, the goal is to forward as many
independent coded packets as possible. We refer to a coded packet as being “innovative,” if it is
linearly independent of all the other coded packets already transmitted by the nodes of the same
cluster. The diagram of the network architecture is shown in Figure 3.3, where there are
clusters and the cluster contains nodes. The overall objective is for the destination node to
be able to correctly reproduce the original packets.
Since m is the number of original packets in a block sent by the source node, thus, m is
the minimal number of (independent) combinations that the destination needs to receive to be
able to recover all the m original packets. Therefore, the source node creates (where )
network coded packets from a block of original packets. The original packets are combined via
operations in a Galois Field , using Eq. ( 2–28 ), as follows:
∑
{ } ( 3–2 )
where and are the coded packets and original packets, respectively and the coefficients
are randomly chosen from [56]. The coding operation in ( 3–2 ) is performed symbol-by-
symbol (depending on the size) to create the bits in the coded packet. The coefficients are
embedded in the packet’s header. In each cluster, the coefficients are multiplied by random
coefficients and the result of the multiplication is embedded in the packet’s header that is
transmitted to the nodes in the next cluster.
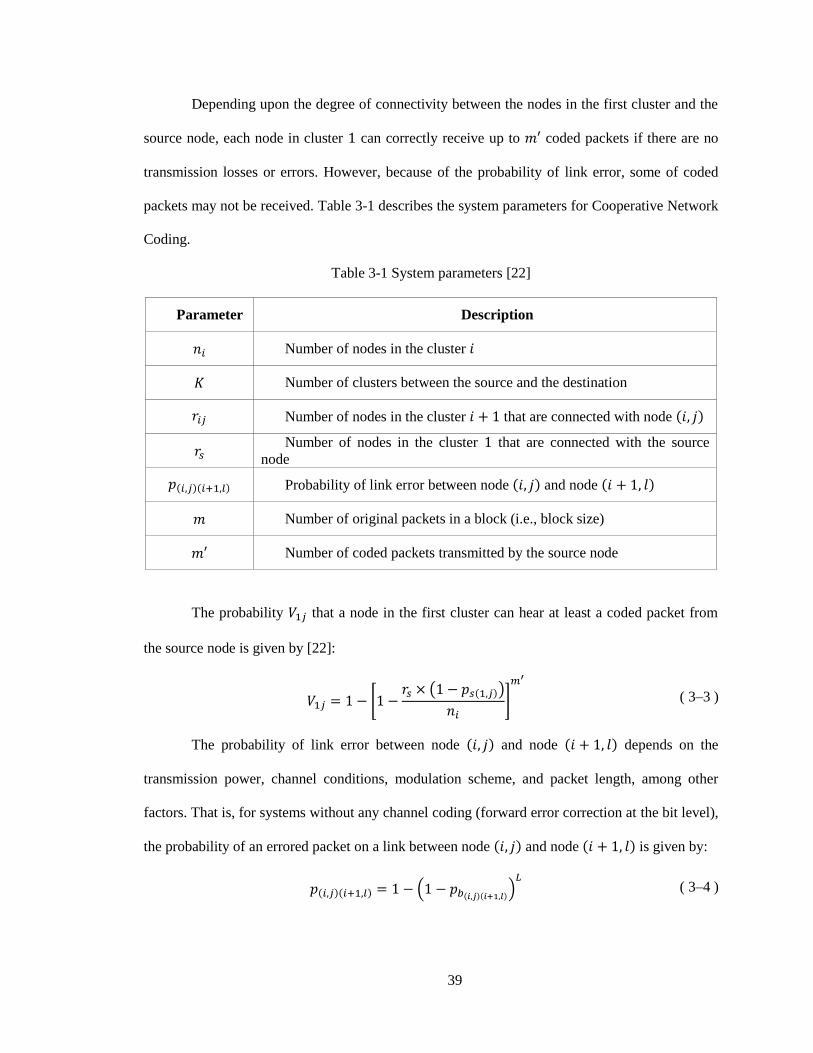
39
Depending upon the degree of connectivity between the nodes in the first cluster and the
source node, each node in cluster can correctly receive up to coded packets if there are no
transmission losses or errors. However, because of the probability of link error, some of coded
packets may not be received. Table 3-1 describes the system parameters for Cooperative Network
Coding.
Table 3-1 System parameters [22]
Parameter Description
Number of nodes in the cluster
Number of clusters between the source and the destination
Number of nodes in the cluster that are connected with node
Number of nodes in the cluster that are connected with the source
node
Probability of link error between node and node
Number of original packets in a block (i.e., block size)
Number of coded packets transmitted by the source node
The probability that a node in the first cluster can hear at least a coded packet from
the source node is given by [22]:
[ ( )
]
( 3–3 )
The probability of link error between node and node depends on the
transmission power, channel conditions, modulation scheme, and packet length, among other
factors. That is, for systems without any channel coding (forward error correction at the bit level),
the probability of an errored packet on a link between node and node is given by:
( ) ( 3–4 )
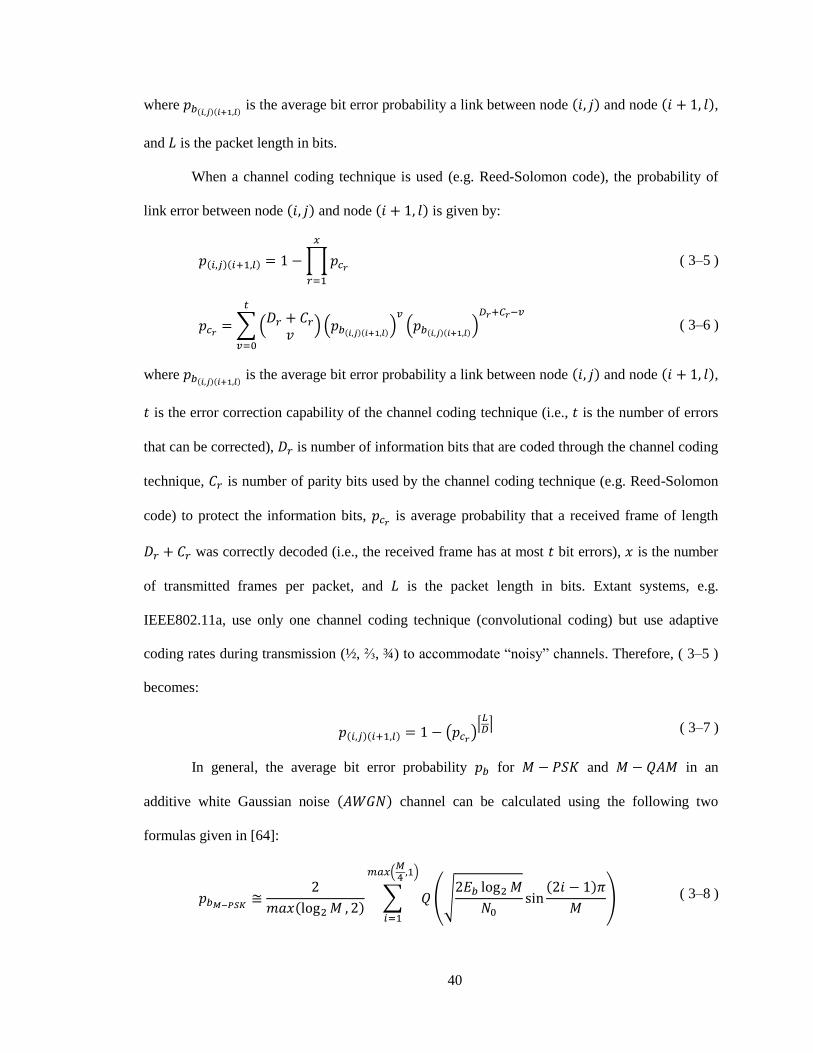
40
where is the average bit error probability a link between node and node ,
and is the packet length in bits.
When a channel coding technique is used (e.g. Reed-Solomon code), the probability of
link error between node and node is given by:
∏
( 3–5 )
∑(
) (
) (
)
( 3–6 )
where is the average bit error probability a link between node and node ,
is the error correction capability of the channel coding technique (i.e., is the number of errors
that can be corrected), is number of information bits that are coded through the channel coding
technique, is number of parity bits used by the channel coding technique (e.g. Reed-Solomon
code) to protect the information bits, is average probability that a received frame of length
was correctly decoded (i.e., the received frame has at most bit errors), is the number
of transmitted frames per packet, and is the packet length in bits. Extant systems, e.g.
IEEE802.11a, use only one channel coding technique (convolutional coding) but use adaptive
coding rates during transmission (½, ⅔, ¾) to accommodate “noisy” channels. Therefore, ( 3–5 )
becomes:
( )⌈ ⌉ ( 3–7 )
In general, the average bit error probability for and in an
additive white Gaussian noise channel can be calculated using the following two
formulas given in [64]:
∑ (√
)
( )
( 3–8 )
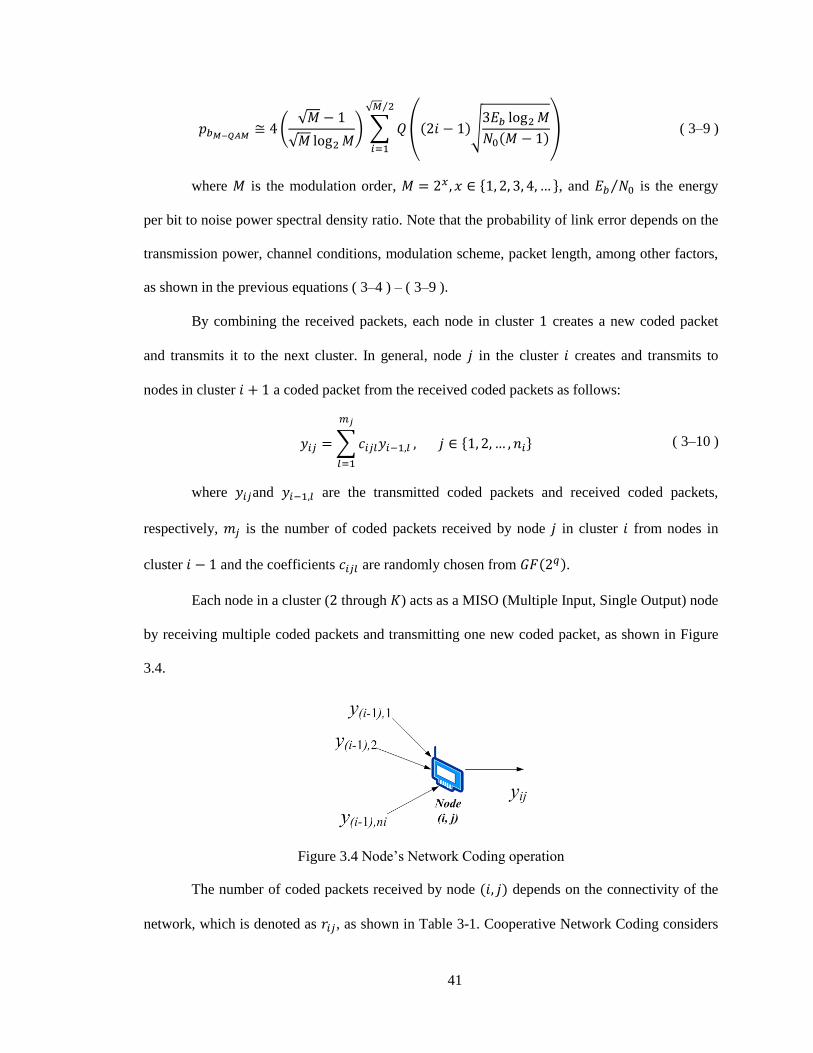
41
(
√
√ ) ∑ ( √
)
√ ⁄
( 3–9 )
where is the modulation order, { }, and ⁄ is the energy
per bit to noise power spectral density ratio. Note that the probability of link error depends on the
transmission power, channel conditions, modulation scheme, packet length, among other factors,
as shown in the previous equations ( 3–4 ) – ( 3–9 ).
By combining the received packets, each node in cluster creates a new coded packet
and transmits it to the next cluster. In general, node in the cluster creates and transmits to
nodes in cluster a coded packet from the received coded packets as follows:
∑
{ } ( 3–10 )
where and are the transmitted coded packets and received coded packets,
respectively, is the number of coded packets received by node in cluster from nodes in
cluster and the coefficients are randomly chosen from .
Each node in a cluster ( through ) acts as a MISO (Multiple Input, Single Output) node
by receiving multiple coded packets and transmitting one new coded packet, as shown in Figure
3.4.
Figure 3.4 Node’s Network Coding operation
The number of coded packets received by node depends on the connectivity of the
network, which is denoted as , as shown in Table 3-1. Cooperative Network Coding considers
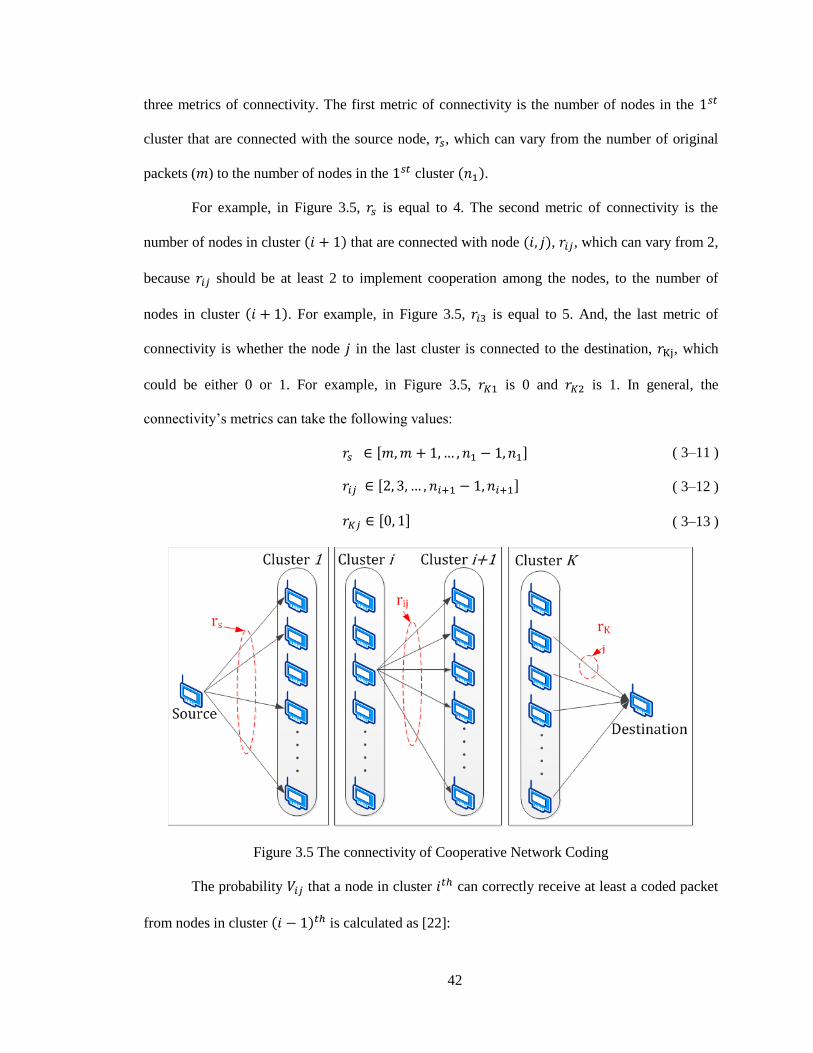
42
three metrics of connectivity. The first metric of connectivity is the number of nodes in the
cluster that are connected with the source node, , which can vary from the number of original
packets ( ) to the number of nodes in the cluster .
For example, in Figure 3.5, is equal to 4. The second metric of connectivity is the
number of nodes in cluster that are connected with node , , which can vary from 2,
because should be at least 2 to implement cooperation among the nodes, to the number of
nodes in cluster . For example, in Figure 3.5, is equal to 5. And, the last metric of
connectivity is whether the node in the last cluster is connected to the destination, , which
could be either 0 or 1. For example, in Figure 3.5, is 0 and is 1. In general, the
connectivity’s metrics can take the following values:
[ ] ( 3–11 )
[ ] ( 3–12 )
[ ] ( 3–13 )
Figure 3.5 The connectivity of Cooperative Network Coding
The probability that a node in cluster can correctly receive at least a coded packet
from nodes in cluster is calculated as [22]:
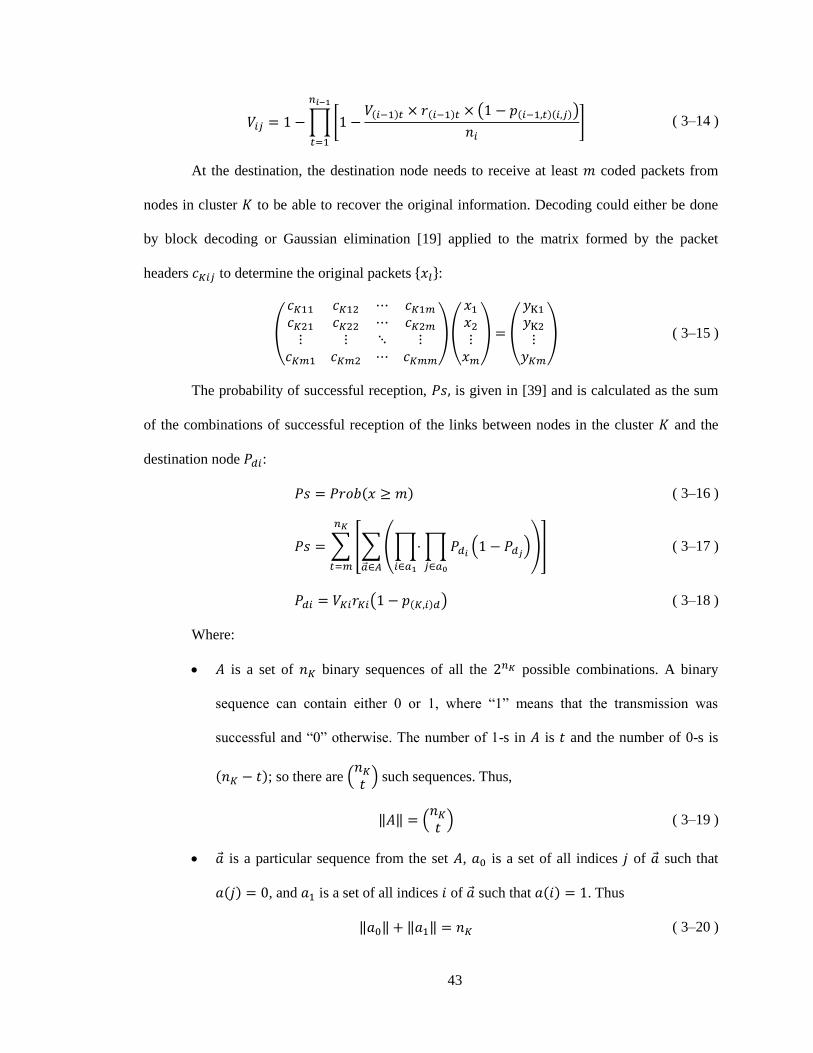
43
∏[ ( )
]
( 3–14 )
At the destination, the destination node needs to receive at least coded packets from
nodes in cluster to be able to recover the original information. Decoding could either be done
by block decoding or Gaussian elimination [19] applied to the matrix formed by the packet
headers to determine the original packets { }:
(
)(
) (
) ( 3–15 )
The probability of successful reception, is given in [39] and is calculated as the sum
of the combinations of successful reception of the links between nodes in the cluster and the
destination node :
( 3–16 )
∑ [∑(∏
∏ (
)
)
]
( 3–17 )
( ) ( 3–18 )
Where:
is a set of binary sequences of all the possible combinations. A binary
sequence can contain either 0 or 1, where “1” means that the transmission was
successful and “0” otherwise. The number of 1-s in is and the number of 0-s is
; so there are (
) such sequences. Thus,
‖ ‖ (
) ( 3–19 )
is a particular sequence from the set , is a set of all indices of such that
, and is a set of all indices of such that . Thus
‖ ‖ ‖ ‖ ( 3–20 )
44
is the probability that a combination packet, transmitted from node in the cluster
, is correctly received by the destination node,
is the probability that node in the cluster receives at least a combination
packet from nodes of the cluster ,
is the connectivity between node in the cluster and the destination node. This
parameter could be either 1 or 0,
is the probability of link error between node in the cluster and the
destination node.
The expected number of correctly received and decoded packets (information packets) at
the destination is given by:
( 3–21 )
3.3 Simulation Scenario and Results for Wireless Ad Hoc Networks
In the following two sections, we present the general rules of design such as the Network
Coding rate (number of original packets to the number of coded packets ratio), probability of link
error, among others to achieve performance improvement through Cooperative Network Coding
in wireless sensor networks.
3.3.1 Effect of the Number of Original Packets on the Performance of Cooperative Network
Coding
In this section we discuss various scenarios of the number of original packets and its
effect on the performance of Cooperative Network Coding.
We considered the following assumptions:
The number of coded packets is at least equal to the number of original packets
,
All the clusters have the same number of nodes ,
The number of coded packets is equal to the number of nodes per cluster ,
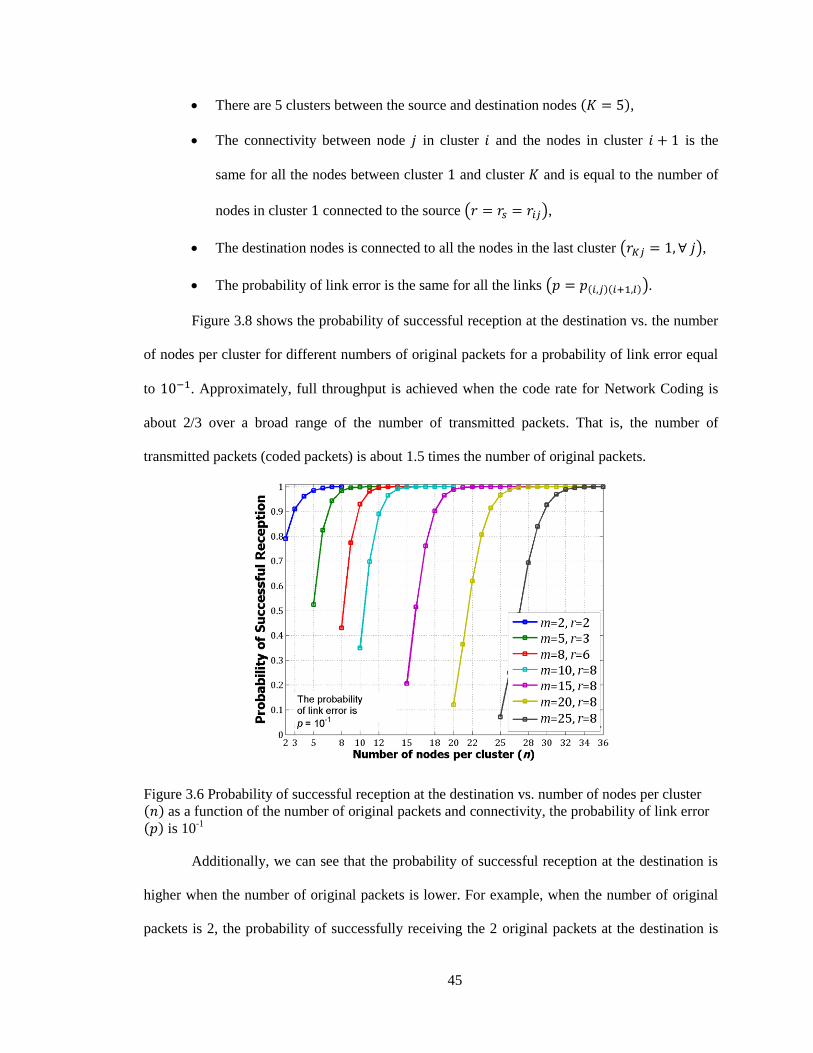
45
There are 5 clusters between the source and destination nodes ,
The connectivity between node in cluster and the nodes in cluster is the
same for all the nodes between cluster and cluster and is equal to the number of
nodes in cluster connected to the source ( ),
The destination nodes is connected to all the nodes in the last cluster ( ),
The probability of link error is the same for all the links ( ).
Figure 3.8 shows the probability of successful reception at the destination vs. the number
of nodes per cluster for different numbers of original packets for a probability of link error equal
to . Approximately, full throughput is achieved when the code rate for Network Coding is
about 2/3 over a broad range of the number of transmitted packets. That is, the number of
transmitted packets (coded packets) is about 1.5 times the number of original packets.
Figure 3.6 Probability of successful reception at the destination vs. number of nodes per cluster as a function of the number of original packets and connectivity, the probability of link error
is 10-1
Additionally, we can see that the probability of successful reception at the destination is
higher when the number of original packets is lower. For example, when the number of original
packets is 2, the probability of successfully receiving the 2 original packets at the destination is
46
about 80%, while the probability of successfully receiving the 15 original packets at the
destination, when the number of original packets is 15, is about 20%. Therefore, it is
recommended to keep the number of original packets small to increase the probability of
successfully decoding the information at the destination and also this reduces the decoding
processing time because the destination node needs to receive at least linearly independent
coded packet to recover the original information.
3.3.2 Effect of the Probability of Link Error on the Performance of Cooperative Network
Coding
In this section we discuss the effect of the probability of link error on the performance of
Cooperative Network Coding.
We considered the following assumptions:
The number of original packets is 10,
All the clusters have the same number of nodes ,
The number of coded packets is equal to the number of nodes per cluster ,
There are 5 clusters between the source and destination nodes ,
The connectivity between node in cluster and the nodes in cluster is the
same for all the nodes between cluster and cluster and is equal to the number of
nodes in cluster connected to the source ( ),
The destination nodes is connected to all the nodes in the last cluster ( ),
The probability of link error is the same for all the links ( ).
Figure 3.7 shows the probability of successful reception at the destination vs. the number
of nodes per cluster for different values of probability of link error. As we can see in this figure,
the probability of link error has direct influence in the probability of successful reception at the
destination. That is, for low probabilities of link error (e.g., ), no extra information
(redundancy) would be required to correctly receive the block of information at the destination.
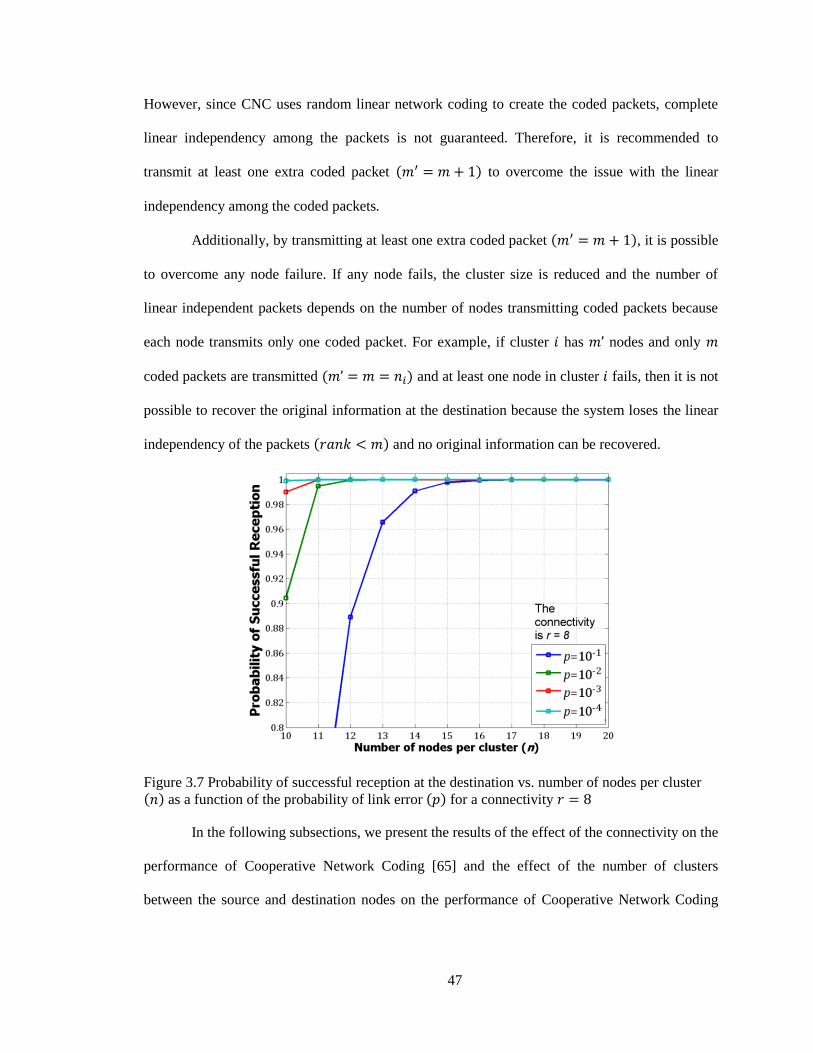
47
However, since CNC uses random linear network coding to create the coded packets, complete
linear independency among the packets is not guaranteed. Therefore, it is recommended to
transmit at least one extra coded packet to overcome the issue with the linear
independency among the coded packets
Additionally, by transmitting at least one extra coded packet , it is possible
to overcome any node failure. If any node fails, the cluster size is reduced and the number of
linear independent packets depends on the number of nodes transmitting coded packets because
each node transmits only one coded packet. For example, if cluster has nodes and only
coded packets are transmitted and at least one node in cluster fails, then it is not
possible to recover the original information at the destination because the system loses the linear
independency of the packets and no original information can be recovered.
Figure 3.7 Probability of successful reception at the destination vs. number of nodes per cluster as a function of the probability of link error for a connectivity
In the following subsections, we present the results of the effect of the connectivity on the
performance of Cooperative Network Coding [65] and the effect of the number of clusters
between the source and destination nodes on the performance of Cooperative Network Coding
48
[66] for a different range of parameters. The results presented in this section were obtained
through simulations by running 10,000 experiments and averaging the results.
3.3.3 Effect of the Connectivity on the Performance of Cooperative Network Coding
In this section we discuss various scenarios of the connectivity and its effect on the
performance of Cooperative Network Coding. The different scenarios for the connectivity
indicate whether a significant improvement in the expected number of correctly received and
decoded information packets at the destination node is achieved varying the connectivity among
the nodes or no improvement at all. We considered the following assumptions:
The number of original packets is 10,
All the clusters have the same number of nodes ,
There are 3 clusters between the source and destination nodes ,
The number of nodes in cluster connected to the source is equal to the number of
original packets ,
The connectivity between node in cluster and the nodes in cluster is the
same for all the nodes between cluster and cluster ( ),
The destination nodes is connected to all the nodes in the last cluster ( ),
The probability of link error is the same for all the links ( ).
Figure 3.8 and Figure 3.9 show the probability of successful reception at the destination
vs. the number of nodes per cluster for different values of connectivity and probability of link
error of 0.1 and 0.25, respectively. As we can see in these figures, the gain in probability of
successful reception at the destination is minimum compared to the increase of cooperation
among the nodes for values of connectivity greater than 4. Therefore, we concentrate our work on
investigating the effect of the connectivity on the performance of Cooperative Network Coding
for connectivity values equal 2, 3 and 4, where is the optimal value for the connectivity
of the nodes between two adjacent clusters ( ).
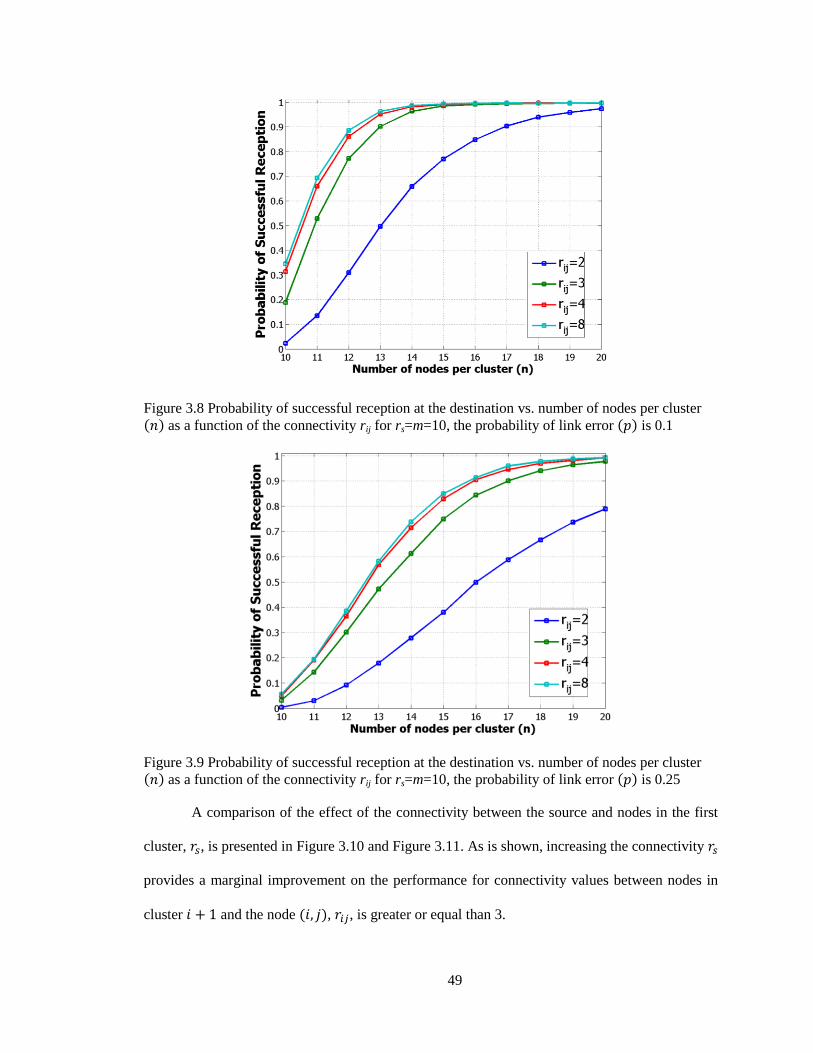
49
Figure 3.8 Probability of successful reception at the destination vs. number of nodes per cluster
as a function of the connectivity rij for rs=m=10, the probability of link error is 0.1
Figure 3.9 Probability of successful reception at the destination vs. number of nodes per cluster as a function of the connectivity rij for rs=m=10, the probability of link error is 0.25
A comparison of the effect of the connectivity between the source and nodes in the first
cluster, , is presented in Figure 3.10 and Figure 3.11. As is shown, increasing the connectivity
provides a marginal improvement on the performance for connectivity values between nodes in
cluster and the node , , is greater or equal than 3.
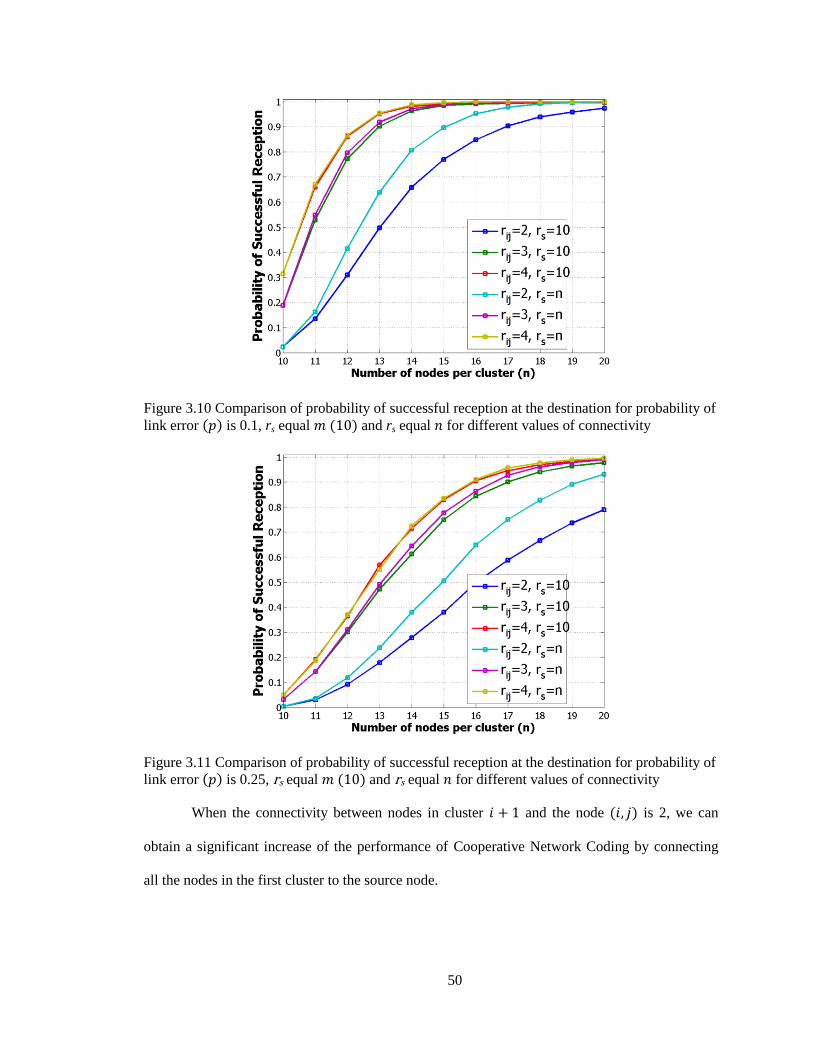
50
Figure 3.10 Comparison of probability of successful reception at the destination for probability of
link error is 0.1, rs equal and rs equal for different values of connectivity
Figure 3.11 Comparison of probability of successful reception at the destination for probability of
link error is 0.25, rs equal and rs equal for different values of connectivity
When the connectivity between nodes in cluster and the node is 2, we can
obtain a significant increase of the performance of Cooperative Network Coding by connecting
all the nodes in the first cluster to the source node.
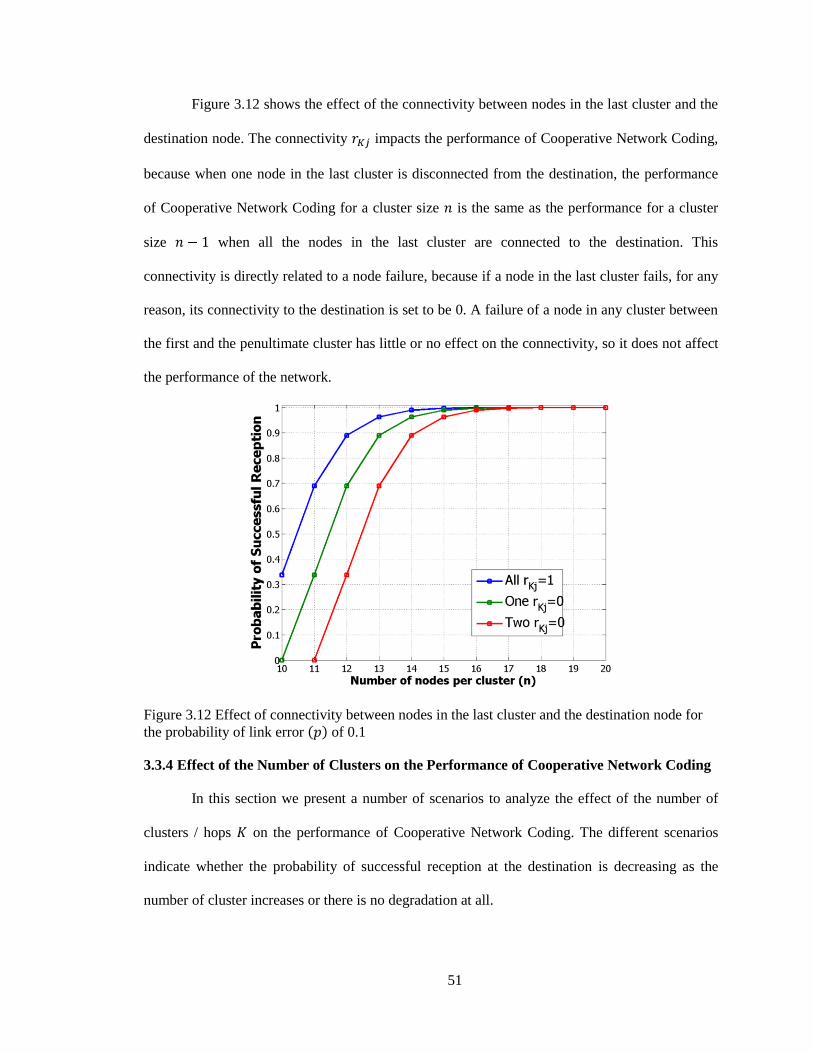
51
Figure 3.12 shows the effect of the connectivity between nodes in the last cluster and the
destination node. The connectivity impacts the performance of Cooperative Network Coding,
because when one node in the last cluster is disconnected from the destination, the performance
of Cooperative Network Coding for a cluster size is the same as the performance for a cluster
size when all the nodes in the last cluster are connected to the destination. This
connectivity is directly related to a node failure, because if a node in the last cluster fails, for any
reason, its connectivity to the destination is set to be 0. A failure of a node in any cluster between
the first and the penultimate cluster has little or no effect on the connectivity, so it does not affect
the performance of the network.
Figure 3.12 Effect of connectivity between nodes in the last cluster and the destination node for
the probability of link error of 0.1
3.3.4 Effect of the Number of Clusters on the Performance of Cooperative Network Coding
In this section we present a number of scenarios to analyze the effect of the number of
clusters / hops on the performance of Cooperative Network Coding. The different scenarios
indicate whether the probability of successful reception at the destination is decreasing as the
number of cluster increases or there is no degradation at all.
52
The results were obtained through simulations by running 10,000 experiments and
averaging the results. Additionally, similar to [22] and [39], we assumed that:
10 original packets are transmitted, ;
The number of nodes per cluster is the same for all the clusters, ;
All the nodes, including the source node, have the same connectivity value,
;
All the links have the same probability of link error, .
As it was recommended in [22] and [65], by setting the connectivity to 8 and 4,
respectively, it is possible to achieve the highest performance of Cooperative Network Coding.
Thus, we consider the level of cooperation (connectivity) to 4 and 8 to find out the effect of the
number of clusters between the source and destination nodes.
In Figure 3.13 and Figure 3.14, we can see that the probability of successful reception at
the destination in Cooperative Network Coding does not vary significantly for cluster size, ,
greater or equal than 13 nodes, regardless the probability of link error. For cluster size smaller
than 13 nodes, we can see that the throughput decreases when the number of clusters increases.
However, this decrease of the performance is not that significant as in a multihop network, which
does not take advantage of cooperation among the nodes.
In Figure 3.13, we can see that to achieve the optimal probability of successful reception
at the destination, when all the original packets can be decoded, the cluster size should be at
least 14 nodes per cluster when the probability of link error is 0.1. Also, from Figure 3.14, we can
see that because the probability of link error is relatively high, the cluster size should be increased
to values beyond 15 nodes per cluster to obtain a probability of successful reception at the
destination close to 1. That is, all the original packets can be recovered.
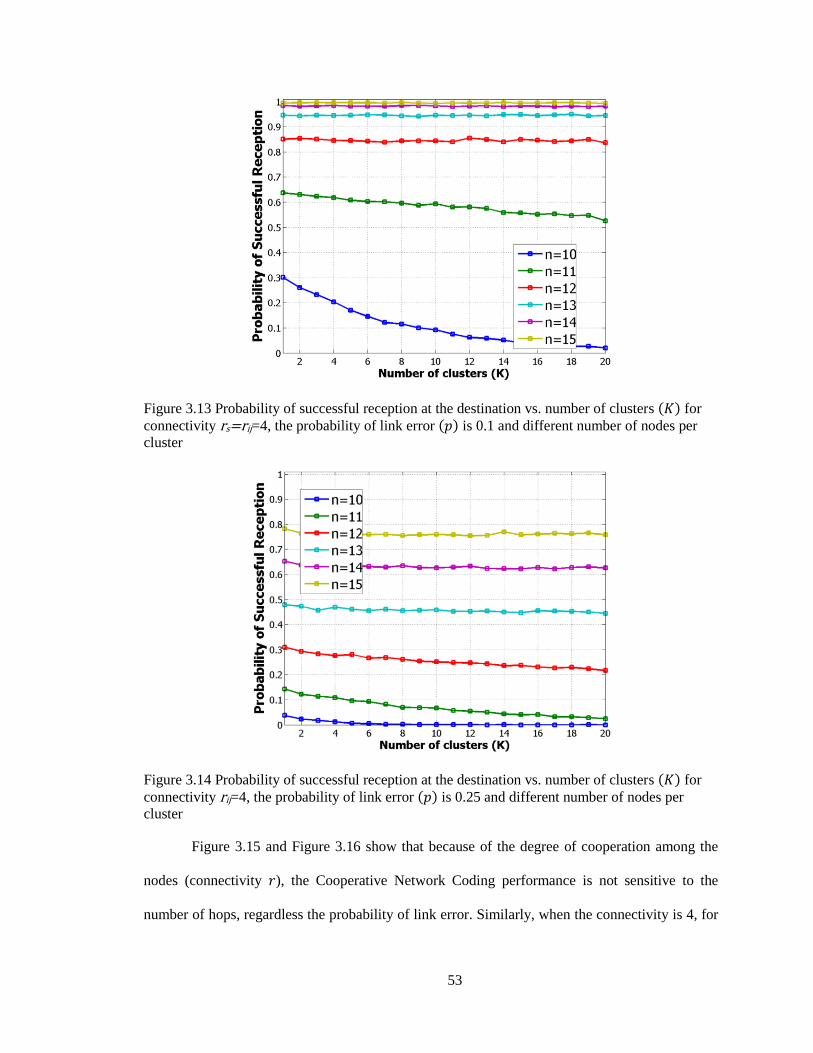
53
Figure 3.13 Probability of successful reception at the destination vs. number of clusters for
connectivity rs=rij=4, the probability of link error is 0.1 and different number of nodes per
cluster
Figure 3.14 Probability of successful reception at the destination vs. number of clusters for
connectivity rij=4, the probability of link error is 0.25 and different number of nodes per
cluster
Figure 3.15 and Figure 3.16 show that because of the degree of cooperation among the
nodes (connectivity ), the Cooperative Network Coding performance is not sensitive to the
number of hops, regardless the probability of link error. Similarly, when the connectivity is 4, for
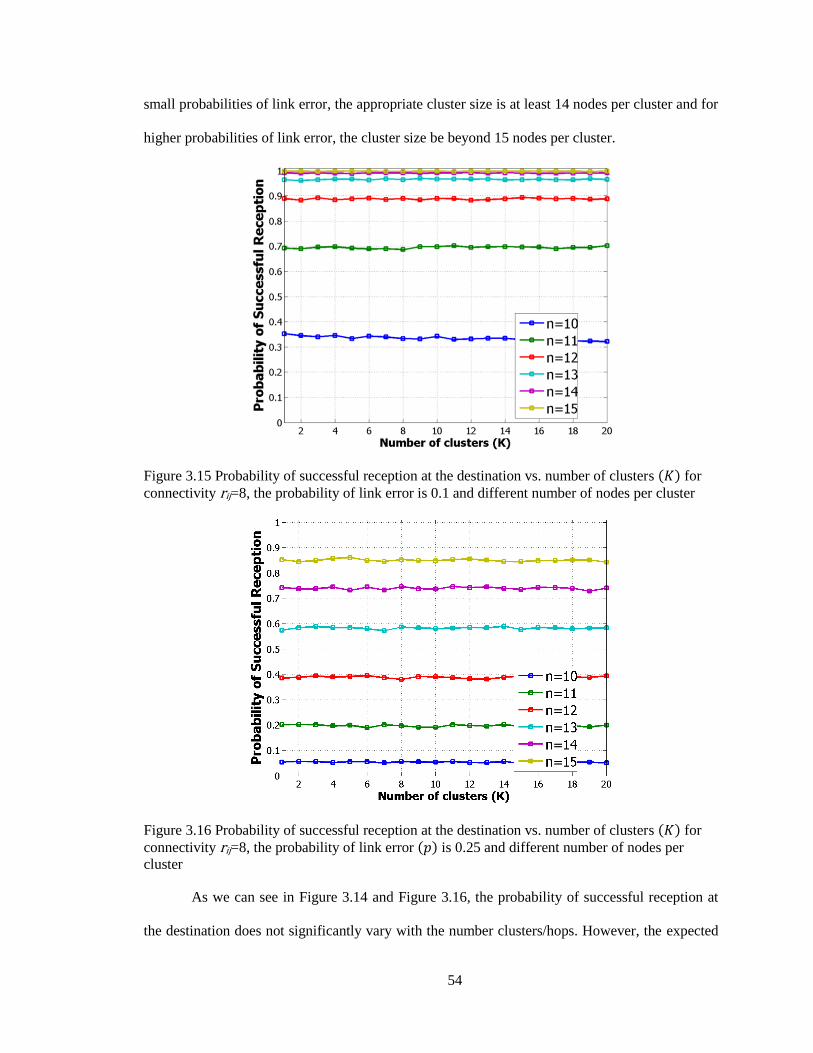
54
small probabilities of link error, the appropriate cluster size is at least 14 nodes per cluster and for
higher probabilities of link error, the cluster size be beyond 15 nodes per cluster.
Figure 3.15 Probability of successful reception at the destination vs. number of clusters for
connectivity rij=8, the probability of link error is 0.1 and different number of nodes per cluster
Figure 3.16 Probability of successful reception at the destination vs. number of clusters for
connectivity rij=8, the probability of link error is 0.25 and different number of nodes per
cluster
As we can see in Figure 3.14 and Figure 3.16, the probability of successful reception at
the destination does not significantly vary with the number clusters/hops. However, the expected
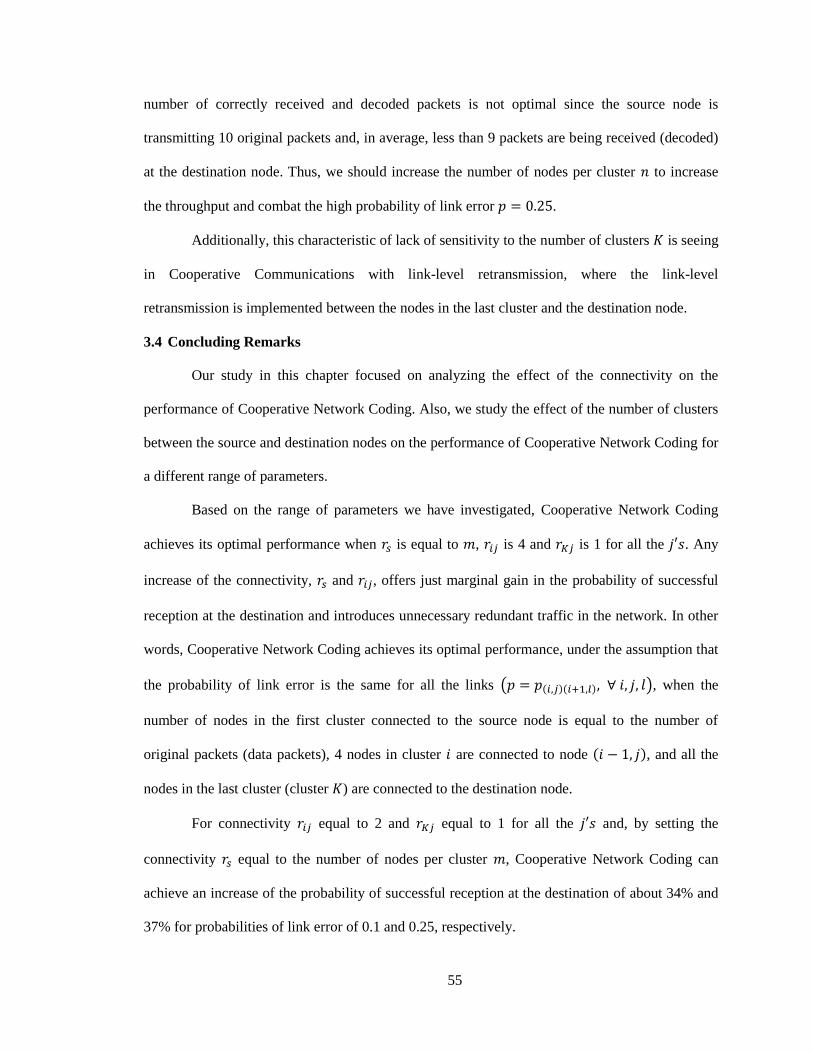
55
number of correctly received and decoded packets is not optimal since the source node is
transmitting 10 original packets and, in average, less than 9 packets are being received (decoded)
at the destination node. Thus, we should increase the number of nodes per cluster to increase
the throughput and combat the high probability of link error .
Additionally, this characteristic of lack of sensitivity to the number of clusters is seeing
in Cooperative Communications with link-level retransmission, where the link-level
retransmission is implemented between the nodes in the last cluster and the destination node.
3.4 Concluding Remarks
Our study in this chapter focused on analyzing the effect of the connectivity on the
performance of Cooperative Network Coding. Also, we study the effect of the number of clusters
between the source and destination nodes on the performance of Cooperative Network Coding for
a different range of parameters.
Based on the range of parameters we have investigated, Cooperative Network Coding
achieves its optimal performance when is equal to , is 4 and is 1 for all the . Any
increase of the connectivity, and , offers just marginal gain in the probability of successful
reception at the destination and introduces unnecessary redundant traffic in the network. In other
words, Cooperative Network Coding achieves its optimal performance, under the assumption that
the probability of link error is the same for all the links ( ), when the
number of nodes in the first cluster connected to the source node is equal to the number of
original packets (data packets), 4 nodes in cluster are connected to node , and all the
nodes in the last cluster (cluster ) are connected to the destination node.
For connectivity equal to 2 and equal to 1 for all the and, by setting the
connectivity equal to the number of nodes per cluster , Cooperative Network Coding can
achieve an increase of the probability of successful reception at the destination of about 34% and
37% for probabilities of link error of 0.1 and 0.25, respectively.
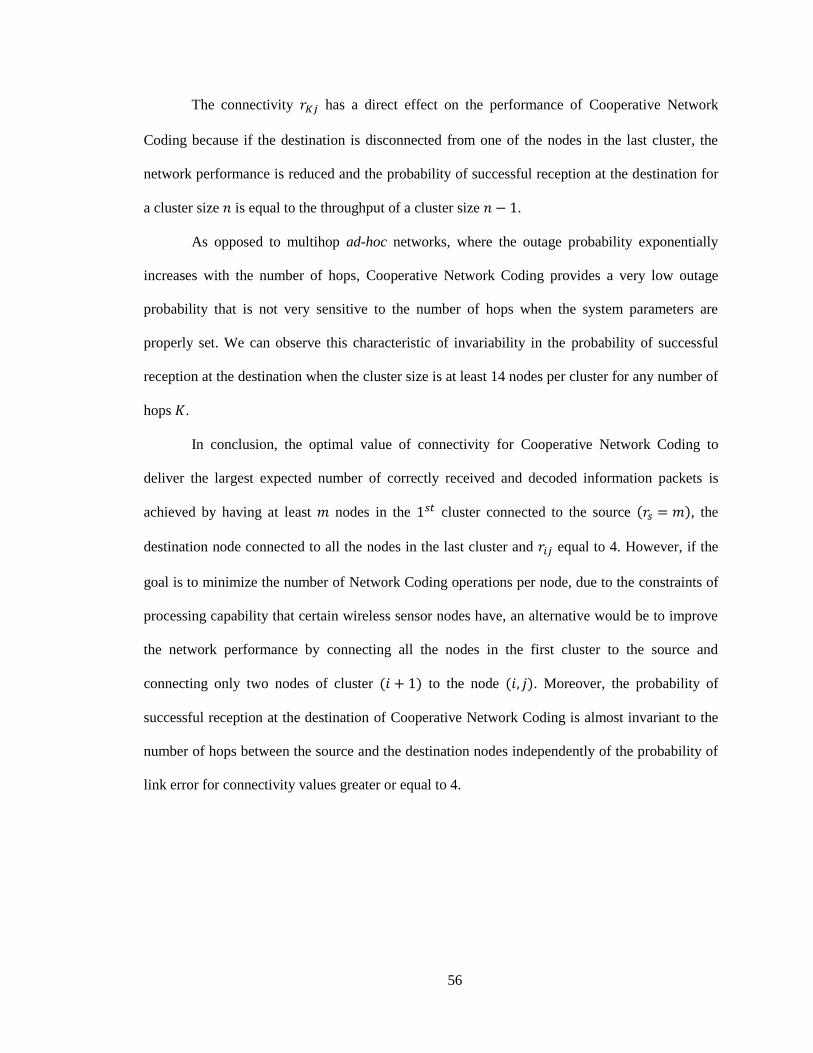
56
The connectivity has a direct effect on the performance of Cooperative Network
Coding because if the destination is disconnected from one of the nodes in the last cluster, the
network performance is reduced and the probability of successful reception at the destination for
a cluster size is equal to the throughput of a cluster size .
As opposed to multihop ad-hoc networks, where the outage probability exponentially
increases with the number of hops, Cooperative Network Coding provides a very low outage
probability that is not very sensitive to the number of hops when the system parameters are
properly set. We can observe this characteristic of invariability in the probability of successful
reception at the destination when the cluster size is at least 14 nodes per cluster for any number of
hops .
In conclusion, the optimal value of connectivity for Cooperative Network Coding to
deliver the largest expected number of correctly received and decoded information packets is
achieved by having at least nodes in the cluster connected to the source , the
destination node connected to all the nodes in the last cluster and equal to 4. However, if the
goal is to minimize the number of Network Coding operations per node, due to the constraints of
processing capability that certain wireless sensor nodes have, an alternative would be to improve
the network performance by connecting all the nodes in the first cluster to the source and
connecting only two nodes of cluster to the node . Moreover, the probability of
successful reception at the destination of Cooperative Network Coding is almost invariant to the
number of hops between the source and the destination nodes independently of the probability of
link error for connectivity values greater or equal to 4.
57
CHAPTER 4. LINK LEVEL RETRANSMISSIONS FOR COOPERATIVE NETWORK
CODING AND COOPERATIVE DIVERSITY CODING
4.1 Introduction
Due to the channel impairments, some packets transmitted from the source to the
destination node are errored or lost. So, to overcome packet errors and/or loss, communication
systems make the use of retransmissions to increase the probability of successful delivery of a
message. The retransmissions can be done end-to-end or link-by-link. In end-to-end
retransmissions, the destination node acknowledges (ACK) the reception of a packet and if the
transmitted packet or the ACK is errored or lost, the source node retransmits the packet. This
operation is performed in the transport layer (e.g. TCP protocol). In link-by-link retransmissions,
a transmitted packet is acknowledged on a link basis. That is, the source transmits a packet to the
next node that is in the path towards the destination. Then, the node acknowledges the packet to
the source. If the packet is errored or lost, the source retransmits the packet. If not, the node sends
the packet to the following node in the path to the destination and the following node
acknowledges successful reception of the packet. If the packet is errored or lost, the packet is
retransmitted. This process continues until the penultimate node in the path sends the packet to
the destination node and waits for the acknowledgement. If the packet is errored or lost, the
penultimate node retransmits the packets. Link-by-link retransmission is implemented at link
layer and Automatic Repeat reQuest (ARQ) [11], [46] error detection and retransmission is used.
This error-control method uses two types of frames: frames (data), and acknowledgements
(ACK). The transmitter sends one or many frames, the receiver runs an error-detection algorithm
on the received data to verify that the frames are error-free and, if an error is detected in a frame,
the receiver requests the transmitter for retransmission of the erroneous frame(s) by sending a
58
NACK (negative ACK) frame indicating the last correctly received frame. This feedback process
continues until no error is detected. In multihop communication, link-by-link retransmission
provides higher reliability compared to the end-to-end retransmission. However, the main
drawback of this approach, when compared to a feed-forward approach, is its latency because of
retransmissions and also requires buffers and timers. As a result of the retransmissions, the load
on the network can be very high, especially under bad channel conditions, and the capacity is
reduced because of need for a reverse channel.
Considering the advantages and disadvantages of these two approaches, a mixed
(combination of forward error correction at packet level and retransmissions) approach to error
control is presented in this chapter with the aim of optimizing the performance of multihop
wireless networks that use Cooperative Network Coding. In [22], the authors analyzed the
performance of Cooperative Network Coding, without link-level feedback and retransmissions.
In this chapter, we extend the work done in [22] by analyzing the effect of link-level feedback
(i.e., packet retransmission) on Cooperative Network Coding. Link-level feedback is
implemented when an insufficient number of combination packets is received at the destination
node, so that the destination cannot reproduce the original packets transmitted by the source. To
compare the performance of Cooperative Network Coding with and without link-layer feedback,
we rely on two metrics: the expected number of correctly received packets and the probability of
recovery of the source information at the destination.
In [22], the authors determined the appropriate values of the system’s parameters to
achieve an optimal performance of the network under the following assumptions:
There is no link-level feedback.
The number of original packets is 10.
All the clusters have the same number of nodes
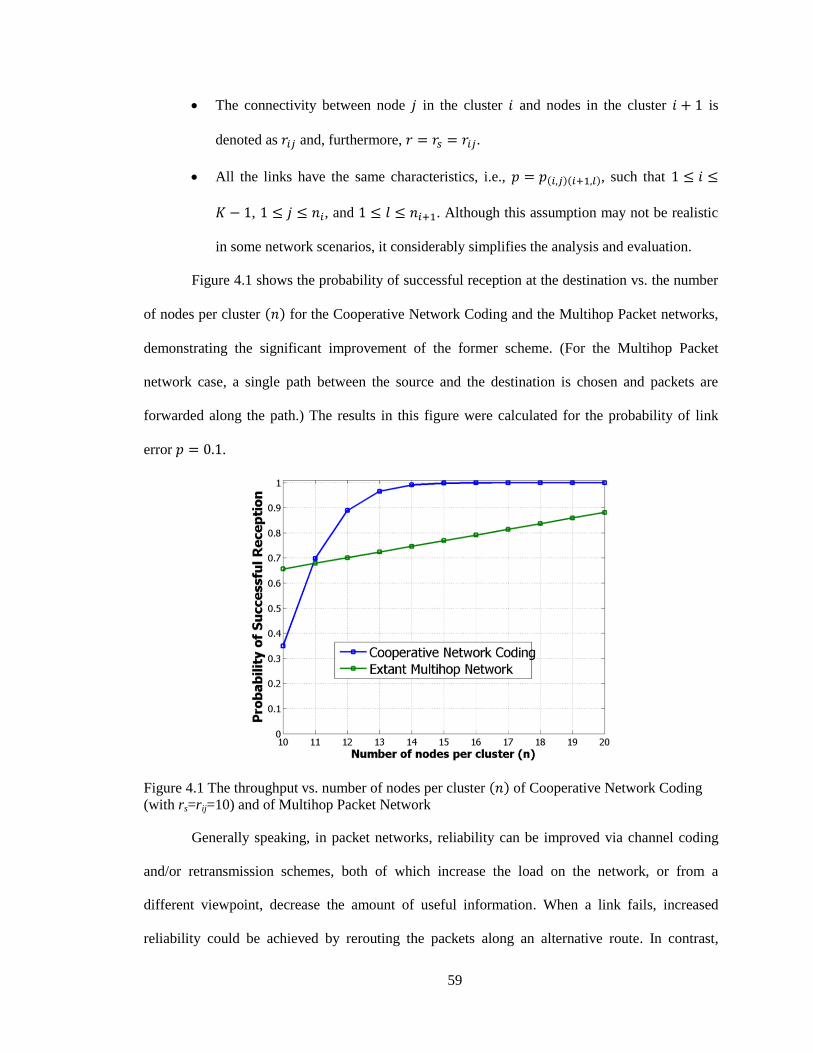
59
The connectivity between node in the cluster and nodes in the cluster is
denoted as and, furthermore, .
All the links have the same characteristics, i.e., , such that
, , and . Although this assumption may not be realistic
in some network scenarios, it considerably simplifies the analysis and evaluation.
Figure 4.1 shows the probability of successful reception at the destination vs. the number
of nodes per cluster for the Cooperative Network Coding and the Multihop Packet networks,
demonstrating the significant improvement of the former scheme. (For the Multihop Packet
network case, a single path between the source and the destination is chosen and packets are
forwarded along the path.) The results in this figure were calculated for the probability of link
error .
Figure 4.1 The throughput vs. number of nodes per cluster of Cooperative Network Coding
(with rs=rij=10) and of Multihop Packet Network
Generally speaking, in packet networks, reliability can be improved via channel coding
and/or retransmission schemes, both of which increase the load on the network, or from a
different viewpoint, decrease the amount of useful information. When a link fails, increased
reliability could be achieved by rerouting the packets along an alternative route. In contrast,
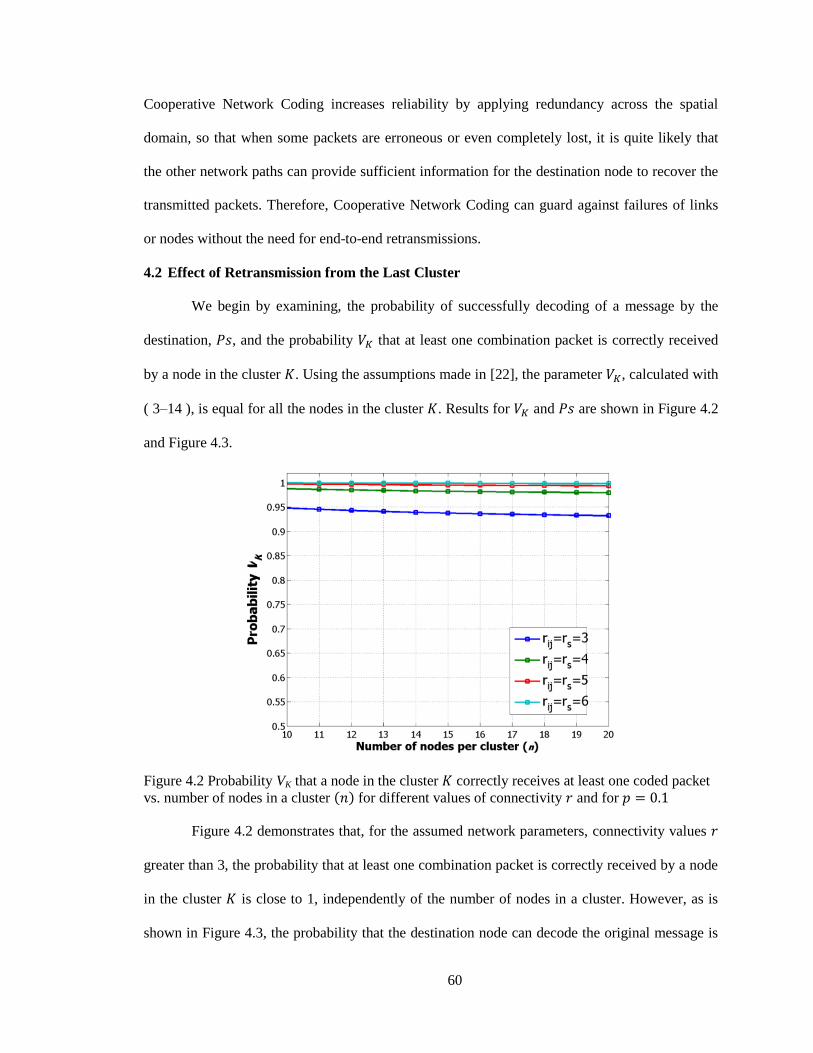
60
Cooperative Network Coding increases reliability by applying redundancy across the spatial
domain, so that when some packets are erroneous or even completely lost, it is quite likely that
the other network paths can provide sufficient information for the destination node to recover the
transmitted packets. Therefore, Cooperative Network Coding can guard against failures of links
or nodes without the need for end-to-end retransmissions.
4.2 Effect of Retransmission from the Last Cluster
We begin by examining, the probability of successfully decoding of a message by the
destination, , and the probability that at least one combination packet is correctly received
by a node in the cluster . Using the assumptions made in [22], the parameter , calculated with
( 3–14 ), is equal for all the nodes in the cluster . Results for and are shown in Figure 4.2
and Figure 4.3.
Figure 4.2 Probability VK that a node in the cluster correctly receives at least one coded packet
vs. number of nodes in a cluster for different values of connectivity and for
Figure 4.2 demonstrates that, for the assumed network parameters, connectivity values
greater than 3, the probability that at least one combination packet is correctly received by a node
in the cluster is close to 1, independently of the number of nodes in a cluster. However, as is
shown in Figure 4.3, the probability that the destination node can decode the original message is
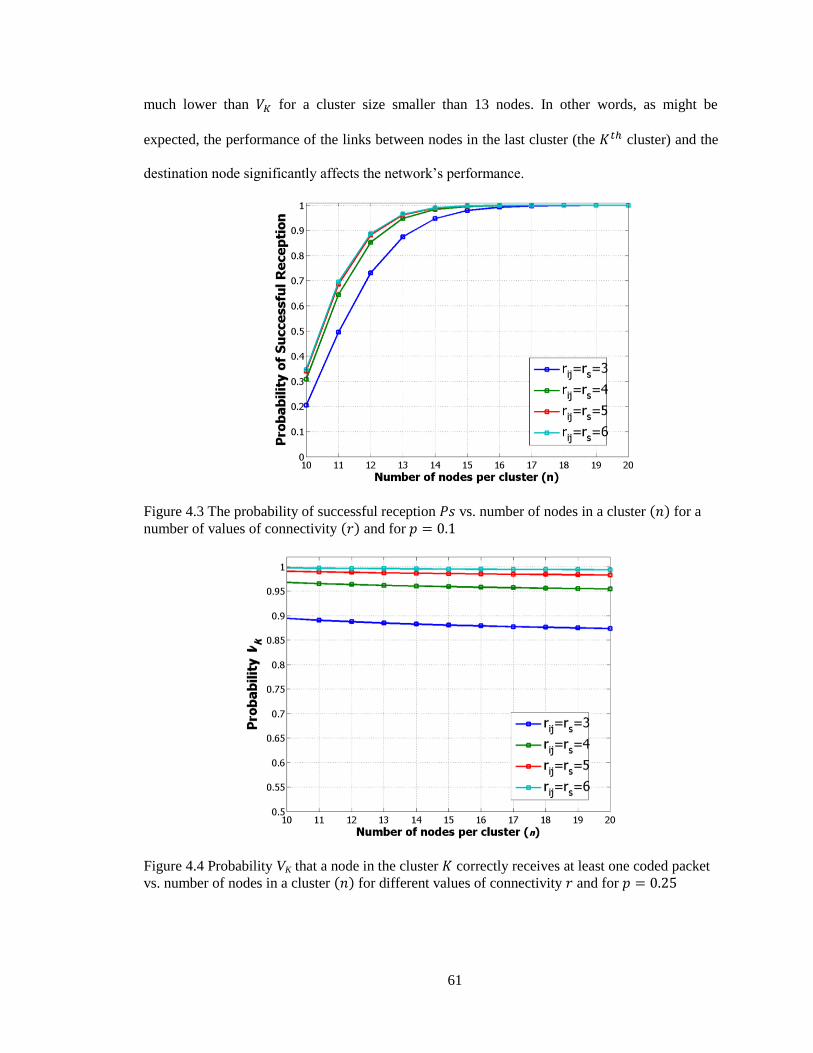
61
much lower than for a cluster size smaller than 13 nodes. In other words, as might be
expected, the performance of the links between nodes in the last cluster (the cluster) and the
destination node significantly affects the network’s performance.
Figure 4.3 The probability of successful reception vs. number of nodes in a cluster for a
number of values of connectivity and for
Figure 4.4 Probability VK that a node in the cluster correctly receives at least one coded packet
vs. number of nodes in a cluster for different values of connectivity and for
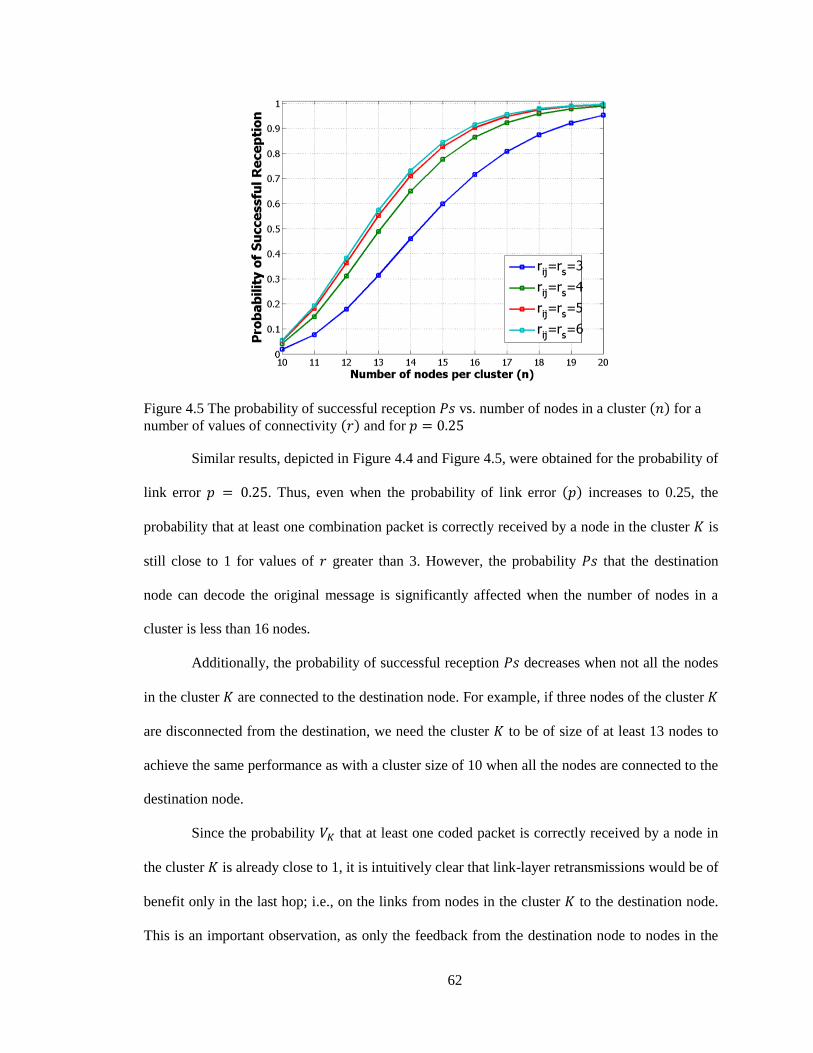
62
Figure 4.5 The probability of successful reception vs. number of nodes in a cluster for a
number of values of connectivity and for
Similar results, depicted in Figure 4.4 and Figure 4.5, were obtained for the probability of
link error . Thus, even when the probability of link error increases to 0.25, the
probability that at least one combination packet is correctly received by a node in the cluster is
still close to 1 for values of greater than 3. However, the probability that the destination
node can decode the original message is significantly affected when the number of nodes in a
cluster is less than 16 nodes.
Additionally, the probability of successful reception decreases when not all the nodes
in the cluster are connected to the destination node. For example, if three nodes of the cluster
are disconnected from the destination, we need the cluster to be of size of at least 13 nodes to
achieve the same performance as with a cluster size of 10 when all the nodes are connected to the
destination node.
Since the probability that at least one coded packet is correctly received by a node in
the cluster is already close to 1, it is intuitively clear that link-layer retransmissions would be of
benefit only in the last hop; i.e., on the links from nodes in the cluster to the destination node.
This is an important observation, as only the feedback from the destination node to nodes in the
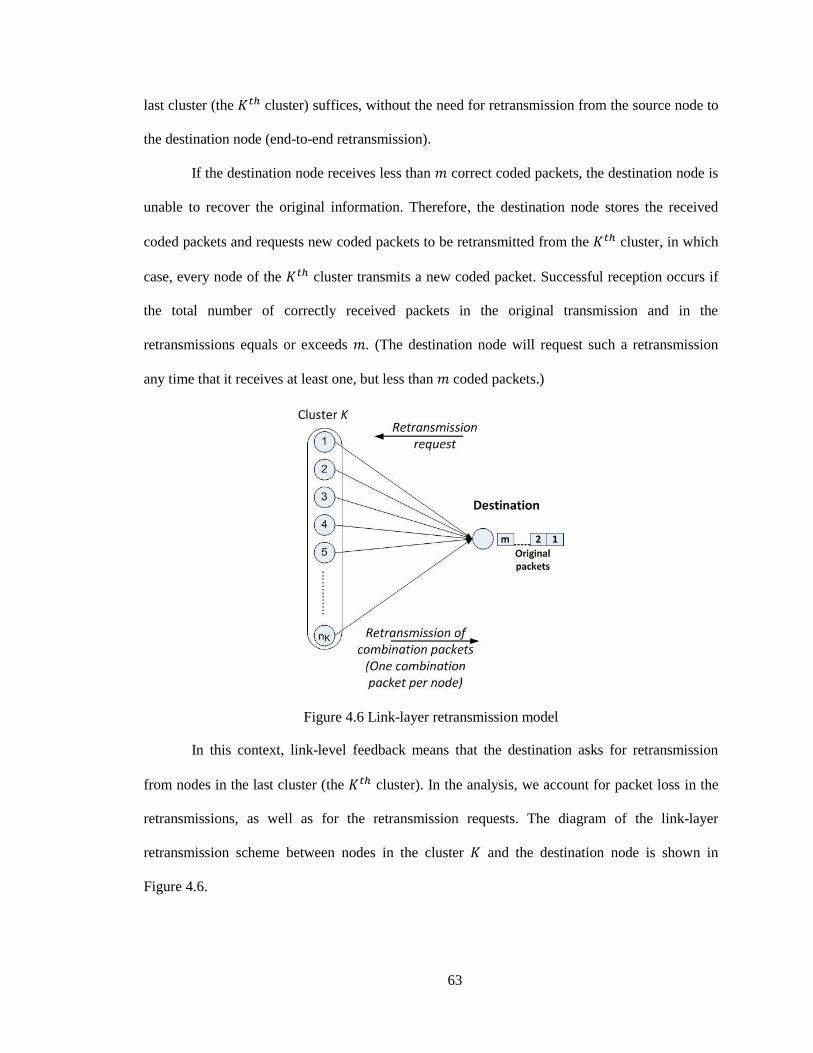
63
last cluster (the cluster) suffices, without the need for retransmission from the source node to
the destination node (end-to-end retransmission).
If the destination node receives less than correct coded packets, the destination node is
unable to recover the original information. Therefore, the destination node stores the received
coded packets and requests new coded packets to be retransmitted from the cluster, in which
case, every node of the cluster transmits a new coded packet. Successful reception occurs if
the total number of correctly received packets in the original transmission and in the
retransmissions equals or exceeds . (The destination node will request such a retransmission
any time that it receives at least one, but less than coded packets.)
Figure 4.6 Link-layer retransmission model
In this context, link-level feedback means that the destination asks for retransmission
from nodes in the last cluster (the cluster). In the analysis, we account for packet loss in the
retransmissions, as well as for the retransmission requests. The diagram of the link-layer
retransmission scheme between nodes in the cluster and the destination node is shown in
Figure 4.6.
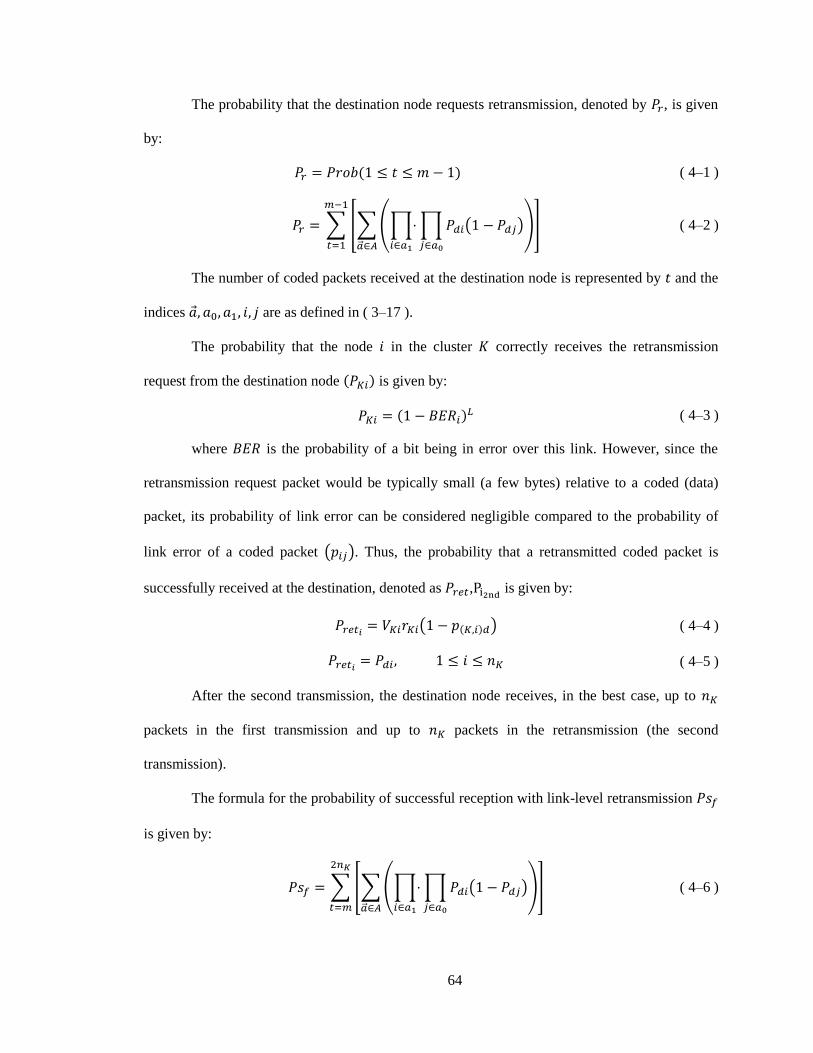
64
The probability that the destination node requests retransmission, denoted by , is given
by:
( 4–1 )
∑ [∑(∏
∏ ( )
)
]
( 4–2 )
The number of coded packets received at the destination node is represented by and the
indices are as defined in ( 3–17 ).
The probability that the node in the cluster correctly receives the retransmission
request from the destination node is given by:
( 4–3 )
where is the probability of a bit being in error over this link. However, since the
retransmission request packet would be typically small (a few bytes) relative to a coded (data)
packet, its probability of link error can be considered negligible compared to the probability of
link error of a coded packet ( ). Thus, the probability that a retransmitted coded packet is
successfully received at the destination, denoted as , is given by:
( ) ( 4–4 )
( 4–5 )
After the second transmission, the destination node receives, in the best case, up to
packets in the first transmission and up to packets in the retransmission (the second
transmission).
The formula for the probability of successful reception with link-level retransmission
is given by:
∑ [∑(∏
∏ ( )
)
]
( 4–6 )
65
under the following conditions:
is a set of binary sequence of all the possible combinations. A binary
sequence can contain either 0 or 1, where “1” means that the transmission was
successful and “0” otherwise. The number of 1’s in is and the number of 0’s is
; so there are (
) such sequences.
is a particular sequence from the set , is a set of all indices of such that
and is a set of all indices of such that . Thus,
‖ ‖ ‖ ‖ ( 4–7 )
is the probability that a coded packet, transmitted from node in the cluster , is
correctly received by the destination node.
In section 4.4.1 we evaluate the performance of Cooperative Network Coding with link-
level retransmission and compare to the results obtained in [22].
4.3 Cooperative Network Coding Optimization – Selective Retransmissions to Minimize
Energy Consumption
Achieving minimal energy consumption, with the required level of reliability is critical
for the proper functioning of many wireless sensor and body area networks. In this section we
will address this challenge for advanced network architectures including Cooperative Network
Coding (CNC) [22] that was introduced in CHAPTER 3.
It has been shown that NC also improves throughput in “noisy,” or lossy, networks [18],
[19], [22], [43], [52], [53]. However, in all of these network architectures, coded (parity) packets
have to be transmitted to overcome wireless channel impairments. This increases network
reliability at the expense of increasing the transmitted energy. We will address the design
tradeoffs in optimizing the use of error control and retransmissions to optimize performance
based on a statistical study because it goes beyond finding averages, as is the case when
mathematical analysis is used. Moreover, finding the distribution is a challenging nonlinear
66
problem and does not lend itself to analysis beyond averages. An example of this is the study of
the skewness, a measure of the asymmetry of a distribution, which is explained in detail later in
this chapter.
For CNC systems, as long as, the destination receives a sufficient number of error-free,
innovative (linearly independent) coded packets, the original (source) packets may be properly
recovered at the destination. There are two ways to implement NC; the first is through a
centralized scheme, where the coding coefficients are assigned to the nodes by a central node.
Complete linearly independency of the coded packets can be achieved with this methodology;
however, the network topology needs to be known by all the nodes. The second method, which is
known as Random Linear Network Coding (RLNC) [56], is to implement NC through a
decentralized scheme where each node randomly chooses the coding coefficients.
In [22], the authors study the performance of this scheme in terms of probability of
successful reception at the destination and the expected number of correctly received information
packets at the destination. Through a mathematical analysis, the authors concluded that the
number of nodes per cluster should be 15, when the number of original packets is 10. That is a
Network Coding rate of 2/3. Also, they found that the optimal connectivity of the nodes should be
8 and that the expected number of correctly received information packets at the destination of this
scheme is invariant with the number of hops (clusters). The authors compared this scheme with
other three schemes:
No-cooperation and no-Network Coding
Cooperation and no-Network Coding; and
No-cooperation and Network Coding.
The effect of link-level feedback and retransmissions on the performance of Cooperative
Network Coding, presented in the previous section, was analyzed in [39]. We found that by
having retransmissions only in the last cluster (cluster ), the performance of Cooperative
67
Network Coding can be improved when the number of nodes per cluster is low .
The analysis considers that all the nodes in the last cluster retransmit.
In this section, a mathematical analysis of the energy required to code packets and the
minimum number of coded packets that to be transmitted for Cooperative Network Coding is
presented. Further, a mathematical analysis of the energy required to code packets through
Cooperative Diversity Coding is studied and a comparison of these two techniques, in terms of
energy required to code packet is presented.
The energy required to network code a packet, ( 2–28 ), is calculated as:
( 4–8 )
where is the energy required to generate the random coefficients using linear
feedback shift register (LFSR), is the packet length in bits, is the energy require to
multiply a random coefficient and the packet (portion of the packet that depends on the Galois
Field size) and is the energy required to add the results of two multiplication processes.
Since with Network Coding, all the packets are coded, the energy required for each node to code
packets is:
( 4–9 )
(
) ( 4–10 )
In Network Coding, the linear independency of the coded packets is a function of the
field size. Thus, the expected number of transmitted packets until transmitting linearly
independent coded packets, when using RLNC, can be calculated as [67]:
∑
( )
( 4–11 )
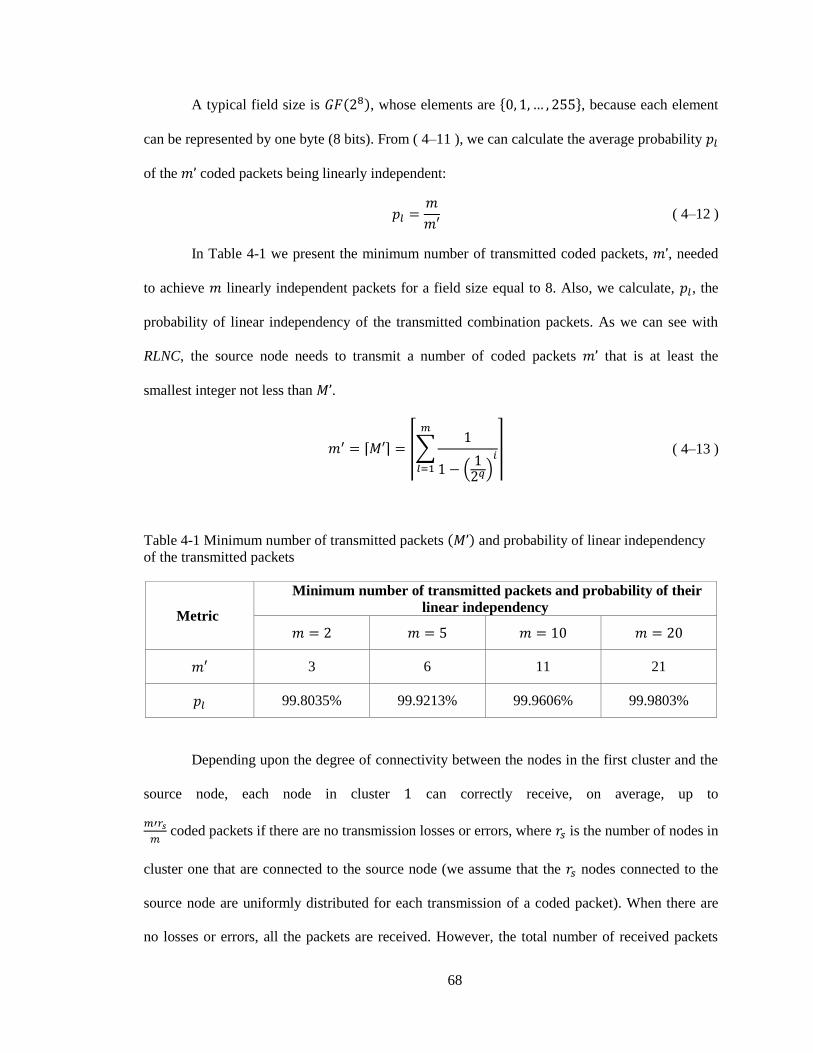
68
A typical field size is , whose elements are { }, because each element
can be represented by one byte (8 bits). From ( 4–11 ), we can calculate the average probability
of the coded packets being linearly independent:
( 4–12 )
In Table 4-1 we present the minimum number of transmitted coded packets, , needed
to achieve linearly independent packets for a field size equal to 8. Also, we calculate, , the
probability of linear independency of the transmitted combination packets. As we can see with
RLNC, the source node needs to transmit a number of coded packets that is at least the
smallest integer not less than .
⌈ ⌉ ⌈∑
( )
⌉ ( 4–13 )
Table 4-1 Minimum number of transmitted packets and probability of linear independency
of the transmitted packets
Metric
Minimum number of transmitted packets and probability of their
linear independency
3 6 11 21
99.8035% 99.9213% 99.9606% 99.9803%
Depending upon the degree of connectivity between the nodes in the first cluster and the
source node, each node in cluster can correctly receive, on average, up to
coded packets if there are no transmission losses or errors, where is the number of nodes in
cluster one that are connected to the source node (we assume that the nodes connected to the
source node are uniformly distributed for each transmission of a coded packet). When there are
no losses or errors, all the packets are received. However, the total number of received packets
69
depends on the connectivity between the source node and the nodes in the first cluster. For
example, if the connectivity is 2, then only 2 out of the nodes in cluster 1 can receive each
packet. However, because of the channel characteristics (probability of link error), some of coded
packets may not be received or received with errors. By combining the received packets, each
node in cluster creates a new coded packet and transmits it to the next cluster. In general, node
in the cluster creates and transmits to nodes in cluster a coded packet from the received
coded packets.
At the destination, the destination node needs to receive at least linearly independent
coded packets from nodes in cluster to be able to recover the original information. Decoding
could be done by block decoding or Gaussian elimination [19] applied to the matrix formed by
the packets header to determine the original packets { }.
In order to realize our goal of achieving minimal energy consumption, with the required
level of reliability, we study the effect of the linear independency of the coded packets for
multihop wireless networks and we propose a method to selectively retransmit coded packets
from the last cluster where the combination packets have full rank. That is, since each node in a
cluster transmits only one coded packet and all the nodes in a cluster cooperate to transmit linear
independent coded packets, full rank in a cluster is achieved when at least linear independent
packets are transmitted from the nodes in cluster , where . The nodes in cluster
cooperate by receiving coded packets from the previous cluster (cluster ), combining those
received packets and creating a new coded packet.
By using this selectivity of the retransmitted packets, we can minimize the average
energy consumed by each node and the energy required by the source node to create and transmit
combination packets. In case that the destination receives less than the minimum number of
linearly independent coded packets, selective retransmission from the last cluster that has full
rank (at least linearly independent coded packets) can be made to avoid any retransmission
70
from the source node. This feature of Cooperative Network Coding is very useful for multihop
networks.
When the destination node receives less than linear independent packets, it sends a
message to the previous clusters by using the initial route that was established between source
and destination nodes before the transmission began. The nodes that are part of this route and
were in charge of recruiting other nodes to create the clusters keep track of the number of linearly
independent packets (rank) that were transmitted by the nodes in their own clusters. Thus, when
the retransmission message from the destination node is received by the node in the last cluster
with full rank ( linearly independent packets), this node forwards the retransmission request to
the nodes in its cluster. Based on this retransmission request, the nodes in this cluster create a new
coded packet and retransmit.
With the aim of further minimizing the energy consumed by the source due to coding
operations; we also study the performance of cooperative Diversity Coding (CDC). Cooperative
Diversity Coding [40] operates similarly as to Cooperative Network Coding, but the difference is
in the method of how the source node chooses the coding coefficients. The source uses Diversity
Coding [13], which is an efficient technique to code packets. For CNC, the source creates coded
packets by randomly choosing the coding coefficients and for CDC, the source creates the
protection packets by using known coefficients from the Vandermonde matrix. Note that the
source node does not need to know the topology of the network because Diversity Coding is used
only at the source node (to reduce the energy consumed by the source node to create the coded
packets). The intermediate nodes use Network Coding to code the packets. By randomly choosing
the coefficients, linearly independency of the combination packets is not guaranteed as we can
see in Table 4-1. Moreover, the linearly independence of the coded packets depends on the Galois
field size. The higher the field size the higher is the probability of linear independence of the
combination packets; we can verify this using ( 4–11 ). On the other hand, by selecting known
coefficients from a Vandermonde matrix, it is guaranteed that all coded packets will be linearly
71
independent at the source. Moreover, since the coefficients are known, the computational
complexity is reduced because the Vandermonde matrix coefficients are stored in the sensor
memory. Also, no extra circuitry is needed (e.g. shift registers) as is the case for RLNC. The
simplicity of using Vandermonde matrix coefficients was implemented in Diversity Coding [13],
a forerunner of Network Coding. With the aim of minimize the energy required to code the
packets in multihop scenarios, the nodes could choose the coding coefficients from the
Vandermonde matrix. However, the nodes need to keep track of the coding coefficients (a row
from the Vandermonde matrix) to be able to properly decode the packets at the destination.
In Diversity Coding, the coding coefficients ( ) are calculated using ( 2–14 ). Thus, the
source uses the coefficients to calculate the coded packets ( 2–13 ):
∑
{ } ( 4–14 )
Note that with CDC the coded packets lose their linear independency at the clusters,
because the nodes in a cluster still use random Network Coding to create the new coded packets.
The main advantage of CDC over CNC is that the source saves computation energy by creating
coded packets using known coding coefficients (not random coefficients), which are stored in the
node’s memory. Also, with CDC, only the additional (protection) packets are coded and the
original information is transmitted uncoded. That is, the energy required to code a packet using
Diversity Coding is calculated as:
( 4–15 )
where is the packet length in bits, is the energy require to multiply a random
coefficient and the packet (portion of the packet that depends on the Galois filed size) and is
the energy required to add the results of two multiplication processes. Since with Diversity
Coding, only the protection packets are coded, the energy required for the source node to code
packets is:
72
( 4–16 )
( 4–17 )
As we can see from equations ( 4–10 ) and ( 4–17 ), the source node requires less energy
when using Diversity Coding to create coded packets ( ). That is given in ( 4–18 ):
( 4–18 )
where the second term on the right hand side of ( 4–18 ) is the energy savings for using
known coding coefficients and the third term on the right hand side of ( 4–18 ) is the energy
savings achieved for coding only the protection packets.
We can express the total number of transmitted packets in the network with CDC or CNC
as:
∏
( 4–19 )
4.4 Simulation Scenario for Wireless Ad hoc Networks
In this section, we present the results for Cooperative Network Coding with a
retransmission for all the nodes in the last cluster and simulation results and a statistical analysis
of the simulations for Cooperative Network Coding and Cooperative Diversity Coding with
retransmission from the last cluster that has full rank (at least linearly independent packets)
with the aim of minimizing the energy required to transmit a block of information by minimizing
the number of transmitted packets.
The parameters for the analyses and simulations of Cooperative Network Coding and
Cooperative Diversity Coding are similar to the parameters used in [22]:
The number of original packets is 10.
All the clusters have the same number of nodes
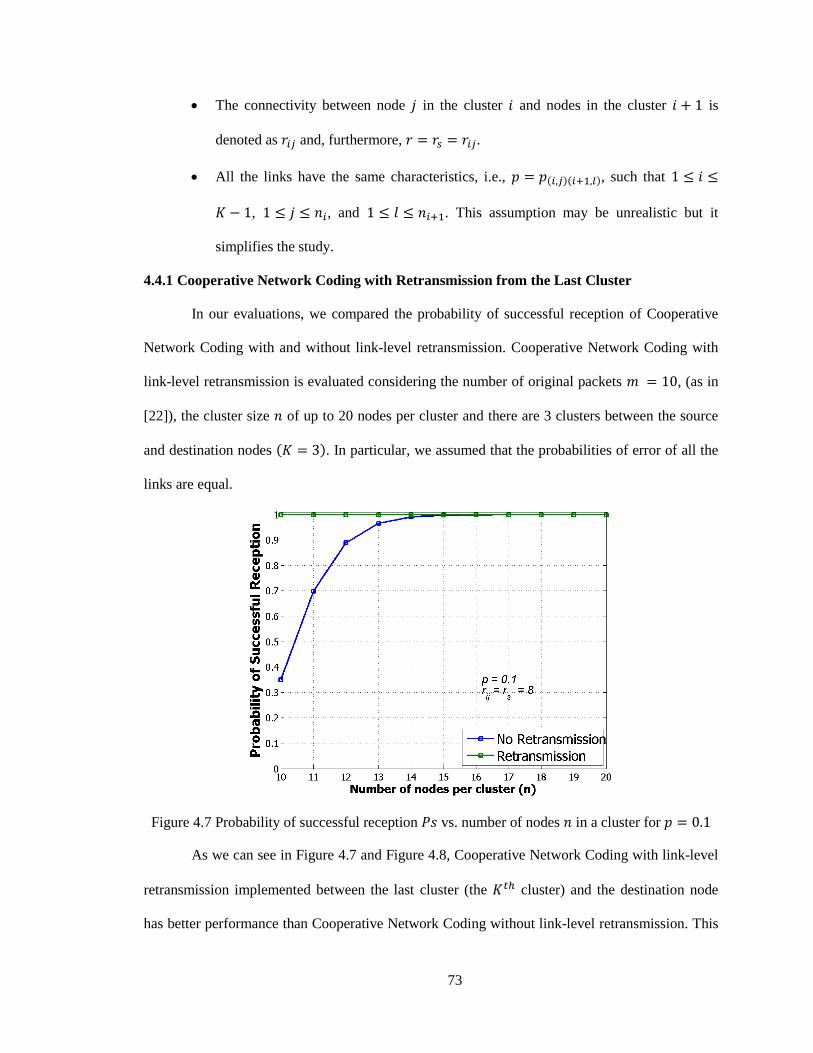
73
The connectivity between node in the cluster and nodes in the cluster is
denoted as and, furthermore, .
All the links have the same characteristics, i.e., , such that
, , and . This assumption may be unrealistic but it
simplifies the study.
4.4.1 Cooperative Network Coding with Retransmission from the Last Cluster
In our evaluations, we compared the probability of successful reception of Cooperative
Network Coding with and without link-level retransmission. Cooperative Network Coding with
link-level retransmission is evaluated considering the number of original packets , (as in
[22]), the cluster size of up to 20 nodes per cluster and there are 3 clusters between the source
and destination nodes . In particular, we assumed that the probabilities of error of all the
links are equal.
Figure 4.7 Probability of successful reception vs. number of nodes in a cluster for
As we can see in Figure 4.7 and Figure 4.8, Cooperative Network Coding with link-level
retransmission implemented between the last cluster (the cluster) and the destination node
has better performance than Cooperative Network Coding without link-level retransmission. This
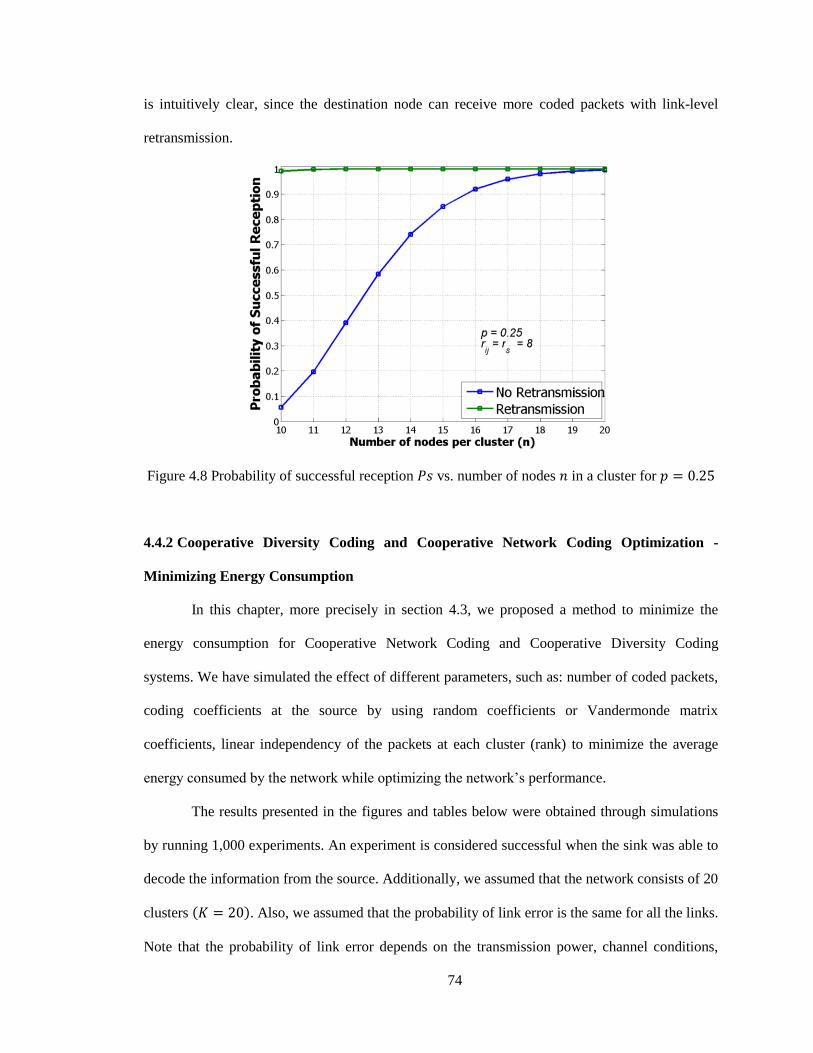
74
is intuitively clear, since the destination node can receive more coded packets with link-level
retransmission.
Figure 4.8 Probability of successful reception vs. number of nodes in a cluster for
4.4.2 Cooperative Diversity Coding and Cooperative Network Coding Optimization -
Minimizing Energy Consumption
In this chapter, more precisely in section 4.3, we proposed a method to minimize the
energy consumption for Cooperative Network Coding and Cooperative Diversity Coding
systems. We have simulated the effect of different parameters, such as: number of coded packets,
coding coefficients at the source by using random coefficients or Vandermonde matrix
coefficients, linear independency of the packets at each cluster (rank) to minimize the average
energy consumed by the network while optimizing the network’s performance.
The results presented in the figures and tables below were obtained through simulations
by running 1,000 experiments. An experiment is considered successful when the sink was able to
decode the information from the source. Additionally, we assumed that the network consists of 20
clusters . Also, we assumed that the probability of link error is the same for all the links.
Note that the probability of link error depends on the transmission power, channel conditions,
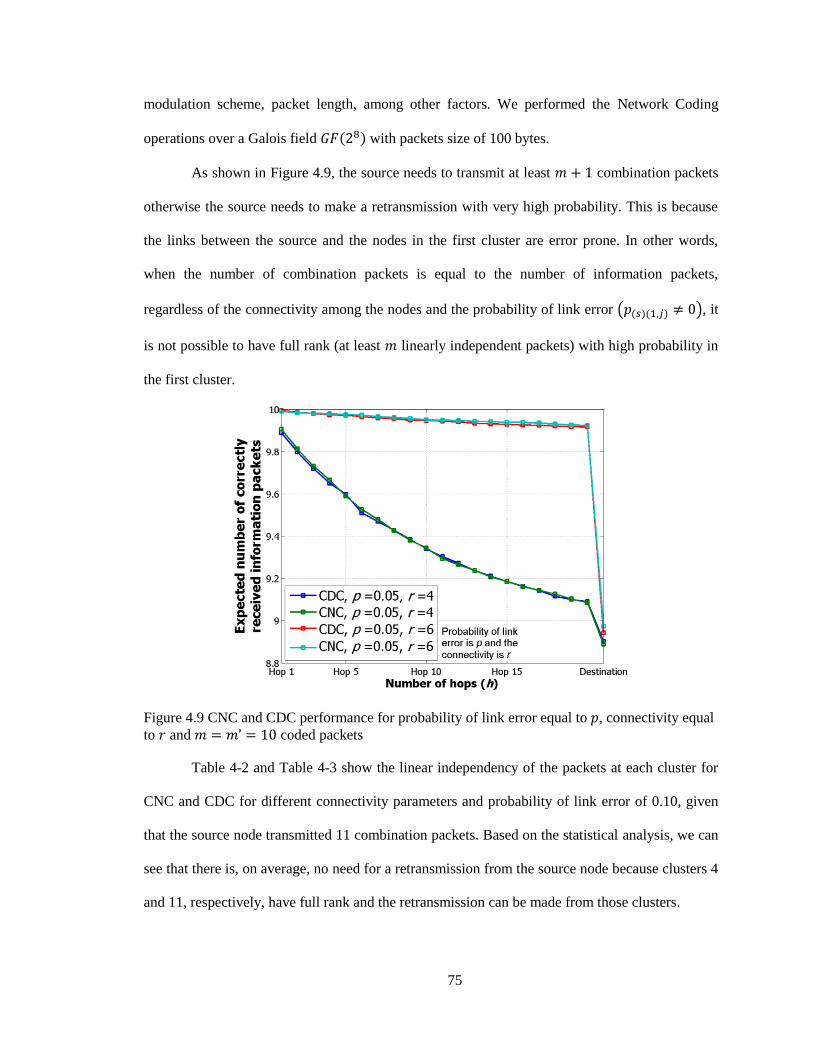
75
modulation scheme, packet length, among other factors. We performed the Network Coding
operations over a Galois field with packets size of 100 bytes.
As shown in Figure 4.9, the source needs to transmit at least combination packets
otherwise the source needs to make a retransmission with very high probability. This is because
the links between the source and the nodes in the first cluster are error prone. In other words,
when the number of combination packets is equal to the number of information packets,
regardless of the connectivity among the nodes and the probability of link error ( ), it
is not possible to have full rank (at least linearly independent packets) with high probability in
the first cluster.
Figure 4.9 CNC and CDC performance for probability of link error equal to , connectivity equal
to and coded packets
Table 4-2 and Table 4-3 show the linear independency of the packets at each cluster for
CNC and CDC for different connectivity parameters and probability of link error of 0.10, given
that the source node transmitted 11 combination packets. Based on the statistical analysis, we can
see that there is, on average, no need for a retransmission from the source node because clusters 4
and 11, respectively, have full rank and the retransmission can be made from those clusters.
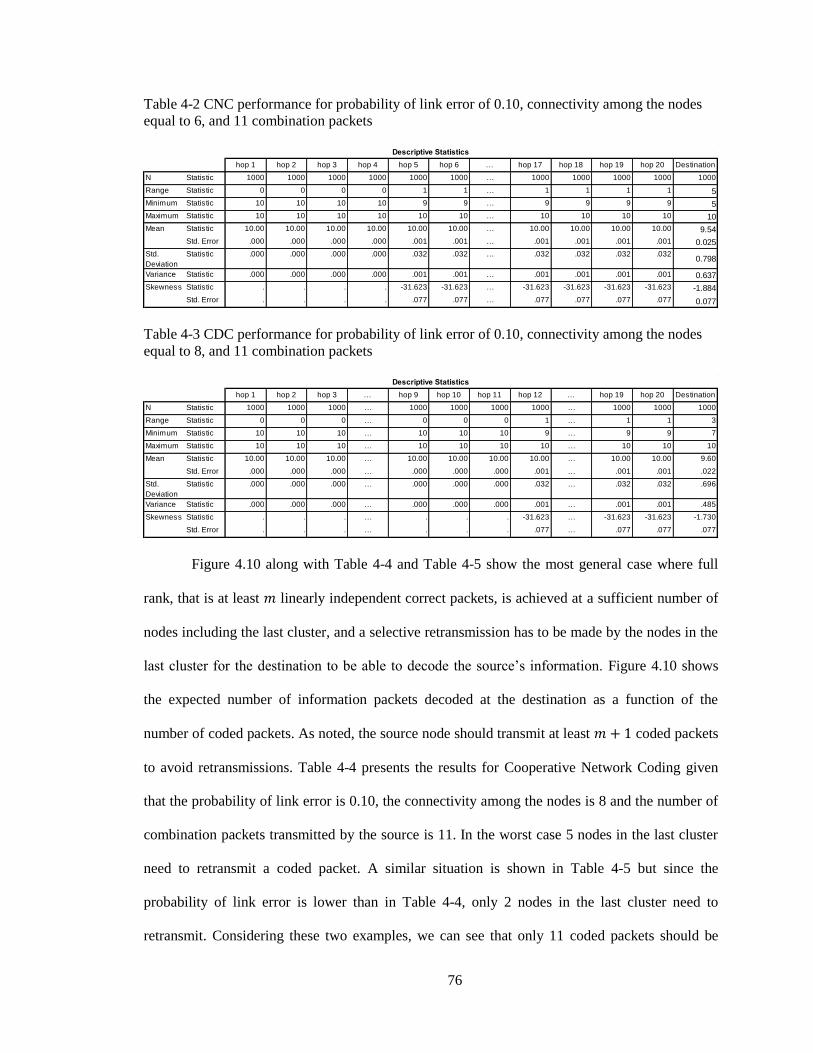
76
Table 4-2 CNC performance for probability of link error of 0.10, connectivity among the nodes
equal to 6, and 11 combination packets
Table 4-3 CDC performance for probability of link error of 0.10, connectivity among the nodes
equal to 8, and 11 combination packets
Figure 4.10 along with Table 4-4 and Table 4-5 show the most general case where full
rank, that is at least linearly independent correct packets, is achieved at a sufficient number of
nodes including the last cluster, and a selective retransmission has to be made by the nodes in the
last cluster for the destination to be able to decode the source’s information. Figure 4.10 shows
the expected number of information packets decoded at the destination as a function of the
number of coded packets. As noted, the source node should transmit at least coded packets
to avoid retransmissions. Table 4-4 presents the results for Cooperative Network Coding given
that the probability of link error is 0.10, the connectivity among the nodes is 8 and the number of
combination packets transmitted by the source is 11. In the worst case 5 nodes in the last cluster
need to retransmit a coded packet. A similar situation is shown in Table 4-5 but since the
probability of link error is lower than in Table 4-4, only 2 nodes in the last cluster need to
retransmit. Considering these two examples, we can see that only 11 coded packets should be
hop 1 hop 2 hop 3 hop 4 hop 5 hop 6 … hop 17 hop 18 hop 19 hop 20 Destination
N Statistic 1000 1000 1000 1000 1000 1000 … 1000 1000 1000 1000 1000
Range Statistic 0 0 0 0 1 1 … 1 1 1 1 5
Minimum Statistic 10 10 10 10 9 9 … 9 9 9 9 5
Maximum Statistic 10 10 10 10 10 10 … 10 10 10 10 10
Statistic 10.00 10.00 10.00 10.00 10.00 10.00 … 10.00 10.00 10.00 10.00 9.54
Std. Error .000 .000 .000 .000 .001 .001 … .001 .001 .001 .001 0.025
Std.
Deviation
Statistic .000 .000 .000 .000 .032 .032 … .032 .032 .032 .0320.798
Variance Statistic .000 .000 .000 .000 .001 .001 … .001 .001 .001 .001 0.637
Statistic . . . . -31.623 -31.623 … -31.623 -31.623 -31.623 -31.623 -1.884
Std. Error . . . . .077 .077 … .077 .077 .077 .077 0.077
Descriptive Statistics
Mean
Skewness
hop 1 hop 2 hop 3 … hop 9 hop 10 hop 11 hop 12 … hop 19 hop 20 Destination
N Statistic 1000 1000 1000 … 1000 1000 1000 1000 … 1000 1000 1000
Range Statistic 0 0 0 … 0 0 0 1 … 1 1 3
Minimum Statistic 10 10 10 … 10 10 10 9 … 9 9 7
Maximum Statistic 10 10 10 … 10 10 10 10 … 10 10 10
Statistic 10.00 10.00 10.00 … 10.00 10.00 10.00 10.00 … 10.00 10.00 9.60
Std. Error .000 .000 .000 … .000 .000 .000 .001 … .001 .001 .022
Std.
Deviation
Statistic .000 .000 .000 … .000 .000 .000 .032 … .032 .032 .696
Variance Statistic .000 .000 .000 … .000 .000 .000 .001 … .001 .001 .485
Statistic . . . … . . . -31.623 … -31.623 -31.623 -1.730
Std. Error . . . … . . . .077 … .077 .077 .077
Descriptive Statistics
Mean
Skewness

77
transmitted by each cluster (one coded packet per node) plus one retransmission (5 and 2 coded
packets, respectively) from the last cluster (cluster 20) for the destination to be able to reliably
decode the original packets.
Moreover, all the tables (Table 4-2 – Table 4-5) show that the skewness, a measure of the
asymmetry of a probability distribution, is negative, which means that most of the values of the
probability distribution lie to the right of the mean. For example, in Table 4-4 and Table 4-5, the
mean at the destination node is 9.88, which means that all the 10 original packets were recovered
in an average of 98.8% of the simulations. Also, Table 4-4 and Table 4-5 show, through the
skewness, that most of the values lie to the right of the 98.8%. In other words, the 10 original
packets are recovered most of the time. This characteristic is omitted in mathematical analyses
that consider only averages values.
Comparing with [22], where 15 combination packets should be transmitted to achieve full
throughput, our approach, which selectively retransmits coded packets from the last cluster that
has full rank ( linearly independent packets), reduces by 26% the energy consumed by the
network. That is, the source node transmits 15 coded packets to the nodes in the first cluster.
Then, the nodes in a cluster (15 nodes per cluster), transmits one coded packet to the nodes in the
next cluster, and so on. So, we can calculate the number of transmitted packets to achieve full
throughput at the destination by using (15), which is 315 packets for a 21-hop network. Using our
approach, we only need to transmit 233 packets (Table 4-5) to achieve full throughput at the
destination node. Moreover, since each node is receiving fewer packets, the energy required to
create a new coded packet is reduced. In addition, as shown in (14), extra energy savings for the
overall network are achieved when CDC is used at the source node.
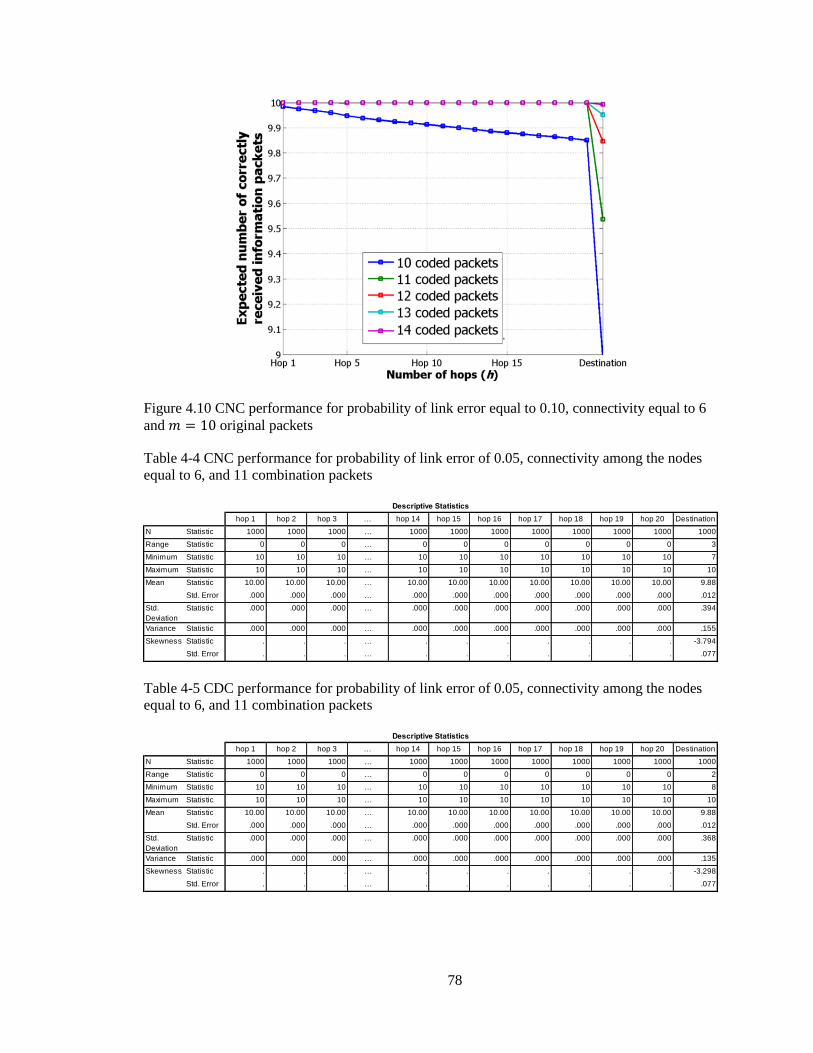
78
Figure 4.10 CNC performance for probability of link error equal to 0.10, connectivity equal to 6
and original packets
Table 4-4 CNC performance for probability of link error of 0.05, connectivity among the nodes
equal to 6, and 11 combination packets
Table 4-5 CDC performance for probability of link error of 0.05, connectivity among the nodes
equal to 6, and 11 combination packets
hop 1 hop 2 hop 3 … hop 14 hop 15 hop 16 hop 17 hop 18 hop 19 hop 20 Destination
N Statistic 1000 1000 1000 … 1000 1000 1000 1000 1000 1000 1000 1000
Range Statistic 0 0 0 … 0 0 0 0 0 0 0 3
Minimum Statistic 10 10 10 … 10 10 10 10 10 10 10 7
Maximum Statistic 10 10 10 … 10 10 10 10 10 10 10 10
Statistic 10.00 10.00 10.00 … 10.00 10.00 10.00 10.00 10.00 10.00 10.00 9.88
Std. Error .000 .000 .000 … .000 .000 .000 .000 .000 .000 .000 .012
Std.
Deviation
Statistic .000 .000 .000 … .000 .000 .000 .000 .000 .000 .000 .394
Variance Statistic .000 .000 .000 … .000 .000 .000 .000 .000 .000 .000 .155
Statistic . . . … . . . . . . . -3.794
Std. Error . . . … . . . . . . . .077
Descriptive Statistics
Mean
Skewness
hop 1 hop 2 hop 3 … hop 14 hop 15 hop 16 hop 17 hop 18 hop 19 hop 20 Destination
N Statistic 1000 1000 1000 … 1000 1000 1000 1000 1000 1000 1000 1000
Range Statistic 0 0 0 … 0 0 0 0 0 0 0 2
Minimum Statistic 10 10 10 … 10 10 10 10 10 10 10 8
Maximum Statistic 10 10 10 … 10 10 10 10 10 10 10 10
Statistic 10.00 10.00 10.00 … 10.00 10.00 10.00 10.00 10.00 10.00 10.00 9.88
Std. Error .000 .000 .000 … .000 .000 .000 .000 .000 .000 .000 .012
Std.
Deviation
Statistic .000 .000 .000 … .000 .000 .000 .000 .000 .000 .000 .368
Variance Statistic .000 .000 .000 … .000 .000 .000 .000 .000 .000 .000 .135
Statistic . . . … . . . . . . . -3.298
Std. Error . . . … . . . . . . . .077
Descriptive Statistics
Mean
Skewness
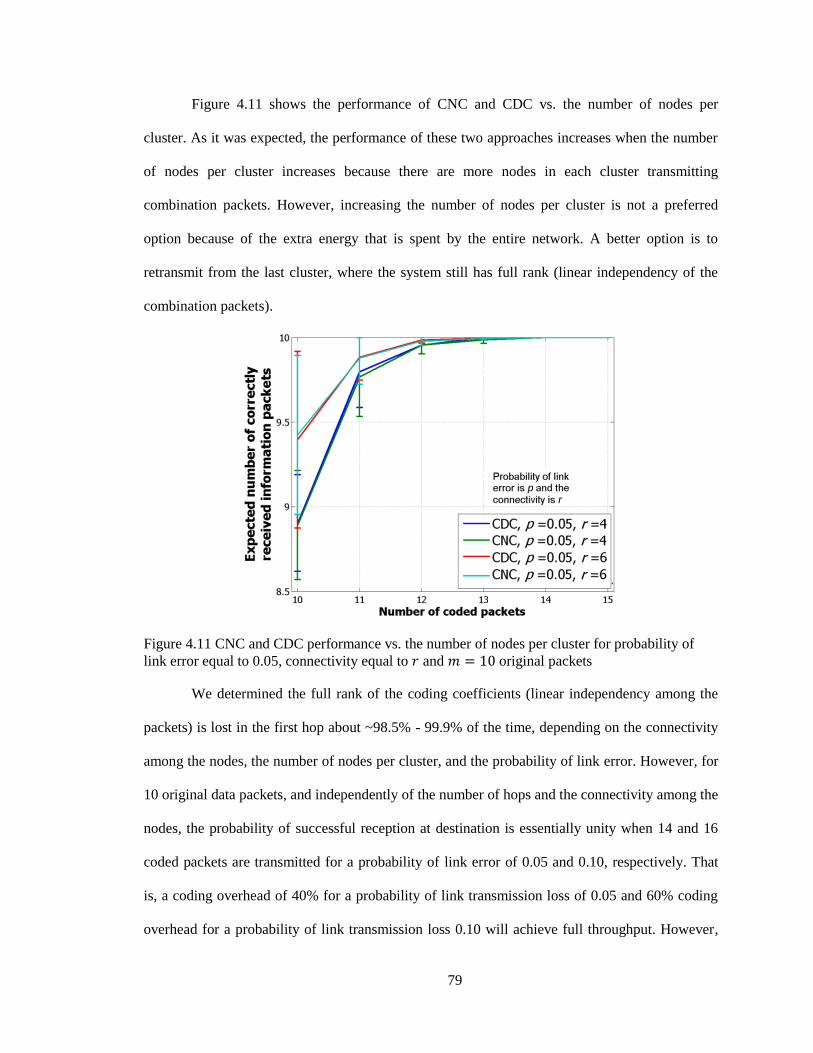
79
Figure 4.11 shows the performance of CNC and CDC vs. the number of nodes per
cluster. As it was expected, the performance of these two approaches increases when the number
of nodes per cluster increases because there are more nodes in each cluster transmitting
combination packets. However, increasing the number of nodes per cluster is not a preferred
option because of the extra energy that is spent by the entire network. A better option is to
retransmit from the last cluster, where the system still has full rank (linear independency of the
combination packets).
Figure 4.11 CNC and CDC performance vs. the number of nodes per cluster for probability of
link error equal to 0.05, connectivity equal to and original packets
We determined the full rank of the coding coefficients (linear independency among the
packets) is lost in the first hop about ~98.5% - 99.9% of the time, depending on the connectivity
among the nodes, the number of nodes per cluster, and the probability of link error. However, for
10 original data packets, and independently of the number of hops and the connectivity among the
nodes, the probability of successful reception at destination is essentially unity when 14 and 16
coded packets are transmitted for a probability of link error of 0.05 and 0.10, respectively. That
is, a coding overhead of 40% for a probability of link transmission loss of 0.05 and 60% coding
overhead for a probability of link transmission loss 0.10 will achieve full throughput. However,
80
with the aim of minimizing the energy consumed by the nodes in transmitting coded packets, the
source need only transmit about 10% - 30% coded packets and utilize retransmission by the nodes
in the last cluster that has full rank (100% linear independency among the packets) to minimize
energy utilization. Our statistical analysis has shown that most of the retransmissions are only
required at the last cluster. In this way we optimize the energy consumed by each node and
minimize the energy consumed by the source node. Moreover, we minimize the delay introduce
by the retransmissions because no retransmission is done from the source node.
Since these are random events, minimum energy consumption can be achieved in practice
by the nodes listening to the transmitted coded packets from their own cluster and calculating the
rank of the system. Note that the nodes that form a cluster are geographically close to each other
and they can hear each other’s packets with high probability. For example, if there are nodes in
cluster and assuming that the node transmits first and node transmits last, node 2 can check
whether it coded packet is linear independent with the coded packet already transmitted by node
1. If the packet is not linearly independent, node 2 can discard that packet and create a new coded
packet and transmit it. Then node 3 creates a coded packet from the received packets and checks
whether this packet is linearly independent with the previous transmitted packets (packet from
node 1 and 2). If its packet is not linearly independent, it creates a new coded packet and
transmits it. This process continues until node creates its own packet from the coded packets
received from the previous cluster and checks the rank of the packets already transmitted by the
other nodes and its own packet. If there are not enough linearly independent packets (i.e.
less than linearly independent packets), node requests retransmission from the nodes in the
previous cluster (cluster ).
In summary the above approach of selective retransmissions will minimize both the
energy consumed by the network and the delay, while achieving the desired throughput.
81
4.5 Concluding Remarks
4.5.1 Cooperative Network Coding with Retransmissions
Our study in this chapter focused on analyzing the effect of link-level retransmission on
the performance of Cooperative Network Coding [39]. Based on the range of parameters we have
investigated, Cooperative Networking with link-level retransmission offers significant
performance improvement in sparse wireless sensor networks, that is when the cluster size and
the connectivity of the network are small.
By implementing link-level retransmission in Cooperative Networking, the probability of
successful reception can be increased from 0.05 without link-level retransmissions to close to
1 with link-level retransmissions, when the number of nodes per cluster is equal to the number
of original packets and the probability of link error is 0.25.
For cluster sizes of less than 15 nodes per cluster and the connectivity of nodes less
than 8, link-level retransmissions offers a significant improvement in the probability of successful
reception from values in the range (0.05 to 0.35) with no link-level retransmissions, to values
greater than 0.95 with link-level retransmissions.
Moreover, when not all the nodes in the cluster are connected to the destination node,
link-layer retransmission can help to increase the network’s performance without increasing the
cluster size.
Also, we observe that link-layer retransmissions on other than the last hop will not
produce significant improvement in the performance of Cooperative Networking, since the
probability that a node in the cluster correctly receives at least one combination packet, , is
already close to 1. In fact, implementation of link-layer retransmissions on other than the last hop
would be counter-productive, because of the unnecessary consumption of network resources and
the introduction of extraneous traffic in the network.

82
In conclusion, Cooperative Networking with link-level retransmission results in larger
probability of successful reception together with increased throughput when there are small
clusters, when the connectivity of the network is small , and when the probability
of link error is large . These conditions are representative sparse sensor networks.
4.5.2 Cooperative Diversity Coding and Cooperative Network Coding Optimization -
Minimizing Energy Consumption
Our approach of selective retransmissions [40] minimizes the energy consumed by
multihop wireless packet networks that use Cooperative Network Coding (CNC) or a novel
variant Cooperative Diversity Coding (CDC). By optimizing and balancing the use of forward
error control, error detection, and retransmissions at packet level in such networks we can both
minimize the energy consumption and network latency.
The energy savings obtained by using our approaches (CNC and CDC) are about 26%
compared to the baseline CNC approach. Our approaches attain energy savings by making
selective retransmissions from the last cluster that has full rank (at least linear independent
packets), which is typically the last cluster. Further, our CDC approach further reduces the energy
and complexity of the source node to create coded packets.
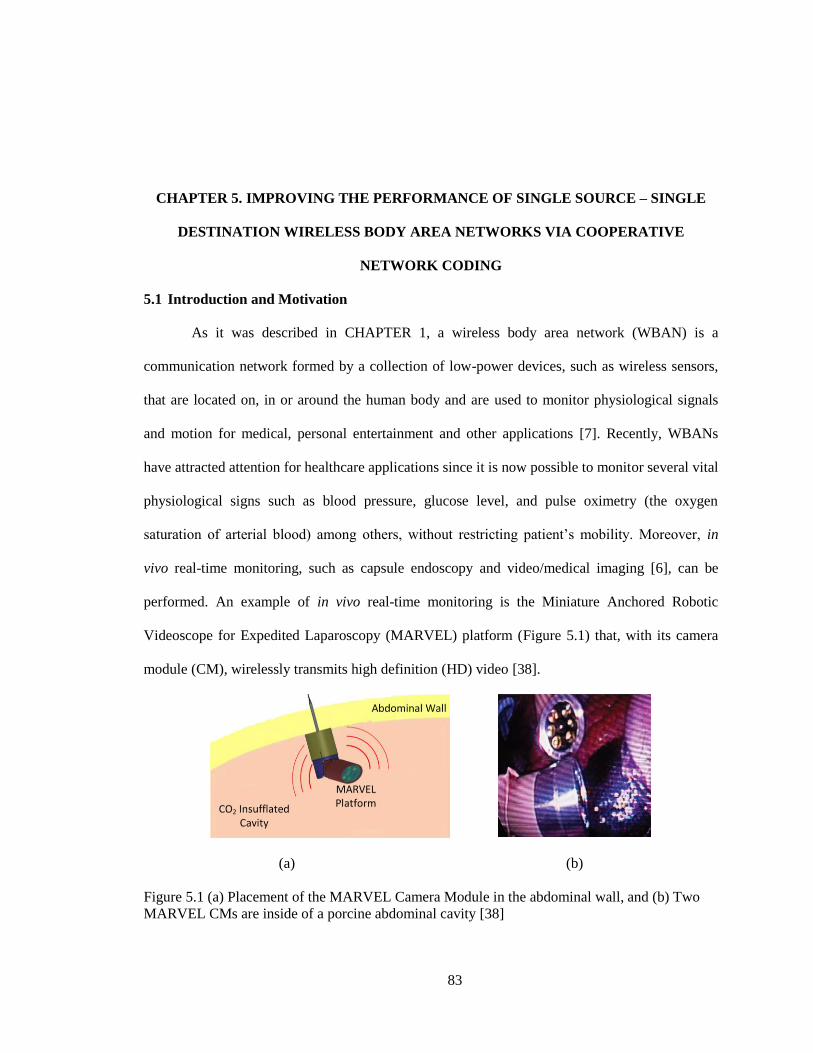
83
CHAPTER 5. IMPROVING THE PERFORMANCE OF SINGLE SOURCE – SINGLE
DESTINATION WIRELESS BODY AREA NETWORKS VIA COOPERATIVE
NETWORK CODING
5.1 Introduction and Motivation
As it was described in CHAPTER 1, a wireless body area network (WBAN) is a
communication network formed by a collection of low-power devices, such as wireless sensors,
that are located on, in or around the human body and are used to monitor physiological signals
and motion for medical, personal entertainment and other applications [7]. Recently, WBANs
have attracted attention for healthcare applications since it is now possible to monitor several vital
physiological signs such as blood pressure, glucose level, and pulse oximetry (the oxygen
saturation of arterial blood) among others, without restricting patient’s mobility. Moreover, in
vivo real-time monitoring, such as capsule endoscopy and video/medical imaging [6], can be
performed. An example of in vivo real-time monitoring is the Miniature Anchored Robotic
Videoscope for Expedited Laparoscopy (MARVEL) platform (Figure 5.1) that, with its camera
module (CM), wirelessly transmits high definition (HD) video [38].
(a) (b)
Figure 5.1 (a) Placement of the MARVEL Camera Module in the abdominal wall, and (b) Two
MARVEL CMs are inside of a porcine abdominal cavity [38]
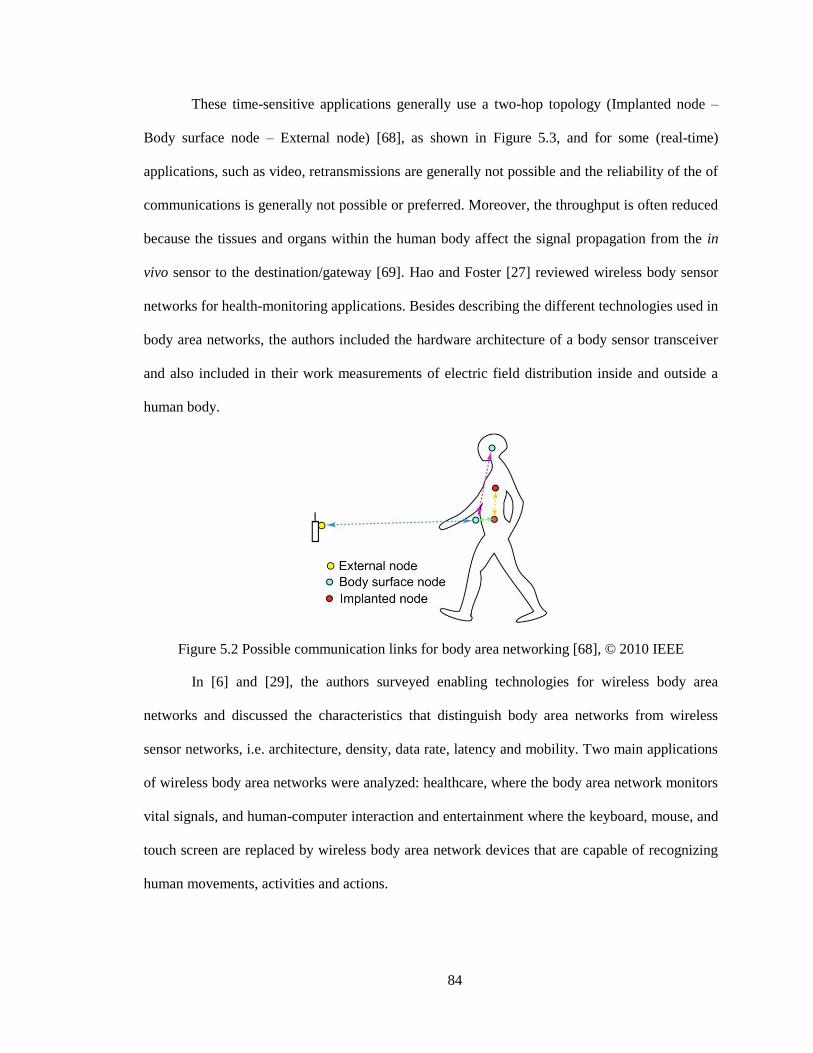
84
These time-sensitive applications generally use a two-hop topology (Implanted node –
Body surface node – External node) [68], as shown in Figure 5.3, and for some (real-time)
applications, such as video, retransmissions are generally not possible and the reliability of the of
communications is generally not possible or preferred. Moreover, the throughput is often reduced
because the tissues and organs within the human body affect the signal propagation from the in
vivo sensor to the destination/gateway [69]. Hao and Foster [27] reviewed wireless body sensor
networks for health-monitoring applications. Besides describing the different technologies used in
body area networks, the authors included the hardware architecture of a body sensor transceiver
and also included in their work measurements of electric field distribution inside and outside a
human body.
Figure 5.2 Possible communication links for body area networking [68], © 2010 IEEE
In [6] and [29], the authors surveyed enabling technologies for wireless body area
networks and discussed the characteristics that distinguish body area networks from wireless
sensor networks, i.e. architecture, density, data rate, latency and mobility. Two main applications
of wireless body area networks were analyzed: healthcare, where the body area network monitors
vital signals, and human-computer interaction and entertainment where the keyboard, mouse, and
touch screen are replaced by wireless body area network devices that are capable of recognizing
human movements, activities and actions.
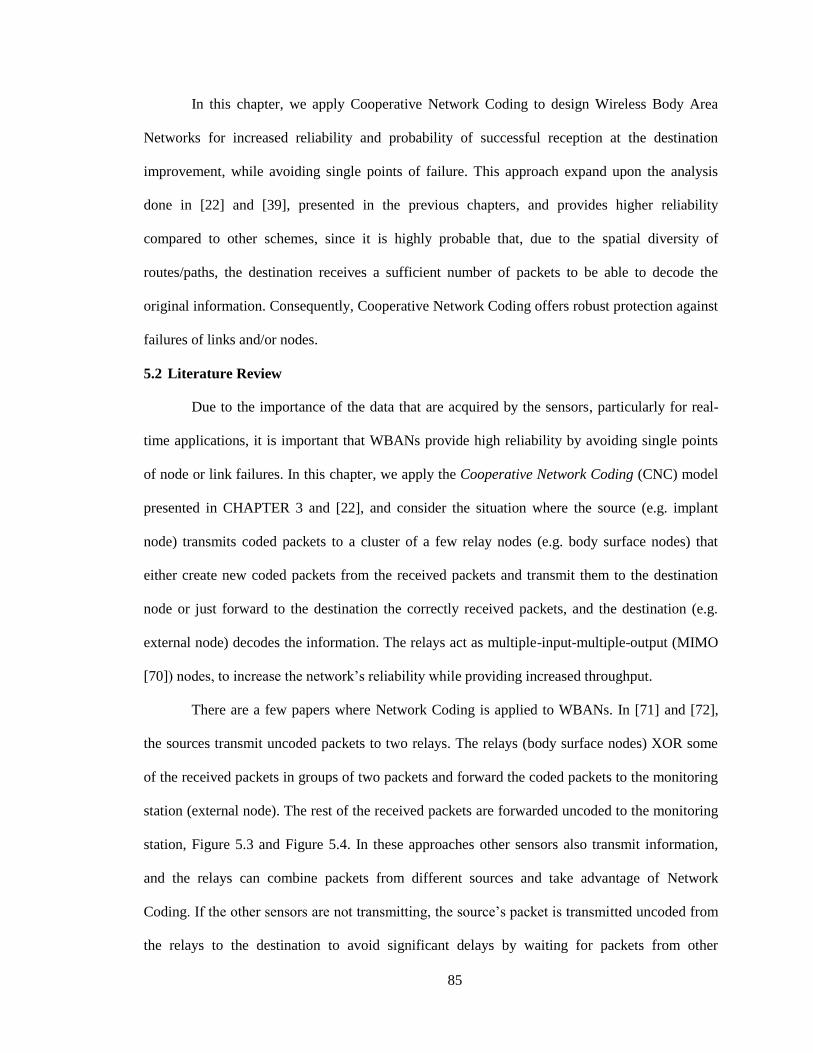
85
In this chapter, we apply Cooperative Network Coding to design Wireless Body Area
Networks for increased reliability and probability of successful reception at the destination
improvement, while avoiding single points of failure. This approach expand upon the analysis
done in [22] and [39], presented in the previous chapters, and provides higher reliability
compared to other schemes, since it is highly probable that, due to the spatial diversity of
routes/paths, the destination receives a sufficient number of packets to be able to decode the
original information. Consequently, Cooperative Network Coding offers robust protection against
failures of links and/or nodes.
5.2 Literature Review
Due to the importance of the data that are acquired by the sensors, particularly for real-
time applications, it is important that WBANs provide high reliability by avoiding single points
of node or link failures. In this chapter, we apply the Cooperative Network Coding (CNC) model
presented in CHAPTER 3 and [22], and consider the situation where the source (e.g. implant
node) transmits coded packets to a cluster of a few relay nodes (e.g. body surface nodes) that
either create new coded packets from the received packets and transmit them to the destination
node or just forward to the destination the correctly received packets, and the destination (e.g.
external node) decodes the information. The relays act as multiple-input-multiple-output (MIMO
[70]) nodes, to increase the network’s reliability while providing increased throughput.
There are a few papers where Network Coding is applied to WBANs. In [71] and [72],
the sources transmit uncoded packets to two relays. The relays (body surface nodes) XOR some
of the received packets in groups of two packets and forward the coded packets to the monitoring
station (external node). The rest of the received packets are forwarded uncoded to the monitoring
station, Figure 5.3 and Figure 5.4. In these approaches other sensors also transmit information,
and the relays can combine packets from different sources and take advantage of Network
Coding. If the other sensors are not transmitting, the source’s packet is transmitted uncoded from
the relays to the destination to avoid significant delays by waiting for packets from other
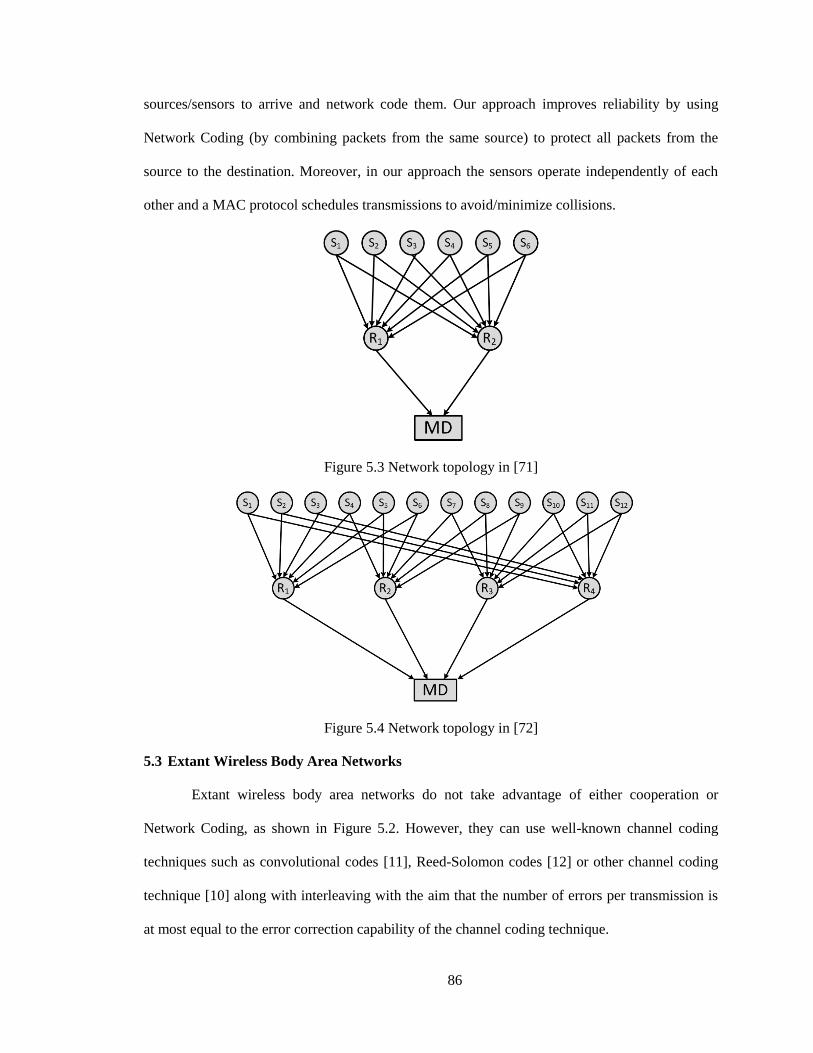
86
sources/sensors to arrive and network code them. Our approach improves reliability by using
Network Coding (by combining packets from the same source) to protect all packets from the
source to the destination. Moreover, in our approach the sensors operate independently of each
other and a MAC protocol schedules transmissions to avoid/minimize collisions.
Figure 5.3 Network topology in [71]
Figure 5.4 Network topology in [72]
5.3 Extant Wireless Body Area Networks
Extant wireless body area networks do not take advantage of either cooperation or
Network Coding, as shown in Figure 5.2. However, they can use well-known channel coding
techniques such as convolutional codes [11], Reed-Solomon codes [12] or other channel coding
technique [10] along with interleaving with the aim that the number of errors per transmission is
at most equal to the error correction capability of the channel coding technique.
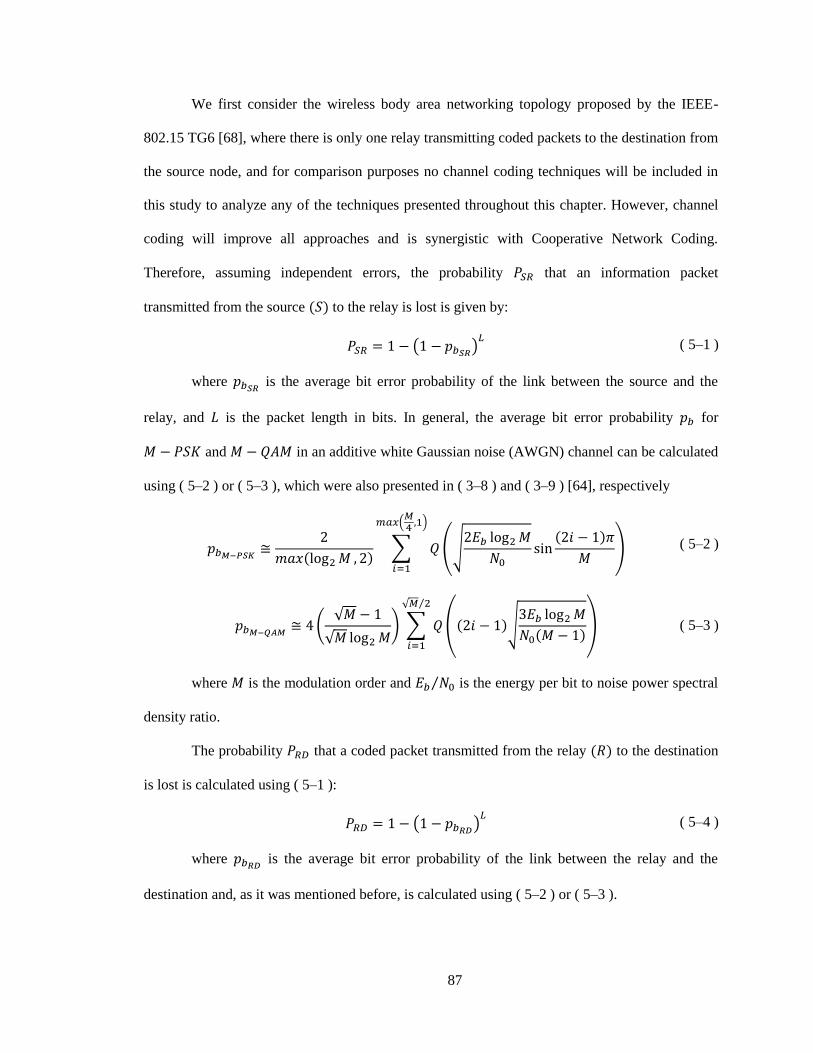
87
We first consider the wireless body area networking topology proposed by the IEEE-
802.15 TG6 [68], where there is only one relay transmitting coded packets to the destination from
the source node, and for comparison purposes no channel coding techniques will be included in
this study to analyze any of the techniques presented throughout this chapter. However, channel
coding will improve all approaches and is synergistic with Cooperative Network Coding.
Therefore, assuming independent errors, the probability that an information packet
transmitted from the source to the relay is lost is given by:
( ) ( 5–1 )
where is the average bit error probability of the link between the source and the
relay, and is the packet length in bits. In general, the average bit error probability for
and in an additive white Gaussian noise (AWGN) channel can be calculated
using ( 5–2 ) or ( 5–3 ), which were also presented in ( 3–8 ) and ( 3–9 ) [64], respectively
∑ (√
)
( )
( 5–2 )
(
√
√ ) ∑ ( √
)
√ ⁄
( 5–3 )
where is the modulation order and ⁄ is the energy per bit to noise power spectral
density ratio.
The probability that a coded packet transmitted from the relay to the destination
is lost is calculated using ( 5–1 ):
( ) ( 5–4 )
where is the average bit error probability of the link between the relay and the
destination and, as it was mentioned before, is calculated using ( 5–2 ) or ( 5–3 ).
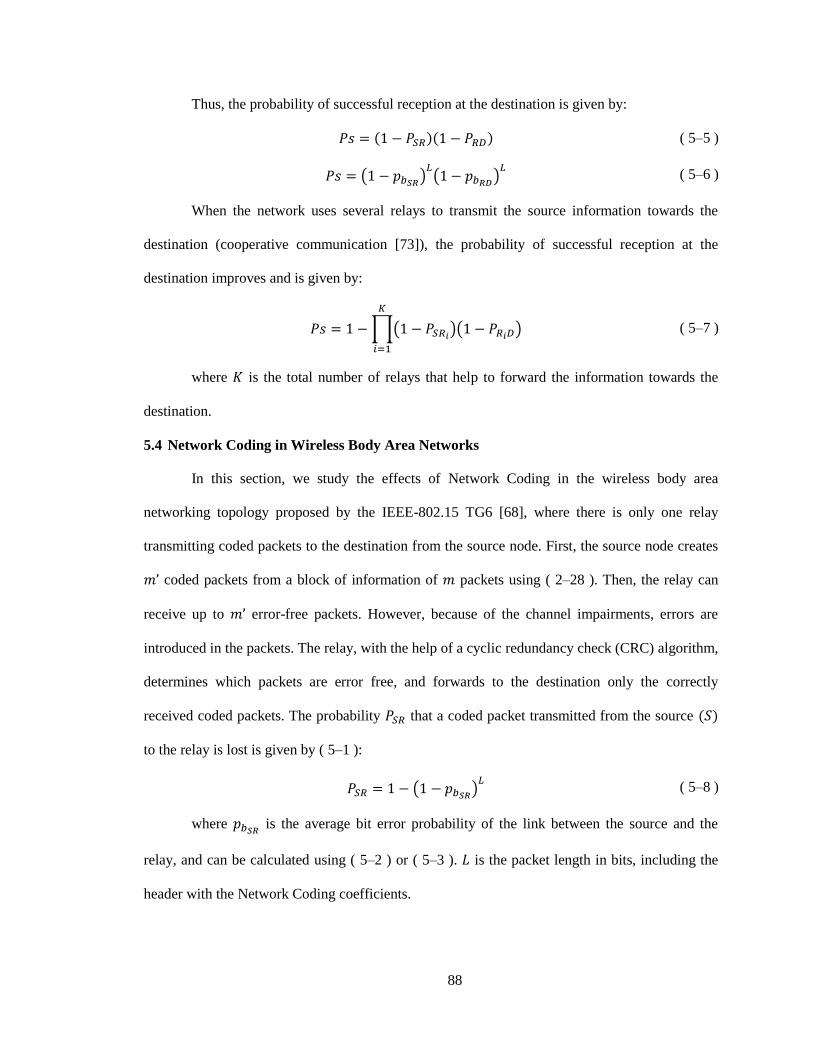
88
Thus, the probability of successful reception at the destination is given by:
( 5–5 )
( ) (
) ( 5–6 )
When the network uses several relays to transmit the source information towards the
destination (cooperative communication [73]), the probability of successful reception at the
destination improves and is given by:
∏( )( )
( 5–7 )
where is the total number of relays that help to forward the information towards the
destination.
5.4 Network Coding in Wireless Body Area Networks
In this section, we study the effects of Network Coding in the wireless body area
networking topology proposed by the IEEE-802.15 TG6 [68], where there is only one relay
transmitting coded packets to the destination from the source node. First, the source node creates
coded packets from a block of information of packets using ( 2–28 ). Then, the relay can
receive up to error-free packets. However, because of the channel impairments, errors are
introduced in the packets. The relay, with the help of a cyclic redundancy check (CRC) algorithm,
determines which packets are error free, and forwards to the destination only the correctly
received coded packets. The probability that a coded packet transmitted from the source
to the relay is lost is given by ( 5–1 ):
( ) ( 5–8 )
where is the average bit error probability of the link between the source and the
relay, and can be calculated using ( 5–2 ) or ( 5–3 ). is the packet length in bits, including the
header with the Network Coding coefficients.
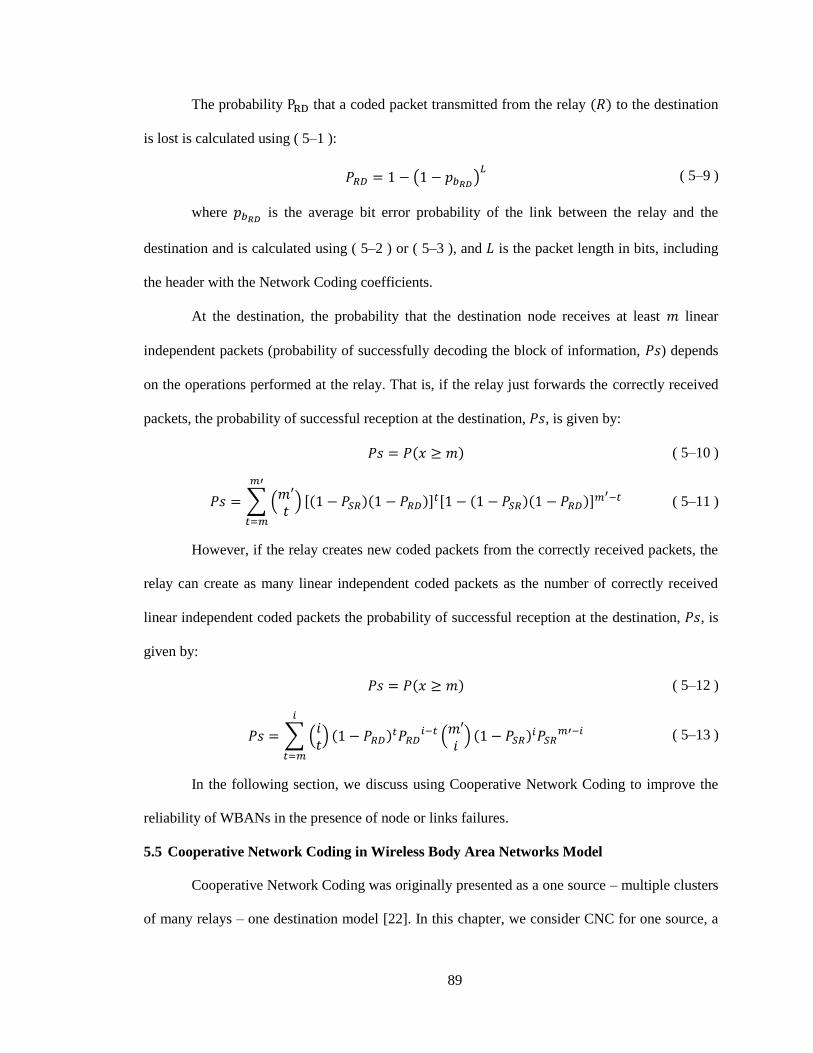
89
The probability that a coded packet transmitted from the relay to the destination
is lost is calculated using ( 5–1 ):
( ) ( 5–9 )
where is the average bit error probability of the link between the relay and the
destination and is calculated using ( 5–2 ) or ( 5–3 ), and is the packet length in bits, including
the header with the Network Coding coefficients.
At the destination, the probability that the destination node receives at least linear
independent packets (probability of successfully decoding the block of information, ) depends
on the operations performed at the relay. That is, if the relay just forwards the correctly received
packets, the probability of successful reception at the destination, , is given by:
( 5–10 )
∑ (
) [ ]
[ ]
( 5–11 )
However, if the relay creates new coded packets from the correctly received packets, the
relay can create as many linear independent coded packets as the number of correctly received
linear independent coded packets the probability of successful reception at the destination, , is
given by:
( 5–12 )
∑ ( )
(
)
( 5–13 )
In the following section, we discuss using Cooperative Network Coding to improve the
reliability of WBANs in the presence of node or links failures.
5.5 Cooperative Network Coding in Wireless Body Area Networks Model
Cooperative Network Coding was originally presented as a one source – multiple clusters
of many relays – one destination model [22]. In this chapter, we consider CNC for one source, a
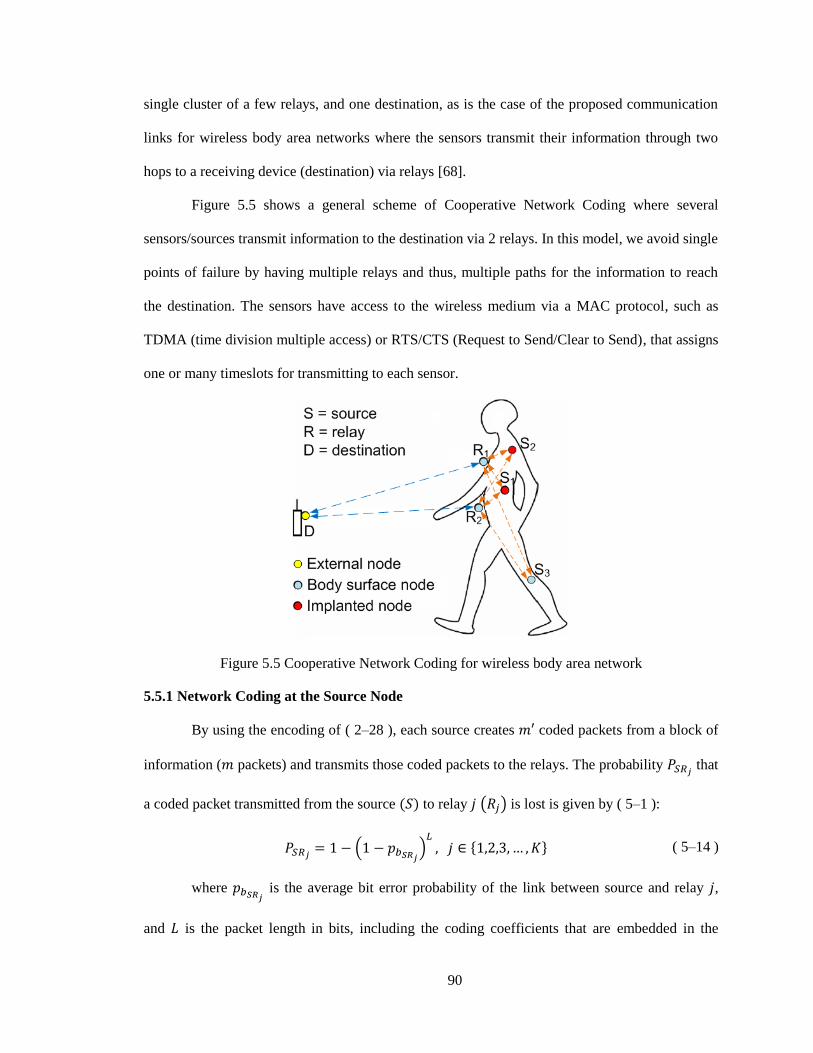
90
single cluster of a few relays, and one destination, as is the case of the proposed communication
links for wireless body area networks where the sensors transmit their information through two
hops to a receiving device (destination) via relays [68].
Figure 5.5 shows a general scheme of Cooperative Network Coding where several
sensors/sources transmit information to the destination via 2 relays. In this model, we avoid single
points of failure by having multiple relays and thus, multiple paths for the information to reach
the destination. The sensors have access to the wireless medium via a MAC protocol, such as
TDMA (time division multiple access) or RTS/CTS (Request to Send/Clear to Send), that assigns
one or many timeslots for transmitting to each sensor.
Figure 5.5 Cooperative Network Coding for wireless body area network
5.5.1 Network Coding at the Source Node
By using the encoding of ( 2–28 ), each source creates coded packets from a block of
information ( packets) and transmits those coded packets to the relays. The probability that
a coded packet transmitted from the source to relay ( ) is lost is given by ( 5–1 ):
(
) { } ( 5–14 )
where is the average bit error probability of the link between source and relay ,
and is the packet length in bits, including the coding coefficients that are embedded in the
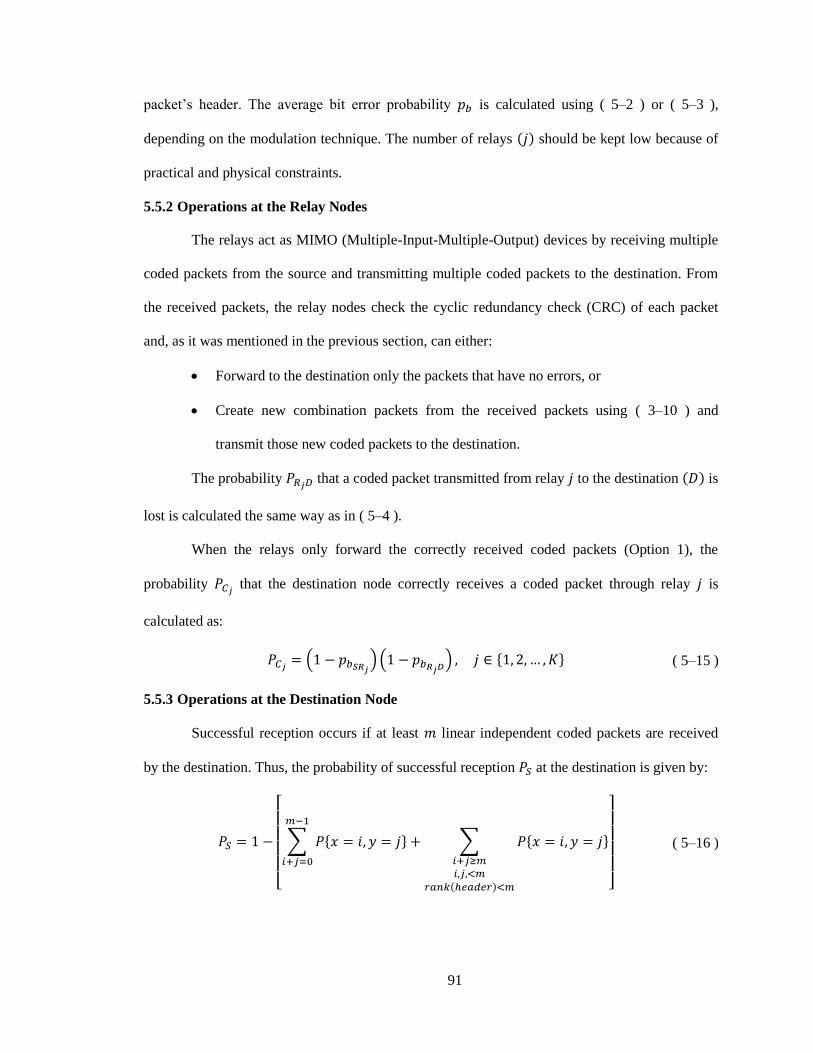
91
packet’s header. The average bit error probability is calculated using ( 5–2 ) or ( 5–3 ),
depending on the modulation technique. The number of relays should be kept low because of
practical and physical constraints.
5.5.2 Operations at the Relay Nodes
The relays act as MIMO (Multiple-Input-Multiple-Output) devices by receiving multiple
coded packets from the source and transmitting multiple coded packets to the destination. From
the received packets, the relay nodes check the cyclic redundancy check (CRC) of each packet
and, as it was mentioned in the previous section, can either:
Forward to the destination only the packets that have no errors, or
Create new combination packets from the received packets using ( 3–10 ) and
transmit those new coded packets to the destination.
The probability that a coded packet transmitted from relay to the destination is
lost is calculated the same way as in ( 5–4 ).
When the relays only forward the correctly received coded packets (Option 1), the
probability that the destination node correctly receives a coded packet through relay is
calculated as:
(
) ( ) { } ( 5–15 )
5.5.3 Operations at the Destination Node
Successful reception occurs if at least linear independent coded packets are received
by the destination. Thus, the probability of successful reception at the destination is given by:
[
∑ { }
∑ { }
]
( 5–16 )
92
where { } is a bivariate binomial distribution and is given by [74]:
{ }
∑
( 5–17 )
and
( 5–18 )
(
) ( 5–19 )
( )
( 5–20 )
( )(
) ( 5–21 )
The probability of successful reception at the destination is a function of the number
of received linear independent packets given that the relays, combined, receive at least linear
independent packets. The expected number of correctly received information (original) packets is
calculated as the product of the number of original packets and the probability of successful
reception at the destination,
( 5–22 )
When there are multiple relay nodes forwarding multiple coded packets (e.g. relays,
), the probability of successful reception at the destination can be characterized as a -
multinomial distribution [75]. However, if there are relays transmitting only one
coded packet towards the destination, the probability of successful reception can be
mathematically characterized using ( 3–17 ) [39].
We present, in the following section, the evaluation and simulation results for a range of
parameters for the network, such as: number of coded packets, number of relays, modulation
scheme, and energy per bit to noise power spectral density ratio.
5.6 Simulation Results and Discussion
In this section, we discuss the performance of a WBAN that uses CNC to realize a highly
reliable network which provides high probability of successful reception at the destination and
93
avoids single points of failure compared to extant wireless body area technologies that do not take
advantage of cooperation and/or Network Coding. We have analyzed the effect of different
parameters, such as: number of coded packets, number of cooperative relays, modulation
technique and average energy per bit, to optimize the network’s probability of successful
reception of a message (block of information) at the destination. Moreover, we have compared
our approach [CNC] to existing WBANs that do not use cooperation or Network Coding
(“uncoded” system [U]), to WBANs that use cooperation but not Network Coding [UC], and to
WBANs that use Network Coding but not cooperation [NC]. [U] and [UC] systems were
described in section 5.3 and the [NC] system was presented in section 5.4.
The results presented below were obtained through simulations with the MATLAB
communications toolbox (modulation, channel, and Galois filed operations) by running 1,000
experiments and averaging the results. With CNC or NC, successful transmission occurs when
the destination receives a sufficient number of correct packets to be able to successfully decode
the information from the source. Additionally, we assumed that the source has a block of
information of 10 packets, the energy per bit to noise power spectral density ratio is the same for
all the links and the channel is additive white Gaussian noise (AWGN). We performed the
Network Coding operations over a Galois field with packets size of 100 bytes. The
packets include cyclic redundancy check (CRC) so the receiver can detect which packets have
been correctly received and discard the packets that have errors. For CNC and NC, the packet
length is 110 bytes, which includes: data, Network Coding random coefficients (1 byte per
original packet) and CRC. No bit error correction capability (channel coding) has been used in the
packets. Note that the probability of link error will decrease when an error correction technique at
bit level is used. Also note that if we use FEC at bit level, we would be “over protecting” the
system, in the sense that we would be using double error correction. Thus, the effective
throughput will be considerably reduced.
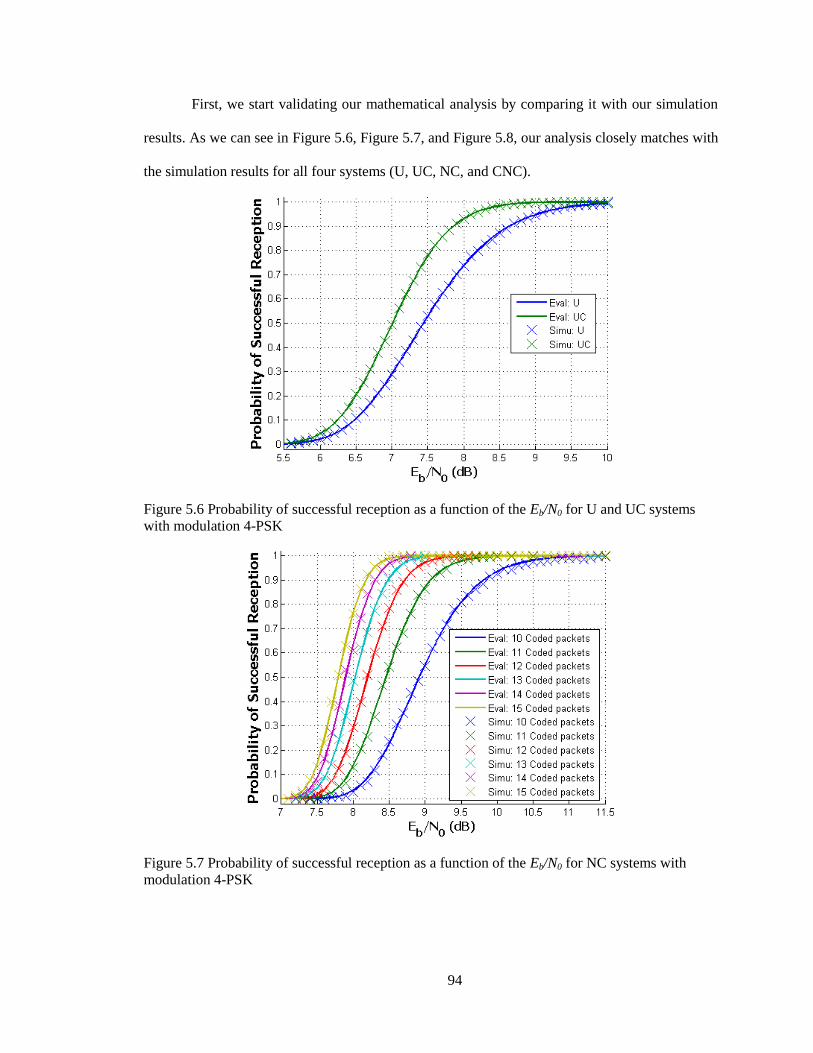
94
First, we start validating our mathematical analysis by comparing it with our simulation
results. As we can see in Figure 5.6, Figure 5.7, and Figure 5.8, our analysis closely matches with
the simulation results for all four systems (U, UC, NC, and CNC).
Figure 5.6 Probability of successful reception as a function of the Eb/N0 for U and UC systems
with modulation 4-PSK
Figure 5.7 Probability of successful reception as a function of the Eb/N0 for NC systems with
modulation 4-PSK
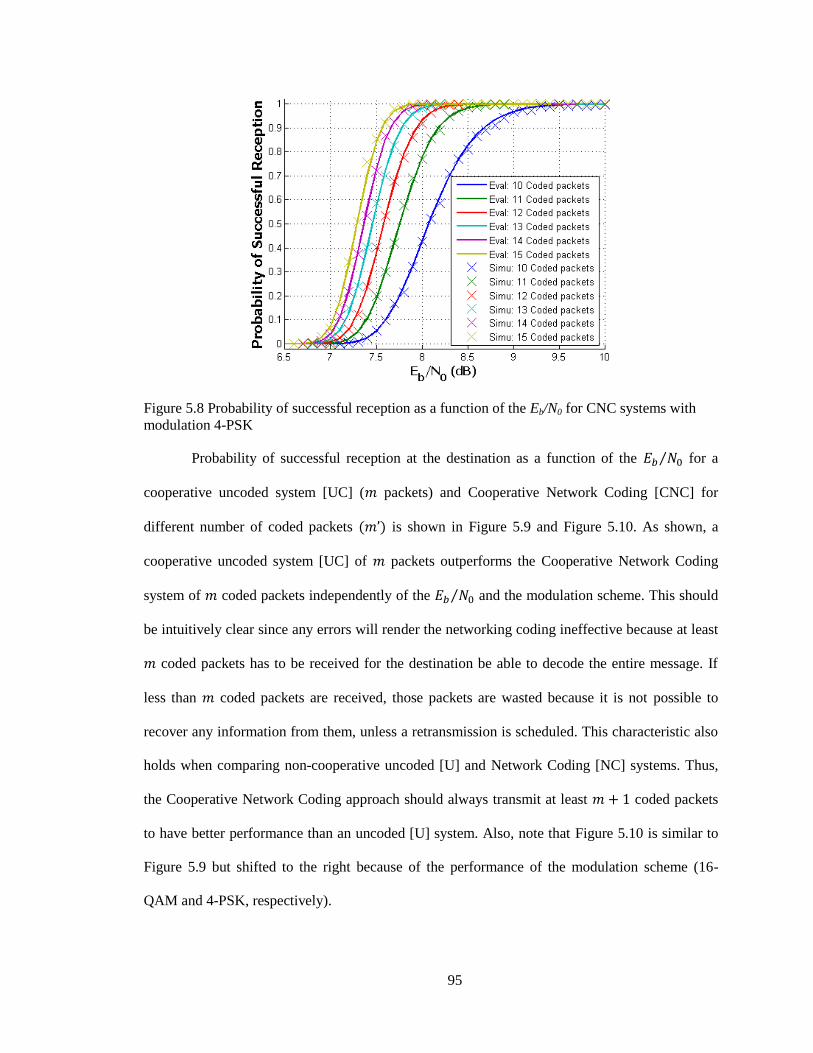
95
Figure 5.8 Probability of successful reception as a function of the Eb/N0 for CNC systems with
modulation 4-PSK
Probability of successful reception at the destination as a function of the ⁄ for a
cooperative uncoded system [UC] ( packets) and Cooperative Network Coding [CNC] for
different number of coded packets is shown in Figure 5.9 and Figure 5.10. As shown, a
cooperative uncoded system [UC] of packets outperforms the Cooperative Network Coding
system of coded packets independently of the ⁄ and the modulation scheme. This should
be intuitively clear since any errors will render the networking coding ineffective because at least
coded packets has to be received for the destination be able to decode the entire message. If
less than coded packets are received, those packets are wasted because it is not possible to
recover any information from them, unless a retransmission is scheduled. This characteristic also
holds when comparing non-cooperative uncoded [U] and Network Coding [NC] systems. Thus,
the Cooperative Network Coding approach should always transmit at least coded packets
to have better performance than an uncoded [U] system. Also, note that Figure 5.10 is similar to
Figure 5.9 but shifted to the right because of the performance of the modulation scheme (16-
QAM and 4-PSK, respectively).
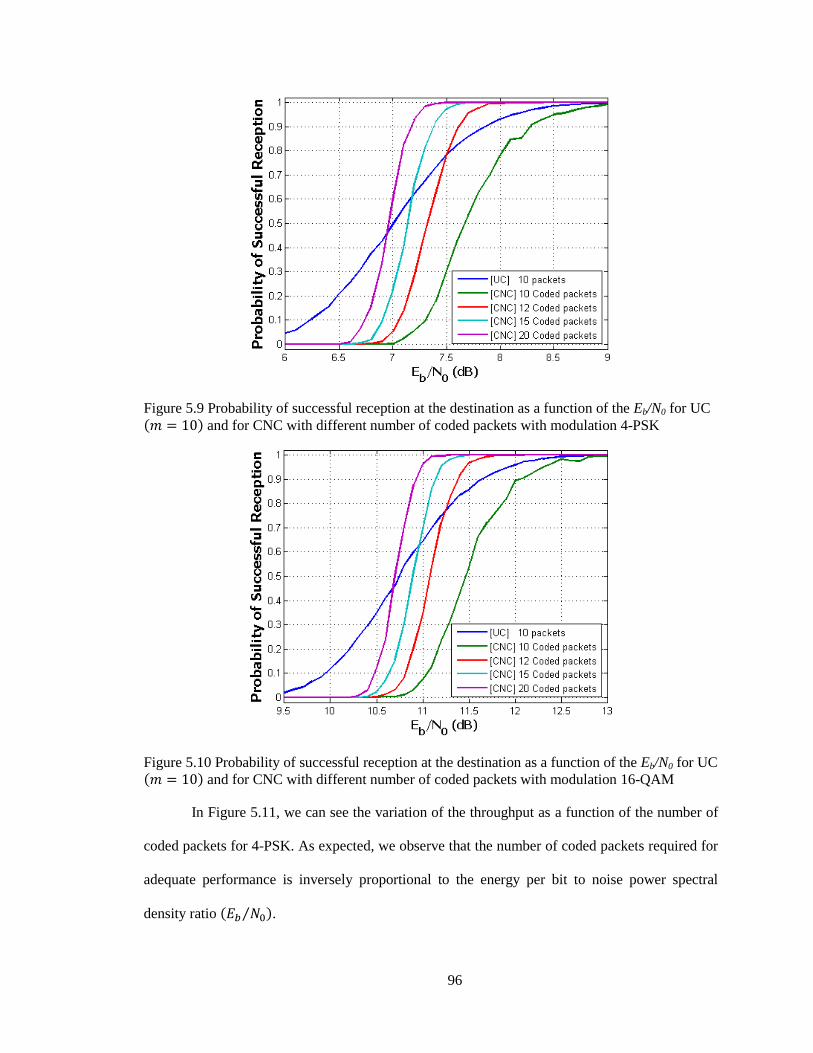
96
Figure 5.9 Probability of successful reception at the destination as a function of the Eb/N0 for UC
and for CNC with different number of coded packets with modulation 4-PSK
Figure 5.10 Probability of successful reception at the destination as a function of the Eb/N0 for UC and for CNC with different number of coded packets with modulation 16-QAM
In Figure 5.11, we can see the variation of the throughput as a function of the number of
coded packets for 4-PSK. As expected, we observe that the number of coded packets required for
adequate performance is inversely proportional to the energy per bit to noise power spectral
density ratio ⁄ .
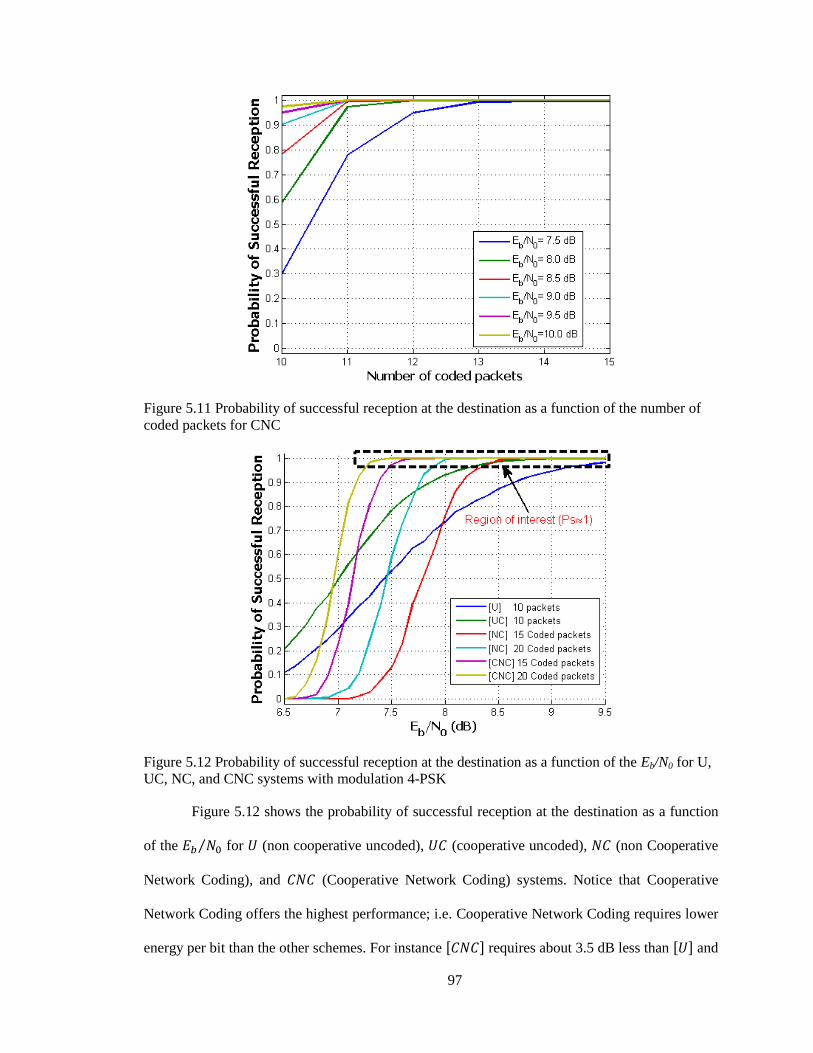
97
Figure 5.11 Probability of successful reception at the destination as a function of the number of
coded packets for CNC
Figure 5.12 Probability of successful reception at the destination as a function of the Eb/N0 for U,
UC, NC, and CNC systems with modulation 4-PSK
Figure 5.12 shows the probability of successful reception at the destination as a function
of the ⁄ for (non cooperative uncoded), (cooperative uncoded), (non Cooperative
Network Coding), and (Cooperative Network Coding) systems. Notice that Cooperative
Network Coding offers the highest performance; i.e. Cooperative Network Coding requires lower
energy per bit than the other schemes. For instance [ ] requires about 3.5 dB less than [ ] and

98
about 1.5 dB less than [ ] to achieve optimal performance . Also note that Network
Coding [ ] offers better performance than uncoded cooperation [ ] in terms of probability of
successful reception at the destination. However, [ ] does not provide spatial diversity, as is the
case for [ ], to overcome link or node failures.
5.7 Concluding Remarks
In this chapter, we proposed and present a WBAN communication network based on
Cooperative Network Coding that provides improved probability of successful reception at the
destination and transparent self-healing and fault-tolerance. Since, real-time applications for
wireless body area networks are sensitive to packet loss, Cooperative Network Coding offers an
attractive solution to combat packet loss and improve the probability of success to recover the
information at the destination while transmitting at relatively low powers. Also, by implementing
Cooperative Network Coding in a wireless body area network, we can avoid single points of
failure and provide a more reliable network that is quite tolerant of node or link failures, since the
information is transmitted via multiple relays.
In conclusion, under typical operating conditions, Cooperative Network Coding enables
increased probability of successful reception at the destination, and thus higher expected number
of correctly received and decoded packets at the destination, and improved network reliability
because of the cooperation of the relays in transmitting coded packets through multiple paths.

99
CHAPTER 6. IMPROVING THE PERFORMANCE OF WIRELESS BODY AREA
NETWORKS THROUGH TEMPORAL DIVERSITY CODING
6.1 Introduction and Motivation
In this chapter we discuss and analyze the application and effect of Diversity Coding [13]
on the performance of WBANs, and propose Temporal Diversity Coding [44], a novel
technique that applies Diversity Coding in time and uses multiple paths to enhance the
performance of WBANs, especially for emerging real-time in vivo applications such as:
Streaming real-time video during surgery, and
Measurement-response applications requiring feedback on small time-scale, such as
cardio-feedback applications, where the remote control system needs to react to fast
changes in the biological/physiological parameters and actuate an in vivo mechanism.
For this type of in vivo applications, since retransmissions are not very useful, the
throughput and network reliability must be maximized, while the complexity and energy
consumption should be kept low. An example of an implementation for in vivo real-time
application, where can improve the communications performance, is the MARVEL
(Miniature Anchored Robotic Videoscope for Expedited Laparoscopy) [38] research platform at
USF (Figure 5.1), which is a device that decreases the surgical-tool bottleneck experienced by
surgeons in state-of-the art Laparoscopic Endoscopic Single-Site (LESS) procedures for
minimally invasive abdominal surgery (MIS).
The very attractive feature of Diversity Coding is its feed-forward architecture that
transmits data packets and coded packets over spatially distinct paths, to improve network
performance by providing high throughput, overcoming packet losses and minimizing the delay.
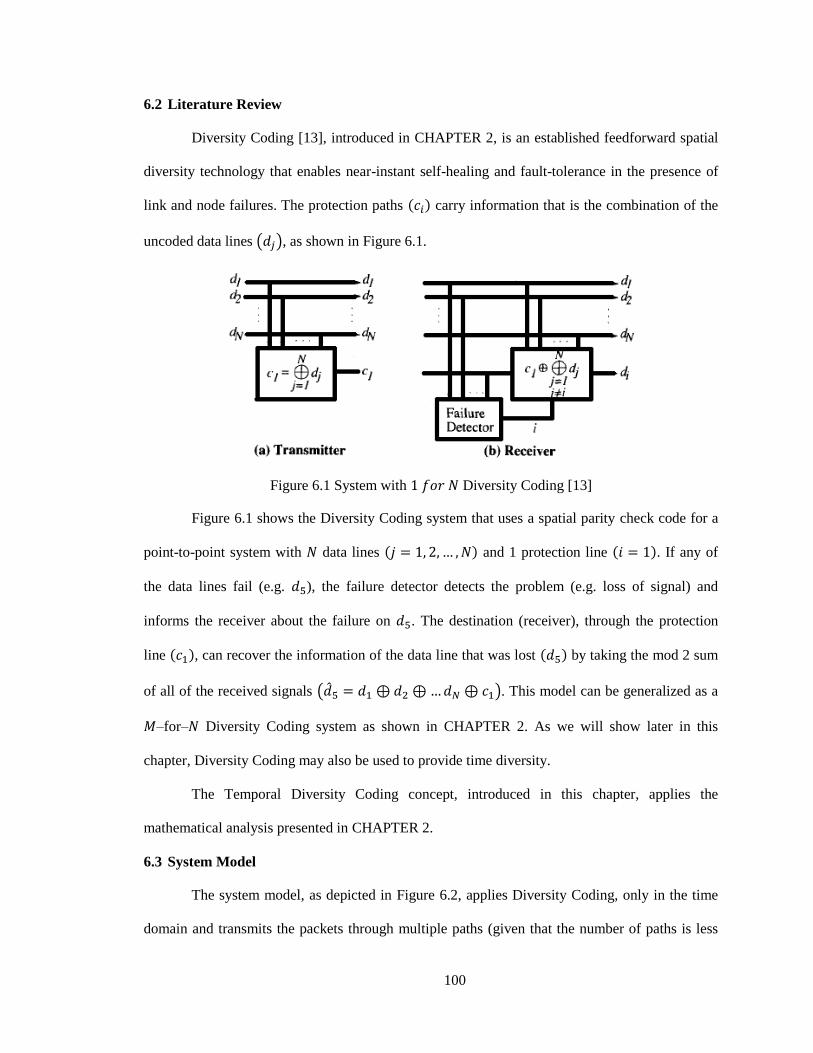
100
6.2 Literature Review
Diversity Coding [13], introduced in CHAPTER 2, is an established feedforward spatial
diversity technology that enables near-instant self-healing and fault-tolerance in the presence of
link and node failures. The protection paths carry information that is the combination of the
uncoded data lines ( ), as shown in Figure 6.1.
Figure 6.1 System with Diversity Coding [13]
Figure 6.1 shows the Diversity Coding system that uses a spatial parity check code for a
point-to-point system with data lines and 1 protection line . If any of
the data lines fail (e.g. ), the failure detector detects the problem (e.g. loss of signal) and
informs the receiver about the failure on . The destination (receiver), through the protection
line , can recover the information of the data line that was lost by taking the mod 2 sum
of all of the received signals ( ). This model can be generalized as a
–for– Diversity Coding system as shown in CHAPTER 2. As we will show later in this
chapter, Diversity Coding may also be used to provide time diversity.
The Temporal Diversity Coding concept, introduced in this chapter, applies the
mathematical analysis presented in CHAPTER 2.
6.3 System Model
The system model, as depicted in Figure 6.2, applies Diversity Coding, only in the time
domain and transmits the packets through multiple paths (given that the number of paths is less
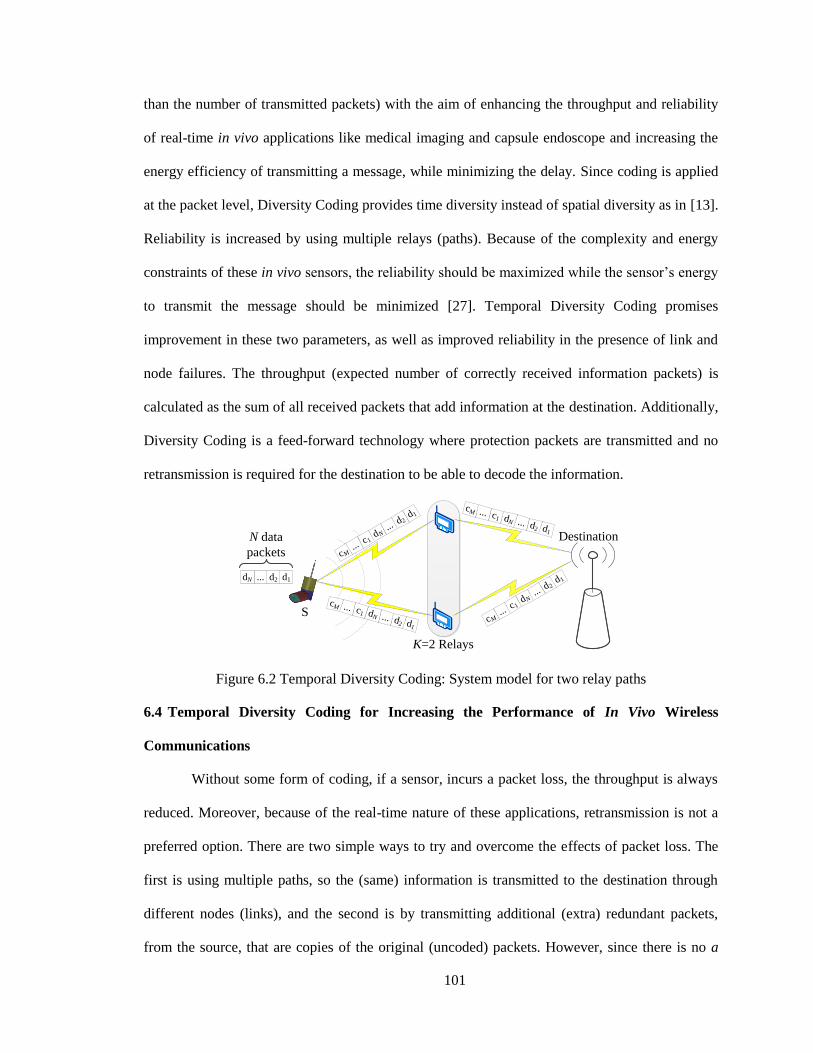
101
than the number of transmitted packets) with the aim of enhancing the throughput and reliability
of real-time in vivo applications like medical imaging and capsule endoscope and increasing the
energy efficiency of transmitting a message, while minimizing the delay. Since coding is applied
at the packet level, Diversity Coding provides time diversity instead of spatial diversity as in [13].
Reliability is increased by using multiple relays (paths). Because of the complexity and energy
constraints of these in vivo sensors, the reliability should be maximized while the sensor’s energy
to transmit the message should be minimized [27]. Temporal Diversity Coding promises
improvement in these two parameters, as well as improved reliability in the presence of link and
node failures. The throughput (expected number of correctly received information packets) is
calculated as the sum of all received packets that add information at the destination. Additionally,
Diversity Coding is a feed-forward technology where protection packets are transmitted and no
retransmission is required for the destination to be able to decode the information.
Destination
d1
d2
...dN
c1...
cM
d1d2
...dN
c1...
cM
d1d2...dN
d1d2
...dN
c1...
cM
d1
d2
...dN
c1...
cMS
N data
packets
K=2 Relays
Figure 6.2 Temporal Diversity Coding: System model for two relay paths
6.4 Temporal Diversity Coding for Increasing the Performance of In Vivo Wireless
Communications
Without some form of coding, if a sensor, incurs a packet loss, the throughput is always
reduced. Moreover, because of the real-time nature of these applications, retransmission is not a
preferred option. There are two simple ways to try and overcome the effects of packet loss. The
first is using multiple paths, so the (same) information is transmitted to the destination through
different nodes (links), and the second is by transmitting additional (extra) redundant packets,
from the source, that are copies of the original (uncoded) packets. However, since there is no a
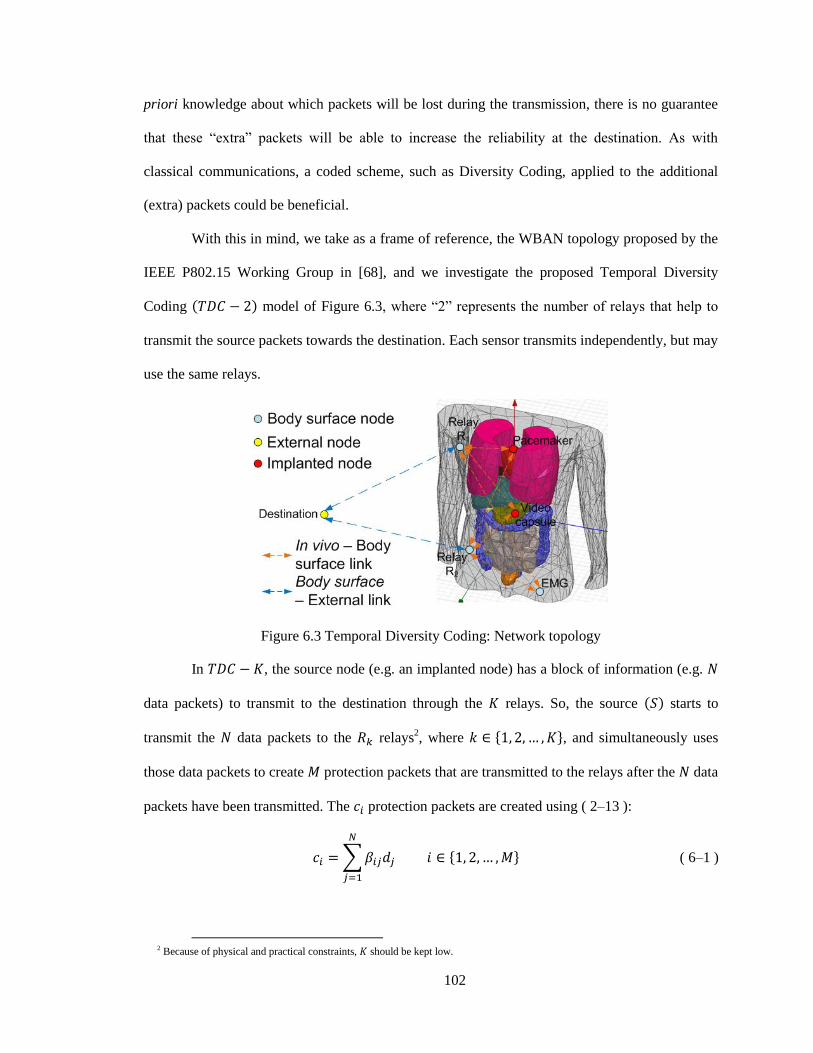
102
priori knowledge about which packets will be lost during the transmission, there is no guarantee
that these “extra” packets will be able to increase the reliability at the destination. As with
classical communications, a coded scheme, such as Diversity Coding, applied to the additional
(extra) packets could be beneficial.
With this in mind, we take as a frame of reference, the WBAN topology proposed by the
IEEE P802.15 Working Group in [68], and we investigate the proposed Temporal Diversity
Coding model of Figure 6.3, where “2” represents the number of relays that help to
transmit the source packets towards the destination. Each sensor transmits independently, but may
use the same relays.
Figure 6.3 Temporal Diversity Coding: Network topology
In , the source node (e.g. an implanted node) has a block of information (e.g.
data packets) to transmit to the destination through the relays. So, the source starts to
transmit the data packets to the relays2, where { }, and simultaneously uses
those data packets to create protection packets that are transmitted to the relays after the data
packets have been transmitted. The protection packets are created using ( 2–13 ):
∑
{ } ( 6–1 )
2 Because of physical and practical constraints, should be kept low.
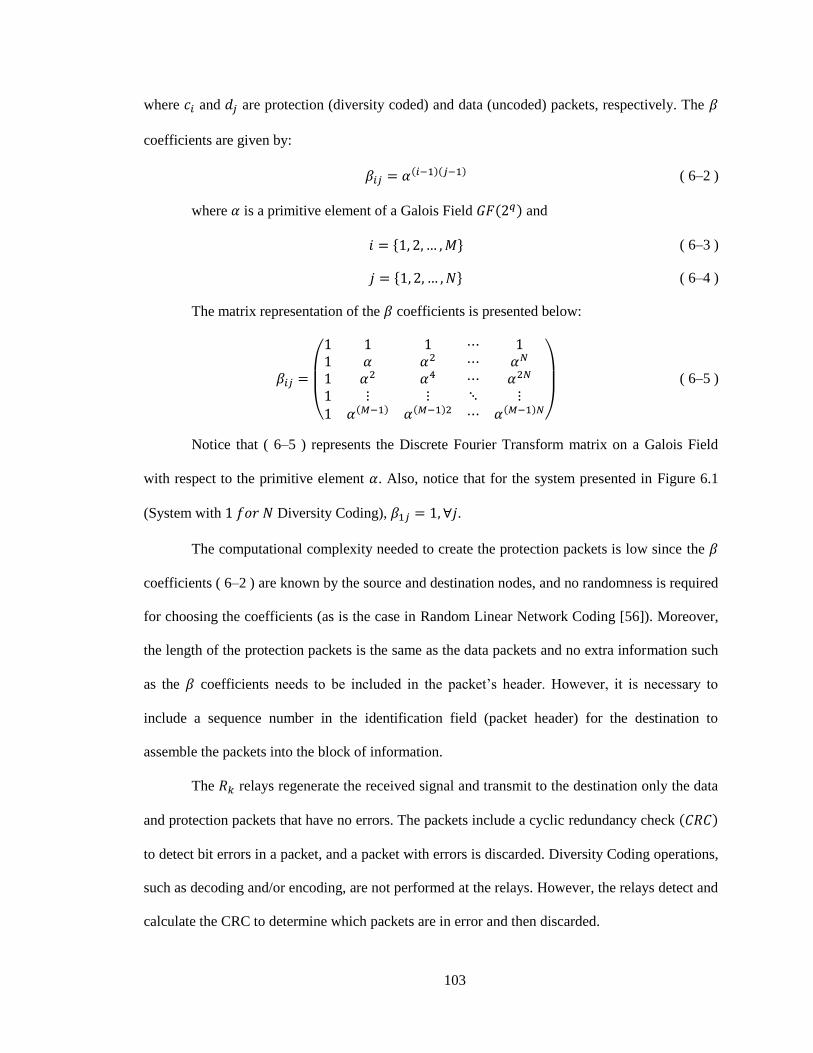
103
where and are protection (diversity coded) and data (uncoded) packets, respectively. The
coefficients are given by:
( 6–2 )
where is a primitive element of a Galois Field and
{ } ( 6–3 )
{ } ( 6–4 )
The matrix representation of the coefficients is presented below:
(
)
( 6–5 )
Notice that ( 6–5 ) represents the Discrete Fourier Transform matrix on a Galois Field
with respect to the primitive element . Also, notice that for the system presented in Figure 6.1
(System with Diversity Coding), .
The computational complexity needed to create the protection packets is low since the
coefficients ( 6–2 ) are known by the source and destination nodes, and no randomness is required
for choosing the coefficients (as is the case in Random Linear Network Coding [56]). Moreover,
the length of the protection packets is the same as the data packets and no extra information such
as the coefficients needs to be included in the packet’s header. However, it is necessary to
include a sequence number in the identification field (packet header) for the destination to
assemble the packets into the block of information.
The relays regenerate the received signal and transmit to the destination only the data
and protection packets that have no errors. The packets include a cyclic redundancy check
to detect bit errors in a packet, and a packet with errors is discarded. Diversity Coding operations,
such as decoding and/or encoding, are not performed at the relays. However, the relays detect and
calculate the CRC to determine which packets are in error and then discarded.
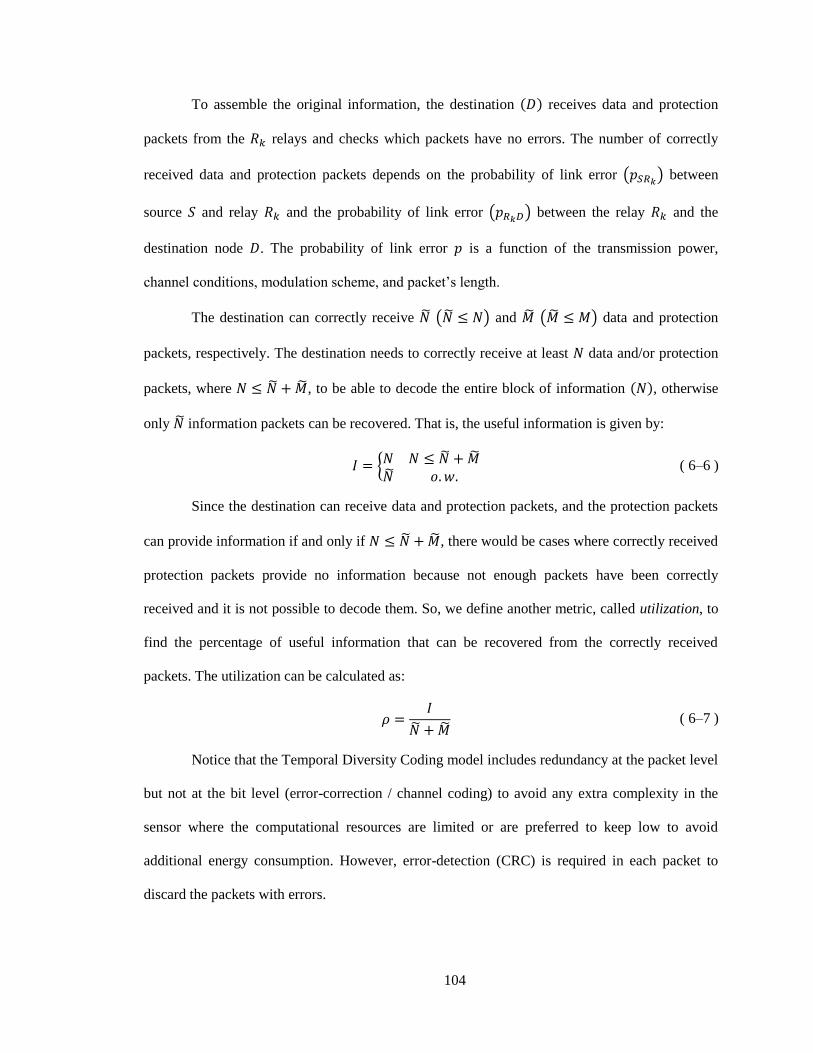
104
To assemble the original information, the destination receives data and protection
packets from the relays and checks which packets have no errors. The number of correctly
received data and protection packets depends on the probability of link error ( ) between
source and relay and the probability of link error ( ) between the relay and the
destination node . The probability of link error is a function of the transmission power,
channel conditions, modulation scheme, and packet’s length.
The destination can correctly receive ( ) and ( ) data and protection
packets, respectively. The destination needs to correctly receive at least data and/or protection
packets, where , to be able to decode the entire block of information , otherwise
only information packets can be recovered. That is, the useful information is given by:
{
( 6–6 )
Since the destination can receive data and protection packets, and the protection packets
can provide information if and only if , there would be cases where correctly received
protection packets provide no information because not enough packets have been correctly
received and it is not possible to decode them. So, we define another metric, called utilization, to
find the percentage of useful information that can be recovered from the correctly received
packets. The utilization can be calculated as:
( 6–7 )
Notice that the Temporal Diversity Coding model includes redundancy at the packet level
but not at the bit level (error-correction / channel coding) to avoid any extra complexity in the
sensor where the computational resources are limited or are preferred to keep low to avoid
additional energy consumption. However, error-detection (CRC) is required in each packet to
discard the packets with errors.
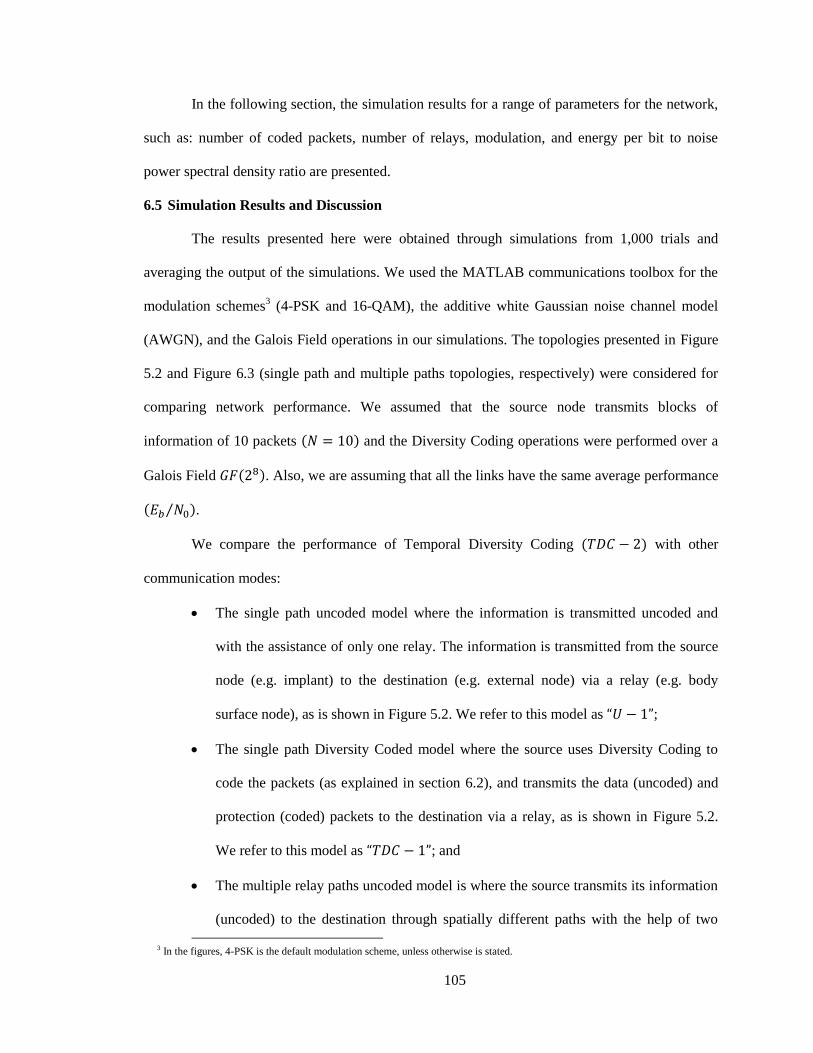
105
In the following section, the simulation results for a range of parameters for the network,
such as: number of coded packets, number of relays, modulation, and energy per bit to noise
power spectral density ratio are presented.
6.5 Simulation Results and Discussion
The results presented here were obtained through simulations from 1,000 trials and
averaging the output of the simulations. We used the MATLAB communications toolbox for the
modulation schemes3 (4-PSK and 16-QAM), the additive white Gaussian noise channel model
(AWGN), and the Galois Field operations in our simulations. The topologies presented in Figure
5.2 and Figure 6.3 (single path and multiple paths topologies, respectively) were considered for
comparing network performance. We assumed that the source node transmits blocks of
information of 10 packets and the Diversity Coding operations were performed over a
Galois Field . Also, we are assuming that all the links have the same average performance
⁄ .
We compare the performance of Temporal Diversity Coding with other
communication modes:
The single path uncoded model where the information is transmitted uncoded and
with the assistance of only one relay. The information is transmitted from the source
node (e.g. implant) to the destination (e.g. external node) via a relay (e.g. body
surface node), as is shown in Figure 5.2. We refer to this model as ;
The single path Diversity Coded model where the source uses Diversity Coding to
code the packets (as explained in section 6.2), and transmits the data (uncoded) and
protection (coded) packets to the destination via a relay, as is shown in Figure 5.2.
We refer to this model as ; and
The multiple relay paths uncoded model is where the source transmits its information
(uncoded) to the destination through spatially different paths with the help of two
3 In the figures, 4-PSK is the default modulation scheme, unless otherwise is stated.
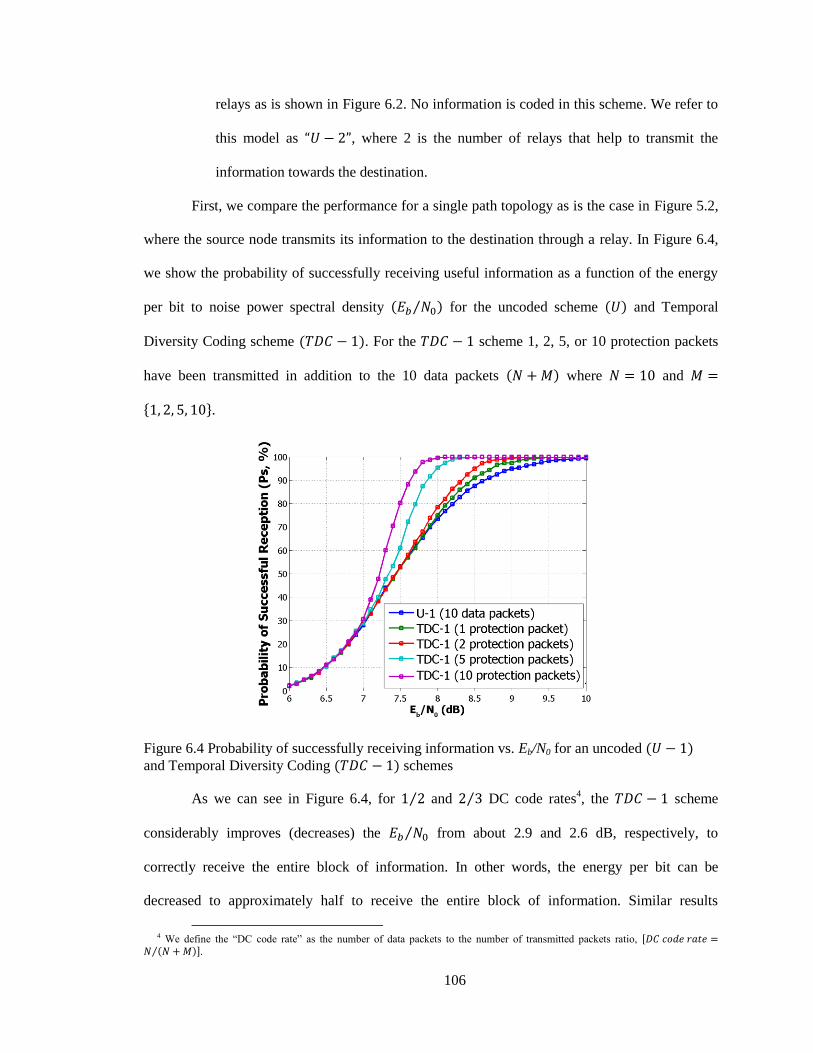
106
relays as is shown in Figure 6.2. No information is coded in this scheme. We refer to
this model as , where 2 is the number of relays that help to transmit the
information towards the destination.
First, we compare the performance for a single path topology as is the case in Figure 5.2,
where the source node transmits its information to the destination through a relay. In Figure 6.4,
we show the probability of successfully receiving useful information as a function of the energy
per bit to noise power spectral density ⁄ for the uncoded scheme and Temporal
Diversity Coding scheme . For the scheme 1, 2, 5, or 10 protection packets
have been transmitted in addition to the 10 data packets where and
{ }.
Figure 6.4 Probability of successfully receiving information vs. Eb/N0 for an uncoded and Temporal Diversity Coding schemes
As we can see in Figure 6.4, for ⁄ and ⁄ DC code rates4, the scheme
considerably improves (decreases) the ⁄ from about 2.9 and 2.6 dB, respectively, to
correctly receive the entire block of information. In other words, the energy per bit can be
decreased to approximately half to receive the entire block of information. Similar results
4 We define the “DC code rate” as the number of data packets to the number of transmitted packets ratio, [
⁄ ].
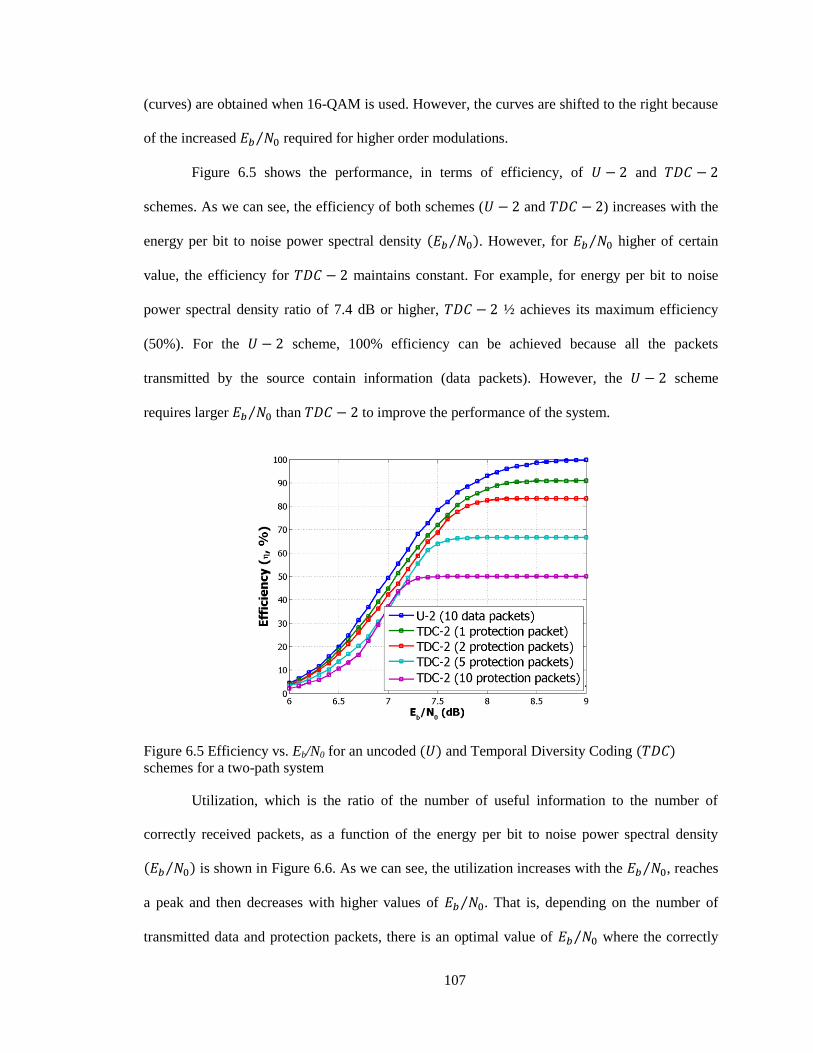
107
(curves) are obtained when 16-QAM is used. However, the curves are shifted to the right because
of the increased ⁄ required for higher order modulations.
Figure 6.5 shows the performance, in terms of efficiency, of and
schemes. As we can see, the efficiency of both schemes ( and ) increases with the
energy per bit to noise power spectral density ⁄ . However, for ⁄ higher of certain
value, the efficiency for maintains constant. For example, for energy per bit to noise
power spectral density ratio of 7.4 dB or higher, ½ achieves its maximum efficiency
(50%). For the scheme, 100% efficiency can be achieved because all the packets
transmitted by the source contain information (data packets). However, the scheme
requires larger ⁄ than to improve the performance of the system.
Figure 6.5 Efficiency vs. Eb/N0 for an uncoded and Temporal Diversity Coding schemes for a two-path system
Utilization, which is the ratio of the number of useful information to the number of
correctly received packets, as a function of the energy per bit to noise power spectral density
⁄ is shown in Figure 6.6. As we can see, the utilization increases with the ⁄ , reaches
a peak and then decreases with higher values of ⁄ . That is, depending on the number of
transmitted data and protection packets, there is an optimal value of ⁄ where the correctly
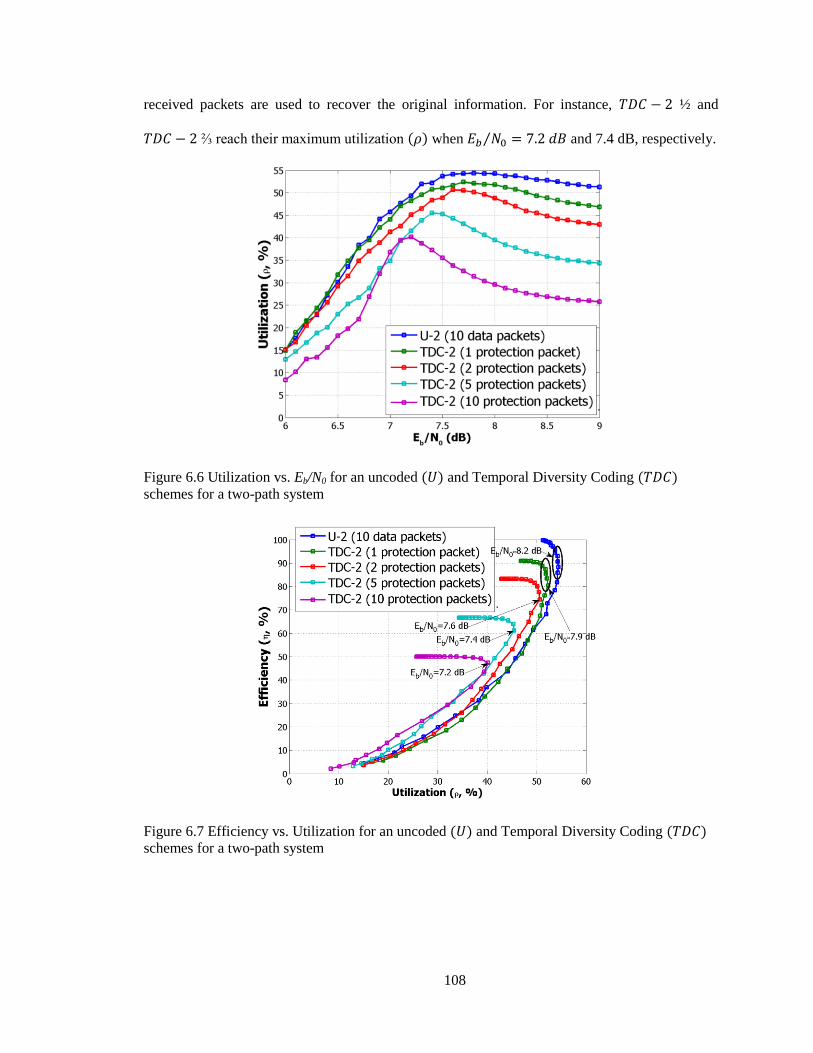
108
received packets are used to recover the original information. For instance, ½ and
⅔ reach their maximum utilization when ⁄ and 7.4 dB, respectively.
Figure 6.6 Utilization vs. Eb/N0 for an uncoded and Temporal Diversity Coding schemes for a two-path system
Figure 6.7 Efficiency vs. Utilization for an uncoded and Temporal Diversity Coding schemes for a two-path system
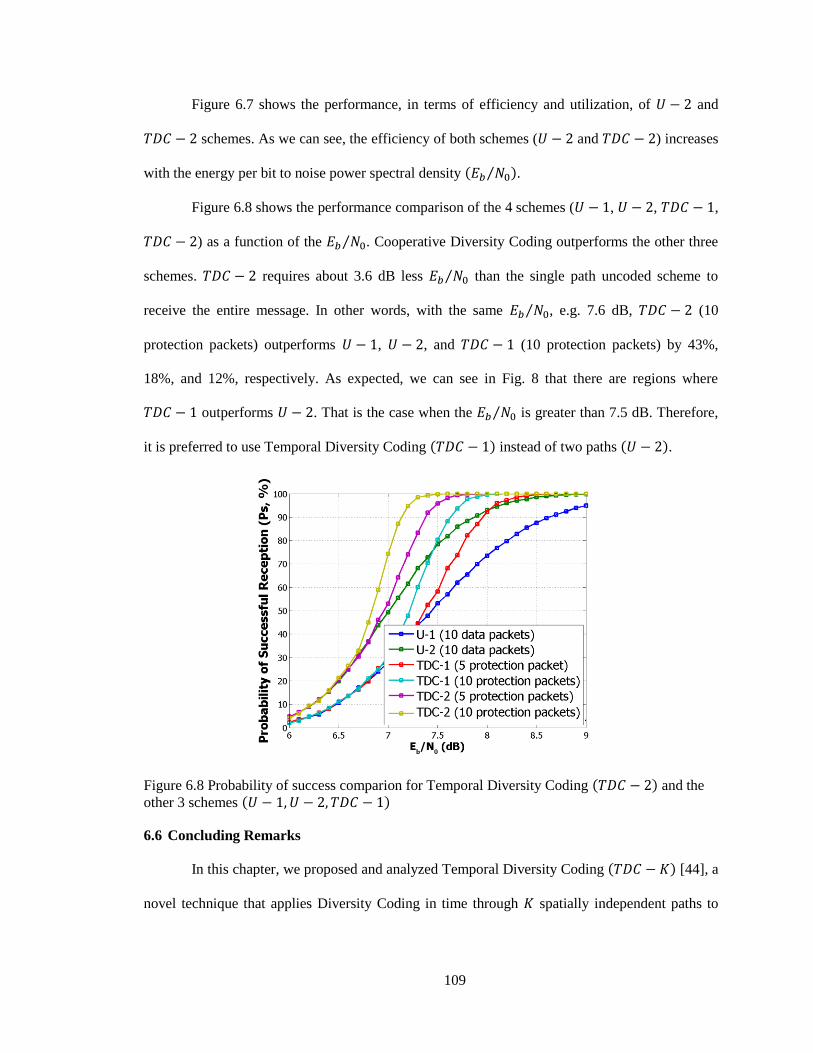
109
Figure 6.7 shows the performance, in terms of efficiency and utilization, of and
schemes. As we can see, the efficiency of both schemes ( and ) increases
with the energy per bit to noise power spectral density ⁄ .
Figure 6.8 shows the performance comparison of the 4 schemes ( , , ,
) as a function of the ⁄ . Cooperative Diversity Coding outperforms the other three
schemes. requires about 3.6 dB less ⁄ than the single path uncoded scheme to
receive the entire message. In other words, with the same ⁄ , e.g. 7.6 dB, (10
protection packets) outperforms , , and (10 protection packets) by 43%,
18%, and 12%, respectively. As expected, we can see in Fig. 8 that there are regions where
outperforms . That is the case when the ⁄ is greater than 7.5 dB. Therefore,
it is preferred to use Temporal Diversity Coding instead of two paths .
Figure 6.8 Probability of success comparion for Temporal Diversity Coding and the
other 3 schemes
6.6 Concluding Remarks
In this chapter, we proposed and analyzed Temporal Diversity Coding [44], a
novel technique that applies Diversity Coding in time through spatially independent paths to
110
achieve improved network performance by increasing the network’s reliability and minimizing
the delay.
For ⁄ equal to 7.6 dB, where achieves full throughput and maximum
efficiency at a ½ DC code rate, we can see that transmitting the packets through multiple paths
about 12% improvement in throughput is achieved, Temporal Diversity Coding – 1 (½ DC code
rate) provides about 18% improvement in throughput, and the combination of these two
techniques [ (½ DC code rate)] provides a 43% improvement in throughput.
Wireless body area networks (WBANs) are an attractive application for Temporal
Network Coding because of the low complexity, limited power, and high reliability that this type
of networks should provide, especially in real-time applications such as capsule endoscopy and
video/medical imaging where retransmissions are not a good alternative.
Temporal Diversity Coding has:
Low extra complexity, compared to CNC because the Diversity Coding coefficients
are already stored in the source (implant) and destination (external) nodes;
Limited power consumption because lower energy per bit to noise spectral ratio is
required to recover the entire message;
High reliability because of the use of a cooperative relay that helps to transmit the
packets from the source to the destination node; and
Real-time transmission because the source node transmits the data packets as soon as
they are in the queue and simultaneously creates the protection packets (using the
data packets) that are transmitted after the data packets.
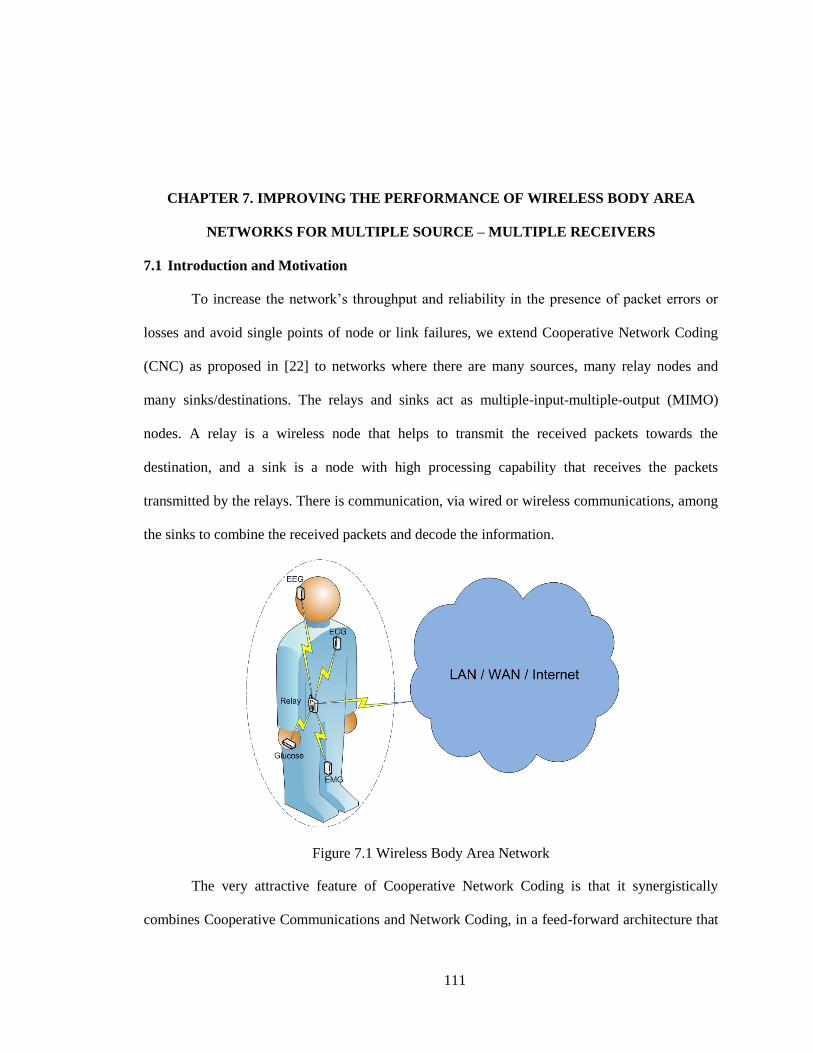
111
CHAPTER 7. IMPROVING THE PERFORMANCE OF WIRELESS BODY AREA
NETWORKS FOR MULTIPLE SOURCE – MULTIPLE RECEIVERS
7.1 Introduction and Motivation
To increase the network’s throughput and reliability in the presence of packet errors or
losses and avoid single points of node or link failures, we extend Cooperative Network Coding
(CNC) as proposed in [22] to networks where there are many sources, many relay nodes and
many sinks/destinations. The relays and sinks act as multiple-input-multiple-output (MIMO)
nodes. A relay is a wireless node that helps to transmit the received packets towards the
destination, and a sink is a node with high processing capability that receives the packets
transmitted by the relays. There is communication, via wired or wireless communications, among
the sinks to combine the received packets and decode the information.
Figure 7.1 Wireless Body Area Network
The very attractive feature of Cooperative Network Coding is that it synergistically
combines Cooperative Communications and Network Coding, in a feed-forward architecture that
112
creates combination packets of the source information and transmits these over spatially distinct
paths, to improve network performance by providing high throughput and overcoming packet
losses.
7.2 Literature Review
Network Coding [16] is a networking technology that achieves capacity gain by
combining the packets received at intermediate nodes and transmitting a linearly independent
coded packet that contains information about all the original (source) packets. A coded packet is
obtained by multiplying each of the original packets with a random coefficient and then the
results are summed:
∑
( 7–1 )
where and are the combination, also known as coded, packets and original packets,
respectively, is the number of coded packets, the coefficients are randomly chosen
from a Galois Field and all the operations are performed over a Galois Field ,
where the elements are { }. The random coefficients { } are embedded
into the packet’s header.
Intermediate nodes create new coded packets from the correctly received coded packets
∑
( 7–2 )
where and are the transmitted coded packets and correctly received coded
packets, respectively, is the number of nodes in cluster , is the number of coded packets
received by node in cluster from nodes in the previous cluster and the coefficients
are randomly chosen from .
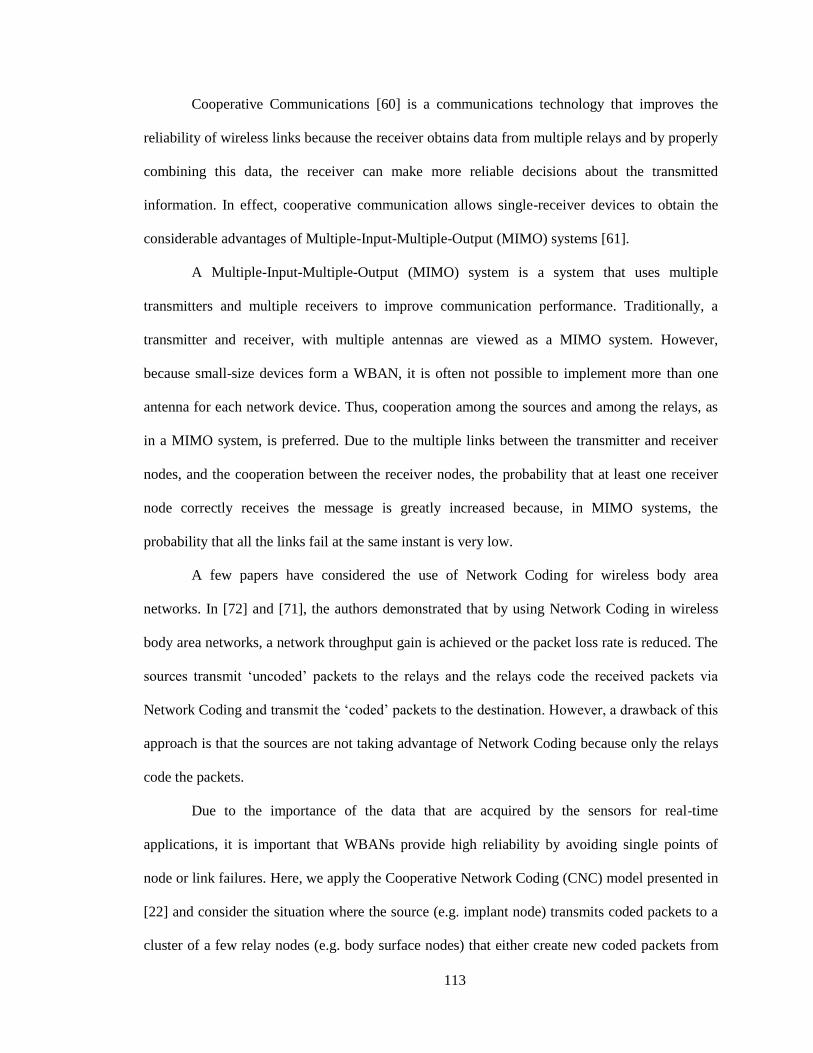
113
Cooperative Communications [60] is a communications technology that improves the
reliability of wireless links because the receiver obtains data from multiple relays and by properly
combining this data, the receiver can make more reliable decisions about the transmitted
information. In effect, cooperative communication allows single-receiver devices to obtain the
considerable advantages of Multiple-Input-Multiple-Output (MIMO) systems [61].
A Multiple-Input-Multiple-Output (MIMO) system is a system that uses multiple
transmitters and multiple receivers to improve communication performance. Traditionally, a
transmitter and receiver, with multiple antennas are viewed as a MIMO system. However,
because small-size devices form a WBAN, it is often not possible to implement more than one
antenna for each network device. Thus, cooperation among the sources and among the relays, as
in a MIMO system, is preferred. Due to the multiple links between the transmitter and receiver
nodes, and the cooperation between the receiver nodes, the probability that at least one receiver
node correctly receives the message is greatly increased because, in MIMO systems, the
probability that all the links fail at the same instant is very low.
A few papers have considered the use of Network Coding for wireless body area
networks. In [72] and [71], the authors demonstrated that by using Network Coding in wireless
body area networks, a network throughput gain is achieved or the packet loss rate is reduced. The
sources transmit ‘uncoded’ packets to the relays and the relays code the received packets via
Network Coding and transmit the ‘coded’ packets to the destination. However, a drawback of this
approach is that the sources are not taking advantage of Network Coding because only the relays
code the packets.
Due to the importance of the data that are acquired by the sensors for real-time
applications, it is important that WBANs provide high reliability by avoiding single points of
node or link failures. Here, we apply the Cooperative Network Coding (CNC) model presented in
[22] and consider the situation where the source (e.g. implant node) transmits coded packets to a
cluster of a few relay nodes (e.g. body surface nodes) that either create new coded packets from
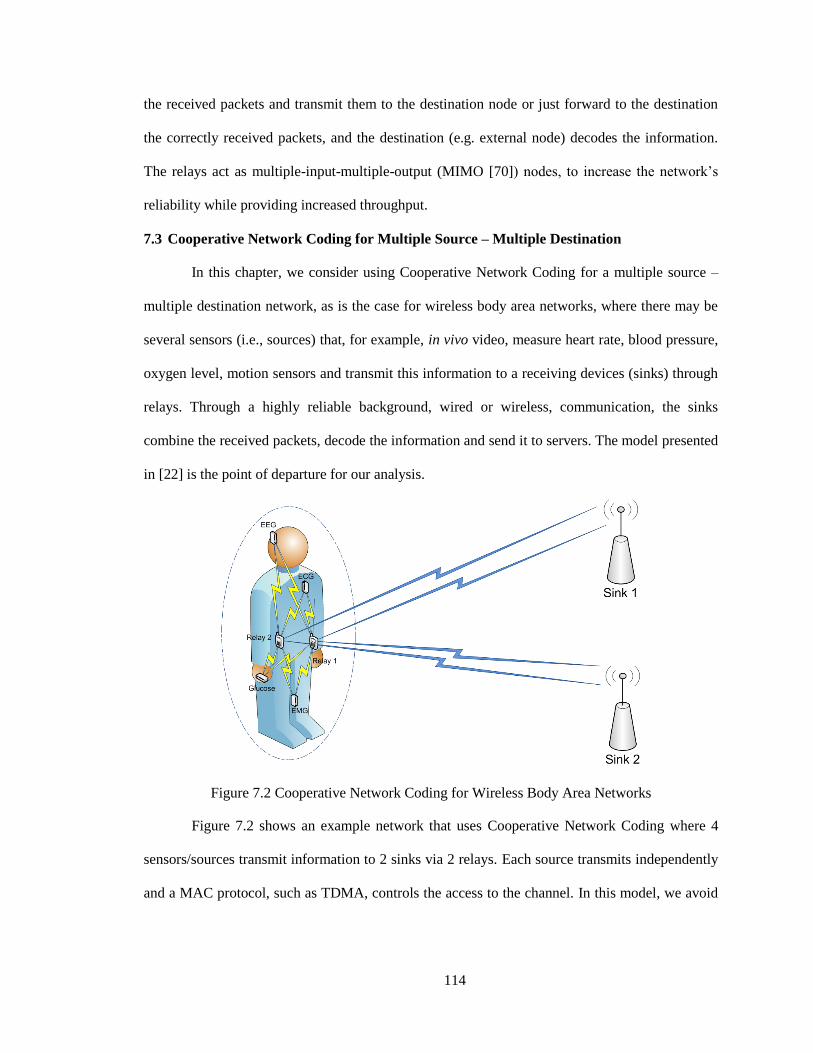
114
the received packets and transmit them to the destination node or just forward to the destination
the correctly received packets, and the destination (e.g. external node) decodes the information.
The relays act as multiple-input-multiple-output (MIMO [70]) nodes, to increase the network’s
reliability while providing increased throughput.
7.3 Cooperative Network Coding for Multiple Source – Multiple Destination
In this chapter, we consider using Cooperative Network Coding for a multiple source –
multiple destination network, as is the case for wireless body area networks, where there may be
several sensors (i.e., sources) that, for example, in vivo video, measure heart rate, blood pressure,
oxygen level, motion sensors and transmit this information to a receiving devices (sinks) through
relays. Through a highly reliable background, wired or wireless, communication, the sinks
combine the received packets, decode the information and send it to servers. The model presented
in [22] is the point of departure for our analysis.
Figure 7.2 Cooperative Network Coding for Wireless Body Area Networks
Figure 7.2 shows an example network that uses Cooperative Network Coding where 4
sensors/sources transmit information to 2 sinks via 2 relays. Each source transmits independently
and a MAC protocol, such as TDMA, controls the access to the channel. In this model, we avoid
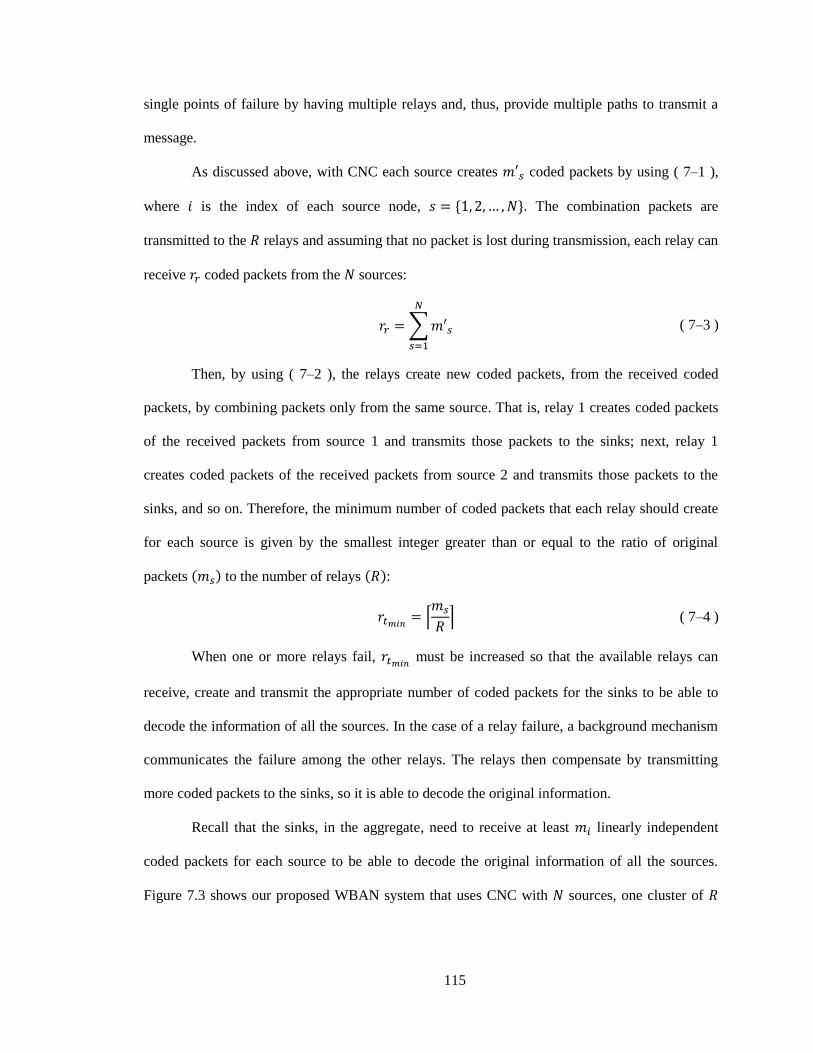
115
single points of failure by having multiple relays and, thus, provide multiple paths to transmit a
message.
As discussed above, with CNC each source creates coded packets by using ( 7–1 ),
where is the index of each source node, { }. The combination packets are
transmitted to the relays and assuming that no packet is lost during transmission, each relay can
receive coded packets from the sources:
∑
( 7–3 )
Then, by using ( 7–2 ), the relays create new coded packets, from the received coded
packets, by combining packets only from the same source. That is, relay 1 creates coded packets
of the received packets from source 1 and transmits those packets to the sinks; next, relay 1
creates coded packets of the received packets from source 2 and transmits those packets to the
sinks, and so on. Therefore, the minimum number of coded packets that each relay should create
for each source is given by the smallest integer greater than or equal to the ratio of original
packets to the number of relays :
⌈
⌉ ( 7–4 )
When one or more relays fail, must be increased so that the available relays can
receive, create and transmit the appropriate number of coded packets for the sinks to be able to
decode the information of all the sources. In the case of a relay failure, a background mechanism
communicates the failure among the other relays. The relays then compensate by transmitting
more coded packets to the sinks, so it is able to decode the original information.
Recall that the sinks, in the aggregate, need to receive at least linearly independent
coded packets for each source to be able to decode the original information of all the sources.
Figure 7.3 shows our proposed WBAN system that uses CNC with sources, one cluster of
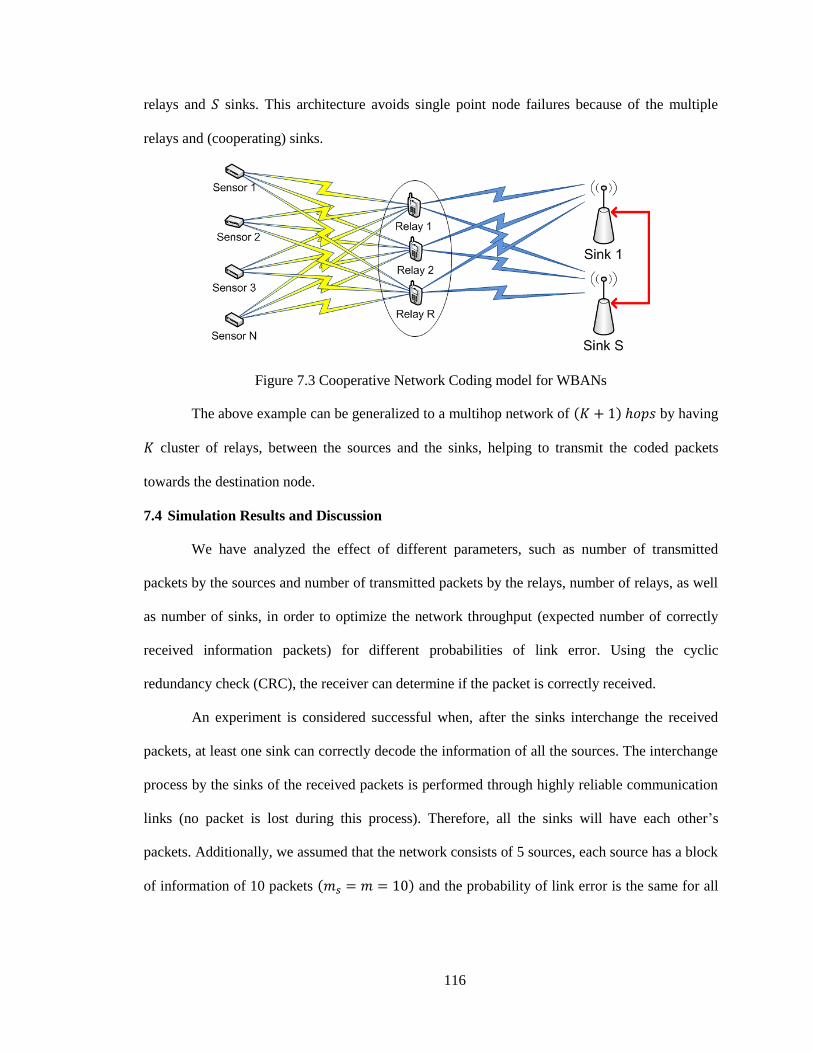
116
relays and sinks. This architecture avoids single point node failures because of the multiple
relays and (cooperating) sinks.
Figure 7.3 Cooperative Network Coding model for WBANs
The above example can be generalized to a multihop network of by having
cluster of relays, between the sources and the sinks, helping to transmit the coded packets
towards the destination node.
7.4 Simulation Results and Discussion
We have analyzed the effect of different parameters, such as number of transmitted
packets by the sources and number of transmitted packets by the relays, number of relays, as well
as number of sinks, in order to optimize the network throughput (expected number of correctly
received information packets) for different probabilities of link error. Using the cyclic
redundancy check (CRC), the receiver can determine if the packet is correctly received.
An experiment is considered successful when, after the sinks interchange the received
packets, at least one sink can correctly decode the information of all the sources. The interchange
process by the sinks of the received packets is performed through highly reliable communication
links (no packet is lost during this process). Therefore, all the sinks will have each other’s
packets. Additionally, we assumed that the network consists of 5 sources, each source has a block
of information of 10 packets and the probability of link error is the same for all
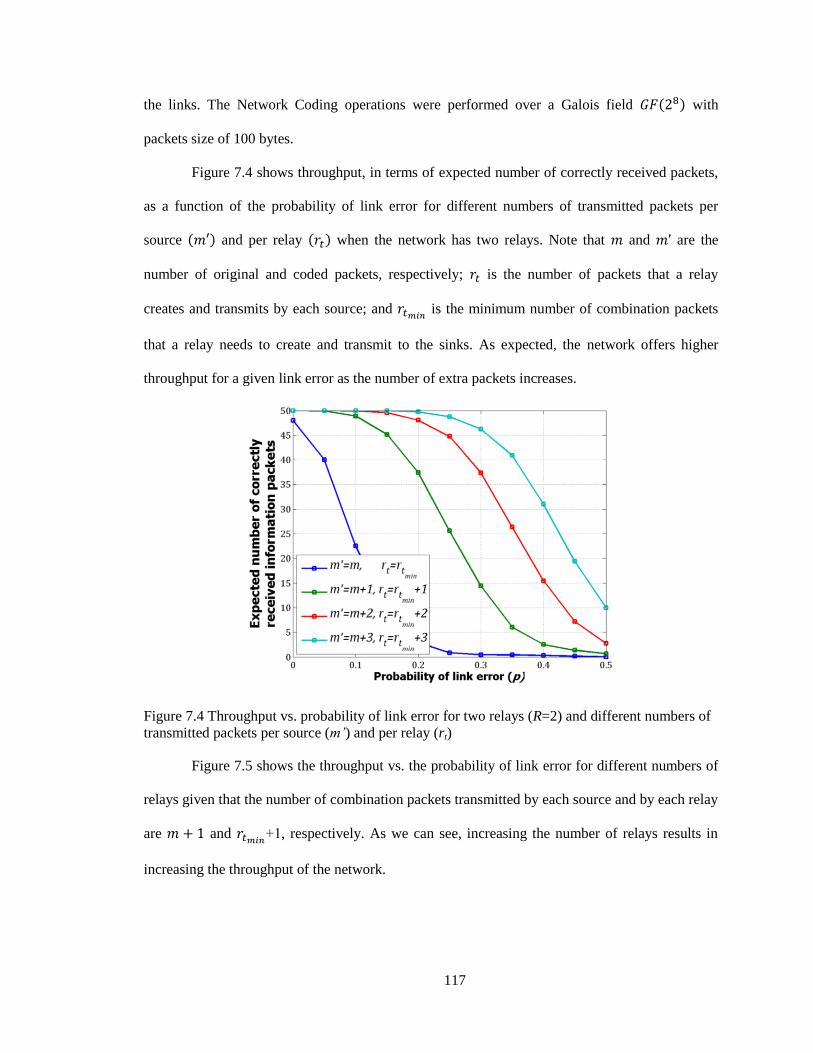
117
the links. The Network Coding operations were performed over a Galois field with
packets size of 100 bytes.
Figure 7.4 shows throughput, in terms of expected number of correctly received packets,
as a function of the probability of link error for different numbers of transmitted packets per
source and per relay when the network has two relays. Note that and are the
number of original and coded packets, respectively; is the number of packets that a relay
creates and transmits by each source; and is the minimum number of combination packets
that a relay needs to create and transmit to the sinks. As expected, the network offers higher
throughput for a given link error as the number of extra packets increases.
Figure 7.4 Throughput vs. probability of link error for two relays (R=2) and different numbers of
transmitted packets per source (m’) and per relay (rt)
Figure 7.5 shows the throughput vs. the probability of link error for different numbers of
relays given that the number of combination packets transmitted by each source and by each relay
are and 1, respectively. As we can see, increasing the number of relays results in
increasing the throughput of the network.
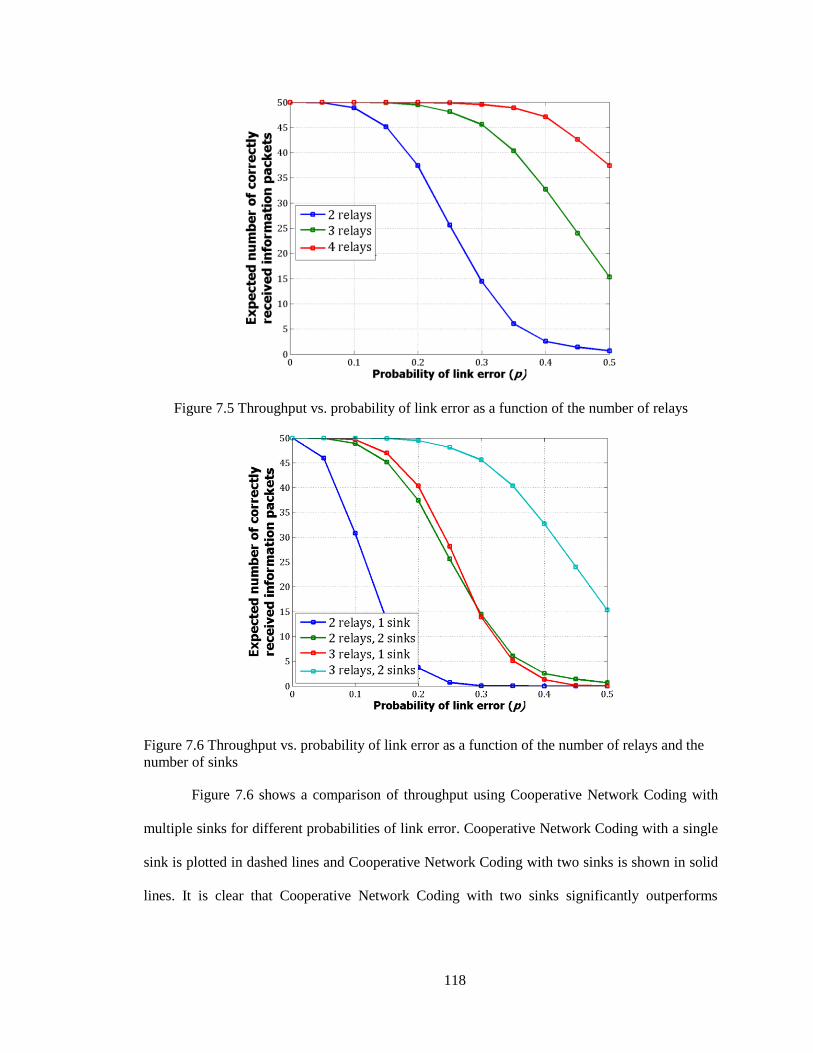
118
Figure 7.5 Throughput vs. probability of link error as a function of the number of relays
Figure 7.6 Throughput vs. probability of link error as a function of the number of relays and the
number of sinks
Figure 7.6 shows a comparison of throughput using Cooperative Network Coding with
multiple sinks for different probabilities of link error. Cooperative Network Coding with a single
sink is plotted in dashed lines and Cooperative Network Coding with two sinks is shown in solid
lines. It is clear that Cooperative Network Coding with two sinks significantly outperforms
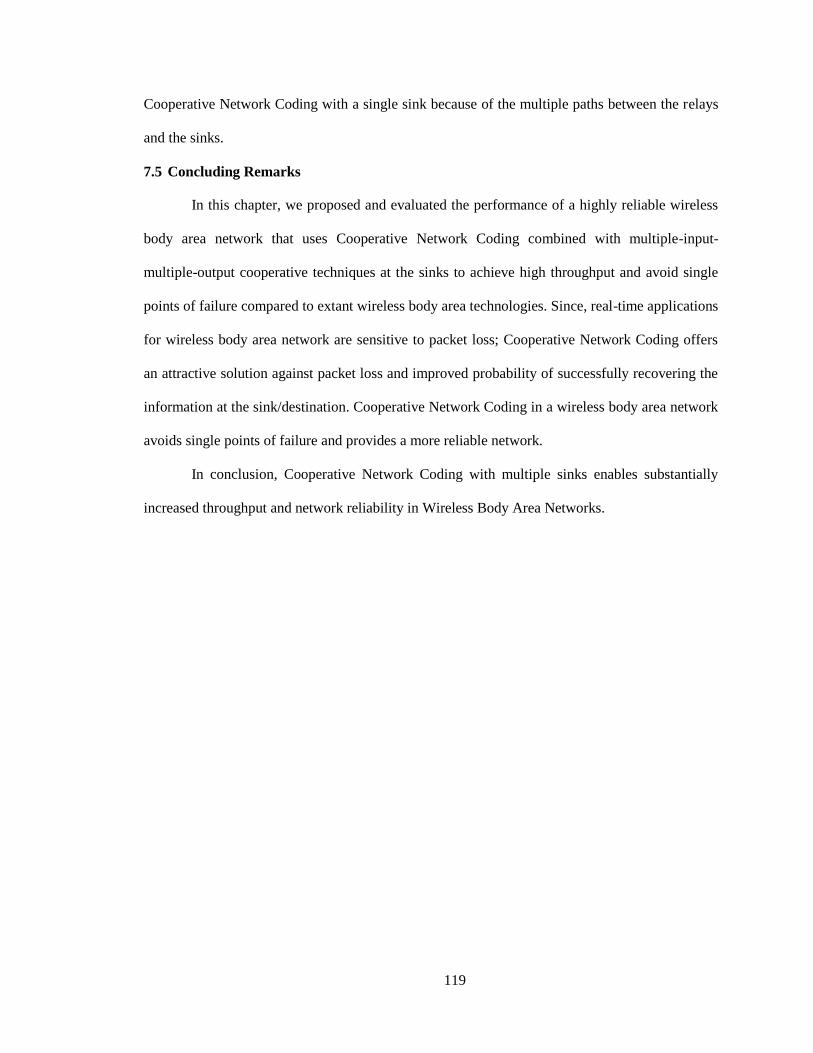
119
Cooperative Network Coding with a single sink because of the multiple paths between the relays
and the sinks.
7.5 Concluding Remarks
In this chapter, we proposed and evaluated the performance of a highly reliable wireless
body area network that uses Cooperative Network Coding combined with multiple-input-
multiple-output cooperative techniques at the sinks to achieve high throughput and avoid single
points of failure compared to extant wireless body area technologies. Since, real-time applications
for wireless body area network are sensitive to packet loss; Cooperative Network Coding offers
an attractive solution against packet loss and improved probability of successfully recovering the
information at the sink/destination. Cooperative Network Coding in a wireless body area network
avoids single points of failure and provides a more reliable network.
In conclusion, Cooperative Network Coding with multiple sinks enables substantially
increased throughput and network reliability in Wireless Body Area Networks.
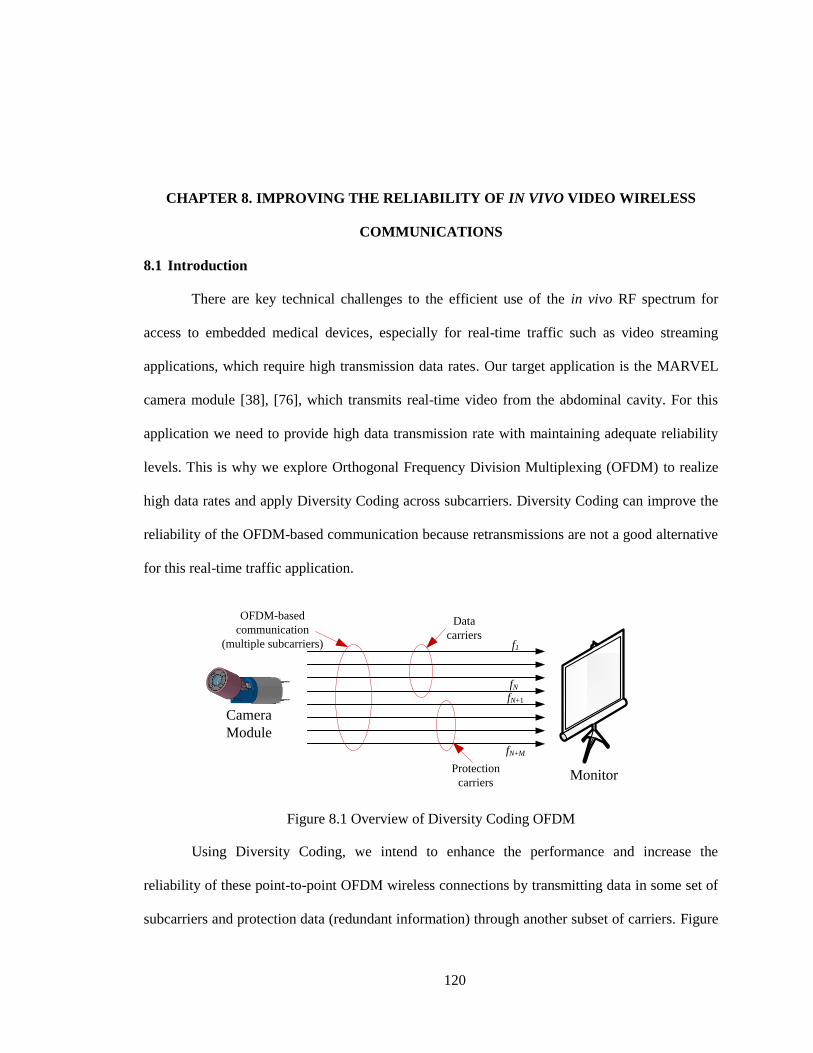
120
CHAPTER 8. IMPROVING THE RELIABILITY OF IN VIVO VIDEO WIRELESS
COMMUNICATIONS
8.1 Introduction
There are key technical challenges to the efficient use of the in vivo RF spectrum for
access to embedded medical devices, especially for real-time traffic such as video streaming
applications, which require high transmission data rates. Our target application is the MARVEL
camera module [38], [76], which transmits real-time video from the abdominal cavity. For this
application we need to provide high data transmission rate with maintaining adequate reliability
levels. This is why we explore Orthogonal Frequency Division Multiplexing (OFDM) to realize
high data rates and apply Diversity Coding across subcarriers. Diversity Coding can improve the
reliability of the OFDM-based communication because retransmissions are not a good alternative
for this real-time traffic application.
OFDM-based
communication
(multiple subcarriers) f1
fN
Data
carriers
Protection
carriers
fN+1
fN+M
10
Ba
se
21
0B
ase
51
0B
ase
T
Camera
Module
Monitor
Figure 8.1 Overview of Diversity Coding OFDM
Using Diversity Coding, we intend to enhance the performance and increase the
reliability of these point-to-point OFDM wireless connections by transmitting data in some set of
subcarriers and protection data (redundant information) through another subset of carriers. Figure
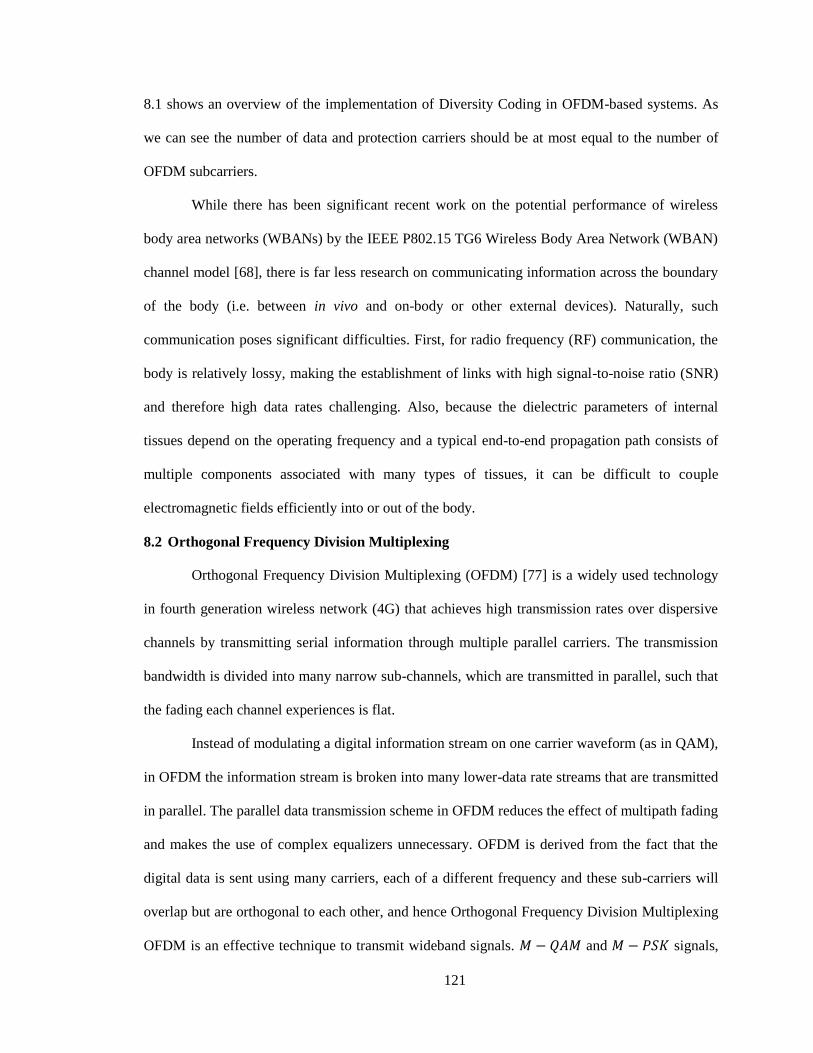
121
8.1 shows an overview of the implementation of Diversity Coding in OFDM-based systems. As
we can see the number of data and protection carriers should be at most equal to the number of
OFDM subcarriers.
While there has been significant recent work on the potential performance of wireless
body area networks (WBANs) by the IEEE P802.15 TG6 Wireless Body Area Network (WBAN)
channel model [68], there is far less research on communicating information across the boundary
of the body (i.e. between in vivo and on-body or other external devices). Naturally, such
communication poses significant difficulties. First, for radio frequency (RF) communication, the
body is relatively lossy, making the establishment of links with high signal-to-noise ratio (SNR)
and therefore high data rates challenging. Also, because the dielectric parameters of internal
tissues depend on the operating frequency and a typical end-to-end propagation path consists of
multiple components associated with many types of tissues, it can be difficult to couple
electromagnetic fields efficiently into or out of the body.
8.2 Orthogonal Frequency Division Multiplexing
Orthogonal Frequency Division Multiplexing (OFDM) [77] is a widely used technology
in fourth generation wireless network (4G) that achieves high transmission rates over dispersive
channels by transmitting serial information through multiple parallel carriers. The transmission
bandwidth is divided into many narrow sub-channels, which are transmitted in parallel, such that
the fading each channel experiences is flat.
Instead of modulating a digital information stream on one carrier waveform (as in QAM),
in OFDM the information stream is broken into many lower-data rate streams that are transmitted
in parallel. The parallel data transmission scheme in OFDM reduces the effect of multipath fading
and makes the use of complex equalizers unnecessary. OFDM is derived from the fact that the
digital data is sent using many carriers, each of a different frequency and these sub-carriers will
overlap but are orthogonal to each other, and hence Orthogonal Frequency Division Multiplexing
OFDM is an effective technique to transmit wideband signals. and signals,
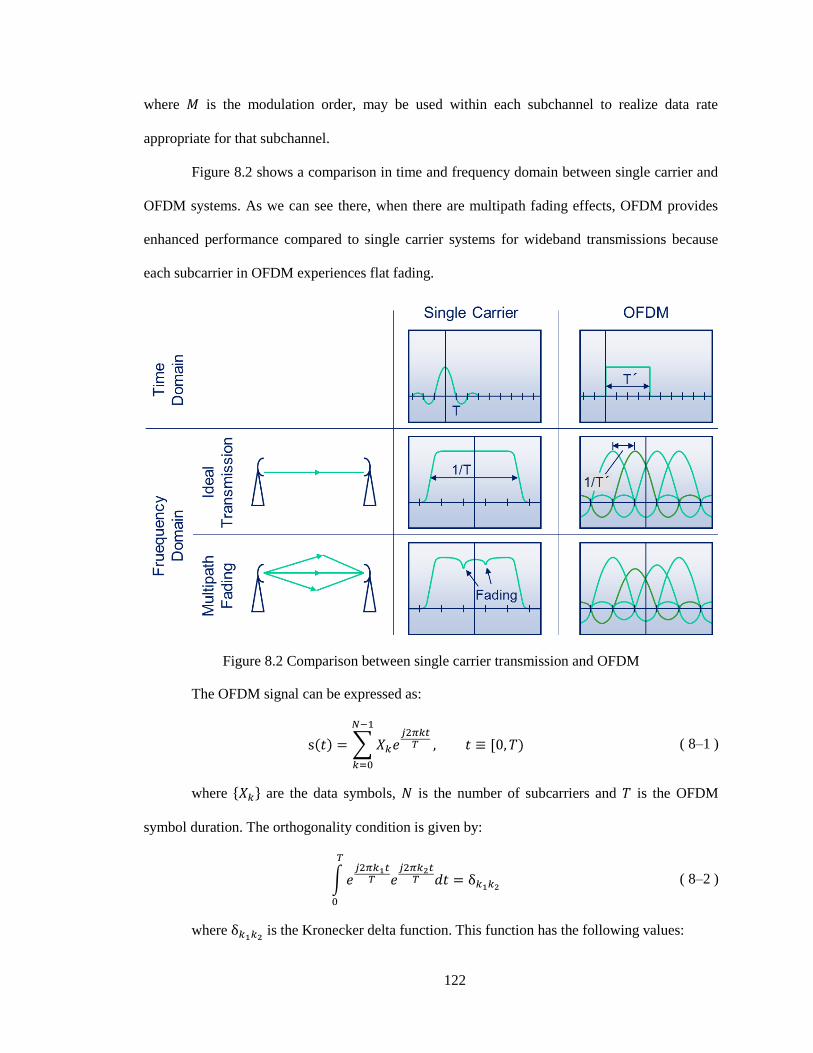
122
where is the modulation order, may be used within each subchannel to realize data rate
appropriate for that subchannel.
Figure 8.2 shows a comparison in time and frequency domain between single carrier and
OFDM systems. As we can see there, when there are multipath fading effects, OFDM provides
enhanced performance compared to single carrier systems for wideband transmissions because
each subcarrier in OFDM experiences flat fading.
Figure 8.2 Comparison between single carrier transmission and OFDM
The OFDM signal can be expressed as:
∑
[ ( 8–1 )
where { } are the data symbols, is the number of subcarriers and is the OFDM
symbol duration. The orthogonality condition is given by:
∫
( 8–2 )
where is the Kronecker delta function. This function has the following values:
123
{
( 8–3 )
The probability of symbol error for a QPSK modulated OFDM signal under an AWGN
channel is given by [78]:
(√ ) (√ ) ( 8–4 )
If we consider a Rayleigh distributed channel, ( 8–4 ) becomes [78]:
√
(
√
) ( 8–5 )
where:
(
)
( 8–6 )
( 8–7 )
( 8–8 )
where is the maximum Doppler shift, is the relative speed between the transmitter
and receiver, is the carrier frequency and is the speed of light. The total bandwidth is
calculated as the product between the number of subcarriers and the subcarrier spacing .
Assuming that all subcarriers experience independent channel conditions and that the
probability of symbol error is the same for all subcarriers, the probability of having symbol
errors in an OFDM symbol is calculated by the probability mass function of the binomial
distribution:
( ) ( )
( )
( 8–9 )
The probability of having no symbol errors in an OFDM symbol can be calculated as:
( )
( 8–10 )
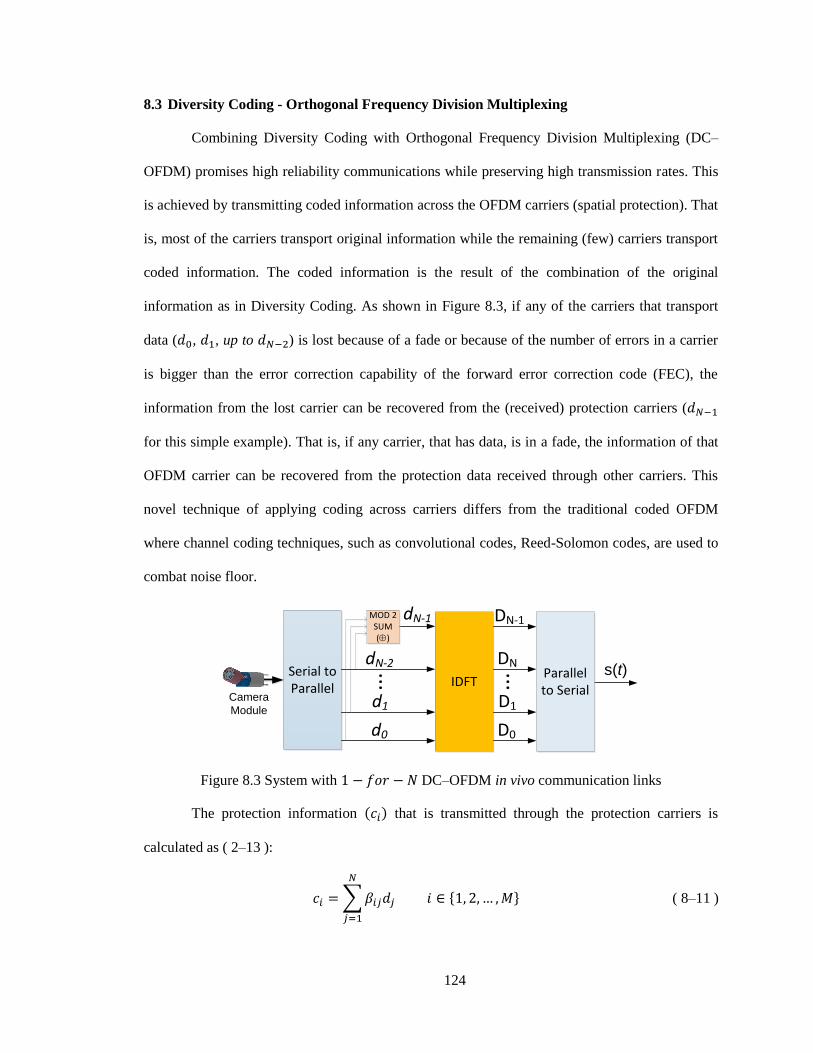
124
8.3 Diversity Coding - Orthogonal Frequency Division Multiplexing
Combining Diversity Coding with Orthogonal Frequency Division Multiplexing (DC–
OFDM) promises high reliability communications while preserving high transmission rates. This
is achieved by transmitting coded information across the OFDM carriers (spatial protection). That
is, most of the carriers transport original information while the remaining (few) carriers transport
coded information. The coded information is the result of the combination of the original
information as in Diversity Coding. As shown in Figure 8.3, if any of the carriers that transport
data ( , , up to ) is lost because of a fade or because of the number of errors in a carrier
is bigger than the error correction capability of the forward error correction code (FEC), the
information from the lost carrier can be recovered from the (received) protection carriers (
for this simple example). That is, if any carrier, that has data, is in a fade, the information of that
OFDM carrier can be recovered from the protection data received through other carriers. This
novel technique of applying coding across carriers differs from the traditional coded OFDM
where channel coding techniques, such as convolutional codes, Reed-Solomon codes, are used to
combat noise floor.
Serial to Parallel
10Base 210Base 5
10Base T
s(t)
d0
d1
dN-2...
MOD 2 SUM (Å)
dN-1
IDFT
D0
D1
DN...
DN-1
Parallel to Serial
Camera
Module
Figure 8.3 System with DC–OFDM in vivo communication links
The protection information that is transmitted through the protection carriers is
calculated as ( 2–13 ):
∑
{ } ( 8–11 )
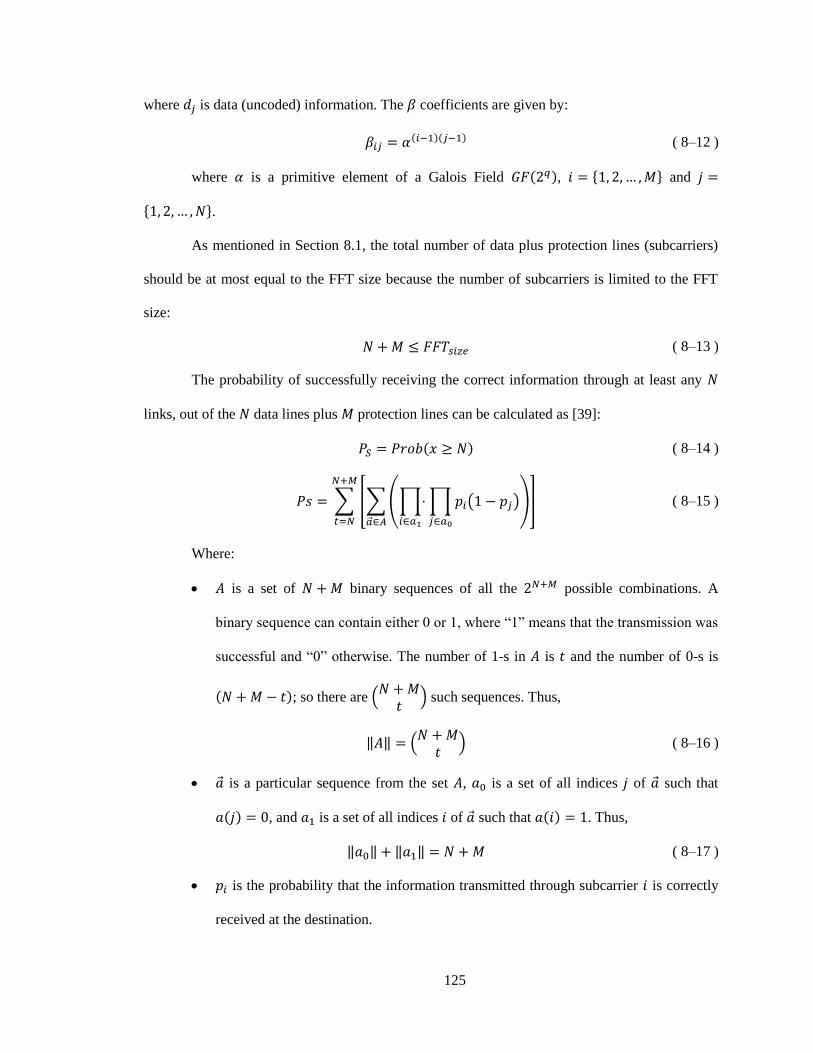
125
where is data (uncoded) information. The coefficients are given by:
( 8–12 )
where is a primitive element of a Galois Field , { } and
{ }.
As mentioned in Section 8.1, the total number of data plus protection lines (subcarriers)
should be at most equal to the FFT size because the number of subcarriers is limited to the FFT
size:
( 8–13 )
The probability of successfully receiving the correct information through at least any
links, out of the data lines plus protection lines can be calculated as [39]:
( 8–14 )
∑ [∑(∏
∏ ( )
)
]
( 8–15 )
Where:
is a set of binary sequences of all the possible combinations. A
binary sequence can contain either 0 or 1, where “1” means that the transmission was
successful and “0” otherwise. The number of 1-s in is and the number of 0-s is
; so there are (
) such sequences. Thus,
‖ ‖ (
) ( 8–16 )
is a particular sequence from the set , is a set of all indices of such that
, and is a set of all indices of such that . Thus,
‖ ‖ ‖ ‖ ( 8–17 )
is the probability that the information transmitted through subcarrier is correctly
received at the destination.
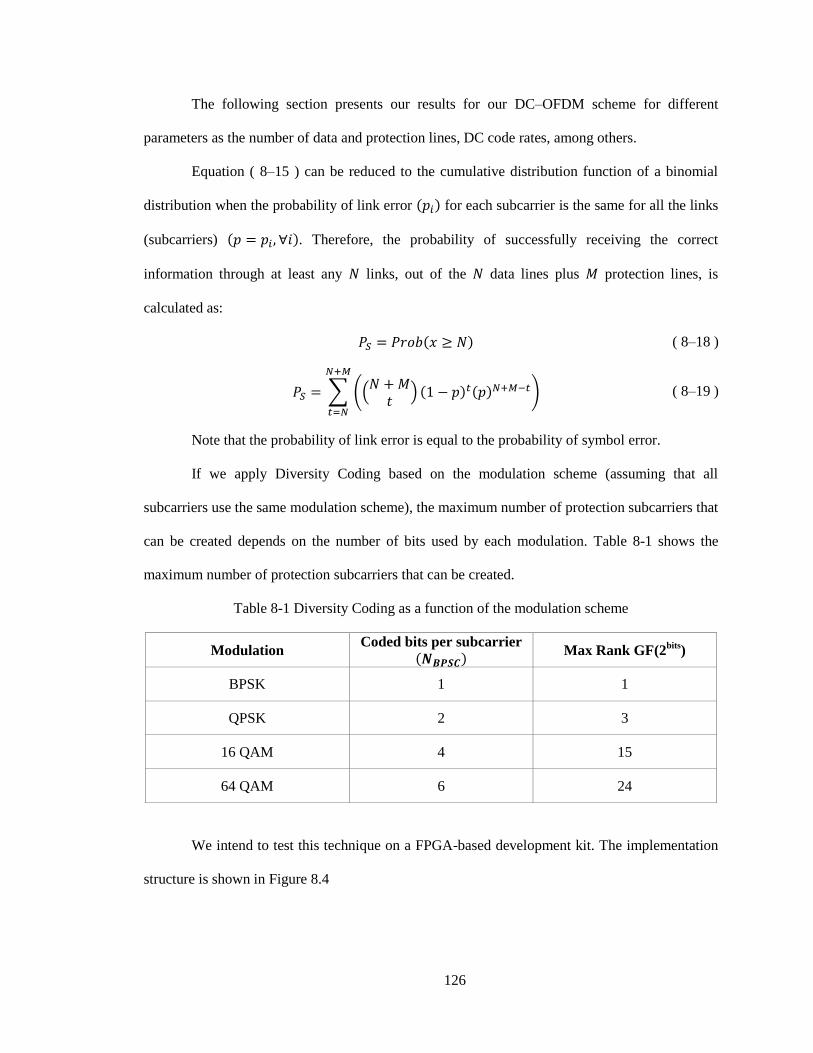
126
The following section presents our results for our DC–OFDM scheme for different
parameters as the number of data and protection lines, DC code rates, among others.
Equation ( 8–15 ) can be reduced to the cumulative distribution function of a binomial
distribution when the probability of link error for each subcarrier is the same for all the links
(subcarriers) . Therefore, the probability of successfully receiving the correct
information through at least any links, out of the data lines plus protection lines, is
calculated as:
( 8–18 )
∑ ((
) )
( 8–19 )
Note that the probability of link error is equal to the probability of symbol error.
If we apply Diversity Coding based on the modulation scheme (assuming that all
subcarriers use the same modulation scheme), the maximum number of protection subcarriers that
can be created depends on the number of bits used by each modulation. Table 8-1 shows the
maximum number of protection subcarriers that can be created.
Table 8-1 Diversity Coding as a function of the modulation scheme
Modulation Coded bits per subcarrier
Max Rank GF(2
bits)
BPSK 1 1
QPSK 2 3
16 QAM 4 15
64 QAM 6 24
We intend to test this technique on a FPGA-based development kit. The implementation
structure is shown in Figure 8.4
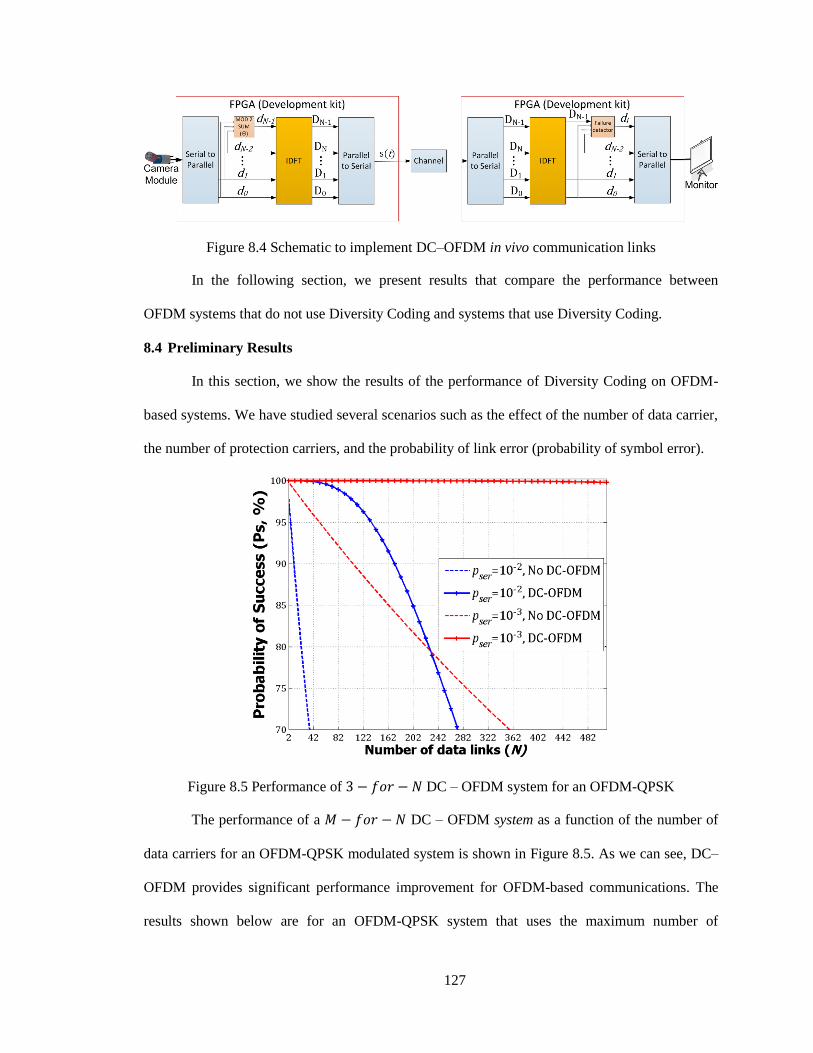
127
Figure 8.4 Schematic to implement DC–OFDM in vivo communication links
In the following section, we present results that compare the performance between
OFDM systems that do not use Diversity Coding and systems that use Diversity Coding.
8.4 Preliminary Results
In this section, we show the results of the performance of Diversity Coding on OFDM-
based systems. We have studied several scenarios such as the effect of the number of data carrier,
the number of protection carriers, and the probability of link error (probability of symbol error).
Figure 8.5 Performance of DC – OFDM system for an OFDM-QPSK
The performance of a DC – OFDM system as a function of the number of
data carriers for an OFDM-QPSK modulated system is shown in Figure 8.5. As we can see, DC–
OFDM provides significant performance improvement for OFDM-based communications. The
results shown below are for an OFDM-QPSK system that uses the maximum number of
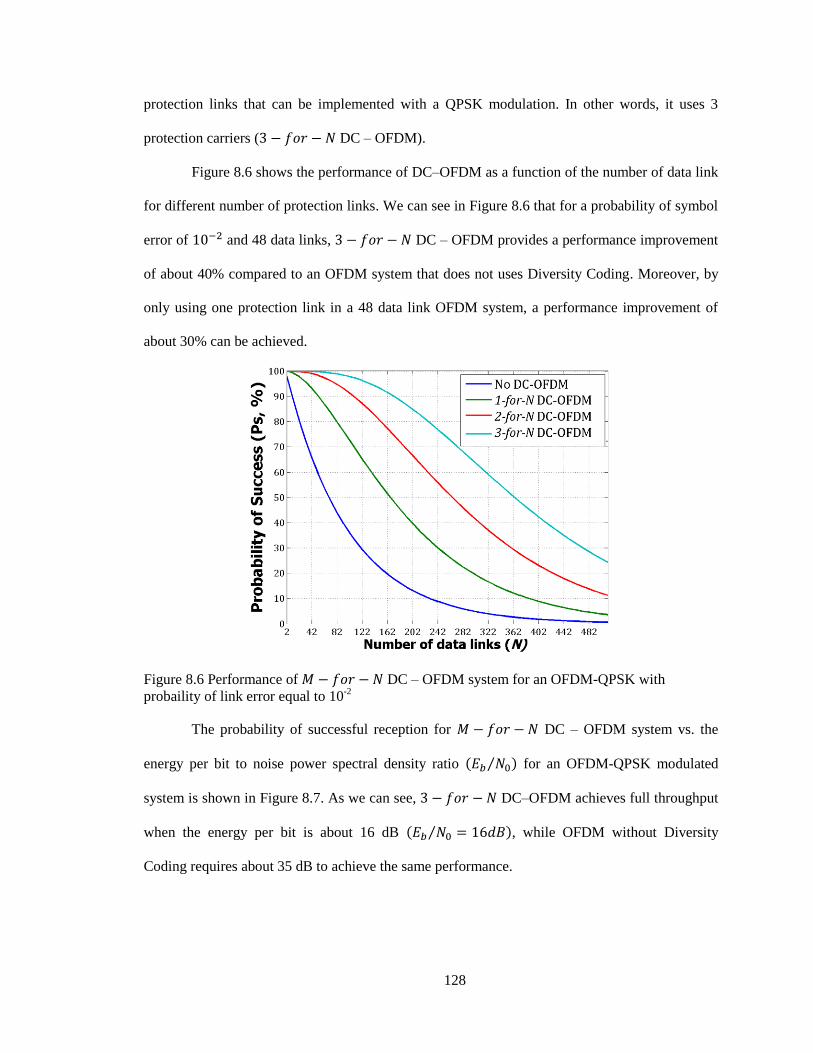
128
protection links that can be implemented with a QPSK modulation. In other words, it uses 3
protection carriers ( DC – OFDM).
Figure 8.6 shows the performance of DC–OFDM as a function of the number of data link
for different number of protection links. We can see in Figure 8.6 that for a probability of symbol
error of and 48 data links, DC – OFDM provides a performance improvement
of about 40% compared to an OFDM system that does not uses Diversity Coding. Moreover, by
only using one protection link in a 48 data link OFDM system, a performance improvement of
about 30% can be achieved.
Figure 8.6 Performance of DC – OFDM system for an OFDM-QPSK with
probaility of link error equal to 10-2
The probability of successful reception for DC – OFDM system vs. the
energy per bit to noise power spectral density ratio ⁄ for an OFDM-QPSK modulated
system is shown in Figure 8.7. As we can see, DC–OFDM achieves full throughput
when the energy per bit is about 16 dB ⁄ , while OFDM without Diversity
Coding requires about 35 dB to achieve the same performance.
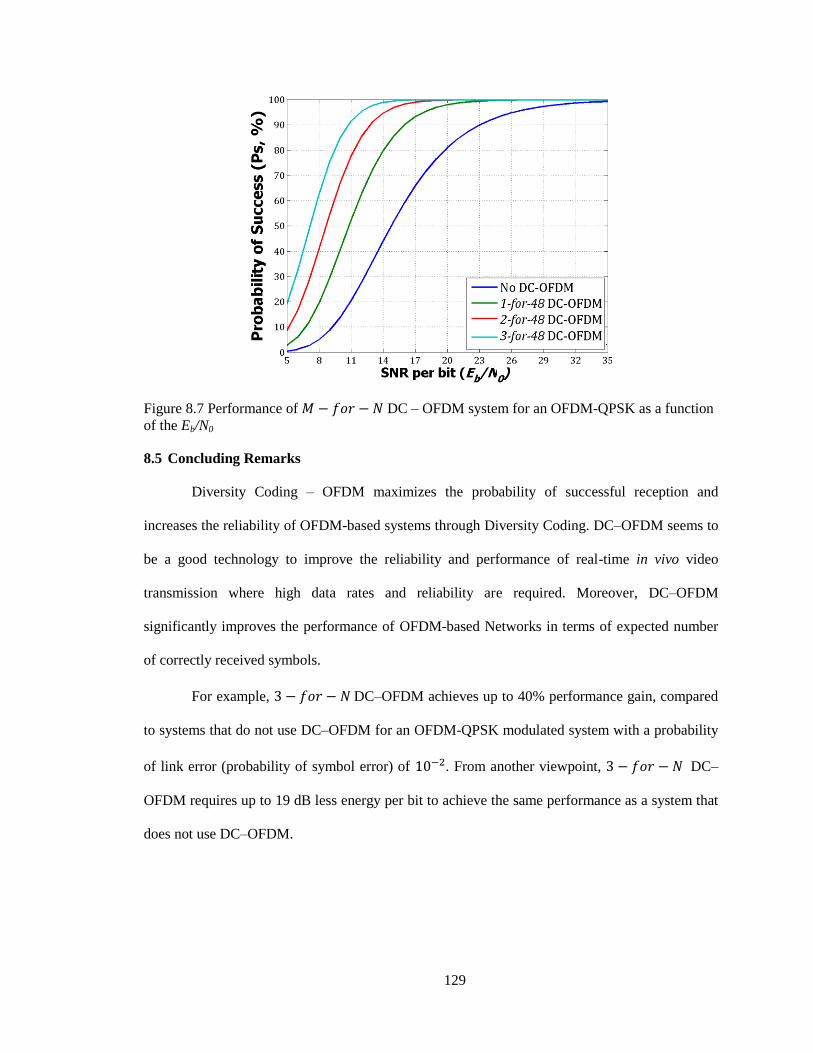
129
Figure 8.7 Performance of DC – OFDM system for an OFDM-QPSK as a function
of the Eb/N0
8.5 Concluding Remarks
Diversity Coding – OFDM maximizes the probability of successful reception and
increases the reliability of OFDM-based systems through Diversity Coding. DC–OFDM seems to
be a good technology to improve the reliability and performance of real-time in vivo video
transmission where high data rates and reliability are required. Moreover, DC–OFDM
significantly improves the performance of OFDM-based Networks in terms of expected number
of correctly received symbols.
For example, DC–OFDM achieves up to 40% performance gain, compared
to systems that do not use DC–OFDM for an OFDM-QPSK modulated system with a probability
of link error (probability of symbol error) of . From another viewpoint, DC–
OFDM requires up to 19 dB less energy per bit to achieve the same performance as a system that
does not use DC–OFDM.
130
CHAPTER 9. DC–OFDM FOR IMPROVING THE RELIABILITY OF VEHICULAR
COMMUNICATIONS
9.1 Introduction
Vehicular communications play an important role in vehicle safety and transportation
efficiency. The objective of vehicular communication is to ensure vehicle safety for the drivers
and passengers and to reduce time and fuel consumption, among other services. A few of the
primary applications envisioned for vehicular networks are emergency notifications for
automotive safety, notification and prevention of vehicles during collision, location-based
information and vehicle tracking services, high-speed tolling, real-time traffic updates and
Internet access with multimedia streaming.
For short and medium range communications, WAVE/IEEE 802.11p standards-based
systems have been devised using the WLAN technologies in these systems. These systems have
acceptable transmission range and power, although, they are limited in terms of coverage
distance. WAVE systems are complex as the vehicular environment is dynamic. Therefore, it is
important to maintain a stable and reliable wireless connection for a significant period of time.
Moreover, Wireless Access in Vehicular Environments (WAVE), which is a wireless scheme that
provides vehicle-to-vehicle communication and vehicle-to-infrastructure communication, has as
its primary application in providing emergency safety measures for vehicles.
IEEE 802.11p uses Orthogonal Frequency Division Multiplexing (OFDM) [77] to
transmit information. OFDM is a widely used technology in fourth generation wireless networks
(4G) and 802.11a/g/n WLANs that achieve high transmission rates over dispersive channels by
transmitting serial information through multiple parallel carriers. The transmission bandwidth is
131
divided into many narrow sub-channels, which are transmitted in parallel, such that the fading
each channel experiences is flat.
Many applications need to be communicated in a timely manner, so reliability of these
networks is a concern. To overcome these issues, the novel idea of employing Diversity Coding
[13] across OFDM subchannels is proposed. Diversity coded OFDM-based systems [45] are
capable of achieving better spectrum efficiency with excellent transmission rates, improved
throughput, perform better during multipath fading and retrieve lost information easily without
the need of retransmission or feedback from the transmitter when compared to other similar
schemes employed in VANETs (Vehicular Ad-Hoc Networks). Using Diversity Coding, reliable
information can be transmitted especially for time-critical applications even when a reliable
infrastructure is available.
9.2 Literature Review
9.2.1 Wireless Access in Vehicular Environments
WAVE is a combination of both IEEE 802.11p and IEEE 1609.x working in the DSRC
(Dedicated Short Range Communications) band (75 MHz bandwidth operating between 5.85
GHz and 5.925 GHz) specifically for both the PHY and the MAC layers. IEEE 1609 is a higher
layer standard based on the IEEE 802.11p.
The IEEE 802.11p standard PHY layer is similar to the 802.11a standard, but with
specific features matched to the communication requirements between vehicles or between a
vehicle and the infrastructure in current vehicular environments. The key points that drove the
802.11p standard are the relative speed (distances) between the vehicles, the maximum possible
coverage distance (~1000 meter radius), varying multipath channel effects in multiple
environments and most importantly, the reliability and the security of the message broadcasted in
the network. The 5.85 – 5.925 GHz band was chosen to minimize the interference and
overcrowding present in the operating bandwidth of 802.11a WLANs. The 75 MHz bandwidth of
802.11p is divided into seven 10MHz channels each with a 5 MHz margin at the lower end. Since
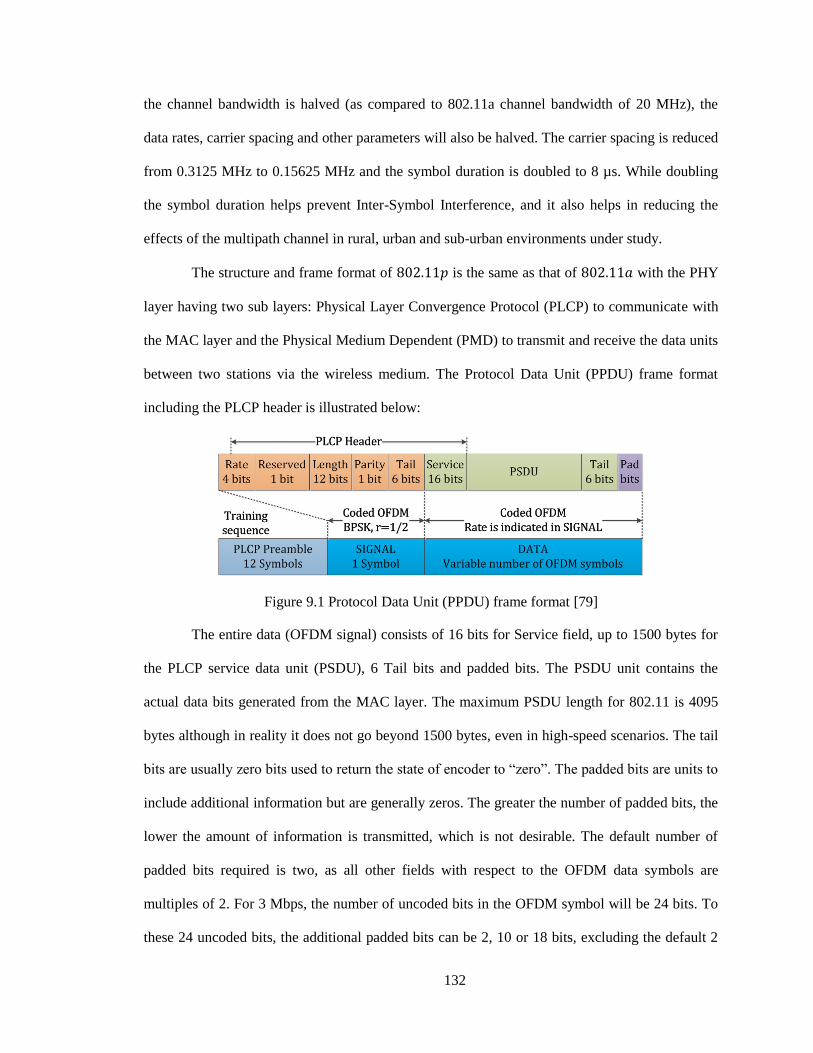
132
the channel bandwidth is halved (as compared to 802.11a channel bandwidth of 20 MHz), the
data rates, carrier spacing and other parameters will also be halved. The carrier spacing is reduced
from 0.3125 MHz to 0.15625 MHz and the symbol duration is doubled to 8 µs. While doubling
the symbol duration helps prevent Inter-Symbol Interference, and it also helps in reducing the
effects of the multipath channel in rural, urban and sub-urban environments under study.
The structure and frame format of is the same as that of with the PHY
layer having two sub layers: Physical Layer Convergence Protocol (PLCP) to communicate with
the MAC layer and the Physical Medium Dependent (PMD) to transmit and receive the data units
between two stations via the wireless medium. The Protocol Data Unit (PPDU) frame format
including the PLCP header is illustrated below:
Figure 9.1 Protocol Data Unit (PPDU) frame format [79]
The entire data (OFDM signal) consists of 16 bits for Service field, up to 1500 bytes for
the PLCP service data unit (PSDU), 6 Tail bits and padded bits. The PSDU unit contains the
actual data bits generated from the MAC layer. The maximum PSDU length for 802.11 is 4095
bytes although in reality it does not go beyond 1500 bytes, even in high-speed scenarios. The tail
bits are usually zero bits used to return the state of encoder to “zero”. The padded bits are units to
include additional information but are generally zeros. The greater the number of padded bits, the
lower the amount of information is transmitted, which is not desirable. The default number of
padded bits required is two, as all other fields with respect to the OFDM data symbols are
multiples of 2. For 3 Mbps, the number of uncoded bits in the OFDM symbol will be 24 bits. To
these 24 uncoded bits, the additional padded bits can be 2, 10 or 18 bits, excluding the default 2
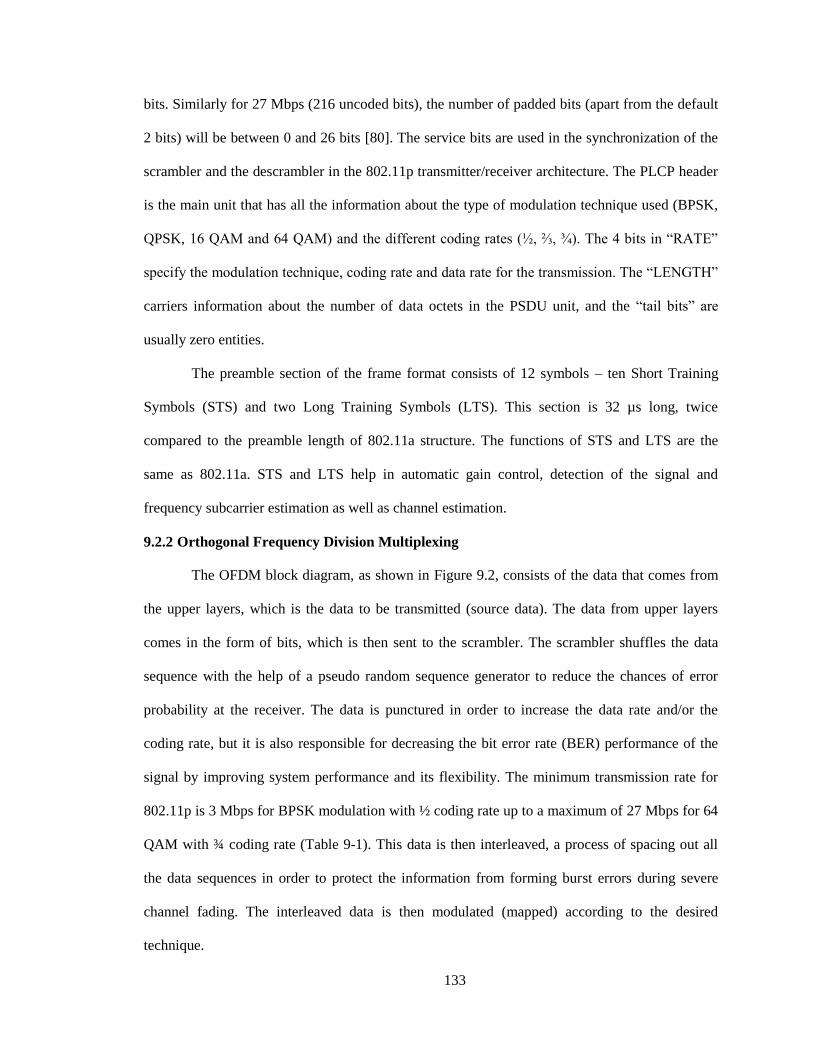
133
bits. Similarly for 27 Mbps (216 uncoded bits), the number of padded bits (apart from the default
2 bits) will be between 0 and 26 bits [80]. The service bits are used in the synchronization of the
scrambler and the descrambler in the 802.11p transmitter/receiver architecture. The PLCP header
is the main unit that has all the information about the type of modulation technique used (BPSK,
QPSK, 16 QAM and 64 QAM) and the different coding rates (½, ⅔, ¾). The 4 bits in “RATE”
specify the modulation technique, coding rate and data rate for the transmission. The “LENGTH”
carriers information about the number of data octets in the PSDU unit, and the “tail bits” are
usually zero entities.
The preamble section of the frame format consists of 12 symbols – ten Short Training
Symbols (STS) and two Long Training Symbols (LTS). This section is 32 µs long, twice
compared to the preamble length of 802.11a structure. The functions of STS and LTS are the
same as 802.11a. STS and LTS help in automatic gain control, detection of the signal and
frequency subcarrier estimation as well as channel estimation.
9.2.2 Orthogonal Frequency Division Multiplexing
The OFDM block diagram, as shown in Figure 9.2, consists of the data that comes from
the upper layers, which is the data to be transmitted (source data). The data from upper layers
comes in the form of bits, which is then sent to the scrambler. The scrambler shuffles the data
sequence with the help of a pseudo random sequence generator to reduce the chances of error
probability at the receiver. The data is punctured in order to increase the data rate and/or the
coding rate, but it is also responsible for decreasing the bit error rate (BER) performance of the
signal by improving system performance and its flexibility. The minimum transmission rate for
802.11p is 3 Mbps for BPSK modulation with ½ coding rate up to a maximum of 27 Mbps for 64
QAM with ¾ coding rate (Table 9-1). This data is then interleaved, a process of spacing out all
the data sequences in order to protect the information from forming burst errors during severe
channel fading. The interleaved data is then modulated (mapped) according to the desired
technique.
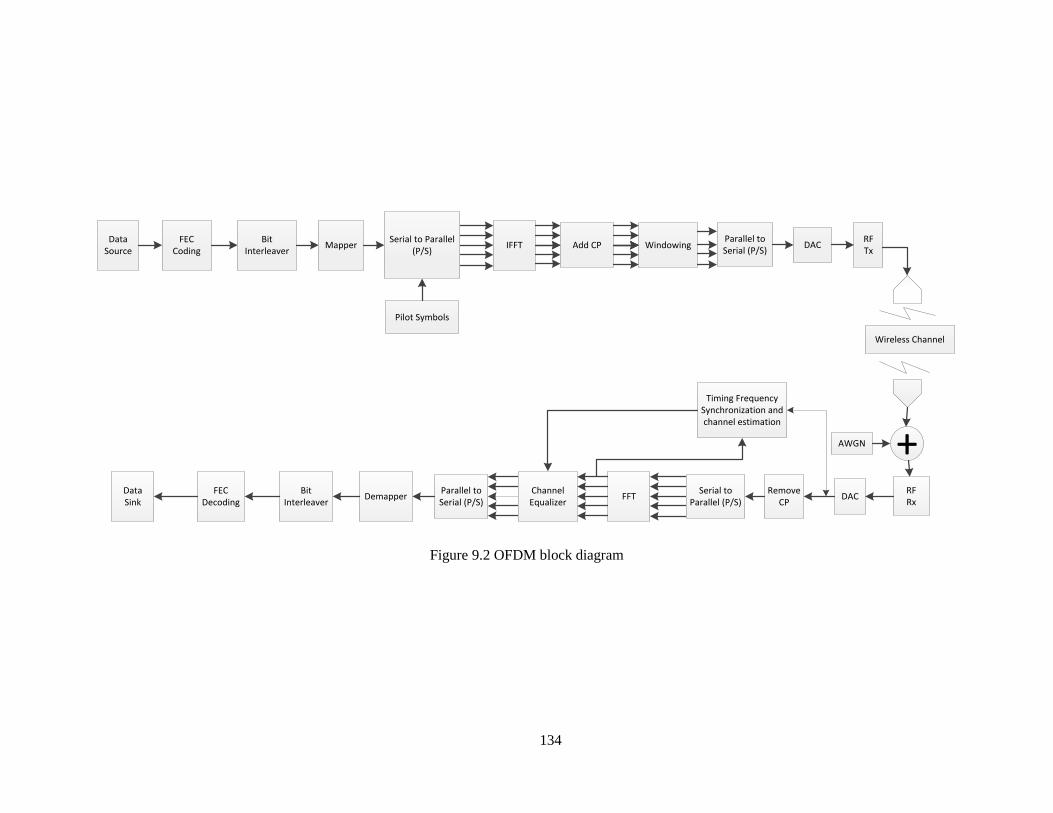
134
Parallel to Serial (P/S)
Bit Interleaver
FEC Decoding
Data Sink
Demapper Channel Equalizer
Parallel to Serial (P/S)
DACRF Tx
Wireless Channel
+AWGN
RF Rx
DACRemove
CP
Timing Frequency Synchronization and channel estimation
Serial to Parallel (P/S)
FFT
WindowingAdd CPIFFT Data
Source FEC
CodingBit
InterleaverMapper
Pilot Symbols
Serial to Parallel (P/S)
Figure 9.2 OFDM block diagram
135
Similar to the 802.11a architecture, the 802.11p has a total of 64 carriers, each occupying
0.15625 MHz. The 64 carriers are divided into 48 subcarriers carrying the data, 4 pilot carriers to
make the signal robust against frequency offset and the remaining 12 null subcarriers. The data
bits are then converted to symbols that contain a value (integer and/or complex) and occupy their
respective positions in the constellation. The subcarriers subjected to IFFT (Inverse Fourier
Transform) convert from the frequency domain to the time domain. The output of the IFFT
process is the OFDM symbol. To this symbol, guard intervals (GI) are added to prevent the
symbol from Inter-Symbol Interference (ISI) and Inter-Carrier Interference (ICI). ICI causes loss
of orthogonality and frequency offset and can be mitigated by windowing to smooth out the
transitions between the symbols. The guard interval (TGI1) of 802.11p is twice that of 802.11a
and this is better in reducing the effects of ISI and mitigating the effects of the multipath channel.
The guard interval for OFDM in 802.11a is 0.8 µs seems to be sufficient for the suburban
environment; however there are chances of the multipath channel subjected to additional (excess)
delay in the rural, urban and highway-based environments. In such cases, the channel model
becomes very difficult to be estimated due to the rapidly changing environment. For high-speed
scenarios, the channel is difficult to predict and there is an increase in the Doppler shift, which in
turn degrades the quality of the signal and increases the Bit Error Rate (BER). The choice of
having a longer guard interval is a tradeoff between the bandwidth of the data and the reliability
as longer GI reduces the throughput of the channel. In the case of 802.11p standard, the guard
interval is observed to be longer than the maximum excess delay in all the environments.
The bit error rate of an OFDM-based system for modulation scheme in
AWGN and Rayleigh channels, respectively, are given by [81]:
(√
) ( 9–1 )
136
(
√
)
( 9–2 )
where is the order of the modulation scheme and
⁄ is the energy per bit to noise
power spectral density ratio. The symbol error probability for a M-QAM and M-PSK
modulated OFDM signals under an AWGN channel are given by [64]:
(
√ ) (√
)
(
√ )
(√
)
( 9–3 )
∫
(
)
( 9–4 )
If we assume that the channel is an ideal linear time-invariant frequency non-dispersive
AWGN channel, the receiver sees the OFDM signal as a group of parallel AWGN channels with
equal that has a similar performance as a single carrier system. That is, the average symbol
error probability for an OFDM symbol is equal to the symbol error probability of a subcarrier.
∑
( 9–5 )
Since
, then
( 9–6 )
However, the OFDM signal has a lower compared to the single carrier signal due to
the cyclic prefix.
When a multipath channel is assumed (e.g. Rayleigh distributed), the symbol error
probability for a QPSK modulated OFDM signal can be calculated as [78]:
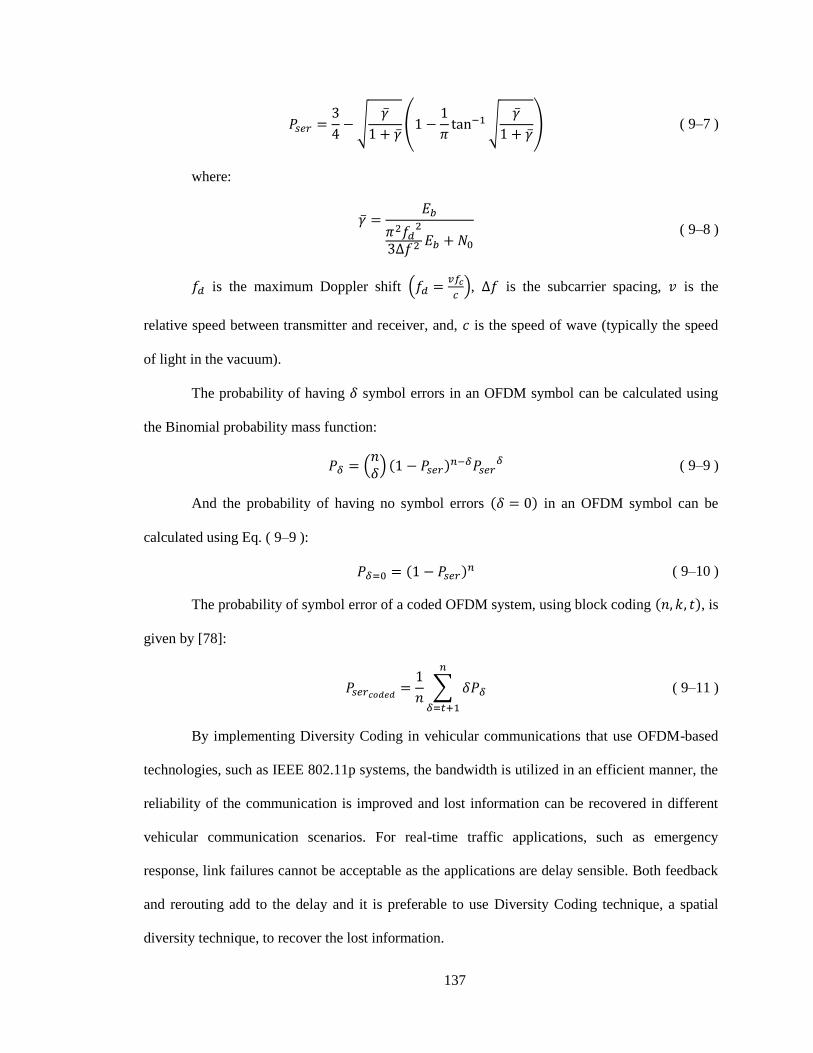
137
√
(
√
) ( 9–7 )
where:
( 9–8 )
is the maximum Doppler shift (
), is the subcarrier spacing, is the
relative speed between transmitter and receiver, and, is the speed of wave (typically the speed
of light in the vacuum).
The probability of having symbol errors in an OFDM symbol can be calculated using
the Binomial probability mass function:
( )
( 9–9 )
And the probability of having no symbol errors in an OFDM symbol can be
calculated using Eq. ( 9–9 ):
( 9–10 )
The probability of symbol error of a coded OFDM system, using block coding , is
given by [78]:
∑
( 9–11 )
By implementing Diversity Coding in vehicular communications that use OFDM-based
technologies, such as IEEE 802.11p systems, the bandwidth is utilized in an efficient manner, the
reliability of the communication is improved and lost information can be recovered in different
vehicular communication scenarios. For real-time traffic applications, such as emergency
response, link failures cannot be acceptable as the applications are delay sensible. Both feedback
and rerouting add to the delay and it is preferable to use Diversity Coding technique, a spatial
diversity technique, to recover the lost information.
138
9.2.3 Diversity Coding
Diversity Coding [13–15] is a feed-forward spatial diversity technology that
enables near instant self-healing and fault-tolerance in the presence of wireless link failures. We
use the mathematical analysis developed in CHAPTER 2 to study the performance of our
proposed approach.
9.3 Related Work – Network Coding for OFDM-Based Systems
Network coding, which is an enhancement of Diversity Coding, is a concept where
packets are combined and transmitted through different nodes or locations. The aim of Network
Coding is to reduce the number of packet retransmission and thereby improve system bandwidth
and throughput.
There are two different Network Coding techniques widely used at different levels
(symbol level and packet level) applicable to both PHY and MAC layers in IEEE 802.11p
(WAVE) systems.
9.3.1 Network Coding in the MAC Layer
Wireless systems generally broadcast information in multiple frequency channels and
follow the multihop pattern that tends to overcrowd the available frequency bandwidth. This
results in interference due to increase in the number of wireless devices used today. A system
with multiple hops reduces the resultant throughput of the system that is not desired. Wireless
Network Coding (WNC) helps a multihop system use fewer transmissions, in contrast to a
multihop system that does not use WNC.
The WNC scheme is typically a MAC layer oriented scheme based on the proposed
method of sending acknowledgment (ACK) packets from both the nodes A and B for OFDM
based systems. This technique complies with the IEEE 802.11a (WLAN) standard. As shown in
Figure 9.3(b), both A and B transmit their packet to the relay R that stores these packets and
performs an XOR operation on the packets and sends the resultant output to A and B. Since A
and B know the packet they transmitted, they decode the XORed output and obtain the necessary
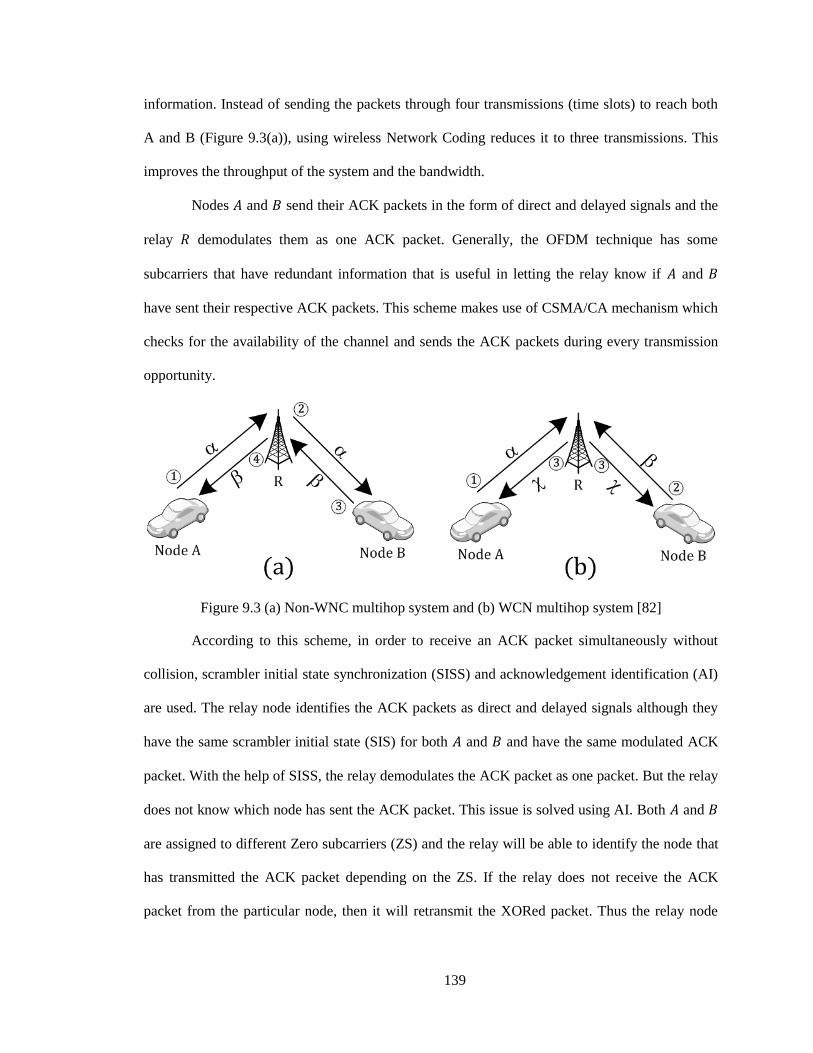
139
information. Instead of sending the packets through four transmissions (time slots) to reach both
A and B (Figure 9.3(a)), using wireless Network Coding reduces it to three transmissions. This
improves the throughput of the system and the bandwidth.
Nodes and send their ACK packets in the form of direct and delayed signals and the
relay demodulates them as one ACK packet. Generally, the OFDM technique has some
subcarriers that have redundant information that is useful in letting the relay know if and
have sent their respective ACK packets. This scheme makes use of CSMA/CA mechanism which
checks for the availability of the channel and sends the ACK packets during every transmission
opportunity.
Figure 9.3 (a) Non-WNC multihop system and (b) WCN multihop system [82]
According to this scheme, in order to receive an ACK packet simultaneously without
collision, scrambler initial state synchronization (SISS) and acknowledgement identification (AI)
are used. The relay node identifies the ACK packets as direct and delayed signals although they
have the same scrambler initial state (SIS) for both and and have the same modulated ACK
packet. With the help of SISS, the relay demodulates the ACK packet as one packet. But the relay
does not know which node has sent the ACK packet. This issue is solved using AI. Both and
are assigned to different Zero subcarriers (ZS) and the relay will be able to identify the node that
has transmitted the ACK packet depending on the ZS. If the relay does not receive the ACK
packet from the particular node, then it will retransmit the XORed packet. Thus the relay node
140
can discriminate between the nodes based on the nulls in the spectrum resulting in higher MAC
throughput.
The WNC scheme is found to have high efficiency and very low packet transmission loss
compared to traditional schemes. TCP throughput is observed to increase by 3.4 Mbps at 25 dB
SNR and has much better packet loss rate (PLR) performance which ensures high reliability than
in conventional systems [82].
9.3.2 Network Coding in the PHY Layer
In the PHY layer, symbol level Network Coding is a predominant method and there are
different approaches used in vehicular to vehicular (V2V) and vehicular to infrastructure (V2I)
communications [83–87]. Vehicular communications are point-to-point communications with an
infrastructure such as roadside units. However, in reality, most of the communications take place
in Ad-Hoc network mode (Vehicular Ad-Hoc Network, VANET) with the help of relays. The
vehicles adopt the Ad-Hoc network mode in situations when there is no availability of roadside
units in the particular area of interest.
There are several approaches that implement Network Coding in the PHY layer. A few of
them are:
9.3.2.1 Rate Diverse Network Coding
The idea of combining modulation techniques with the conventional Network Coding
scheme in the physical layer as Rate diverse Network Coding (RDNC) [88] was proposed for
IEEE 802.11a/g networks to demodulate the signal received at different nodes according to their
respective channel types.
As shown in Figure 9.4, using BPSK modulation node sends two packets to the relay
node and node sends only one packet to the relay. The relay codes both packets from node
with one packet from node and transmits it to node using QPSK modulation.
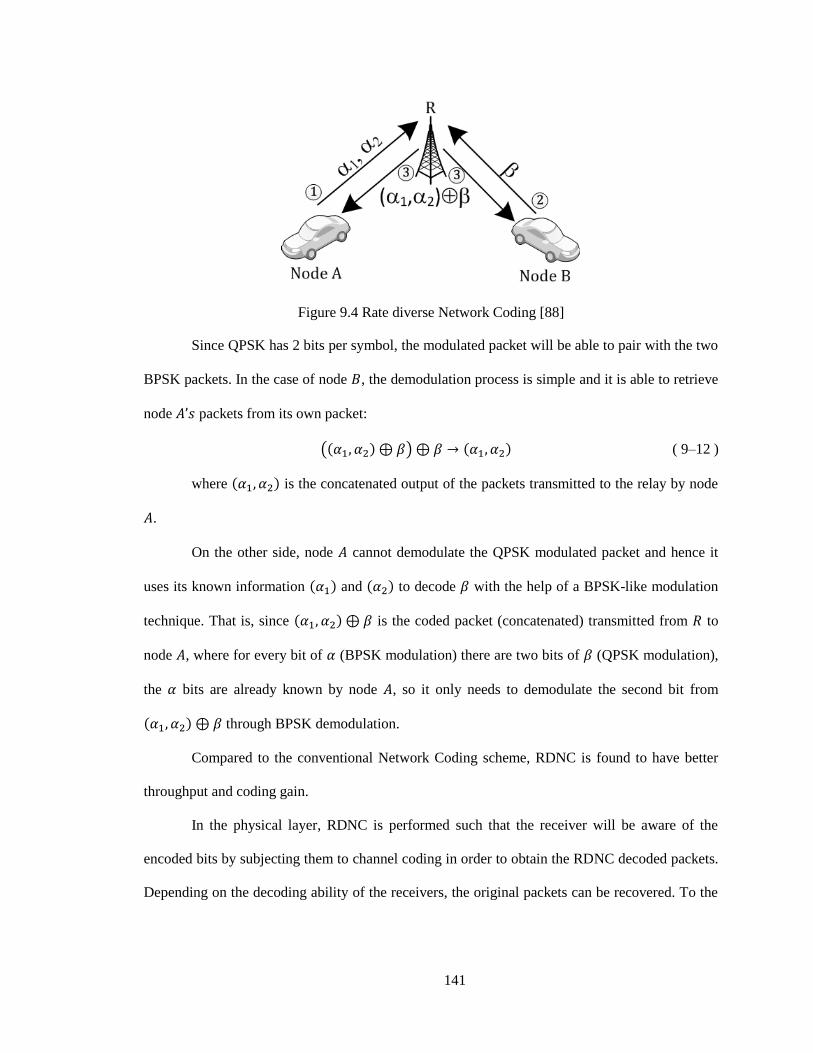
141
Figure 9.4 Rate diverse Network Coding [88]
Since QPSK has 2 bits per symbol, the modulated packet will be able to pair with the two
BPSK packets. In the case of node , the demodulation process is simple and it is able to retrieve
node packets from its own packet:
( ) ( 9–12 )
where is the concatenated output of the packets transmitted to the relay by node
.
On the other side, node cannot demodulate the QPSK modulated packet and hence it
uses its known information and to decode with the help of a BPSK-like modulation
technique. That is, since is the coded packet (concatenated) transmitted from to
node , where for every bit of (BPSK modulation) there are two bits of (QPSK modulation),
the bits are already known by node , so it only needs to demodulate the second bit from
through BPSK demodulation.
Compared to the conventional Network Coding scheme, RDNC is found to have better
throughput and coding gain.
In the physical layer, RDNC is performed such that the receiver will be aware of the
encoded bits by subjecting them to channel coding in order to obtain the RDNC decoded packets.
Depending on the decoding ability of the receivers, the original packets can be recovered. To the
142
encoded packet, the header is added and sent to the receiver. The receiver will use the header,
PLCP, Nexthop and Packetfield information to identify its destination.
This scheme is still valid even if the packets to be XORed do not have the same bits.
Among the coding rates that comply with the IEEE 802.11a standard, RDNC uses ¾ coding rate
as it is capable of carrying more information than the other rates. Therefore, it is limited to 9
Mbps (BPSK), 18 Mbps (QPSK) and 36 Mbps (16 QAM). When different symbols carrying
different bits and modulation techniques are sent, there is a problem in combining these into one
single packet and then sending it to the destination nodes. BPSK is the preferred modulation
method in conventional systems but it is inefficient modulation techniques for higher quality
links.
9.3.2.2 CodePlay
CodePlay [89] is a symbol level Network Coding (SLNC) technique proposed for live
multimedia streaming service in vehicular communications (VANETs). SLNC is a type of
Network Coding applied to a smaller group of consecutive bits within a packet. Live multimedia
streaming (LMS) service is used for real-time applications such as live video streaming which is
useful for intelligent navigation and also for non-real time applications like video on-demand.
LMS is generally employed in conventional wired or wireless networks where the link is stable
and reliable. When the LMS scheme is used in VANETs, it will lead to severe packet loss due to
the varying effects of the channel and the bandwidth utilization is inefficient. The objectives of
this scheme are:
Better utilization of the bandwidth,
Reliable service delivery ensuring all near-by users have the same delays, and
Providing smooth playback having a high and stable streaming rate.
9.3.3 Performance Evaluation of PHY Layer Network Coding Techniques
The RDNC scheme has the disadvantage of using a low-order modulation method for
high quality links. To overcome this, a new scheme of high quality links having their own
143
individual modulation rate is used to receive their coded packets. This prevents the use of lower
order modulation method for high quality links while the lower quality links make use of the
previous transmission to demodulate the high rate coded packets. The coding gain is almost 250%
better than the other methods used in [88] making the RDNC scheme very robust.
The performance of ZCR is better than the traditional retransmission scheme as it gives
better throughput and simulation results show this scheme to have 670% higher median
throughput gain than the conventional method. The difficulty in using RDNC is the quality of the
link used for broadcasting the information and the usage of higher coding rate leads to some
amount of degradation in the performance of the decoding process. The performance of RDNC in
the classic “Alice-Bob topology” [21] is found to have more uncoded packets that other schemes
used for comparison in [88]. RDNC uses three packets in every coding, causing lesser coding
opportunities to be created and results in more than 30% of the packets to be transmitted in
uncoded manner.
CodePlay was implemented for both sparse and dense VANET conditions and the
performance of SLNC CodePlay was compared to that of PLNC CodePlay [89]. The comparison
was based on the factors: Initial buffering delay, skip ratio (fraction of generations skipped due to
incomplete reception before playback time over all the generations that are played [89]) and the
source rate. In highly dense highways, the performance of SLNC and PLNC was compared for
two-AP and single-AP condition. Both performed better in two-AP than single-AP. But the skip
ratio for SLNC was as low as 8% whereas for PLNC, it was as high as 24%. In two-AP condition,
the packet losses are compensated as the packets are sent in both the directions and smooth
playback is ensured.
Simulations were performed for sparse VANET condition by varying initial buffering
delay and the source rates accordingly [89]. In the cases considered, SLNC was found to be more
stable than PLNC. The CodePlay +SLNC scheme outperforms PLNC for source rates not greater
than 30KB/s and for initial buffering delay of 16s and 24s [89]. In dense VANET conditions, the
144
performance of SLNC is better than PLNC although the skip ratios are high with low buffering
values when compared to sparse VANETs. In the dense VANET case, if all vehicles request for
different LMS content at the same time, this will lead to frequent playback skips which would
affect the performance. Using OLRR gives better results than LRR scheme and the skip ratio is
found to reduce to 6% from 20%. Also, this scheme is more suitable for SLNC and reliable for
long distance transmissions.
The idea behind the implementation of CodePlay is to provide smooth and reliable
playback along with high streaming rates. LMS services with high source rates can be difficult
and might require better infrastructure but feasible. This scheme is also applicable to sparse
VANETs with decent buffering delay and source rate no greater than 30 KB/s in order to ensure
stable, smooth and reliable playback.
Physical Layer Network Coding scheme in WAVE system helps in sending the
information in fewer transmissions and also in retrieving the original information sent by one of
the transmitters in a two-node (as discussed above) or in a multi-node network. In order to
perform this scheme in WAVE, the PHY layer specifications of IEEE 802.11p need to be known
and the working of OFDM in the physical layer needs to be understood.
However, the main difference between these schemes and our approach is that they are
typically applied to two hop communication through a relay and for multicasting, where it has
been proven that Network Coding provides throughput gain [19], [21], [56], [67], [90], [91]. Our
approach focuses on point-to-point communications and takes advantage of the spatial
(frequency) transmission of the information when using Orthogonal Frequency Division
Multiplexing. Moreover, our approach can be used by itself, or it can be used along with any
other forward error correction technique at bit level such as convolutional codes or Reed-
Solomon codes.
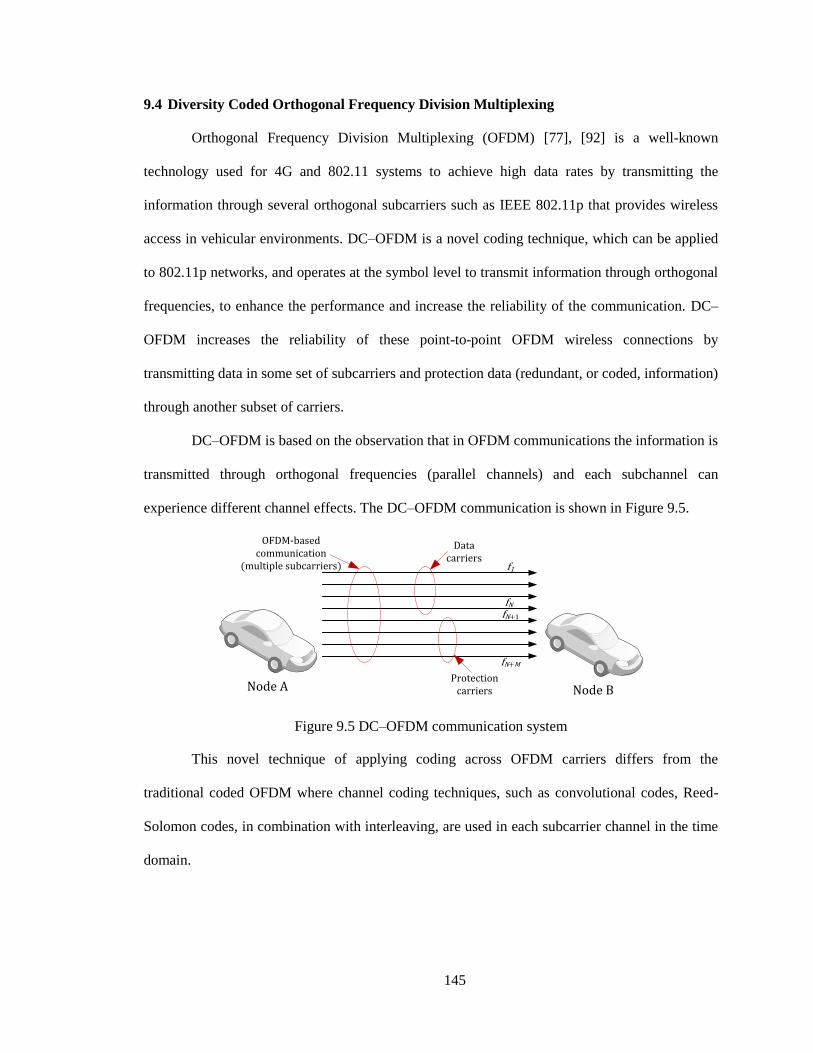
145
9.4 Diversity Coded Orthogonal Frequency Division Multiplexing
Orthogonal Frequency Division Multiplexing (OFDM) [77], [92] is a well-known
technology used for 4G and 802.11 systems to achieve high data rates by transmitting the
information through several orthogonal subcarriers such as IEEE 802.11p that provides wireless
access in vehicular environments. DC–OFDM is a novel coding technique, which can be applied
to 802.11p networks, and operates at the symbol level to transmit information through orthogonal
frequencies, to enhance the performance and increase the reliability of the communication. DC–
OFDM increases the reliability of these point-to-point OFDM wireless connections by
transmitting data in some set of subcarriers and protection data (redundant, or coded, information)
through another subset of carriers.
DC–OFDM is based on the observation that in OFDM communications the information is
transmitted through orthogonal frequencies (parallel channels) and each subchannel can
experience different channel effects. The DC–OFDM communication is shown in Figure 9.5.
Node A Node B
OFDM-based communication
(multiple subcarriers) f1
fN
Data carriers
Protection carriers
fN+1
fN+M
Figure 9.5 DC–OFDM communication system
This novel technique of applying coding across OFDM carriers differs from the
traditional coded OFDM where channel coding techniques, such as convolutional codes, Reed-
Solomon codes, in combination with interleaving, are used in each subcarrier channel in the time
domain.
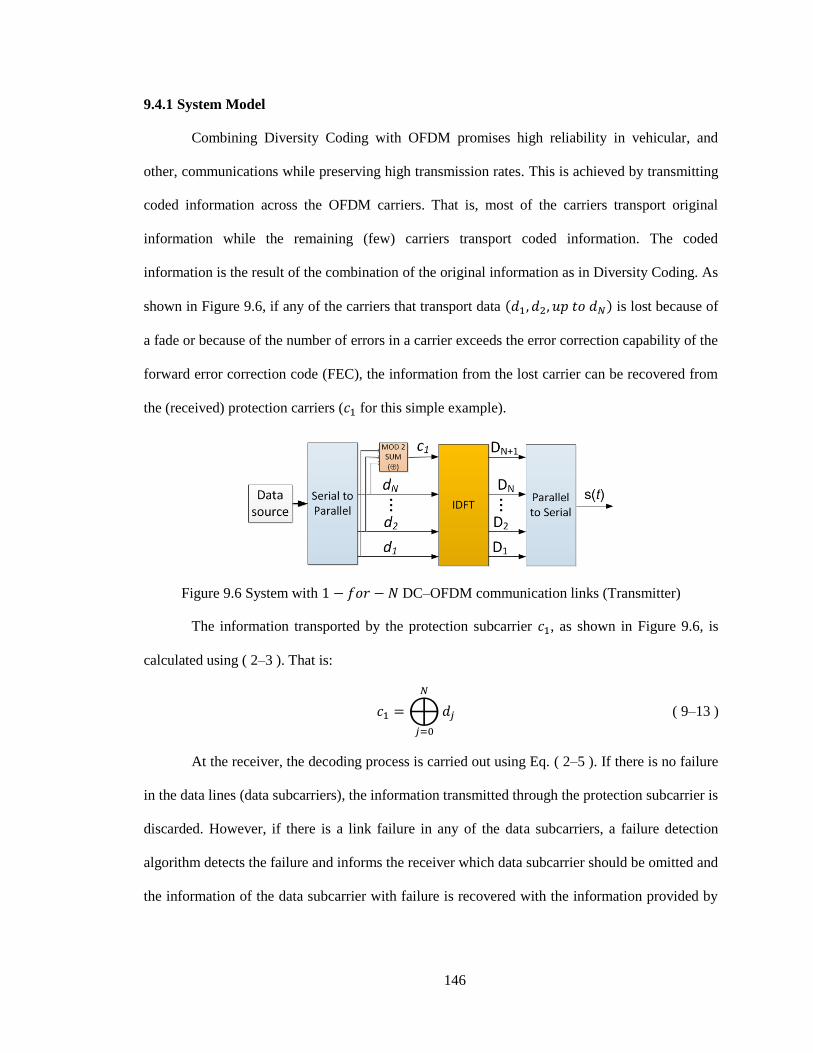
146
9.4.1 System Model
Combining Diversity Coding with OFDM promises high reliability in vehicular, and
other, communications while preserving high transmission rates. This is achieved by transmitting
coded information across the OFDM carriers. That is, most of the carriers transport original
information while the remaining (few) carriers transport coded information. The coded
information is the result of the combination of the original information as in Diversity Coding. As
shown in Figure 9.6, if any of the carriers that transport data is lost because of
a fade or because of the number of errors in a carrier exceeds the error correction capability of the
forward error correction code (FEC), the information from the lost carrier can be recovered from
the (received) protection carriers ( for this simple example).
Figure 9.6 System with DC–OFDM communication links (Transmitter)
The information transported by the protection subcarrier , as shown in Figure 9.6, is
calculated using ( 2–3 ). That is:
⨁
( 9–13 )
At the receiver, the decoding process is carried out using Eq. ( 2–5 ). If there is no failure
in the data lines (data subcarriers), the information transmitted through the protection subcarrier is
discarded. However, if there is a link failure in any of the data subcarriers, a failure detection
algorithm detects the failure and informs the receiver which data subcarrier should be omitted and
the information of the data subcarrier with failure is recovered with the information provided by
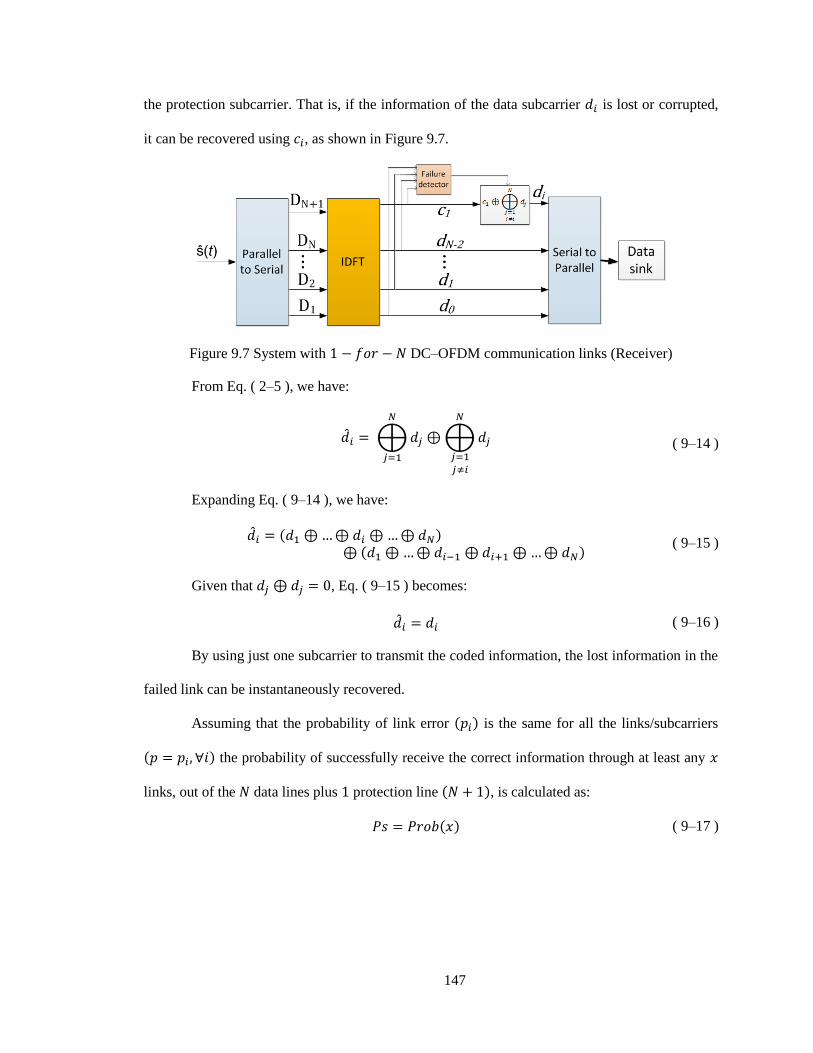
147
the protection subcarrier. That is, if the information of the data subcarrier is lost or corrupted,
it can be recovered using , as shown in Figure 9.7.
Figure 9.7 System with DC–OFDM communication links (Receiver)
From Eq. ( 2–5 ), we have:
⨁
⨁
( 9–14 )
Expanding Eq. ( 9–14 ), we have:
( 9–15 )
Given that , Eq. ( 9–15 ) becomes:
( 9–16 )
By using just one subcarrier to transmit the coded information, the lost information in the
failed link can be instantaneously recovered.
Assuming that the probability of link error is the same for all the links/subcarriers
the probability of successfully receive the correct information through at least any
links, out of the data lines plus protection line , is calculated as:
( 9–17 )
148
∑ ((∏
)(
) )
∑ ((
) )
( 9–18 )
Rewriting Eq. ( 9–18 ), we have that the probability of successful reception at the
destination is calculated as:
∑ ((∏
) )
∑ ((
) )
( 9–19 )
However, since the region of interest is when the information has been correctly received
through at least links, Eq. ( 9–19 ) is reduced to:
( 9–20 )
∑ ((
) )
( 9–21 )
As shown in Figure 9.6, each link can carry as few as one bit to implement a
Diversity Coding system, because with one bit we can calculate a Galois Field of up to two
elements { }, . In other words, the number of protection links is limited by the number
of bits per link. That is, the larger the number of bits to be transmitted by each link, the larger the
number of protection links that can be implemented. This is because the number of protection
links (subcarriers) is limited to the Galois Field [ ] size to calculate the information that
is transmitted through the protection links. If we would like to relate the number of protection
links and the modulation schemes in an OFDM system directly, we can see that only high order
modulation schemes can be used with Diversity Coding because of Diversity Coding spatial
transmission characteristic. Table 9-1 shows the parameters for a Diversity Coding OFDM-based
system that take into account the IEEE 802.11p standard. That is, the number of subcarriers is 48,
the number of data bits per OFDM symbol depends on the modulation scheme, and the code rate
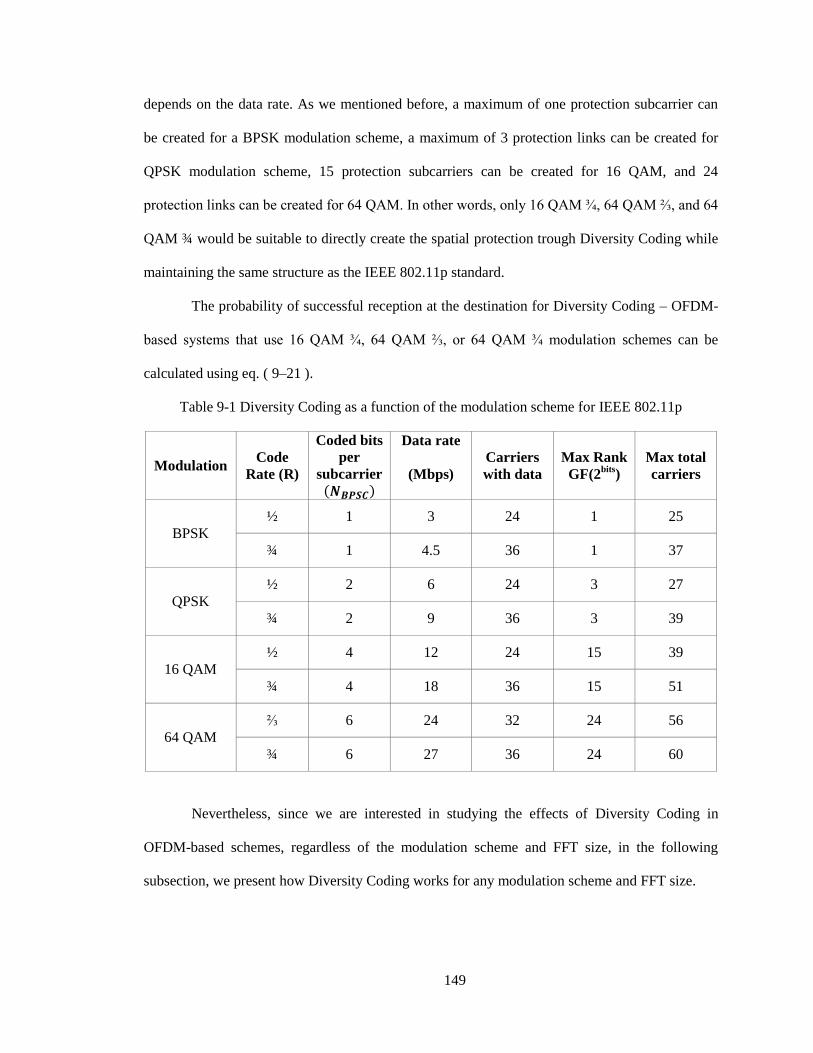
149
depends on the data rate. As we mentioned before, a maximum of one protection subcarrier can
be created for a BPSK modulation scheme, a maximum of 3 protection links can be created for
QPSK modulation scheme, 15 protection subcarriers can be created for 16 QAM, and 24
protection links can be created for 64 QAM. In other words, only 16 QAM ¾, 64 QAM ⅔, and 64
QAM ¾ would be suitable to directly create the spatial protection trough Diversity Coding while
maintaining the same structure as the IEEE 802.11p standard.
The probability of successful reception at the destination for Diversity Coding – OFDM-
based systems that use 16 QAM ¾, 64 QAM ⅔, or 64 QAM ¾ modulation schemes can be
calculated using eq. ( 9–21 ).
Table 9-1 Diversity Coding as a function of the modulation scheme for IEEE 802.11p
Modulation Code
Rate (R)
Coded bits
per
subcarrier
Data rate
(Mbps)
Carriers
with data
Max Rank
GF(2bits
)
Max total
carriers
BPSK
½ 1 3 24 1 25
¾ 1 4.5 36 1 37
QPSK
½ 2 6 24 3 27
¾ 2 9 36 3 39
16 QAM
½ 4 12 24 15 39
¾ 4 18 36 15 51
64 QAM
⅔ 6 24 32 24 56
¾ 6 27 36 24 60
Nevertheless, since we are interested in studying the effects of Diversity Coding in
OFDM-based schemes, regardless of the modulation scheme and FFT size, in the following
subsection, we present how Diversity Coding works for any modulation scheme and FFT size.
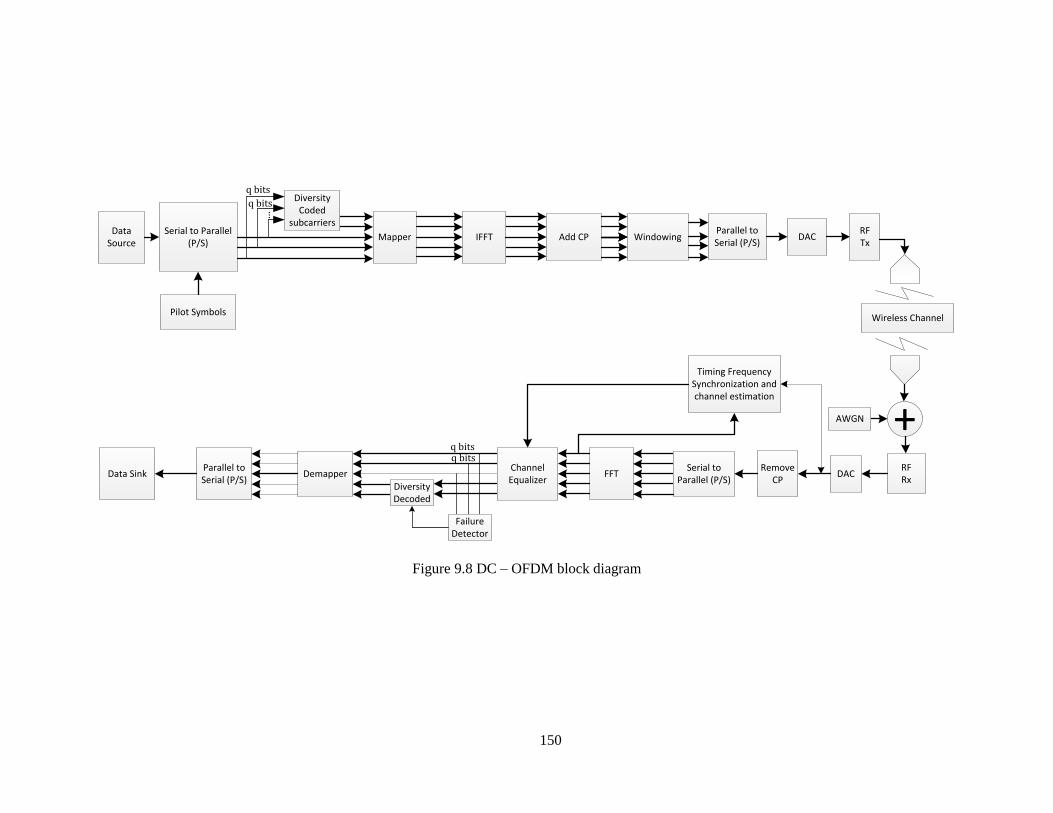
150
DemapperData SinkParallel to Serial (P/S)
Channel Equalizer
Parallel to Serial (P/S)
DACRF Tx
Wireless Channel
+AWGN
RF Rx
DACRemove
CP
Timing Frequency Synchronization and channel estimation
Serial to Parallel (P/S)
FFT
WindowingAdd CPMapperData
Source
Pilot Symbols
Serial to Parallel (P/S)
Diversity Coded
subcarriers
Failure Detector
Diversity Decoded
IFFT
q bits
q bits
q bitsq bits
Figure 9.8 DC – OFDM block diagram
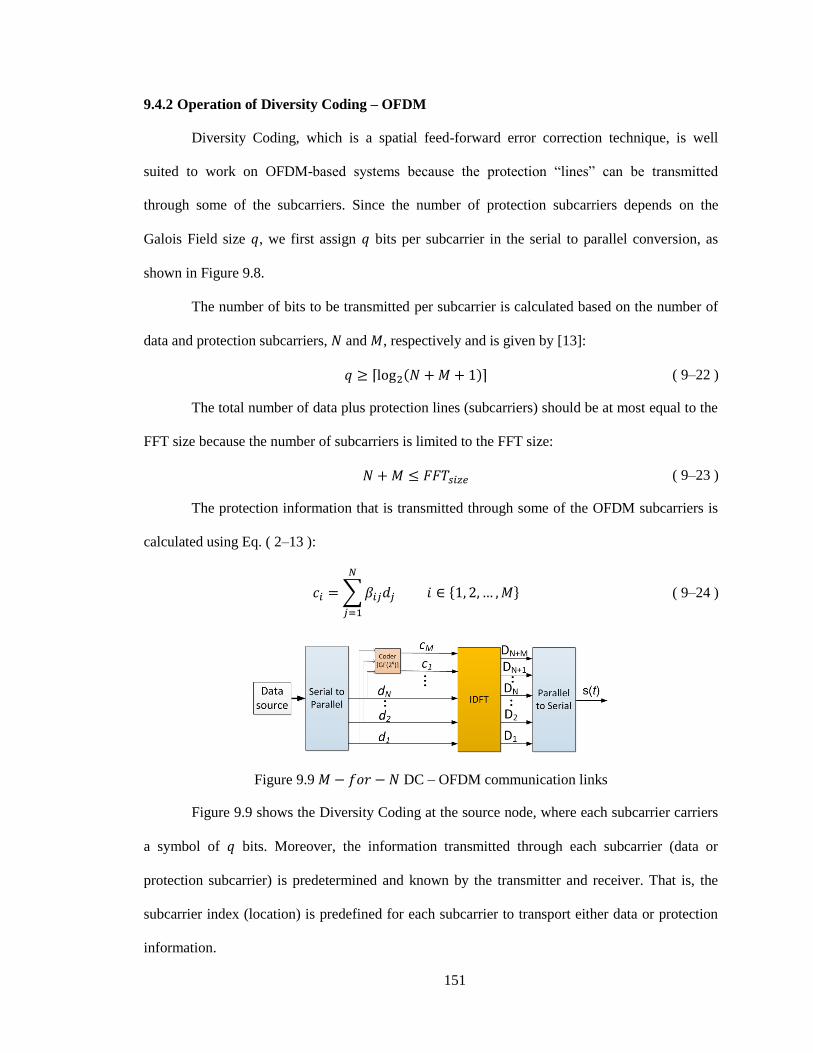
151
9.4.2 Operation of Diversity Coding – OFDM
Diversity Coding, which is a spatial feed-forward error correction technique, is well
suited to work on OFDM-based systems because the protection “lines” can be transmitted
through some of the subcarriers. Since the number of protection subcarriers depends on the
Galois Field size , we first assign bits per subcarrier in the serial to parallel conversion, as
shown in Figure 9.8.
The number of bits to be transmitted per subcarrier is calculated based on the number of
data and protection subcarriers, and , respectively and is given by [13]:
⌈ ⌉ ( 9–22 )
The total number of data plus protection lines (subcarriers) should be at most equal to the
FFT size because the number of subcarriers is limited to the FFT size:
( 9–23 )
The protection information that is transmitted through some of the OFDM subcarriers is
calculated using Eq. ( 2–13 ):
∑
{ } ( 9–24 )
Figure 9.9 DC – OFDM communication links
Figure 9.9 shows the Diversity Coding at the source node, where each subcarrier carriers
a symbol of bits. Moreover, the information transmitted through each subcarrier (data or
protection subcarrier) is predetermined and known by the transmitter and receiver. That is, the
subcarrier index (location) is predefined for each subcarrier to transport either data or protection
information.
152
Since the information transmitted through the data lines (subcarriers) is uncoded, the
coding coefficients of the data lines form an identity matrix of size as shown below:
{
[ ]
⏞
( 9–25 )
where { }. The coefficients of the protection lines are formed by the
coefficients matrix, as shown in Eq. ( 2–14 ):
{
[
]
⏞
( 9–26 )
The assignment of the data and protection lines to each subcarrier is predefined to
minimize the computational complexity in both transmitter and receiver. The assignment can be
sequential, where the data lines { } can be assigned to the first subcarriers and the
protection lines { } can be assigned to the next subcarriers { },
or it can be interleaved, where for example, the first data line is assigned to the first subcarrier,
the first protection lines is assigned to the second subcarrier, the second data line is assigned to
the third subcarrier, and so on. This will depend on the diversity code (DC) rate. The DC code
rate is calculated as:
( 9–27 )
We can calculate the number of protection lines as a function of the data lines and DC
code rates as:
( 9–28 )
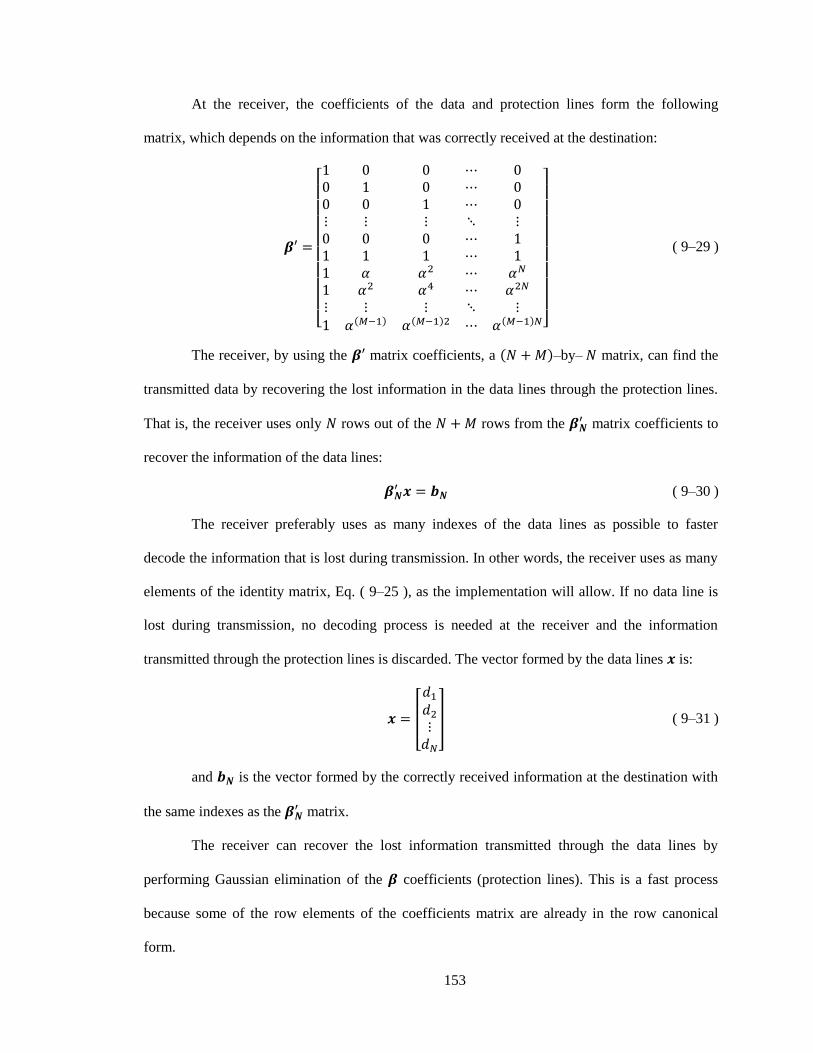
153
At the receiver, the coefficients of the data and protection lines form the following
matrix, which depends on the information that was correctly received at the destination:
[
]
( 9–29 )
The receiver, by using the matrix coefficients, a –by– matrix, can find the
transmitted data by recovering the lost information in the data lines through the protection lines.
That is, the receiver uses only rows out of the rows from the matrix coefficients to
recover the information of the data lines:
( 9–30 )
The receiver preferably uses as many indexes of the data lines as possible to faster
decode the information that is lost during transmission. In other words, the receiver uses as many
elements of the identity matrix, Eq. ( 9–25 ), as the implementation will allow. If no data line is
lost during transmission, no decoding process is needed at the receiver and the information
transmitted through the protection lines is discarded. The vector formed by the data lines is:
[
] ( 9–31 )
and is the vector formed by the correctly received information at the destination with
the same indexes as the matrix.
The receiver can recover the lost information transmitted through the data lines by
performing Gaussian elimination of the coefficients (protection lines). This is a fast process
because some of the row elements of the coefficients matrix are already in the row canonical
form.
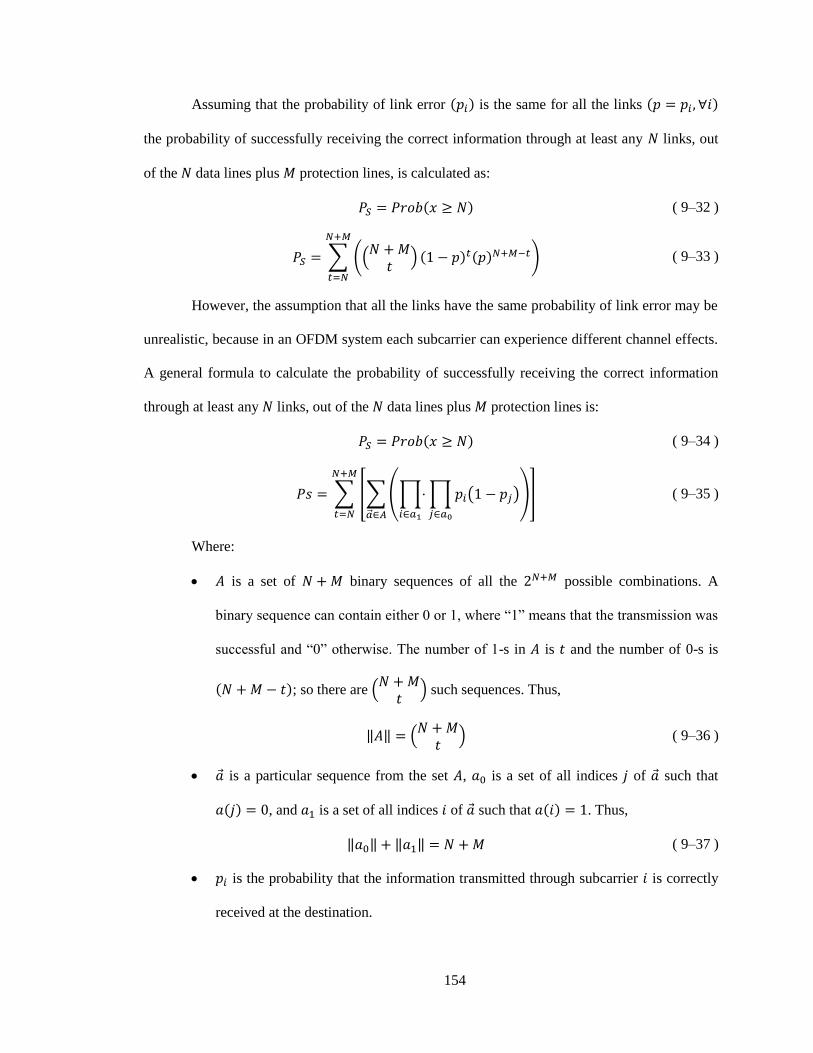
154
Assuming that the probability of link error is the same for all the links
the probability of successfully receiving the correct information through at least any links, out
of the data lines plus protection lines, is calculated as:
( 9–32 )
∑ ((
) )
( 9–33 )
However, the assumption that all the links have the same probability of link error may be
unrealistic, because in an OFDM system each subcarrier can experience different channel effects.
A general formula to calculate the probability of successfully receiving the correct information
through at least any links, out of the data lines plus protection lines is:
( 9–34 )
∑ [∑(∏
∏ ( )
)
]
( 9–35 )
Where:
is a set of binary sequences of all the possible combinations. A
binary sequence can contain either 0 or 1, where “1” means that the transmission was
successful and “0” otherwise. The number of 1-s in is and the number of 0-s is
; so there are (
) such sequences. Thus,
‖ ‖ (
) ( 9–36 )
is a particular sequence from the set , is a set of all indices of such that
, and is a set of all indices of such that . Thus,
‖ ‖ ‖ ‖ ( 9–37 )
is the probability that the information transmitted through subcarrier is correctly
received at the destination.
155
The following section presents our results for our DC–OFDM scheme for different
parameters as the number of data and protection lines, DC code rates, among others.
9.5 Results
In this section, we discuss the performance of Diversity Coding – Orthogonal Frequency
Division Multiplexing (DC–OFDM) as measured by the probability of successful reception at the
destination. We have analyzed the effect of different parameters, such as: number of data links,
number of coded (protection) links, modulation technique and DC code rate, to optimize the
communication’s probability of successful reception of an OFDM symbol at the receiver.
Moreover, we have compared our approach (DC–OFDM) to existing OFDM-based systems, such
as IEEE 802.11p, that do not use coding in the spatial domain (across sub-channels). Extant
OFDM-based systems were described in subsection 9.2.2 and the DC–OFDM approach was
presented in Section 9.4.
First, we start comparing the performance of DC–OFDM system to extant
OFDM systems that do not use Diversity Coding (no DC). Figure 9.10 shows the probability of
successfully receiving at the destination the information of data links (subcarriers) as a function
of the symbol error rate per subcarrier ( ). That is, we use Eq. ( 9–10 ) and Eq. (
9–24 ) for this comparison. We have also validated these equations through simulations. As we
can see in Figure 9.10, by only adding one subcarrier to transmit coded information, that is the
combination of the information transmitted through the data links, we can achieve a significant
performance improvement (probability of correctly receiving the information), as the number of
data links increases. The performance improvement is more pronounced for high symbol error
rates . Moreover, Diversity Coding provides excellent performance when a data
link fails, e.g. fails ( ).

156
Figure 9.10 Performance of a DC – OFDM system as a function of the number of
subcarriers
Figure 9.11 and Figure 9.12 show the performance of DC – OFDM as a function of the
number of data link for different, typical, code rates. As we can see in Figure 9.11, ½, ⅔ and ¾
code rates achieve the maximum throughput performance because the symbol error probability
is very small.
Figure 9.11 Performance of a DC – OFDM system for a probability of link error
pser of 10–3
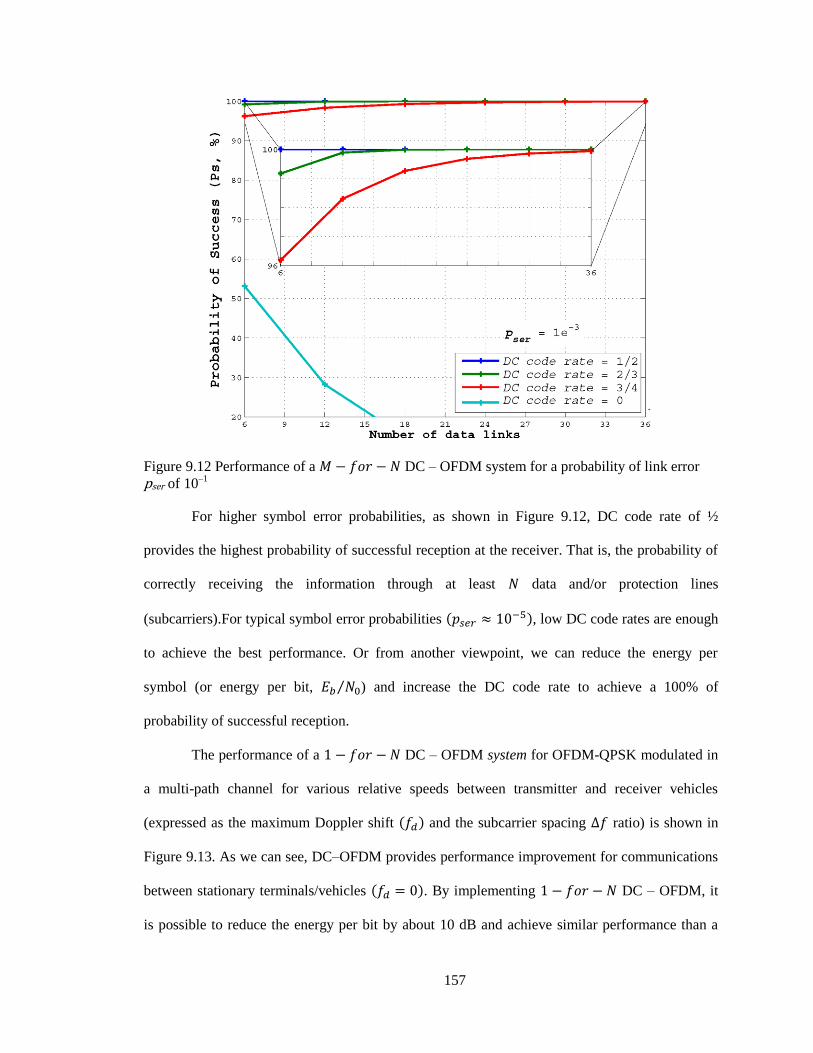
157
Figure 9.12 Performance of a DC – OFDM system for a probability of link error
pser of 10–1
For higher symbol error probabilities, as shown in Figure 9.12, DC code rate of ½
provides the highest probability of successful reception at the receiver. That is, the probability of
correctly receiving the information through at least data and/or protection lines
(subcarriers).For typical symbol error probabilities , low DC code rates are enough
to achieve the best performance. Or from another viewpoint, we can reduce the energy per
symbol (or energy per bit, ⁄ ) and increase the DC code rate to achieve a 100% of
probability of successful reception.
The performance of a DC – OFDM system for OFDM-QPSK modulated in
a multi-path channel for various relative speeds between transmitter and receiver vehicles
(expressed as the maximum Doppler shift and the subcarrier spacing ratio) is shown in
Figure 9.13. As we can see, DC–OFDM provides performance improvement for communications
between stationary terminals/vehicles . By implementing DC – OFDM, it
is possible to reduce the energy per bit by about 10 dB and achieve similar performance than a
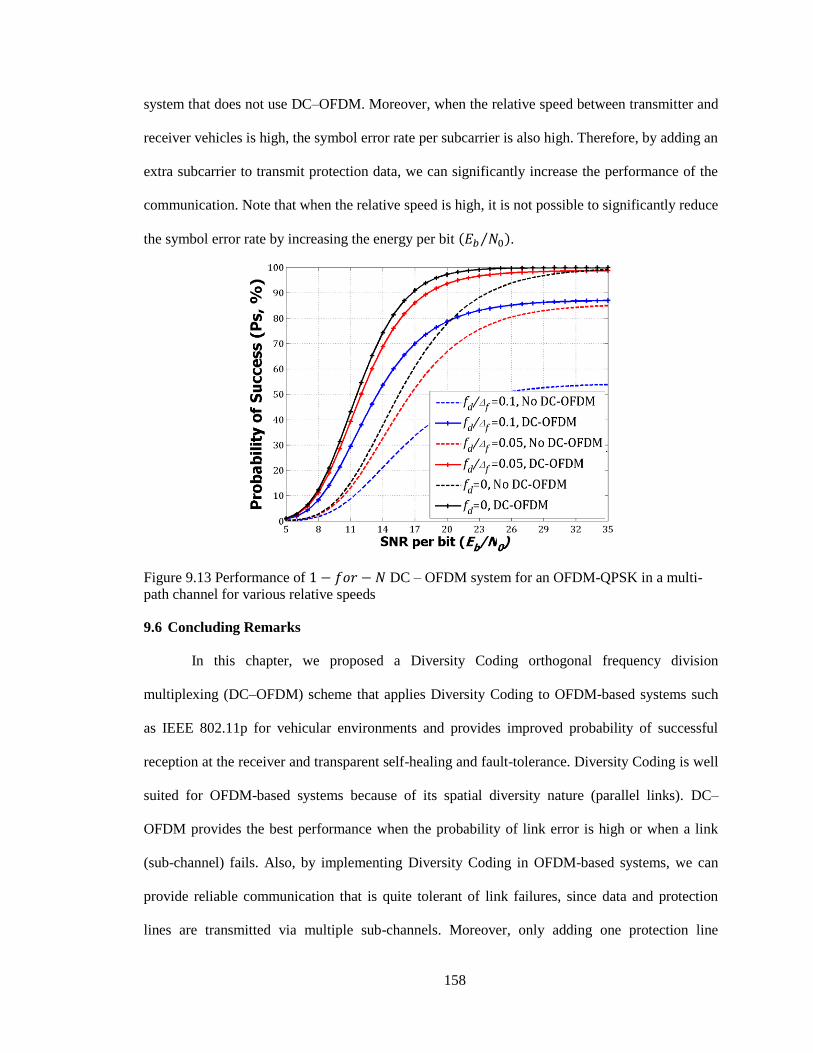
158
system that does not use DC–OFDM. Moreover, when the relative speed between transmitter and
receiver vehicles is high, the symbol error rate per subcarrier is also high. Therefore, by adding an
extra subcarrier to transmit protection data, we can significantly increase the performance of the
communication. Note that when the relative speed is high, it is not possible to significantly reduce
the symbol error rate by increasing the energy per bit ⁄ .
Figure 9.13 Performance of DC – OFDM system for an OFDM-QPSK in a multi-
path channel for various relative speeds
9.6 Concluding Remarks
In this chapter, we proposed a Diversity Coding orthogonal frequency division
multiplexing (DC–OFDM) scheme that applies Diversity Coding to OFDM-based systems such
as IEEE 802.11p for vehicular environments and provides improved probability of successful
reception at the receiver and transparent self-healing and fault-tolerance. Diversity Coding is well
suited for OFDM-based systems because of its spatial diversity nature (parallel links). DC–
OFDM provides the best performance when the probability of link error is high or when a link
(sub-channel) fails. Also, by implementing Diversity Coding in OFDM-based systems, we can
provide reliable communication that is quite tolerant of link failures, since data and protection
lines are transmitted via multiple sub-channels. Moreover, only adding one protection line

159
(subcarrier), DC–OFDM provides significant performance improvement. Note that DC–OFDM is
also well suited for mobile communications because this type of communications often has (raw)
high symbol error rates.
In conclusion, under typical operating conditions, DC–OFDM enables increased
probability of successful reception at the receiver, thus, increasing the reliability of
communications between vehicles.
160
CHAPTER 10. CONCLUSION AND FUTURE DIRECTIONS
Wireless networks will forever alter how people access information and will facilitate
integration of the physical world with the Internet. Wireless technology is rapidly migrating from
communications to a multitude of embedded real-world applications. A current example is
surveillance in the military, which exploits the rapid deployment of many wireless sensor nodes.
One of the main desired features of this type of network is robustness while minimizing the
energy consumption.
In the recent years, Wireless Body Area Networks (WBANs), communication networks
of low-power wireless sensors or devices located on, in, or around the human body that provides
ubiquitous real-time monitoring and / or actuation, have gained interest in medical applications
for prevention and early detection of medical problems that may need attention, as well as for
assisting surgeons in minimally invasive surgeries (MIS) as the MARVEL camera module for
real-time video streaming.
Since wireless high-definition video over the in vivo communications channel requires
high bit rates, Orthogonal Frequency Division Multiplexing (OFDM), a widely used technology
in fourth generation wireless network (4G), is studied. By applying Diversity Coding through
orthogonal subcarriers (OFDM), high reliability communications while preserving high
transmission rates is achieved.
The technologies that we use to improve the performance of wireless sensor and wireless
body area networks are based on Network Coding and Diversity Coding. Table 10-1 shows a
comparison between Diversity Coding and Network Coding. As per this table, Diversity Coding
is more suited to improve the performance of Wireless Body Area Networks because of its low
complexity and low energy required to code the packets.
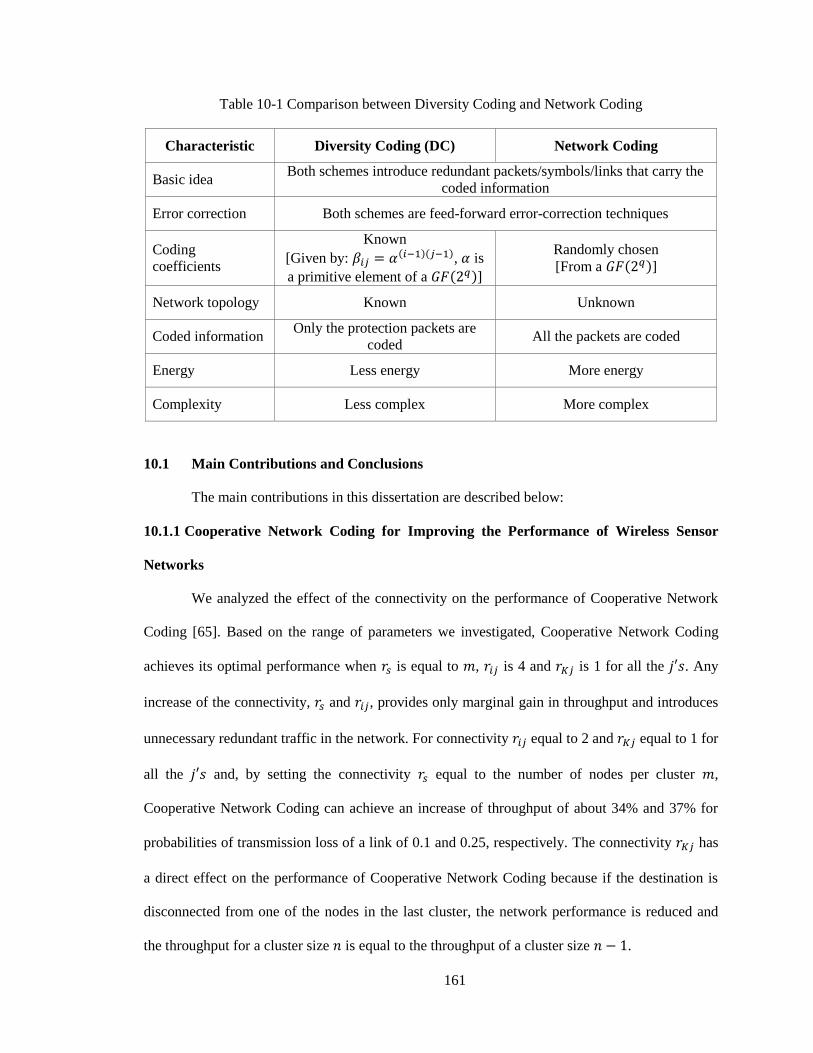
161
Table 10-1 Comparison between Diversity Coding and Network Coding
Characteristic Diversity Coding (DC) Network Coding
Basic idea Both schemes introduce redundant packets/symbols/links that carry the
coded information
Error correction Both schemes are feed-forward error-correction techniques
Coding
coefficients
Known
[Given by: , is
a primitive element of a ]
Randomly chosen [From a ]
Network topology Known Unknown
Coded information Only the protection packets are
coded All the packets are coded
Energy Less energy More energy
Complexity Less complex More complex
10.1 Main Contributions and Conclusions
The main contributions in this dissertation are described below:
10.1.1 Cooperative Network Coding for Improving the Performance of Wireless Sensor
Networks
We analyzed the effect of the connectivity on the performance of Cooperative Network
Coding [65]. Based on the range of parameters we investigated, Cooperative Network Coding
achieves its optimal performance when is equal to , is 4 and is 1 for all the . Any
increase of the connectivity, and , provides only marginal gain in throughput and introduces
unnecessary redundant traffic in the network. For connectivity equal to 2 and equal to 1 for
all the and, by setting the connectivity equal to the number of nodes per cluster ,
Cooperative Network Coding can achieve an increase of throughput of about 34% and 37% for
probabilities of transmission loss of a link of 0.1 and 0.25, respectively. The connectivity has
a direct effect on the performance of Cooperative Network Coding because if the destination is
disconnected from one of the nodes in the last cluster, the network performance is reduced and
the throughput for a cluster size is equal to the throughput of a cluster size .
162
Further, we studied the effect of the number of clusters between the source and
destination nodes on the performance of Cooperative Network Coding for a different range of
parameters [66]. As opposed to multihop ad-hoc networks, where the outage probability
exponentially increases with the number of hops, Cooperative Network Coding provides a very
low outage probability that is not very sensitive to the number of hops when the system
parameters are properly set. We can observe this characteristic of invariability in the throughput
when the cluster size is at least 14 nodes per cluster for any number of hops . Generally, the
throughput of Cooperative Network Coding is almost invariant to the number of hops between the
source and the destination nodes independently of the probability of transmission loss for
connectivity values greater or equal to 4.
10.1.2 Link-level Retransmissions for Cooperative Network Coding Architectures
Cooperative Network Coding with link-level retransmission in the last cluster [39] results
in increased probability of successful reception together with increased throughput when there are
small clusters, when the connectivity of the network is small ( , ), and when the
probability of transmission loss is large ( ). These conditions are representative sparse
sensor networks. By implementing link-level retransmission in Cooperative Network Coding, the
probability of successful reception can be increased from 0.05 without link-level
retransmissions to close to 1 with link-level retransmissions, when the number of nodes per
cluster is equal to the number of original packets and the probability of
transmission loss is 0.25. For cluster sizes of less than 15 nodes per cluster and the
connectivity of nodes less than 8, link-level retransmissions offers a significant improvement in
the probability of successful reception from values in the range (0.05 to 0.35) with no link-
level retransmissions, to values greater than 0.95 with link-level retransmissions. Moreover, when
not all the nodes in the cluster are connected to the destination node, link-layer retransmission
can help to increase the network’s performance without increasing the cluster size.
163
To further improve the performance of Cooperative Network Coding architectures with
link-level retransmissions, we presented an approach of selective retransmissions that minimizes
the energy consumed by multihop wireless packet networks that use Cooperative Network
Coding (CNC) or a novel variant Cooperative Diversity Coding (CDC) [40]. By optimizing and
balancing the use of forward error control, error detection, and retransmissions at packet level in
such networks we can both minimize the energy consumption and network latency. The energy
savings obtained by our approaches (CNC and CDC) are about 26% compared to the baseline
CNC approach. Further, our CDC approach further reduces the energy and complexity of the
source node to create coded packets.
10.1.3 Cooperative Network Coding for Improving the Performance of Wireless Body Area
Networks
We discussed the ability of Cooperative Network Coding [CNC] to increase the
reliability, provide transparent self-healing, and enhance the expected number of correctly
received and decoded packets at the destination of WBANs while transmitting at low power.
Because of the real-time nature of many medical applications and the fact that many sensors can
only transmit, error detection and retransmission (i.e., ARQ) is not a preferred option. We
proposed a WBAN communication network based on Cooperative Network Coding that provides
improved probability of successful reception at the destination and transparent self-healing and
fault-tolerance [41]. For representative systems, we determine the optimal parameter values to
achieve the highest throughput and reduce the required energy per bit. As opposed to systems that
are unprotected against node or link failures, for WBANs with Cooperative Network Coding, it is
quite likely that the packets needed to recover the original information are available through
different paths to the sink and (therefore) enable a substantial throughput gain. Our approach
[CNC] requires about 3.5 dB less energy per bit than extant WBAN systems that do not use
cooperation or Network Coding. Moreover, we have shown that Network Coding [NC] provides
better performance than an uncoded cooperation system [UC], but at expense of decreasing the
164
network reliability because of the single path between source and destination. Under typical
operating conditions, Cooperative Network Coding enables increased probability of successful
reception at the destination, and thus higher expected number of correctly received and decoded
packets at the destination, and improved network reliability because of the cooperation of the
relays in transmitting coded packets through multiple paths.
10.1.4 Temporal Diversity Coding for Improving the Performance of Wireless Body Area
Networks
We proposed the Temporal Diversity Coding scheme, a novel technique that
utilizes Diversity Coding in time through spatially independent paths to achieve improved
network performance by increasing the network's reliability and minimizing the delay. Wireless
body area networks (WBANs) are an attractive application for Temporal Network Coding
because of the requirement for low complexity, limited power, and high reliability for this type of
network in real-time applications such as capsule endoscopy and video/medical imaging, where
retransmissions are not a good alternative. We demonstrated that by implementing this novel
technique, we can achieve significant improvement (~50%) in throughput compared to extant
WBANs. The Temporal Diversity Coding scheme features: low complexity because the Diversity
Coding coefficients are implicitly known to the source and destination nodes; limited power
consumption because smaller is required to recover the entire message; better reliability
because of the use of a cooperative relays that help to transmit the packets from the source to the
destination node; and real-time transmission because of the reduced complexity of the scheme,
allowing processing on low-power nodes.
Temporal Diversity Coding requires less complexity and computational power, but is
limited in that the relays cannot combine packets (they just forward the packets). On the other
hand, Cooperative Network Coding requires more complexity and computational power than
TDC but the relays can combine the received packets and create new combination packets. This
process adds “some” linear independency among the packets. However, Temporal Diversity
165
Coding allows “almost” real-time transmission because while the data packets are being
transmitted, the protection packets are being created. So, after the last data packet is transmitted,
the protection packets are immediately transmitted. For Cooperative Network Coding, the source
needs to have the block of information (e.g. packets) to be able to create the coded packets,
where . And after that, it transmits the coded packets.
10.1.5 Diversity Coding for Orthogonal Frequency Division Multiplexing (OFDM-based)
Systems
We proposed a Diversity Coding orthogonal frequency division multiplexing (DC–
OFDM) scheme [45] that applies Diversity Coding to OFDM-based systems to provide improved
probability of successful reception at the receiver and transparent self-healing and fault-tolerance.
Diversity Coding is well suited for OFDM-based systems because of its spatial diversity nature
(parallel links). DC–OFDM provides the best performance when the probability of link error is
high or when a link (sub-channel) fails. Also, by implementing Diversity Coding in OFDM-based
systems, we can provide reliable communication that is quite tolerant of link failures, since data
and protection lines are transmitted via multiple sub-channels. Moreover, only adding one
protection line (subcarrier), DC–OFDM provides significant performance improvement. Note that
DC–OFDM is also well suited for mobile communications because this type of communications
has high symbol error probability. Under typical operating conditions, DC–OFDM enables
increased probability of successful reception at the receiver, thus, increasing the reliability of
communications between vehicles by transmitting data and protection information through
parallel subcarriers.
10.2 Future Directions
Beyond what has been presented throughout this dissertation, there are topics that can be
further explored. For example:
Analyzing and simulating the performance and dynamic effects of link-level
retransmissions on Cooperative Network Coding (CNC) when the links or nodes fail.

166
Optimizing the performance of Cooperative Diversity Coding (CDC) while
minimizing the energy consumed by the network, including the energy consumed by
the nodes in checking the rank in a cluster.
Studying the performance of a pseudo-random approach based on Cooperative
Network Coding. Where the nodes, instead of randomly choosing the coding
coefficients, select the coding coefficients from a given row from the Vandermonde
matrix.
Analyzing the performance of Cooperative Network Coding (CNC) for WBANs
when there are many relays transmitting many coded packets.
Analyzing the benefits of combining Temporal Diversity Coding and Spatial
Diversity Coding.
Studying the most effective method to detect symbol errors in DC–OFDM.
Exploring the performance of CDC, TDC and DC–OFDM over in vivo wireless
channels.
167
REFERENCES
[1] K. David, D. Dixit, and N. Jefferies, “2020 Vision,” Vehicular Technology Magazine, IEEE,
vol. 5, no. 3, pp. 22–29, 2010.
[2] Lene Sørensen and Knud Erik Skouby, “User scenarios 2020 - a worldwide wireless future.”
Wireless World Research Forum, Sep-2012.
[3] Roberto Verdone, Davide Dardari, Gianluca Mazzini, and Andrea Conti, Wireless sensor
and actuator networks: technologies, analysis and design. Amsterdam; Boston:
Elsevier/Academic Press, 2008.
[4] K. Sohraby, D. Minoli, and T. Znati, Wireless sensor networks : technology, protocols, and
applications. Hoboken,N.J.: John Wiley & Sons, 2007.
[5] S. Ullah, H. Higgins, B. Braem, B. Latre, C. Blondia, I. Moerman, S. Saleem, Z. Rahman,
and K. S. Kwak, “A Comprehensive Survey of Wireless Body Area Networks,” Journal of
Medical Systems, Aug. 2010.
[6] M. Patel and Jianfeng Wang, “Applications, challenges, and prospective in emerging body
area networking technologies,” Wireless Communications, IEEE DOI -
10.1109/MWC.2010.5416354, vol. 17, no. 1, pp. 80–88, 2010.
[7] “IEEE 802.15 WPANTM
Task Group 6 (TG6) Body Area Networks.” [Online]. Available:
http://www.ieee802.org/15/pub/TG6.html. [Accessed: 15-Sep-2011].
[8] IEEE P802.15 Working Group for Wireless Personal Area Networks (WPANs), “Channel
Model for Body Area Network (BAN).” IEEE P802.15 Wireless Personal Area Networks,
2010.
[9] M. A. Labrador and P. M. Wightman, Topology control in wireless sensor networks with a
companion simulation tool for teaching and research. Springer, 2009.
[10] C. Lee, Error-control block codes for communications engineers. Artech House, Boston,
2000.
[11] A. S. Tanenbaum and D. Wetherall, Computer networks. Boston: Pearson Prentice Hall,
2011.
[12] Stephen B. Wicker and Vijay Bhargava, Eds., Reed-Solomon codes and their applications.
New York: IEEE Press, 1994.
[13] E. Ayanoglu, Chih-Lin I, R. D. Gitlin, and J. E. Mazo, “Diversity coding for transparent self-
healing and fault-tolerant communication networks,” IEEE Transactions on
Communications, vol. 41, no. 11, pp. 1677–1686, 1993.
168
[14] E. Ayanoglu, Chih-Lin I, R. D. Gitlin, and J. E. Mazo, “Diversity coding: using error control
for self-healing in communication networks,” in Proceedings of Ninth Annual Joint
Conference of the IEEE Computer and Communication Societies. “The Multiple Facets of
Integration”, INFOCOM ’90, 1990, pp. 95–104 vol.1.
[15] Chih-Lin I, E. Ayanoglu, R. D. Gitlin, and J. E. Mazo, “Transparent self-healing
communication networks via diversity coding,” in IEEE International Conference on
Communications, 1990. ICC ’90, Including Supercomm Technical Sessions.
SUPERCOMM/ICC ’90, 1990, pp. 509–514 vol.2.
[16] R. Ahlswede, Ning Cai, S.-Y. R. Li, and R. W. Yeung, “Network information flow,”
Information Theory, IEEE Transactions on, vol. 46, no. 4, pp. 1204–1216, 2000.
[17] P. A. Chou and Yunnan Wu, “Network Coding for the Internet and Wireless Networks,”
Signal Processing Magazine, IEEE DOI - 10.1109/MSP.2007.904818, vol. 24, no. 5, pp. 77–
85, 2007.
[18] S. Yang and R. Koetter, “Network Coding over a Noisy Relay : a Belief Propagation
Approach_,” CoRR, vol. abs/cs/0701062, 2007.
[19] C. Fragouli, D. Katabi, A. Markopoulou, M. Medard, and H. Rahul, “Wireless Network
Coding: Opportunities & Challenges,” in Military Communications Conference, 2007.
MILCOM 2007. IEEE, 2007, pp. 1–8.
[20] L. Lima, M. Medard, and J. Barros, “Random Linear Network Coding: A free cipher?,” in
Information Theory, 2007. ISIT 2007. IEEE International Symposium on, 2007, pp. 546–550.
[21] S. Katti, H. Rahul, Wenjun Hu, D. Katabi, M. Medard, and J. Crowcroft, “XORs in the Air:
Practical Wireless Network Coding,” Networking, IEEE/ACM Transactions on, vol. 16, no.
3, pp. 497–510, 2008.
[22] Z. J. Haas and Tuan-Che Chen, “Cluster-based cooperative communication with network
coding in wireless networks,” in MILITARY COMMUNICATIONS CONFERENCE, 2010 -
MILCOM 2010, 2010, pp. 2082–2089.
[23] A. Sprintson, “Network Coding and Its Applications in Communication Networks,” in
Algorithms for Next Generation Networks, G. Cormode and M. Thottan, Eds. London:
Springer London, 2010, pp. 343–372.
[24] M. Chen, S. Gonzalez, A. Vasilakos, H. Cao, and V. C. M. Leung, “Body Area Networks: A
Survey,” Mobile Networks and Applications, vol. 16, pp. 171–193, Aug. 2010.
[25] B. Latré, B. Braem, I. Moerman, C. Blondia, and P. Demeester, “A survey on wireless body
area networks,” Wireless Networks, vol. 17, pp. 1–18, Nov. 2010.
[26] “IEEE Standard for Safety Levels With Respect to Human Exposure to Radio Frequency
Electromagnetic Fields, 3 kHz to 300 GHz.” 2006.
[27] Y. Hao and R. Foster, “Wireless body sensor networks for health-monitoring applications,”
Physiological Measurement, vol. 29, pp. R27–R56, Nov. 2008.
169
[28] H. Alemdar and C. Ersoy, “Wireless sensor networks for healthcare: A survey,” Computer
Networks, vol. 54, no. 15, pp. 2688–2710, Oct. 2010.
[29] Huasong Cao, V. Leung, C. Chow, and H. Chan, “Enabling technologies for wireless body
area networks: A survey and outlook,” Communications Magazine, IEEE, vol. 47, no. 12, pp.
84–93, 2009.
[30] W. Dale Compton and Proctor P. Reid, “Engineering and the Health Care Delivery System
(editorial),” The Bridge, vol. 38, no. 1, pp. 3–5, Spring-2008.
[31] “Healthcare: PillCam, Video Capsule Endoscopy, Esophageal Endoscopy - Given Imaging.”
[Online]. Available: http://www.givenimaging.com/en-
us/healthcareprofessionals/Products/Pages/PillCamSB.aspx. [Accessed: 22-Nov-2011].
[32] “Capsule Endoscopes - Endo Capsule redefining capsule endoscopy.” [Online]. Available:
http://www.olympusamerica.com/msg_section/msg_endoscopy_capsulescopes.asp.
[Accessed: 22-Nov-2011].
[33] C.-Y. Li, B.-L. Zhang, C.-X. Chen, and Y.-M. Li, “OMOM capsule endoscopy in diagnosis
of small bowel disease,” J Zhejiang Univ Sci B, vol. 9, no. 11, pp. 857–862, Nov. 2008.
[34] W. A. Qureshi, “Current and future applications of the capsule camera,” Nat Rev Drug
Discov, vol. 3, no. 5, pp. 447–450, May 2004.
[35] C. Kovac, “‘Video pill’ may supplement standard endoscopy,” BMJ, vol. 323, no. 7309, p.
358, Aug. 2001.
[36] F. Li, J. A. Leighton, and V. K. Sharma, “Capsule endoscopy in the evaluation of obscure
gastrointestinal bleeding: a comprehensive review,” Gastroenterol Hepatol (N Y), vol. 3, no.
10, pp. 777–785, Oct. 2007.
[37] A. Koulaouzidis and S. Douglas, “Capsule endoscopy in clinical practice: concise up-to-date
overview,” Clin Exp Gastroenterol, vol. 2, pp. 111–116, 2009.
[38] C. A. Castro, S. Smith, A. Alqassis, T. Ketterl, Yu Sun, S. Ross, A. Rosemurgy, P. P.
Savage, and R. D. Gitlin, “MARVEL: A Wireless Miniature Anchored Robotic Videoscope
for Expedited Laparoscopy,” in IEEE International Conference on Robotics and Automation
(ICRA), 2012, 2012, pp. 1–6.
[39] G. E. Arrobo, R. D. Gitlin, and Z. J. Haas, “Effect of link-level feedback and retransmissions
on the performance of cooperative networking,” in Wireless Communications and
Networking Conference (WCNC), 2011 IEEE, 2011, pp. 1131–1136.
[40] G. E. Arrobo and R. D. Gitlin, “Minimizing Energy Consumption for Cooperative Network
and Diversity Coding Sensor Networks,” in Accepted to 4th Latin-American Conference on
Communications (LATINCOM 2012), 2012, pp. 1–6.
[41] G. E. Arrobo and R. D. Gitlin, “Cooperative Network Coding in Wireless Body Area
Networks for Improved Performance,” Submitted to EURASIP Journal on Advances in
Signal Processing, pp. 1–19, 2012.
170
[42] G. E. Arrobo and R. D. Gitlin, “New approaches to reliable wireless body area networks,” in
IEEE International Conference on Microwaves, Communications, Antennas and Electronics
Systems (COMCAS 2011), Tel Aviv, Israel, 2011, pp. 1–6.
[43] G. E. Arrobo and R. D. Gitlin, “Improving the reliability of wireless body area networks,” in
Engineering in Medicine and Biology Society,EMBC, 2011 Annual International Conference
of the IEEE, 2011, pp. 2192–2195.
[44] G. E. Arrobo, Z. J. Haas, and R. D. Gitlin, “Temporal Diversity Coding for Improving the
Performance of Wireless Body Area Networks,” in Accepted to the 7th International
Conference on Body Area Networks, Oslo, Norway, 2012, pp. 1–4.
[45] G. E. Arrobo and R. D. Gitlin, “Improving the Performance of OFDM-based Vehicular
Systems through Diversity Coding,” Submitted to Journal of Communications and Networks,
pp. 1–10, 2013.
[46] H. Liu, H. Ma, M. El Zarki, and S. Gupta, “Error control schemes for networks: An
overview,” Mobile Networks and Applications, vol. 2, no. 2, pp. 167–182, 1997.
[47] A. Goldsmith, Wireless Communications. New York, NY, USA: Cambridge University
Press, 2005.
[48] H. O. Burton and D. D. Sullivan, “Errors and error control,” Proceedings of the IEEE, vol.
60, no. 11, pp. 1293 – 1301, Nov. 1972.
[49] E. Y. Rocher and R. L. Pickholtz, “An analysis of the effectiveness of hybrid transmission
schemes,” IBM J. Res. Dev., vol. 14, no. 4, pp. 426–433, Jul. 1970.
[50] E. Dahlman, 3G Evolution: HSPA and LTE for Mobile Broadband. Academic Press, 2008.
[51] Jia-Qi Jin, T. Ho, and H. Viswanathan, “Comparison of Network Coding and Non-Network
Coding Schemes for Multi-hop Wireless Networks,” in Information Theory, 2006 IEEE
International Symposium on, 2006, pp. 197–201.
[52] D. S. Lun, M. Medard, and R. Koetter, “Network Coding for Efficient Wireless Unicast,” in
Communications, 2006 International Zurich Seminar on, 2006, pp. 74–77.
[53] S. Yang and R. Koetter, “Network Coding over a Noisy Relay : a Belief Propagation
Approach,” in Information Theory, 2007. ISIT 2007. IEEE International Symposium on,
2007, pp. 801–804.
[54] C. Fragouli, J.-Y. Le Boudec, and J. Widmer, “Network coding: an instant primer,”
SIGCOMM Comput. Commun. Rev., vol. 36, no. 1, pp. 63–68, Jan. 2006.
[55] J. Bhatia, A. Patel, and Z. Narmawala, “Review on variants of network coding in wireless
ad-hoc networks,” in 2011 Nirma University International Conference on Engineering,
Ahmedabad, Gujarat, India, 2011, pp. 1–6.
[56] T. Ho, M. Medard, R. Koetter, D. R. Karger, M. Effros, Jun Shi, and B. Leong, “A Random
Linear Network Coding Approach to Multicast,” Information Theory, IEEE Transactions on,
vol. 52, no. 10, pp. 4413–4430, 2006.
171
[57] C. Gkantsidis and P. R. Rodriguez, “Network coding for large scale content distribution,” in
Proceedings IEEE INFOCOM 2005. 24th Annual Joint Conference of the IEEE Computer
and Communications Societies, 2005, vol. 4, pp. 2235 – 2245 vol. 4.
[58] C. Gkantsidis, J. Miller, and P. Rodriguez, “Anatomy of a P2P Content Distribution system
with Network Coding,” in IPTPS’06, 2006, pp. 1–6.
[59] C. Gkantsidis, J. Miller, and P. Rodriguez, “Comprehensive view of a live network coding
P2P system,” in Proceedings of the 6th ACM SIGCOMM conference on Internet
measurement, New York, NY, USA, 2006, pp. 177–188.
[60] A. Sendonaris, E. Erkip, and B. Aazhang, “User cooperation diversity-part I: system
description,” IEEE Transactions on Communications, vol. 51, pp. 1927–1938, Nov. 2003.
[61] A. Nosratinia, T. E. Hunter, and A. Hedayat, “Cooperative communication in wireless
networks,” Communications Magazine, IEEE, vol. 42, no. 10, pp. 74–80, 2004.
[62] Shuguang Cui, A. J. Goldsmith, and A. Bahai, “Energy-efficiency of MIMO and cooperative
MIMO techniques in sensor networks,” Selected Areas in Communications, IEEE Journal
on, vol. 22, no. 6, pp. 1089–1098, 2004.
[63] M. Elhawary and Z. J. Haas, “Energy-Efficient Protocol for Cooperative Networks,”
Networking, IEEE/ACM Transactions on, vol. 19, no. 2, pp. 561–574, 2011.
[64] M. K. Simon and M.-S. Alouini, Digital communication over fading channels. Hoboken,
N.J.: Wiley-Interscience, 2005.
[65] G. E. Arrobo and R. D. Gitlin, “Effect of the connectivity on the performance of Cooperative
Network Coding,” in Wireless and Microwave Technology Conference (WAMICON), 2011
IEEE 12th Annual, 2011, pp. 1–4.
[66] G. E. Arrobo and R. D. Gitlin, “Effect of the number of clusters on the performance of
Cooperative Network Coding,” in Wireless Telecommunications Symposium (WTS), 2011,
2011, pp. 1–4.
[67] G. Angelopoulos, M. Medard, and A. P. Chandrakasan, “Energy-aware hardware
implementation of network coding,” in Proceedings of the IFIP TC 6th international
conference on Networking, Valencia, Spain, 2011, pp. 137–144.
[68] IEEE P802.15 Working Group for Wireless Personal Area Networks (WPANs), “Channel
Model for Body Area Network (BAN).”
[69] T. P. Ketterl, G. E. Arrobo, A. Sahin, T. J. Tillman, H. Arslan, and R. D. Gitlin, “In vivo
wireless communication channels,” in Wireless and Microwave Technology Conference
(WAMICON), 2012 IEEE 13th Annual, 2012, pp. 1–3.
[70] Ezio Biglieri, Robert Calderbank, Anthony Constantinides, Andrea Goldsmith,
Arogyaswami Paulraj, and H. Vincent Poor, MIMO wireless communications. Cambridge
University Press, 2007.
172
[71] S. Marinkovic and E. Popovici, “Network Coding for Efficient Error Recovery in Wireless
Sensor Networks for Medical Applications,” in Emerging Network Intelligence, 2009 First
International Conference on, 2009, pp. 15–20.
[72] A. Taparugssanagorn, F. Ono, and R. Kohno, “Network coding for non-invasive Wireless
Body Area Networks,” in Personal, Indoor and Mobile Radio Communications Workshops
(PIMRC Workshops), 2010 IEEE 21st International Symposium on, 2010, pp. 134–138.
[73] K. J. R. Liu, A. K. Sadek, W. Su, and A. Kwasinski, Cooperative Communications and
Networking. Cambridge: Cambridge University Press, 2008.
[74] A. W. Marshall and I. Olkin, “A Family of Bivariate Distributions Generated by the
Bivariate Bernoulli Distribution,” Journal of the American Statistical Association, vol. 80,
no. 390, p. 332, Jun. 1985.
[75] J. E. Mosimann, “On the Compound Multinomial Distribution, the Multivariate β-
Distribution, and Correlations Among Proportions,” Biometrika, vol. 49, no. 1/2, pp. 65–82,
Jun. 1962.
[76] A. Alqassis, T. P. Ketterl, C. A. Castro, R. D. Gitlin, S. Ross, Yu Sun, and A. Rosemurgy,
“MARVEL In Vivo Wireless System,” National Academy of Inventors: Journal of
Technology and Innovation, 2012.
[77] H. Liu, OFDM-based broadband wireless networks : design and optimization. Hoboken
N.J.: Wiley-Interscience, 2005.
[78] M. Engels, “Wireless OFDM Systems - How to Make Them Work?” Springer - Verlag.
[79] “IEEE Standard for Information technology--Telecommunications and information exchange
between systems Local and metropolitan area networks--Specific requirements Part 11:
Wireless LAN Medium Access Control (MAC) and Physical Layer (PHY) Specifications.”
29-Mar-2012.
[80] J. B. Kenney, “Standards and Regulations,” in VANET, John Wiley & Sons, Ltd, 2009, pp.
365–429.
[81] Y. S. Cho, MIMO-OFDM wireless communications with MATLAB. Singapore; Hoboken,
NJ: IEEE Press : J. Wiley & Sons (Asia), 2010.
[82] N. Otsuki and T. Sugiyama, “A New ACK Packet Transmission Scheme for Wireless
Network Coding Systems Based on IEEE802.11a,” in Vehicular Technology Conference
(VTC Spring), 2011 IEEE 73rd, 2011, pp. 1–5.
[83] S. Ahmed and S. S. Kanhere, “VANETCODE: network coding to enhance cooperative
downloading in vehicular ad-hoc networks,” in Proceedings of the international conference
on Wireless communications and mobile computing, New York, NY, 2006, pp. 527–532.
[84] U. Lee, J.-S. Park, J. Yeh, G. Pau, and M. Gerla, “Code torrent: content distribution using
network coding in VANET,” in Proceedings of the 1st international workshop on
Decentralized resource sharing in mobile computing and networking, New York, NY, USA,
2006, pp. 1–5.
173
[85] J.-S. Park, U. Lee, S. Y. Oh, M. Gerla, and D. S. Lun, “Emergency related video streaming
in VANET using network coding,” in Proceedings of the 3rd international workshop on
Vehicular ad hoc networks, New York, NY, USA, 2006, pp. 102–103.
[86] S.-H. Lee, U. Lee, K.-W. Lee, and M. Gerla, “Content Distribution in VANETs Using
Network Coding: The Effect of Disk I/O and Processing O/H,” in 5th Annual IEEE
Communications Society Conference on Sensor, Mesh and Ad Hoc Communications and
Networks, 2008. SECON ’08, 2008, pp. 117 –125.
[87] M. Li, Z. Yang, and W. Lou, “CodeOn: Cooperative Popular Content Distribution for
Vehicular Networks using Symbol Level Network Coding,” IEEE Journal on Selected Areas
in Communications, vol. 29, no. 1, pp. 223 –235, Jan. 2011.
[88] S. Yun and H. Kim, “Rate diverse network coding: breaking the broadcast bottleneck,” in
Proceedings of the eleventh ACM international symposium on Mobile ad hoc networking and
computing, Chicago, Illinois, USA, 2010, pp. 221–230.
[89] Z. Yang, M. Li, and W. Lou, “CodePlay: Live multimedia streaming in VANETs using
symbol-level network coding,” in Proceedings of the The 18th IEEE International
Conference on Network Protocols, 2010, pp. 223–232.
[90] Hang Su and Xi Zhang, “Characterizing the throughput gain of network coding in wireless
ad hoc networks,” in Military Communications Conference, 2008. MILCOM 2008. IEEE,
2008, pp. 1–7.
[91] A. Keshavarz-Haddadt and R. Riedi, “Bounds on the Benefit of Network Coding:
Throughput and Energy Saving in Wireless Networks,” in INFOCOM 2008. The 27th
Conference on Computer Communications. IEEE, 2008, pp. 376–384.
[92] Y. Li, Orthogonal frequency division multiplexing for wireless communications. New
York :: Springer Science Business Media,, 2006.

174
APPENDICES
175
Appendix A Copyright and Permissions
© 2011 IEEE. Reprinted, with permission, from Gabriel E. Arrobo, Richard D. Gitlin,
and Zygmunt J. Haas, “Effect of link-level feedback and retransmissions on the performance of
cooperative networking,” IEEE Wireless Communications and Networking Conference (WCNC),
March 2011.
© 2011 IEEE. Reprinted, with permission, from Gabriel E. Arrobo, and Richard D.
Gitlin, “Effect of the number of clusters on the performance of Cooperative Network Coding,”
IEEE Wireless Telecommunications Symposium (WTS), April 2011.
© 2011 IEEE. Reprinted, with permission, from Gabriel E. Arrobo, and Richard D.
Gitlin, “Improving the reliability of wireless body area networks,” IEEE Wireless and Microwave
Technology Conference (WAMICON), April 2011.
© 2011 IEEE. Reprinted, with permission, from Gabriel E. Arrobo, and Richard D.
Gitlin, “Effect of the connectivity on the performance of Cooperative Network Coding,” IEEE
Engineering in Medicine and Biology Society (EMBC), August 2011.
© 2011 IEEE. Reprinted, with permission, from Gabriel E. Arrobo, and Richard D.
Gitlin, “New approaches to reliable wireless body area networks,” IEEE Microwaves,
Communications, Antennas and Electronics Systems (COMCAS), November 2011.
© 2012 IEEE. Reprinted, with permission, from Thomas P. Ketterl, Gabriel E. Arrobo,
Alphan Sahin, Thomas J. Tillman, Huseyin Arslan, and Richard D. Gitlin, “In vivo wireless
communication channels,” IEEE Wireless and Microwave Technology Conference
(WAMICON), April 2012.
© ACM, 2012. This is the author’s version of the work. It is posted here by permission of
ACM for your personal use. Not for redistribution. The definitive version will be published in
BodyNets, 2012.
ABOUT THE AUTHOR
Gabriel Arrobo received his Engineering degree (CUM LAUDE) in Electronics and
Telecommunications (5-year degree) from the Escuela Politécnica Nacional, in Quito, Ecuador in
2004 and the Engineering Diploma in Inter-networking (1-year graduate studies) from the
Escuela Politécnica Nacional, in Quito, Ecuador in 2006. He received his Master of Business
Administration, Concentration in strategy and enterprise policy from the Instituto Tecnológico de
Estudios Superiores de Monterrey, Toluca, Mexico in 2008. Gabriel was with the “Corporación
Nacional de Telecomunicaciones” (formerly ANDINATEL), a telecommunications service
provider, where he held various jobs positions ranging from staff engineer to manager. In 2010,
he received his Master of Sciences in Electrical Engineering from the University of South
Florida, in Tampa, Florida, where he is currently pursuing his Doctor of Philosophy in Electrical
Engineering. His research interests include performance of wireless sensor networks with
emphasis on wireless body area networks, where reliability is one of the key performance metrics.