Embed Size (px)
Citation preview

Tim Proctor
Improving Your Practice Health with PCC Dashboard
Tim ProctorUsers Conference 2016

Tim Proctor
Agenda
● How the PCC Dashboard changed one practice
● Some PCC Dashboard highlights
● Explore your own PCC Dashboard
Tim Proctor
Goals● Recognize specific PCC Dashboard reports that are
important to the health of my practice● Realize the attainable value from using the PCC
Dashboard to discover opportunity for growth and improvement
● Discover new and upcoming features of PCC Dashboard● See how you measure up to other PCC practices

Tim Proctor
PCC Dashboard
“a tool to inform all PCC clients of their financial and clinical health, based on relative performance in a variety of areas.”
Tim Proctor
PCC Dashboard Basics
● One login for each practice● Data collected on the first Sunday of every
month. Loaded into production a few days after that
● Pediatric-specific benchmarks
Tim Proctor
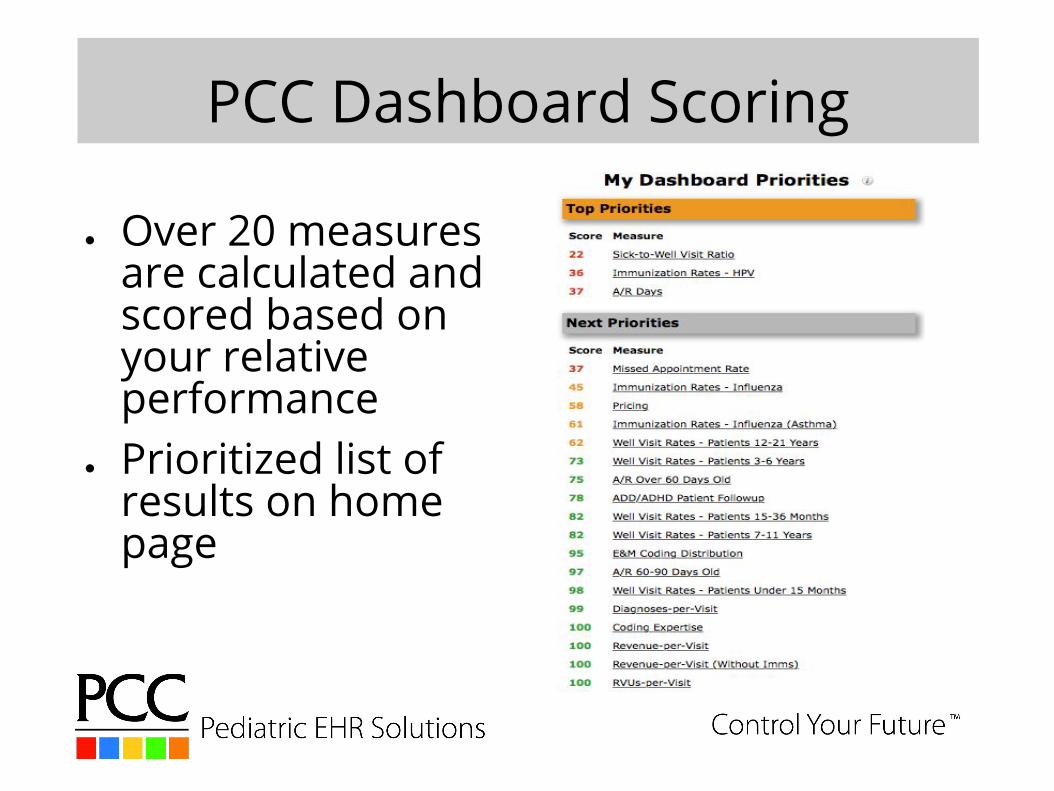
PCC Dashboard Scoring
● Over 20 measures are calculated and scored based on your relative performance
● Prioritized list of results on home page

Tim Proctor
Benchmarks
PCC AVG and “Top Performers” (90th percentile)

Tim Proctor
Benchmarks
National and regional benchmarks
Tim Proctor
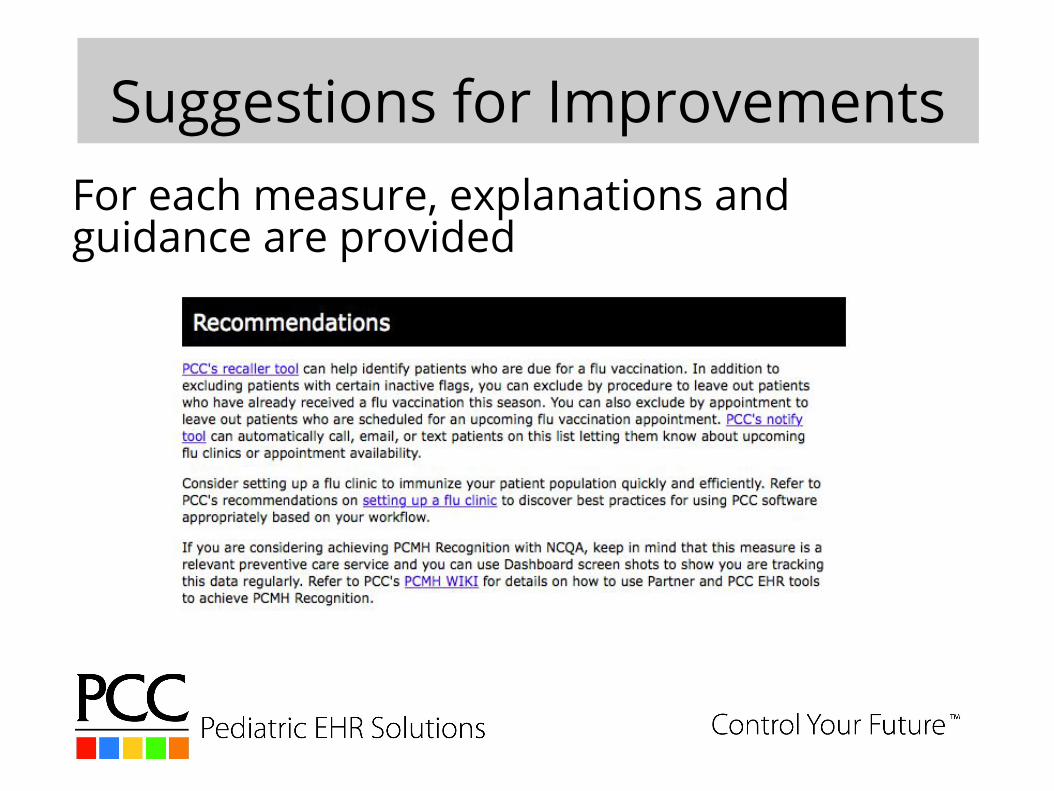
Suggestions for ImprovementsFor each measure, explanations and guidance are provided

Tim Proctor
Provider Breakdown
For some measures, there is additional breakdown by provider.

Tim Proctor
Provider breakdown available for the following measures:
● Immunization Rates - Influenza (Asthma)
● ADD/ADHD Patient Followup
● Well Visit Rates
● Missed Appointment Rate
● Developmental Screening Rates
● Sick-to-Well Visit Ratio
● E&M Coding Distribution
Provider Breakdown

Tim Proctor
Interactive Graphing
Tim Proctor
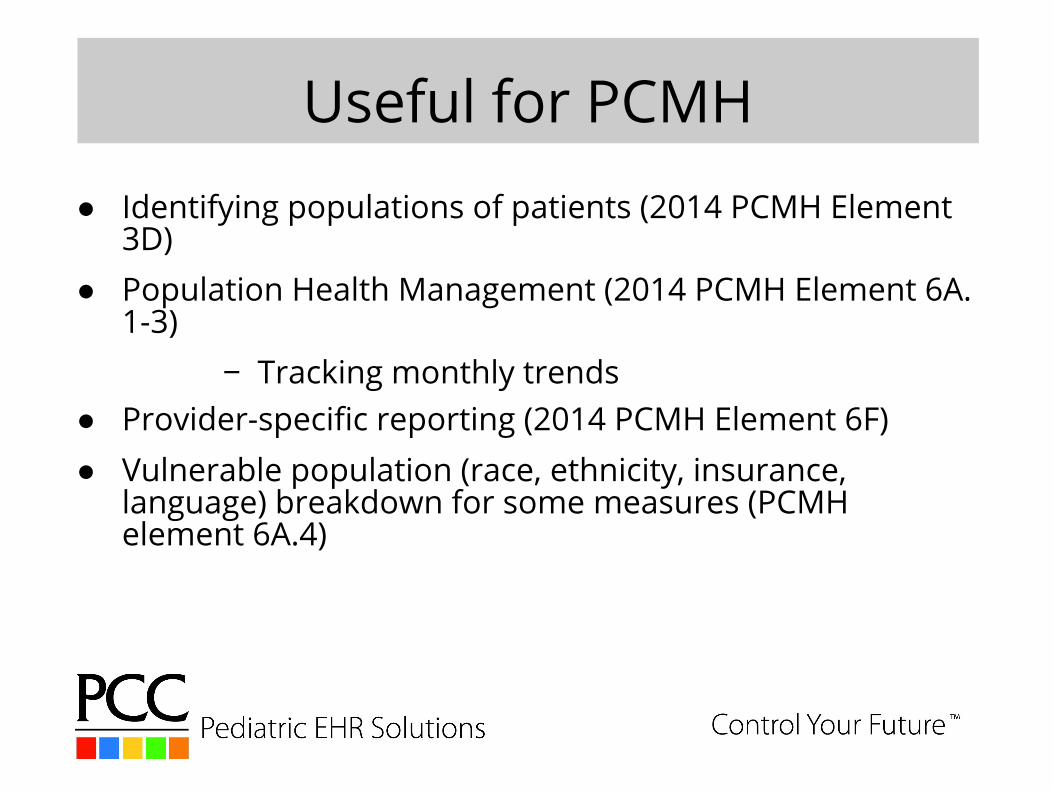
Useful for PCMH● Identifying populations of patients (2014 PCMH Element
3D)● Population Health Management (2014 PCMH Element 6A.
1-3)− Tracking monthly trends
● Provider-specific reporting (2014 PCMH Element 6F) ● Vulnerable population (race, ethnicity, insurance,
language) breakdown for some measures (PCMH element 6A.4)
Tim Proctor
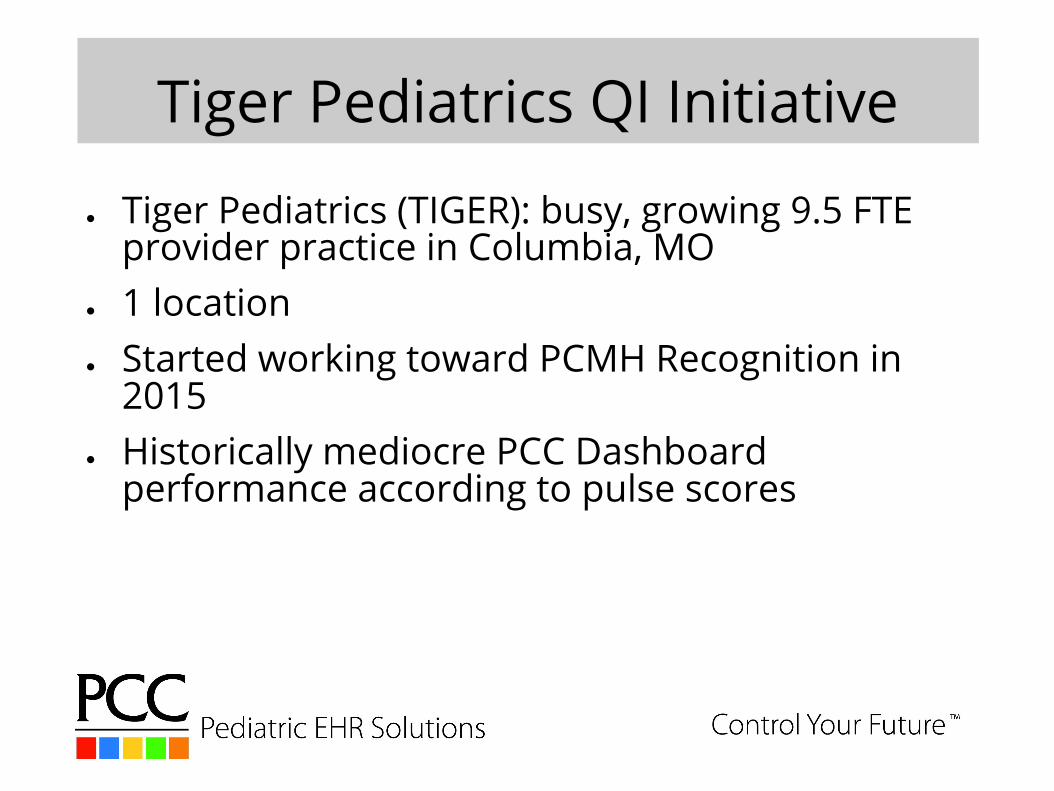
Tiger Pediatrics QI Initiative
● Tiger Pediatrics (TIGER): busy, growing 9.5 FTE provider practice in Columbia, MO
● 1 location● Started working toward PCMH Recognition in
2015● Historically mediocre PCC Dashboard
performance according to pulse scores
Tim Proctor
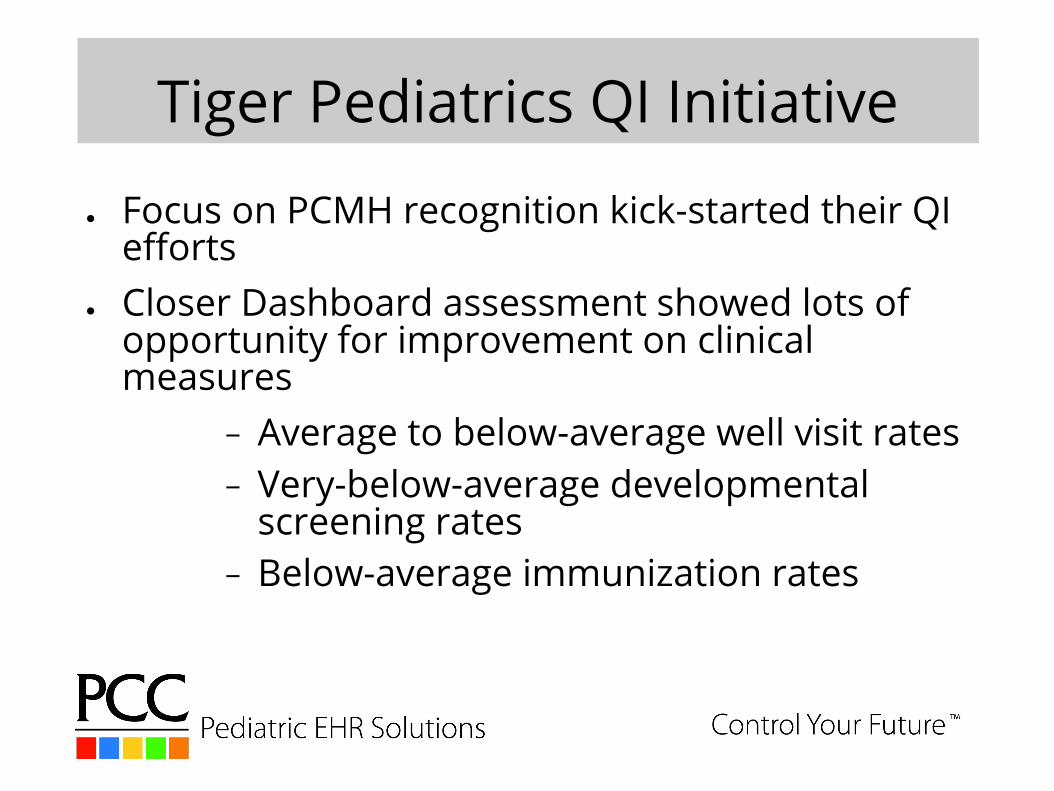
Tiger Pediatrics QI Initiative
● Focus on PCMH recognition kick-started their QI efforts
● Closer Dashboard assessment showed lots of opportunity for improvement on clinical measures
− Average to below-average well visit rates− Very-below-average developmental
screening rates− Below-average immunization rates

Tim Proctor
Patient Flagging● TIGER realized they needed to do a better job flagging
patients who were only seen in the hospital or have left the practice
● Review patient and account flags table. If the last question, “Exclude these patients from reports” is set to “Yes”, then patients with these flags are excluded from PCC Dashboard clinical measures
Tim Proctor
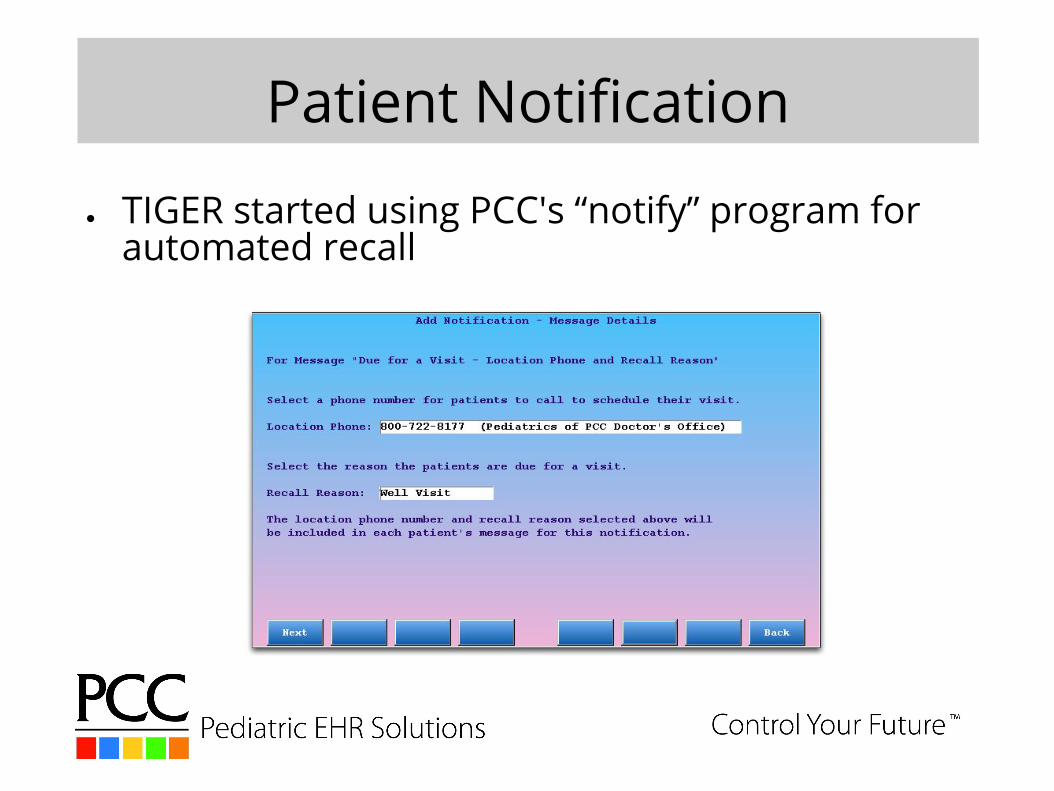
Patient Notification
● TIGER started using PCC's “notify” program for automated recall
Tim Proctor
Patient Notification● TIGER focused on recalling all active patients ages 3 and
over using automated phone calls● Notified active patients who are about to become
overdue for a well visit, and do not already have one scheduled
● Notified active patients who are overdue for a well visit within the past 18 months, and without an upcoming well visit already scheduled
− This notification is configured to happen automatically once a month
Tim Proctor
Infant Developmental Screening
● PCC Dashboard indicated TIGER was rarely doing a developmental screening at 9mo well visit
● Started using CHADIS to allow patients to complete screening questionnaire online
● Sent letters to patients with scheduled 9mo well visit appointments including instructions for completing screening questionnaire before the visit

Tim Proctor
HPV Dashboard
● Participated in Merck “Health In Focus” rebate program
● Used HPV Dashboard to easily report required HPV vaccination rate information
● Received significant vaccine rebates● Expect to receive even greater rebates by using
PCC Dashboard to show improvement in HPV vaccination rates
Tim Proctor
Keep the Payors Honest
● TIGER was told by a major payor that they fell in the 25th percentile for various clinical measures
● PCC Dashboard reported much better results for these measures, so they challenged the integrity of the payor's data
● Payor admitted their data included patients who never visited Tiger Pediatrics
● Payor is now updating their quality reporting system

Tim Proctor
Consistent Care Coordination
● Considering hiring full-time “care coordinators”● Focus on recall efforts:
− Well visits− Vaccinations− Screenings− Chronic Disease Management (ADHD,
Asthma, Obesity, etc) ● Referral Coordination

Tim Proctor
Results● Improvement in PCC Dashboard well visit rates (June
2015 – June 2016)− Under 15 month: 86% - 90%− 15-36 mo olds: 60% - 67%− 3-6 year olds: 64% - 70%− 7-11 year olds: 57% - 61%− 12-21 year olds: 49% - 51%
● Additional 900 well visits performed so far this year over last year

Tim Proctor
Results● Sick-to-well visit ratio improved from 1.33 to 1.21
sick visits-per-well visit (June 2015 – June 2016)
Tim Proctor
Results● Value of increased well visits: $198,000 additional revenue
year-to-date● For TIGER, this translates to 4-5 additional well visits per-
week per-provider● Infant developmental screening rates improved from 6% in
June 2015 to 39% as of June 2016. Estimated additional revenue from this screening YTD 2016: $5,000
● Expected to achieve level 3 PCMH recognition this Fall

Tim Proctor
Dashboard Demo