Embed Size (px)
Citation preview
www.wjpr.net Vol 8, Issue 9, 2019.
1659
Braimah et al. World Journal of Pharmaceutical Research
IMPURITY PROFILING OF PARACETAMOL DOSAGE FORMS USED
IN MAIDUGURI METROPOLIS
Hassan Yesufu Braimah*1, Abubakar Babakura Tijjani
1 and Samuel Chabiri Amos
2
1Department of Pharmaceutical Chemistry, Faculty of Pharmacy, University of Maiduguri,
Maiduguri, Nigeria.
2National Agency for Food Drug Administration and Control Maiduguri Area Laboratory,
Maiduguri, Nigeria.
ABSTRACT
Pharmaceutical impurities are those substances which co-exist with the
active pharmaceutical ingredient (API) or they may develop during
synthesis or ageing of both API and formulation. The presence of these
impurities even in minor amounts can influence the efficacy and safety
of drug. Paracetamol (N-(4-hydroxyphenyl) acetamide) also known as
acetaminophen is a widely used analgesic for management of pain and
fever in a variety of patients including children, pregnant women and
the elderly. The aim of this work was to test for the presence of
impurities in paracetamol dosage forms used in the Maiduguri
metropolis by TLC and HPLC methods. For PAP detection an Intersil
ODS-3V column (150 mm × 4.6 mm; 5 µm pore size) was used at the
temperature of 350C, the mobile phase was methanol : water (20 : 80) using isocratic elution
at the flow rate of 2 ml/min, injection volume of 10 µl and a diode array detector. For PCA
detection, the chromatographic conditions were the same except the mobile phase which was
methanol: water (60: 40), flow rate of 1.2 ml/min and injection volume of 20 µl. 15 samples
each of paracetamol tablet and syrups were randomly selected from three different sources;
hospital pharmacy, community pharmacy and drug patent stores. Using the TLC method none
of the samples showed spots corresponding to PAP or PCA. Using the HPLC method, one
sample of paracetamol syrup presented with a peak that corresponds to PAP and upon
quantification the amount was below the limit stated by the pharmacopoeia thus the sample
was accepted. None of the samples showed peak corresponding to PCA. corresponding to
PCA.
World Journal of Pharmaceutical Research SJIF Impact Factor 8.074
Volume 8, Issue 9, 1659-1685. Research Article ISSN 2277– 7105
Article Received on
21 June 2019,
Revised on 11 July 2019,
Accepted on 01 Aug. 2019
DOI: 10.20959/wjpr20199-15598
*Corresponding Author
Hassan Yesufu Braimah
Department of
Pharmaceutical Chemistry,
Faculty of Pharmacy,
University of Maiduguri,
Maiduguri, Nigeria.
www.wjpr.net Vol 8, Issue 9, 2019.
1660
Braimah et al. World Journal of Pharmaceutical Research
KEYWORDS: Pharmaceutical impurity, paracetamol, HPLC, TLC, PAP and PCA.
Abbreviations: USP: United States Pharmacopoeia, BP: British Pharmacopoeia, HPLC:
High Performance Liquid Chromatography, TLC: Thin Layer Chromatography; PTH:
Paracetamol Tablet Hospital sample, PSH: Paracetamol Syrup Hospital sample; PTCP:
Paracetamol Tablet Community Pharmacy sample, PSCP: Paracetamol Syrup Community
Pharmacy sample, PTPS:Paracetamol Tablet Patent Store sample and PSPS: Paracetamol
Syrup Patent Store sample.
INTRODUCTION
Pharmaceutical impurities are those substances which co-exist with the active pharmaceutical
ingredient (API) or they may develop during synthesis or ageing of both API and
formulation. The presence of these impurities even in minor amounts can influence the
efficacy and safety of drug. The safety of drug is dependent not only on the toxicological
properties of active drug substance itself, but also on impurities that it contains. As safety and
quality of pharmaceutical products can be affected by impurities present in APIs, impurity
profiling of API has started gaining wider attention.[1]
Impurity profiling (i.e. the identity as
well as the quantity of impurity in the pharmaceuticals), is now receiving important critical
attention from regulatory authorities. The different pharmacopoeias, such as the British
Pharmacopoeia (BP) and the United States Pharmacopoeia (USP), are slowly incorporating
limits to allowable levels of impurities present in the APIs or formulations.[2]
Development of
analytical methods to determine impurities and degradation products during pharmaceutical
development is necessary.[3]
It is virtually impossible to have absolutely pure chemical compounds and even analytical
pure chemical compounds contain minute trace of impurities. The chemical purity may be
achieved as closely as desired provided that sufficient care is observed at different levels in
manufacturing of a pharmaceutical.[4]
The level of purity of the pharmaceutical substances
depends partly on the cost-effectiveness of the process employed, method of purification and
stability of the final product. Setting higher standards of purity for pharmaceutical substances
than that of desirable and pharmacologically safe level will unduly result in wastage of
money, material and time. Purification of chemical compounds is a very expensive process
hence one has to strike a balance in order to obtain a pharmaceutical substance at reasonable
cost yet sufficiently pure for all pharmaceutical purposes.[5]
www.wjpr.net Vol 8, Issue 9, 2019.
1661
Braimah et al. World Journal of Pharmaceutical Research
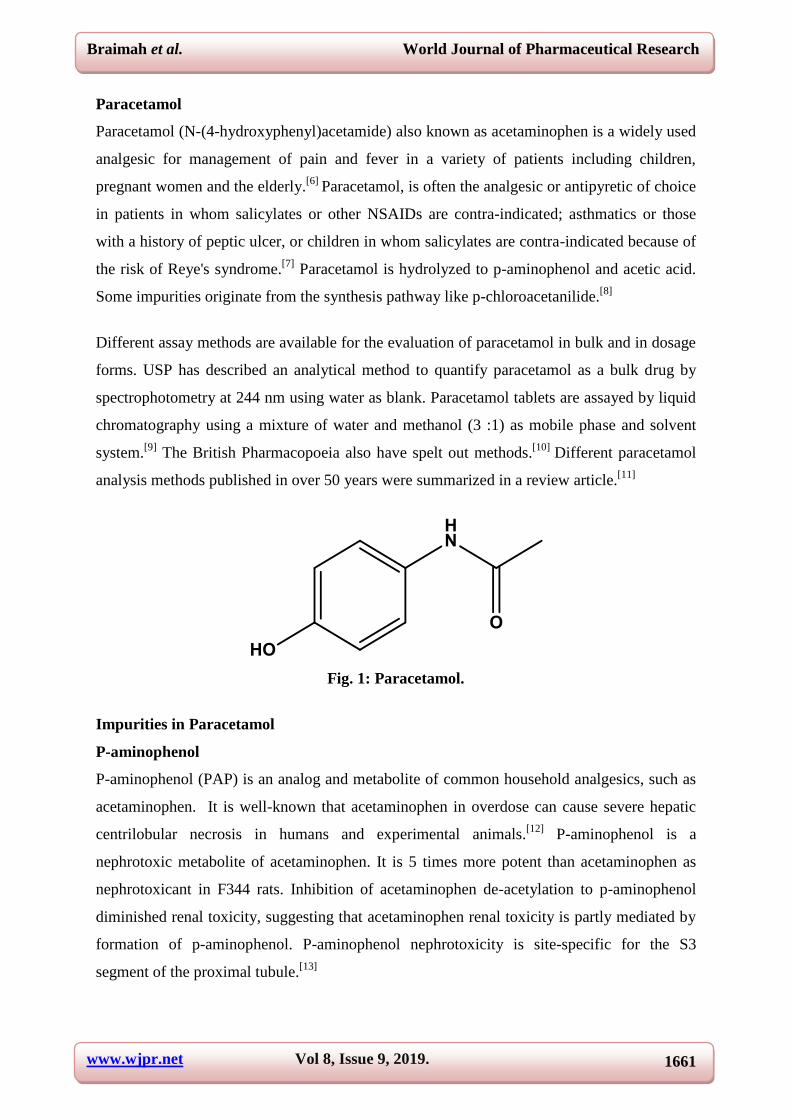
Paracetamol
Paracetamol (N-(4-hydroxyphenyl)acetamide) also known as acetaminophen is a widely used
analgesic for management of pain and fever in a variety of patients including children,
pregnant women and the elderly.[6]
Paracetamol, is often the analgesic or antipyretic of choice
in patients in whom salicylates or other NSAIDs are contra-indicated; asthmatics or those
with a history of peptic ulcer, or children in whom salicylates are contra-indicated because of
the risk of Reye's syndrome.[7]
Paracetamol is hydrolyzed to p-aminophenol and acetic acid.
Some impurities originate from the synthesis pathway like p-chloroacetanilide.[8]
Different assay methods are available for the evaluation of paracetamol in bulk and in dosage
forms. USP has described an analytical method to quantify paracetamol as a bulk drug by
spectrophotometry at 244 nm using water as blank. Paracetamol tablets are assayed by liquid
chromatography using a mixture of water and methanol (3 :1) as mobile phase and solvent
system.[9]
The British Pharmacopoeia also have spelt out methods.[10]
Different paracetamol
analysis methods published in over 50 years were summarized in a review article.[11]
Fig. 1: Paracetamol.
Impurities in Paracetamol
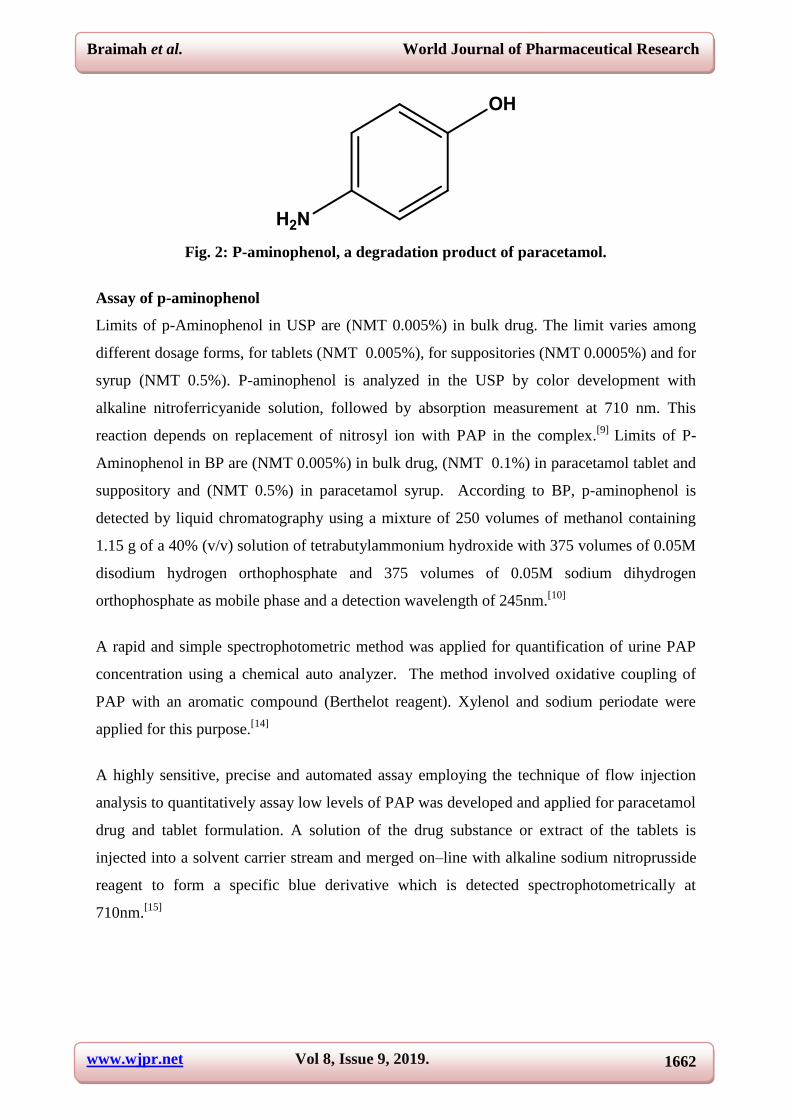
P-aminophenol
P-aminophenol (PAP) is an analog and metabolite of common household analgesics, such as
acetaminophen. It is well-known that acetaminophen in overdose can cause severe hepatic
centrilobular necrosis in humans and experimental animals.[12]
P-aminophenol is a
nephrotoxic metabolite of acetaminophen. It is 5 times more potent than acetaminophen as
nephrotoxicant in F344 rats. Inhibition of acetaminophen de-acetylation to p-aminophenol
diminished renal toxicity, suggesting that acetaminophen renal toxicity is partly mediated by
formation of p-aminophenol. P-aminophenol nephrotoxicity is site-specific for the S3
segment of the proximal tubule.[13]
www.wjpr.net Vol 8, Issue 9, 2019.
1662
Braimah et al. World Journal of Pharmaceutical Research
Fig. 2: P-aminophenol, a degradation product of paracetamol.
Assay of p-aminophenol
Limits of p-Aminophenol in USP are (NMT 0.005%) in bulk drug. The limit varies among
different dosage forms, for tablets (NMT 0.005%), for suppositories (NMT 0.0005%) and for
syrup (NMT 0.5%). P-aminophenol is analyzed in the USP by color development with
alkaline nitroferricyanide solution, followed by absorption measurement at 710 nm. This
reaction depends on replacement of nitrosyl ion with PAP in the complex.[9]
Limits of P-
Aminophenol in BP are (NMT 0.005%) in bulk drug, (NMT 0.1%) in paracetamol tablet and
suppository and (NMT 0.5%) in paracetamol syrup. According to BP, p-aminophenol is
detected by liquid chromatography using a mixture of 250 volumes of methanol containing
1.15 g of a 40% (v/v) solution of tetrabutylammonium hydroxide with 375 volumes of 0.05M
disodium hydrogen orthophosphate and 375 volumes of 0.05M sodium dihydrogen
orthophosphate as mobile phase and a detection wavelength of 245nm.[10]
A rapid and simple spectrophotometric method was applied for quantification of urine PAP
concentration using a chemical auto analyzer. The method involved oxidative coupling of
PAP with an aromatic compound (Berthelot reagent). Xylenol and sodium periodate were
applied for this purpose.[14]
A highly sensitive, precise and automated assay employing the technique of flow injection
analysis to quantitatively assay low levels of PAP was developed and applied for paracetamol
drug and tablet formulation. A solution of the drug substance or extract of the tablets is
injected into a solvent carrier stream and merged on–line with alkaline sodium nitroprusside
reagent to form a specific blue derivative which is detected spectrophotometrically at
710nm.[15]
www.wjpr.net Vol 8, Issue 9, 2019.
1663
Braimah et al. World Journal of Pharmaceutical Research
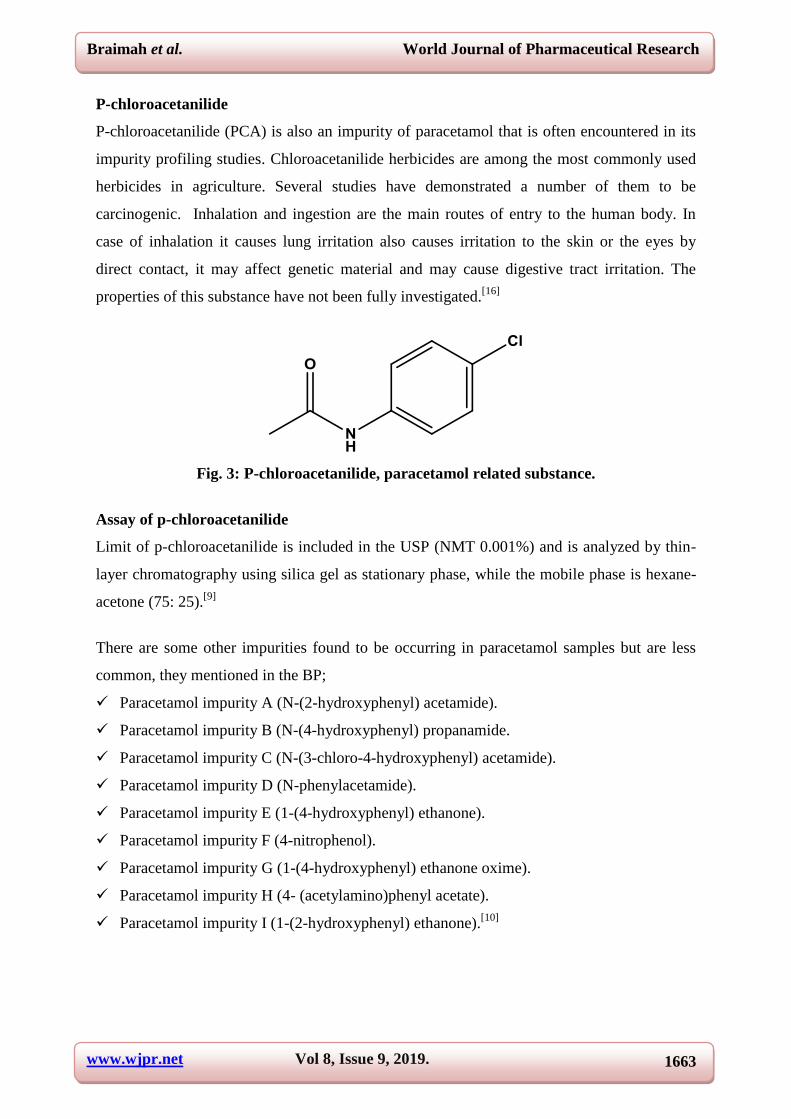
P-chloroacetanilide
P-chloroacetanilide (PCA) is also an impurity of paracetamol that is often encountered in its
impurity profiling studies. Chloroacetanilide herbicides are among the most commonly used
herbicides in agriculture. Several studies have demonstrated a number of them to be
carcinogenic. Inhalation and ingestion are the main routes of entry to the human body. In
case of inhalation it causes lung irritation also causes irritation to the skin or the eyes by
direct contact, it may affect genetic material and may cause digestive tract irritation. The
properties of this substance have not been fully investigated.[16]
Fig. 3: P-chloroacetanilide, paracetamol related substance.
Assay of p-chloroacetanilide
Limit of p-chloroacetanilide is included in the USP (NMT 0.001%) and is analyzed by thin-
layer chromatography using silica gel as stationary phase, while the mobile phase is hexane-
acetone (75: 25).[9]
There are some other impurities found to be occurring in paracetamol samples but are less
common, they mentioned in the BP;
Paracetamol impurity A (N-(2-hydroxyphenyl) acetamide).
Paracetamol impurity B (N-(4-hydroxyphenyl) propanamide.
Paracetamol impurity C (N-(3-chloro-4-hydroxyphenyl) acetamide).
Paracetamol impurity D (N-phenylacetamide).
Paracetamol impurity E (1-(4-hydroxyphenyl) ethanone).
Paracetamol impurity F (4-nitrophenol).
Paracetamol impurity G (1-(4-hydroxyphenyl) ethanone oxime).
Paracetamol impurity H (4- (acetylamino)phenyl acetate).
Paracetamol impurity I (1-(2-hydroxyphenyl) ethanone).[10]
www.wjpr.net Vol 8, Issue 9, 2019.
1664
Braimah et al. World Journal of Pharmaceutical Research
MATERIALS AND METHOD
Instruments
Hitachi HPLC machine; pump model L-2130 (USA), Intersil ODS-3V C-18 column; 150mm
× 4.6mm; 5µm pore size (GL Sciences, USA), shaker and centrifuge.
Reagents
Standards: paracetamol and 4-chloroacetanilide, (Sigma Aldrich, France), 4-aminophenol
(Merck, Germany). Solvents: methanol,(Sigma Aldrich, France), acetone, ethanol, toluene,
acetic acid, ethyl acetate, hexane, and distilled water. Substances: iodine, and ammonia (BDH
chemicals, UK). Materials: TLC plates Kiesel gel 60 F254 (5 ×10cm) (Merck, Germany),
micro capillary 2µl.
Sampling
The sample were selected from the different pharmacy premises as well as the patent stores.
Different dosage forms were used; tablets and syrups. The pharmacies and the patent stores
of each area were selected randomly.
Sample Size
The samples were randomly selected from three different sources; hospitals, community
pharmacies and patent drug stores. 300 tablets and 15 syrups of paracetamol produced by 5
different companies were randomly selected. Different doses and types were randomly
selected.
Detection of Impurities of Paracetamol using TLC
Standard Solutions: For tablets
-Paracetamol standard solution: 1g standard paracetamol was dissolved in 5 ml methanol.
-Para-aminophenol standard solution: The limit of para-aminophenol is not more than
0.005% (USP, 2017 and BP, 2018). 0.05g of standard para-aminophenol was dissolved in
10ml methanol. 1ml of the resulting solution was diluted to 100ml with methanol to get a
final concentration of 50µg/ml.[11]
-Para- chloroacetanilide standard solution: The limit of para-chloroacetanilide as an impurity
in paracetamol is not more than 0.001%.[9,10]
0.01g of the standard para- chloroacetanilidewas
dissolved in 10ml methanol. 1ml of the resulting solution was diluted to 100 ml with
methanol. The resulting solution has a concentration of 10µg/ml.[11]
www.wjpr.net Vol 8, Issue 9, 2019.
1665
Braimah et al. World Journal of Pharmaceutical Research
Standard Solution: For Syrups
-Paracetamol standard solution: 25mg paracetamol was dissolved in 5ml methanol. The
concentration of the standard solution was 5mg/ml.[11]
-Para-aminophenol standard solution: The limit of para-aminophenol in paracetamol syrup is
not more than 0.5% (USP, 2017 and BP, 2018). 25 mg of standard para-aminophenol was
dissolved in 10ml methanol. 1ml of the resulting solution was diluted to 100ml with
methanol to get a final concentration of 25µg/ml.[11]
-Para-chloroacetanilide standard solution: Para-chloroacetanilide standard solution with a
concentration of 5.0µg/ml was prepared by dissolving 50mg of para-chloroacetanilide in
100ml methanol. 1ml of the last solution was transferred into 100ml volumetric flask and
diluted to volume with methanol.[11]
A mixture of paracetamol, para-aminophenol and para- chloroacetanilide was prepared by
mixing equal volumes of their standard solutions.
Chromatography
Stationary phase: TLC plates (Kiesel gel 60 F254, 5 × 10 cm).
Mobile phases: Different mobile phases were tested to get the best isolation for paracetamol
samples along with its impurities by TLC. These will include:
Chloroform: acetone (4:1); ethyl acetate: hexane (3:1); Ethyl acetate : acetic acid (200:1);
toluene : acetone : acetic acid (20:20:2); hexane : ethyl acetate (3:4) and toluene : acetonitrile
(1:1).
Application: 10µl of each paracetamol standard solutions, 2µl of para-aminophenol, para
chloroacetanilide, standard solutions and mixture solutions were applied. The spots were
detected using iodine vapor. After identifying the best solvent system, the drug samples were
prepared by accurately weighing powder equivalent to 1g paracetamol and dissolving in 5 ml
methanol. It was mechanically shaken for 30 minutes and centrifuged at 1000 rpm for 15
minutes. The clear supernatant was then separated. This clear solution was usedfor spotting
together with the solutions of the standards (paracetamol, para-aminophenol and para-
chloroacetanilide). Commercial paracetamol syrup that has a concentration of 125 mg/5ml
was examined. 5 ml of the preparation was diluted to 25 ml with methanol and filtered. The
filtrate was used for spotting together with the standard solutions.
Evaluation: Rfvalues were determined. The spots of para-aminophenol and para-
chloroacetanilide in paracetamol tablet samples should not be larger than the corresponding
www.wjpr.net Vol 8, Issue 9, 2019.
1666
Braimah et al. World Journal of Pharmaceutical Research
para-aminophenol and para-chloroacetanilide spots in standard solution. (the limit of para-
aminophenol is 0.005% and para chloroacetanilide 0.001%).The spots of para-aminophenol
and para- chloroacetanilide in paracetamol syrup samples should not be larger than the
corresponding para-aminophenol and para-chloroacetanilide spots in standard solution. (the
limit of para-aminophenol is 0.5% and para chloroacetanilide 0.1%).
Detection of Impurities of Paracetamol using HPLC
Using the standard powders, solutions of paracetamol, 4-aminophenol and 4-
chloroacetanilide were prepared. Various concentrations were used to obtain the calibration
curve. 25 mg of each standard was dissolved in 2 ml of methanol and made up to 10 ml using
distilled water. 1.5 ml of the resulting solution was diluted to 25 ml with distilled water. From
the second solution 1, 0.8, 0.6, 0.4 and 0.2 ml were taken and diluted to 25 ml with distilled
water to give 6 µg/ml, 4.8 µg/ml, 3.6 µg/ml, 2.4 µg/ml and 1.2 µg/ml respectively. Peak area
was plotted against concentration to obtain the calibration curve. To quantify paracetamol
and its impurities, samples to be analyzed were prepared to obtain 150 µg/ml concentration.
For tablets, quantity of powdered sample containing 25 mg equivalent of paracetamol was
weighed and dissolved in 2 ml methanol and made up to 10 ml with distilled water. After
filtration of the resulting solution, 1.5 ml was taken and diluted to 25 ml with distilled water
to yield 150 µg/ml concentration. For syrups, 1 ml was be measured and dissolved in 2 ml
methanol and made up to 10 ml with distilled water. After filtration of the resulting solution,
1.5 ml was taken and diluted to 25 ml with distilled water to yield 150 µg/ml concentration.
The chromatographic conditions are:
Column: Intersil ODS-3V C-18
Column dimension: 150 mm × 4.6 mm; 5 µm pore size
Mobile phase: methanol : water (20 : 80)
Flow rate: 2 ml/min
Injection volume: 10 µl
Mode of elution: isocratic
Column temperature: 35 0C
Detector: diode array detector (DAD L-2455).[17]
For 4-chloroacetanilide, the chromatographic conditions are same but with the following
differences:
Mobile phase: methanol : water (60 : 40)
www.wjpr.net Vol 8, Issue 9, 2019.
1667
Braimah et al. World Journal of Pharmaceutical Research
Flow rate: 1.2 ml/min
Injection volume: 20 µl.[18]
RESULTS AND DISCUSSION
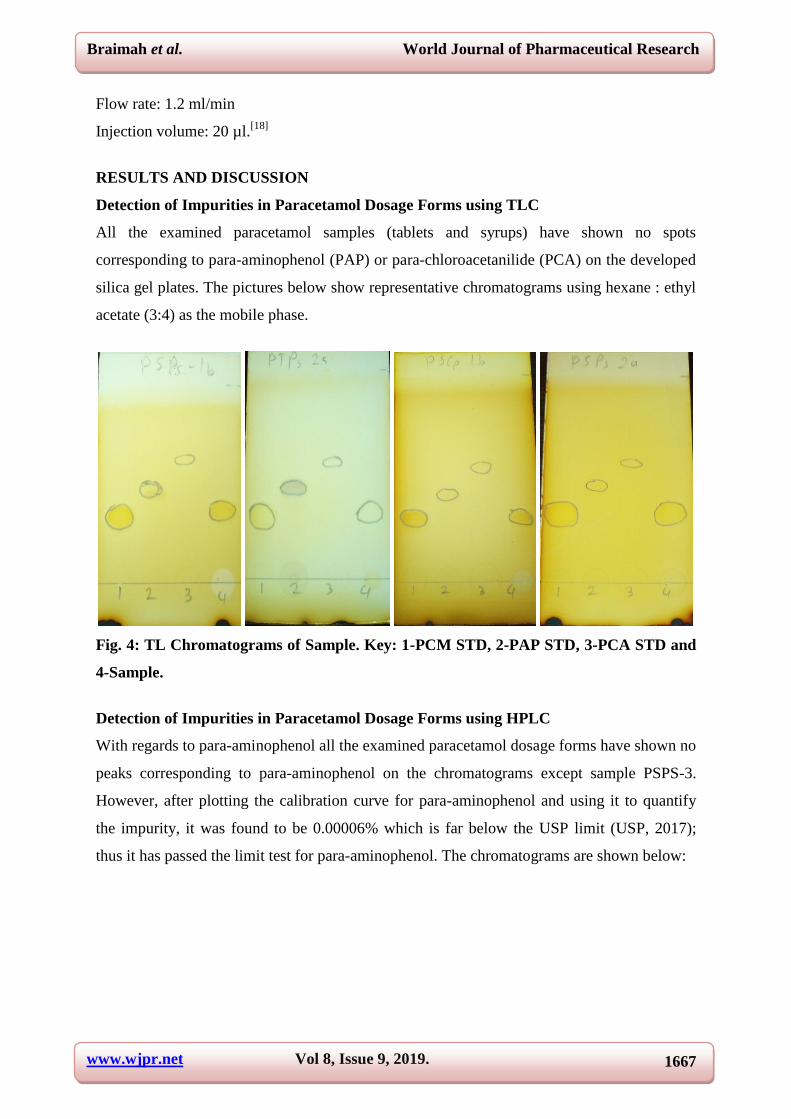
Detection of Impurities in Paracetamol Dosage Forms using TLC
All the examined paracetamol samples (tablets and syrups) have shown no spots
corresponding to para-aminophenol (PAP) or para-chloroacetanilide (PCA) on the developed
silica gel plates. The pictures below show representative chromatograms using hexane : ethyl
acetate (3:4) as the mobile phase.
Fig. 4: TL Chromatograms of Sample. Key: 1-PCM STD, 2-PAP STD, 3-PCA STD and
4-Sample.
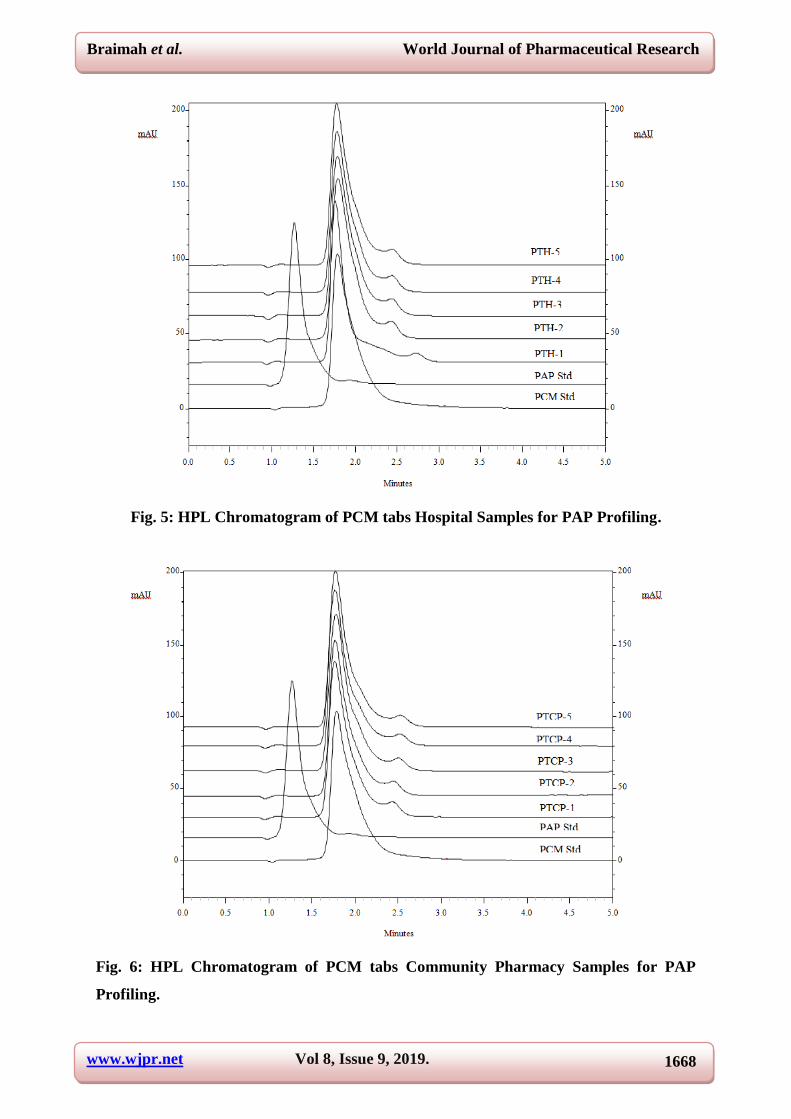
Detection of Impurities in Paracetamol Dosage Forms using HPLC
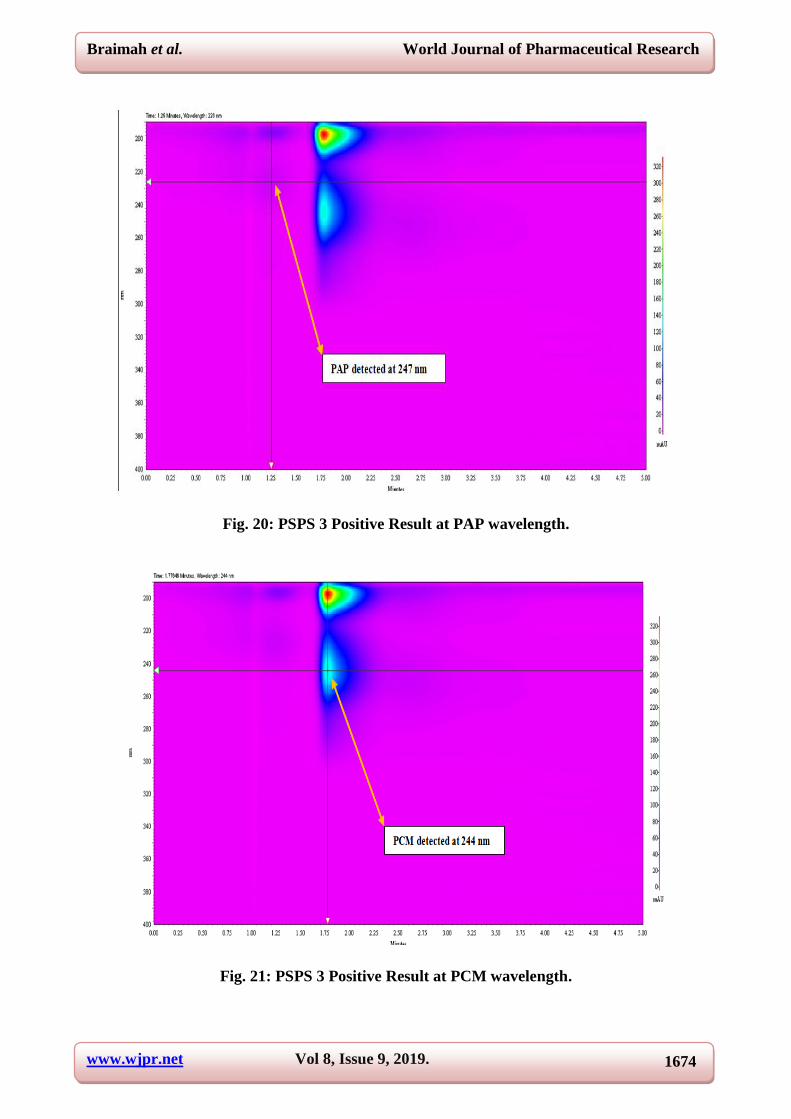
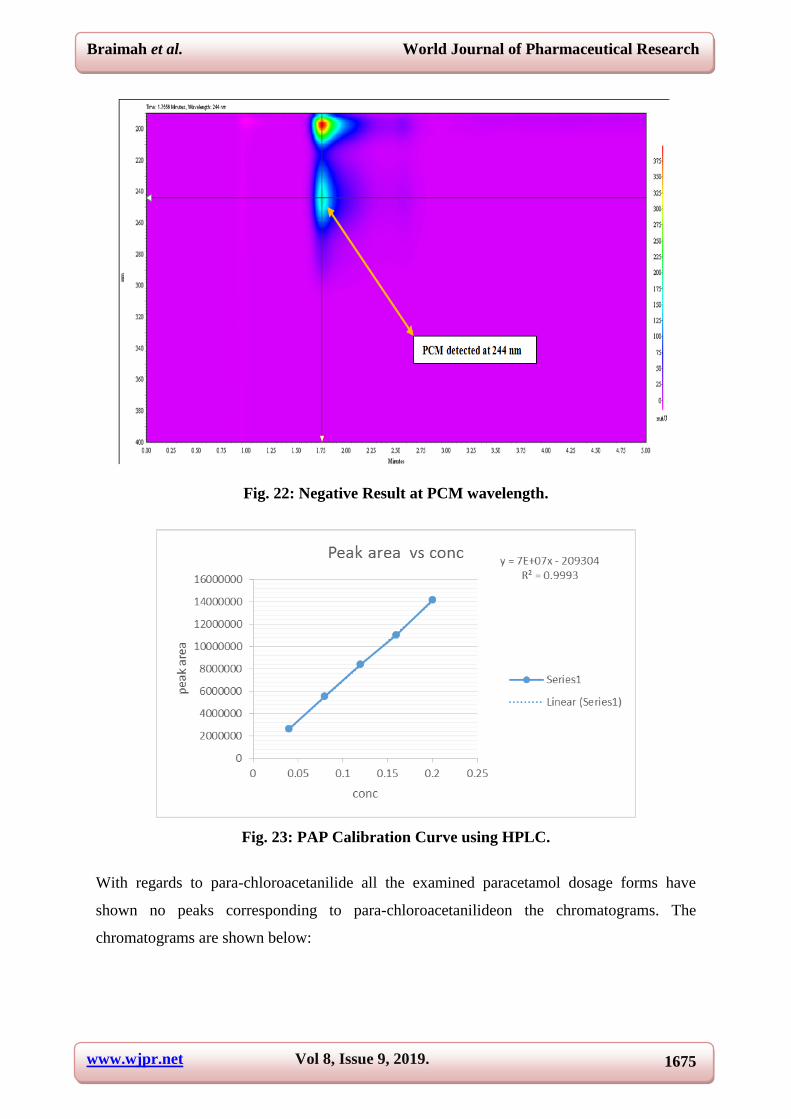
With regards to para-aminophenol all the examined paracetamol dosage forms have shown no
peaks corresponding to para-aminophenol on the chromatograms except sample PSPS-3.
However, after plotting the calibration curve for para-aminophenol and using it to quantify
the impurity, it was found to be 0.00006% which is far below the USP limit (USP, 2017);
thus it has passed the limit test for para-aminophenol. The chromatograms are shown below:
www.wjpr.net Vol 8, Issue 9, 2019.
1668
Braimah et al. World Journal of Pharmaceutical Research
Fig. 5: HPL Chromatogram of PCM tabs Hospital Samples for PAP Profiling.
Fig. 6: HPL Chromatogram of PCM tabs Community Pharmacy Samples for PAP
Profiling.
www.wjpr.net Vol 8, Issue 9, 2019.
1669
Braimah et al. World Journal of Pharmaceutical Research
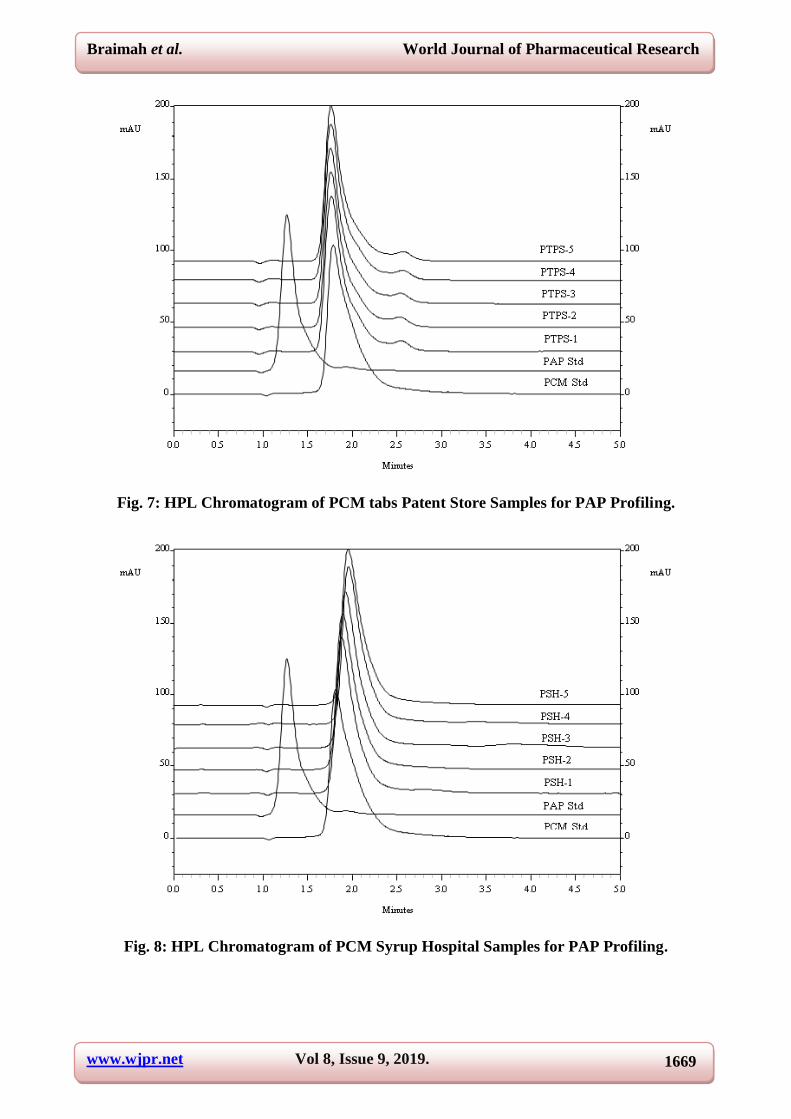
Fig. 7: HPL Chromatogram of PCM tabs Patent Store Samples for PAP Profiling.
Fig. 8: HPL Chromatogram of PCM Syrup Hospital Samples for PAP Profiling.
www.wjpr.net Vol 8, Issue 9, 2019.
1670
Braimah et al. World Journal of Pharmaceutical Research
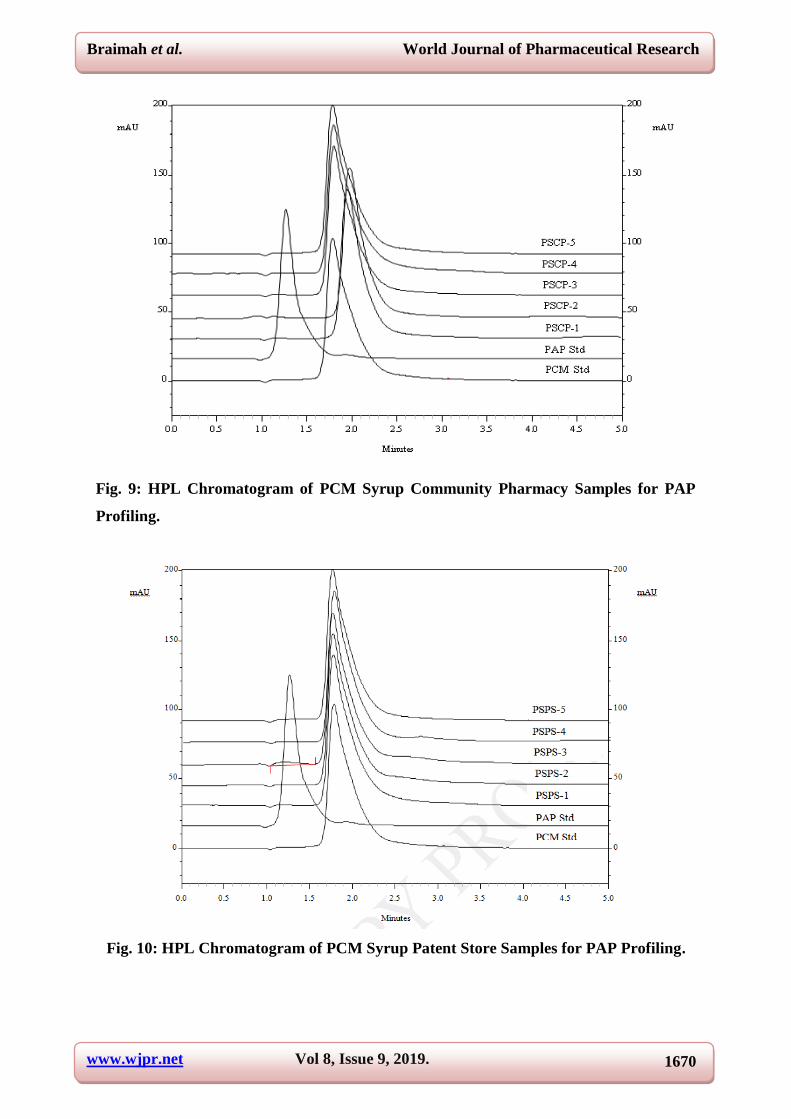
Fig. 9: HPL Chromatogram of PCM Syrup Community Pharmacy Samples for PAP
Profiling.
Fig. 10: HPL Chromatogram of PCM Syrup Patent Store Samples for PAP Profiling.
www.wjpr.net Vol 8, Issue 9, 2019.
1671
Braimah et al. World Journal of Pharmaceutical Research
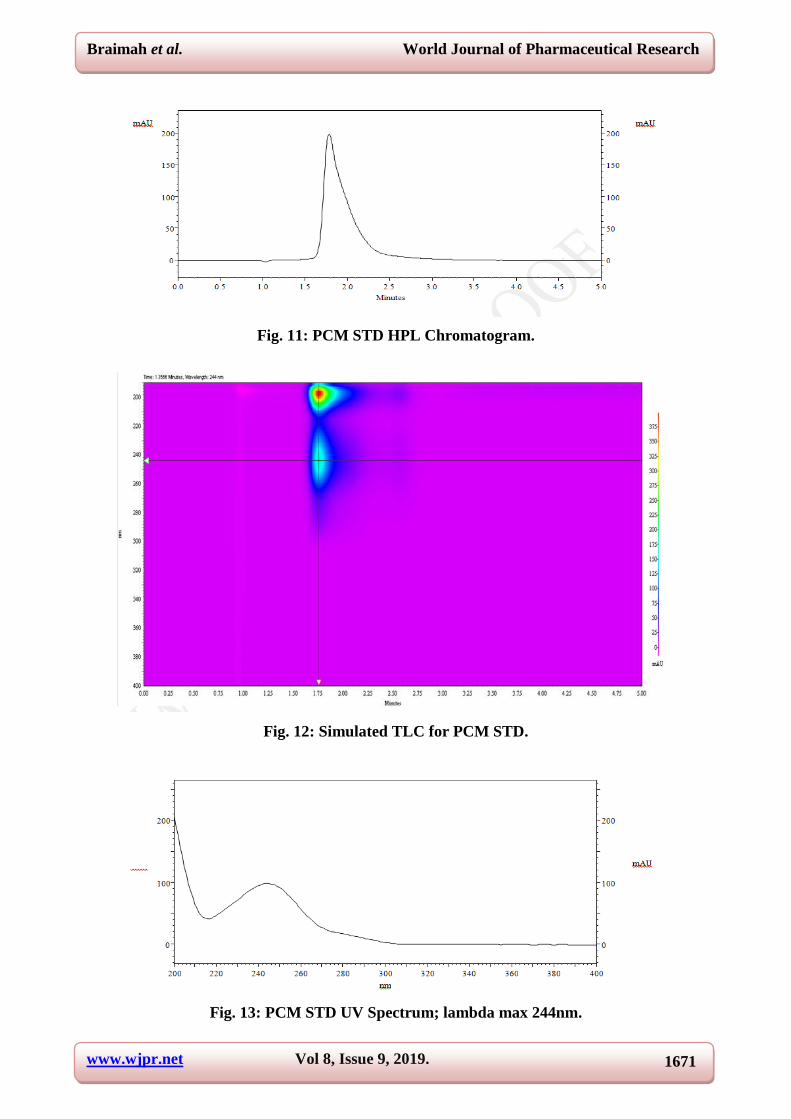
Fig. 11: PCM STD HPL Chromatogram.
Fig. 12: Simulated TLC for PCM STD.
Fig. 13: PCM STD UV Spectrum; lambda max 244nm.
www.wjpr.net Vol 8, Issue 9, 2019.
1672
Braimah et al. World Journal of Pharmaceutical Research
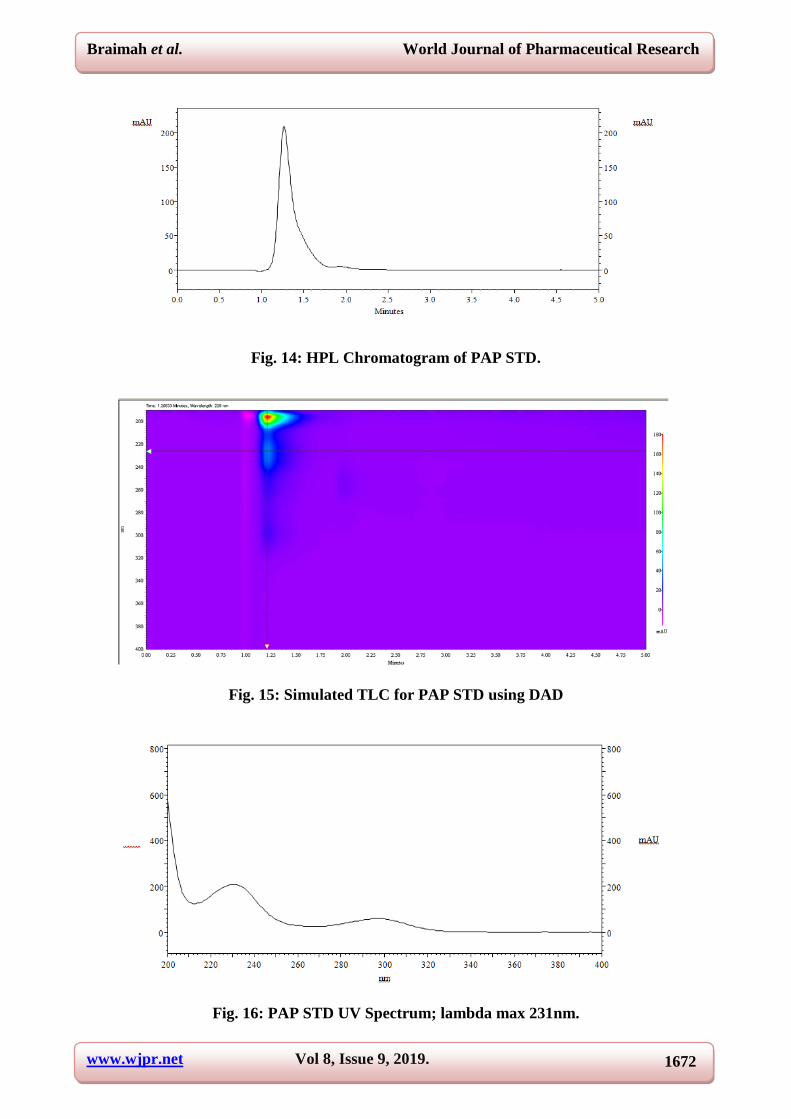
Fig. 14: HPL Chromatogram of PAP STD.
Fig. 15: Simulated TLC for PAP STD using DAD
Fig. 16: PAP STD UV Spectrum; lambda max 231nm.
www.wjpr.net Vol 8, Issue 9, 2019.
1673
Braimah et al. World Journal of Pharmaceutical Research
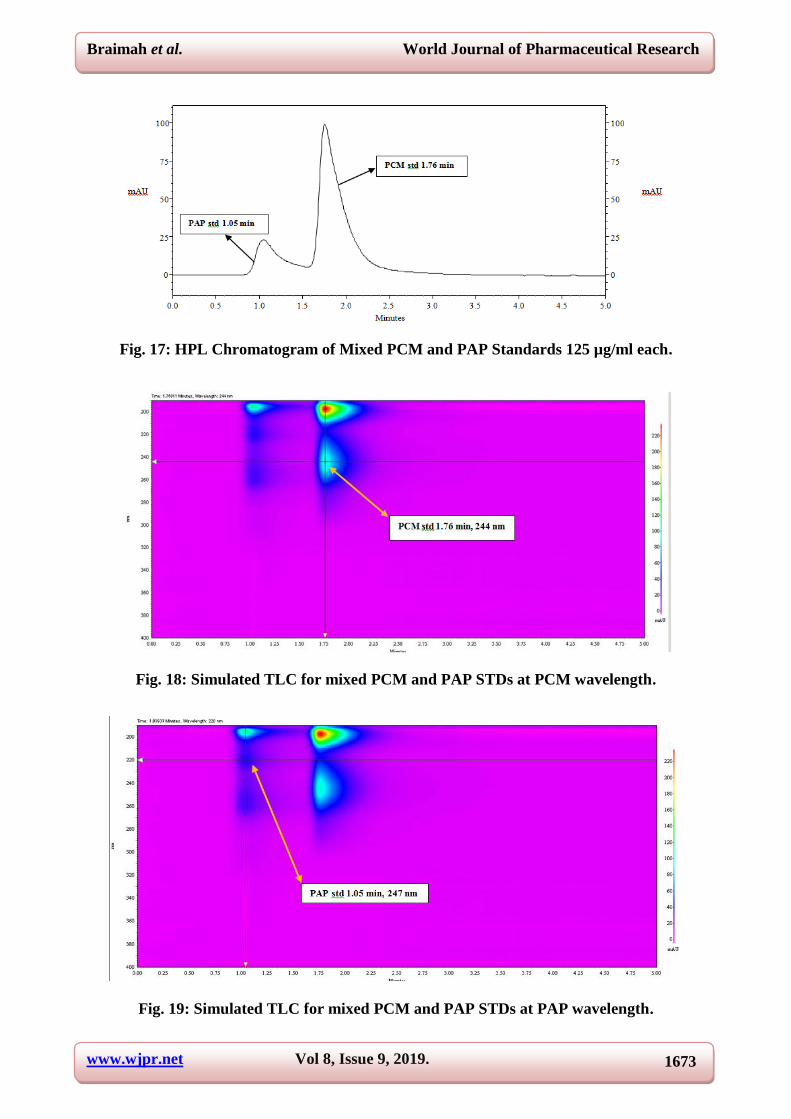
Fig. 17: HPL Chromatogram of Mixed PCM and PAP Standards 125 µg/ml each.
Fig. 18: Simulated TLC for mixed PCM and PAP STDs at PCM wavelength.
Fig. 19: Simulated TLC for mixed PCM and PAP STDs at PAP wavelength.
www.wjpr.net Vol 8, Issue 9, 2019.
1674
Braimah et al. World Journal of Pharmaceutical Research
Fig. 20: PSPS 3 Positive Result at PAP wavelength.
Fig. 21: PSPS 3 Positive Result at PCM wavelength.
www.wjpr.net Vol 8, Issue 9, 2019.
1675
Braimah et al. World Journal of Pharmaceutical Research
Fig. 22: Negative Result at PCM wavelength.
Fig. 23: PAP Calibration Curve using HPLC.
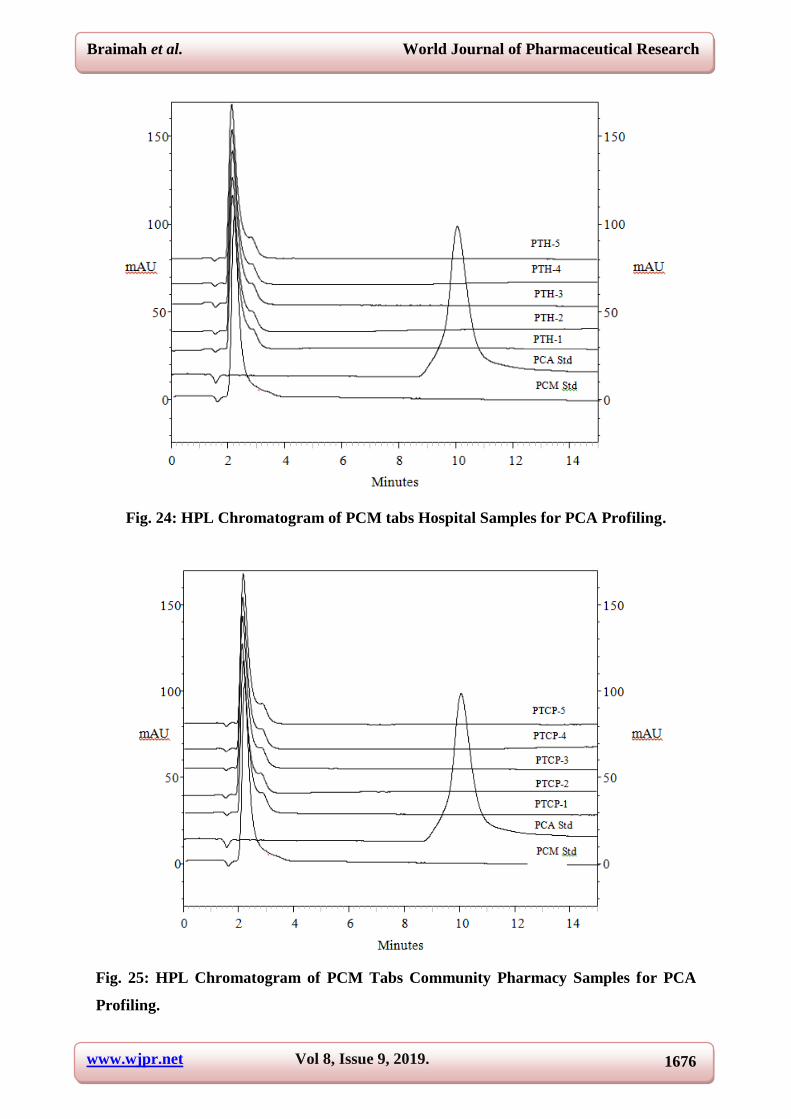
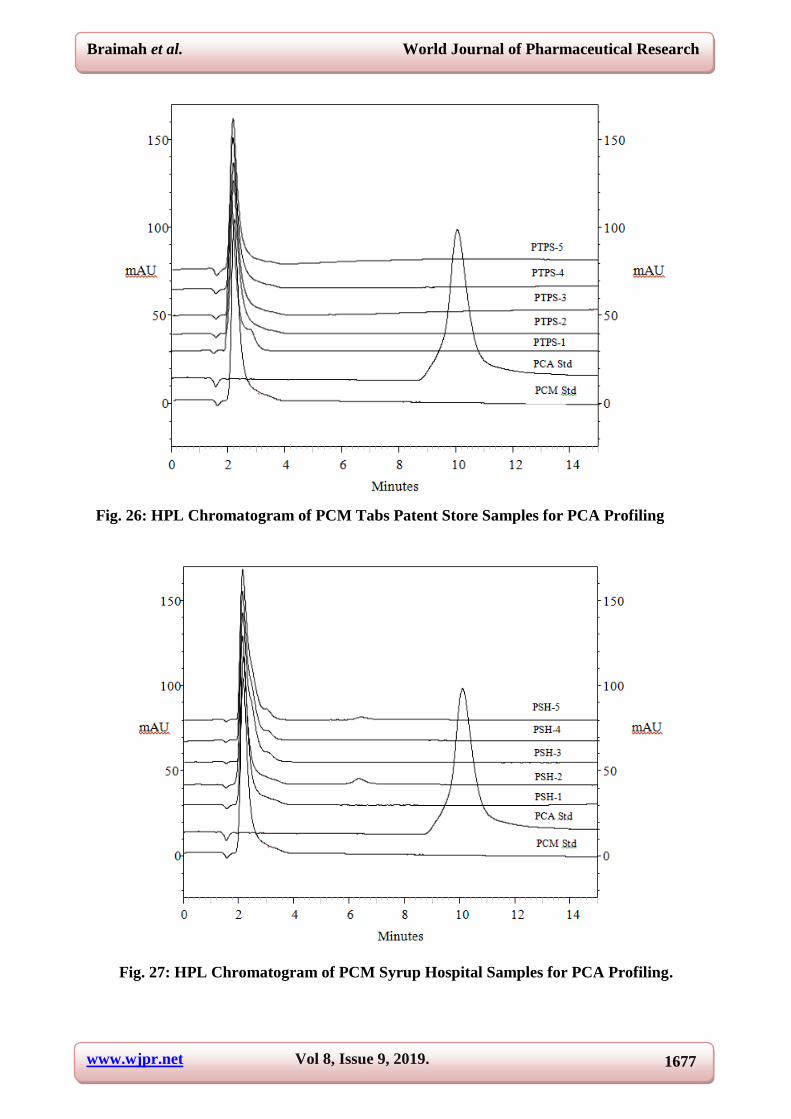
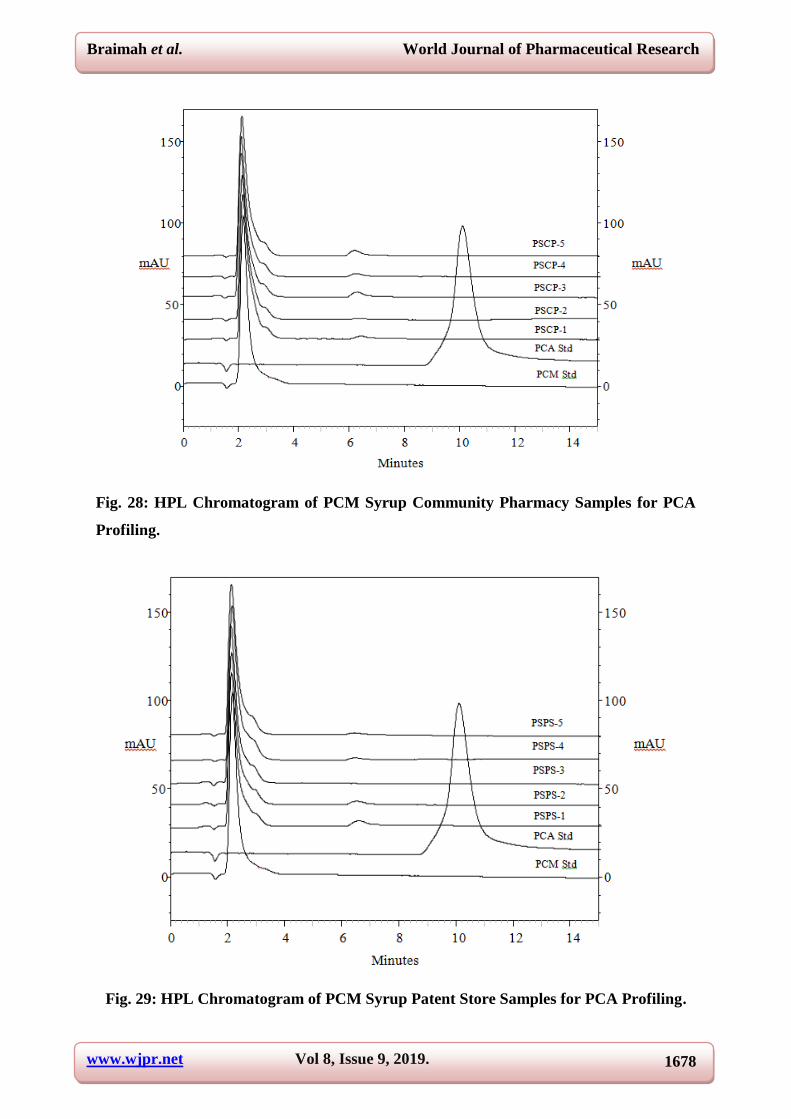
With regards to para-chloroacetanilide all the examined paracetamol dosage forms have
shown no peaks corresponding to para-chloroacetanilideon the chromatograms. The
chromatograms are shown below:
www.wjpr.net Vol 8, Issue 9, 2019.
1676
Braimah et al. World Journal of Pharmaceutical Research
Fig. 24: HPL Chromatogram of PCM tabs Hospital Samples for PCA Profiling.
Fig. 25: HPL Chromatogram of PCM Tabs Community Pharmacy Samples for PCA
Profiling.
www.wjpr.net Vol 8, Issue 9, 2019.
1677
Braimah et al. World Journal of Pharmaceutical Research
Fig. 26: HPL Chromatogram of PCM Tabs Patent Store Samples for PCA Profiling
Fig. 27: HPL Chromatogram of PCM Syrup Hospital Samples for PCA Profiling.
www.wjpr.net Vol 8, Issue 9, 2019.
1678
Braimah et al. World Journal of Pharmaceutical Research
Fig. 28: HPL Chromatogram of PCM Syrup Community Pharmacy Samples for PCA
Profiling.
Fig. 29: HPL Chromatogram of PCM Syrup Patent Store Samples for PCA Profiling.
www.wjpr.net Vol 8, Issue 9, 2019.
1679
Braimah et al. World Journal of Pharmaceutical Research
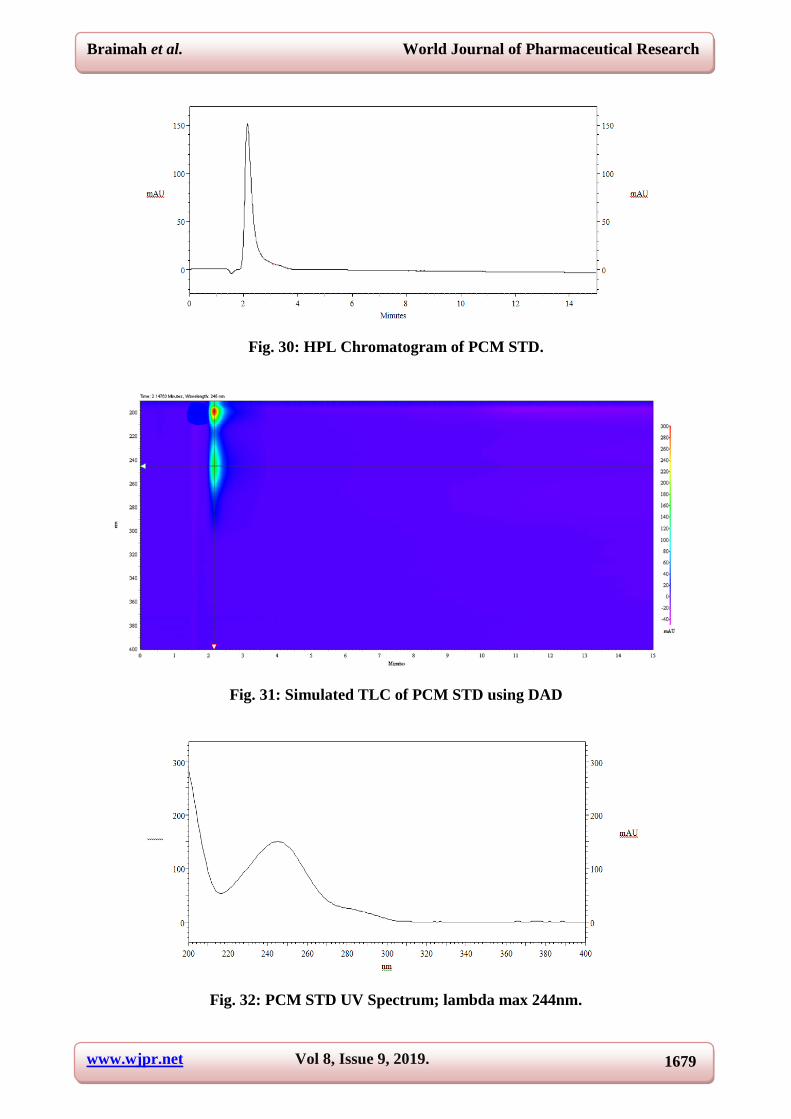
Fig. 30: HPL Chromatogram of PCM STD.
Fig. 31: Simulated TLC of PCM STD using DAD
Fig. 32: PCM STD UV Spectrum; lambda max 244nm.
www.wjpr.net Vol 8, Issue 9, 2019.
1680
Braimah et al. World Journal of Pharmaceutical Research
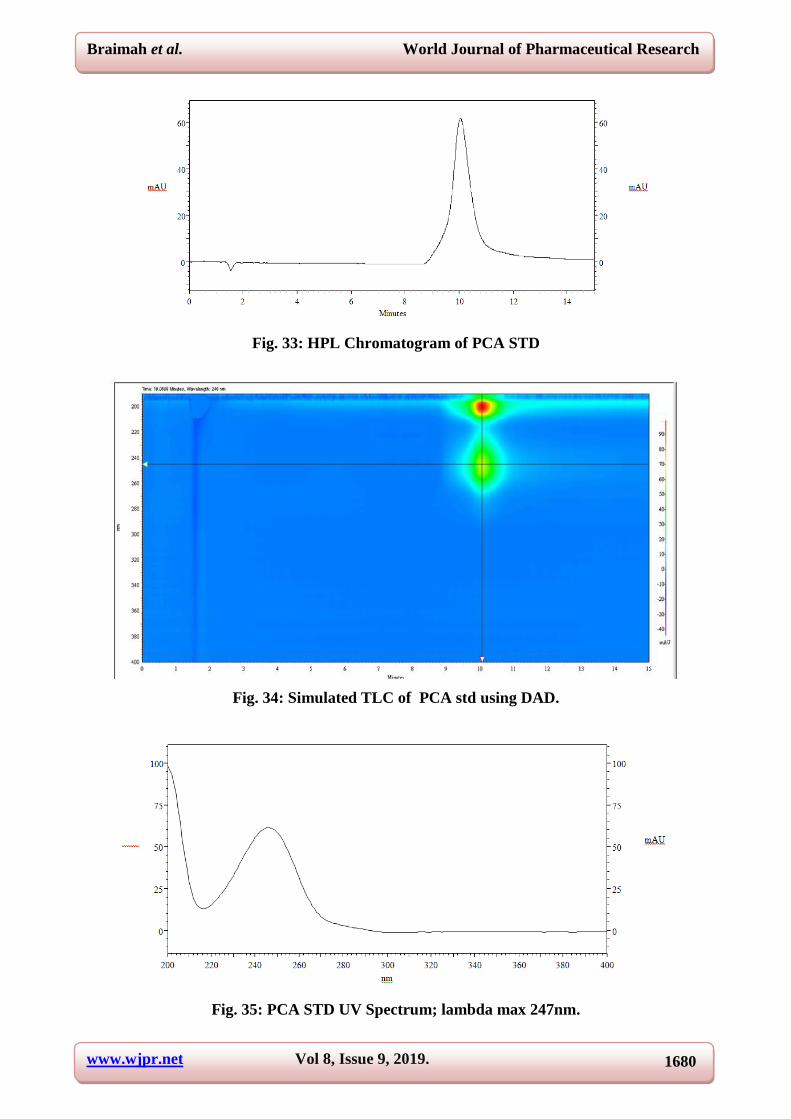
Fig. 33: HPL Chromatogram of PCA STD
Fig. 34: Simulated TLC of PCA std using DAD.
Fig. 35: PCA STD UV Spectrum; lambda max 247nm.
www.wjpr.net Vol 8, Issue 9, 2019.
1681
Braimah et al. World Journal of Pharmaceutical Research
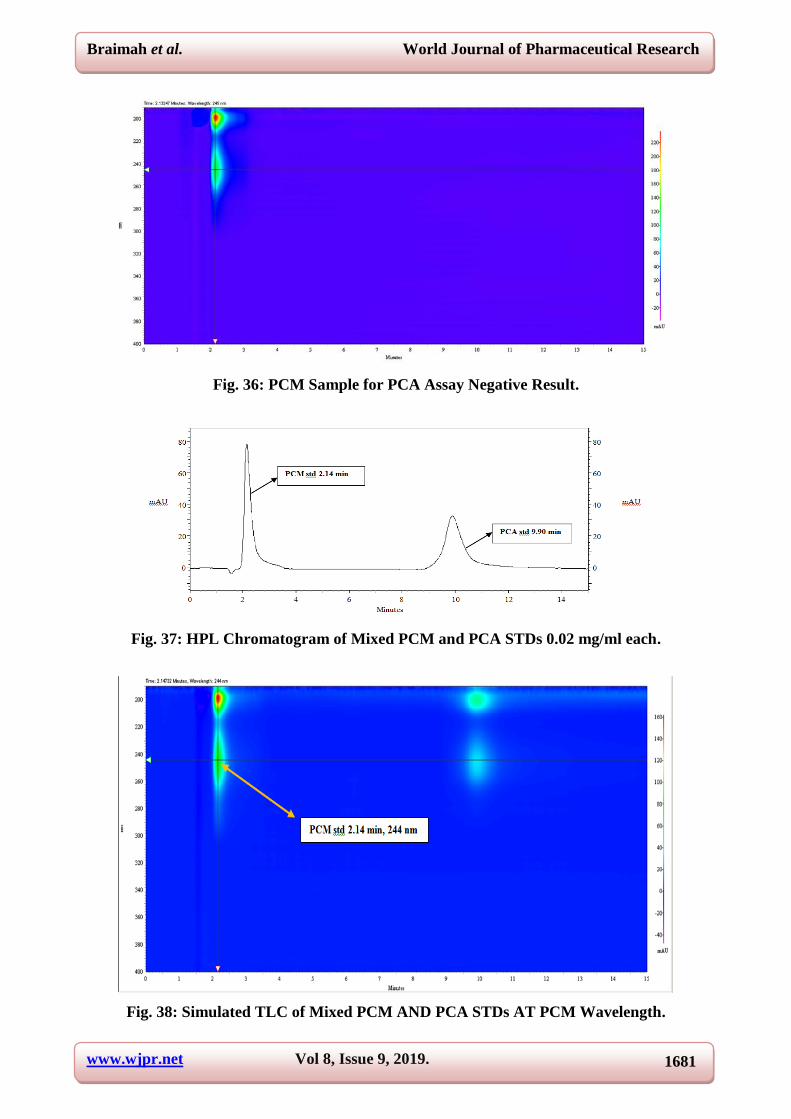
Fig. 36: PCM Sample for PCA Assay Negative Result.
Fig. 37: HPL Chromatogram of Mixed PCM and PCA STDs 0.02 mg/ml each.
Fig. 38: Simulated TLC of Mixed PCM AND PCA STDs AT PCM Wavelength.
www.wjpr.net Vol 8, Issue 9, 2019.
1682
Braimah et al. World Journal of Pharmaceutical Research
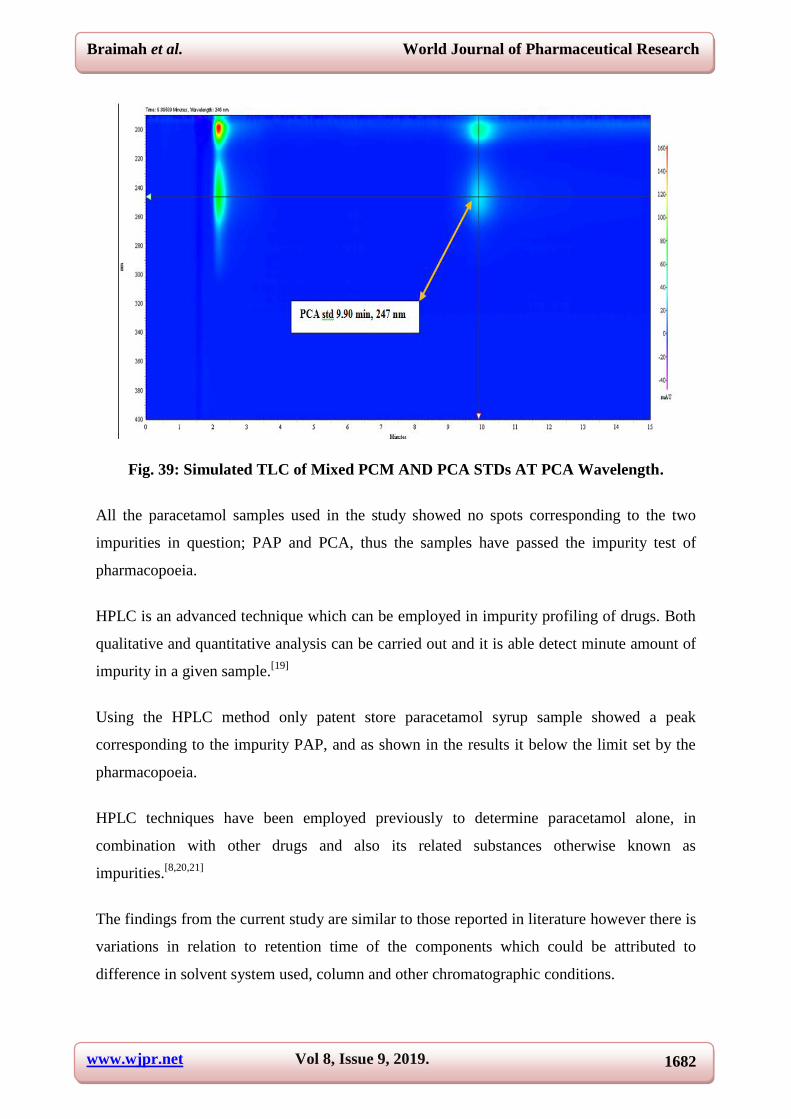
Fig. 39: Simulated TLC of Mixed PCM AND PCA STDs AT PCA Wavelength.
All the paracetamol samples used in the study showed no spots corresponding to the two
impurities in question; PAP and PCA, thus the samples have passed the impurity test of
pharmacopoeia.
HPLC is an advanced technique which can be employed in impurity profiling of drugs. Both
qualitative and quantitative analysis can be carried out and it is able detect minute amount of
impurity in a given sample.[19]
Using the HPLC method only patent store paracetamol syrup sample showed a peak
corresponding to the impurity PAP, and as shown in the results it below the limit set by the
pharmacopoeia.
HPLC techniques have been employed previously to determine paracetamol alone, in
combination with other drugs and also its related substances otherwise known as
impurities.[8,20,21]
The findings from the current study are similar to those reported in literature however there is
variations in relation to retention time of the components which could be attributed to
difference in solvent system used, column and other chromatographic conditions.
www.wjpr.net Vol 8, Issue 9, 2019.
1683
Braimah et al. World Journal of Pharmaceutical Research
Despite the limitations attributed to the TLC method, it can still be employed when situations
warrant as the case may be since the findings from the two methods are comparable and also
as reported by Payka et al 2013.[22]
CONCLUSION
1. TLC and HPLC methods were successfully used to detect impurities in paracetamol
samples.
2. Neither PAP nor PCA spot was detected using the TLC impurity profiling method of
paracetamol samples.
3. One sample of paracetamol syrup presented with a peak that corresponds to PAP and
upon quantification the amount was below the limit stated by the pharmacopoeia thus the
sample was accepted. None of the samples showed peak corresponding to PCA using the
HPLC method.
ACKNOWLEDGEMENT
We wish to express our appreciation to all students who helped in carrying out this study.
REFERENCES
1. Singh A., Afreen A., Singh D. P. and Kumar R. “A Review on Pharmaceutical Impurities
and Their Importance”. World J Pharm Pharm Sci., 2007; 6(10): 1337-1354.
2. Saibaba S. V., Kumar M. S. and Ramu B. “Pharmaceutical Impurities and Their
Characterization: A Review”. Eur J Pharm Med Res., 2016; 3(5): 190-196.
3. Akay C., Tuncer I., Sayal A., Aydin A., Zkan Y and Gul H. "Rapid and Simultaneous
Determination of Acetylsalicylic Acid, Paracetamol, And Their Degradation and Toxic
Impurity Products by HPLC in Pharmaceutical Dosage Forms". Turk J Med Sci., 2008;
38(2): 167-173.
4. Kasture A.V., Mahadik K.R., Wadodkar S. G. and More H. N. “Impurities in
Pharmaceutical Substances and Limit Tests”. Pharm Anal, 2008; 1: 6-9.
5. Bartos D. and Gorog S. "Recent advances in the impurity profiling of drugs". Current
Pharm Anal, 2008; 4(4): 215-230.
6. Page C. and Curtis M. Integrated pharmacology, 3rd
Edition, Mosby Elsevier, 2006;
334-336.
7. Sweetman S. C., (ed.). Martindale, 36th
Edition. The Pharmaceutical Press, London, 2009;
20-21.
www.wjpr.net Vol 8, Issue 9, 2019.
1684
Braimah et al. World Journal of Pharmaceutical Research
8. Nageswara Rao R. and A. Narasaraju A., (2006). “Rapid Separation and Determination of
Process-Related Substances of Paracetamol Using Reversed-Phase HPLC with Photo
Diode Array as a Detector”. Anal Sci., 2006; 22: 287-292.
9. USP 40 NF 35, United States Pharmacopeia. U.S. Pharmacopeial Convention, Inc.,
Rockville, MD, 2017.
10. British Pharmacopoeia, Vol. I-IV. Published by the department of health, London, 2018;
1889-1898, 4548-4552.
11. Espinosa M., Ruiz A., Sanchez F. and Bosch C."Determination of Paracetamol: Historical
Evolution". J Pharm Biomed Anal, 2006; 42(3): 291-321.
12. Thomas S.H.L. "Paracetamol (Acetaminophen) Poisoning". Pharmacol Therap, 1993; 60:
91-120.
13. Harmon R."Pyruvate reduces 4-aminophenol in vitro toxicity". Toxicol Appl Pharmacol,
2006; 213: 179-186.
14. Chen G, Ye J, Bao H and Yang P. "Determination of the Rate Constants and Activation
Energy of Acetaminophen Hydrolysis Bb Capillary Electrophoresis". J Pharm Biomed
Anal, 2002; 29(5): 843-850.
15. Bloomfield M. and Talanta S. "A Sensitive and Rapid Assay for 4-Aminophenol in
Paracetamol Drug and Tablet Formulation, by Flow Injection Analysis with
Spectrophotometric Detection". J Pharm Biomed Sci, 2002; 58: 1301-1310.
16. Osterhuis B. "Specific interactions of chloroacetanilide herbicides with human ABC
transporter proteins". Toxicol, 2008; 248: 45-51.
17. Crevar M., Ivkovic B., Vladimirov S., Kuntica V. and Vujic Z. “Statistical Optimization
of Reverse Phase High Performance Liquid Chromatography for the Analysis of Caffeine
Paracetamol and its Degradation Product p-aminophenol”. Acta Chim Slov, 2008; 55:
665–670.
18. Ali M. S., Rafiudin S., Ghori M. and Kahtri A.R. “Simultaneous Determination of
paracetamol, Chlorzoxazone and Related Impurities 4-aminophenol, 4΄-chloroacetanilide
and p-chlorophenol in pharmaceutical preparations using high-performance liquid
chromatography”. J AOA CInt, 2007; 90(1): 82-93.
19. Badyal P. N., Sharma C., Kaur N., Shankar R., Pandey A. and Rawal R. K. “Analytical
Techniques in Simultaneous Estimation: An Overview”. Austin J Anal Pharm Chem,
2015; 2(2): 1-14.
www.wjpr.net Vol 8, Issue 9, 2019.
1685
Braimah et al. World Journal of Pharmaceutical Research
20. Ca linescu O., Badea I. A., Vladescu L., Meltzer V. and Pincu E. “HPLC Separation of
Acetaminophen and its Impurities Using a Mixed-mode Reversed-Phase/Cation Exchange
Stationary Phase”. J Chromatogr Sci, 2012; 50: 335–342.
21. Raju K. N., Sunitha T., Krishnaja V. and Babu I. S. “Development and Validation of RP-
HPLC method for the Simultaneous estimation of Meloxicam and Paracetamol”. Int. J.
Drug Dev. & Res., 2013; 5(4): 280-285.
22. Pyka A., Budzisz M. and Dolowy M. “Validation Thin Layer Chromatography for the
Determination of Acetaminophen in Tablets and Comparison with a Pharmacopeial
Method”. Biomed ResInt, 2013; 1-10.