Embed Size (px)
Citation preview

18th International Symposium on the Application of Laser and Imaging Techniques to Fluid Mechanics・LISBON | PORTUGAL ・JULY 4 – 7, 2016
In-Cylinder Flow Measurement in SI Engine under Firing Conditions by High Speed PIV
Yuji Ikeda1,*, Takashi Furui1, Minh Khoi Le1, Atsushi Nishiyama1 1: Imagineering, Inc., 7-4-4 Minatojima-Minami, Chuo, Kobe, Japan
* Correspondent author: [email protected]
Keywords: High speed PIV, Flame propagation, Planer laser tomography
ABSTRACT
In this study, a simultaneous measurement technique of in-cylinder flow and flame propagation were developed and discussed in order to evaluate the relationship between flow field and flame propagation in the same cycle. The high-speed PIV technique was applied to evaluate the in-cylinder velocity and turbulence distribution under firing condition. The flame front configuration was extracted from the PIV image based on planar laser tomography method. The strong contrast between the intensity of burned and unburned region in the captured images due to low gas and seed density of the former was utilized to derive this flame front. A 500 cc single-cylinder optical engine was used for this experiment. The bore diameter and stroke length were 86 mm and 86 mm respectively, and compression ratio was 10.4. To improve PIV and flame detection near the pent roof and spark plug, reflection light from the surface of the cylinder head was reduced by using the black paint. The interferences from flame emission was removed using an appropriate band-pass filter. The amount of seeding particles and laser power was also adjusted to maintain the integrity of PIV data while still obtaining good contrast of intensity in burned and unburned region. The reliability of the high-speed PIV data under firing condition were also analyzed and discussed. The interrogation area was decided as 32 x 32 pixels by confirming the valid vector fraction and velocity profile around the flame front. Based on the power spectrum of instantaneous velocity, cutoff frequency was selected at 300 Hz to analyze turbulent intensity. Using these diagnostics and analysis settings, crank-angle-resolved evolution of velocity and turbulence intensity distribution were measured and analyzed for both motoring and firing condition at 1200 rpm. The PIV data was taken at 7.2 kHz repetition frequency, corresponding to one crank-angle degree resolution at 1200 rpm. After the ignition timing, the velocity in the unburned region increased under the effect of flame propagation and strong turbulence were observed in same region.
1. Introduction To satisfy strict fuel economy regulation, thermal efficiency improvement is one of the most desirable quality to be achieved for gasoline engines. The key technologies to realize this involve increases in compression ratio and ultra-lean combustion. However, the former results in engine knocking by self-ignition of unburned mixture. Although increasing the flame propagation speed is one way to reduce knocking, dilution of air-fuel mixture via lean burning and EGR often makes

18th International Symposium on the Application of Laser and Imaging Techniques to Fluid Mechanics・LISBON | PORTUGAL ・JULY 4 – 7, 2016
the ignition unstable and decrease flame propagation speed. To achieve stable ignition under lean condition, new ignition technologies, such as high-energy ignition and non-thermal plasma ignition [1-5], have been developed. Furthermore, turbulence has been shown to be advantageous for lean combustion [6]. Therefore, long-stroke engines with higher piston speed and high-tumble engines have been developed to make strong turbulence inside the cylinder. Figure 1 illustrates the hypothesized optimum flow transition during the compression stroke. At the ignition timing, the bulk flow fully transitioned to turbulence, the turbulence intensity is maximized, and the turbulence scale is minimized. This requires higher momentum in the initial bulk flow. The intensity and transition timing of strong small-scale turbulence and its control are also important. To optimize the turbulent flow field at the ignition timing, we must understand how the in-cylinder bulk flow is generated during the intake process and how the cascade transition is accomplished during the compression stroke. Many successful approaches for measuring the flow field in internal combustion engines and turbo machineries have been reported [7–25]. Laser Doppler Anemometry (LDA/LDV) and particle image velocimetry (PIV) have been utilized extensively to evaluate in-cylinder flow of internal combustion engines. LDV is a time-domain measurement method and can achieve high sampling rate. The turbulent intensity and scale can be commonly calculated from LDV by separating the low and high frequency velocity component of the instantaneous velocity with temporal filter. Being a point-measurement technique, the experiments must be performed at various the measurement points in order to study the spatial distribution of the flow field by LDV. On the other hand, PIV is a spatial-domain measurement method and two-dimensional velocity distribution is captured. The turbulence is calculated by separating the low and high frequency
BDC TDCCrank angle
Inde
x va
lue
Turbulent energy: Max
Turbulent scale: Min.
Mean velocity = 0

18th International Symposium on the Application of Laser and Imaging Techniques to Fluid Mechanics・LISBON | PORTUGAL ・JULY 4 – 7, 2016
Fig. 1 Concept of in-cylinder flow optimization
velocity component using spatial filtering. Recently, high-speed PIV have become increasingly popular in which the velocity distribution can be measured with high sampling rate. Instead of spatial filtering, turbulence has been calculated with temporal filter [17]. Previously, we measured and evaluated the in-cylinder flow transition and turbulence characteristics near the spark location during compression stroke by using PIV and LDV in order to understand the generation of in-cylinder bulk flow during the intake stroke, cascade transition during compression stroke and optimized turbulence flow field at ignition timing [22]. The study was done in an optical engine and the combination of PIV and LDV has enabled the evaluation in-cylinder flow time history. In particular, spatial distribution of in-cylinder flow characteristics were evaluated by PIV and time-frequency analysis of flow at a local point was made by LDV: Two-dimensional velocity distribution and qualitative turbulent distribution were obtained from PIV measurement while time series velocity fluctuation and qualitative turbulent intensity at local point were obtained from LDV measurement. The study focused on the turbulent characteristics around the spark location. We have developed a plug-in type LDV probe in order to evaluate the flow field near the spark location [23]. Extremely compact LDV optics were designed and installedin a spark plug and this system can be readily used in an actual production engine under firing conditions. The plug-in LDV probe was directly installed in the spark plug hole without any modification to the engine head. The experiments were conducted under both motoring and firing conditions and the effects of engine speed, cutoff frequency, data sampling rate, required cycle number were discussed. In addition, the effect of engine speed on turbulent intensity around the ignition timing was investigated. Our previous and current works are summarized in Fig. 2. Most of the previous works about in-cylinder flow measurement of internal combustion engines were conducted under motoring condition without combustion inside optical engines. However, in practical engine operating condition with combustion, the fuel and residual gas co-exist and mix with the intake air during intake and compression stroke, inducing differences to the flow field comparing to non-firing condition. Moreover, the effect of residual gas and flame on flow field was also not discussed in details in literature. The knowledge base of these phenomena requires further detailed updates to continue the development of internal combustion engines. In the present study, we applied high-speed PIV technique in order to measure and evaluate the in-cylinder flow under firing conditions to discuss not only the flow field during intake and compression stroke but also their effect on flame propagation under firing conditions. The results

18th International Symposium on the Application of Laser and Imaging Techniques to Fluid Mechanics・LISBON | PORTUGAL ・JULY 4 – 7, 2016
of the measurement techniques also enable the analysis of many more aspects regarding in-cylinder phenomena, some of which are shown in Fig. 3.
Fig. 2 Previous and current work for in-cylinder flow measurement and evaluation
Fig. 3 Discussion items from simultaneous measurement of flow field and flame propagation by
high speed PIV under firing condition
Motoring Firing
LDV
PIV ◎(This paper)
2012[22]
540deg 570deg 600deg 630deg 660deg
600r
pm80
0rpm
1000
rpm
1200
rpm
0 0.5 1 1.5 2 2.5 3 3.5 4 4.5 5
Vortex center
m/s
Ex In
Ex In
Ex In
Ex In
Y,m
m
-20 -10 0 10 20-70
-60
-50
-40
-30
-20
-10
0
570deg585deg600deg
615deg
630deg
645deg
660deg
675deg
600rpm
-20 -10 0 10 20-70
-60
-50
-40
-30
-20
-10
0
555deg570deg
585deg600deg
615deg
630deg
645deg
660deg
675deg
800rpm
-20 -10 0 10 20-70
-60
-50
-40
-30
-20
-10
0
555deg570deg
585deg
600deg
615deg
630deg
645deg
660deg
675deg
1000rpm
-20 -10 0 10 20-70
-60
-50
-40
-30
-20
-10
0
540deg
555deg570deg
585deg
600deg
615deg
630deg
645deg
660deg 675deg
1200rpm
Vortex center
2014[23]
0
200
400
600
800
500 1000 1500 2000
Cut
off f
requ
ency
, Hz
Engine speed, rpm
Motoring, WOTFiring, Pin=58kPa, A/F=14.7
Large scale flow- Tumble flow Small scale flow
- Turbulence intensity- Turbulence scale
Flame interaction to unburned gas flow
Vortex center
Stretch of spark discharge Flame shift
Heat transfer to the wall
Flame front- Propagation speed- Reaction zone thickness
【Reliability of high speed PIV results under firing condition】- Optimization and establishment of measurement and data analysis method【Intake ~ Ignition timing】- Difference in flow field between motoring and firing condition⇒ Effect of residual gas on flow field (mean flow, turbulence intensity and scale, cyclic variation【After ignition timing】- Effect of flow field on spark discharge, flame propagation, heat release and combustion duration⇒ Large scale flow effect on spark stretch and flame shift
Turbulence effect on flame configuration, propagation speed and reaction zone thicknessCorrelation between turbulence distribution and combustion duration
- Effect of flame on flow of unburned mixture⇒ Flame enhances or decays turbulence of unburned mixture?
- Heat transfer from flame to wall (surface of piston top and cylinder head)⇒ Flame attachment timing, area and flow field【Effect of engine operating conditions】- Effect of engine speed, load, A/F, EGR rate⇒ Turbulence field and flame configuration, cyclic variation

18th International Symposium on the Application of Laser and Imaging Techniques to Fluid Mechanics・LISBON | PORTUGAL ・JULY 4 – 7, 2016
During intake and compression stroke before ignition, the differences in flow field between motoring and firing condition need to be discuss. For firing case, residual gas exists and its effect on flow field, such as mean flow, turbulence intensity and scale, as well as cyclic variation should be investigated. After the ignition timing, one of the most interesting topics is the effect of flow field on spark discharge, flame propagation speed, heat release and combustion duration. The large scale flow will stretch the spark discharge and shift the propagating flame. The small scale vortex will affect flame configuration and reaction zone thickness. The correlation between flow field and flame propagation in the same cycle can provide the clear indication of the optimum velocity and turbulence distribution in-cylinder to realize faster flame propagation and combustion. As a result, detail analysis in these area can provide valuable information for engine design to improve the thermal efficiency. Another point of interest is the effect of flame propagation on the flow field in unburned mixture. Does the flame enhance or decay the turbulence of unburned mixture? Enhancement in the understanding of physical phenomena and accuracy of engine combustion simulations can be obtained from such results. Furthermore, heat loss is the one of the more important issues for thermal efficiency improvement and the information regarding on flame attachment to the wall as well as the corresponding velocity can help explain the heat transfer between flame wall (surface of piston top and cylinder head). The variations of these aforementioned effects with different engine operating conditions, in particular ultra-lean and high exhaust gas recirculation (EGR), can help provide useful directions in terms of engine design optimization. Nevertheless, the reliability of high-speed PIV results under firing conditions must be justified first before valid detail discussion of these phenomena. The measurement and data analysis methodologies have to be optimized and established. In this study, we have succeed in measuring the instantaneous velocity, flame propagation and combustion pressure inside the cylinder simultaneously by high-speed PIV under firing condition. Analysis methodologies and the reliability of this measurement method was first discussed and the crank angle change of the velocity and turbulence intensity distribution were then measured for a comparison between motoring and firing conditions. 2. Experimental setup and experimental condition Figure 4 illustrated the schematic of the high-speed PIV measurement system. Corresponding details on each component are also annotated in this figure. The Nd: YLF laser with 527 nm wavelength and 20 kHz maximum repetition frequency was used as light source. The laser beam

18th International Symposium on the Application of Laser and Imaging Techniques to Fluid Mechanics・LISBON | PORTUGAL ・JULY 4 – 7, 2016
were re-directed and introduced near the optical engine by a laser guide arm. The laser beam was made into a sheet configuration by a series of lenses at the tip of the guide arm. The laser sheet
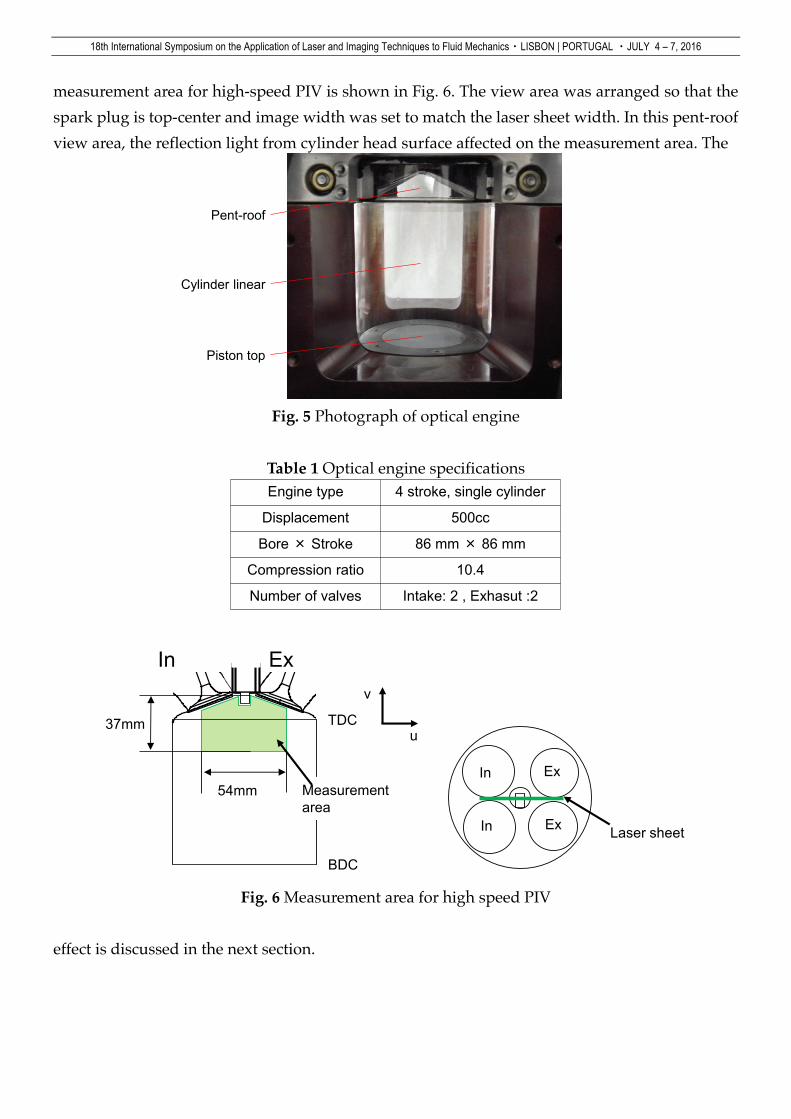
Fig. 4 Schematic diagram and key issues for high speed PIV system under firing condition was exposed into the cylinder by reflecting off a 45-degree mirror below the elongated piston and through the optical quartz-window at the piston top. The camera for high-speed PIV measurement had 1280 x 800 pixels and synchronized with laser operation. The seeding particle was introduced into the intake air flow upstream of the intake system of the optical engine to ensure the homogeneous mixing and trace to the intake air motion. The in-cylinder pressure data were taken with synchronization of PIV measurement. The optimization of high-speed PIV measurement and flame front detection method is discussed in detail in the next section. Figure 5 is a photograph of the optical test engine, and Table 1 lists the engine specifications. The test engine for this study was a single-cylinder optical engine. The bore diameter was 86 mm, the stroke length was 86 mm. The displacement was 500 cc and the compression ratio was 10.4. The engine had a quartz window in the pent roof, a quartz liner, and a quartz window at the top of the piston. The diameter of optical window at piston top was 54 mm. As a result, the in-cylinder flow along a vertical cross-section can be observed during a complete stroke. In this study, we focused on the in-cylinder flow from latter part of compression stroke to initial flame propagation. The
Seeding・Selection of seed particle- Material, diameter, traceability, burning resistance・Optimization of seed supply- Quantity, stability, supply air・Avoidance of deposition
Laser・Optimization- Laser sheet thickness- Laser power- Repetition rate- Time interval
Camera・Reduction of background noise- Reflection light, flame emission・Vibration resistance
Control/Analysis・Control- Calibration, synchronization,
noise protection・Analysis- Optimization of parameters
(Interrogation area, averaging, cut-off frequency)
- Extract of flame shape
Engines・Optical access- Optical windows, view area・Firing operation
Optics・Vibration resistance・Reduction of reflection・Enlargement of measurement area
18th International Symposium on the Application of Laser and Imaging Techniques to Fluid Mechanics・LISBON | PORTUGAL ・JULY 4 – 7, 2016
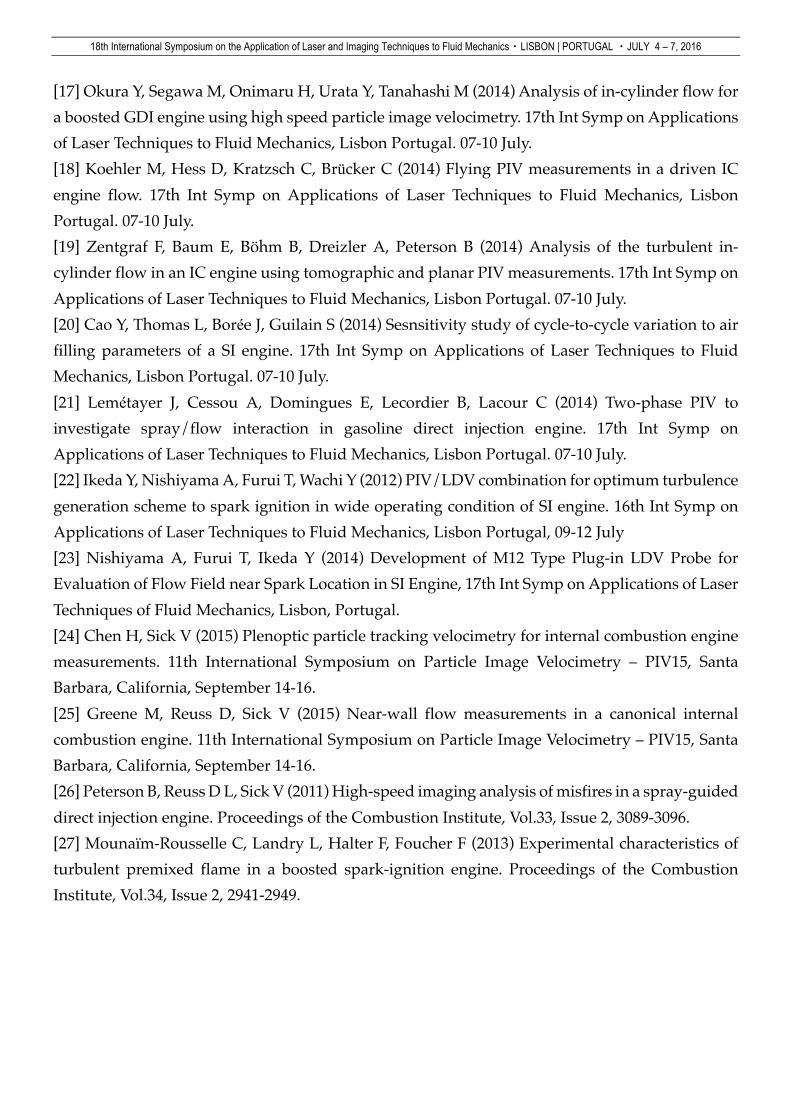
measurement area for high-speed PIV is shown in Fig. 6. The view area was arranged so that the spark plug is top-center and image width was set to match the laser sheet width. In this pent-roof view area, the reflection light from cylinder head surface affected on the measurement area. The
Fig. 5 Photograph of optical engine
Table 1 Optical engine specifications
Fig. 6 Measurement area for high speed PIV
effect is discussed in the next section.
Piston top
Cylinder linear
Pent-roof
Engine type 4 stroke, single cylinder
Displacement 500cc
Bore × Stroke 86 mm × 86 mm
Compression ratio 10.4
Number of valves Intake: 2 , Exhasut :2
In ExIn Ex
TDC
BDC
Measurement area
37mm
54mm
u
v
Laser sheet
Ex
Ex
In
In

18th International Symposium on the Application of Laser and Imaging Techniques to Fluid Mechanics・LISBON | PORTUGAL ・JULY 4 – 7, 2016
The engine operating condition is shown in table 2. The engine speed was 1200 rpm and absolute intake pressure was 60 kPa. The experiments were conducted at both motoring and firing conditions. For motoring conditions, fuel injection and spark ignition were not operated. For firing conditions, air-fuel ratio and ignition timing were set to 14.7 and 15 deg.BTDC respectively.
Table 2 Engine operating condition
3. Results and discussion 3.1 General diagnostics setup considerations First, the engine was installed with balancers and dampers to minimize vibrations and eliminate any influences it can have on PIV arrangement. The results are confirmed to be free of vibration-induced errors, proving the effectiveness of this strategy. For PIV measurement, selection of the seeding particle is important to achieve high quality data. Especially in this study, burning resistance is required because the seeding is exposed in the combustion gas with high temperature. Therefore, solid particle with burning resistance is the main candidate for this work. The outer diameter of the seeding particle must be selected by means of signal intensity and traceability. The larger diameter is desirable for strong signal intensity while smaller diameter and lower density is desirable for high traceability. From these considerations, the SiO2 particle with 4 µm outer diameter was selected. The traceability of this particle is enough for kHz order and has been proven by LDV measurement previously under similar engine operating condition. As shown in Fig. 7 (a), the reflection light from the surface of the combustion chamber becomes problem and can consequently reduce the desired measurement area of PIV. The reflection light also scatters on the optical window at pent roof. Conventional lack paint was used to reduce the reflectiveness of the cylinder head surface and reflection light was hence minimized with the measurement area significantly improved as shown in Fig. 7 (b). This black paint can endure the high pressure and temperature under firing condition in this study. 3.2 Flame front detection
Engine operating mode Motoring Firing
Engine speed, rpm 1200 1200
Pintake, kPa 60 60
A/F - 14.7
Spark timing, deg.BTDC - 15

18th International Symposium on the Application of Laser and Imaging Techniques to Fluid Mechanics・LISBON | PORTUGAL ・JULY 4 – 7, 2016
In this study, flame imaging inside an optical SI engine is carried out using flame front imaging by a pseudo-planar laser-tomography set-up. After the ignition, the flame initiates and flame emission becomes the background noise for PIV measurement. Furthermore, the seeding around the flame scatters the flame emission in the different position from the laser sheet plane. A bandpass filter at the PIV laser wavelength of 527nm is applied in front of the high-speed CMOS – PIV camera to isolate the signal from the interferences of chemiluminescence and flame natural luminosity emission. The effect of band pass filter is shown in Fig. 8. Furthermore, using the band pass filter, the contrast of burned and unburned region is enhanced and flame front was observed. Therefore, both PIV data and flame tomography can be captured simultaneously using one camera high-speed PIV setup. The images captured can be used for both flow field and flame analysis to provide a cycle-resolved flame-flow interaction investigation. In contrast to other tomography/PIV set up [26-28], after combustion occurred, the burned gas altered the seed and gas density, creating an intensity gradient between burned and unburnt region. The SiO2 seeds were not burned off during combustion unlike oil droplets seeds and the integrity of flame front region captured in the images can be maintained. A sample image of high-speed PIV/tomography imaging captured at TDC (15 deg.CA after ignition timing) and the algorithm of flame front extraction are shown in Fig. 9. The flame front and its geometrical features were extracted and derived using a series of image processing steps. The flame front extraction processing involves the use of both automated, in-house developed algorithm and manual visual inspections of the captured images. As the images in this study focus on the tumble-plane view, the area bounded by the pent-roof access window is used to define the region-of-interest for the flame analysis. First, the images are inverted and background subtraction is applied. A median filter is then applied to eliminate artefacts due to scattered light from PIV seeds and laser reflection. An appropriate image intensity range and results of filtering is verified by visual inspections and binary conversion using
(a) Without paint (b) With paint
Fig. 7 Reflection light image at -360 deg.ATDC (1200 rpm, Pin=60 kPa, A/F=14.7, ignition timing=15 deg.BTDC)
Reflection light

18th International Symposium on the Application of Laser and Imaging Techniques to Fluid Mechanics・LISBON | PORTUGAL ・JULY 4 – 7, 2016
(a) Without band pass filter (b) With band pass filter
Fig. 8 Effect of band pass filter on PIV images at 10 deg.ATDC (1200 rpm, Pin=60 kPa, A/F=14.7, ignition timing=15 deg.BTDC)
Fig. 9 Algorithm of flame front extraction with sample image at 15 deg.ATDC
(1200 rpm, Pin=60 kPa, A/F=14.7, ignition timing=15 deg.BTDC) Otsu’s threshold method is finally applied to extract the flame front. Additional visual inspection of the flame front and the original image is again performed to eliminate obvious errors due to laser intensity fluctuations. The resulted flame front is used to derive the projected flame area, the equivalent flame radius R and global flame-growth speed dR/dt. To reduce potential large error, the image processing stops once the piston goes out of the region interest, which is at 10 deg.ATDC. 3.3 PIV data analysis and validation for flow field
Invert and background subtraction
Display range optimized and boost
Binarisation (Otsu’s threshold)+ spark plug correction
Boundaries selected

18th International Symposium on the Application of Laser and Imaging Techniques to Fluid Mechanics・LISBON | PORTUGAL ・JULY 4 – 7, 2016
For PIV data analysis, the interrogation area is important to determine the spatial resolution and reliability of vectors. Here, the velocity vector map was calculated and investigated with a variations of the interrogation area. The result is shown in Fig. 10. Figure 10 (a) is the vector map for each interrogation area of 16, 32 and 64 pixels. The blue and red vector indicates the valid and error vector respectively. Here, the smaller interrogation area results in high spatial resolution but the error vector with red color exits. The spatial resolution became low but error vector decreased with larger interrogation area. Figure 10 (b) indicated the valid vector fraction around top dead center for each interrogation area. The valid vector fraction is almost over 95 % for interrogation area for 32 and 64 pixels and 90% for interrogation area for 16 pixel. There effect does not vary much across different crank angle timings. Another investigation of the interrogation area effect is shown in Figure 11. Here, the effect of interrogation area on the velocity around flame front was investigated because the existence of strong intensity contrast may affect the velocity of burned and unburned mixture around the flame front. Figure 11 (a) shows the sample image of high- speed PIV measurement at 3 deg. ATDC under firing condition. The velocity profile of two
(a) Vector map at 0 deg.ATDC (TDC)
10 m/s
Interrogation area
16 x 16 pixels
32 x 32 pixels
64 x 64 pixels
Valid vectorError vector
Intake Exhaust

18th International Symposium on the Application of Laser and Imaging Techniques to Fluid Mechanics・LISBON | PORTUGAL ・JULY 4 – 7, 2016
(b) Valid vector fraction
Fig. 10 Effect of interrogation area on vector calculation (1200 rpm, Pin=60 kPa, A/F=14.7, ignition timing=15 deg.BTDC)
(a) Vector map and flame front image at 3 deg.ATDC
80
85
90
95
100
-60 -40 -20 0 20 40 60
Valid
vec
tor f
ract
ion,
%
Crank angle, deg.ATDC
Interrogation area, pixels16 x 1632 x 3264 x 64
16 pixel
Flame front at laser pulse 1
Flame front at laser pulse 2
u
v
Line A
Line B
Burned regionUnburned region
Intake Exhaust

18th International Symposium on the Application of Laser and Imaging Techniques to Fluid Mechanics・LISBON | PORTUGAL ・JULY 4 – 7, 2016
(b) Effect of interrogation area on velocity around flame front
Fig. 11 Effect of flame on vector calculation (1200 rpm, Pin=60 kPa, A/F=14.7, ignition timing=15 deg.BTDC)
randomly chosen line A and B around the flame front was investigated with different interrogation area of 16, 32 and 64 pixels as shown in Figure 11 (b). For both line A and B, the velocity profiles showed almost the same trend with different interrogation areas. This suggests that the velocity gradient before and after flame front is not significant. Following the results in Fig. 10 and 11, the interrogation area was fixed to 32 pixel in this study. In order to discuss about turbulence, the low and high frequency velocity component has to be separated from the instantaneous velocity. When the temporal filter is utilize, the temporal cutoff frequency need to be determined. Many studies have investigated the selection of the cutoff frequency for turbulent velocity estimation in internal combustion engines, which are still a relatively arbitrary process. In this study, the power spectrum at four measurement point (A, B, C and D) was investigated in order to determine the cutoff frequency as shown in Figure 12. The power spectrum of the velocity data calculated with fast Fourier transformation (FFT) method. The graph shows the power spectrum of instantaneous velocity of average of 19 cycles. Around the frequency of 300 Hz, the power spectrum has an inflection point and it indicates that the variability characteristic of velocity changed at this frequency. For LDV measurement in the same optical engine under near engine operating condition, the inflection point in the power spectrum was also around 300 Hz [23]. Therefore, the cutoff frequency of this engine operating condition has been selected to be 300 Hz.
3.4 Flow field variations between motoring and firing conditions
-15
-10
-5
0
-7 -5 -3 -1 1 3
u, m
/s
x, mm
-15
-10
-5
0
-7 -5 -3 -1 1 3
u, m
/s
x, mm
Line A Line B
Flame front Flame front
Interrogation area, pixels16 x 1632 x 3264 x 64
Interrogation area, pixels16 x 1632 x 3264 x 64
Burned UnburnedBurned Unburned

18th International Symposium on the Application of Laser and Imaging Techniques to Fluid Mechanics・LISBON | PORTUGAL ・JULY 4 – 7, 2016
Following the considerations in previous sections, the experimental and analysis condition was decided as shown in Table 3. Sampling frequency was set to 7.2 kHz which corresponds to one crank angle degree resolution at 1200 rpm engine speed condition. The interrogation area of 32 x 32 pixels equals to 1.5 x 1.5 mm of spatial resolution under firing condition. The measurement results of high-speed PIV under motoring and firing condition are shown in Fig.
Table 3 Experimental and analysis condition of high speed PIV setup
13 and 14. The measurement was done for 19 cycles and the representative cycles for each motoring and firing case are selected. Figure 13 illustrates the crank angle change of the velocity distribution of low frequency component every 5 deg. CA. For motoring case in Fig. 13 (a), the bulk flow of tumble flow with clockwise rotation movement is shown as indicated with red arrow lines and dot. This tumble flow stays in the left side of combustion chamber and still remained at 25 deg. ATDC. In the right side of the combustion chamber, some small-sized vortices appeared during compression, and then decayed and diminished after top dead center (TDC). For firing condition shown in Fig. 13 (b), a large scale flow of tumble flow existed and some small vortices were in the right side of combustion chamber before ignition timing. The tendency for these tumbles was roughly the same as the motoring case. After the ignition timing, the flame initiated and propagated. The flame shifted exhaust side (right hand side) due to the clockwise rotation of tumble flow. As the flame growth, the tumble flow diminished and the strong directional flow toward the circumference of the combustion chamber occurred. This strong flow may be caused by the flame propagation to the surrounding unburned mixture. Figure 14 illustrates the crank-angle resolved evolution of the turbulence intensity distribution. For brevity of the figures, images were presented every 5 deg. CA. Before the ignition timing at -15 deg. BTDC, the tendency is almost same for motoring and firing cases. After the ignition timing, the turbulent intensity monotonically decreased for motoring case. However, strong turbulence intensity region initiated in the unburned region around the flame front for firing case. This strong turbulence related to the
Sampling frequency 7.2 kHzCrank angle resolution 1 deg.CA (@1200 rpm)Image size 1280×800 pixels (59×37mm)Spatial resolution 0.046×0.046 mm Seeding particle SiO2, Diameter: 4 µmMeasurement cycle number 19 (Consecutive)Interrogation area 32×32 pixels (1.5×1.5 mm)Overlap 50 %

18th International Symposium on the Application of Laser and Imaging Techniques to Fluid Mechanics・LISBON | PORTUGAL ・JULY 4 – 7, 2016
high velocity region in Fig.14 (b), and these data indicated that the flame initiate the velocity and turbulence of unburned mixture. Further detailed analysis of velocity and turbulence intensity pattern and flame propagation and combustion duration should provide deeper understanding about the flow interaction on combustion. In the current study, despite some subtle differences hinting at certain phenomena, we cannot find big difference for motoring and firing before the ignition timing. This, however, could be the result of the engine operating condition in this study: stable condition with low engine speed, low-load and stoichiometry operating condition. Our future application of this measurement technique to stronger tumble, ultra-lean or high EGR condition will help reveal the effect of residual gas and cyclic variations and improve the current understanding in the field. 4. Summary In this study, in-cylinder flow field and flame propagation were successfully measured under firing condition simultaneously by high-speed PIV. The selection of seeding particle,

18th International Symposium on the Application of Laser and Imaging Techniques to Fluid Mechanics・LISBON | PORTUGAL ・JULY 4 – 7, 2016
(a) Motoring (b) Firing
Fig. 13 Effect of flame on vector calculation
Intake Exhaust
-45 deg.ATDC
-35
-25
-15(Ignition timing)
5m/sIntake Exhaust
-5
5
15
25

18th International Symposium on the Application of Laser and Imaging Techniques to Fluid Mechanics・LISBON | PORTUGAL ・JULY 4 – 7, 2016
(1200 rpm, Pin=60 kPa, A/F=14.7, ignition timing=15 deg.BTDC)
(a) Motoring (b) Firing
0 0.5 1Intake Exhaust Intake Exhaust
[m/s]
-45 deg.ATDC
-35
-25
-15(Ignition timing)
-5
5
15
25

18th International Symposium on the Application of Laser and Imaging Techniques to Fluid Mechanics・LISBON | PORTUGAL ・JULY 4 – 7, 2016
Fig. 14 Effect of flame on turbulence intensity distribution
(1200 rpm, Pin=60 kPa, A/F=14.7, ignition timing=15 deg.BTDC) measurement area, and extraction of flame front, interrogation area as well as cutoff frequency were investigated to optimize for flow field - flame analysis from high-speed PIV measurement coupled with simultaneous flame imaging during a combustion event. The solid particle of SiO2 with 4 µm diameter is selected due to its burning resistance, signal intensity and traceability. The reflection light from the surface of cylinder head has been successfully decreased using black paint. The effect of flame emission has also been removed using the band-pass filter at the laser wavelength and flame front has been successfully extracted simultaneously from PIV results by an in-house developed image processing algorithm. An appropriate interrogation area of 32 x 32 pixels has been chosen by confirming the valid vector fraction and velocity profile around flame front. The cutoff frequency has also been determined to analyze turbulent intensity using the calculated power spectrum of instantaneous velocity. Interestingly, the cutoff frequency determined from high-speed PIV result is almost the same as that obtained by LDV measurement. The crank-angle resolved evolution of velocity and turbulent intensity distribution from a certain representative cycle was compared between motoring and firing conditions. After ignition timing, the flame increases the velocity in unburned region and strong turbulence region occurred. For future work, the detailed analysis on the relationship between flow field and flame propagation, as well as the effect of different engine operating conditions with high-engine speed, high-load, lean and high EGR condition will be further investigated. References [1] Alger T, Gingrich J, Roberts B, Mangold B, Sellnau M (2013) A high-energy continuous discharge ignition system for dilute engine applications. SAE Technical Paper, No. 2013-01-1628. [2] Shiraishi T (2012) Possibility of the new ignition system using the low temperature plasma having dual function of strengthening ignition for SI combustion and promoting and controlling autoignition of HCCI combustion. 1st International Conference: Advanced Ignition System for Gasoline Engines. [3] Burrows J B, Mixell K, Reinicke P-B, Riess M, Sens M (2014) Corona ignition – Assessment of physical effects by pressure chamber, rapid compression machine, and single cylinder engine testing. 2nd International Conference on Ignition Systems for Gasoline Engines. [4] Weyand P, Lorenz F, Schilling S, Bernhaerd B, Hofmann P, Graf J, Hofherr T (2014) Adaptive continuous spark ignition as enabler for high dilution EGR operation. 2nd International Conference on Ignition Systems for Gasoline Engines.

18th International Symposium on the Application of Laser and Imaging Techniques to Fluid Mechanics・LISBON | PORTUGAL ・JULY 4 – 7, 2016
[5] Ikeda Y (2014) Development a microwave plasma ignition system with semiconductor microwave oscillator and combustion improvement in a practical SI engine. 2nd International Conference on Ignition Systems for Gasoline Engines. [6] Nogawa S, Nataka K, Mohammadi A (2012) Effect of ignition system on combustion. 1st International Conference: Advanced Ignition System for Gasoline Engines. [7] Dierksheide, U, Meyer, P., Hovestadt, T. and Hentschel, W (2001) Endoscopic 2D-PIV flow field measurements in IC engines. 4th International Symposium on Particle Image Velocimetry, Göttingen, Germany, September, PIV’01 Paper 1060. [8] Dierksheide, U., Meyer, P., Hovestadt, T. and Hentschel, W (2002), Endoscopic 2D particle image velocimetry (PIV) flow field measurements in IC engines. Experiments in Fluids, 2002. 33(6): p. 794-800. [9] Gindele, J. and Spicher, U. (1998) Investigation of In-Cylinder Flow inside IC Engines using PIV with Endoscopic Optics. Proceedings of the 9th International symposium on application of laser techniques to fluid mechanics, Lisbon, Portugal, July [10] Geis, T., Rottenkolber, G., Dittmann, M., Richter, B., Dullenkopf, K. and Wittig, S. (2002) Endoscopic PIV measurements in an enclosed rotor-stator system with pre-swirled cooling air. Proceedings of the 11th International symposium on application of laser techniques to fluid mechanics, Lisbon, Portugal, July [11] Krause, N., Zähringer, K. and Pap., E. (2005) Time-resolved particle image velocimetry for the investigation of rotating stall in a radial pump Experiments in Fluids 39, pp192-201 [12] Lang, H., Mørck, T., and Woisetschläger, J. (2002) Stereoscopic particle image velocimetry in a transonic turbine stage Experiments in Fluids, 32, pp 700-709 [13] Voges, M., Beversdorff, M., Willert, C.and Krain, H. (2007) Application of particle image velocimetry to a transonic centrifugal compressor Experiments in Fluids 43, pp371-384 [14] Westerweel, J. (2000) Theoretical analysis of the measurement precision in particle image velocimetry Experiments in Fluids 29 S3-S12 [15] Kegalj, M. and Schiffer, H.P. (2008) Endoscopic PIV Measurements in a Low Pressure Turbine Rig 14th International symposium on Applications of Laser Techniques to Fluid Mechanics Lisbon, Portugal, 07-10 July [16] Miles P C, RempelEwert B H, Reitz R D (2009) Experimental assessment of a nonlinear turbulent stress relation in a complex reciprocating engine flow. Experiments in Fluids Volume 47, Issue 3, 451-461.
18th International Symposium on the Application of Laser and Imaging Techniques to Fluid Mechanics・LISBON | PORTUGAL ・JULY 4 – 7, 2016
[17] Okura Y, Segawa M, Onimaru H, Urata Y, Tanahashi M (2014) Analysis of in-cylinder flow for a boosted GDI engine using high speed particle image velocimetry. 17th Int Symp on Applications of Laser Techniques to Fluid Mechanics, Lisbon Portugal. 07-10 July.[18] Koehler M, Hess D, Kratzsch C, Brücker C (2014) Flying PIV measurements in a driven IC engine flow. 17th Int Symp on Applications of Laser Techniques to Fluid Mechanics, Lisbon Portugal. 07-10 July. [19] Zentgraf F, Baum E, Böhm B, Dreizler A, Peterson B (2014) Analysis of the turbulent in-cylinder flow in an IC engine using tomographic and planar PIV measurements. 17th Int Symp on Applications of Laser Techniques to Fluid Mechanics, Lisbon Portugal. 07-10 July. [20] Cao Y, Thomas L, Borée J, Guilain S (2014) Sesnsitivity study of cycle-to-cycle variation to air filling parameters of a SI engine. 17th Int Symp on Applications of Laser Techniques to Fluid Mechanics, Lisbon Portugal. 07-10 July. [21] Lemétayer J, Cessou A, Domingues E, Lecordier B, Lacour C (2014) Two-phase PIV to investigate spray/flow interaction in gasoline direct injection engine. 17th Int Symp on Applications of Laser Techniques to Fluid Mechanics, Lisbon Portugal. 07-10 July. [22] Ikeda Y, Nishiyama A, Furui T, Wachi Y (2012) PIV/LDV combination for optimum turbulence generation scheme to spark ignition in wide operating condition of SI engine. 16th Int Symp on Applications of Laser Techniques to Fluid Mechanics, Lisbon Portugal, 09-12 July [23] Nishiyama A, Furui T, Ikeda Y (2014) Development of M12 Type Plug-in LDV Probe for Evaluation of Flow Field near Spark Location in SI Engine, 17th Int Symp on Applications of Laser Techniques of Fluid Mechanics, Lisbon, Portugal. [24] Chen H, Sick V (2015) Plenoptic particle tracking velocimetry for internal combustion engine measurements. 11th International Symposium on Particle Image Velocimetry – PIV15, Santa Barbara, California, September 14-16. [25] Greene M, Reuss D, Sick V (2015) Near-wall flow measurements in a canonical internal combustion engine. 11th International Symposium on Particle Image Velocimetry – PIV15, Santa Barbara, California, September 14-16. [26] Peterson B, Reuss D L, Sick V (2011) High-speed imaging analysis of misfires in a spray-guided direct injection engine. Proceedings of the Combustion Institute, Vol.33, Issue 2, 3089-3096. [27] Mounaïm-Rousselle C, Landry L, Halter F, Foucher F (2013) Experimental characteristics of turbulent premixed flame in a boosted spark-ignition engine. Proceedings of the Combustion Institute, Vol.34, Issue 2, 2941-2949.

18th International Symposium on the Application of Laser and Imaging Techniques to Fluid Mechanics・LISBON | PORTUGAL ・JULY 4 – 7, 2016
[28] Aleiferis P.G., Behringer M.K. (2015) Flame front analysis of ethanol, butanol, iso-octane and gasoline in a spark-ignition engine using laser tomography and integral length scale measurement. Combustion & Flame, Vol.162, Issue 12, 4371-4674.