Embed Size (px)
Citation preview
THE JOURNAL OF FINANCE • VOL. LXVI, NO. 5 • OCTOBER 2011
In Search of Attention
ZHI DA, JOSEPH ENGELBERG, and PENGJIE GAO∗
ABSTRACT
We propose a new and direct measure of investor attention using search frequencyin Google (Search Volume Index (SVI)). In a sample of Russell 3000 stocks from 2004to 2008, we find that SVI (1) is correlated with but different from existing proxies ofinvestor attention; (2) captures investor attention in a more timely fashion and (3)likely measures the attention of retail investors. An increase in SVI predicts higherstock prices in the next 2 weeks and an eventual price reversal within the year. It alsocontributes to the large first-day return and long-run underperformance of IPO stocks.
What information consumes is rather obvious: it consumes the attention ofits recipients. Hence, a wealth of information creates a poverty of attentionand a need to allocate that attention efficiently among the overabundanceof information sources that might consume it. “Designing Organizationsfor an Information-Rich World,” in Martin Greenberger, Computers, Com-munication, and the Public Interest [Baltimore, MD: The Johns HopkinsPress, 1971, 40–41]
Herbert Simon, Nobel Laureate in Economics
TRADITIONAL ASSET PRICING models assume that information is instantaneouslyincorporated into prices when it arrives. This assumption requires that
∗Da is with University of Notre Dame, Engelberg is with the University of California at SanDiego, and Gao is with University of Notre Dame. We thank Nick Barberis; Robert Battalio; AndriyBodnaruk; Zhiwu Chen; Jennifer Conrad; Shane Corwin; Mark Greenblatt; Campbell Harvey (theeditor); David Hirshleifer; Kewei Hou; Byoung-Hyoun Hwang; Ryan Israelsen; Ravi Jagannathan;Robert Jennings; Gabriele Lepori; Dong Lou; Tim Loughran; Ernst Schaumburg; Paul Schultz;Mark Seasholes; Ann Sherman; Sophie Shive; Avanidhar Subrahmanyam; Paul Tetlock; HeatherTookes; Annette Vissing-Jorgensen; Mitch Warachka; Yu Yuan; an anonymous associate editor; twoanonymous referees; and seminar participants at AQR Capital Management, HEC Montreal, Pur-due University, Singapore Management University, University of California at Irvine, Universityof North Carolina at Chapel Hill, University of Georgia, University of Hong Kong, University ofOklahoma, University of Notre Dame, Fifth Yale Behavioral Science Conference, the 2009 NBERMarket Microstructure meeting, Macquarie Global Quant Conference, 2009 Chicago QuantitativeAliance Academic Competition, 2010 American Finance Association, 2010 Crowell Memorial PrizePaper Competition, and Center of Policy and Economic Research (CEPR) European Summer Sym-posia for helpful comments and discussions. We thank Frank Russell and Company for providingus with the historical Russell 3000 index membership data, Dow Jones & Company for providingus with the news data, Market System Incorporated (MSI) for providing us with the Dash-5 data,and IPO SCOOP for providing us with the IPO rating data. We are grateful to Robert Battalio,Hyunyoung Choi, Amy Davison, Ann Sherman, and Paul Tetlock for their assistance with some ofthe data used in this study. Xian Cai, Mei Zhao, Jianfeng Zhu, and Mendoza IT Group providedsuperb resesarch assistance. We are responsible for remaining errors.
1461
1462 The Journal of Finance R©
investors allocate sufficient attention to the asset. In reality, attention is ascarce cognitive resource (Kahneman (1973)), and investors have limited atten-tion. Recent studies provide a theoretical framework in which limited attentioncan affect asset pricing statics as well as dynamics.1
When testing theories of attention, empiricists face a substantial challenge:we do not have direct measures of investor attention. We have indirect proxiesfor investor attention such as extreme returns (Barber and Odean (2008)),trading volume (Barber and Odean (2008), Gervais, Kaniel, and Mingelgrin(2001), and Hou, Peng, and Xiong (2008)), news and headlines (Barber andOdean (2008) and Yuan (2008)), advertising expense (Chemmanur and Yan(2009), Grullon, Kanatas, and Weston (2004), and Lou (2008)), and price limits(Seasholes and Wu (2007)). These proxies make the critical assumption thatif a stock’s return or turnover was extreme or its name was mentioned in thenews media, then investors should have paid attention to it. However, returnor turnover can be driven by factors unrelated to investor attention and a newsarticle in the Wall Street Journal does not guarantee attention unless investorsactually read it. This is especially true in the so-called information age where“a wealth of information creates a poverty of attention.”
In this paper, we propose a novel and direct measure of investor atten-tion using aggregate search frequency in Google and then revisit the rela-tion between investor attention and asset prices. We use aggregate searchfrequency in Google as a measure of attention for several reasons. First, In-ternet users commonly use a search engine to collect information, and Googlecontinues to be the favorite. Indeed, as of February 2009, Google accountedfor 72.1% of all search queries performed in the United States.2 The searchvolume reported by Google is thus likely to be representative of the inter-net search behavior of the general population. Second, and more critically,search is a revealed attention measure: if you search for a stock in Google, youare undoubtedly paying attention to it. Therefore, aggregate search frequencyin Google is a direct and unambiguous measure of attention. For instance,Google’s Chief Economist Hal Varian recently suggested that search data havethe potential to describe interest in a variety of economic activities in realtime. Choi and Varian (2009) support this claim by providing evidence thatsearch data can predict home sales, automotive sales, and tourism. Ginsberget al. (2009) similarly find that search data for 45 terms related to influenzapredicted flu outbreaks 1 to 2 weeks before Centers for Disease Control andPrevention (CDC) reports. The authors conclude that, “harnessing the col-lective intelligence of millions of users, Google web search logs can provideone of the most timely, broad-reaching influenza monitoring systems availabletoday” (p. 1014).
Google makes the Search Volume Index (SVI) of search terms public viathe product Google Trends (http://www.google.com/trends). Weekly SVI for a
1 See, for example, Merton (1987), Sims (2003), Hirshleifer and Teoh (2003), and Peng and Xiong(2006).
2 Source: Hitwise (http://www.hitwise.com/press-center/hitwiseHS2004/google-searches-feb-09.php)
In Search of Attention 1463
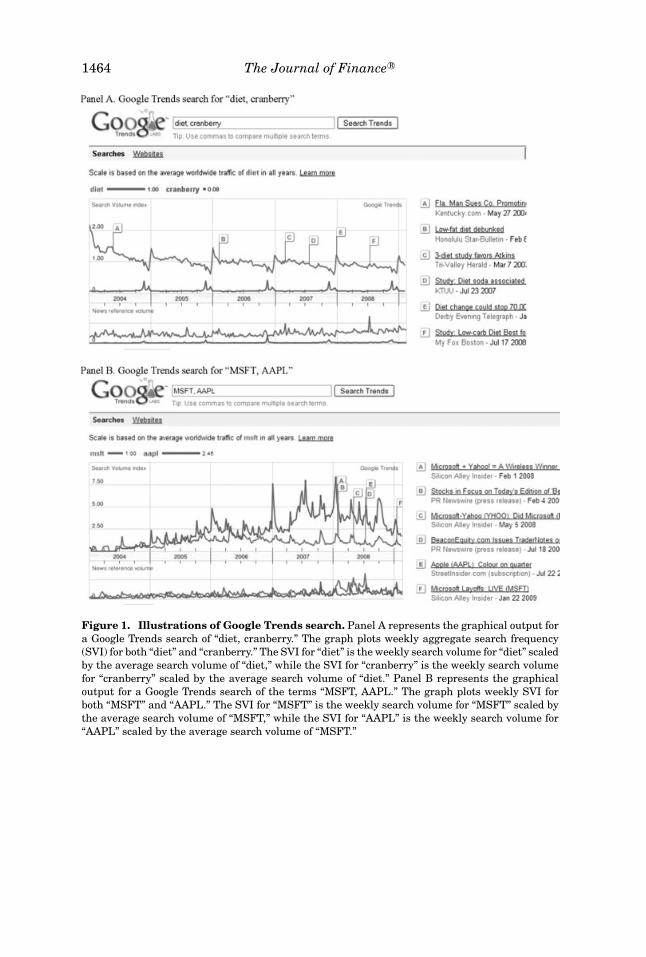
search term is the number of searches for that term scaled by its time-seriesaverage. Panel A of Figure 1 plots the weekly SVI of the two search terms“diet” and “ cranberry” for January 2004 to February 2009. The news referencevolumes are also plotted in the bottom of the figure. SVI appears to captureattention well. The SVI for “diet” falls during the holiday season and spikesat the beginning of the year, consistent with the notion that individuals payless attention to dieting during the holidays (November and December) butmore attention in January as part of a New Year’s resolution, where as theSVI for “cranberry” spikes in November and December, coinciding with theThanksgiving and Christmas holidays.
To capture attention paid towards particular stocks, we examine the SVIfor stock ticker symbols (e.g., “AAPL” for Apple Computer and “MSFT” forMicrosoft). After obtaining the SVI associated with stock ticker symbols forall Russell 3000 stocks, we proceed in three steps. First, we investigate therelationship between SVI and existing attention measures. We find that thetime-series correlations between (log) SVI and alternative weekly measuresof attention such as extreme returns, turnover, and news are positive on av-erage but the level of the correlation is low. In a vector autoregression (VAR)framework, we find that (log) SVI actually leads alternative measures such asextreme returns and news, consistent with the notion that investors may startto pay attention to a stock in anticipation of a news event. When we focus on ourmain variable, abnormal SVI (ASVI), which is defined as the (log) SVI duringthe current week minus the (log) median SVI during the previous eight weeks,we find that the majority of the time-series and cross-sectional variation inASVI remains unexplained by alternative measures of attention. We also findthat a stock’s SVI has little correlation with a news-based measure of investorsentiment.
Second, we examine whose attention SVI is capturing. Consistent withintuition, we find strong evidence that SVI captures the attention of indi-vidual/retail investors. Using retail order execution from SEC Rule 11Ac1-5(Dash-5) reports, we find a strong and direct link between SVI changes andtrading by retail investors. Interestingly, across different market centers, thesame increase in SVI leads to greater individual trading in the market centerthat typically attracts less sophisticated retail investors (i.e., Madoff) than inthe market center that attracts more sophisticated retail investors (i.e., NYSEfor NYSE stocks and Archipelago for NASDAQ stocks). This difference sug-gests that SVI likely captures the attention of less sophisticated individualinvestors.
Third, having established that SVI captures retail investor attention, we testthe attention theory of Barber and Odean (2008). Barber and Odean (2008)argue that individual investors are net buyers of attention-grabbing stocksand thus an increase in individual investor attention results in temporarypositive price pressure. The reasoning behind their argument goes as follows.When individual investors are buying, they have to choose from a large set ofavailable alternatives. However, when they are selling, they can only sell whatthey own. This means that shocks to retail attention should lead, on average,
1464 The Journal of Finance R©
Figure 1. Illustrations of Google Trends search. Panel A represents the graphical output fora Google Trends search of “diet, cranberry.” The graph plots weekly aggregate search frequency(SVI) for both “diet” and “cranberry.” The SVI for “diet” is the weekly search volume for “diet” scaledby the average search volume of “diet,” while the SVI for “cranberry” is the weekly search volumefor “cranberry” scaled by the average search volume of “diet.” Panel B represents the graphicaloutput for a Google Trends search of the terms “MSFT, AAPL.” The graph plots weekly SVI forboth “MSFT” and “AAPL.” The SVI for “MSFT” is the weekly search volume for “MSFT” scaled bythe average search volume of “MSFT,” while the SVI for “AAPL” is the weekly search volume for“AAPL” scaled by the average search volume of “MSFT.”
In Search of Attention 1465
to net buying from these uninformed traders. Within the framework of Barberand Odean (2008), a positive ASVI should predict higher stock prices in theshort term and price reversals in the long run. Furthermore, we expect to findstronger attention-induced price pressure among stocks in which individualinvestor attention matters the most.
Our empirical results based on ASVI as a measure of retail attention stronglysupport the hypotheses of Barber and Odean (2008). Among our sample ofRussell 3000 stocks, stocks that experience an increase in ASVI this weekare associated with an outperformance of more than 30 basis points (bps) ona characteristic-adjusted basis during the subsequent two weeks. This initialpositive price pressure is almost completely reversed by the end of the year.In addition, we find such price pressure to be stronger among Russell 3000stocks that are traded more by individual investors. The fact that we documentstrong price pressure associated with SVI even after controlling for a batteryof alternative attention measures highlights the incremental value of SVI. Infact, ASVI is the only variable to predict both a significant initial price increaseand a subsequent price reversal.
A natural venue to test the retail attention hypothesis is a stock’s initial pub-lic offering (IPO). IPOs follow the pattern predicted by the attention-inducedprice pressure hypothesis. As studied in Loughran and Ritter (1995, 2002),among many others, IPOs usually experience temporarily high returns fol-lowed by longer-run reversal. Moreover, many authors have suggested thesetwo stylized features of IPO returns are related to the behavior of retail in-vestors (Ritter and Welch (2002), Ljungqvist, Nanda, and Singh (2006), andCook, Kieschnick, and Van Ness (2006)). Because search volume exists priorto the IPO while other trading-based measures do not, SVI offers a uniqueopportunity to empirically study the impact of retail investor attention on IPOreturns.
We find considerable evidence that retail attention measured by search vol-ume is related to IPO first-day returns and subsequent return reversal. First,we find that searches related to IPO stocks increase by almost 20% during theIPO week. The jump in SVI indicates a surge in public attention consistentwith the marketing role of IPOs documented by Demers and Lewellen (2003).When we compare the group of IPOs that experiences large positive ASVI dur-ing the week prior to the IPO to the group of IPOs that experiences smallerASVI, we find that the former group outperforms the latter by 6% during thefirst day after the IPO and the outperformance is statistically significant. Wealso document significant long-run return reversals among IPO stocks thatexperience large increases in search prior to their IPOs and large first-dayreturns after their IPOs. These patterns are confirmed using cross-sectionalregressions after taking into account a comprehensive list of IPO character-istics, aggregate market sentiment, and an alternative attention measure ofmedia coverage, as discussed in Liu, Sherman, and Zhang (2009). Our resultsare different, however, from those in Liu, Sherman, and Zhang (2009), who findthat increased pre-IPO investor attention as measured by media coverage doesnot lead to price reversal or underperformance in the long run. The difference
1466 The Journal of Finance R©
in these two paper’s findings highlights the subtleties between news-based andsearch-based measures of investor attention.3
The rest of the paper is organized as follows. Section I describes data sourcesand how we construct the aggregate Google SVI variable. Section II comparesour SVI measure to alternative proxies of investor attention and examines ad-ditional factors that drive our SVI measure. Section III provides direct evidencethat SVI captures the attention of retail investors. Section IV tests the pricepressure hypothesis of Barber and Odean (2008) in various settings. Section Vconcludes.
I. Data and Sample Construction
Google Trends provides data on search term frequency dating back toJanuary 2004. For our analysis, we download the weekly Search Volume Indexfor individual stocks. To make the data collection and cleaning task manage-able, we focus on stocks in the Russell 3000 index for most of the paper. TheRussell 3000 index contains the 3,000 largest U.S. companies, representingmore than 90% of the total U.S. equity market capitalization. We obtain themembership of the Russell 3000 index directly from Frank Russell and Com-pany. To eliminate survivorship bias and the impact of index addition anddeletion, we examine all 3,606 stocks ever included in the index during oursampling period from January 2004 to June 2008. As Russell 3000 stocks arerelatively large stocks, our results are less likely to be affected by bid-askbounce. To further alleviate market microstructure-related concerns, we ex-clude stock-week observations for which the market price is less than threedollars when testing the attention-induced price pressure hypothesis.
Our next empirical choice concerns the identification of a stock in Google.A search engine user may search for a stock in Google using either its tickeror company name. Identifying search frequencies by company name may beproblematic for two reasons. First, investors may search the company namefor reasons unrelated to investing. For example, one may search “Best Buy”for online shopping rather than collect financial information about the firm.This problem is more severe if the company name has multiple meanings (e.g.,“Apple” or “Amazon” ). Second, different investors may search the same firmusing several variations of its name. For example, American Airlines is givena company name of “AMR Corp.” in CRSP. However, investors may search forthe company in Google using any one of the following: “AMR Corp,” “ AMR,”“AA,” or “American Airlines.”
Searching for a stock using its ticker is less ambiguous. If an investor issearching “AAPL” (the ticker for Apple Computer Inc.) in Google, it is likelythat she is interested in financial information about the stock of Apple Inc.
3 However, there is no inherent inconsistency in these two seemingly different results. SVI islikely to capture the attention of less sophisticated retail investors, while pre-IPO media coverageis likely to reflect information demand and attention of institutional investors, as suggested in Liu,Sherman, and Zhang (2009).
In Search of Attention 1467
Since we are interested in studying the impact of investor attention on tradingand asset pricing, this is precisely the group of people whose attention we wouldlike to capture. Since a firm’s ticker is always uniquely assigned, identifying astock using its ticker also avoids the problem of multiple reference names. Forthese reasons, we choose to identify a stock using its ticker for the majorityof our study. The only exception is when we examine IPO stocks. Because theticker is not widely available prior to the IPO, we search for the company usingits company name.
We are cautious about using tickers with a generic meaning such as “GPS,”“DNA,” “BABY,” “A,” “ B,” and “ALL.” We manually go through all the Russellstock tickers in our sample and flag such “noisy” tickers. These tickers areusually associated with abnormally high SVIs that may have nothing to dowith attention paid to the stocks with these ticker symbols. While we reportthe results using all tickers to avoid subjectivity in sample construction, weconfirm that our results are robust to the exclusion of the “noisy” tickers weidentified (about 7% of all Russell 3000 stocks).
Panel B of Figure 1 plots the SVI of Apple’s ticker (AAPL) against thatof Microsoft (MSFT). Two interesting observations emerge from this figure.First, we observe spikes in the SVI of “AAPL” in the beginning of a year.These spikes are consistent with increasing public attention coming from (1)the MacWorld conference that is held during the first week of January and(2) awareness of the company after receiving Apple products as holiday gifts.Second, SVIs are correlated with but remain different from news coverage.These two observations again support our argument that SVI indeed capturesinvestor attention and is different from existing proxies of attention.
To collect data on all 3,606 stocks in our sample (i.e., all stocks ever includedin the Russell 3000 index during our sample period), we employ a web crawlingprogram that inputs each ticker and uses the Google Trends’ option to downloadthe SVI data into a CSV file.4 We do this for all stocks in our sample. Thisgenerates a total of 834,627 firm-week observations. Unfortunately, GoogleTrends does not return a valid SVI for some of our queries. If a ticker is rarelysearched, Google Trends will return a zero value for that ticker’s SVI.5 Of our834,627 firm-week observations, 468,413 have a valid SVI.
For comparison, we also collect two other types of SVI. First, we collect SVIsbased on company name (Name SVI). We have two independent research as-sistants report how they would search for each company based on the company
4 To increase the response speed, Google currently calculates SVI from a random subset of theactual historical search data. This is why SVIs on the same search term might be slightly differentwhen they are downloaded at different points in time. We believe that the impact of such samplingerror is small for our study and should bias against finding significant results. When we downloadthe SVIs several times and compute their correlation, we find the correlations are usually above97%. In addition, we also find that if we restrict our analysis to a subset of SVIs for which thesampling error standard deviation reported by Google Trends is low, we get stronger results.
5 The truncation issue almost certainly works against us as we analyze price pressure in thispaper. As our empirical results suggest, price pressure is typically stronger among small stocks.These are precisely the set of stocks that, on average, will have less search and be removed fromthe sample due to Google’s truncation.
1468 The Journal of Finance R©
name in CRSP. Where there are differences between the reports, we use GoogleInsights’ “related search” feature to determine which query is most common.6
Unlike SVI, Name SVI is clearly affected by subjectivity. Second, we collectSVIs based on the main product of the company (PSVI). To identify the mainproduct, we follow the steps described in Da, Engelberg, and Gao (2010). Webegin by gathering data on firm products from Nielsen Media Research (NMR),which tracks television advertising for firms. NMR provides us a list of all firmsthat advertised a product on television during our sample period between 2004and 2008. We hand-match the set of firms covered in NMR to our Russell 3000stock sample. For each firm, we select its most popular product as measuredby the number of ads in the Nielsen database. Then, we consider how themain product might be searched in Google. We do this again by having twoindependent research assistants report how they would search for each prod-uct. Where there are differences between the reports, we use Google Insights’“related search” feature to determine which query is most common.
Our main news data come from the Dow Jones archive and comprise allDow Jones News Service articles and Wall Street Journal articles aboutRussell 3000 firms over our sample period. Each article in the data set isindexed by a set of tickers that we date-match to CRSP. A news observationat the weekly (monthly) level in our data set corresponds to a firm having anarticle in the archive during that week (month). To disentangle news from cov-erage (or less important stories from more important ones), we follow Tetlock(2010) and introduce a variable called Chunky News, which requires that aparticular story have multiple messages (i.e., the story is not released all atonce but instead in multiple “chunks” ). According to Tetlock (2010, p. 3538),“. . . stories consisting of more newswire messages are more likely to be timely,important, and thorough.” Finally, because the Dow Jones archive does notsystematically index (by ticker) a company’s news media coverage prior to itsIPO, we manually searched Factiva to obtain the media coverage attributes forthe IPO sample.
We collect all IPOs of common stocks completed between January 2004 andDecember 2007 in the United States from the Thompson Financial / ReutersSecurities Data Corporation (SDC) new issue database. We exclude all unitofferings, close-end funds, real estate investment trusts (REITs), AmericanDeposit Receipts (ADRs), limited partnerships (LPs), and stocks for which thefinal offering price is below five dollars. We also require the stock’s commonshares to be traded on the NYSE, Amex, or NASDAQ exchange with a validclosing price within 5 days of the IPO date.
We obtain the original SEC Rule 11Ac1-5 (Dash-5) monthly reports fromMarket System Incorporated (MSI, now a subsidiary of Thomson Financial /Reuters), which aggregates the monthly Dash-5 reports provided by all market
6 For each term entered into Google Insights (http://www.google.com/insights/), it returns 10“top searches” related to the term. According to Google, “Top searches refer to search terms withthe most significant level of interest. These terms are related to the term you have entered . . . oursystem determines relativity by examining searches that have been conducted by a large group ofusers preceding the search term you’ve entered, as well as after.”
In Search of Attention 1469
centers in the United States, and provides various transaction cost and exe-cution quality statistics based on the Dash-5 reports. The main variables ofinterest from the MSI database include the number of shares executed and thenumber of orders executed by each market center.
Other variables are constructed from standard data sources. Price andvolume-related variables are obtained from CRSP, accounting informationis obtained from Standard and Poor’s COMPUSTAT, and analyst informa-tion is obtained from I/B/E/S. Table I defines all variables used in thispaper.
II. What Drives SVI?
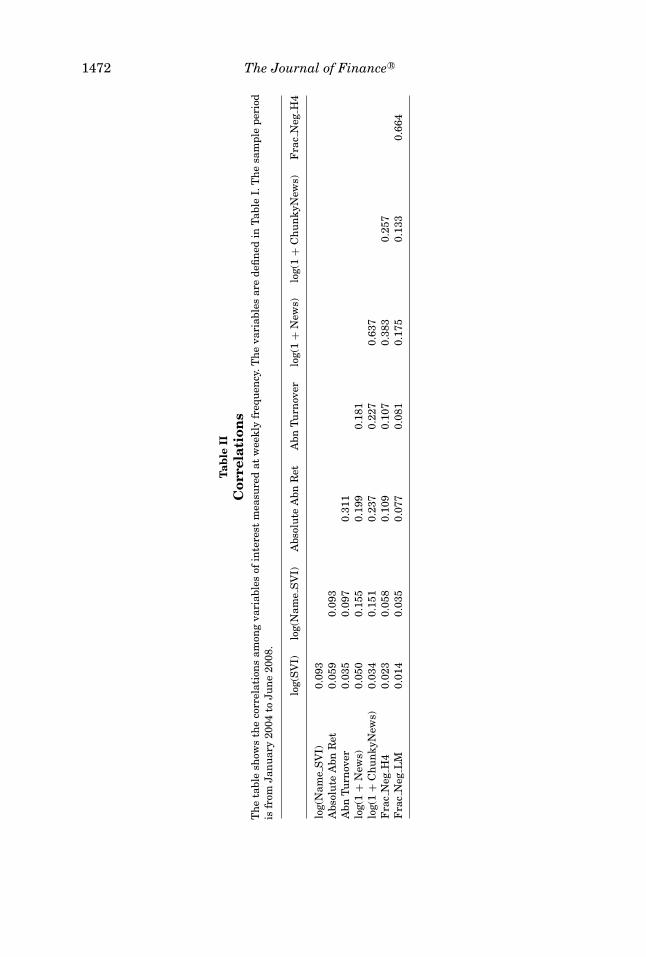
In this section, we examine what drives SVI and compare SVI to other com-mon proxies for attention. We first present simple contemporaneous correla-tions among (log) SVI and other variables of interest (see Table I for definitions),measurable at a weekly frequency in Table II. These correlations are first com-puted in the time series for each stock with a minimum of 1 year of data andthen averaged across stocks.
In general, the correlations between SVI and the other variables of interestare low. The correlation between log SVI and log Name SVI is about 9%. Again,this is because people may search company name for many reasons, such asgathering product information, looking for store locations, or searching for jobopportunities, while people who search for stock tickers are interested in finan-cial information about the stock. In addition, different people may use differentsearch terms when they search for a company, which introduces further noiseto Name SVI.
Extreme returns and trading volume are popular measures of investor at-tention. Although they have a correlation of more than 30% with each other,their correlation with SVI is positive but small. For example, the correlationbetween Absolute Abn Ret and Log(SVI) is 5.9%, and the correlation betweenAbnormal Turnover and Log(SVI) is 3.5%. Such low correlation may be at-tributed to the fact that both returns and turnover are equilibrium outcomesthat are functions of many economic factors in addition to investor attention.
News media coverage is another popular measure of investor attention. Anec-dotal evidence presented in Figure 1 clearly indicates a positive correlationbetween SVI and news. We confirm this positive correlation on average be-tween SVI and news coverage (News) and news events (Chunky News). Thesecorrelations are low, ranging from 3.5% (Chunky News) to 5.0% (News). Thereare several reasons for such low correlations. First, overall newspaper cov-erage is surprisingly low. Fang and Peress (2009) report that over 25% ofNYSE stocks are not featured in the press in a typical year. The number iseven higher for NASDAQ stocks (50%). While SVI measures investor atten-tion continuously over the year, news coverage of a typical firm is sporadic.Second, news coverage does not guarantee attention unless investors actu-ally read it, and the same amount of news coverage may generate a differentamount of investor attention across different stocks. Even if a surge in SVI were

1470 The Journal of Finance R©
Table IVariable Definitions
Variable Definition
Variables from Google TrendsSVI Aggregate search frequency from Google Trends based on stock
tickerASVI The log of SVI during the week minus the log of median SVI
during the previous 8 weeksName SVI Aggregate search frequency based on company nameAPSVI The log of PSVI (aggregate search frequency based on the main
product of the company) during the week minus the log ofmedian PSVI during the previous 8 weeks
Variables from Dash-5 reportsPercent Dash-5 Volume Ratio between Dash-5 trading volume and total trading volume
during the previous monthMadoff Dummy variable taking a value of one for all observations from
the Madoff market center and taking a value of zero for allobservations from the New York Stock Exchange (forNYSE-listed stocks) and Archipelago Holdings (forNASDAQ-listed stocks)
Other variables related to investment attention/sentimentRet Stock returnAbn Ret Characteristic-adjusted return as in Daniel et al. (1997)Turnover Trading volumeAbn Turnover Standardized abnormal turnover as in Chordia, Huh, and
Subrahmanyam (2007)Market Cap Market capitalization# of Analysts Number of analysts in I/B/E/SAdvertising Expense/Sales Ratio between advertisement expense and sales in the previous
fiscal year, where we set advertisement expenditure to zero ifit is missing in COMPUSTAT
News Number of news stories in the Dow Jones news archiveNews Dummy Dummy variable that takes the value of one if News variable is
positiveChunky News Number of news stories with multiple story codes in the Dow
Jones news archiveChunky News Dummy Dummy variable that takes the value of one if Chunky News
variable is positiveChunky News Last Year Number of Chunky News stories in the last 52 weeksFrac Neg H4 Media-based stock-level sentiment measure. Following Tetlock
(2007), for each stock each week, we gather all the newsarticles about the stock recorded in the Dow Jones Newswire(DJNW) database and identify words with “negativesentiment.” We count the total number of words over theentire collection of news articles about the stock (excludingso-called “stop words”) within that week, as well as thenumber of negative sentiment words. Then we take the ratio ofthe number of negative sentiment words to the total number ofwords to get the fraction of negative words. Negative sentimentwords are defined using the Harvard IV-4 dictionary.
(continued)
In Search of Attention 1471
Table I—Continued
Variable Definition
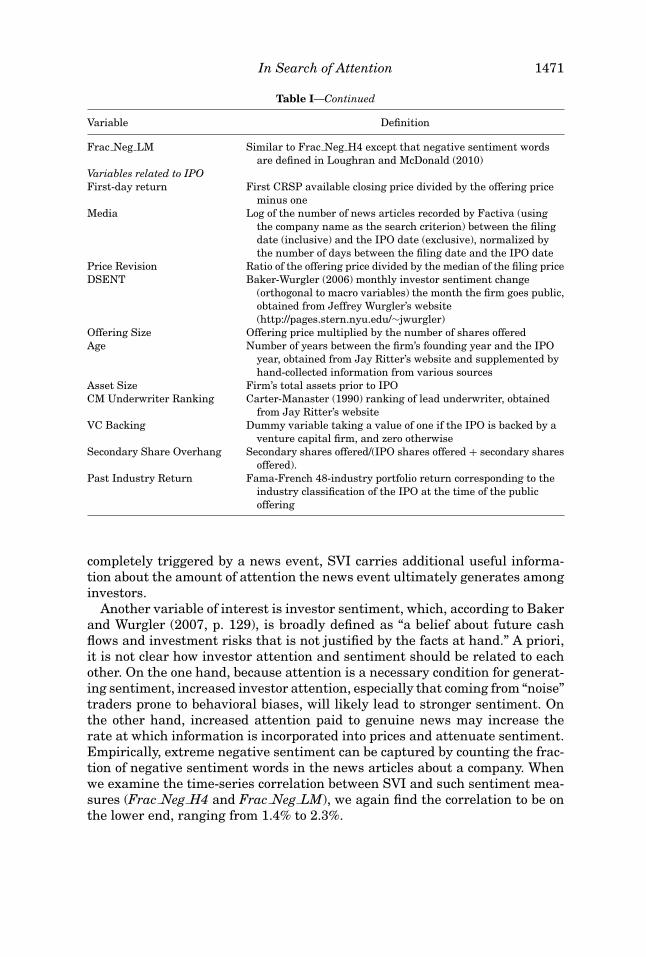
Frac Neg LM Similar to Frac Neg H4 except that negative sentiment wordsare defined in Loughran and McDonald (2010)
Variables related to IPOFirst-day return First CRSP available closing price divided by the offering price
minus oneMedia Log of the number of news articles recorded by Factiva (using
the company name as the search criterion) between the filingdate (inclusive) and the IPO date (exclusive), normalized bythe number of days between the filing date and the IPO date
Price Revision Ratio of the offering price divided by the median of the filing priceDSENT Baker-Wurgler (2006) monthly investor sentiment change
(orthogonal to macro variables) the month the firm goes public,obtained from Jeffrey Wurgler’s website(http://pages.stern.nyu.edu/∼jwurgler)
Offering Size Offering price multiplied by the number of shares offeredAge Number of years between the firm’s founding year and the IPO
year, obtained from Jay Ritter’s website and supplemented byhand-collected information from various sources
Asset Size Firm’s total assets prior to IPOCM Underwriter Ranking Carter-Manaster (1990) ranking of lead underwriter, obtained
from Jay Ritter’s websiteVC Backing Dummy variable taking a value of one if the IPO is backed by a
venture capital firm, and zero otherwiseSecondary Share Overhang Secondary shares offered/(IPO shares offered + secondary shares
offered).Past Industry Return Fama-French 48-industry portfolio return corresponding to the
industry classification of the IPO at the time of the publicoffering
completely triggered by a news event, SVI carries additional useful informa-tion about the amount of attention the news event ultimately generates amonginvestors.
Another variable of interest is investor sentiment, which, according to Bakerand Wurgler (2007, p. 129), is broadly defined as “a belief about future cashflows and investment risks that is not justified by the facts at hand.” A priori,it is not clear how investor attention and sentiment should be related to eachother. On the one hand, because attention is a necessary condition for generat-ing sentiment, increased investor attention, especially that coming from “noise”traders prone to behavioral biases, will likely lead to stronger sentiment. Onthe other hand, increased attention paid to genuine news may increase therate at which information is incorporated into prices and attenuate sentiment.Empirically, extreme negative sentiment can be captured by counting the frac-tion of negative sentiment words in the news articles about a company. Whenwe examine the time-series correlation between SVI and such sentiment mea-sures (Frac Neg H4 and Frac Neg LM), we again find the correlation to be onthe lower end, ranging from 1.4% to 2.3%.
1472 The Journal of Finance R©
Tab
leII
Cor
rela
tion
sT
he
tabl
esh
ows
the
corr
elat
ion
sam
ong
vari
able
sof
inte
rest
mea
sure
dat
wee
kly
freq
uen
cy.T
he
vari
able
sar
ede
fin
edin
Tabl
eI.
Th
esa
mpl
epe
riod
isfr
omJa
nu
ary
2004
toJu
ne
2008
.
log(
SV
I)lo
g(N
ame
SV
I)A
bsol
ute
Abn
Ret
Abn
Turn
over
log(
1+
New
s)lo
g(1
+C
hu
nky
New
s)F
rac
Neg
H4
log(
Nam
eS
VI)
0.09
3A
bsol
ute
Abn
Ret
0.05
90.
093
Abn
Turn
over
0.03
50.
097
0.31
1lo
g(1
+N
ews)
0.05
00.
155
0.19
90.
181
log(
1+
Ch
un
kyN
ews)
0.03
40.
151
0.23
70.
227
0.63
7F
rac
Neg
H4
0.02
30.
058
0.10
90.
107
0.38
30.
257
Fra
cN
egL
M0.
014
0.03
50.
077
0.08
10.
175
0.13
30.
664
In Search of Attention 1473
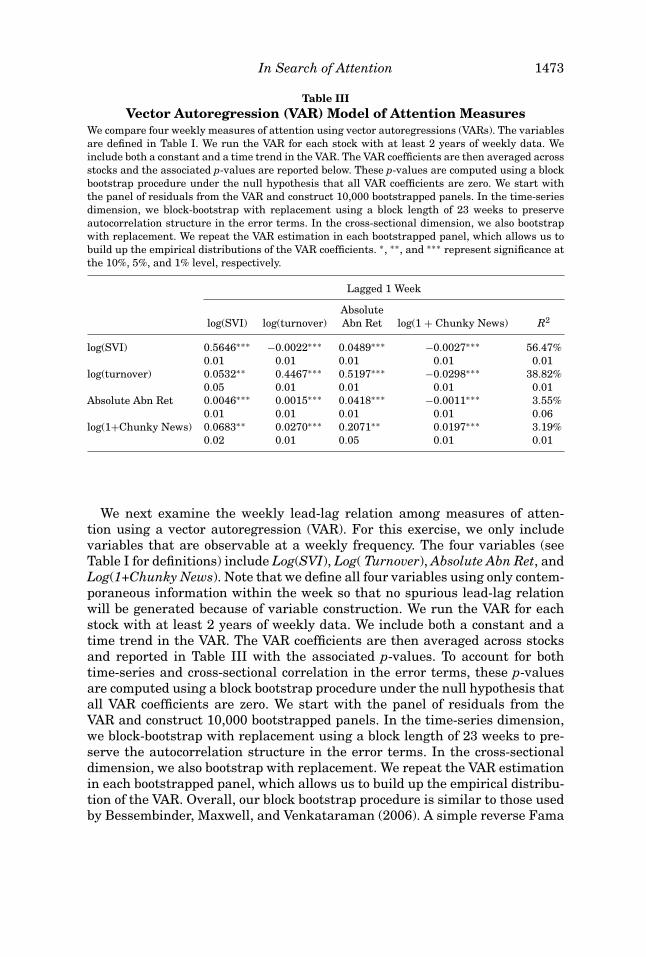
Table IIIVector Autoregression (VAR) Model of Attention Measures
We compare four weekly measures of attention using vector autoregressions (VARs). The variablesare defined in Table I. We run the VAR for each stock with at least 2 years of weekly data. Weinclude both a constant and a time trend in the VAR. The VAR coefficients are then averaged acrossstocks and the associated p-values are reported below. These p-values are computed using a blockbootstrap procedure under the null hypothesis that all VAR coefficients are zero. We start withthe panel of residuals from the VAR and construct 10,000 bootstrapped panels. In the time-seriesdimension, we block-bootstrap with replacement using a block length of 23 weeks to preserveautocorrelation structure in the error terms. In the cross-sectional dimension, we also bootstrapwith replacement. We repeat the VAR estimation in each bootstrapped panel, which allows us tobuild up the empirical distributions of the VAR coefficients. ∗, ∗∗, and ∗∗∗ represent significance atthe 10%, 5%, and 1% level, respectively.
Lagged 1 Week
Absolutelog(SVI) log(turnover) Abn Ret log(1 + Chunky News) R2
log(SVI) 0.5646∗∗∗ −0.0022∗∗∗ 0.0489∗∗∗ −0.0027∗∗∗ 56.47%0.01 0.01 0.01 0.01 0.01
log(turnover) 0.0532∗∗ 0.4467∗∗∗ 0.5197∗∗∗ −0.0298∗∗∗ 38.82%0.05 0.01 0.01 0.01 0.01
Absolute Abn Ret 0.0046∗∗∗ 0.0015∗∗∗ 0.0418∗∗∗ −0.0011∗∗∗ 3.55%0.01 0.01 0.01 0.01 0.06
log(1+Chunky News) 0.0683∗∗ 0.0270∗∗∗ 0.2071∗∗ 0.0197∗∗∗ 3.19%0.02 0.01 0.05 0.01 0.01
We next examine the weekly lead-lag relation among measures of atten-tion using a vector autoregression (VAR). For this exercise, we only includevariables that are observable at a weekly frequency. The four variables (seeTable I for definitions) include Log(SVI), Log( Turnover), Absolute Abn Ret, andLog(1+Chunky News). Note that we define all four variables using only contem-poraneous information within the week so that no spurious lead-lag relationwill be generated because of variable construction. We run the VAR for eachstock with at least 2 years of weekly data. We include both a constant and atime trend in the VAR. The VAR coefficients are then averaged across stocksand reported in Table III with the associated p-values. To account for bothtime-series and cross-sectional correlation in the error terms, these p-valuesare computed using a block bootstrap procedure under the null hypothesis thatall VAR coefficients are zero. We start with the panel of residuals from theVAR and construct 10,000 bootstrapped panels. In the time-series dimension,we block-bootstrap with replacement using a block length of 23 weeks to pre-serve the autocorrelation structure in the error terms. In the cross-sectionaldimension, we also bootstrap with replacement. We repeat the VAR estimationin each bootstrapped panel, which allows us to build up the empirical distribu-tion of the VAR. Overall, our block bootstrap procedure is similar to those usedby Bessembinder, Maxwell, and Venkataraman (2006). A simple reverse Fama
1474 The Journal of Finance R©
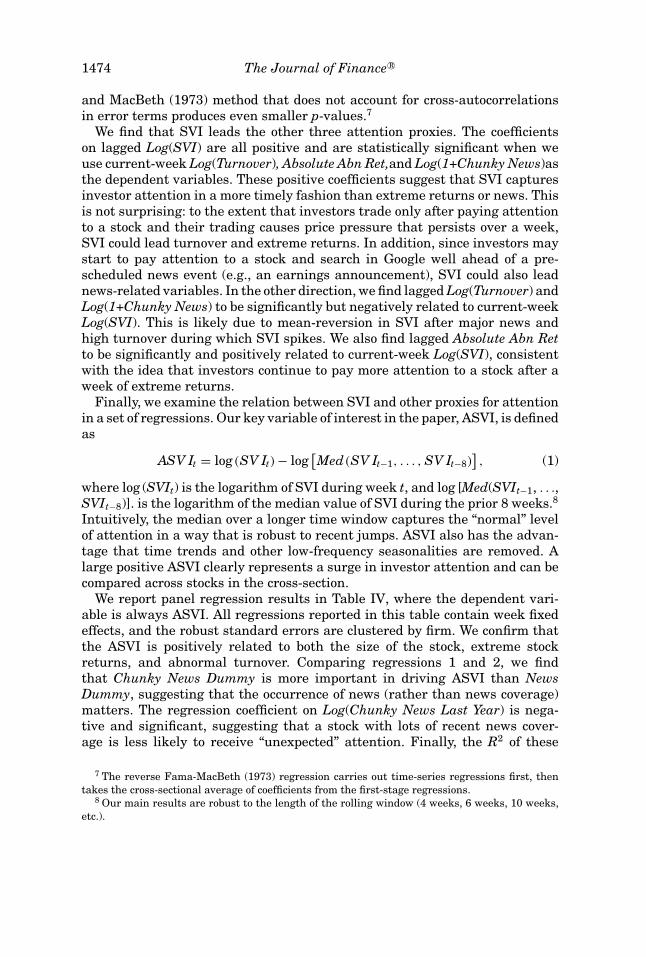
and MacBeth (1973) method that does not account for cross-autocorrelationsin error terms produces even smaller p-values.7
We find that SVI leads the other three attention proxies. The coefficientson lagged Log(SVI) are all positive and are statistically significant when weuse current-week Log(Turnover), Absolute Abn Ret,and Log(1+Chunky News)asthe dependent variables. These positive coefficients suggest that SVI capturesinvestor attention in a more timely fashion than extreme returns or news. Thisis not surprising: to the extent that investors trade only after paying attentionto a stock and their trading causes price pressure that persists over a week,SVI could lead turnover and extreme returns. In addition, since investors maystart to pay attention to a stock and search in Google well ahead of a pre-scheduled news event (e.g., an earnings announcement), SVI could also leadnews-related variables. In the other direction, we find lagged Log(Turnover) andLog(1+Chunky News) to be significantly but negatively related to current-weekLog(SVI). This is likely due to mean-reversion in SVI after major news andhigh turnover during which SVI spikes. We also find lagged Absolute Abn Retto be significantly and positively related to current-week Log(SVI), consistentwith the idea that investors continue to pay more attention to a stock after aweek of extreme returns.
Finally, we examine the relation between SVI and other proxies for attentionin a set of regressions. Our key variable of interest in the paper, ASVI, is definedas
ASV It = log (SV It) − log[Med (SV It−1, . . . , SV It−8)
], (1)
where log (SVIt) is the logarithm of SVI during week t, and log [Med(SVIt−1, . . .,SVIt−8)]. is the logarithm of the median value of SVI during the prior 8 weeks.8
Intuitively, the median over a longer time window captures the “normal” levelof attention in a way that is robust to recent jumps. ASVI also has the advan-tage that time trends and other low-frequency seasonalities are removed. Alarge positive ASVI clearly represents a surge in investor attention and can becompared across stocks in the cross-section.
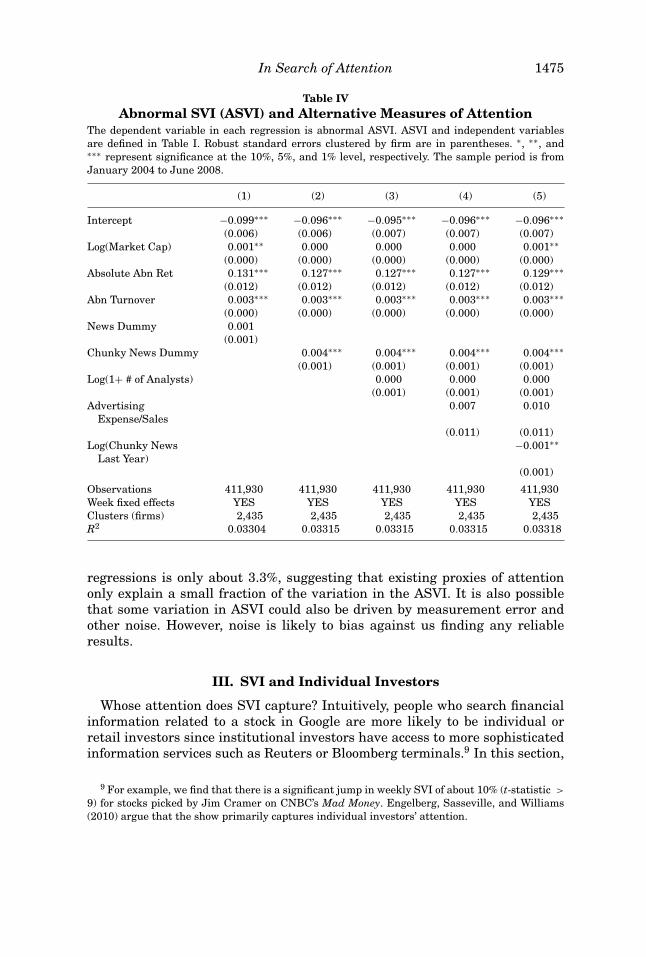
We report panel regression results in Table IV, where the dependent vari-able is always ASVI. All regressions reported in this table contain week fixedeffects, and the robust standard errors are clustered by firm. We confirm thatthe ASVI is positively related to both the size of the stock, extreme stockreturns, and abnormal turnover. Comparing regressions 1 and 2, we findthat Chunky News Dummy is more important in driving ASVI than NewsDummy, suggesting that the occurrence of news (rather than news coverage)matters. The regression coefficient on Log(Chunky News Last Year) is nega-tive and significant, suggesting that a stock with lots of recent news cover-age is less likely to receive “unexpected” attention. Finally, the R2 of these
7 The reverse Fama-MacBeth (1973) regression carries out time-series regressions first, thentakes the cross-sectional average of coefficients from the first-stage regressions.
8 Our main results are robust to the length of the rolling window (4 weeks, 6 weeks, 10 weeks,etc.).
In Search of Attention 1475
Table IVAbnormal SVI (ASVI) and Alternative Measures of Attention
The dependent variable in each regression is abnormal ASVI. ASVI and independent variablesare defined in Table I. Robust standard errors clustered by firm are in parentheses. ∗, ∗∗, and∗∗∗ represent significance at the 10%, 5%, and 1% level, respectively. The sample period is fromJanuary 2004 to June 2008.
(1) (2) (3) (4) (5)
Intercept −0.099∗∗∗ −0.096∗∗∗ −0.095∗∗∗ −0.096∗∗∗ −0.096∗∗∗(0.006) (0.006) (0.007) (0.007) (0.007)
Log(Market Cap) 0.001∗∗ 0.000 0.000 0.000 0.001∗∗(0.000) (0.000) (0.000) (0.000) (0.000)
Absolute Abn Ret 0.131∗∗∗ 0.127∗∗∗ 0.127∗∗∗ 0.127∗∗∗ 0.129∗∗∗(0.012) (0.012) (0.012) (0.012) (0.012)
Abn Turnover 0.003∗∗∗ 0.003∗∗∗ 0.003∗∗∗ 0.003∗∗∗ 0.003∗∗∗(0.000) (0.000) (0.000) (0.000) (0.000)
News Dummy 0.001(0.001)
Chunky News Dummy 0.004∗∗∗ 0.004∗∗∗ 0.004∗∗∗ 0.004∗∗∗(0.001) (0.001) (0.001) (0.001)
Log(1+ # of Analysts) 0.000 0.000 0.000(0.001) (0.001) (0.001)
AdvertisingExpense/Sales
0.007 0.010
(0.011) (0.011)Log(Chunky News
Last Year)−0.001∗∗
(0.001)
Observations 411,930 411,930 411,930 411,930 411,930Week fixed effects YES YES YES YES YESClusters (firms) 2,435 2,435 2,435 2,435 2,435R2 0.03304 0.03315 0.03315 0.03315 0.03318
regressions is only about 3.3%, suggesting that existing proxies of attentiononly explain a small fraction of the variation in the ASVI. It is also possiblethat some variation in ASVI could also be driven by measurement error andother noise. However, noise is likely to bias against us finding any reliableresults.
III. SVI and Individual Investors
Whose attention does SVI capture? Intuitively, people who search financialinformation related to a stock in Google are more likely to be individual orretail investors since institutional investors have access to more sophisticatedinformation services such as Reuters or Bloomberg terminals.9 In this section,
9 For example, we find that there is a significant jump in weekly SVI of about 10% (t-statistic >
9) for stocks picked by Jim Cramer on CNBC’s Mad Money. Engelberg, Sasseville, and Williams(2010) argue that the show primarily captures individual investors’ attention.
1476 The Journal of Finance R©
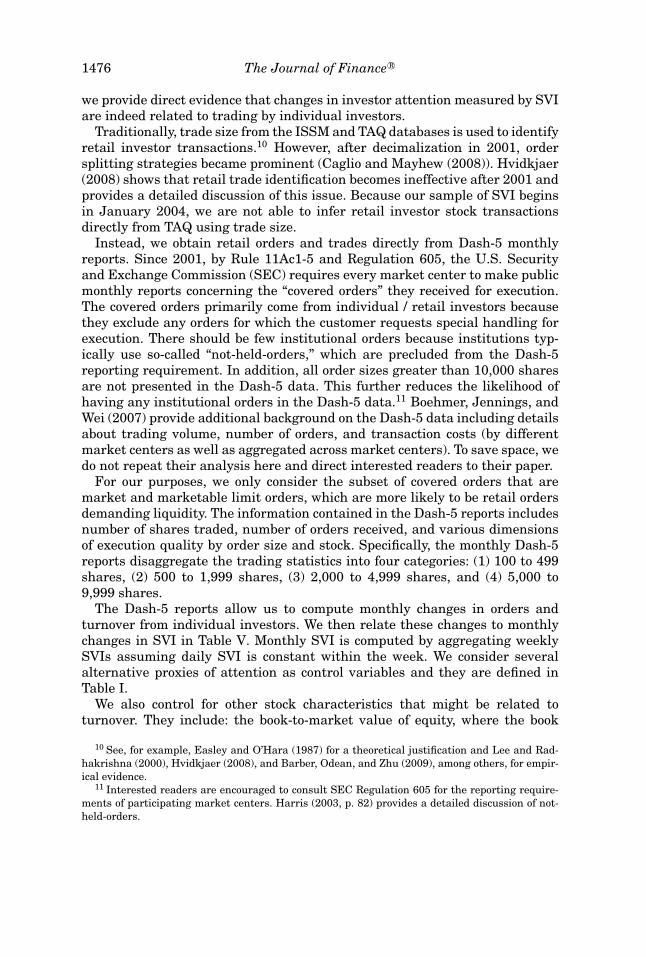
we provide direct evidence that changes in investor attention measured by SVIare indeed related to trading by individual investors.
Traditionally, trade size from the ISSM and TAQ databases is used to identifyretail investor transactions.10 However, after decimalization in 2001, ordersplitting strategies became prominent (Caglio and Mayhew (2008)). Hvidkjaer(2008) shows that retail trade identification becomes ineffective after 2001 andprovides a detailed discussion of this issue. Because our sample of SVI beginsin January 2004, we are not able to infer retail investor stock transactionsdirectly from TAQ using trade size.
Instead, we obtain retail orders and trades directly from Dash-5 monthlyreports. Since 2001, by Rule 11Ac1-5 and Regulation 605, the U.S. Securityand Exchange Commission (SEC) requires every market center to make publicmonthly reports concerning the “covered orders” they received for execution.The covered orders primarily come from individual / retail investors becausethey exclude any orders for which the customer requests special handling forexecution. There should be few institutional orders because institutions typ-ically use so-called “not-held-orders,” which are precluded from the Dash-5reporting requirement. In addition, all order sizes greater than 10,000 sharesare not presented in the Dash-5 data. This further reduces the likelihood ofhaving any institutional orders in the Dash-5 data.11 Boehmer, Jennings, andWei (2007) provide additional background on the Dash-5 data including detailsabout trading volume, number of orders, and transaction costs (by differentmarket centers as well as aggregated across market centers). To save space, wedo not repeat their analysis here and direct interested readers to their paper.
For our purposes, we only consider the subset of covered orders that aremarket and marketable limit orders, which are more likely to be retail ordersdemanding liquidity. The information contained in the Dash-5 reports includesnumber of shares traded, number of orders received, and various dimensionsof execution quality by order size and stock. Specifically, the monthly Dash-5reports disaggregate the trading statistics into four categories: (1) 100 to 499shares, (2) 500 to 1,999 shares, (3) 2,000 to 4,999 shares, and (4) 5,000 to9,999 shares.
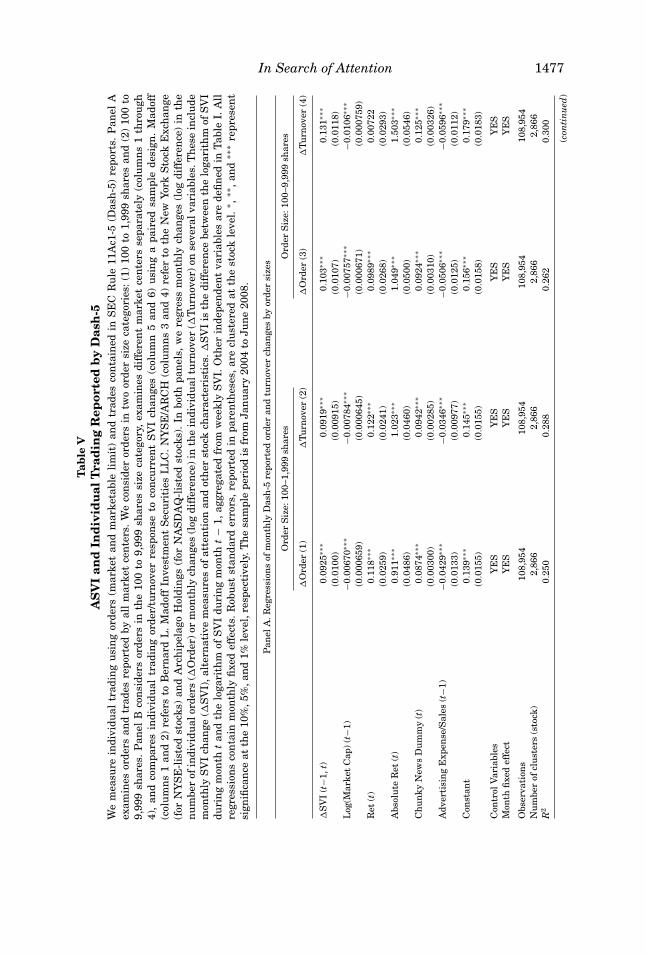
The Dash-5 reports allow us to compute monthly changes in orders andturnover from individual investors. We then relate these changes to monthlychanges in SVI in Table V. Monthly SVI is computed by aggregating weeklySVIs assuming daily SVI is constant within the week. We consider severalalternative proxies of attention as control variables and they are defined inTable I.
We also control for other stock characteristics that might be related toturnover. They include: the book-to-market value of equity, where the book
10 See, for example, Easley and O’Hara (1987) for a theoretical justification and Lee and Rad-hakrishna (2000), Hvidkjaer (2008), and Barber, Odean, and Zhu (2009), among others, for empir-ical evidence.
11 Interested readers are encouraged to consult SEC Regulation 605 for the reporting require-ments of participating market centers. Harris (2003, p. 82) provides a detailed discussion of not-held-orders.
In Search of Attention 1477T
able
VA
SV
Ian
dIn
div
idu
alT
rad
ing
Rep
orte
db
yD
ash
-5W
em
easu
rein
divi
dual
trad
ing
usi
ng
orde
rs(m
arke
tan
dm
arke
tabl
eli
mit
)an
dtr
ades
con
tain
edin
SE
CR
ule
11A
c1-5
(Das
h-5
)re
port
s.P
anel
Aex
amin
esor
ders
and
trad
esre
port
edby
all
mar
ket
cen
ters
.W
eco
nsi
der
orde
rsin
two
orde
rsi
zeca
tego
ries
:(1
)10
0to
1,99
9sh
ares
and
(2)
100
to9,
999
shar
es.
Pan
elB
con
side
rsor
ders
inth
e10
0to
9,99
9sh
ares
size
cate
gory
,ex
amin
esdi
ffer
ent
mar
ket
cen
ters
sepa
rate
ly(c
olu
mn
s1
thro
ugh
4),
and
com
pare
sin
divi
dual
trad
ing
orde
r/tu
rnov
erre
spon
seto
con
curr
ent
SV
Ich
ange
s(c
olu
mn
5an
d6)
usi
ng
apa
ired
sam
ple
desi
gn.
Mad
off
(col
um
ns
1an
d2)
refe
rsto
Ber
nar
dL
.M
adof
fIn
vest
men
tS
ecu
riti
esL
LC
.N
YS
E/A
RC
H(c
olu
mn
s3
and
4)re
fer
toth
eN
ewYo
rkS
tock
Exc
han
ge(f
orN
YS
E-l
iste
dst
ocks
)an
dA
rch
ipel
ago
Hol
din
gs(f
orN
AS
DA
Q-l
iste
dst
ocks
).In
both
pan
els,
we
regr
ess
mon
thly
chan
ges
(log
diff
eren
ce)
inth
en
um
ber
ofin
divi
dual
orde
rs(�
Ord
er)o
rm
onth
lych
ange
s(l
ogdi
ffer
ence
)in
the
indi
vidu
altu
rnov
er(�
Turn
over
)on
seve
ralv
aria
bles
.Th
ese
incl
ude
mon
thly
SV
Ich
ange
(�S
VI)
,alt
ern
ativ
em
easu
res
ofat
ten
tion
and
oth
erst
ock
char
acte
rist
ics.
�S
VI
isth
edi
ffer
ence
betw
een
the
loga
rith
mof
SV
Idu
rin
gm
onth
tan
dth
elo
gari
thm
ofS
VI
duri
ng
mon
tht
−1,
aggr
egat
edfr
omw
eekl
yS
VI.
Oth
erin
depe
nde
nt
vari
able
sar
ede
fin
edin
Tabl
eI.
All
regr
essi
ons
con
tain
mon
thly
fixe
def
fect
s.R
obu
stst
anda
rder
rors
,rep
orte
din
pare
nth
eses
,are
clu
ster
edat
the
stoc
kle
vel.
∗ ,∗∗
,an
d∗∗
∗re
pres
ent
sign
ifica
nce
atth
e10
%,5
%,a
nd
1%le
vel,
resp
ecti
vely
.Th
esa
mpl
epe
riod
isfr
omJa
nu
ary
2004
toJu
ne
2008
.
Pan
elA
.Reg
ress
ion
sof
mon
thly
Das
h-5
repo
rted
orde
ran
dtu
rnov
erch
ange
sby
orde
rsi
zes
Ord
erS
ize:
100–
1,99
9sh
ares
Ord
erS
ize:
100–
9,99
9sh
ares
�O
rder
(1)
�Tu
rnov
er(2
)�
Ord
er(3
)�
Turn
over
(4)
�S
VI
(t−1
,t)
0.09
25∗∗
∗0.
0919
∗∗∗
0.10
3∗∗∗
0.13
1∗∗∗
(0.0
100)
(0.0
0915
)(0
.010
7)(0
.011
8)L
og(M
arke
tC
ap)
(t−1
)−0
.006
70∗∗
∗−0
.007
84∗∗
∗−0
.007
57∗∗
∗−0
.010
6∗∗∗
(0.0
0065
9)(0
.000
645)
(0.0
0067
1)(0
.000
759)
Ret
(t)
0.11
8∗∗∗
0.12
2∗∗∗
0.09
89∗∗
∗0.
0072
2(0
.025
9)(0
.024
1)(0
.026
8)(0
.029
3)A
bsol
ute
Ret
(t)
0.91
1∗∗∗
1.02
3∗∗∗
1.04
9∗∗∗
1.50
3∗∗∗
(0.0
486)
(0.0
460)
(0.0
500)
(0.0
546)
Ch
un
kyN
ews
Du
mm
y(t
)0.
0874
∗∗∗
0.09
42∗∗
∗0.
0924
∗∗∗
0.12
5∗∗∗
(0.0
0300
)(0
.002
85)
(0.0
0310
)(0
.003
26)
Adv
erti
sin
gE
xpen
se/S
ales
(t−1
)−0
.042
9∗∗∗
−0.0
346∗
∗∗−0
.050
6∗∗∗
−0.0
596∗
∗∗
(0.0
133)
(0.0
0977
)(0
.012
5)(0
.011
2)C
onst
ant
0.13
9∗∗∗
0.14
5∗∗∗
0.15
6∗∗∗
0.17
9∗∗∗
(0.0
155)
(0.0
155)
(0.0
158)
(0.0
183)
Con
trol
Var
iabl
esY
ES
YE
SY
ES
YE
SM
onth
fixe
def
fect
YE
SY
ES
YE
SY
ES
Obs
erva
tion
s10
8,95
410
8,95
410
8,95
410
8,95
4N
um
ber
ofcl
ust
ers
(sto
ck)
2,86
62,
866
2,86
62,
866
R2
0.25
00.
288
0.26
20.
300
(con
tin
ued
)
1478 The Journal of Finance R©
Tab
leV
—C
onti
nu
ed
Pan
elB
.Reg
ress
ion
sof
mon
thly
Das
h-5
repo
rted
orde
ran
dtu
rnov
erch
ange
sby
mar
ket
cen
ter
Mad
off
NY
SE
/AR
CH
Com
pari
son
�O
rder
(1)
�Tu
rnov
er(2
)�
Ord
er(3
)�
Turn
over
(4)
�O
rder
(5)
�Tu
rnov
er(6
)
�S
VI
(t−1
,t)
0.26
4∗∗∗
0.29
7∗∗∗
0.09
20∗∗
∗0.
104∗
∗∗0.
166∗
∗∗0.
204∗
∗∗
(0.0
317)
(0.0
355)
(0.0
105)
(0.0
132)
(0.0
218)
(0.0
256)
�S
VI
×M
adof
f0.
109∗
∗∗0.
0951
∗∗
(0.0
328)
(0.0
374)
Mad
off
0.00
0440
0.02
23∗∗
∗
(0.0
0223
)(0
.002
53)
Log
(Mar
ket
Cap
)(t
−1)
−0.0
117∗
∗∗−0
.012
2∗∗∗
−0.0
0889
∗∗∗
−0.0
129∗
∗∗−0
.004
11∗∗
∗−0
.008
41∗∗
∗
(0.0
0202
)(0
.002
07)
(0.0
0064
1)(0
.000
713)
(0.0
0132
)(0
.001
52)
Ret
(t)
0.15
4∗∗∗
0.07
72∗
0.09
99∗∗
∗0.
0064
70.
0418
−0.0
875∗
∗∗
(0.0
372)
(0.0
437)
(0.0
173)
(0.0
199)
(0.0
284)
(0.0
331)
Abs
olu
teR
et(t
)1.
299∗
∗∗1.
570∗
∗∗1.
001∗
∗∗1.
418∗
∗∗1.
244∗
∗∗1.
622∗
∗∗
(0.0
528)
(0.0
622)
(0.0
271)
(0.0
338)
(0.0
405)
(0.0
493)
Ch
un
kyN
ews
Du
mm
y(t
)0.
0658
∗∗∗
0.09
15∗∗
∗0.
0936
∗∗∗
0.12
5∗∗∗
0.07
68∗∗
∗0.
0991
∗∗∗
(0.0
0997
)(0
.012
1)(0
.003
01)
(0.0
0364
)(0
.006
78)
(0.0
0841
)A
dver
tisi
ng
Exp
ense
/Sal
es(t
−1)
−0.1
04∗
−0.0
954
0.00
255
−0.0
328∗
∗∗−0
.071
3−0
.056
8(0
.063
0)(0
.064
2)(0
.006
43)
(0.0
0636
)(0
.061
0)(0
.065
8)C
onst
ant
0.25
5∗∗∗
0.25
1∗∗∗
0.17
5∗∗∗
0.22
9∗∗∗
0.05
70∗
0.11
9∗∗∗
(0.0
480)
(0.0
492)
(0.0
148)
(0.0
167)
(0.0
303)
(0.0
349)
Con
trol
vari
able
sY
ES
YE
SY
ES
YE
SY
ES
YE
SM
onth
fixe
def
fect
YE
SY
ES
YE
SY
ES
YE
SY
ES
Obs
erva
tion
s35
,280
35,2
8010
3,25
310
3,25
352
,837
52,8
37N
um
ber
ofC
lust
ers
(Sto
ck)
1,35
81,
358
2,74
32,
743
962
962
R2
0.13
10.
127
0.29
90.
291
0.17
30.
191

In Search of Attention 1479
value of equity is from the latest available accounting statement and the mar-ket value of equity is the month-end close price times the number of sharesoutstanding at the end of month (t − 1); the percentage of stocks held by allS34-filing institutional shareholders at the end of quarter (Q − 1); the standarddeviation of the individual stock return estimated from daily returns duringquarter (Q − 1); the difference between the natural logarithm of total stockturnover reported by CRSP in month (t − 2) and month (t − 1); the 1-monthreturn prior to current month t; the cumulative stock return between months( t − 13) and (t − 2); and the cumulative stock return between months (t − 36)and (t − 14).
In Panel A of Table V, we examine changes in individual trading acrossall markets centers. We first consider the smaller order size categories (100to 1,999 shares) in the Dash-5 reports, which are more likely to capture re-tail transactions. When we measure changes in individual trading as changesin the number of orders (in logarithm), we find that a 1% increase in SVIleads to a 0.0925% increase in individual orders (regression 1). This posi-tive correlation is statistically significant at the 1% level after controllingfor alternative proxies for attention and other trading-related stock charac-teristics. It is not too surprising that several alternative proxies for attentionare also significant because they might be mechanically related to trading.For example, trading can correlate with absolute returns or market capital-ization via price impact, and trading can correlate with news if news cover-age is triggered by abnormal trading. In regression 2, we measure changesin individual trading by changes in turnover (in logarithm) and find a sim-ilar relation between the change in individual trading and the change inSVI. Finally, we use all order size categories (100 to 9,999 shares) in theDash-5 reports. We find almost identical results as reported in regressions3 and 4 in Panel A of Table V, and we therefore use all order size categorieshereafter.
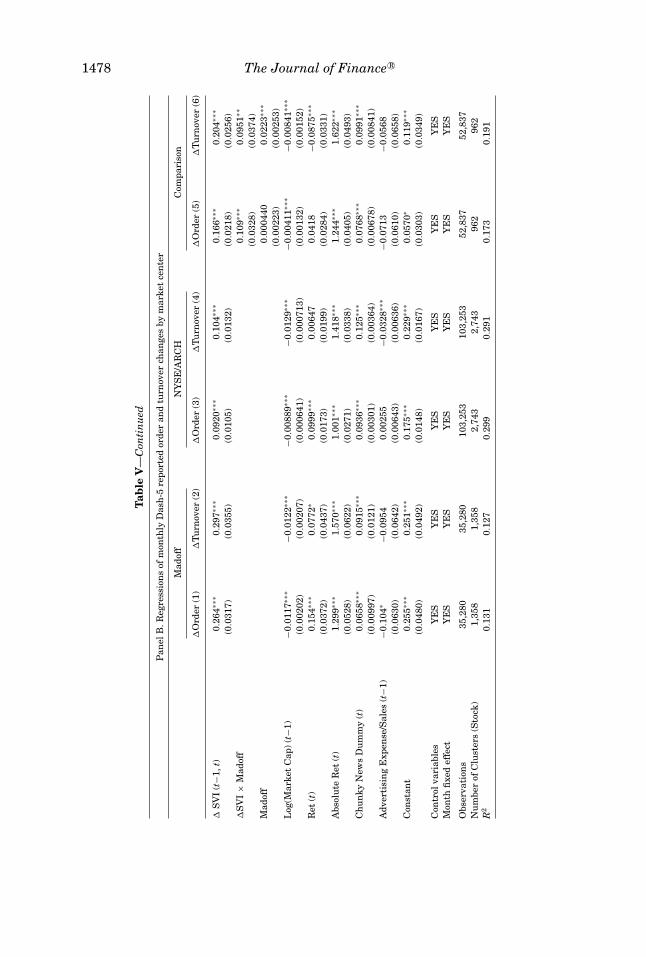
Although retail traders are thought to be uninformed on average, we donot rule out the possibility that some individual traders may be informed.Empirical evidence offered by Battalio (1997), Battalio, Greene, and Jennings(1997), and Bessembinder (2003) suggests that retail orders from differentindividual investors may be routed to and executed at different market centersbased on the information content in the orders. Therefore, retail orders fromless informed individual investors are often routed to and executed at marketcenters that pay for order flow. One well-known market center is now-defunctBernard L. Madoff Investment Securities LLC (Madoff). In contrast, ordersfrom more informed investors often go to the NYSE for NYSE stocks andArchipelago for NASDAQ stocks. These venues do not pay for order flow andare typically the execution venues of last resort. As a result, by examining thechange in individual trading at different market centers separately, we canmake inferences about which groups of individual investor attention SVI maycapture. Our working hypothesis is that, for uninformed investor clienteles, weare more likely to see a large increase in order number and share volume for asimilar magnitude change in SVI.
1480 The Journal of Finance R©
We repeat our regressions separately for Madoff and NYSE/Archipelago inPanel B of Table V. Interestingly, we find the correlation between the changein individual trading and the change in SVI is much stronger at Madoff. Af-ter controlling for alternative proxies for attention and other trading-relatedstock characteristics, a 1% increase in SVI translates to a 0.264% increase inindividual orders and a 0.297% increase in individual turnover at Madoff (re-gressions 1 and 2). Such an increase in individual trading is much higher thanthe average increase across all market centers as reported in Panel A (wherethe corresponding increases are 0.103% and 0.131%). In contrast, the same1% increase in SVI only translates to a 0.092% increase in individual ordersand a 0.104% increase in individual turnover at NYSE/Archipelago (regressions3 and 4). Finally, we directly examine the difference in retail trading betweenMadoff and NYSE/Archipelago using a matched sample in regressions 5 and6. Each month, we focus on a set of stocks that are traded on both Madoffand NYSE/Archipelago. We create a dummy variable, Madoff , which takes thevalue one for all observations from Madoff and zero for all observations fromNYSE/Archipelago. In this matched sample, we find that a 1% increase in SVIleads to a 0.109% greater increase in individual orders and a 0.0951% greaterincrease in individual turnover at Madoff and these additional increases arestatistically significant. It is interesting to note that the news variable actuallycorrelates with the trading at NYSE/ARCH more than that at Madoff, suggest-ing that the news variable may not be capturing the attention of less informedretail investors.
In sum, our results suggest that SVI captures the attention of individualinvestors. In the following section, we explore how attention from these retailinvestors can affect asset prices.
IV. SVI and Price Pressure
As seen from Figure 1, attention can vary considerably over time. How doesa sharp increase in retail attention affect stock returns? Barber and Odean(2008) argue that buying allows individuals to choose from a large set of al-ternatives while selling does not. For retail traders who rarely short, sellinga stock requires individuals to have already owned the stock. Therefore, theBarber and Odean (2008) model predicts that attention shocks lead to net buy-ing by retail traders. Because retail traders are uninformed on average, thisshould lead to temporarily higher returns. To the extent that ASVI is a directmeasure of retail attention, we can directly test the price pressure hypothesisof Barber and Odean (2008). Specifically, we expect large ASVI to result inincreased buying pressure that pushes stock prices up temporarily. We firstinvestigate such price pressure in the context of a cross-section of Russell3000 stocks and then in the context of IPOs. Given the lack of trading dataprior to IPO, trade-based measures of attention are unavailable. Thus, SVIoffers a unique opportunity to empirically study the impact of retail investorattention on IPO returns.
In Search of Attention 1481
A. Russell 3000 Stock Sample
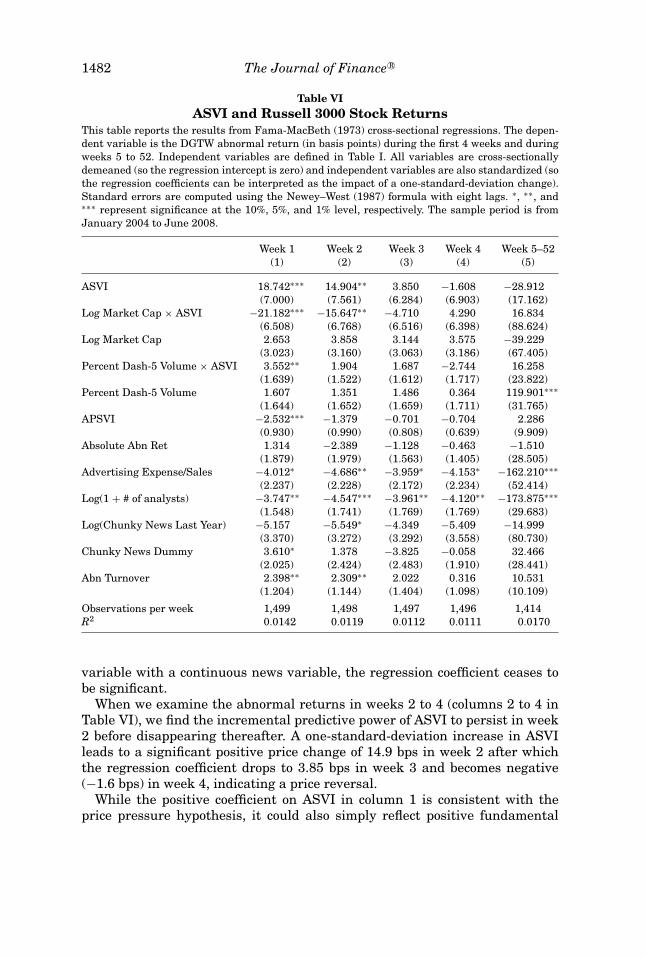
We first investigate the empirical relation between ASVI and future stockreturns for Russell 3000 stocks in our sample. We use a Fama-MacBeth(1973) cross-sectional regression to account for time-specific economy-wideshocks. Each week, we regress future DGTW abnormal returns (measuredin basis points, or bps) at different horizons on ASVI and other control vari-ables. The regression coefficients are then averaged over time and standarderrors are computed using the Newey-West (1987) formula with eight lags.All variables are cross-sectionally demeaned (so the regression intercept iszero) and independent variables are also standardized (so the regression co-efficient on a variable can be interpreted as the effect of a one-standard-deviation change in that variable). These regression results are reported inTable VI.
In column 1, the dependent variable is next week’s DGTW abnormal return.We find strong evidence of positive price pressure following an increase in in-dividual attention as measured by ASVI. A one-standard-deviation increase inASVI leads to a significant positive price change of 18.7 bps among Russell 3000stocks. Moreover, this result holds primarily in two important cross-sectionsof the data. First, if a price increase reflects price pressure due to individualbuying activity, we would expect it to be stronger among small stocks, whichare typically associated with a larger price impact. This is exactly what we findin the data. We find a significant and negative coefficient on the interactionterm between Log Market Cap and ASVI. This negative coefficient suggestsa larger price increase following an increase in ASVI among smaller Russell3000 stocks. In fact, we confirm through both a portfolio sorting exercise andregression analysis that the positive price pressure is only present among thesmaller half of our Russell 3000 stock sample.12
Second, we would expect price pressure to be stronger among stocks that aretraded more by individual investors. We measure retail trading directly usingPercent Dash-5 Volume, defined as the ratio between Dash-5 trading volumeand total trading volume during the previous month. We find the interactionbetween this retail trading measure and ASVI is significant in predicting first-week abnormal returns, which suggests a stronger price increase among stockstraded mainly by retail investors, again supporting the price pressure hypoth-esis of Barber and Odean (2008).
Note that the positive, significant coefficient on ASVI in column 1 is ob-tained after controlling for alternative measures of investor attention. Amongthese alternative attention measures, we find a significant positive coefficienton abnormal turnover, consistent with the high-volume return premium docu-mented in Gervais, Kaniel, and Mingelgrin (2001). We also observe weak incre-mental predictive power on Chunky News Dummy, which measures whetherthere is a news event in the current week. The weak predictive power is notdue to the use of a dummy variable. In fact, if we replace the dummy news
12 These additional results are reported in the Internet Appendix, available online in the “Sup-plements and Datasets” section at http://www.afajof.org/supplements.asp.
1482 The Journal of Finance R©
Table VIASVI and Russell 3000 Stock Returns
This table reports the results from Fama-MacBeth (1973) cross-sectional regressions. The depen-dent variable is the DGTW abnormal return (in basis points) during the first 4 weeks and duringweeks 5 to 52. Independent variables are defined in Table I. All variables are cross-sectionallydemeaned (so the regression intercept is zero) and independent variables are also standardized (sothe regression coefficients can be interpreted as the impact of a one-standard-deviation change).Standard errors are computed using the Newey–West (1987) formula with eight lags. ∗, ∗∗, and∗∗∗ represent significance at the 10%, 5%, and 1% level, respectively. The sample period is fromJanuary 2004 to June 2008.
Week 1 Week 2 Week 3 Week 4 Week 5–52(1) (2) (3) (4) (5)
ASVI 18.742∗∗∗ 14.904∗∗ 3.850 −1.608 −28.912(7.000) (7.561) (6.284) (6.903) (17.162)
Log Market Cap × ASVI −21.182∗∗∗ −15.647∗∗ −4.710 4.290 16.834(6.508) (6.768) (6.516) (6.398) (88.624)
Log Market Cap 2.653 3.858 3.144 3.575 −39.229(3.023) (3.160) (3.063) (3.186) (67.405)
Percent Dash-5 Volume × ASVI 3.552∗∗ 1.904 1.687 −2.744 16.258(1.639) (1.522) (1.612) (1.717) (23.822)
Percent Dash-5 Volume 1.607 1.351 1.486 0.364 119.901∗∗∗(1.644) (1.652) (1.659) (1.711) (31.765)
APSVI −2.532∗∗∗ −1.379 −0.701 −0.704 2.286(0.930) (0.990) (0.808) (0.639) (9.909)
Absolute Abn Ret 1.314 −2.389 −1.128 −0.463 −1.510(1.879) (1.979) (1.563) (1.405) (28.505)
Advertising Expense/Sales −4.012∗ −4.686∗∗ −3.959∗ −4.153∗ −162.210∗∗∗(2.237) (2.228) (2.172) (2.234) (52.414)
Log(1 + # of analysts) −3.747∗∗ −4.547∗∗∗ −3.961∗∗ −4.120∗∗ −173.875∗∗∗(1.548) (1.741) (1.769) (1.769) (29.683)
Log(Chunky News Last Year) −5.157 −5.549∗ −4.349 −5.409 −14.999(3.370) (3.272) (3.292) (3.558) (80.730)
Chunky News Dummy 3.610∗ 1.378 −3.825 −0.058 32.466(2.025) (2.424) (2.483) (1.910) (28.441)
Abn Turnover 2.398∗∗ 2.309∗∗ 2.022 0.316 10.531(1.204) (1.144) (1.404) (1.098) (10.109)
Observations per week 1,499 1,498 1,497 1,496 1,414R2 0.0142 0.0119 0.0112 0.0111 0.0170
variable with a continuous news variable, the regression coefficient ceases tobe significant.
When we examine the abnormal returns in weeks 2 to 4 (columns 2 to 4 inTable VI), we find the incremental predictive power of ASVI to persist in week2 before disappearing thereafter. A one-standard-deviation increase in ASVIleads to a significant positive price change of 14.9 bps in week 2 after whichthe regression coefficient drops to 3.85 bps in week 3 and becomes negative(−1.6 bps) in week 4, indicating a price reversal.
While the positive coefficient on ASVI in column 1 is consistent with theprice pressure hypothesis, it could also simply reflect positive fundamental
In Search of Attention 1483
information about the firm that is captured by ASVI on a more timely basis. Forexample, suppose a company announces an innovation in its product to whichconsumers react positively. Such a positive reaction immediately translatesinto a higher SVI as people start to search the company stock, which “predicts”a later price increase as this positive news gradually gets incorporated into thestock price.
We have two pieces of evidence that is inconsistent with such hypothesis.First, we directly test this information story by controlling for the SVI on themain product of the company (PSVI). We define abnormal product SVI (APSVI)in the same way as ASVI. For stocks without a valid APSVI, we set APSVI tozero.
If the information story is true, we would expect an even larger positivecoefficient on APSVI, which subsumes the predictive power of ASVI when weinclude APSVI in the regression. This is not true in regression 1: the coefficienton ASVI is still positive and significant. Interestingly, the regression coefficienton APSVI is actually negative although its magnitude is small (a −2.5 bp pricedrop for a one-standard-deviation increase in APSVI).
The second distinguishing feature between the price pressure hypothesisand the information-based alternative is the prediction for long-run returns.If an initial price increase is due to temporary price pressure, we would ex-pect it to revert in the long run. If, however, the initial price increase reflectsfundamental information about the firm, then no long-run reversal would beexpected.
We examine long-run returns in regression 5. Following Barber and Odean(2008), we skip the first month and look at the returns from weeks 5 to 52. Wefind a negative coefficient of −28.9 bps on ASVI, similar to the magnitude oftotal initial price pressure in the first 2 weeks, suggesting that the initial pricepressure is almost entirely reversed in 1 year. However, the negative coefficientis marginally insignificant (t -value = 1.69). This is not too surprising: givenour short 5 1/2-year sample, we do not have many independent 48-week returnobservations so the regression coefficient is less likely to be significant after theNewey-West (1987) autocorrelation correction. However, the regression resultsreported in the Internet Appendix suggest that such reversals are significantamong the smaller half of the Russell 3000 stocks. Overall, it is important tonote that ASVI seems to be the only measure of attention that predicts boththe initial price increase and subsequent long-run price reversal. The existenceof long-run reversal is more consistent with the price pressure hypothesis thanthe information hypothesis.
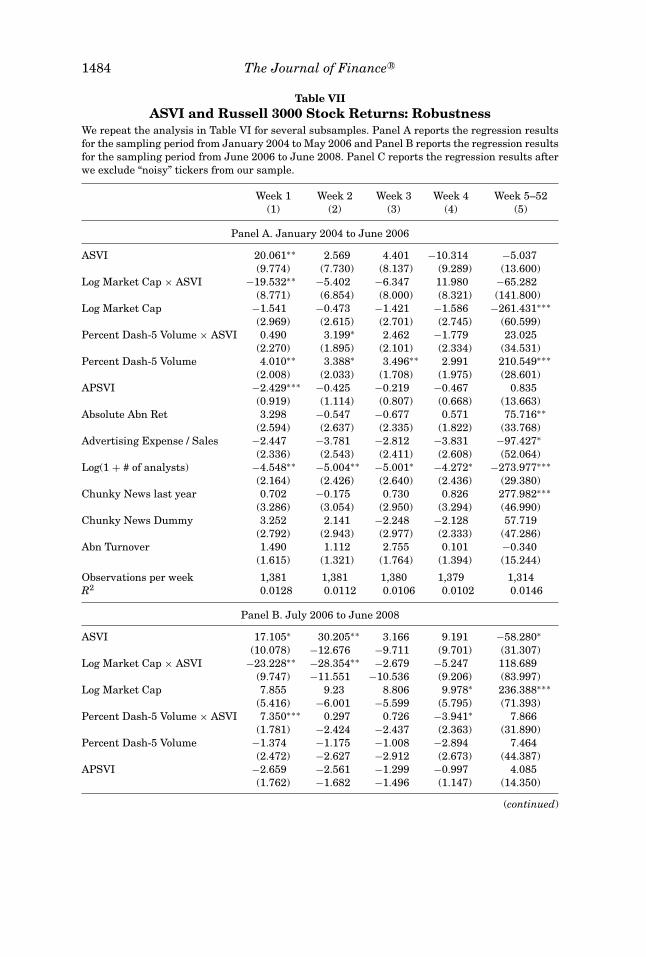
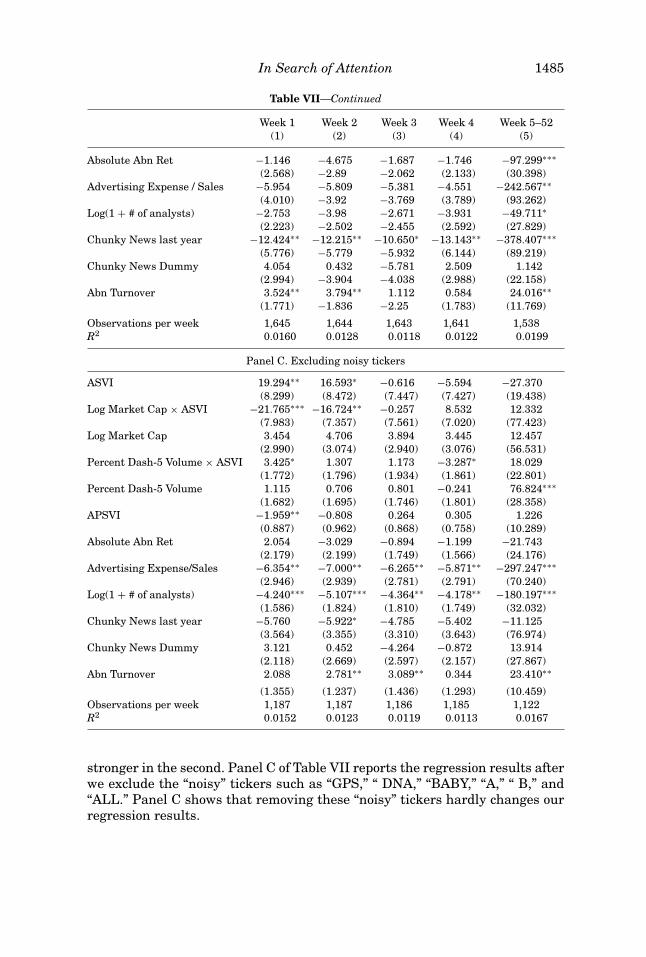
Table VII reports the results of several robustness checks. Panels A and Breport the regression results for the sampling period from January 2004 toMay 2006 and the sampling period from June 2006 to June 2008, respectively.May 2006 is an interesting cutoff point since that was when Google Trends datafirst became available to the public as a “Google Labs” product.13 The regressionresults are qualitatively similar in the two subsample periods although slightly
13 This can be seen by typing “Google Trends” itself into Google Trends.
1484 The Journal of Finance R©
Table VIIASVI and Russell 3000 Stock Returns: Robustness
We repeat the analysis in Table VI for several subsamples. Panel A reports the regression resultsfor the sampling period from January 2004 to May 2006 and Panel B reports the regression resultsfor the sampling period from June 2006 to June 2008. Panel C reports the regression results afterwe exclude “noisy” tickers from our sample.
Week 1 Week 2 Week 3 Week 4 Week 5–52(1) (2) (3) (4) (5)
Panel A. January 2004 to June 2006
ASVI 20.061∗∗ 2.569 4.401 −10.314 −5.037(9.774) (7.730) (8.137) (9.289) (13.600)
Log Market Cap × ASVI −19.532∗∗ −5.402 −6.347 11.980 −65.282(8.771) (6.854) (8.000) (8.321) (141.800)
Log Market Cap −1.541 −0.473 −1.421 −1.586 −261.431∗∗∗(2.969) (2.615) (2.701) (2.745) (60.599)
Percent Dash-5 Volume × ASVI 0.490 3.199∗ 2.462 −1.779 23.025(2.270) (1.895) (2.101) (2.334) (34.531)
Percent Dash-5 Volume 4.010∗∗ 3.388∗ 3.496∗∗ 2.991 210.549∗∗∗(2.008) (2.033) (1.708) (1.975) (28.601)
APSVI −2.429∗∗∗ −0.425 −0.219 −0.467 0.835(0.919) (1.114) (0.807) (0.668) (13.663)
Absolute Abn Ret 3.298 −0.547 −0.677 0.571 75.716∗∗(2.594) (2.637) (2.335) (1.822) (33.768)
Advertising Expense / Sales −2.447 −3.781 −2.812 −3.831 −97.427∗(2.336) (2.543) (2.411) (2.608) (52.064)
Log(1 + # of analysts) −4.548∗∗ −5.004∗∗ −5.001∗ −4.272∗ −273.977∗∗∗(2.164) (2.426) (2.640) (2.436) (29.380)
Chunky News last year 0.702 −0.175 0.730 0.826 277.982∗∗∗(3.286) (3.054) (2.950) (3.294) (46.990)
Chunky News Dummy 3.252 2.141 −2.248 −2.128 57.719(2.792) (2.943) (2.977) (2.333) (47.286)
Abn Turnover 1.490 1.112 2.755 0.101 −0.340(1.615) (1.321) (1.764) (1.394) (15.244)
Observations per week 1,381 1,381 1,380 1,379 1,314R2 0.0128 0.0112 0.0106 0.0102 0.0146
Panel B. July 2006 to June 2008
ASVI 17.105∗ 30.205∗∗ 3.166 9.191 −58.280∗(10.078) −12.676 −9.711 (9.701) (31.307)
Log Market Cap × ASVI −23.228∗∗ −28.354∗∗ −2.679 −5.247 118.689(9.747) −11.551 −10.536 (9.206) (83.997)
Log Market Cap 7.855 9.23 8.806 9.978∗ 236.388∗∗∗(5.416) −6.001 −5.599 (5.795) (71.393)
Percent Dash-5 Volume × ASVI 7.350∗∗∗ 0.297 0.726 −3.941∗ 7.866(1.781) −2.424 −2.437 (2.363) (31.890)
Percent Dash-5 Volume −1.374 −1.175 −1.008 −2.894 7.464(2.472) −2.627 −2.912 (2.673) (44.387)
APSVI −2.659 −2.561 −1.299 −0.997 4.085(1.762) −1.682 −1.496 (1.147) (14.350)
(continued)
In Search of Attention 1485
Table VII—Continued
Week 1 Week 2 Week 3 Week 4 Week 5–52(1) (2) (3) (4) (5)
Absolute Abn Ret −1.146 −4.675 −1.687 −1.746 −97.299∗∗∗(2.568) −2.89 −2.062 (2.133) (30.398)
Advertising Expense / Sales −5.954 −5.809 −5.381 −4.551 −242.567∗∗(4.010) −3.92 −3.769 (3.789) (93.262)
Log(1 + # of analysts) −2.753 −3.98 −2.671 −3.931 −49.711∗(2.223) −2.502 −2.455 (2.592) (27.829)
Chunky News last year −12.424∗∗ −12.215∗∗ −10.650∗ −13.143∗∗ −378.407∗∗∗(5.776) −5.779 −5.932 (6.144) (89.219)
Chunky News Dummy 4.054 0.432 −5.781 2.509 1.142(2.994) −3.904 −4.038 (2.988) (22.158)
Abn Turnover 3.524∗∗ 3.794∗∗ 1.112 0.584 24.016∗∗(1.771) −1.836 −2.25 (1.783) (11.769)
Observations per week 1,645 1,644 1,643 1,641 1,538R2 0.0160 0.0128 0.0118 0.0122 0.0199
Panel C. Excluding noisy tickers
ASVI 19.294∗∗ 16.593∗ −0.616 −5.594 −27.370(8.299) (8.472) (7.447) (7.427) (19.438)
Log Market Cap × ASVI −21.765∗∗∗ −16.724∗∗ −0.257 8.532 12.332(7.983) (7.357) (7.561) (7.020) (77.423)
Log Market Cap 3.454 4.706 3.894 3.445 12.457(2.990) (3.074) (2.940) (3.076) (56.531)
Percent Dash-5 Volume × ASVI 3.425∗ 1.307 1.173 −3.287∗ 18.029(1.772) (1.796) (1.934) (1.861) (22.801)
Percent Dash-5 Volume 1.115 0.706 0.801 −0.241 76.824∗∗∗(1.682) (1.695) (1.746) (1.801) (28.358)
APSVI −1.959∗∗ −0.808 0.264 0.305 1.226(0.887) (0.962) (0.868) (0.758) (10.289)
Absolute Abn Ret 2.054 −3.029 −0.894 −1.199 −21.743(2.179) (2.199) (1.749) (1.566) (24.176)
Advertising Expense/Sales −6.354∗∗ −7.000∗∗ −6.265∗∗ −5.871∗∗ −297.247∗∗∗(2.946) (2.939) (2.781) (2.791) (70.240)
Log(1 + # of analysts) −4.240∗∗∗ −5.107∗∗∗ −4.364∗∗ −4.178∗∗ −180.197∗∗∗(1.586) (1.824) (1.810) (1.749) (32.032)
Chunky News last year −5.760 −5.922∗ −4.785 −5.402 −11.125(3.564) (3.355) (3.310) (3.643) (76.974)
Chunky News Dummy 3.121 0.452 −4.264 −0.872 13.914(2.118) (2.669) (2.597) (2.157) (27.867)
Abn Turnover 2.088 2.781∗∗ 3.089∗∗ 0.344 23.410∗∗
(1.355) (1.237) (1.436) (1.293) (10.459)Observations per week 1,187 1,187 1,186 1,185 1,122R2 0.0152 0.0123 0.0119 0.0113 0.0167
stronger in the second. Panel C of Table VII reports the regression results afterwe exclude the “noisy” tickers such as “GPS,” “ DNA,” “BABY,” “A,” “ B,” and“ALL.” Panel C shows that removing these “noisy” tickers hardly changes ourregression results.
1486 The Journal of Finance R©
To summarize, we find increases in ASVI predict increases in returns in thefollowing 2 weeks, especially among small stocks and those traded by retail in-vestors. Moreover, this initial price pressure is almost completely reversed in 1year. This pattern is not driven by alternative measures of attention and is lessconsistent with an alternative explanation based on fundamental informationcontained in SVI. Overall, our evidence provides support for the price pressurehypothesis of Barber and Odean (2008).
B. Initial Public Offerings IPO Sample
A natural venue to examine the effect of retail attention on asset prices isa stock’s IPO. There are two stylized facts about IPO returns. First, IPOs onaverage have large first-day returns (see Loughran and Ritter (2002)). Second,IPOs exhibit long-run underperformance (Loughran and Ritter (1995), Brav,Geczy, and Gompers (2000)).
Barber and Odean’s (2008) attention-induced price pressure hypothesis nat-urally applies to IPOs because IPO stocks are likely to grab retail attentionaround the issuance. For the set of IPO stocks that receive more retail atten-tion prior to going public, these IPOs are likely to experience greater retailbuying pressure when trading starts. Since it is usually difficult to short-sellIPOs, buying pressure from retail investors can contribute to higher first-dayreturns. Subsequently, for the set of IPO stocks bid up by retail investors,when the price pressure induced by excess retail demand dissipates, stockprices eventually reverse, resulting in long-run underperformance.
Higher first-day IPO returns and subsequent long-run underperformanceare also consistent with the sentiment-based explanations of Ritter and Welch(2002), Ljungqvist, Nanda, and Singh (2006), and Cook, Kieschnick, and VanNess (2006). For example, Ljungqvist, Nanda, and Singh (2006) and Ritterand Welch (2002) conjecture that the over-enthusiasm of retail investors maydrive up an IPO’s first-day return, and eventually overpriced IPOs revert tofundamental value, which causes long-run underperformance. There are somecircumstances in which researchers have been able to obtain the pre-IPO valu-ation of retail investors as a measure of retail investor sentiment. For example,using a novel data set with valuations of a set of “when-issue” IPOs from the“grey market” in several continental European countries, Cornelli, Goldreich,and Ljungqvist (2006) find that pre-IPO valuations are positively correlatedwith first-day IPO returns, and negatively correlated with IPO performance upto 1 year after going public.
There are a couple of reasons to think that retail investor attention andretail investor sentiment are positively related. First, attention is a necessarycondition to generate sentiment. For a retail investor to develop sentiment andbecome overly enthusiastic about a forthcoming IPO, he has to first allocateattention to the IPO. Second, retail investors are more likely to be sentimenttraders suffering from various behavioral biases.
We again measure retail attention prior to the IPO using ASVI. Becausethere is no ticker widely available or known to the public prior to the IPO, we
In Search of Attention 1487
use the company name provided by the SDC to search for the stock in GoogleTrends to obtain the SVI. For the sample of IPOs from 2004 to 2007, we are ableto identify 185 IPOs with sufficient searches that their SVIs are not missing.14
We first confirm that there are significant changes in SVI around the time ofthe IPO. Panel A of Figure 2 illustrates the cross-sectional mean and median ofthe SVI (in logarithm) around the IPO week (week 0). We observe a significantupward trend in SVI starting 2 to 3 weeks prior to the IPO week, followed by asignificant jump in SVI during the IPO week, regardless of whether we measureSVI by sample mean or median. Panel B of Figure 2 confirms the pattern usingASVI around the IPO week. The SVI on an IPO stock jumps by 20% (usingthe mean) during the IPO week, reflecting a surge in retail attention towardthe stock. This surge in retail attention is consistent with the marketing roleof IPOs documented by Demers and Lewellen (2003). Interestingly, the shiftin retail investors’ attention is not permanent. The SVI reverts to its pre-IPOlevel 2 to 3 weeks after the IPO.
Next, we examine the relation between increased attention prior to the IPOand the first-day IPO return. Panel A of Figure 3 summarizes the main results.Consistent with the attention-induced price pressure hypothesis, the set ofIPOs with low ASVI during the week prior to the IPO has first-day averagereturns of 10.90% while the set of IPOs with high ASVI has much higherfirst-day average returns of 16.98%. The difference between the two averagefirst-day returns is about 6.08%. Both t-tests and nonparametric Wilcoxon testsindicate that the difference is statistically significant at the 1% level.
We formalize the analysis using regressions in Table VIII. Regressions al-low us to control for IPO characteristics and other variables that are relatedto first-day IPO returns. In all regressions, the dependent variable is the in-dividual IPO’s first-day return, computed as the first CRSP available closingprice divided by the offering price minus one. In addition to ASVI, we examinethree variables shown by prior literature to have strong predictive power forthe first-day IPO return. The first variable is Media, defined as the logarithmof the number of news articles recorded by Factiva (using company name asthe search criterion) between 1 day after the filing date and 1 day before theIPO date, normalized by the number of days between the filing date and theIPO date. Both Cook, Kieschnick, and Van Ness (2006) and Liu, Sherman, andZhang (2009) show that this alternative measure of attention also predictsfirst-day IPO return, though they differ in their interpretation of the effect ofpre-IPO media coverage. The second variable is Price Revision, defined as theratio of the offering price divided by the median of the filing price. As suggestedby Hanley (1993), a larger revision of the offering price is also associated witha higher first-day return. Finally, it is well known that IPOs come in waves
14 From the SDC new issues database, we can identify 571 common share IPOs traded initiallyon NYSE, Amex, or NASDAQ. There are two reasons why we cannot obtain valid SVI values fromGoogle Trends for some IPO stocks. First, individuals may not use the SDC company name tosearch for the stock in Google. Second, Google Trends truncates the output and returns missingvalues for SVIs with insufficient searches. Unfortunately, we have not been able to obtain the exactcriteria used by Google to determine the truncation threshold.
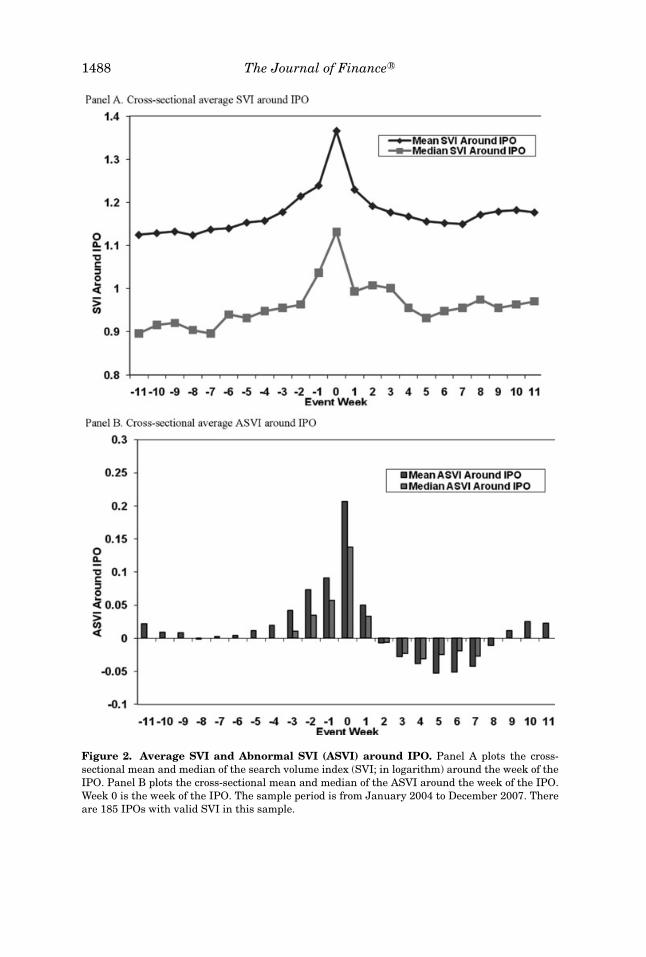
1488 The Journal of Finance R©
Figure 2. Average SVI and Abnormal SVI (ASVI) around IPO. Panel A plots the cross-sectional mean and median of the search volume index (SVI; in logarithm) around the week of theIPO. Panel B plots the cross-sectional mean and median of the ASVI around the week of the IPO.Week 0 is the week of the IPO. The sample period is from January 2004 to December 2007. Thereare 185 IPOs with valid SVI in this sample.
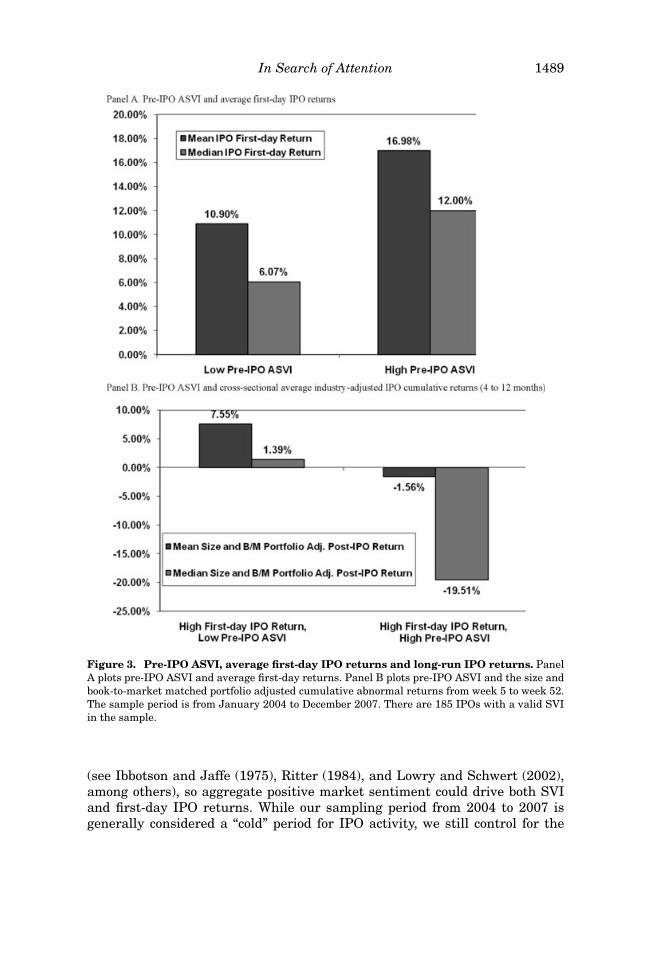
In Search of Attention 1489
Figure 3. Pre-IPO ASVI, average first-day IPO returns and long-run IPO returns. PanelA plots pre-IPO ASVI and average first-day returns. Panel B plots pre-IPO ASVI and the size andbook-to-market matched portfolio adjusted cumulative abnormal returns from week 5 to week 52.The sample period is from January 2004 to December 2007. There are 185 IPOs with a valid SVIin the sample.
(see Ibbotson and Jaffe (1975), Ritter (1984), and Lowry and Schwert (2002),among others), so aggregate positive market sentiment could drive both SVIand first-day IPO returns. While our sampling period from 2004 to 2007 isgenerally considered a “cold” period for IPO activity, we still control for the
1490 The Journal of Finance R©
impact of time-varying aggregate market sentiment using a third additionalvariable, DSENT. Developed by Baker and Wurgler (2006) and obtained fromJeffrey Wurgler’s website, DSENT is the monthly investor sentiment change(orthogonal to macro variables) at the month the firm goes public. In contrastto Media and Price Revision, which are IPO-specific, DSENT is an aggregatemarket-level variable.
We also control for a comprehensive list of firm- and industry-level charac-teristics in Table VIII. These characteristics are defined in Table I.
Regression 1 in Table VIII confirms that ASVI, on a stand alone basis,strongly predicts first-day IPO return. The regression coefficient of 0.275 sug-gests that a one-standard-deviation increase in ASVI (0.168) leads to a 4.62%(=0.168 × 0.275) higher first-day return. While regression 2 confirms the pre-dictive power of the news variable, Media, as documented in Liu, Sherman,and Zhang (2009), ASVI seems to be a better predictor than Media in terms ofa more significant regression coefficient and a higher R2 in our sample of IPOs.Regression 3 shows that Price Revision is by far the strongest predictor of thefirst-day return. The single Price Revision variable explains more than 23% ofthe variation in first-day returns across IPOs in our sample. Finally, regression4 suggests that changes in aggregate market sentiment do not seem to drivefirst-day IPO returns, which is not too surprising given that our sample periodcoincides with a relatively cold period for IPOs.
Regressions 4 through 8 in Table VIII control for other IPO characteristics.The predictive power of all four variables remains. In particular, in regression 5,the regression coefficient on ASVI drops slightly to 0.203, but remains highlysignificant. Finally, when we include all four variables in regression 9, we findthat ASVI drives out Media, although this comes from an increase in Media’sstandard error rather than a decrease in its point estimate in the full specifica-tion. Nevertheless, when all variables are included in the full specification (col-umn 9), the only stock-specific attention measure that predicts first-day returnsis ASVI. Moreover, the regression coefficient on ASVI is 0.189, which measuresthe incremental predictive power of ASVI. Even after controlling for almost allexisting variables affecting first-day returns, a one-standard-deviation increasein ASVI still leads to a 3.18% (=0.168 × 0.189) higher first-day return.
In a third analysis, we examine the relation between increased retail at-tention prior to the IPO and the long-run performance of the IPO. Panel B ofFigure 3 summarizes the main findings. The figure plots the mean and medianmarket capitalization and book-to-market equity matched portfolio-adjustedcumulative IPO returns from weeks 5 to 52 after the IPO. The choice of thisreturn horizon is consistent with Figure 2, which shows that the level of retailinvestor attention largely reverts to the pre-IPO level by the end of week 4.15
We focus on the IPOs that experience large first-day returns and further divide
15 We also experiment with skipping the first 3 months after the IPO to take into accountthe market-making and price stabilization efforts by lead underwriters in that period (see Ellis,Michaely, and O’Hara (2000) and Corwin, Harris, and Lipson (2002)). The results are qualitativelysimilar.
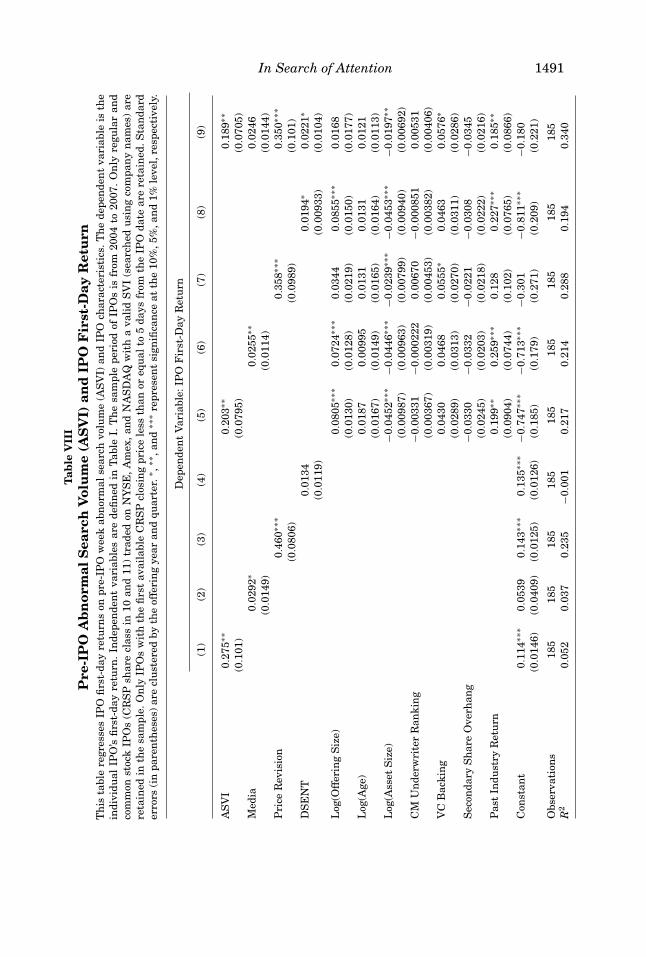
In Search of Attention 1491T
able
VII
IP
re-I
PO
Ab
nor
mal
Sea
rch
Vol
um
e(A
SV
I)an
dIP
OF
irst
-Day
Ret
urn
Th
ista
ble
regr
esse
sIP
Ofi
rst-
day
retu
rns
onpr
e-IP
Ow
eek
abn
orm
alse
arch
volu
me
(AS
VI)
and
IPO
char
acte
rist
ics.
Th
ede
pen
den
tva
riab
leis
the
indi
vidu
alIP
O’s
firs
t-da
yre
turn
.In
depe
nde
nt
vari
able
sar
ede
fin
edin
Tabl
eI.
Th
esa
mpl
epe
riod
ofIP
Os
isfr
om20
04to
2007
.O
nly
regu
lar
and
com
mon
stoc
kIP
Os
(CR
SP
shar
ecl
ass
in10
and
11)
trad
edon
NY
SE
,Am
ex,a
nd
NA
SD
AQ
wit
ha
vali
dS
VI
(sea
rch
edu
sin
gco
mpa
ny
nam
es)
are
reta
ined
inth
esa
mpl
e.O
nly
IPO
sw
ith
the
firs
tav
aila
ble
CR
SP
clos
ing
pric
ele
ssth
anor
equ
alto
5da
ysfr
omth
eIP
Oda
tear
ere
tain
ed.S
tan
dard
erro
rs(i
npa
ren
thes
es)
are
clu
ster
edby
the
offe
rin
gye
aran
dqu
arte
r.∗ ,
∗∗,a
nd
∗∗∗
repr
esen
tsi
gnifi
can
ceat
the
10%
,5%
,an
d1%
leve
l,re
spec
tive
ly.
Dep
ende
nt
Var
iabl
e:IP
OF
irst
-Day
Ret
urn
(1)
(2)
(3)
(4)
(5)
(6)
(7)
(8)
(9)
AS
VI
0.27
5∗∗
0.20
3∗∗
0.18
9∗∗
(0.1
01)
(0.0
795)
(0.0
705)
Med
ia0.
0292
∗0.
0255
∗∗0.
0246
(0.0
149)
(0.0
114)
(0.0
144)
Pri
ceR
evis
ion
0.46
0∗∗∗
0.35
8∗∗∗
0.35
0∗∗∗
(0.0
806)
(0.0
989)
(0.1
01)
DS
EN
T0.
0134
0.01
94∗
0.02
21∗
(0.0
119)
(0.0
0933
)(0
.010
4)
Log
(Off
erin
gS
ize)
0.08
05∗∗
∗0.
0724
∗∗∗
0.03
440.
0855
∗∗∗
0.01
68(0
.013
0)(0
.012
8)(0
.021
9)(0
.015
0)(0
.017
7)L
og(A
ge)
0.01
870.
0099
50.
0131
0.01
310.
0121
(0.0
167)
(0.0
149)
(0.0
165)
(0.0
164)
(0.0
113)
Log
(Ass
etS
ize)
−0.0
452∗
∗∗−0
.044
6∗∗∗
−0.0
239∗
∗∗−0
.045
3∗∗∗
−0.0
197∗
∗(0
.009
87)
(0.0
0963
)(0
.007
99)
(0.0
0940
)(0
.006
92)
CM
Un
derw
rite
rR
anki
ng
−0.0
0331
−0.0
0022
20.
0067
0−0
.000
851
0.00
531
(0.0
0367
)(0
.003
19)
(0.0
0453
)(0
.003
82)
(0.0
0406
)V
CB
acki
ng
0.04
300.
0468
0.05
55∗
0.04
630.
0576
∗(0
.028
9)(0
.031
3)(0
.027
0)(0
.031
1)(0
.028
6)S
econ
dary
Sh
are
Ove
rhan
g−0
.033
0−0
.033
2−0
.022
1−0
.030
8−0
.034
5(0
.024
5)(0
.020
3)(0
.021
8)(0
.022
2)(0
.021
6)P
ast
Indu
stry
Ret
urn
0.19
9∗∗
0.25
9∗∗∗
0.12
80.
227∗
∗∗0.
185∗
∗(0
.090
4)(0
.074
4)(0
.102
)(0
.076
5)(0
.086
6)C
onst
ant
0.11
4∗∗∗
0.05
390.
143∗
∗∗0.
135∗
∗∗−0
.747
∗∗∗
−0.7
13∗∗
∗−0
.301
−0.8
11∗∗
∗−0
.180
(0.0
146)
(0.0
409)
(0.0
125)
(0.0
126)
(0.1
85)
(0.1
79)
(0.2
71)
(0.2
09)
(0.2
21)
Obs
erva
tion
s18
518
518
518
518
518
518
518
518
5R
20.
052
0.03
70.
235
−0.0
010.
217
0.21
40.
288
0.19
40.
340
1492 The Journal of Finance R©
them into two portfolios based on ASVI prior to the IPO. This figure illustratesthat IPOs with large first-day returns driven by investor attention do indeedunderperform firms with similar market capitalizations and book-to-marketequity ratios. In contrast, IPOs experiencing large first-day returns withoutlarge increases in their SVI prior to IPO do not experience post-issuance re-turn reversal. The difference between the two average first-day returns is about9.11%. Both t-tests and nonparametric Wilcoxon tests indicate that the differ-ence is statistically significant at the 1% level.
We formalize the analysis using cross-sectional regressions in Table IX,where we include the same control variables as in Table VIII. Panel A reportsthe results when the dependent variable is the cumulative IPO raw returnfrom weeks 5 to 52 after the IPO. In regression 1, we find that neither ASVInor first-day return alone predict long-run IPO underperformance. Interest-ingly, the interaction between ASVI and first-day return does predict long-rununderperformance (as seen in regression 2). This result is consistent with ourconjecture that for IPOs with high first-day returns that also experience in-creases in retail investor attention, the high first-day returns are partly drivenby price pressure and hence will revert in the long run. In addition, the interac-tion terms between the first-day return and Media, Price Revision, and DSENTare not significant in regressions 3 to 5. As we have shown, SVI more likelycaptures the attention of individual retail investors while Price Revision andMedia capture other aspects of the IPO price-setting process. The insignificanceof the offering price revision variable suggests that it is individual investor at-tention (and not that of institutions) that contributes to the high first-day IPOreturn that is eventually reversed in the long run.
We also repeat the regression analysis using adjusted long-run stock returnspost-IPO. Panel B of Table IX reports the results where the dependent variableis the cumulative IPO raw return adjusted by cumulative industry returns overthe same horizon. In Panel C, the cumulative IPO raw return is adjusted bythe cumulative return of a size and book-to-market matched portfolio (exclud-ing IPO stocks issued in the past 5 years). These return adjustments hardlychange our main conclusion. The regression coefficient on the interaction termbetween ASVI and first-day return is always negative and significant, confirm-ing the existence of long-run underperformance among IPOs with high first-dayreturns that also experience increases in retail investor attention prior to theIPO.
To summarize, two interesting empirical results arise from the analysis ofIPO stocks. First, we find that ASVI has strong incremental predictive powerfor first-day IPO return. Second, ASVI also predicts long-run underperformanceamong IPO stocks with high first-day returns. The results are consistent withthe price pressure hypothesis as described in Barber and Odean (2008).
C. An Alternative Interpretation
Now we discuss an alternative interpretation of ASVI’s predictability forIPO returns. It could be the case that market participants have an expectation
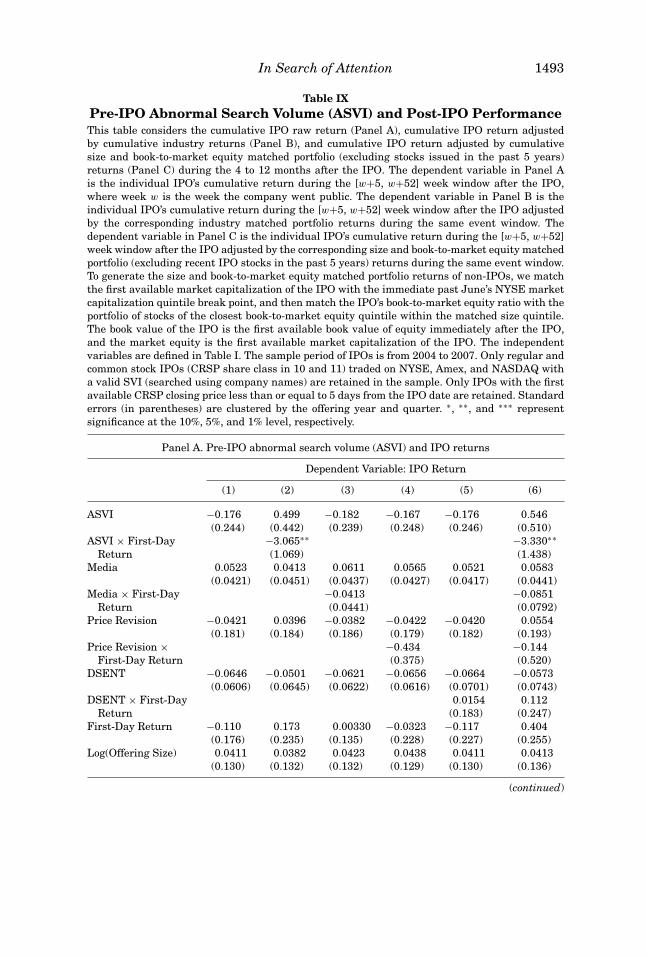
In Search of Attention 1493
Table IXPre-IPO Abnormal Search Volume (ASVI) and Post-IPO PerformanceThis table considers the cumulative IPO raw return (Panel A), cumulative IPO return adjustedby cumulative industry returns (Panel B), and cumulative IPO return adjusted by cumulativesize and book-to-market equity matched portfolio (excluding stocks issued in the past 5 years)returns (Panel C) during the 4 to 12 months after the IPO. The dependent variable in Panel Ais the individual IPO’s cumulative return during the [w+5, w+52] week window after the IPO,where week w is the week the company went public. The dependent variable in Panel B is theindividual IPO’s cumulative return during the [w+5, w+52] week window after the IPO adjustedby the corresponding industry matched portfolio returns during the same event window. Thedependent variable in Panel C is the individual IPO’s cumulative return during the [w+5, w+52]week window after the IPO adjusted by the corresponding size and book-to-market equity matchedportfolio (excluding recent IPO stocks in the past 5 years) returns during the same event window.To generate the size and book-to-market equity matched portfolio returns of non-IPOs, we matchthe first available market capitalization of the IPO with the immediate past June’s NYSE marketcapitalization quintile break point, and then match the IPO’s book-to-market equity ratio with theportfolio of stocks of the closest book-to-market equity quintile within the matched size quintile.The book value of the IPO is the first available book value of equity immediately after the IPO,and the market equity is the first available market capitalization of the IPO. The independentvariables are defined in Table I. The sample period of IPOs is from 2004 to 2007. Only regular andcommon stock IPOs (CRSP share class in 10 and 11) traded on NYSE, Amex, and NASDAQ witha valid SVI (searched using company names) are retained in the sample. Only IPOs with the firstavailable CRSP closing price less than or equal to 5 days from the IPO date are retained. Standarderrors (in parentheses) are clustered by the offering year and quarter. ∗, ∗∗, and ∗∗∗ representsignificance at the 10%, 5%, and 1% level, respectively.
Panel A. Pre-IPO abnormal search volume (ASVI) and IPO returns
Dependent Variable: IPO Return
(1) (2) (3) (4) (5) (6)
ASVI −0.176 0.499 −0.182 −0.167 −0.176 0.546(0.244) (0.442) (0.239) (0.248) (0.246) (0.510)
ASVI × First-Day −3.065∗∗ −3.330∗∗Return (1.069) (1.438)
Media 0.0523 0.0413 0.0611 0.0565 0.0521 0.0583(0.0421) (0.0451) (0.0437) (0.0427) (0.0417) (0.0441)
Media × First-Day −0.0413 −0.0851Return (0.0441) (0.0792)
Price Revision −0.0421 0.0396 −0.0382 −0.0422 −0.0420 0.0554(0.181) (0.184) (0.186) (0.179) (0.182) (0.193)
Price Revision × −0.434 −0.144First-Day Return (0.375) (0.520)
DSENT −0.0646 −0.0501 −0.0621 −0.0656 −0.0664 −0.0573(0.0606) (0.0645) (0.0622) (0.0616) (0.0701) (0.0743)
DSENT × First-Day 0.0154 0.112Return (0.183) (0.247)
First-Day Return −0.110 0.173 0.00330 −0.0323 −0.117 0.404(0.176) (0.235) (0.135) (0.228) (0.227) (0.255)
Log(Offering Size) 0.0411 0.0382 0.0423 0.0438 0.0411 0.0413(0.130) (0.132) (0.132) (0.129) (0.130) (0.136)
(continued)
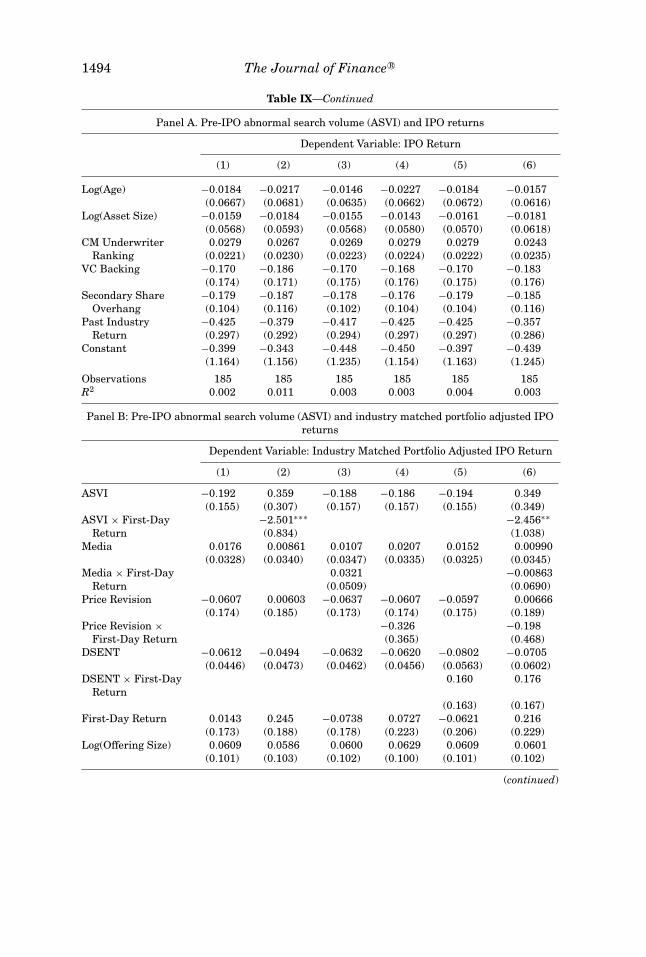
1494 The Journal of Finance R©
Table IX—Continued
Panel A. Pre-IPO abnormal search volume (ASVI) and IPO returns
Dependent Variable: IPO Return
(1) (2) (3) (4) (5) (6)
Log(Age) −0.0184 −0.0217 −0.0146 −0.0227 −0.0184 −0.0157(0.0667) (0.0681) (0.0635) (0.0662) (0.0672) (0.0616)
Log(Asset Size) −0.0159 −0.0184 −0.0155 −0.0143 −0.0161 −0.0181(0.0568) (0.0593) (0.0568) (0.0580) (0.0570) (0.0618)
CM Underwriter 0.0279 0.0267 0.0269 0.0279 0.0279 0.0243Ranking (0.0221) (0.0230) (0.0223) (0.0224) (0.0222) (0.0235)
VC Backing −0.170 −0.186 −0.170 −0.168 −0.170 −0.183(0.174) (0.171) (0.175) (0.176) (0.175) (0.176)
Secondary Share −0.179 −0.187 −0.178 −0.176 −0.179 −0.185Overhang (0.104) (0.116) (0.102) (0.104) (0.104) (0.116)
Past Industry −0.425 −0.379 −0.417 −0.425 −0.425 −0.357Return (0.297) (0.292) (0.294) (0.297) (0.297) (0.286)
Constant −0.399 −0.343 −0.448 −0.450 −0.397 −0.439(1.164) (1.156) (1.235) (1.154) (1.163) (1.245)
Observations 185 185 185 185 185 185R2 0.002 0.011 0.003 0.003 0.004 0.003
Panel B: Pre-IPO abnormal search volume (ASVI) and industry matched portfolio adjusted IPOreturns
Dependent Variable: Industry Matched Portfolio Adjusted IPO Return
(1) (2) (3) (4) (5) (6)
ASVI −0.192 0.359 −0.188 −0.186 −0.194 0.349(0.155) (0.307) (0.157) (0.157) (0.155) (0.349)
ASVI × First-Day −2.501∗∗∗ −2.456∗∗Return (0.834) (1.038)
Media 0.0176 0.00861 0.0107 0.0207 0.0152 0.00990(0.0328) (0.0340) (0.0347) (0.0335) (0.0325) (0.0345)
Media × First-Day 0.0321 −0.00863Return (0.0509) (0.0690)
Price Revision −0.0607 0.00603 −0.0637 −0.0607 −0.0597 0.00666(0.174) (0.185) (0.173) (0.174) (0.175) (0.189)
Price Revision × −0.326 −0.198First-Day Return (0.365) (0.468)
DSENT −0.0612 −0.0494 −0.0632 −0.0620 −0.0802 −0.0705(0.0446) (0.0473) (0.0462) (0.0456) (0.0563) (0.0602)
DSENT × First-DayReturn
0.160 0.176
(0.163) (0.167)First-Day Return 0.0143 0.245 −0.0738 0.0727 −0.0621 0.216
(0.173) (0.188) (0.178) (0.223) (0.206) (0.229)Log(Offering Size) 0.0609 0.0586 0.0600 0.0629 0.0609 0.0601
(0.101) (0.103) (0.102) (0.100) (0.101) (0.102)
(continued)
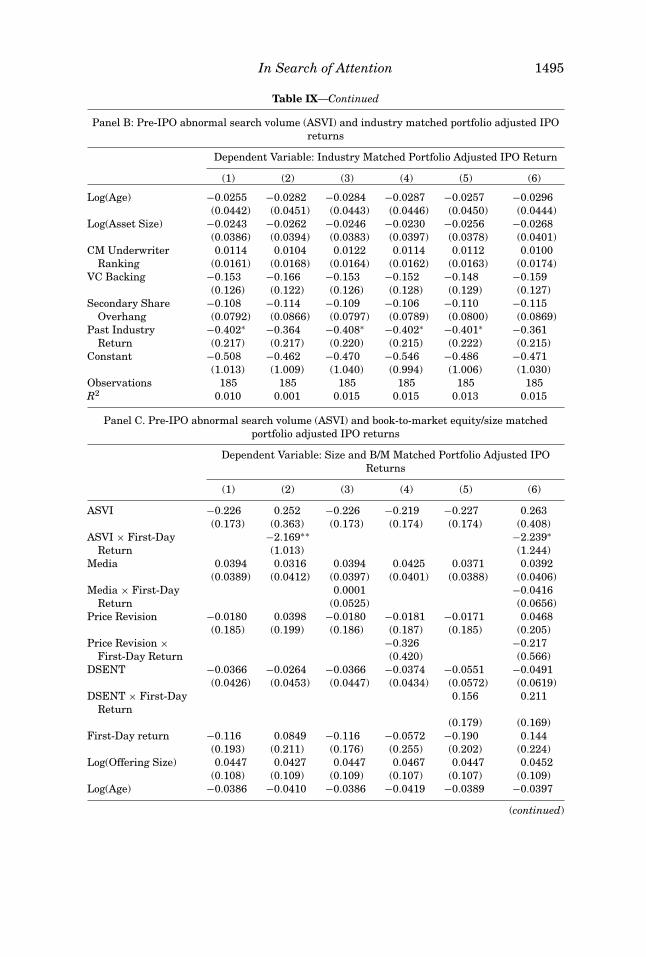
In Search of Attention 1495
Table IX—Continued
Panel B: Pre-IPO abnormal search volume (ASVI) and industry matched portfolio adjusted IPOreturns
Dependent Variable: Industry Matched Portfolio Adjusted IPO Return
(1) (2) (3) (4) (5) (6)
Log(Age) −0.0255 −0.0282 −0.0284 −0.0287 −0.0257 −0.0296(0.0442) (0.0451) (0.0443) (0.0446) (0.0450) (0.0444)
Log(Asset Size) −0.0243 −0.0262 −0.0246 −0.0230 −0.0256 −0.0268(0.0386) (0.0394) (0.0383) (0.0397) (0.0378) (0.0401)
CM Underwriter 0.0114 0.0104 0.0122 0.0114 0.0112 0.0100Ranking (0.0161) (0.0168) (0.0164) (0.0162) (0.0163) (0.0174)
VC Backing −0.153 −0.166 −0.153 −0.152 −0.148 −0.159(0.126) (0.122) (0.126) (0.128) (0.129) (0.127)
Secondary Share −0.108 −0.114 −0.109 −0.106 −0.110 −0.115Overhang (0.0792) (0.0866) (0.0797) (0.0789) (0.0800) (0.0869)
Past Industry −0.402∗ −0.364 −0.408∗ −0.402∗ −0.401∗ −0.361Return (0.217) (0.217) (0.220) (0.215) (0.222) (0.215)
Constant −0.508 −0.462 −0.470 −0.546 −0.486 −0.471(1.013) (1.009) (1.040) (0.994) (1.006) (1.030)
Observations 185 185 185 185 185 185R2 0.010 0.001 0.015 0.015 0.013 0.015
Panel C. Pre-IPO abnormal search volume (ASVI) and book-to-market equity/size matchedportfolio adjusted IPO returns
Dependent Variable: Size and B/M Matched Portfolio Adjusted IPOReturns
(1) (2) (3) (4) (5) (6)
ASVI −0.226 0.252 −0.226 −0.219 −0.227 0.263(0.173) (0.363) (0.173) (0.174) (0.174) (0.408)
ASVI × First-Day −2.169∗∗ −2.239∗Return (1.013) (1.244)
Media 0.0394 0.0316 0.0394 0.0425 0.0371 0.0392(0.0389) (0.0412) (0.0397) (0.0401) (0.0388) (0.0406)
Media × First-Day 0.0001 −0.0416Return (0.0525) (0.0656)
Price Revision −0.0180 0.0398 −0.0180 −0.0181 −0.0171 0.0468(0.185) (0.199) (0.186) (0.187) (0.185) (0.205)
Price Revision × −0.326 −0.217First-Day Return (0.420) (0.566)
DSENT −0.0366 −0.0264 −0.0366 −0.0374 −0.0551 −0.0491(0.0426) (0.0453) (0.0447) (0.0434) (0.0572) (0.0619)
DSENT × First-DayReturn
0.156 0.211
(0.179) (0.169)First-Day return −0.116 0.0849 −0.116 −0.0572 −0.190 0.144
(0.193) (0.211) (0.176) (0.255) (0.202) (0.224)Log(Offering Size) 0.0447 0.0427 0.0447 0.0467 0.0447 0.0452
(0.108) (0.109) (0.109) (0.107) (0.107) (0.109)Log(Age) −0.0386 −0.0410 −0.0386 −0.0419 −0.0389 −0.0397
(continued)
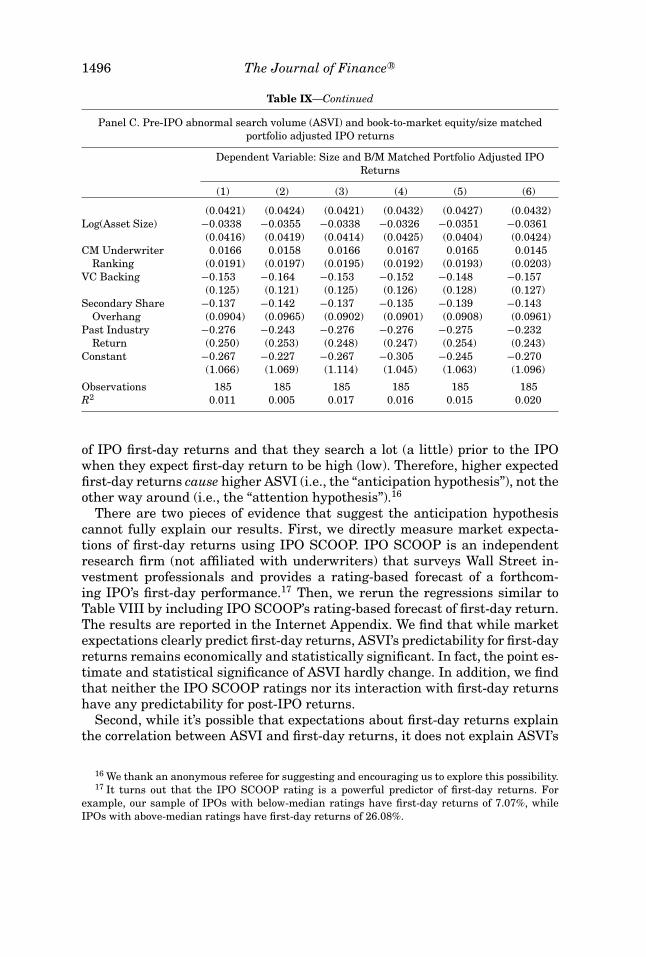
1496 The Journal of Finance R©
Table IX—Continued
Panel C. Pre-IPO abnormal search volume (ASVI) and book-to-market equity/size matchedportfolio adjusted IPO returns
Dependent Variable: Size and B/M Matched Portfolio Adjusted IPOReturns
(1) (2) (3) (4) (5) (6)
(0.0421) (0.0424) (0.0421) (0.0432) (0.0427) (0.0432)Log(Asset Size) −0.0338 −0.0355 −0.0338 −0.0326 −0.0351 −0.0361
(0.0416) (0.0419) (0.0414) (0.0425) (0.0404) (0.0424)CM Underwriter 0.0166 0.0158 0.0166 0.0167 0.0165 0.0145
Ranking (0.0191) (0.0197) (0.0195) (0.0192) (0.0193) (0.0203)VC Backing −0.153 −0.164 −0.153 −0.152 −0.148 −0.157
(0.125) (0.121) (0.125) (0.126) (0.128) (0.127)Secondary Share −0.137 −0.142 −0.137 −0.135 −0.139 −0.143
Overhang (0.0904) (0.0965) (0.0902) (0.0901) (0.0908) (0.0961)Past Industry −0.276 −0.243 −0.276 −0.276 −0.275 −0.232
Return (0.250) (0.253) (0.248) (0.247) (0.254) (0.243)Constant −0.267 −0.227 −0.267 −0.305 −0.245 −0.270
(1.066) (1.069) (1.114) (1.045) (1.063) (1.096)
Observations 185 185 185 185 185 185R2 0.011 0.005 0.017 0.016 0.015 0.020
of IPO first-day returns and that they search a lot (a little) prior to the IPOwhen they expect first-day return to be high (low). Therefore, higher expectedfirst-day returns cause higher ASVI (i.e., the “anticipation hypothesis”), not theother way around (i.e., the “attention hypothesis”).16
There are two pieces of evidence that suggest the anticipation hypothesiscannot fully explain our results. First, we directly measure market expecta-tions of first-day returns using IPO SCOOP. IPO SCOOP is an independentresearch firm (not affiliated with underwriters) that surveys Wall Street in-vestment professionals and provides a rating-based forecast of a forthcom-ing IPO’s first-day performance.17 Then, we rerun the regressions similar toTable VIII by including IPO SCOOP’s rating-based forecast of first-day return.The results are reported in the Internet Appendix. We find that while marketexpectations clearly predict first-day returns, ASVI’s predictability for first-dayreturns remains economically and statistically significant. In fact, the point es-timate and statistical significance of ASVI hardly change. In addition, we findthat neither the IPO SCOOP ratings nor its interaction with first-day returnshave any predictability for post-IPO returns.
Second, while it’s possible that expectations about first-day returns explainthe correlation between ASVI and first-day returns, it does not explain ASVI’s
16 We thank an anonymous referee for suggesting and encouraging us to explore this possibility.17 It turns out that the IPO SCOOP rating is a powerful predictor of first-day returns. For
example, our sample of IPOs with below-median ratings have first-day returns of 7.07%, whileIPOs with above-median ratings have first-day returns of 26.08%.
In Search of Attention 1497
predictability for IPO return reversal. It seems less reasonable to believe thatinvestors, anticipating a return reversal of an IPO, search more for it beforethe IPO. In contrast, the attention hypothesis explains ASVI’s predictability forboth first-day returns and long-run reversals. In our view, while we certainlycannot rule out the anticipation hypothesis, the attention hypothesis is a moreconsistent explanation of the evidence.
V. Conclusion
Existing measures of investor attention such as turnover, extreme returns,news, and advertising expense are indirect proxies. In this paper, we propose anew and direct measure of investor attention using search frequency in Google(SVI). In a sample of Russell 3000 stocks from 2004 to 2008, we first show thatSVI is correlated with but different from existing proxies for investor attention.We also provide evidence that SVI captures the attention of retail investors.Because SVI is a direct measure of individual attention, we use it to test theattention-induced price pressure hypothesis of Barber and Odean (2008). Wefind that an increase in SVI for Russell 3000 stocks predicts higher stock pricesin the next 2 weeks and an eventual price reversal within the year. SVI alsocontributes to the large first-day return and long-run underperformance for asample of IPO stocks.
Beyond testing theories of attention, this paper also illustrates the useful-ness of search data in financial applications. To our knowledge, this paper andMondria, Wu, and Zhang (2010) are the first to use internet search volume infinancial economics. As empiricists, we rarely observe the aggregate interestof investors other than via equilibrium outcomes such as volume and returns.Search volume is an objective way to reveal and quantify the interests of in-vestors and therefore should have many other potential applications in finance.We leave such applications for future research.
REFERENCESBaker, Malcolm, and Jeffrey Wurgler, 2006, Investor sentiment and the cross-section of stock
returns, Journal of Finance 61, 1645–1680.Baker, Malcolm, and Jeffrey Wurgler, 2007, Investor sentiment in the stock market, Journal of
Economic Perspectives 21, 129–151.Barber, Brad M., and Terrance Odean, 2008, All that glitters: The effect of attention and news on
the buying behavior of individual and institutional investors, Review of Financial Studies 21,785–818.
Barber, Brad M., Terrance Odean, and Ning Zhu, 2009, Do retail trades move markets? Review ofFinancial Studies 21, 151–186.
Battalio, Robert, 1997, Third market broker-dealers: Cost competitors or cream skimmers? Journalof Finance 52, 341–352.
Battalio, Robert, Jason Greene, and Robert Jennings, 1997, How do competing specialistsand preferencing dealers affect market quality? Review of Financial Studies 10, 969–993.
Bessembinder, Hendrik, 2003, Selection biases and cross-market trading cost comparisons, Work-ing paper, University of Utah.

1498 The Journal of Finance R©
Bessembinder, Hendrik, William Maxwell, and Kumar Venkataraman, 2006, Market transparency,liquidity externalities, and institutional trading costs in corporate bonds, Journal of FinancialEconomics 82, 251–288.
Boehmer, E., R. Jennings, and L. Wei, 2007, Public disclosure and private decisions: Equity marketexecution quality and order routing, Review of Financial Studies 20, 15–58.
Brav, Alon, Christopher Geczy, Paul A. Gompers, 2000, Is the abnormal return following equityissuances anomalous? Journal of Financial Economics 56, 209–249.
Caglio, Cecilia, and Stewart Mayhew, 2008, Equity trading and the allocation of market revenuedata, Working paper, U.S. Securities and Exchange Commission.
Carter, Richard B., and Steve Manaster, 1990, Initial public offerings and underwriter repuation,Journal of Finance 45, 1045–1067.
Chiang, Yao-Min, Yiming Qian, and Ann E. Sherman, 2010, Endogenous entry and partial ad-justment in IPO auctions: Are institutional investors better informed? Review of FinancialStudies, 23, 1200–1230.
Chemmanur, Thomas, and An Yan, 2009, Advertising, attention, and stock returns, Working paper,Boston College and Fordham University.
Choi, Hyunyoung, and Hal Varian, 2009, Predicting the present with Google Trends, Workingpaper, Google Inc.
Chordia, Tarun, Sahn-Wook Huh, and Avanidhar Subrahmanyam, 2007, The cross-section of ex-pected trading activity, Review of Financial Studies 20, 709–740.
Cook, Douglas O., Robert Kieschnick, and Robert A. Van Ness, 2006, On the marketing of IPOs,Journal of Financial Economics 82, 35–61.
Cornelli, Francesca, David Goldreich, and Alexander Ljungqvist, 2006, Investor sentiment and preIPO markets, Journal of Finance 61, 1187–1216.
Corwin, Shane, Jeffrey H. Harris, and Marc L. Lipson, The development of secondary marketliquidity for NYSE-listed IPOs, Journal of Finance 59, 2339–2373.
Da, Zhi, Joseph Engelberg, and Pengjie Gao, 2010, In search of fundamentals, Working paper,University of Notre Dame and University of North Carolina at Chapel Hill.
Daniel, Kent D., Mark Grinblatt, Sheridan Titman, and Russ Wermers, 1997, Measuring mutualfund performance with characteristic-based benchmarks, Journal of Finance 52, 1035–1058.
Demers, Elizabeth, and Katharina Lewellen, 2003, The marketing role of IPOs: Evidence frominternet stocks, Journal of Financial Economics 68, 413–437.
Easley, David, and Maureen O’Hara, 1987, Price, trade size, and information in securities markets,Journal of Financial Economics 19, 69–90.
Ellis, Katrina, Roni Michaely, and Maureen O’Hara, 2000, When the underwriter is the marketmaker: An examination of trading in the IPO aftermarket, Journal of Finance 55, 1039–1074.
Engelberg, Joseph, Caroline Sasseville, and Jared Williams, 2011, Market madness? The case ofmad money, Management Science, forthcoming.
Fama, Eugene F., and James D. MacBeth, 1973, Risk return and equilibrium: Empirical tests,Journal of Political Economy 81, 607–636.
Fang, Lily, and Joel Peress, 2009, Media coverage and the cross-section of stock returns, Journalof Finance 64, 2023–2052.
Gervais, Simon, Ron Kaniel, and Dan H. Mingelgrin, 2001, The high-volume return premium,Journal of Finance 56, 877–919.
Ginsberg, Jeremy, Matthew H. Mohebbi, Rajan S. Patel, Lynnette Brammer, Mark S. Smolinski,and Larry Brilliant, 2009, Detecting influenza epidemics using search engine query data,Nature 457, 1012–1014.
Grullon, Gustavo, George Kanatas, and James P. Weston, 2004, Advertising, breath of ownership,and liquidity, Review of Financial Studies 17, 439–461.
Hanley, Kathleen Weiss., 1993, The underpricing of initial public offerings and the partial adjust-ment phenomenon, Journal of Financial Economics 34, 231–250.
Harris, Larry, 2003, Trading and Exchanges: Market Microstructure for Practitioners (OxfordUniversity Press, New York, NY).
Hirshleifer, David, and Siew Hong Teoh, 2003, Limited attention, information disclosure, andfinancial reporting, Journal of Accounting and Economics 36, 337–386.

In Search of Attention 1499
Hou, Kewei, Lin Peng, and Wei Xiong, 2008, A tale of two anomalies: The implications of in-vestor attention for price and earnings momentum, Working paper, Ohio State University andPrinceton University.
Hvidkjaer, Soeren., 2008, Small trades and the cross-section of stock returns, Review of FinancialStudies 21, 1123–1151.
Ibbotson, Rorger, and Jeffrey F. Jaffe, 1975, “Hot issue” markets, Journal of Finance 30, 1027–1042.Kahneman, Daniel., 1973, Attention and Effort (Prentice-Hall, Englewood Cliffs, NJ).Lee, Charles M. C., and Balkrishna Radhakrishna, 2000, Inferring investor behavior: Evidence
from TORQ data, Journal of Financial Markets 3, 83–111.Liu, Laura, Ann E. Sherman, and Yong Zhang, 2009, The role of media in initial public offerings,
Working paper, DePaul University and Hong Kong University of Science and Technology.Ljungqvist, Alexander, Vikram Nanda, and Raj Singh, 2006, Hot markets, investor sentiment, and
IPO pricing, Journal of Business 79, 1667–1702.Lou, Dong, 2008, Attracting investor attention through advertising, Working paper, London School
of Economics and Political Science.Loughran, Tim, and Bill McDonald, 2011, When is a liability not a liability? Textual analysis,
dictionaries, and 10-Ks, Journal of Finance 66, 35–65.Loughran, Tim, and Jay Ritter, 1995, The new issues puzzle, Journal of Finance 50, 23–51.Loughran, Tim, and Jay Ritter, 2002, Why don’t issuers get upset about leaving money on the table
in IPOs? Review of Financial Studies 15, 413–443.Lowry, Michelle, and G. William Schwert, 2002, IPO market cycle: Bubbles or sequential learning?
Journal of Finance 57, 1171–1200.Merton, Robert C., 1987, A simple model of capital market equilibrium with incomplete informa-
tion, Journal of Finance 42, 483–510.Mondria, Jordi, Thomas Wu, and Yi Zhang, 2010, The determinants of international investment
and attention allocation: using internet search query data, Journal of International Economics82, 85–95.
Newey, Whitney, and Kenneth West, 1987, A simple positive semi-definite, heteroskedasticity andautocorrelation consistent covariance matrix, Econometrica 55, 703–708.
Peng, Lin, and Wei Xiong, 2006, Investor attention, overconfidence and category learning, Journalof Financial Economics 80, 563–602.
Ritter, Jay R., 1984, The “hot issue” market of 1980, The Journal of Business 57, 215–240.Ritter, Jay, and Ivo Welch, 2002, A review of IPO activity, pricing, and allocations, Journal of
Finance 57, 1795–1828.Seasholes, Mark S., and Guojun Wu, 2007, Predictable behavior, profits, and attention, Journal of
Empirical Finance 14, 590–610.Sims, Christopher A., 2003, Implications of rational inattention, Journal of Monetary Economics
50, 665–690.Tetlock, Paul C., 2007, Giving content to investor sentiment: The role of media in the stock market,
Journal of Finance 62, 1139–1168.Tetlock, Paul C., 2010, Does public financial news resolve asymmetric information? Review of
Financial Studies 23, 3520–3557.Yuan, Yu, 2008, Attention and trading, Working paper, University of Iowa.