Embed Size (px)
Citation preview

9
In-Service Line Monitoring for Passive Optical Networks
Nazuki Honda NTT Access Service System Laboratories, NTT Corp.
Japan
1. Introduction
Broadband optical access services are already being deployed to realize fiber to the home
(FTTH) networks that support high speed internet and video on demand services. The
number of FTTH/B (building) subscribers is increasing rapidly throughout the world. It was
about 61 million by the end of 2010 and is expected to reach 227 million by 2015 (IDATE,
2011). Broadband access network provision currently requires thousands of optical fibers to
be accommodated in a central office (CO) for an optical access network. As we must
respond to the huge demand for FTTH, we can no longer ignore the operation,
administration, and maintenance (OAM) costs in addition to the construction cost (ECOC
work shop 8, 2007). Optical fiber maintenance for outside plant is discussed in ITU-T SG6
and seven recommendations, L.25, L.40, L.41, L.53, L.66, L.68, and L.85 have been published.
Recommendations L.25 and L.53 describe the fundamental need for optical fiber
maintenance functions for preventive and post-fault maintenance. Fiber monitoring and
fiber fault location are required as fundamental functions for optical fiber cable network
maintenance. These functions make it possible to reduce both troubleshooting time and
human resources when repairing damaged cable.
When we monitor an optical fiber network, the network configuration is a critical factor as regards the monitoring method. Passive optical networks (PONs) provide the main FTTH service based on GE-PON (Gigabit Ethernet PON) or G-PON (Gigabit-PON), where several customers’ optical network terminals (ONTs) share an optical line terminal (OLT) and an optical fiber (IEEE Std 802.3ah; ITU-T G984.1). The versatile optical fiber monitoring system uses optical time domain reflectometry (OTDR) to locate a fault by measuring an optical pulse response (e.g. Nakao, 2001). However, these PON systems use a simple power splitter near the customer's home to provide an economical IP service, therefore a conventional testing system, where an OTDR is installed in a central office, is unstable because Rayleigh backscattered signals from all the branched optical fibers accumulate in the OTDR trace. Several fiber fault location techniques have been proposed for use with the branched optical fibers of PONs. One example is the proposal by Sankawa et al. (Sankawa, et al., 1990). However, this approach is difficult to employ practically because the change in the loss value becomes small as the number of branches increases. The multi-wavelength OTDR technique uses an expensive arrayed waveguide grating to assign an individual testing wavelength to each branched fiber (Tanaka, et al., 1996). This method requires us to design
www.intechopen.com

Optical Fiber Communications and Devices
204
the characteristics of the waveguide for a specific communication light wavelength. A monitoring method that embeds the OTDR functions in each ONT (Schmuck, et al., 2006) cannot transmit a measured OTDR trace when the optical network has a fault.
This chapter is devoted to an in-service line monitoring system for branched PON fibers. Section 2 presents the basic concepts of an in-service line monitoring system for PON fibers. By employing individually assigned Brillouin frequency shifts (BFS) for the branching region and using a 1650 nm Brillouin OTDR (B-OTDR), we can detect the profile of each branching fiber. Section 3 discusses the design for the BFS separation of branching fibers taking account of the outside plant environment. BFS can be controlled by controlling the amount of dopant in the optical fiber core. The system dynamic range of in-service line PON fiber monitoring is the focus of Section 4 where we discuss 1650 nm B-OTDR and the transmission system power budget in GE-PON. Section 5 describes the measurement of a fiber with an 8-branched optical splitter using a 1650 nm B-OTDR and BFS assigned fiber in each branching region. The in-service line testing of a GE-PON transmission is demonstrated in Section 6.
2. In-service line monitoring system in PONs
2.1 In-service line monitoring technique using U-band test light for access network
An optical fiber line testing system is essential for reducing maintenance costs and
improving service reliability in optical fiber networks. To perform maintenance system
testing on in-service fibers without causing any degradation in the transmission quality, we
use a test light whose wavelength is different from that of the communication light, and
install a filter in front of the ONT that cuts off only the test light. Figure 1 shows the
wavelength allocation. The ITU-T Supplement on the distributed service network defines
the spectrum band for a wavelength division multiplexing (WDM) transmission system. A
long wavelength band (L-band) that extends to 1625 nm is used for DWDM/CWDM
transmission, and Recommendation G. 983 defines the 1480-1580 nm band (in the S-band)
for downstream G-PON and additional service signals to be distributed simultaneously. An
ultra long wavelength band (U-band) of 1625-1675 nm can be used as the maintenance band
for various services. When monitoring branched PON fiber, the technique must allow in-
service line monitoring because other branched fibers accommodated in the same splitter
may still be active.
Figure 2 shows the configuration of an optical fiber line testing system for PONs with an optical splitter installed in a central office (Sp-C) and an optical splitter installed in outside plant (Sp-O) near the customer's home (Enomoto, et al., 2005). This testing system comprises an optical testing module (OTM) that contains a B-OTDR, optical fiber selectors (FS) that select the fibers to be tested, an optical coupler to introduce test lights into an optical fiber line, and termination cables with an optical filter that allows a communication light to pass but not a test light. Termination filters are installed in front of the ONTs to cut off the test light. The pass band of the termination filter is designed to be 1260-1625 nm in accordance with the ITU-T L.41 recommendation. The control terminal orders the OTM to perform various optical fiber tests through a data communication network (DCN). This system automatically and remotely measures the optical fiber characteristics, and detects and locates faults in optical fiber networks.
www.intechopen.com

In-Service Line Monitoring for Passive Optical Networks
205
[nm]
C-band
1530-
1565 nm
O-band
1260-1360 nm
1311 1331 13511371139112711291 1411 14311451 147114911511 15311551 157115911611
18 gridG694.2 (CWDM)
U-band 1625-1675 nm(Maintenance band)
1300 1550 1600150014001260 1360 1480
VIDEO (1550-1560)
DIGITAL (1539-1565)
UP DOWN
1650
EXTENSION EXTENSION
G983.3 (PON)
L-band
1565-
1625 nm
S-band
1460-
1530 nm
E-band
1360-1460 nm
G.Sup39 and L.41
Fig. 1. Wavelength allocation
ONT
Central office
Sp-O
OTM: Optical testing unit (Brillouin OTDR etc)
OLT: Optical line terminationONT: Optical network terminationFS: Fiber selectorDCN: Data communication networkSp-C: Optical splitter in central officeSp-O: Optical splitter in outside plant
Controlterminal
DCN
Drop cable
Branching region
ONT
OLT
FS
OTM
: Optical filter
: Optical splitter,
ONT
Sp-C
Termination cable with filter
Fig. 2. Configuration of optical fiber line testing system
www.intechopen.com

Optical Fiber Communications and Devices
206
2.2 PON fiber monitoring using fibers with individually assigned Brillouin frequencies
To enable us to monitor individual branched fibers, we install fibers with individually assigned BFSs in the branched region(Shimizu, et al., 1995; Honda, et al., 2006a; Honda, et al. 2006b). Figure 3 shows the basic configuration of a PON monitoring technique that uses 1650 nm B-OTDR for in-service line monitoring, and the Brillouin scattering light spectra in the branched region. When we input a test light, we can distinguish the Brillouin spectrum peak frequency ν1, ν2, ...,νn from each branched fiber. If the peak power of a Brillouin spectrum changes from its initial level, we can determine that the optical fiber with the BFS is faulty. Thus, we can measure the fault location in a branched region from the BFS peak power distribution of the test fibers.
1650 nm Brillouin OTDR
Test light
OLT
Signal light
1260-1625 nm
ONTνn
ONT
ONT
ONT
Brillouin
backscattering light
ν1
ν2
ν3
BFS :
...
Δν
Test light
...
BFS peaks in branched region
Frequency
Feeder Drop
(BFS assigned identification fibers)
Splitter
n-branch
10 GHz
νn ⋅ ⋅ ⋅ ν3 ν2 ν1
Po
wer
in
ten
sity
Fig. 3. Fiber monitoring technique for PONs with branched fibers assigned with individual BFSs and BFS spectra in branched region
3. Design of Brillouin frequency shift assigned fiber
To clarify the operating area of the monitoring method proposed in section 2, we discuss the
applicable PON branching number derived from the design of the BFS assigned
identification fiber in the branched region.
3.1 Design of BFS separation of branched PON fibers for outside environment
The design of BFS assigned fiber is important if we are to realize a method for monitoring a branched PON. The BFS separation Δ┥ of the fibers shown in Fig. 3 must be designed taking account of the temperature-induced fluctuation in the BFS, and strain dependent changes that occur in an outside environment. Δ┥ can be described as
www.intechopen.com

In-Service Line Monitoring for Passive Optical Networks
207
Δν ≥ w + ΔS·CS + ΔT·CT (1)
Here w, ΔS, CS, ΔT, and CT are the full width at half-maximum (FWHM) of the Brillouin
gain spectrum, the fluctuation strain and temperature, and their BFS coefficients, respectively. The Brillouin frequency shift depends on temperature and tension, and the values are 1.08 MHz/ºC and 500 MHz/1% strain at 1650 nm, respectively (Izumita, et al., 1997). Since the residual strain change in an optical fiber cable installed as a feeder section is less than 0.01% (Kawataka, et al., 2003), for simplicity we assume that the BFS change has negligible strain dependence. An outside plant is designed to operate in a -40 to 75 °C temperature range (ITU-T L37).
Figure 4 shows the BFS spectra of branching PON fibers (BFSs =ν1,ν2,ν3, … andνn) at
temperatures of -40 and 75 °C, and the BFS spectrum of fiber 5 at a typical room temperature of 25 °C. Since the drop cables are accommodated in a customer's residence, we must consider a relative maximum temperature change of 65 °C. Using a typical w value of 50 MHz (Azuma, et al., 1988) and a CT of 1.08 MHz/°C, we find that the BFS separation must be more than 120 MHz. To monitor the n-branched PON fiber, we need 120 × (n-1) MHz BFS separation.
-40ºC: Outside plant25ºC
Typical room temperature
75ºC: Outside plant
ν1 ν2 ν3 ⋅ ⋅ ⋅
ν1 ν2 ν3 ⋅ ⋅ ⋅
BFS
BFS25ºC
65ºC
50ºC
νn
νnν5
ν5
Fig. 4. Fluctuation in BFS spectra caused by temperature in outside plant environment
We can fabricate the large BFS fiber that we designed by adjusting the dopant concentration and taking account of the connection loss with single-mode fiber (SMF) by employing a germanium oxide (GeO2) and fluorine (F) co-doping technique. We can assume that the saturation value of the aging loss increase of the fiber when F and GeO2 are co-doped is rarely different from the value for SMF (Iino, et al., 1989). Figure 5 shows that the design of the BFS for optical fibers depends on the GeO2 and F dopant concentrations in the fiber core. GeO2 and F were used to fabricate the identification fibers because as dopants their effects on the refractive index are opposite, but their effects on the BFS are the same, and they are also the most widely used dopants (Iida, et al., 2007). Assuming the maximum BFS separation that we can design is 1.5 GHz and Δν is 120 MHz, we can realize up to 13 kinds
of BFS assigned fiber. This PON monitoring method employing BFS assigned fibers can be applied for a fiber network using 8-branched splitter in an outside plant.
www.intechopen.com

Optical Fiber Communications and Devices
208
Pure silica fiber with F-doped cladding
Fiber core doped with GeO2
Fiber core co-doped with GeO2 and F.
Density of GeO2 [wt%]
3.0
Den
sit
y o
f F
[w
t%]
0 42 106 12 148
1.5
2.5
1.0
2.0
SMF
#4
#1
#7 #6
#2
#3
0.5
00#8
Fig. 5. Design of Brillouin frequency shift for optical fibers depends on GeO2 and F concentrations in optical fiber core.
4. Performance of testing system employing 1650-nm B-OTDR
In this section, to clarify the operating area of the PON fiber monitoring system, we discuss the system performance derived from the 1650 nm B-OTDR dynamic range and the loss of the optical fiber network.
When an optical test module employs an optical amplifier, the amplifier can be used to compensate for the loss of the optical coupler that introduces the test light. Therefore, the single-way dynamic range (SWDR) of a B-OTDR does not include a term for optical coupler loss. The SWDR of a conventional B-OTDR for measuring strain and temperature is described in ref. (Horiguchi, et al., 1995) and defined by Eq. (2).
min1
( )2 2
= + + − − +aveSNIR
SWDR Pt BS Ts Lc R (2)
with
BS =10log(0.5 αb S W vo) (3)
2
10log=Δπ ν
BTs (4)
www.intechopen.com
In-Service Line Monitoring for Passive Optical Networks
209
Rmin = Bhν / η (5)
where Pt is the incident peak power of the test light, Lc is the 1:1 coupler loss, and Rmin is the sensitivity of a photo diode. BS is the Brillouin scattering coefficient. αb is the Brillouin backscattering coefficient given by 7.1× 10⁻³⁰/┣4 m-1. Ts is the Brillouin scattering selection ratio, which indicates that the decrease in the received power is caused by a portion of the Brillouin scattering. To detect the frequency of a Brillouin scattering signal with a finite spectral linewidth, the signal is selected by an electrical band-pass filter with a bandwidth 2B, and detected. SNIRave is the signal-to-noise (S/N) improvement achieved by averaging.
The averaging number N improves the S/N by 1
10log2
⋅ N dB.
W is the pulse width, vo is the velocity of light in an optical fiber, B is the receiver bandwidth, Δv is the Brillouin linewidth, h is Planck's constant, ν is the lightwave frequency, and η is the photodiode quantum efficiency. Rmin is discussed as regards receiver sensitivity in coherent detection because it is suitable for measuring a small Brillouin scattering signal. When SNR=1, the minimum receiver sensitivity is as reported in (Koyamada, et al., 1992).
In (Horiguchi, et al., 1995), Horiguchi et al. consider the degradation caused by fluctuations in the strain and temperature in the single-way dynamic range (SWDR). However, when we use a B-OTDR to monitor the branched PON fibers, the BFSs of the fibers installed in the branched PON region are designed not to overlap each other. Therefore, the degradation caused by strain and temperature fluctuations can be negligible. The resulting large dynamic range is an advantage of this approach.
The required dynamic range for monitoring the branched PON fiber is derived from the maximum optical fiber loss between the OLT and ONT in a GE-PON, which is 24 dB (IEEE Std 802.3ah). With GE-PON, which provides the main FTTH service in Japan, an 8-branched optical splitter is deployed in an aerial closure near the customer’s home, and an optical coupler, which introduces the test light, is installed after a 4-branched splitter. The insertion loss in a central office caused by a 4-branched optical splitter, a coupler and connectors is about 7 dB, and thus the required SWDR for a B-OTDR is more than 17 dB.
5. Experiments and discussion
To confirm the feasibility of the in-service line PON monitoring method, we measured the BFS spectra and B-OTDR traces and carried out an in-service line-monitoring test.
5.1 Branched PON fiber monitoring
The B-OTDR technique illustrated in Fig. 6 has a 1651.3 nm coherent light generated by a 10 kHz linewidth narrowed DFB laser diode that is divided into probe and reference lights. The probe light is modulated with a lithium niobate (LN) modulator. Then its signal power is amplified in a two-stage 1650 nm amplifier consisting of a thulium doped fiber amplifier (TDFA) and a Raman amplifier. The modulated probe light was amplified in Tm-Tb doped fiber (TDF) in the TDFA with a 1220 nm pump light of 49.7 mW. The core and cladding of the Tm-Tb doped fiber contained 2000 parts per million (ppm) of Tm and 4000 ppm of Tb, respectively, and the fiber length was 13 m. The refractive index difference between the core
www.intechopen.com
Optical Fiber Communications and Devices
210
LPF
Double-balanced receiver
1651.3 nmDFB-LD LN
LO
Homodyne detection
Mixer
TDFA
A/D
LD: Laser diode
BPF: Band pass filter
LPF: Low pass filter
LO: Local oscillator
LN: LN phase modulatorFBG: Fibre Bragg grating
A/D: Analog digital converter
Probe light
Reference light
BPF
1650 nm B-OTDR
Measured
fiber
RamanAmp
1.4 km
LD
1550 nm
LN
1220 nm
Isolator
BPF
FBG
LD
Circulator
TDF
13 m
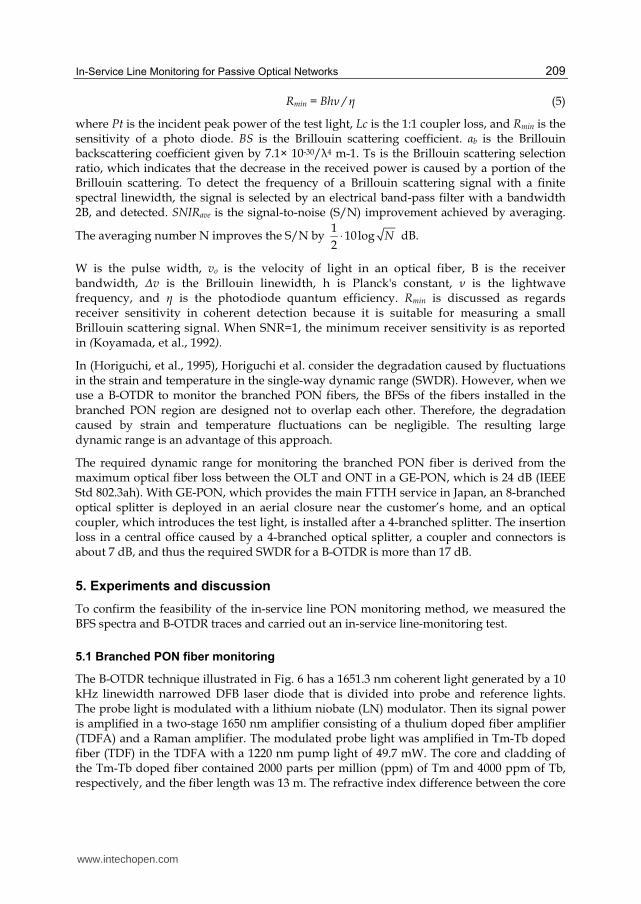
Fig. 6. Configuration for 1650 nm band B-OTDR employing TDFA and Raman amplifier
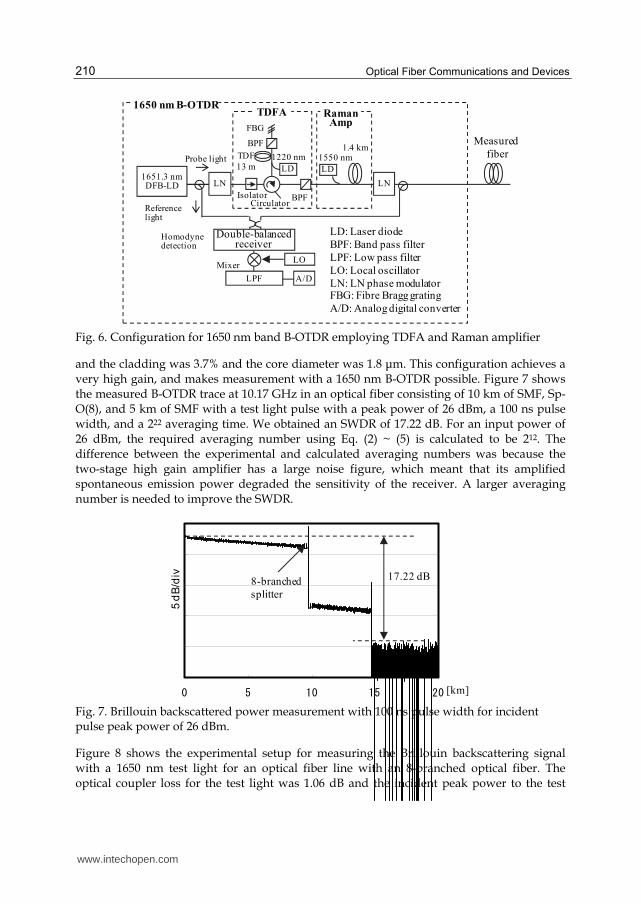
and the cladding was 3.7% and the core diameter was 1.8 ┤m. This configuration achieves a very high gain, and makes measurement with a 1650 nm B-OTDR possible. Figure 7 shows the measured B-OTDR trace at 10.17 GHz in an optical fiber consisting of 10 km of SMF, Sp-O(8), and 5 km of SMF with a test light pulse with a peak power of 26 dBm, a 100 ns pulse width, and a 222 averaging time. We obtained an SWDR of 17.22 dB. For an input power of 26 dBm, the required averaging number using Eq. (2) ~ (5) is calculated to be 212. The difference between the experimental and calculated averaging numbers was because the two-stage high gain amplifier has a large noise figure, which meant that its amplified spontaneous emission power degraded the sensitivity of the receiver. A larger averaging number is needed to improve the SWDR.
0 5 10 15 20[km]
5d
B/d
iv 17.22 dB8-branched
splitter
Fig. 7. Brillouin backscattered power measurement with 100 ns pulse width for incident pulse peak power of 26 dBm.
Figure 8 shows the experimental setup for measuring the Brillouin backscattering signal with a 1650 nm test light for an optical fiber line with an 8-branched optical fiber. The optical coupler loss for the test light was 1.06 dB and the incident peak power to the test
www.intechopen.com

In-Service Line Monitoring for Passive Optical Networks
211
fiber was controlled at 26 dBm. We used eight kinds of fibers for the lower region of the optical splitter as BFS assigned fibers and their dopant concentrations are plotted in Fig. 5. The cores of fibers 1-4 were co-doped with GeO2 + F, fibers 5-7 were doped with GeO2 and fiber 8 was pure silica fiber that had F doped in its cladding. We realized eight kinds of BFS fiber with a the maximum separation of 1.5 GHz. Figure 9 shows the BFS spectra measured 550 m from the B-OTDR. The eight BFS peaks at 9.055, 9.380, 9.535, 9.730, 9.825, 9.990, 10.095 and 10.435 GHz clearly indicate the existence of fibers 1-8. Figure 10 a) and b-i) show the B-OTDR traces obtained before and after the optical splitter, respectively. The traces in b)-i) clearly show the length of the BFS assigned fibers after the splitter. To simulate the fault identification process, the fiber of branch #6 fiber was intentionally bent with a loss of 4.1 dB
8-branched splitter#0: SMF 500 m
#8
#4
#1
#7
#6
#5
#3
#2
1650 nm Brillouin OTDR
Test light
Optical coupler
Fig. 8. Experimental setup with 1650 nm band B-OTDR for measuring PON branching region.
Brillouin frequency shift
Po
wer
in
ten
sity
[GHz]
ν8
1.5 GHz
ν4ν1 ν7ν6ν5ν3ν2
5d
B/d
iv
9.0 9.5 10.0 10.5
Fig. 9. Measured BFS spectra for 8-branched region 550 m from B-OTDR.
www.intechopen.com

Optical Fiber Communications and Devices
212
5d
B/d
iv
Distance from B-OTDR [km]
0 0.1 0.2 0.3 0.4 0.5
ν0: 10.160 GHz(a) SMF
0.5
Distance from B-OTDR [km]
0.6 0.7 0.8 0.9 1.0
5d
B/d
iv
0.5 0.6 0.7 0.8 0.9 1.0
(b) #1
(c) #2
(d) #3
(e) #4
(f) #5
(g) #6
(h) #7
(i) #8
ν1: 9.055 GHz
ν2 : 9.380 GHz
ν3 : 9.535 GHz
ν4 : 9.730 GHz
ν6 : 9.990 GHz
ν7 : 10.095 GHz
ν8 : 10.435 GHz
ν5 : 9.825 GHz
Bending loss
Fig. 10. B-OTDR trace a) between optical coupler and 8-branched splitter, b)-i) 8-branched PON fiber region
www.intechopen.com

In-Service Line Monitoring for Passive Optical Networks
213
60 m from the optical splitter. Traces with the bending loss overlaid are shown in Fig. 9. There was hardly any difference between the BFS peak power traces of b)-f) and h)-i). However, trace g) shows a 4 dB bending loss. This loss agreed with that measured with an optical power meter. This reveals the great advantage of this PON fiber measurement method, namely that it can locate a fault and measure the loss value in branched PON fiber.
Figure 11 shows a measured trace of a branching fiber with two connections that had 0.32 and 0.18 dB losses caused by the MT connector. When we undertook measurements using a conventional OTDR, the calculated bending and connection losses were 0.078 and 0.044 dB, respectively, in the OTDR trace because of the accumulation of Rayleigh backscattered signals from all the branched optical fibers (Sankawa, et al., 1990). This reveals the great advantage of this measurement method using individually assigned BFS fibers in the PON branching region.
520 530 540 550 560 570 580 590 600 610
0.32 dB
0.18 dB
Distance [m]
0.2
[d
B/d
iv]
Fig. 11. Detail of B-OTDR trace in PON branching region with two connections
5.2 In-service line monitoring
The technique used for monitoring the PON branching fiber must allow in-service line monitoring because other branched fibers accommodated in the same optical splitter may still be active. To avoid any deterioration in the transmission, the difference between the optical powers of the communication light and the test light adjacent to the ONT should be sufficiently smaller than the signal to noise ratio (ITU-T Recommendation L.66). A termination filter that cuts off the test light is installed in front of the ONTs as mentioned in section II. The attenuation value of the termination filter LF for the test light is determined by considering the communication system margin (RS/X).
LF > Pt - Ps +RS/X, (6)
These parameters were logarithmically transformed. Ps and Pt, respectively, are the optical
powers of the OLT and the test light just after the optical coupler. As regards the
www.intechopen.com

Optical Fiber Communications and Devices
214
communication and test lights, Hogari et al. reported that the optical losses are slightly
different in optical access networks (Hogari, et al., 2003), namely, Pt - Ps is equal to the
power difference between the communication and test lights at the optical coupler that
coupled them. Each system has particular specifications and these can include the minimum
output power of the transmitters, the minimum sensitivity of the receivers and the S/X
ratio. In GE-PON, the minimum average power of the communication light from an OLT is
defined as +2 dBm (peak power +5 dBm) (IEEE Std 802.3ah), and the insertion loss in a
central office is about 7 dB as mentioned in Section III B. The maximum peak power of the
test light was 26 dBm, and so LF> 28 + RS/X. When we use an ONT with an RS/X of 10 dB,
LF must be more than 38 dB. The typical insertion loss of a termination cord with a fiber
Bragg grating (FBG) filter is shown in Fig. 12.
-100
-80
-60
-40
-20
0
Loss
[dB
]
1200 1300 1400 1500 1600 1700Wavelength [nm]
Fig. 12. Typical loss of FBG filter in front of ONT
Figure 13 shows the experimental setup for in-service line monitoring of GE-PON. A 1492.25 nm signal light with an average power of 4.9 dBm from an OLT was controlled at 2.0 dBm (minimum average launch power for an OLT) by an attenuator, and launched into the experimental fiber line. The fiber line consisted of 4-branched fiber, an optical coupler, a 10 km SMF, and a 200 m BFS assigned fiber (#6). We also installed an FBG filter in front of the receiver port of the ONT as shown in Fig. 13. The 1492.25 nm signal power in front of the ONT was changed by an attenuator to control the insertion loss of the fiber line. The 1650 nm test light was introduced by the optical coupler and coupled with the signal light. Characteristic features of a GE-PON receiver are that the maximum sensitivity and bit error rate (BER) are -24 dBm and 10-12 or better (IEEE Std 802.3ah). When we evaluate the transmission quality in a GE-PON system, Ethernet frame analysis using a LAN analyzer without retransmission processing is a simple and convenient method for measuring the frame error rate (FER). We used a LAN analyzer to create 64 byte packets of 100 Mb/s with the smallest possible packet interval of 0.96 ┤s, and simultaneously transmitted the packets at a maximum throughput of 148809 packets/sec. The FER characteristics with and without the B-OTDR test light are shown in Fig. 14. These results indicate that in-service fault location did not affect the transmission characteristics at either signal wavelength. The FER almost corresponds to the BER when certain conditions are satisfied: 1) each error packet has no error or only a 1-bit error, and 2) the packet layer protocol has only an error detection
www.intechopen.com

In-Service Line Monitoring for Passive Optical Networks
215
BOTDR
Optical coupler
OLT
SMF10 km
ATT
Termination cordwith FBG filter
BS-F200 m
8-SpTest light1651.2 nm
Downstream signal light1490 nm
ATT: Attenuator
BS-F: BFS assigned fiber
x-Sp: X-branched optical splitter
ONT
Network tester
Ether frame
64 byte 100 MHz
4-Sp
Upstream signal light1310 nm
ATT
Pt
Ps
LF
Fig. 13. Experimental setup for in-service line monitoring
no OTDR testing
OTDR testing
with termination filter
Average received power [dB]
Fra
me e
rro
r ra
te
-32
10-2
10-3
10-4
10-5
10-6
10-7
10-8
10-9
-31 -30 -29 -28 -27
10-10
Uplink
Downlink
Error free
Fig. 14. FER measurement with and without in-service line monitoring using 1650 nm OTDR test light.
function and has no error recovery function such as forward error correction or retransmission (Ishikura, et al., 1999). The relationship between FER and BER is given by
FER = 1-(1-BER) Frame length[bits] (7)
www.intechopen.com
Optical Fiber Communications and Devices
216
A BER of 10–12 corresponds to an FER of 5.1×10⁻¹⁰. In-service line monitoring was demonstrated under error free conditions in GE-PON. The PON monitoring method can perform the test with negligible degradation in transmission quality.
6. Conclusion
I introduced an in-service measurement technique for monitoring PON fibers with individually assigned Brillouin frequency shifts and an optical fiber line testing system including 1650 nm Brillouin-OTDR. BFS assigned fiber can be designed for 8-branched PON fibers that have a 1.5 GHz BFS separation. Moreover, the 1650 nm band optical fiber line testing system measured B-OTDR traces with a dynamic range of 17 dB. Fault location carried out in branching fiber demonstrated that we could determine the length of eight BFS assigned fibers after an optical splitter. The PON monitoring system can also detect and locate connection losses in branching regions with high sensitivity. In-service line monitoring of a GE-PON transmission was achieved using a 1650 nm test light, and the degradation in transmission quality was negligible. These techniques enable us to isolate a fiber fault, reduce maintenance costs and improve service reliability for access networks.
7. References
Azuma, Y.; Shibata, N.; Horiguchi, T. & Tateda, M. (1988) Wavelength dependence of
Brillouin-gain spectra for single-mode optical fibers, Electron. Lett., 24, 5, pp. 251-
252, Mar. 1988
Eur. Conf. Optical Communications (ECOC) work shop 8, Operation Expenditures Studies
(2007)
Enomoto, Y.; Izumita, H. & Nakamura, M. (2005). “Highly developed fiber fault location
technique for branched optical fibers of PONs using high spatial resolution OTDR
and frequency domain analysis”, The Review of Laser Engineering, Vol. 33, No. 9
September 2005, pp. 609-614
Hogari, K.; Tetsutani, S.; Zhou, J.; Yamamoto, F. & Sato, K. (2003). Opticaltransmission
characteristics of optical-fiber cables and installed opticalfiber cable networks for
WDM systems. J. Light. Technol., vol. 21, no. 2, pp. 540–545, Feb. 2003.
Horiguchi, T.; Shimizu, K.; Kurashima, T.; Tateda, M.; & Koyamada, Y. (1995).
Development of a Distributed Sensing Technique using Brillouin Scattering, J.
Lightwave Technol., vol. 13, No. 7, July 1995, pp 1296-1302
Honda, N.; Iida, D.; Izumita, H. & Ito, F. (2006). Optical fiber line testing system design
considering outside environment for 8-branched PON fibers with individually
assigned BFSs, Optical Fiber Sensors 2006, ThE8, 2006
Honda, N.; Iida, D.; Izumita, H. & Ito, F. Bending and connection loss measurement of PON
branching fibers with individually assigned Brillouin frequency shifts, Optical
Fiber Communication Conference 2006, OThP6, 2006
IDATE, (Jun., 2011), FTTx around the world, Available from http://www.idate.org/en
/News/FTTx-around-the-world_679.html
www.intechopen.com

In-Service Line Monitoring for Passive Optical Networks
217
Iida, D.; Honda, N.; Izumita, H. & Ito, F. (2007). Design of identification fibers with
individually assigned Brillouin frequency shifts for monitoring passive optical
networks, J. Lightwave Technol., vol. 25, No. 5, MAY 2007, pp1290-1297
Iino, A.; Matsubara, K.; Ogai, M.; Horiuchi, Y. & Namihira, Y. (1989). Diffusion of hydrogen
molecules in fluorine-doped single-mode fibers., Electron. Lett. , 5th Jan. 1989 Vol.
25 No.1, pp78-79.
Ishikura, M.; Ito, Y.; Maeshima, O. & Asami, T. (1999). A traffic measurement tool for IP-
based networks, IEICE Trans. Inf.&Syst., Vail. E82-D, No. 4, April 1999, pp 756-
760.
ITU-T Recommendation (2003) G.984.1, Gigabit-capable Passive Optical Networks (GPON):
General characteristics
ITU-T Recommendation L.25. (1996). Optical fibre cable network maintenance
ITU-T Recommendation L.37. (2007). Optical branching components (non-wavelength
selective)
ITU-T Recommendation L.40. (2000) Optical fibre outside plant maintenance support,
monitoring and testing system
ITU-T Recommendation L.41. (2000). Maintenance wavelength on fibres carrying signals
ITU-T Recommendation L.53. (2003). Optical fibre maintenance criteria for access networks
ITU-T Recommendation L.66. (2007). Maintenance criteria for in-service line monitoring
ITU-T Recommendation L.68. (2007). Fundamental requirement for optical fibre line testing
system carrying high total optical power
ITU-T Recommendation L.85. (2010). Optical fibre identification for the maintenance of
optical access networks
IEEE Std 802.3ah. (2004). Carrier sense multiple access with collision detection (CSMA/CD)
access method and physical layer specifications
Izumita, H.; Horiguchi, T.; & Kurashima, T. (1997) “Distributed sensing technique using
Brillouin scattering”., Optical Fiber Sensors 12th, OWD1-1.1997
Kawataka, J. ; Hogari, K.; Iwata, H.; Hakozaki, H.; Kanayama, M.; Yamamoto, H.; Aihara,
T. & Sato, K. (2003) Novel optical fiber cable for feeder and distribution sections
in access network", J. Lightwave Technol., vol. 21, no. 3, Mar. 2003, pp. 789–796,
2003.
Koyamada, Y.; Nakamoto, H. & Ohta, N. (1992). High performance coherent OTDR
enhanced with erbium doped fiber amplifiers. J. Opt. Com, 13 (1992) 4, pp. 127-
133
Nakao, N.; Izumita, H.; Inoue, T. ; Enomoto, Y. ; Araki, N. & Tomita, N. “Maintenance
method using 1650-nm wavelength band for optical fiber cable networks”, J.
Lightwave. Technol. vol. 19, No. 10, Oct. 2001. pp 1513-1520
Sankawa, I.; Furukawa, S.; Koyamada, Y. & Izumita, H.“Fault location technique for in-
service branched optical fiber networks”, IEEE Photon. Technol. Lett., Vol. 2, No.
10, October 1990, pp 766-768
Schmuck, H.; Hehmann, J.; Straub, M. & Th. Pfeiffer. (2006) Embedded OTDR techniques for
cost-efficient fibre monitoring in optical access networks”, Eur. Conf. Optical
Communications (ECOC), Mo3.5.4, 2006
www.intechopen.com

Optical Fiber Communications and Devices
218
Shimizu, K.; Horiguchi, T.; & Koyamada, Y.(1995). Measurement of distributed strain and
temperature in a branched optical fiber network by use of Brillouin Optical time-
domain reflectometry, Optics Letters, vol. 20, No. 5, 1995, pp. 507–509.
Tanaka, K.; Tateda, M. & Inoue, Y., “Measuring individual attenuation distribution of
passive branched optical networks”, IEEE Photon, Technol. Lett., vol. 8, No. 7, pp.
915-917, July 1996,
www.intechopen.com

Optical Fiber Communications and DevicesEdited by Dr Moh. Yasin
ISBN 978-953-307-954-7Hard cover, 380 pagesPublisher InTechPublished online 01, February, 2012Published in print edition February, 2012
InTech EuropeUniversity Campus STeP Ri Slavka Krautzeka 83/A 51000 Rijeka, Croatia Phone: +385 (51) 770 447 Fax: +385 (51) 686 166www.intechopen.com
InTech ChinaUnit 405, Office Block, Hotel Equatorial Shanghai No.65, Yan An Road (West), Shanghai, 200040, China
Phone: +86-21-62489820 Fax: +86-21-62489821
This book is a collection of works dealing with the important technologies and mathematical concepts behindtoday's optical fiber communications and devices. It features 17 selected topics such as architecture andtopologies of optical networks, secure optical communication, PONs, LANs, and WANs and thus provides anoverall view of current research trends and technology on these topics. The book compiles worldwidecontributions from many prominent universities and research centers, bringing together leading academicsand scientists in the field of photonics and optical communications. This compendium is an invaluablereference edited by three scientists with a wide knowledge of the field and the community. Researchers andpractitioners working in photonics and optical communications will find this book a valuable resource.
How to referenceIn order to correctly reference this scholarly work, feel free to copy and paste the following:
Nazuki Honda (2012). In-Service Line Monitoring for Passive Optical Networks, Optical Fiber Communicationsand Devices, Dr Moh. Yasin (Ed.), ISBN: 978-953-307-954-7, InTech, Available from:http://www.intechopen.com/books/optical-fiber-communications-and-devices/in-service-line-monitoring-for-passive-optical-networks

© 2012 The Author(s). Licensee IntechOpen. This is an open access articledistributed under the terms of the Creative Commons Attribution 3.0License, which permits unrestricted use, distribution, and reproduction inany medium, provided the original work is properly cited.