Embed Size (px)
Citation preview

In situ determination of the mechanical performance of the steel rodsanchored on an existing masonry building wall
ORHAN DOGAN, FATIH CELIK, ORHAN GAZI ODACIOGLU and OZER SEVIM*
Department of Civil Engineering, Kırıkkale University, 71451 Kırıkkale, Turkeye-mail: [email protected]
MS received 10 January 2021; revised 18 July 2021; accepted 23 July 2021
Abstract. In order to strengthen masonry building walls against horizontal earthquake loads, steel plates or
in situ reinforced concrete layers need to be attached to one or both surfaces of the walls. Because the stiffness of
the wall and the stiffness of the strengthening element will be different against earthquake loads, the elastic
connectors are needed to be attached to the strengthening wall to comply with an existing wall. These connectors
must have sufficient and well-known strength, flexibility, spacing, diameter, and depth to resist shear and pull-
out forces that will occur between the wall and the strengthening element. And it is of great importance to
determine the partially interacted pull-out and direct shear performances of the widely known flexible and
commonly used steel rod connectors depending on the diameter and embedment depth in strengthening analysis.
In this study, since the partially interacted pull-out test on chemically anchored steel rods has shown more
realistic failure in comparison to the fully interacted pull-out test and both the partially interacted pull-out test
and the shear test are quite difficult and time-consuming in comparison to the fully interacted pull-out test, the
steel rods were anchored on an existing a five stories masonry building constructed using clay block bricks,
mortar and plaster in Turkey and then three different types of tests were conducted on steel rods to determine the
relation between the fully and partially interacted pull out performances and also between fully interacted pull
out and shear performances. Very significant linear equations were obtained for the shear performance and
partially interacted pull-out performance of the anchor rods in accordance with the fully interacted pull-out
performance of the steel rod connectors for different embedment depth and hole.
Keywords. Clay brick wall; masonry building; earthquake reinforcement in masonry buildings; shear
performance of steel anchor rod; pull-out performance of anchor rods; partially and fully interacted pull-out test
of anchor rods.
1. Introduction
All of Turkey is in a seismic zone. All the historical
buildings and about half of the residences were built as
unreinforced masonry buildings (URM). Although these
buildings are single or several storeys in rural areas, they
are 6-storey in cities [1]. Although the renovation of these
buildings is the most appropriate solution [2], it seems more
economical to retrofit them due to their high number. For
this reason, the most appropriate repair and strengthening
method should be preferred according to the seismic zones,
building material type and mechanical properties, building
characteristic structure and post-earthquake damage [3].
Due to the increased shear force during the earthquake in
URM buildings, out-of-plane toppings and in-plane cracks
and separations are seen, and it is known that the connec-
tion deficiencies between the layers cause these damages
[4]. Anchored connectors are widely used in strengthening
the walls with a rigid diaphragm [5], bonding the wall to the
wall [6], preventing the walls from tipping out of the plane,
bridging the cracks [7], and retrofitting/strengthening the
walls with wooden panels [8], steel strips [9] or concrete
layers [10]. Connectors are exposed to tensile and shear
stresses during earthquakes.
There are many experimental studies on the tensile per-
formance of steel anchors embedded in the walls in liter-
ature by varying the wall materials, anchorage types,
anchorage diameters, embedding depths, and anchorage
area [11–15]. In tensile tests, the application of chemical
anchoring using epoxy to the blind holes drilled for
anchoring to the wall is the most widely used method
besides being efficient [16].
Since the masonry building walls are not homogeneous,
the anchorage tensile strength varies according to the type
of surface material the anchors are attached to. It is known
that anchorages made to the joint areas of the bricks are
more efficient than the other areas of the wall [15]. How-
ever, it is very difficult to direct all the anchors to the joint*For correspondence
Sådhanå (2021) 46:184 � Indian Academy of Sciences
https://doi.org/10.1007/s12046-021-01697-ySadhana(0123456789().,-volV)FT3](0123456789().,-volV)

area because of the closed surfaces of the wall with plaster.
In pull-out tests on masonry walls, bond failures were
observed; at the anchorage-to-interface, at the matrix-to-
substrate interface, at mortar joints due to sliding of bricks,
along a conic surface due to tensile of masonry, at the
anchorage due to tensile failure. While a conical collapse is
observed in anchors with a low buried depth, with the
increase of the embedding depth, yielding failure is
observed in the anchors [17].
There are two different test methods named fully inter-
acted pull-out (Pfi) and partially interacted pull-out (Ppi) for
determining the pull-out capacity of both steel dowel and
chemically bonded steel rods perpendicularly anchored to
concrete. The preferred and commonly used method among
these methods is the pull-out with full interaction test
applied on chemically adhesive anchors, and it occurs in the
form of collapse, breaking of the anchor reinforcement, or
full interaction debonding along the entire anchorage.
Experimental studies have been carried out to find out
the shear performance of the connection connectors that
provide the interaction of masonry walls and reinforcement
elements [18–20]. In anchorages, there is a loss of strength
in the connector area such as tearing in the panel, loss of
strength of the brick, ruptures on the wall surface [8]. It is
recommended to use thin diameter and multiple anchors to
prevent strength losses in brick and masonry [21]. The
ductile behavior of the anchors is of great importance in
terms of the non-linear analysis of an existing masonry
structure and its strengthening elements having different
stiffnesses.
In masonry structures, the external strengthening of the
building emerges as a preferable method, as it will not
disturb the residents in their daily life and is easily appli-
cable (figure 1). However, since the steel rod anchors
between the strengthening RC layer and the existing brick
wall are exposed to extra tensile and shear stresses during
the earthquake, that is why it is of great importance to
determine the material properties of the brick wall before
the strengthening analysis (figure 2).
In this study, it is aimed to determine in situ anchor shear
performance by a simpler pull-out with full interaction,
since the shear test and the pull-out with partial interaction
test are quite difficult and time-consuming. For this pur-
pose, to determine the number of the connectors to be
anchored to the masonry wall surface, an existing building
constructed using traditional commonly used clay bricks
and techniques in the preparation of mortar and plaster in
Ankara/Turkey is chosen as a sample for testing. Here, 2
different experimental set-ups with specially designed,
practical, and useful steel plates were used to determine the
in-situ shear and pull-out with partial interaction of rein-
forcement steel rods with different diameters and embed-
ment depths anchored to the walls of an existing 5-storey
masonry building with clay bricks. Here, 12 pull-outs with
full interaction tests, 24 pull-outs with partial interaction
tests, and 9 shear tests were conducted. Some significant
linear equations were obtained between the shear and pull-
out performances of the anchors depending on the
Figure 1. Models of strengthened masonry building with RC layers.
Figure 2. Model of the strengthened wall with RC layer and
details of steel rod anchors.
184 Page 2 of 13 Sådhanå (2021) 46:184

embedment depth and anchor diameter. The shear and pull-
out performances of the steel rods anchored on the wall
surface for the strengthening of the masonry walls with clay
bricks, depending on the diameter and anchorage depth,
were determined experimentally. Equations correlating
capacity of pull-out test with partial interaction with
capacity of easier to perform pull-out test with full inter-
action are determined for different anchor diameters and
depths.
2. Experimental Design
The existing masonry building where this study was carried
out was built as 5-storey in the middle of the 20th century.
As a result of the examinations made in the building, it was
seen that it was manufactured with Flemish Bond type
using 2159102965 mm clay bricks. It has been found out
that the thickness of the wall including plaster is 270 mm,
the thickness of the joint mortar is 15-20 mm, and the
thickness of the plaster varies between 20 and 30 mm.
2.1 Experimental set-ups of pull-out testswith partial and full interaction of anchors
The anchorage steel rods were planted chemically on the
wall surface using epoxy (table 1). The steel rods were
inserted in the wall from one face and had different
diameters and embedment depths. The failure modes of the
anchorage steel rods after pull-out with full interaction (Pfi)
and partial interaction (Ppi) tests are given in fig-
ures 3(a) and 3(b), respectively.
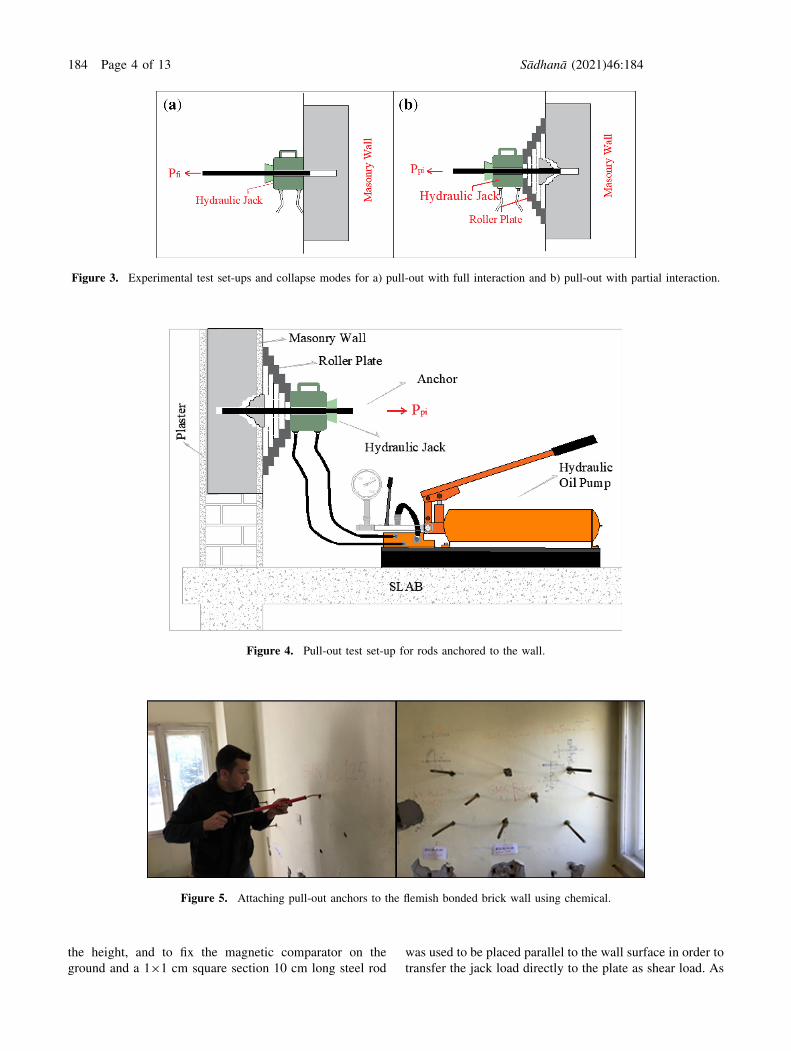
In the pull-out with partial interaction test set-up; one
specially designed steel pull-out plate (St 37), one hydraulic
oil pump and one double-acting hydraulic jack, chemical
adhesive, 55 cm long anchor reinforcement rods in Ø10,
Ø12, Ø14, and Ø16 diameters (S420) (figure 4).
Considering that the contribution of the plaster to the
anchorage pull-out strength for the Pfi and Ppi tests is very
small, holes were made on the wall surface by adding ?2
cm plaster thickness to 5, 10, and 15 cm anchorage depths.
For the anchorage depths of 5-15 cm to be applied, bearing
Flemish bonded brick walls of at least 20 cm are preferred.
The holes drilled 5 mm wider than the diameter of the
ribbed anchor reinforcement were cleaned of dust that
caused approximately 70% performance loss with a brush
and air pump. Starting from the farthest point of the holes
drilled for Pfi and Ppi, epoxy is injected so that the space
around the reinforcement is filled completely, and the
reinforcement rods are anchored by punching and/or ham-
mering (figure 5).
The experimental set-up for pull-out tests was prepared
by planting the anchor steel rods of 55 cm length, Ø10,
Ø12, Ø14, and Ø16 at an angle of 90�, into the holes drilled
on the walls. With the help of a hydraulic jack with pull-out
feature (figure 6) and with the help of a designed plate, Ppitests were performed (figure 7).
For Pfi test experiments, 12 anchorage steel rods of four
different diameters (Ø10, Ø12, Ø14 and Ø16) with 5, 10
and 15 cm anchorage depths (Lad) were used. For Ppi test
experiments, 24 anchorage steel rods of four different
diameters (Ø10, Ø12, Ø14 and Ø16) with 5, 10 and 15 cm
anchorage depths (Lad) were used. In drilling for each
anchorage depth 2 cm plaster thickness was added.
While no damage was observed on the wall around the
anchorage steel rods in figure 8(a), in figure 8(b), it was
observed that the conical wall part of varying diameter and
depth came apart depending on the diameter of the rein-
forcement in the Ppi test. It was observed that this conical
early failure which is known as mix type failure observed in
the wall did not contribute to the pull-out capacity of the
anchors, and the pull-out strength of the anchor was
determined by resisting the remaining embedded part with
full stripping. At the end of the Pfi and Ppi experiments, it
was observed that the collapse occurred by debonding at the
epoxy-masonry interface.
2.2 Anchor shear test set-up
To determine the shear performance of the reinforcement
anchors on the wall surface, firstly, Ø10-Ø16 diameter
symmetrical and 4-anchor reinforcement holes were drilled
and an St37 steel ribbed plate was installed. Then, while
creating the experiment set-up; hydraulic oil pump,
hydraulic pressure gauge, hydraulic jack, steel plate, steel
loading plate, ribbed anchor reinforcement rods (S420) in
Ø10, Ø12, and Ø16 diameters, comparator and other sup-
port plates are brought together in a certain order (figures 9
and 10). In addition, as a non-destructive test method, the
N-Schmidt test hammer was used to determine the com-
pressive strength of brick, plaster, and mortar.
To investigate the shear performance of the reinforce-
ment rods anchored to the wall surface under the shear
force applied parallel to the wall surface with the help of a
hydraulic jack, a special steel plate was designed by rein-
forcing it with flats so that there is no tearing and buckling
in the plate, crushing, and breaking in the steel rods.
Hydraulic jack, hydraulic pump, and comparator were
used in the experiment. In the application of loads, 2.5 cm
thick and 20930 cm support plates are used to spread the
stress transferred by the hydraulic jack to the floor, to adjust
Table 1. Mechanical properties and mix proportions of the
epoxy.
Compressive Strength (ASTM 695) [ 56 N/mm2
Flexural Strength (ASTM 790) [ 16 N/mm2
Modulus of Elasticity 3034 N/mm2
Mixture density (20 �C) 1.65 g/cm3
Sådhanå (2021) 46:184 Page 3 of 13 184
the height, and to fix the magnetic comparator on the
ground and a 191 cm square section 10 cm long steel rod
was used to be placed parallel to the wall surface in order to
transfer the jack load directly to the plate as shear load. As
Figure 3. Experimental test set-ups and collapse modes for a) pull-out with full interaction and b) pull-out with partial interaction.
Figure 4. Pull-out test set-up for rods anchored to the wall.
Figure 5. Attaching pull-out anchors to the flemish bonded brick wall using chemical.
184 Page 4 of 13 Sådhanå (2021) 46:184

a test sample, ribbed anchor steel rods of 25 cm in length,
Ø10, Ø12 and Ø16 were prepared, 4 for each test. In
addition, a N-Schmidt hammer, one of the non-destructive
test equipment, was used to test the compressive strength of
the brick and plaster mortar separately.
The shear plate is held on the wall surface at a height of
40 cm from the ground, and the anchorage holes are marked
on the wall surface, symmetrical from 4 plate holes for the
same diameters from the loading axis. Considering that the
pull-out force in the anchor steel rods would not cause
collapse, 4 anchor steel rods with the same diameters were
placed in the anchorage holes drilled in the marked places,
without using chemicals, the shear plate was inserted into
the anchor steel rods that were driven at an equal depth to
the wall surface. The hydraulic jack was placed by cen-
tering the ground and the lower surface of the shear plate
parallel to each other, and the lower parts of the hydraulic
jack were supported with steel plates.
The prepared experimental set-up was powered by a
hydraulic jack, and the displacements of the shear plate
were measured together with the applied force. The
experiments continued until 2/3 of the maximum load
decreased after the shear force reached the maximum and
the hydraulic pressure gauge reading was recorded
approximately every 1.00 mm from the loading process
until the test was terminated. Load-displacement graphs
were created with the recorded values. For the shear
capacity of each anchor, the maximum shear force was
found by dividing it into 4, and the elastoplastic behavior
formed by permanent crushes on the wall was obtained.
In the experiments conducted, the anchor steel rods
inside the wall showed a non-linear behavior instead of a
rigid connection due to the weak strength of the wall. The
over-loaded anchor steel rods redistributed their overloads
to the less loaded anchor steel rods. Ensuring the redistri-
bution of the shear forces, the collapse of the steel rods was
prevented (figure 11).
3. Results and Discussions
On the testing walls, the N-Schmidt test which is a non-
destructive testing method was carried out to determine the
compressive strengths of the clay brick, mortar, and plaster.
The compressive strength of clay brick, mortar and plaster
is indicated as 14 MPa, 5 MPa and 5 MPa, respectively.
Anchorage steel rods of 4 different diameters and 3
different depths were used in the anchorage shear tests
carried out in a masonry building with clay bricks. The test
results obtained at different anchorage diameters (Ø) and
anchorage depths (Lad) are given in table 2. In the pull-out
tests, Ppi showed lower performance than Pfi.
Figure 6. Pull-out test with full interaction.
Figure 7. Pull-out test with partial interaction.
Figure 8. Collapsing types in pull-out tests a) adherence collapse in the wall with Pfi and b) conical collapse in the wall with Ppi
Sådhanå (2021) 46:184 Page 5 of 13 184

When the pull-out force (P) data (keeping the anchor
diameter (Ø) the same for the anchorage depth (Lad) was
compared, it was seen that the maximum decrease of per-
centage in pull-out force (Pmax) was varied between 23 and
63 in the transition from Pfi to Ppi for 5 cm depth (table 2).
Equations of Pmax and Pfi and Ppi depend on Ø obtained
from the anchorage pull-out experiments given in table 2
were drawn with the excel program and shown in figure 12.
According to the results of the Pfi test, it was observed that
as the anchorage diameter (Ø) and anchorage depth (Lad)
increased, the pull-out force (Pfi) increased. It has been
observed that Ø greatly affects the Pfi values, and negligibly
affects the Ppi values. For the same anchorage depth, the
ratio of Ppi to Pfi is about 70% for the anchor diameter (Ø)
Figure 9. Shear test set- up of rods anchored to the wall.
Figure 10. Anchor reinforcement shear test set-up.
Figure 11. The failure of anchor steel rods in the wall.
Table 2. Pull-out capacities depend on anchor diameter and
depth (Pmax).
Anchor depth (Lad) (cm)
Pmax (kN)
Group Ø 10 Ø 12 Ø 14 Ø 16
5 cm Pfi 3.35 4.56 7.00 8.52
10 cm Pfi 6.69 9.43 11.56 13.38
15 cm Pfi 8.82 11.26 13.38 16.12
5 cm Ppi 2.43 2.43 2.74 3.04
2.74 3.04 3.35 3.35
10 cm Ppi 4.87 4.87 5.48 5.17
4.26 4.56 4.87 5.48
15 cm Ppi 5. 48 5. 48 6. 69 6. 69
6. 08 6. 69 6. 39 7. 30
*2 cm plaster allowance was added to the Øs given above and holes were
made on the wall.
184 Page 6 of 13 Sådhanå (2021) 46:184

10 mm, while the anchor diameter (Ø) decreases to about
40% for 16 mm. It has been observed that the use of thin
diameter anchors is more important in masonry building
reinforcements. It was observed that the anchorage diam-
eter (Ø) increased from 10 mm to 16 mm and the anchorage
depth (Lad) increased from 5 cm to 15 cm and the
anchorage pull-out capacity (Pmax) increased to 2.70 times
for Ppi and 4.82 times for Pfi.
As can be seen in figures 13 and 14, it has been observed
that with the increase of the anchorage depth (Lad), which is
5, 10 and 15 cm, the anchor pull-out maximum force
(P) continues with a decreasing slope. It has been observed
that Lad is the most effective parameter for both Pfi and Ppiin the pull-out performance of anchors. It was concluded
that the embedment depth should be close to the thickness
of the wall to be anchored. It has been observed that the
effect of Ø is higher in Pfi, but less in Ppi, depending on the
pull-out strength of the brick and masonry mortar.
In table 3, from the data obtained from partial and full
interaction experiments; Equations over R2 = 0.99 with
significant regression between P (kN) depending on dif-
ferent Lad (cm) and Ø (mm) were created by drawing the
graphs of the obtained data with the Excel program. With
these Equations, P (kN) values can be obtained depending
on Lad (cm) and Ø (mm).
Since the collapse occurred in the pull-out experiments
of the anchors occurred at the wall interface with chemical
anchorage, the diameter of the hole drilled on the wall
surface (D) which is 4 mm bigger than the anchorage
diameter (Ø) was used in the equations instead of the
anchorage diameter (Ø). Significant Equations with
regression of 97% and 98% were created between Pfi and
Ppi depending on D (mm) and Lad (cm), respectively
(table 4).
The hole diameter (D) was used when calculating the
adherence shear stress (kN/mm2) due to the weaker col-
lapse at the interface between brick and epoxy. Accord-
ingly, by using D (mm) in partially or fully interacted
anchorage pull-out experiments, significant Equations with
regressions of 98% and 84% for adherence shear stresses spiand sfi, respectively, depending on Lad (cm) and D (mm)
have been created (table 5).
In figure 15, significant equations were obtained between
Pfi and Ppi for samples with different anchorage diameters
(Ø). Here, it was observed that as the Ø gets smaller, the
difference between Pfi and Ppi decreases, and the pull-out
strength of the wall and consequently the effect of conical
failure decreases. Using these equations, instead of the
more laborious Ppi test, it will be possible to determine the
Ppi strength based on the easier Pfi test results and to be
used in the strengthening calculation analysis.
It was observed that as the effect of anchorage depth on
shear performance decreases with increasing wall strength,
effective embedment depth will be less. In Equations (1)-
(4), for anchor specimens of different diameters, between
pull-out force with full interaction (Pfi) and with partial
interaction (Ppi), the following equations are obtained:
0
2
4
6
8
10
12
14
16
18
10 12 14 16
Pull-
out f
orce
(kN
)
Anchor diameter Ø (mm)
Figure 12. Pull-out force equations with full and partial
interaction depending on the anchor diameter (Ø) for different
anchorage depth.
0
2
4
6
8
10
12
14
16
18
0 1 2 3 4 5 6 7 8 9 10 11 12 13 14 15 16
Ø 10 Anchor Ø 12 Anchor Ø 14 Anchor Ø 16 Anchor
Pull-
out f
orce
(kN
)
Anchor depth (cm)
Figure 13. Pfi for different anchor diameters depending on
anchor depth (Lad).
0
1
2
3
4
5
6
7
0 1 2 3 4 5 6 7 8 9 10 11 12 13 14 15 16
Ø 10 Anchor Ø 12 Anchor Ø 14 Anchor Ø 16 Anchor
Pull-
out f
orce
(kN
)
Anchor depth (cm)
Figure 14. Anhor diameters depending on anchor depth (Lad).
Sådhanå (2021) 46:184 Page 7 of 13 184

Pfi ¼ 2:4146� Ppifor ø16 anchorage, with 98:98% regression
ð1Þ
Pfi ¼ 2:1404� Ppifor ø14 anchorage, with 99:20% regression
ð2Þ
Pfi ¼ 1:8794� Ppifor ø12 anchorage, with 99:10% regression
ð3Þ
Pfi ¼ 1:4804� Ppifor ø10 anchorage, with 99:32% regression
ð4Þ
As seen in figure 16, it has been observed that a = Pfi /Ppiratio changes depending on the diameter of the reinforce-
ment (mm) and depending on the diameter, there is a
meaningful Equation with 98.88% regression between Pfiand Ppi (Equations (5) and (6)).
Pfi ¼ a� Ppi ð5Þ
a ¼ 0:152� ø ð6ÞShear test results for Ø10, Ø12 and Ø16 anchor steel rods
at different anchorage depths are given in table 6 and fig-
ures 17-19.
As can be seen in table 6 and figures 17-19 in these
experiments, it was observed that the maximum force,
displacement amount and potential energy absorption
capacity increased significantly as the anchorage depth
increased. However, it has been observed that these
increases are very small compared to the increase in
Table 3. Pull-out equations for full and partial interaction forces depending on anchor depth.
Anchor diameter (Ø) (mm)
Full interaction Partial interaction
Pfi (kN) R2 (%) Ppi (kN) R2 (%)
Ø10 Pfi =-0.01159Lad2?0.76539Lad 99.83 Ppi=-0.01369Lad
2?0.599Lad 99.99
Ø12 Pfi =-0.02569Lad2?1.14649Lad 99.24 Ppi =-0.01389Lad
2?0.61169Lad 99.99
Ø14 Pfi =-0.05169Lad2?1.66679Lad 100.00 Ppi =-0.01689Lad
2?0.68779Lad 100.00
Ø16 Pfi =-0.05869Lad2?1.94859Lad 100.00 Ppi =-0.01559Lad
2?0.69739Lad 99.93
Table 4. Pull-out equations for full and partial interaction
depend on anchor depth (cm) and anchor hole diameter (mm).
P (kN) equations R2 (%)
Pfi Pfi=0.6549Lad?1.079D-15.220 97
Ppi Ppi=0.3469Lad?0.159D-1.275 98
Table 5. Adherence shear stress (s) equations depending on
different anchor hole diameter (D) and depth (Lad).
s (kN/mm2) equations R2 (%)
Pfi sfi=0.348-0.069Lad?0.1249D 84
Ppi spi=1.663-0.0299Lad-0.0259D 98
Figure 15. Pfi - Ppi graph for different anchor diameters (Ø).
184 Page 8 of 13 Sådhanå (2021) 46:184

diameter. It has been observed that the shear values of 3
different anchor diameters are close to each other for the
same embedment depth.
It is seen that the shear performance increases by about
10% despite the 50% increase in the anchor diameter.
Therefore, it has been concluded that it would be healthier
to prefer Ø10 anchors compared to others (figure 20).
In figure 20 total shear forces applied on shear plate with
four anchors are given. Equations for shear capacity of an
anchor depending on the mean of all anchorage depths for
the anchors of Ø10, Ø12 and Ø16 with regression up to
100% are respectively given below:
Vmax ¼ �0:0387L2ad þ 1:6047Lad R2 ¼ 0:9997 for ø10
ð7Þ
Vmax ¼ �0:0458L2ad þ 1:756Lad R2 ¼ 0:9996 for ø12
ð8Þ
Vmax ¼ �0:0529L2ad þ 1:9319Lad R2 ¼ 0:9987 for ø16
ð9ÞThe optimum length of anchorage depth depends on the
resistance of the plaster, mortar, and bricks. It was observed
that the optimum anchorage depth decreased in parabolic
with increasing the anchorage diameter. For this building,
by taking the derivation of the second-order equations
given above, optimum anchorage depth depending on the
anchor diameter; Lad = 20.73 cm for Ø10, Lad = 19.17 cm
for Ø12 and Lad = 18.26 cm for Ø16 mm. Therefore,
making the anchorage depth greater than the optimum Lad
does not have any contribution, but it has shown that the
ductile behavior increases with the increase of the
anchorage depth, thus the ideal embedment depth is the
optimum anchorage depth (Equations (7)-(9)).
0.0
0.5
1.0
1.5
2.0
2.5
3.0
8 9 10 11 12 13 14 15 16 17
a=P f
i/Ppi
Anchor diameter (mm)
Figure 16. Pfi and Ppi relation based on anchor diameter.
Table 6. Maximum shear force and displacement at maximum
load.
Anchor diameter and
depth
Max shear force,
Vmax (kN)
Displacement
(mm)
Ø10- 5 cm 27.65 18
Ø10 - 10 cm 49.27 42
Ø10 - 15 cm 61.23 100
Ø12 - 5 cm 31.16 19
Ø12 - 10 cm 51.28 56
Ø12 - 15 cm 64.32 86
Ø16 - 5 cm 34.64 11
Ø16 - 10 cm 54.81 48
Ø16 - 15 cm 68.71 95
0
10
20
30
40
50
60
70
0 20 40 60 80 100 120 140
5 cm Depth 10 cm Depth 15 cm Depth
Shea
r fo
rce
(kN
)
Displacement (mm)
Figure 17. Shear and displacements for Ø10 anchor
reinforcement.
0
10
20
30
40
50
60
70
0 20 40 60 80 100 120 140
5 cm Depth 10 cm Depth 15 cm Depth
Shea
r fo
rce
(kN
)
Displacement (mm)
Figure 19. Shear and displacements for Ø16 anchor
reinforcement.
0
10
20
30
40
50
60
70
0 20 40 60 80 100 120 140
5 cm Depth 10 cm Depth 15 cm Depth
Shea
r fo
rce
(kN
)
Displacement (mm)
Figure 18. Shear and displacements for Ø12 anchor
reinforcement.
Sådhanå (2021) 46:184 Page 9 of 13 184

While the increase in the shear capacity decreases with
increasing the anchorage depth (figure 20), it has been
observed that the parabolic increase in the displacement is
increasingly inclined (figure 21), therefore, the connection
between the existing wall and reinforcement element will
behave more inelastic and ductile with the increase in the
anchorage depth.
As it can be understood from figures 22-24, the anchor-
age behaved more ductile with the anchorage embedment
depth increasing from 5 cm to 10 cm. It was observed that
the energy absorption capacity increased approximately 4
times in parallel with the deformation, and the energy
absorption capacity increased approximately 8 times with
the increase in the embedment depth from 5 cm to 15 cm.
Considering that this increased amount does not increase
linearly with the embedment depth and decreases parabol-
ically, it is seen that if the anchorage depth is more than 15
cm, it will decrease very much, and after 20 cm it will be
negligible.
As can be seen in figure 24, the effect of the change of
anchorage diameters of Ø10, Ø12 and Ø16 on the shear
force applied to the anchor reinforcement at 15 cm
embedment depth and the energy absorption capacity it
means is negligible. It has been observed that masonry
brick and masonry mortar strength is the first-order effec-
tive parameter and the effect of reinforcement diameter on
shear performance is negligible.
In addition, in Equations (10)-(12), the ratios of pull-out
with full interaction to shear force are given in anchor
specimens of different diameters and between shear force
(Vmax) and pull-out with full interaction (Pfi) in the fol-
lowing equations:
0
10
20
30
40
50
60
70
0 1 2 3 4 5 6 7 8 9 10 11 12 13 14 15 16
Ø10 Ø12 Ø16Shea
r fo
rce
(kN
)
Anchor depth (cm)
Figure 20. Vmax-Lad relation for anchors of Ø10, Ø12 and Ø16.
0
10
20
30
40
50
60
70
80
90
100
0 1 2 3 4 5 6 7 8 9 10 11 12 13 14 15 16
Ø10 Ø12 Ø16
Dip
lace
men
t (m
m)
Anchor depth (cm)
Figure 21. Displacement-anchor depth for Ø10, Ø12 and Ø16
anchors.
0
10
20
30
40
0 10 20 30 40
Shea
r fo
rce
(kN
)
Diplacement (mm)
Figure 22. Shear load-displacement of different anchor diame-
ters for 5 cm anchors.
0
10
20
30
40
50
60
70
80
0 10 20 30 40 50 60 70 80 90 100 110 120
Shea
r fo
rce
(kN
)
Diplacement (mm)
Figure 24. Shear load-displacement of different anchor diame-
ters for 15 cm anchors.
0
10
20
30
40
50
60
0 10 20 30 40 50 60 70 80 90 100
Shea
r fo
rce
(kN
)
Diplacement (mm)
Figure 23. Shear load-displacement of different anchor diame-
ters for 10 cm anchors.
184 Page 10 of 13 Sådhanå (2021) 46:184

Vmax ¼ 7:21� Pfiwith 99:18% regression for ø10 anchor;
ð10Þ
Vmax ¼ 5:73� Pfiwith 98:70% regression for ø12 anchor;
ð11Þ
Vmax ¼ 4:18� Pfiwith 99:95% regression for ø16 anchor
ð12Þ
From the equations obtained in figure 25, there are the
following equations between Pfi and shear force (Vmax)
depending on diameter with 98.32% regression:
b ¼ 0:0146� ø ð13ÞVmax ¼ Pfi=b ð14Þ
Here, the pull-out strength is the first-order parameter
depending on the anchor depth, while the maximum
effective depth in shear strength is determined as approxi-
mately 20 cm, and since the most effective force will be the
shear force between the existing wall and the reinforcement
element, the most important criterion in the dimensioning
of the anchors will be the shear performance. In this case,
as the most practical method in determining the shear
performance depending on the anchor diameter, starting
from the result of the easy test, the pull-out test with full
interaction, the Ø value can be found in Equation (13) and
the coefficient b can be found and the shear strength can be
calculated by placing it in Equation (14).
In this study, to determine the number of the connectors
to be anchored to the masonry wall surface, an existing
building constructed using commonly used clay bricks and
techniques in the preparation of mortar and plaster in
Turkey is chosen as a sample for testing. The mechanical
properties of the wall in this building appear to be quite
different from previous studies in Ceroni’s study [22] in
terms of the compressive strength of the mortar and wall,
the confinement pressure, and the maximum experimental
tensile strength. Although there was a good correlation
between the pull-out test results regarding the increase in
the performance of the connectors due to the increase in the
anchor embedding and hole diameter, it was not possible to
compare the test results with the current test results pre-
sented by Ceroni [22].
4. Conclusions and Suggestions
This study, it is aimed to determine the anchor shear per-
formance by a simpler pull-out with full interaction, since
the shear test and the pull-out with partial interaction tests
are quite difficult and time-consuming. For this purpose,
two different types of practical and useful steel plate test
apparatus were specially designed for experimental set-ups.
These two apparatuses were used to determine the shear
performance and pull-out performance with partial inter-
action of reinforcement steel rods with different diameters
and embedment depths anchored to the walls of an existing
5-storey masonry building with clay bricks in Ankara.
Here, 12 pull-outs with full interaction tests, 24 pull-outs
with partial interaction tests, and 9 shear tests were con-
ducted. Following results were obtained as a result of this
study:
• It has been observed that the pull-out force of the fully
interacted anchors (Pfi) is higher than the pull-out force
of the partially interacted anchors (Ppi), so to be closer
to the scientific facts in the design of the anchors under
the pull-out effect, the results of the Ppi pull-out test
should be taken as reference.
• It has been observed that the anchor diameter has little
effect on the realistic Ppi pull-out capacity compared to
the anchor depth. Therefore, when the ease of appli-
cation is also taken into consideration, it has been
observed that the pull-out capacity of the smallest
diameter (Ø10) anchor is close to the larger ones, and
thin diameter anchors are recommended for pull
anchor applications.
• For this building, by taking the derivation of the
second-order equations, optimum anchorage depth was
varied depending on the anchor diameter. The opti-
mum anchorage depth depending on the anchor
diameter; Lad = 20.73 cm for Ø10, Lad = 19.17 cm
for Ø12 and Lad = 18.26 cm for Ø16 mm. Therefore,
making the anchorage depth greater than the optimum
Lad does not have any contribution, but it has shown
that the ductile behavior increases with the increase of
the anchorage depth up to the optimum. Thus the ideal
embedment depth is the optimum anchorage depth.
This varies from building to building so it should be
determined for other buildings with different material
properties before strengthening analysis.
• The adherence between the reinforcement and the
epoxy is stronger than the adherence at the epoxy-wall
interface, and the collapse occurs at the epoxy-wall
interface, so when calculating the adherence surface
area in the adherence pull-out capacity calculations,
0.00
0.05
0.10
0.15
0.20
0.25
0.30
8 10 12 14 16
b=P f
i/Vm
ax
Anchor diameter (mm)
Figure 25. The ratio of pull-out force with full interaction to
shear force depend on anchor diameter.
Sådhanå (2021) 46:184 Page 11 of 13 184

the hole diameter (D) is essential instead of the anchor
reinforcement diameter (Ø). It is more important that
the anchorage holes are not left dusty and cleaned well
with a compressor. However, if ribbed reinforcement is
used in anchors to reduce the use of epoxy, it has been
observed that Ø10 anchors have D=Ø?4 mm hole
diameter for ease of application and keep D larger will
not be meaningful.
• In addition, for any anchorage depth, depending on the
reinforcement diameter, it is determined that the ratio
of Pfi/Ppi is variable and the equation Pfi = 0. 152Ø9Ppisignificant with 98.94% regression between them.
• While the increase in the diameter of the anchor
reinforcement has a great effect on the anchorage Pficapacity, it has been observed that its effect on the Ppicapacity, shear capacity and energy absorption capac-
ity is negligible, so it would be more meaningful to
prefer thin reinforcement in anchor in terms of ease of
application and economy.
• It was observed that the shear performance increased
parabolically with a decreasing trend in line with the
increase in the anchor embedment depth. It has been
observed that if this increase in anchor depth is made
more than 20 cm, its contribution to the shear capacity
will be minimized and it will increase the cost.
• With the increase in anchor embedment depth from 5
cm to 15 cm, it has been observed that there is an
increase of approximately 8 times in the ductility level
and proportionally in the energy absorption capacity.
• It has been observed that the thinnest Ø10 anchor rods
showed a ductile behavior with a bigger collapse
deformation in comparison to the other thick diameter
anchors. In terms of allowing the redistribution of the
load among the anchors and preventing the early brittle
failure of connections, ductile connection showed a
great advantage in terms of nonlinear analysis of a
strengthened system.
• The use of reinforcement anchor rods, which are more
ductile and readily available as the anchor, makes
reinforcement connections more ductile. The shear
strength is approximately seven times bigger than the
pull-out strength of Ø10 anchor rods. Thin anchors
under the effect of shear load are more easily bent in
the wall than thick anchors. It was found important in
terms of decreasing the shear stress and increasing the
tensile stress in its cross-section because the tensile
strength of the steel rod is bigger than the shear
strength of the steel rod.
• In the case of strengthening of relatively higher
strength, concrete walls instead of brick walls, the
bending in the anchor rods will decrease because the
crushing will be less. Because of the non-ductile
behavior of the connection, the anchor steel rods
cannot redistribute their overloads to the less loaded
anchor steel rods and earlier shear failure will occur.
Thus, the effect of the increase in the anchorage depth
on the shear performance will decrease, and the
effective embedment depth will also be less.
• This study was carried out on an existing masonry
building that is going to be destroyed because of the
earthquake. These testing results were only found out
for this building with specific material properties. All
these results (especially adherence shear strength) will
vary on a different building and a masonry different in
terms of units and mortar. So, these tests should be
carried out on different masonry buildings to obtain
more reliable equations.
References
[1] Ceran H B and Erberik M A 2013 Effect of out-of-plane
behavior on seismic fragility of masonry buildings in
Turkey. Bull. Earthquake Eng. 11: 1775–1795.[2] Shabdin M, Zargaran M and Attari N K 2018 Experimental
diagonal tension (shear) test of Un-Reinforced Masonry
(URM) walls strengthened with textile reinforced mortar
(TRM). Constr. Build. Mater. 164: 704–715.[3] ElGawady M, Lestuzzi P and Badoux M 2004 A review of
conventional seismic retrofitting techniques for URM. In:
Proceedings of the 13th International Brick and BlockMasonry Conference, Amsterdam, pp. 1–10
[4] Yon B, Onat O, Oncu M E and Karasin A, 2020 Failures of
masonry dwelling triggered by East Anatolian Fault earth-
quakes in Turkey. Soil Dyn. Earthquake Eng. 133: 106–126.[5] Lin T J and LaFave J M 2012 Experimental structural
behavior of wall-diaphragm connections for older masonry
buildings. Constr. Build. Mater. 26: 180–189.[6] AlShawa O, Liberatore D and Sorrentino L 2019 Dynamic
one-sided out-of-plane behavior of unreinforced-masonry
wall restrained by elasto-plastic tie-rods. Int. J. Archit.Heritage 13: 340–357.
[7] Paganoni S and D’Ayala D 2010 Experimental and compu-
tational validation of dissipative prototype for the seismic
protection of heritage buildings. Adv. Mater. Res. 133:
831–836.
[8] Riccadonna D, Giongo I, Schiro G, Rizzi E and Parisi M A
2019 Experimental shear testing of timber-masonry dry
connections for the seismic retrofit of unreinforced masonry
shear walls. Constr. Build. Mater. 211: 52–72.[9] Taghdi M, Bruneau M and Saatcioglu M 2000 Seismic
retrofitting of low-rise masonry and concrete walls using
steel strips. J. Struct. Eng. 126: 1017–1025.[10] Ghiassi B and Mohammadi M S 2012 A performance-based
method for seismic evaluation of masonry walls strengthened
with RC layers. In: Proceedings of 15th World Conferenceon Earthquake Engineering, Lisbon, Portugal
[11] Paganoni S and D’Ayala D 2014 Testing and design
procedure for corner connections of masonry heritage
buildings strengthened by metallic grouted anchors. Eng.Struct. 70: 278–293.
[12] Arifovic F and Nielsen M P 2004 Strength of anchors inmasonry. Department of Civil Engineering, Technical
184 Page 12 of 13 Sådhanå (2021) 46:184

University of Denmark, Rapport BYG DTU, ISBN 87-7877-
205-2
[13] Ceroni F, Cuzzilla R and Pecce M 2016 Assessment
of performance of steel and GFRP bars as injected
anchors in masonry walls. Constr. Build. Mater. 123: 78–98.[14] Burton C, Visintin P, Griffith M and Vaculik J 2020 Field
testing of vintage masonry: Mechanical properties and
anchorage strengths. Structures. 28: 1900–1914.[15] Giresini L, Puppio M L and Taddei F 2020 Experimental
pull-out tests and design indications for strength anchors
installed in masonry walls. Mater. Struct. 53: 1–16.[16] Munoz R, Lourenco P B and Moreira S 2018 Experimen-
tal results on mechanical behaviour of metal anchors in
historic stone masonry. Constr. Build. Mater. 163: 643–655.[17] Panizza M, Girardello P, Garbin E, Valluzzi M R, Cardani G,
Dalla Benetta M and Casadei P 2015 On-site pull-out tests of
steel anchor spikes applied to brickwork masonry. Key Eng.Mater. 624: 266–274.
[18] Giuriani E, Gattesco N and Del Piccolo M 1993 Experimental
tests on the shear behaviour of dowels connecting concrete
slabs to stone masonry walls. Mater. Struct. 26: 293–301.[19] Choi Y H and LaFave J M 2004 Performance of corrugated
metal ties for brick veneer wall systems. J. Mater. Civ. Eng.16: 202–211.
[20] Kucharczyk A and Urbanska K 2019 Impact of Anchoring
Steel Mast Structure on the State of Stress and Strain in
Existing Masonry Buildings. IOP Conf. Ser.: Mater. Sci.Eng. 471: 052037
[21] Binda L, Modena C, Valluzzi M R and Zago R 1999
Mechanical effects of bed joint steel reinforcement in historic
brick masonry structures. In: Proceedings of the 8th Int. Conf.and Exhibition, Structural Faults? Repair, London, pp. 3–13
[22] Ceroni F and Di Ludovico M 2020 Traditional and
innovative systems for injected anchors in masonry ele-
ments: Experimental behavior and theoretical formulations.
Constr. Build. Mater. 254: 119178.
Sådhanå (2021) 46:184 Page 13 of 13 184