Embed Size (px)
Citation preview
Molecular Beam Mass Spectroscopy 20/11/2006Katrin Pelzer, Dept. Inorg. Chemistry, FHI-MPG, Berlin
In situ molecular beam massspectrometry for high temperature
catalysis research:Heterogeneous – Homogeneous
Catalytic OxidationsKatrin Pelzer

Molecular Beam Mass Spectroscopy 20/11/2006Katrin Pelzer, Dept. Inorg. Chemistry, FHI-MPG, Berlin
Co-workers
• MBMS group
Molecular Beam Mass Spectroscopy 20/11/2006Katrin Pelzer, Dept. Inorg. Chemistry, FHI-MPG, Berlin
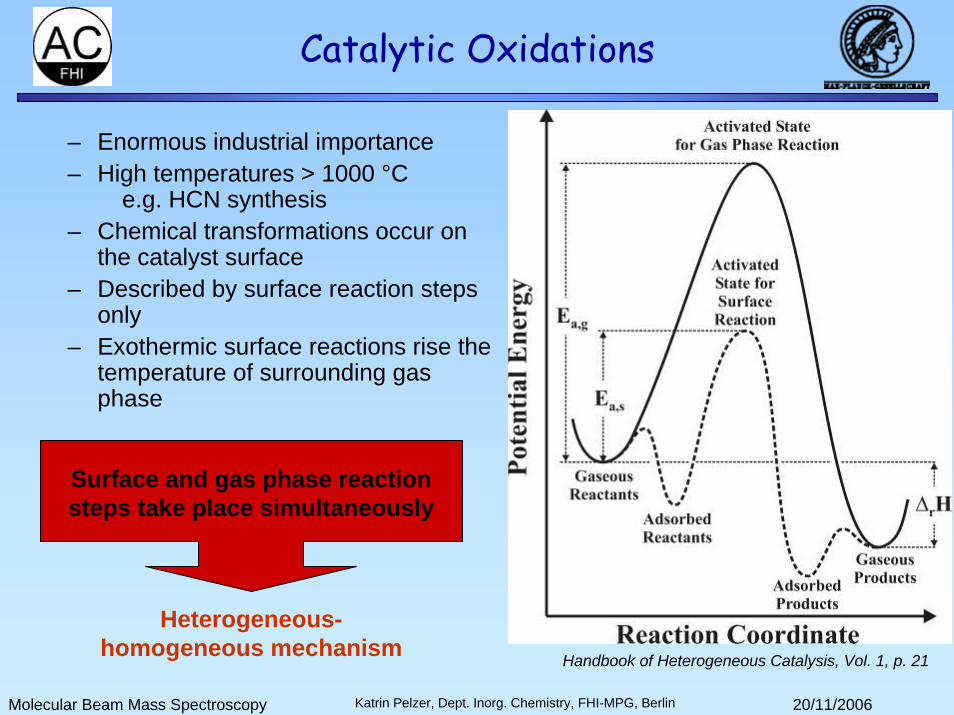
Catalytic Oxidations
– Enormous industrial importance – High temperatures > 1000 °C
e.g. HCN synthesis– Chemical transformations occur on
the catalyst surface– Described by surface reaction steps
only– Exothermic surface reactions rise the
temperature of surrounding gas phase
Heterogeneous-homogeneous mechanism
Surface and gas phase reactionsteps take place simultaneously
Handbook of Heterogeneous Catalysis, Vol. 1, p. 21

Molecular Beam Mass Spectroscopy 20/11/2006Katrin Pelzer, Dept. Inorg. Chemistry, FHI-MPG, Berlin
Reactor Modeling with Detailed Chemistry
Homogeneous reaction pathways become feasible:
• Exothermic surface reactions– Energetic coupling
• Desorption of heterogeneously formed intermediates– Substancial coupling
Transport of energy, species
Heat transport in wall
Gas phasereactions
Thermalradiation Diffusion
Adsorptionsurface reactionsdesorption
Deutschmann O., Interactions between Transport and Chemistry in Catalytic Reactors, Habilitation.
key intermediates: radicals
Molecular Beam Mass Spectroscopy 20/11/2006Katrin Pelzer, Dept. Inorg. Chemistry, FHI-MPG, Berlin
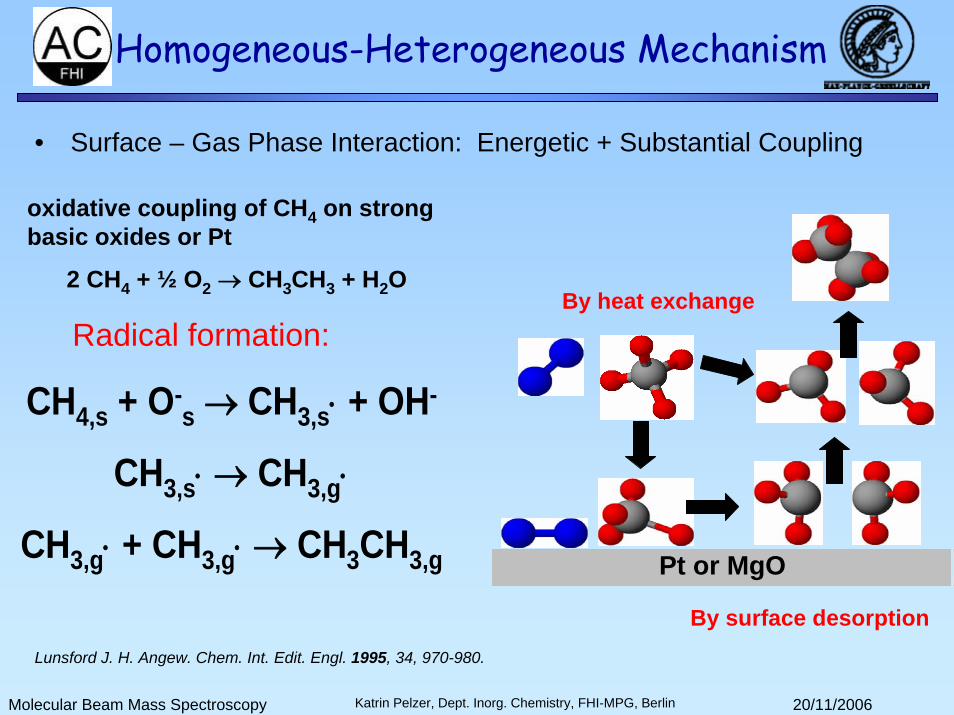
Homogeneous-Heterogeneous Mechanism
• Surface – Gas Phase Interaction: Energetic + Substantial Coupling
Pt or MgO
CH4,s + O-s → CH3,s⋅ + OH-
CH3,s⋅ → CH3,g⋅
CH3,g⋅ + CH3,g⋅ → CH3CH3,g
Radical formation:By heat exchange
By surface desorptionLunsford J. H. Angew. Chem. Int. Edit. Engl. 1995, 34, 970-980.
oxidative coupling of CH4 on strongbasic oxides or Pt
2 CH4 + ½ O2 → CH3CH3 + H2O

Molecular Beam Mass Spectroscopy 20/11/2006Katrin Pelzer, Dept. Inorg. Chemistry, FHI-MPG, Berlin
Homogeneous Contributions
• Dehydrogenation of ethane to ethene over Pt in the gas phaseC2H6,g → C2H4,g + H2,g ΔrH° = +137 kJ/mol
Heat from surface oxidation: C2H6 + 7/2 O2 → 2 CO2 + 3 H2O ΔrH° = -1560 kJ/mol
(energetical coupling)
Huff, Androulakis, Sinfelt, J. Catal. 2000, 191, 46-54.
• Oxidative coupling of methane to ethylene and water2 CH4 + O2 →C2H4 + 2 H2O
Catalysts produces CH3 radicals: gas phase coupling to ethane anddehydrogenation to ethylene(substantial coupling)
Mims, Mauti, Dean, Rose, J. Phys. Chem. 1994, 98, 13357-13372.
Molecular Beam Mass Spectroscopy 20/11/2006Katrin Pelzer, Dept. Inorg. Chemistry, FHI-MPG, Berlin
Mechanistic details
Elementary steps
Intermediates
Molecular Beam Mass Spectroscopy 20/11/2006Katrin Pelzer, Dept. Inorg. Chemistry, FHI-MPG, Berlin
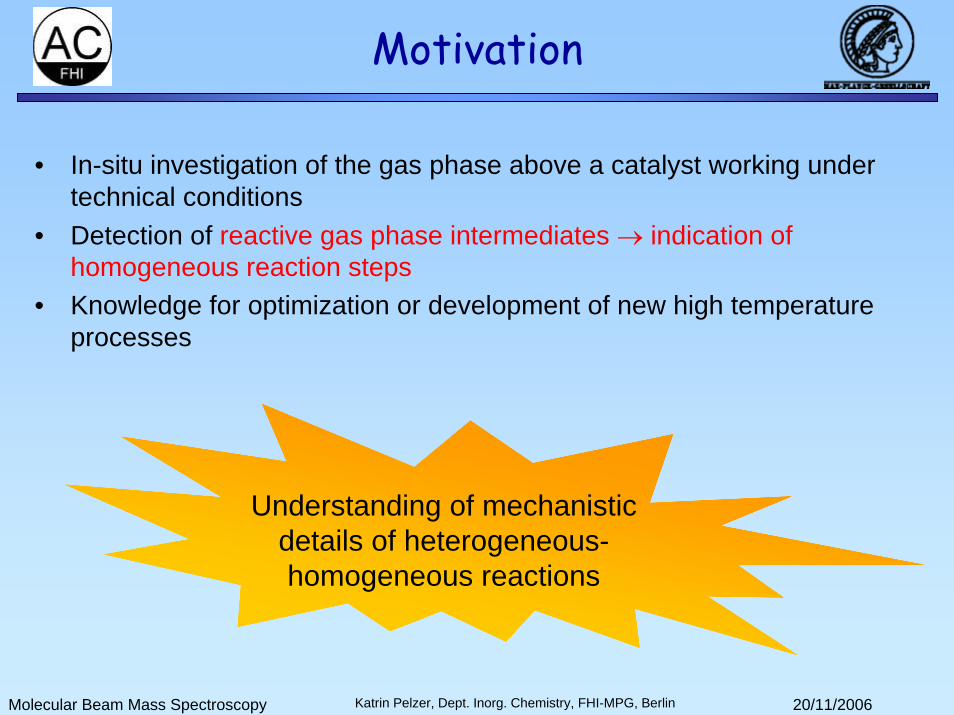
Motivation
• In-situ investigation of the gas phase above a catalyst working under technical conditions
• Detection of reactive gas phase intermediates → indication of homogeneous reaction steps
• Knowledge for optimization or development of new high temperature processes
Understanding of mechanistic details of heterogeneous-homogeneous reactions
Molecular Beam Mass Spectroscopy 20/11/2006Katrin Pelzer, Dept. Inorg. Chemistry, FHI-MPG, Berlin
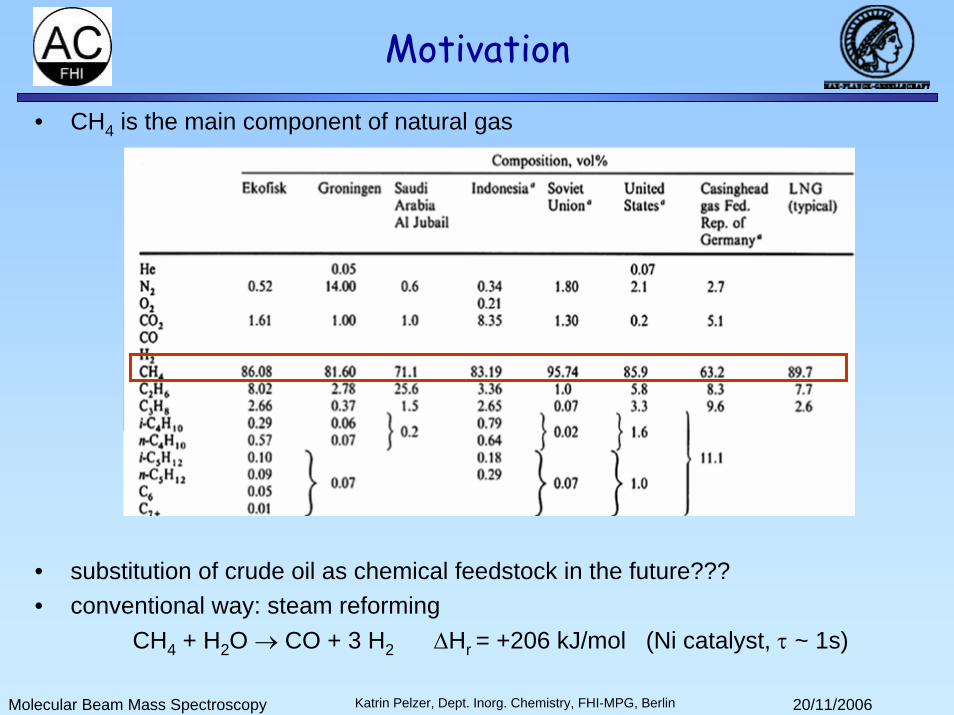
Motivation
• CH4 is the main component of natural gas
• substitution of crude oil as chemical feedstock in the future???• conventional way: steam reforming
CH4 + H2O → CO + 3 H2 ΔHr = +206 kJ/mol (Ni catalyst, τ ~ 1s)
Molecular Beam Mass Spectroscopy 20/11/2006Katrin Pelzer, Dept. Inorg. Chemistry, FHI-MPG, Berlin
Motivation
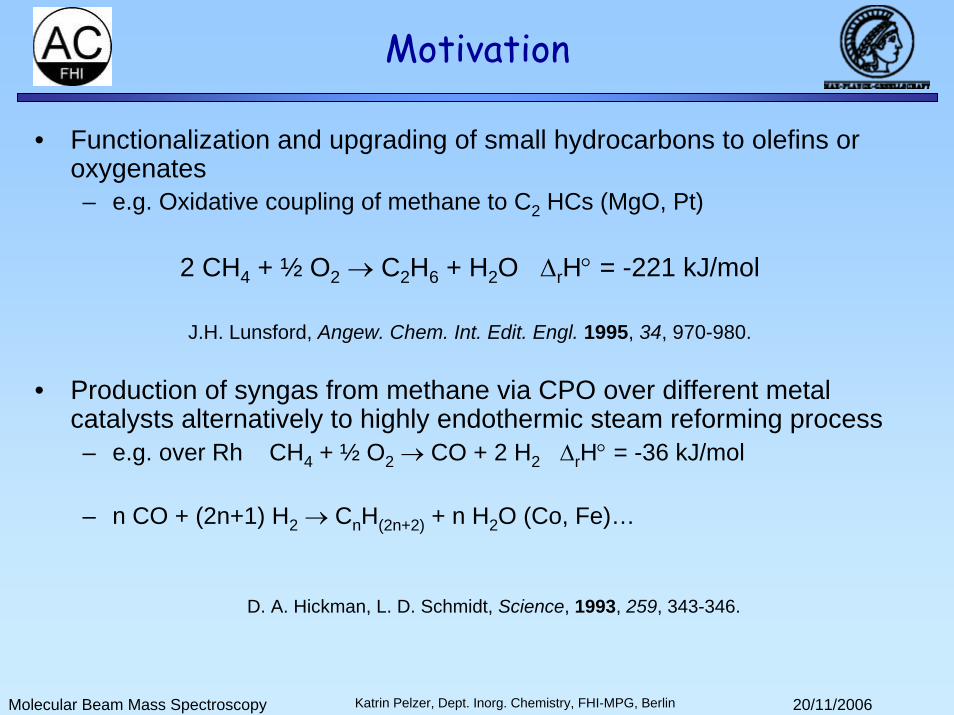
• Functionalization and upgrading of small hydrocarbons to olefins or oxygenates– e.g. Oxidative coupling of methane to C2 HCs (MgO, Pt)
2 CH4 + ½ O2 → C2H6 + H2O ΔrH° = -221 kJ/mol
J.H. Lunsford, Angew. Chem. Int. Edit. Engl. 1995, 34, 970-980.
• Production of syngas from methane via CPO over different metal catalysts alternatively to highly endothermic steam reforming process– e.g. over Rh CH4 + ½ O2 → CO + 2 H2 ΔrH° = -36 kJ/mol
– n CO + (2n+1) H2 → CnH(2n+2) + n H2O (Co, Fe)…
D. A. Hickman, L. D. Schmidt, Science, 1993, 259, 343-346.
Molecular Beam Mass Spectroscopy 20/11/2006Katrin Pelzer, Dept. Inorg. Chemistry, FHI-MPG, Berlin
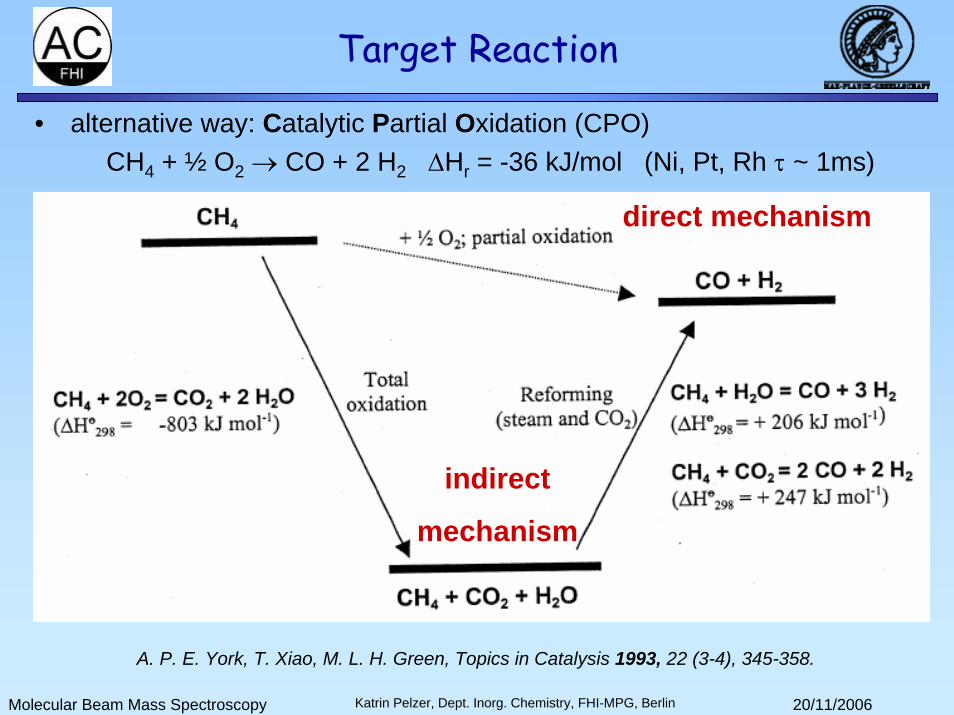
Target Reaction
indirect
mechanism
direct mechanism
• alternative way: Catalytic Partial Oxidation (CPO)CH4 + ½ O2 → CO + 2 H2 ΔHr = -36 kJ/mol (Ni, Pt, Rh τ ~ 1ms)
A. P. E. York, T. Xiao, M. L. H. Green, Topics in Catalysis 1993, 22 (3-4), 345-358.
Molecular Beam Mass Spectroscopy 20/11/2006Katrin Pelzer, Dept. Inorg. Chemistry, FHI-MPG, Berlin
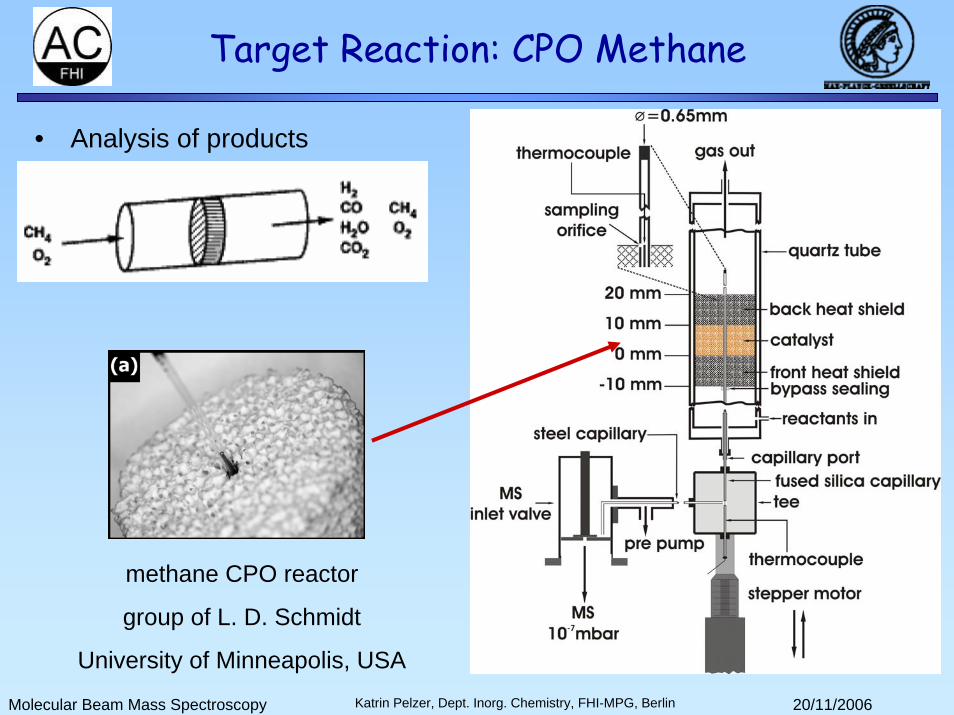
Target Reaction: CPO Methane
methane CPO reactor
group of L. D. Schmidt
University of Minneapolis, USA
• Analysis of products

Molecular Beam Mass Spectroscopy 20/11/2006Katrin Pelzer, Dept. Inorg. Chemistry, FHI-MPG, Berlin
Molecular Beam Mass Spectrometer
Mass spectrometer
Skimmer chamber
Reactor chamber
Pyrometer scanner
Turbomolecular pump
Collimator chamber

Molecular Beam Mass Spectroscopy 20/11/2006Katrin Pelzer, Dept. Inorg. Chemistry, FHI-MPG, Berlin
Wall Reactor Setup• Pt/Rh tube 90/10 w%, 10 mm, ∅ 5.0 mm OD, 0.3 mm wall thickness
Fabeckstr. Room 3032
tiny orifice
Molecular Beam Mass Spectroscopy 20/11/2006Katrin Pelzer, Dept. Inorg. Chemistry, FHI-MPG, Berlin
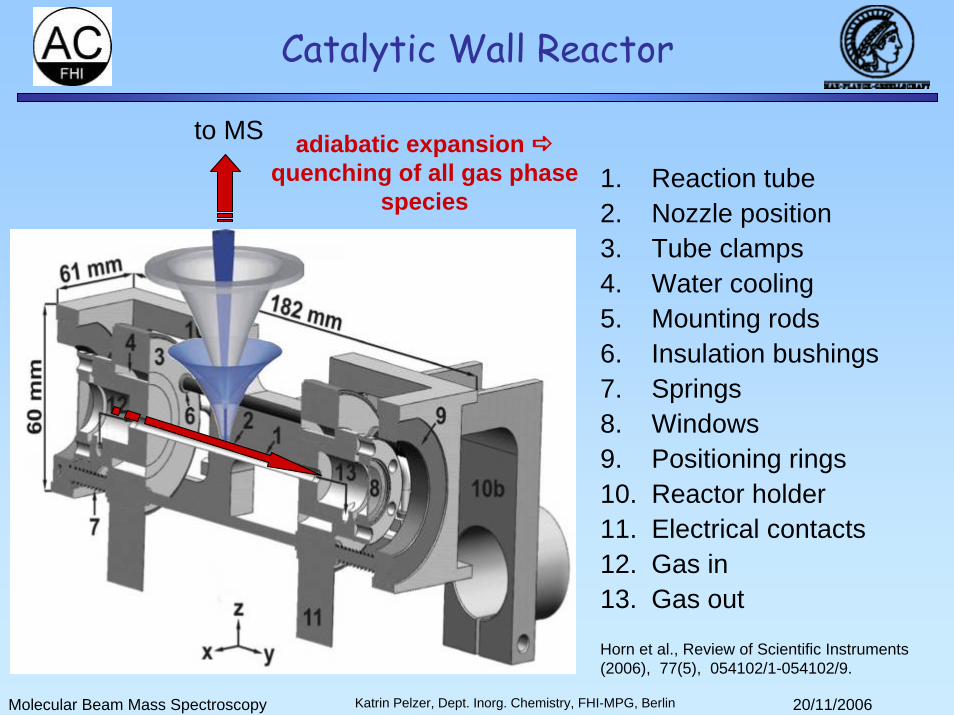
Catalytic Wall Reactor
1. Reaction tube2. Nozzle position3. Tube clamps4. Water cooling5. Mounting rods6. Insulation bushings7. Springs8. Windows9. Positioning rings10. Reactor holder11. Electrical contacts12. Gas in13. Gas out
to MS adiabatic expansion quenching of all gas phase
species
Horn et al., Review of Scientific Instruments (2006), 77(5), 054102/1-054102/9.

Molecular Beam Mass Spectroscopy 20/11/2006Katrin Pelzer, Dept. Inorg. Chemistry, FHI-MPG, Berlin
Reactor Setup
High temperature catalytic wall reactor installed in MBMS chamber
Molecular Beam Mass Spectroscopy 20/11/2006Katrin Pelzer, Dept. Inorg. Chemistry, FHI-MPG, Berlin
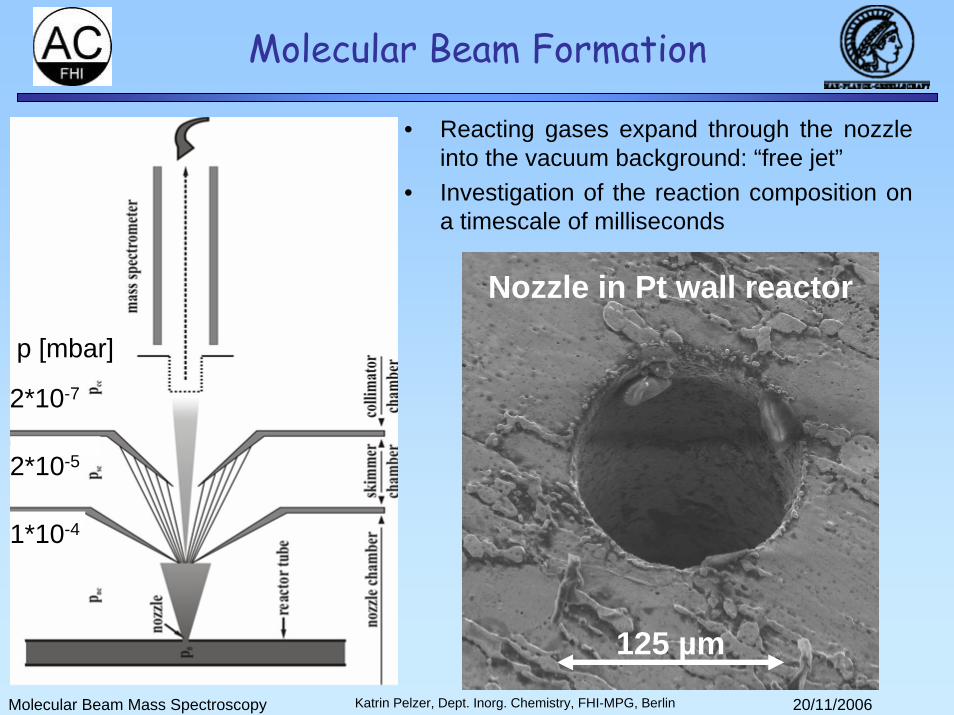
Molecular Beam Formation
125 µm
Nozzle in Pt wall reactor
• Reacting gases expand through the nozzle into the vacuum background: “free jet”
• Investigation of the reaction composition on a timescale of milliseconds
2*10-7
2*10-5
1*10-4
p [mbar]
Molecular Beam Mass Spectroscopy 20/11/2006Katrin Pelzer, Dept. Inorg. Chemistry, FHI-MPG, Berlin
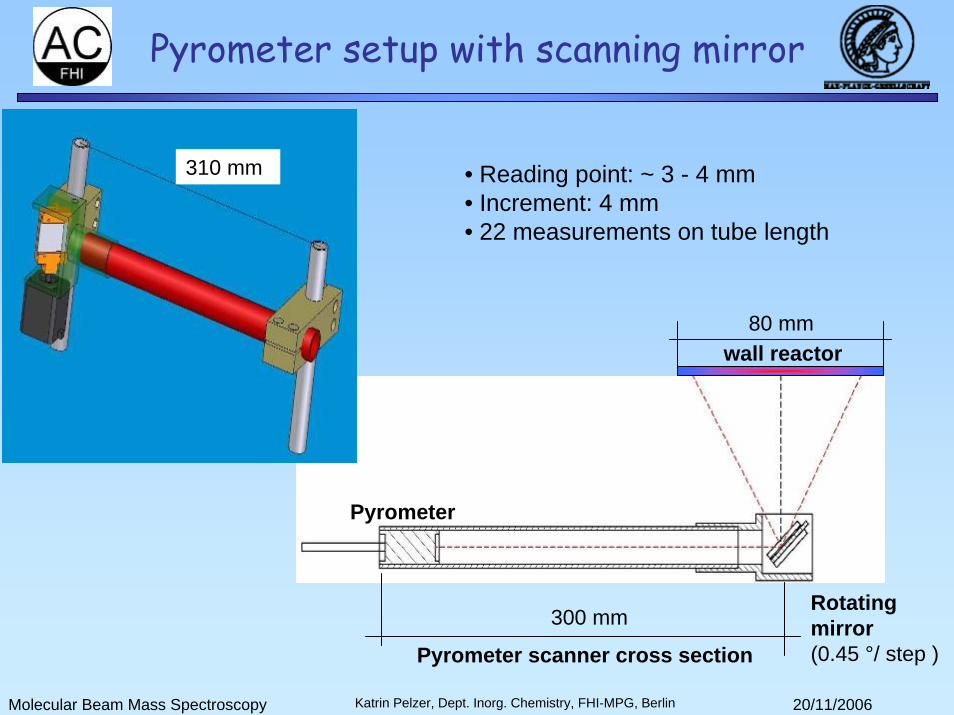
Pyrometer setup with scanning mirror
Rotating mirror (0.45 °/ step )
wall reactor
Pyrometer
Pyrometer scanner cross section
300 mm
80 mm
310 mm • Reading point: ~ 3 - 4 mm• Increment: 4 mm• 22 measurements on tube length

Molecular Beam Mass Spectroscopy 20/11/2006Katrin Pelzer, Dept. Inorg. Chemistry, FHI-MPG, Berlin
Temperature Profiles
Pyrometer for reaction controlling and temperature profile measurements
Pyrometer setup
Controller Box
Scanning Mirror
Scanning-Dot onPt-Tube
Molecular Beam Mass Spectroscopy 20/11/2006Katrin Pelzer, Dept. Inorg. Chemistry, FHI-MPG, Berlin
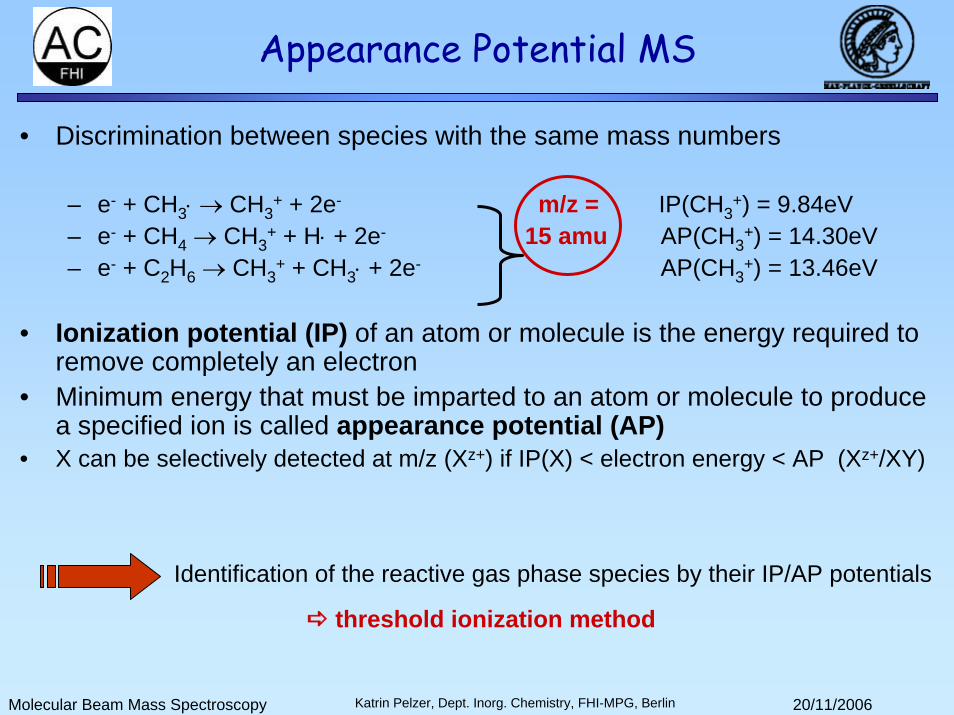
Appearance Potential MS
• Discrimination between species with the same mass numbers
– e- + CH3⋅ → CH3+ + 2e- m/z = IP(CH3
+) = 9.84eV– e- + CH4 → CH3
+ + H⋅ + 2e- 15 amu AP(CH3+) = 14.30eV
– e- + C2H6 → CH3+ + CH3⋅ + 2e- AP(CH3
+) = 13.46eV
• Ionization potential (IP) of an atom or molecule is the energy required to remove completely an electron
• Minimum energy that must be imparted to an atom or molecule to produce a specified ion is called appearance potential (AP)
• X can be selectively detected at m/z (Xz+) if IP(X) < electron energy < AP (Xz+/XY)
Identification of the reactive gas phase species by their IP/AP potentials
threshold ionization method
Molecular Beam Mass Spectroscopy 20/11/2006Katrin Pelzer, Dept. Inorg. Chemistry, FHI-MPG, Berlin
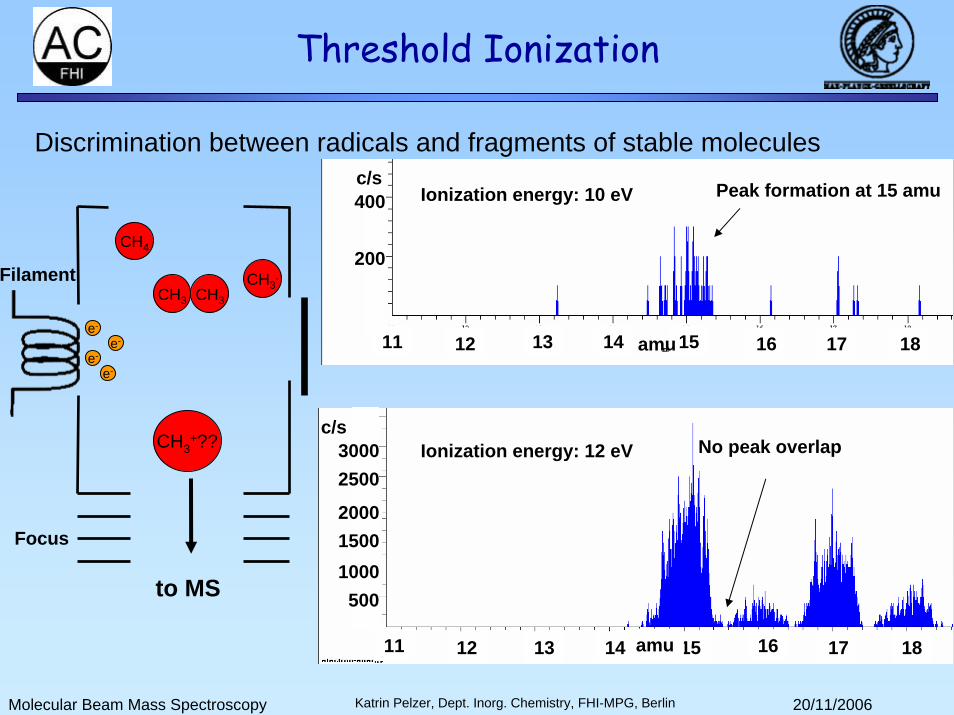
Threshold Ionization
Discrimination between radicals and fragments of stable molecules
e-
e-
e-e-
CH4
CH3.
CH3CH3
CH3+??
to MS
Filament
Focus
Ionization energy: 12 eV
Ionization energy: 10 eV Peak formation at 15 amu
No peak overlap
400
200
11 12 13 14 15 16 17 18
c/s
amu
11 12 13 14 15 16 17 18
c/s
amu
1000500
15002000
25003000

Molecular Beam Mass Spectroscopy 20/11/2006Katrin Pelzer, Dept. Inorg. Chemistry, FHI-MPG, Berlin
Threshold Ionization
CO in N2 as model system for CH3⋅ radical detection
Expected radical concentration:
102 – 103 ppm
CH3. in methane CPO on Pt CO in N2
Measured concentration range:
2260 – 20960 ppm
CH3⋅ + e- → CH3+ + 2 e-
12C1H3+ /12C1H3⋅ at m/z = 15amu
IP = 9.84 eV
CH4 + e- → CH3+ + H⋅ + 2 e-
12C1H3+ /12C1H4 at m/z = 15amu
AP = 14.01 eV
N2 + e- → N2+ + 2 e-
14N2+ /14N2 at m/z = 28amu
IP = 15.58 eV
CO + e- → CO + 2 e-
12C16O+ /12C16O at m/z = 28amu
IP = 14.014 eV
Molecular Beam Mass Spectroscopy 20/11/2006Katrin Pelzer, Dept. Inorg. Chemistry, FHI-MPG, Berlin
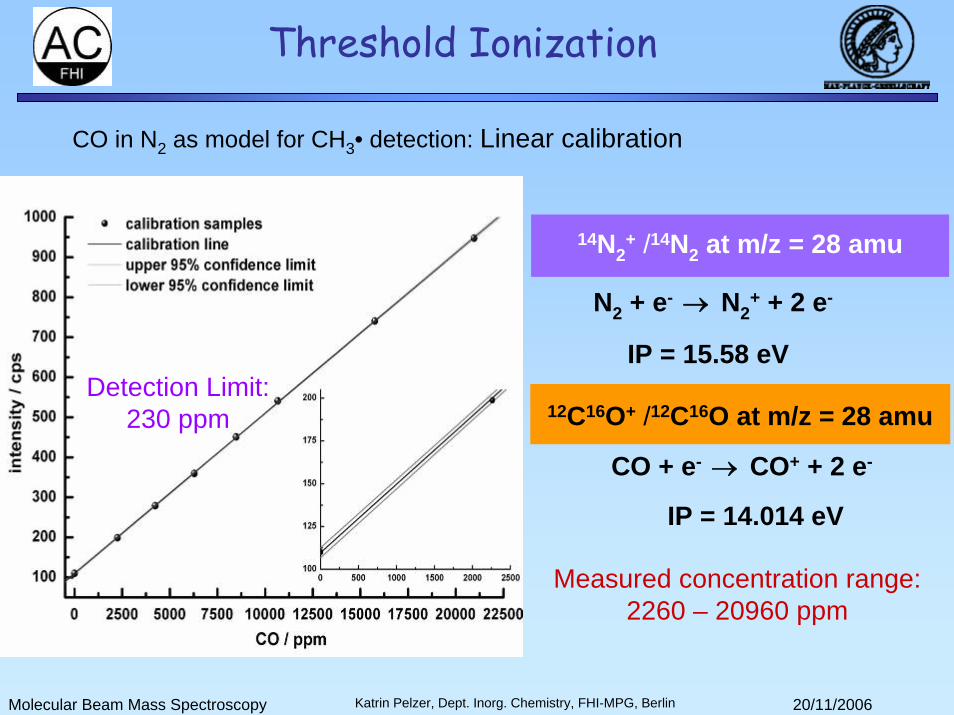
Threshold Ionization
N2 + e- → N2+ + 2 e-
14N2+ /14N2 at m/z = 28 amu
IP = 15.58 eV
CO + e- → CO+ + 2 e-
12C16O+ /12C16O at m/z = 28 amu
IP = 14.014 eV
Measured concentration range:2260 – 20960 ppm
CO in N2 as model for CH3• detection: Linear calibration
Detection Limit:230 ppm
Molecular Beam Mass Spectroscopy 20/11/2006Katrin Pelzer, Dept. Inorg. Chemistry, FHI-MPG, Berlin
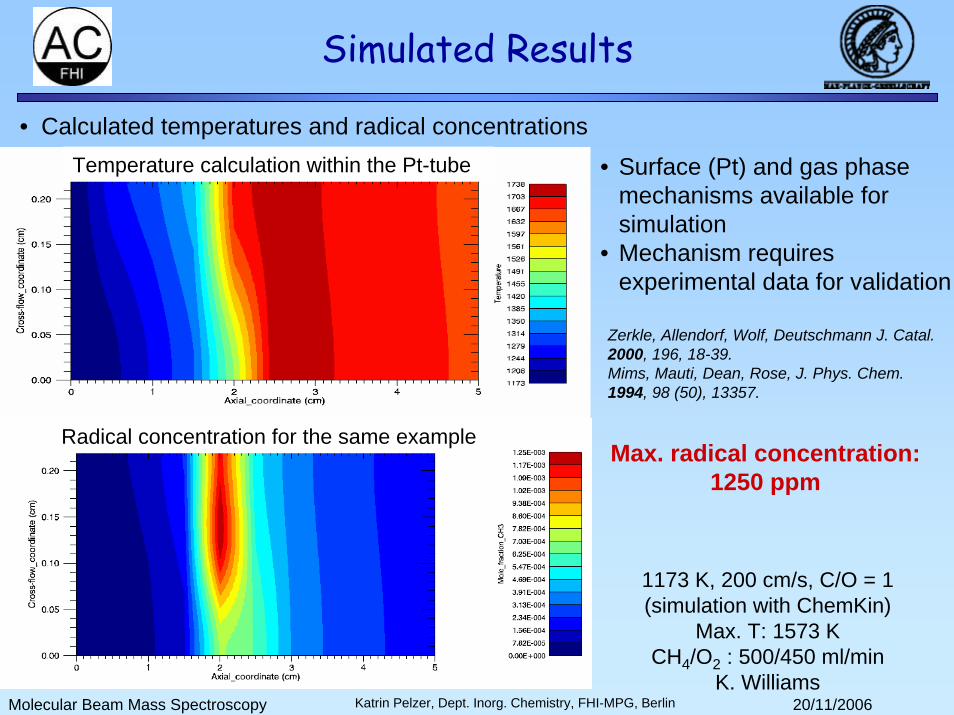
1173 K, 200 cm/s, C/O = 1 (simulation with ChemKin)
Max. T: 1573 K CH4/O2 : 500/450 ml/min
K. Williams
• Calculated temperatures and radical concentrations
Simulated Results
Temperature calculation within the Pt-tube
Radical concentration for the same example
• Surface (Pt) and gas phase mechanisms available for simulation
• Mechanism requires experimental data for validation
Zerkle, Allendorf, Wolf, Deutschmann J. Catal. 2000, 196, 18-39.Mims, Mauti, Dean, Rose, J. Phys. Chem. 1994, 98 (50), 13357.
Max. radical concentration:1250 ppm

Molecular Beam Mass Spectroscopy 20/11/2006Katrin Pelzer, Dept. Inorg. Chemistry, FHI-MPG, Berlin
Ionization Efficiency Curves
• Experiment offers Ionization Efficiency curves:– Intensity of an ion as a function of the energy of the ionizing electron
• i = f(V)• Variation of the electron energy: 4eV-150eV• Steps: 0.1eV
– Electron bombardment ionization– Ionization probability p: p(E) ∼ (E-Ei)n
• Simple ionization n = 1, double ionization n = 2 ... – Linear ascent of the intensity of the mass from the corresponding IP– Problem: thermal energy spread of electrons (Maxwell-Boltzmann)
( )dEe
kTE
NdN kT
E−
= 2/32π
Molecular Beam Mass Spectroscopy 20/11/2006Katrin Pelzer, Dept. Inorg. Chemistry, FHI-MPG, Berlin
Experimental Approach
• catalytic wall reactor (Pt, Tmax= 1300 °C, atmospheric pressure)• coupling to a QMS via molecular beam sampling interface• QMS with electron impact source & threshold ionization capability• principle discrimination of interfering ions (same nominal m/z
value) by means of their ionization- and appearance potentials• Inhomogeneous electrons determination of shape and width of
the electron energy spread function

Molecular Beam Mass Spectroscopy 20/11/2006Katrin Pelzer, Dept. Inorg. Chemistry, FHI-MPG, Berlin
Energy Spread and Offset
• N2 at 28 amu• IP N2 = 15.6 eV energy offset ≈ 1 eV
Energetically inhomogeneous electrons from the source:• Filament contaminations• Thermal energy spread (Maxwell-Boltzmann)• Potential drop along the filament• Potential gradients inside the source
energy spread: σ = 0.49eV IP ± 2σ = IP ± 0.5eV ≈ 1 eVGaussian
∫∞ −
−−
⋅=
IP
VE
dEIPEeCVi 127.12)(
)(2
)( 2
2
σ
πσ

Molecular Beam Mass Spectroscopy 20/11/2006Katrin Pelzer, Dept. Inorg. Chemistry, FHI-MPG, Berlin
starting sequence
300 ml/min CH4, 240ml/min O2, C/O = 0.6
surface ⇔ gas phase interaction
Homogeneous-Heterogeneous Mechanism
F. Cavani, F. Trifirò, Catal. Today, 1999, 51, 561-580. T. A. Garibyan, L. Y. Margolis, Catal. Rev.-Sci. Eng. 1989, 31, 355-384.
• oxidation reactions start at the surface
• heat of reactions (ΔrH << 0) increase gas phase temperature
• heat generation much faster than heat removal reactor light-off, reactor runs autothermally
• surpass of homogeneous reaction barriers gas phase reactions possible
Molecular Beam Mass Spectroscopy 20/11/2006Katrin Pelzer, Dept. Inorg. Chemistry, FHI-MPG, Berlin
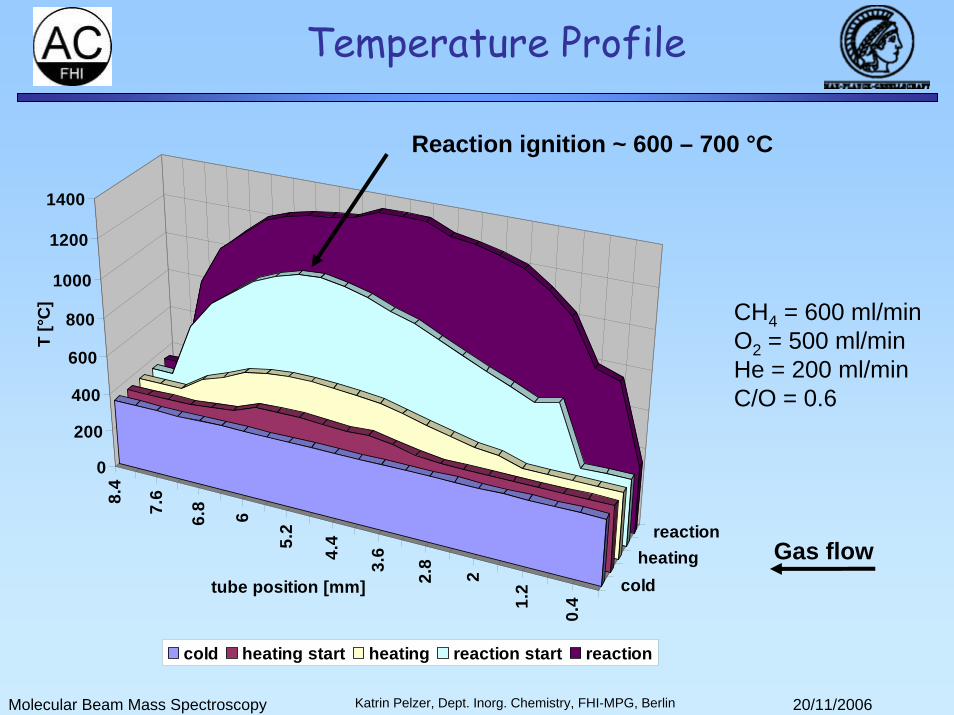
Temperature Profile
Gas flow
8.4
7.6
6.8 6
5.2
4.4
3.6
2.8
2
1.2
0.4
coldheating
reaction
0
200
400
600
800
1000
1200
1400
tube position [mm]
T [°
C]
cold heating start heating reaction start reaction
Reaction ignition ~ 600 – 700 °C
CH4 = 600 ml/minO2 = 500 ml/minHe = 200 ml/minC/O = 0.6

Molecular Beam Mass Spectroscopy 20/11/2006Katrin Pelzer, Dept. Inorg. Chemistry, FHI-MPG, Berlin
Spatially Resolved Measurements• Sliding the reaction zone along the nozzle by increasing the flow rate (adding He)
321 VVV &&& <<
1V& 2V& 3V&
Molecular Beam Mass Spectroscopy 20/11/2006Katrin Pelzer, Dept. Inorg. Chemistry, FHI-MPG, Berlin
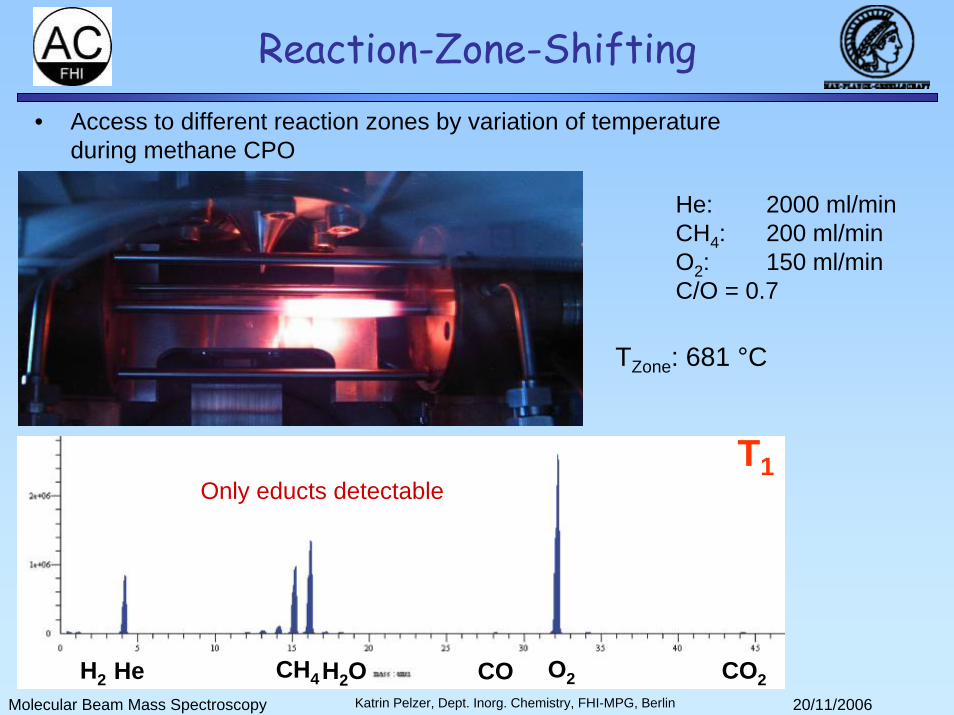
Reaction-Zone-Shifting• Access to different reaction zones by variation of temperature
during methane CPO
He CH4H2OH2 CO CO2O2
T1
TZone: 681 °C
Only educts detectable
He: 2000 ml/minCH4: 200 ml/minO2: 150 ml/minC/O = 0.7
Molecular Beam Mass Spectroscopy 20/11/2006Katrin Pelzer, Dept. Inorg. Chemistry, FHI-MPG, Berlin
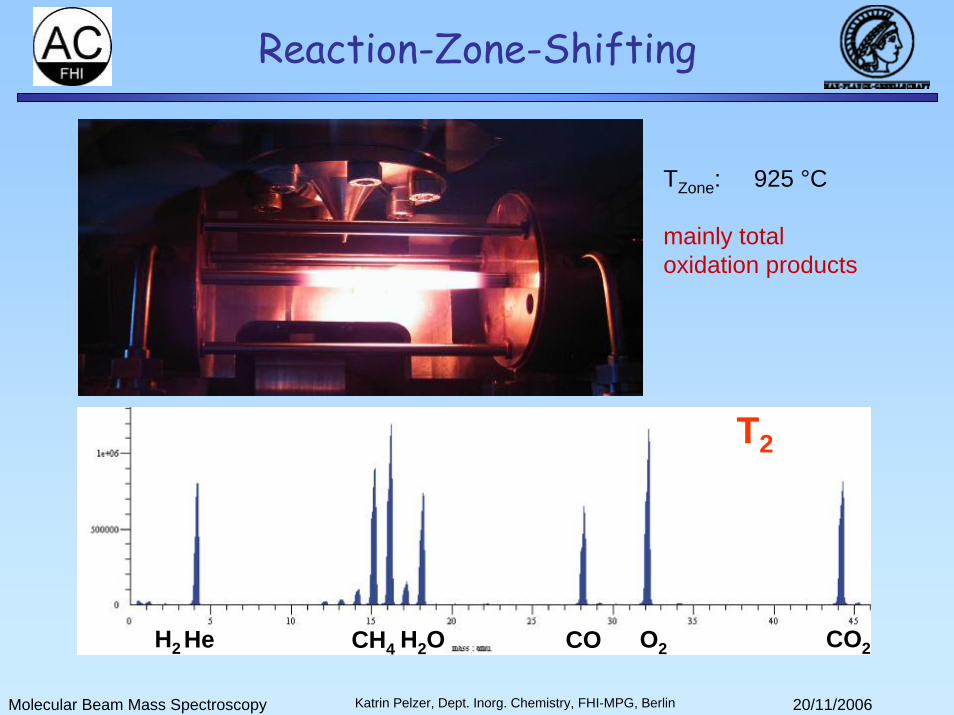
Reaction-Zone-Shifting
TZone: 925 °C
mainly total oxidation products
He CH4 H2OH2 CO CO2O2
T2
Molecular Beam Mass Spectroscopy 20/11/2006Katrin Pelzer, Dept. Inorg. Chemistry, FHI-MPG, Berlin
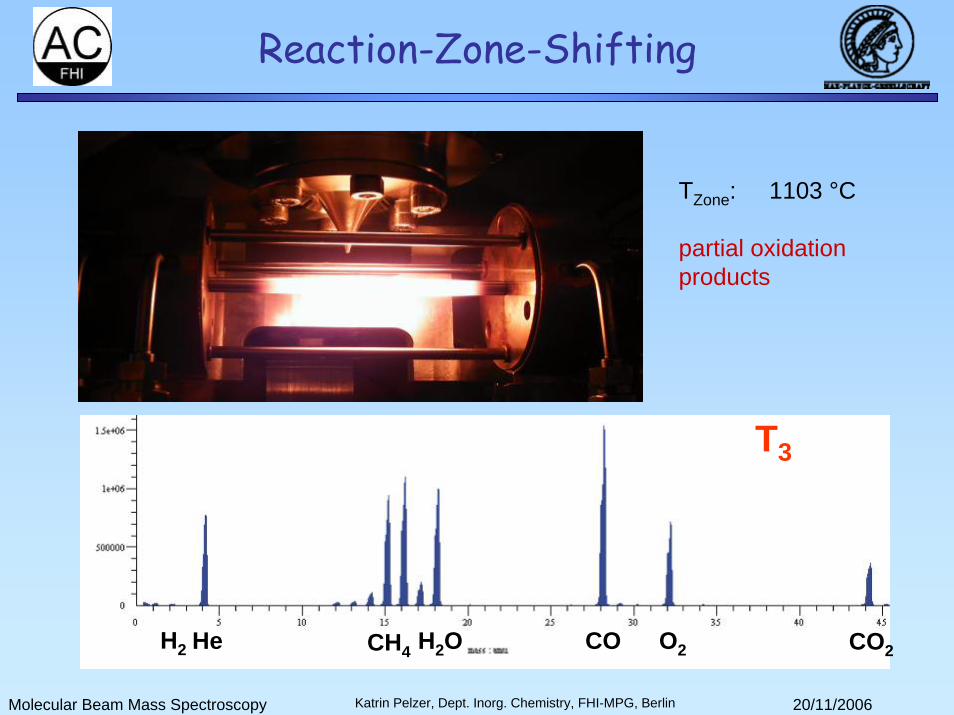
Reaction-Zone-Shifting
TZone: 1103 °C
partial oxidation products
He CH4 H2OH2 CO CO2O2
T3
Molecular Beam Mass Spectroscopy 20/11/2006Katrin Pelzer, Dept. Inorg. Chemistry, FHI-MPG, Berlin
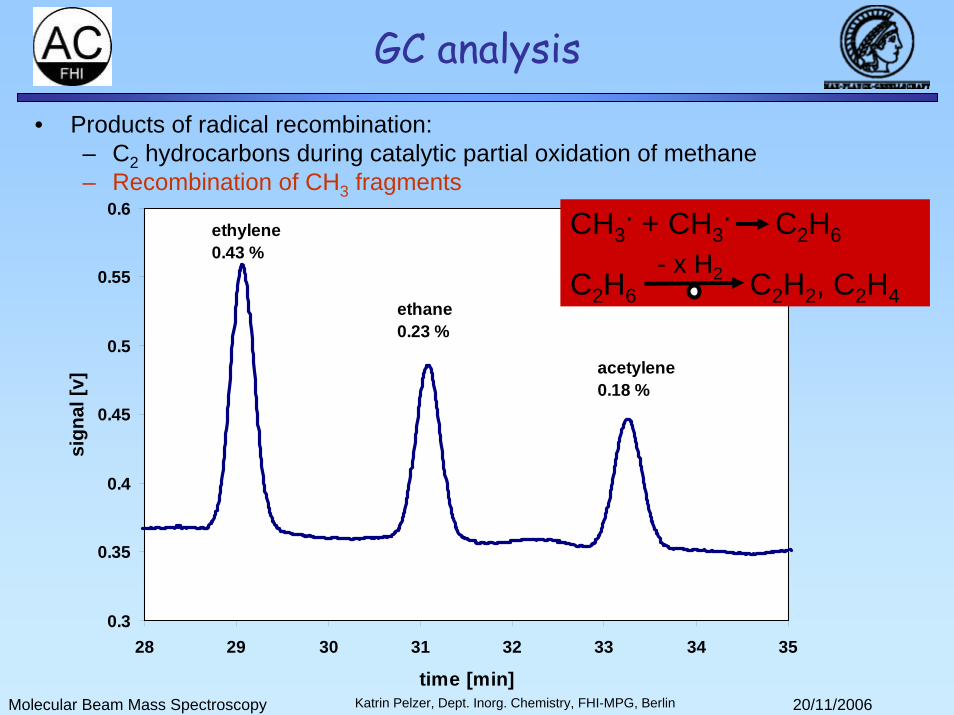
GC analysis• Products of radical recombination:
– C2 hydrocarbons during catalytic partial oxidation of methane– Recombination of CH3 fragments
0.3
0.35
0.4
0.45
0.5
0.55
0.6
28 29 30 31 32 33 34 35
time [min]
sign
al [v
]
ethylene0.43 %
ethane0.23 %
acetylene0.18 %
CH3. + CH3
. C2H6
C2H6 C2H2, C2H4- x H2

Molecular Beam Mass Spectroscopy 20/11/2006Katrin Pelzer, Dept. Inorg. Chemistry, FHI-MPG, Berlin
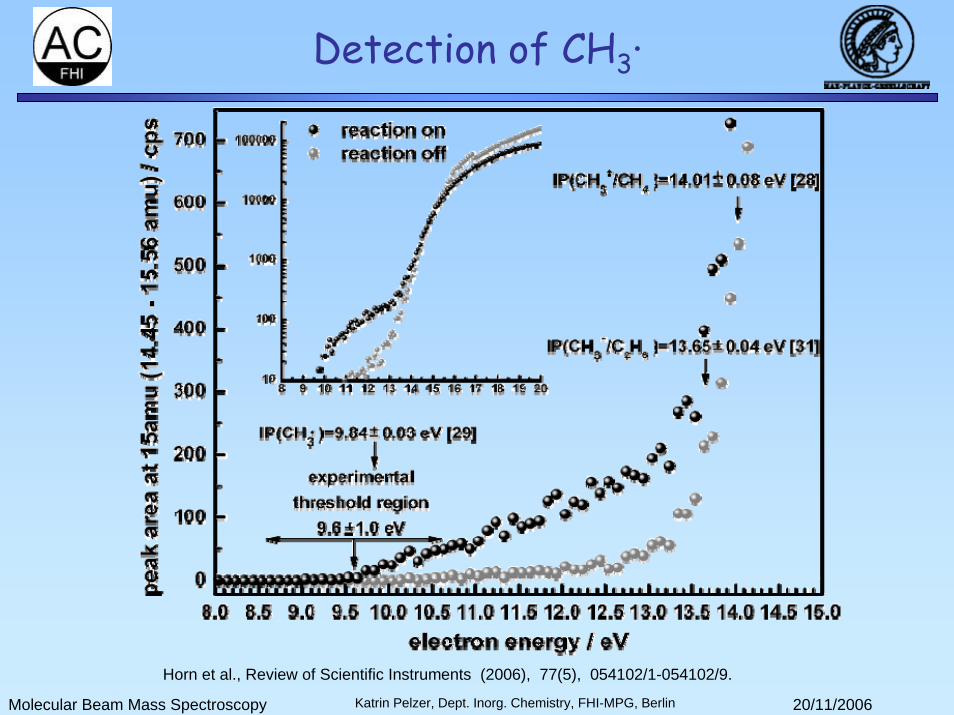
Detection of intermediates• CH3· in oxidative coupling of methane on Pt• Expected radical concentration: 100 – 1000 ppm
CH3· + e- → CH3+ + 2 e-
12C1H3+ /12C1H3· at m/z = 15 amu
IP = 9.84 eVCH4 + e- → CH3
+ + H· + 2 e-
12C1H3+ /12C1H4 at m/z = 15 amu
AP = 14.01 eV
CH4: 600 ml/minO2: 500 ml/minHe: 200 ml/min
Tmax: 1520 K
Molecular Beam Mass Spectroscopy 20/11/2006Katrin Pelzer, Dept. Inorg. Chemistry, FHI-MPG, Berlin
Detection of CH3·
Horn et al., Review of Scientific Instruments (2006), 77(5), 054102/1-054102/9.

Molecular Beam Mass Spectroscopy 20/11/2006Katrin Pelzer, Dept. Inorg. Chemistry, FHI-MPG, Berlin
0
1000
2000
3000
4000
5000
6000
7000
8000
9000
10000
9 10 11 12 13 14 15 16energy [eV]
peak
are
a [c
]
Background not heated Background heated CPO 80%,40ACPO 0%, 0A CPO 50%, 30A CPO new, 80%, 40A
> 1300°CCH3
+ from CH3·9.84 eV + 0.6 eV offset
IE curves: Radical concentrations
CH3+ from CH4
14.01 eV + 0.6 eV offset
Radical formation in the gas phase ???
~ 1250°C
~ 1100°C
Molecular Beam Mass Spectroscopy 20/11/2006Katrin Pelzer, Dept. Inorg. Chemistry, FHI-MPG, Berlin
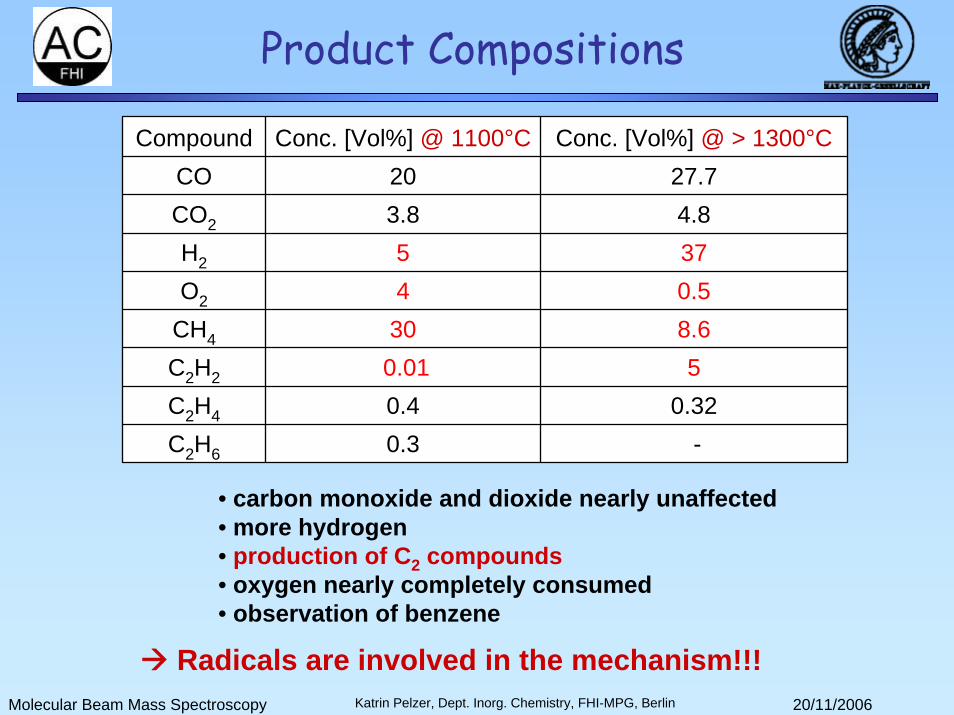
Compound Conc. [Vol%] @ 1100°C Conc. [Vol%] @ > 1300°CCO 20 27.7CO2 3.8 4.8H2 5 37O2 4 0.5
CH4 30 8.6C2H2 0.01 5C2H4 0.4 0.32C2H6 0.3 -
• carbon monoxide and dioxide nearly unaffected• more hydrogen• production of C2 compounds• oxygen nearly completely consumed• observation of benzene
Radicals are involved in the mechanism!!!
Product Compositions

Molecular Beam Mass Spectroscopy 20/11/2006Katrin Pelzer, Dept. Inorg. Chemistry, FHI-MPG, Berlin
Radical reactions
• Radicals are formed in gas phase or at catalyst surface at high temperatures• Started radical chain reactions lead to the desired products
Anders Holmen, Ola Olsvik, O. A. Rokstad, Fuel Processing Technology 42, 249-267 (1995).
Gas Phase Reaction started
Molecular Beam Mass Spectroscopy 20/11/2006Katrin Pelzer, Dept. Inorg. Chemistry, FHI-MPG, Berlin
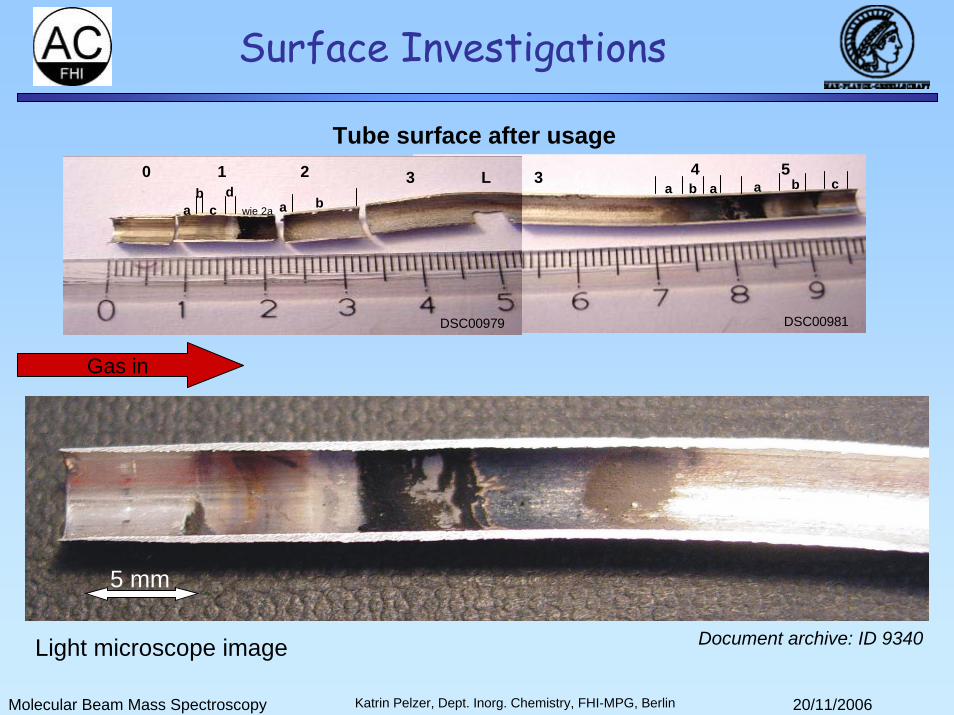
Surface Investigations
Tube surface after usage
Document archive: ID 9340Light microscope image
5 mm
DSC00981DSC00979
ab
cd
a bwie 2a
0 1 2 3 3La b ca ba
4 5
Gas in
Molecular Beam Mass Spectroscopy 20/11/2006Katrin Pelzer, Dept. Inorg. Chemistry, FHI-MPG, Berlin
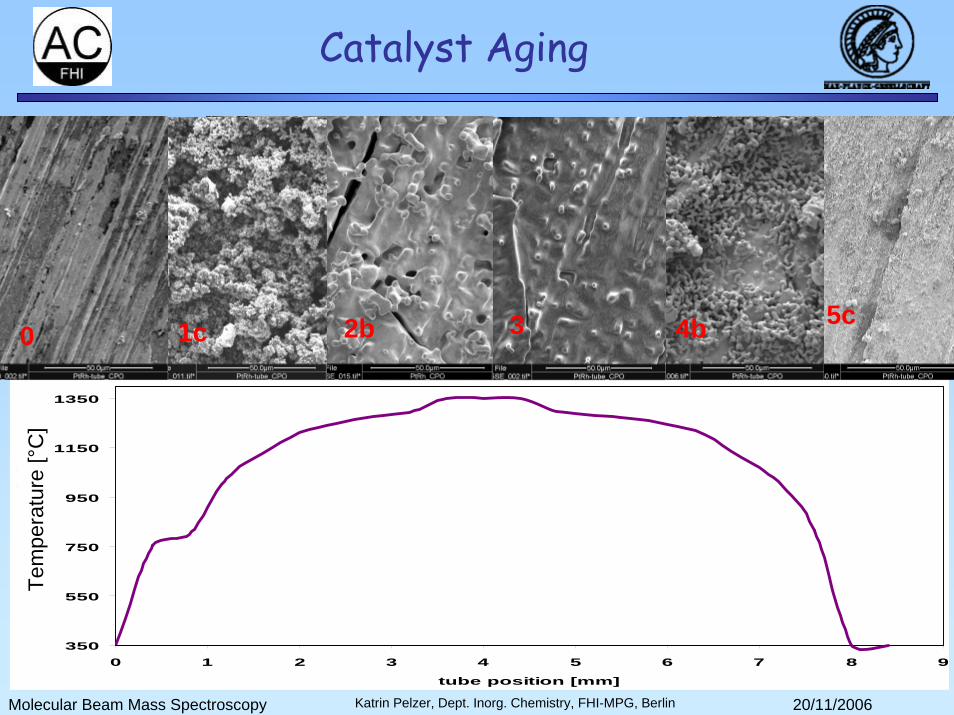
5c4b32b1c0
Catalyst Aging
350
550
750
950
1150
1350
0 1 2 3 4 5 6 7 8 9
tube position [mm]
tempe
rature [°C]
Tem
pera
ture
[°C
]
Molecular Beam Mass Spectroscopy 20/11/2006Katrin Pelzer, Dept. Inorg. Chemistry, FHI-MPG, Berlin
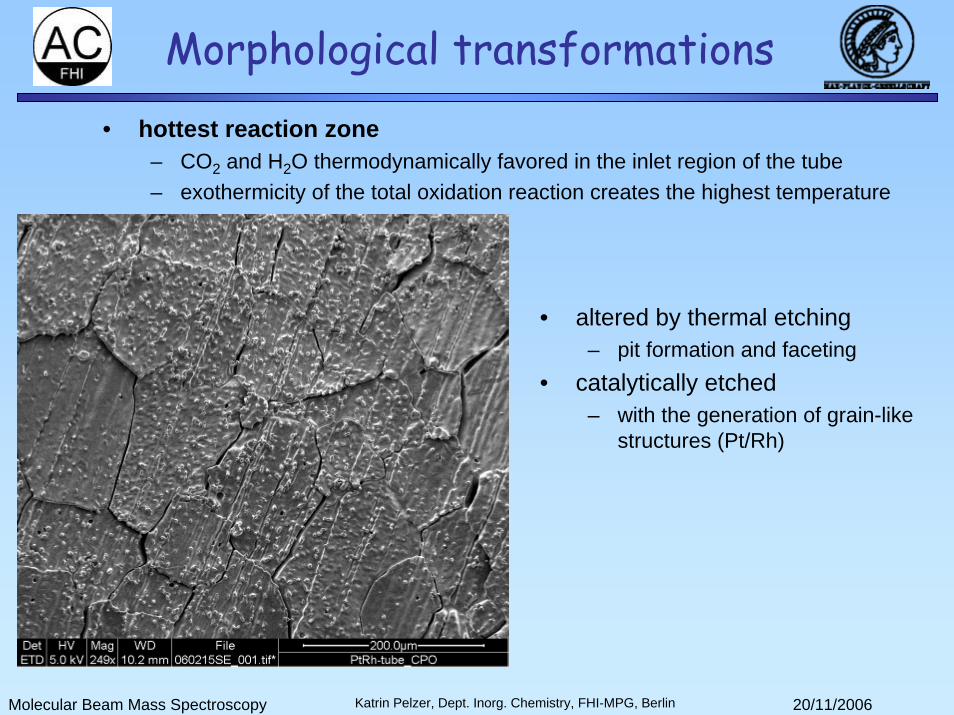
Morphological transformations
• altered by thermal etching– pit formation and faceting
• catalytically etched– with the generation of grain-like
structures (Pt/Rh)
• hottest reaction zone– CO2 and H2O thermodynamically favored in the inlet region of the tube– exothermicity of the total oxidation reaction creates the highest temperature

Molecular Beam Mass Spectroscopy 20/11/2006Katrin Pelzer, Dept. Inorg. Chemistry, FHI-MPG, Berlin
Surface Studies
• SEM image of area 4b – hot outgas zone:- Pt/Rh crystals- Carbon coverage
• Pt and Rh transported via the gas phase
– In colder regions Pt is strongly enriched
– pure Pt particles downstream of the reactor shown by EDX
Carbon formation
Molecular Beam Mass Spectroscopy 20/11/2006Katrin Pelzer, Dept. Inorg. Chemistry, FHI-MPG, Berlin
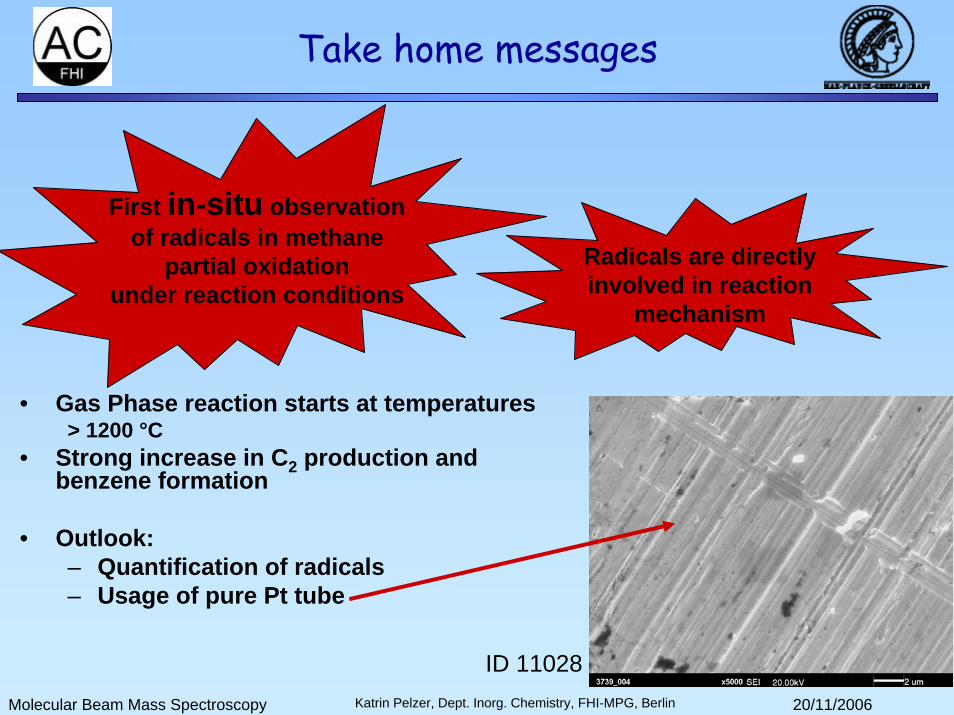
Take home messages
• Gas Phase reaction starts at temperatures> 1200 °C
• Strong increase in C2 production and benzene formation
• Outlook:– Quantification of radicals– Usage of pure Pt tube
First in-situ observation of radicals in methane
partial oxidationunder reaction conditions
ID 11028
Radicals are directly involved in reaction
mechanism
Molecular Beam Mass Spectroscopy 20/11/2006Katrin Pelzer, Dept. Inorg. Chemistry, FHI-MPG, Berlin
Thank you for the attention!!!