Embed Size (px)
Citation preview
In-situ spectroscopic studies of viologen basedelectrochromic device
Suryakant Mishra, Haardik Pandey, Priyanka Yogi, Shailendra K. Saxena, Swaroop Roy, Pankaj R.
Sagdeo and Rajesh Kumar1
Material Research Laboratory, Discipline of Physics & MSEG, Indian Institute of Technology Indore,
Simrol-453552, Madhya Pradesh, India
ABSTRACT
Fabrication and operation of simple solid state electrochromic devices using ethyl viologen diperchlorate in
a polymer matrix is presented here. In-situ Raman and transmission/absorption studies have been done
to establish the origin of bias induced color change, between a transparent and navy blue color, in the
electrochromic device. The origin of bias induced color change has been attributed to the bias induced redox
switching between its viologen dication and free redicle forms. Fundamental reason behind colour changes of
viologen molecule has been established. In-situ UV-Vis spectra reveals that the navy blue color of the device
under biased condition is not due to increase in the transparency corresponding to blue wavelength but due
to suppression of the transparency corresponding to the complementary colors. Absorption modulation has
been reported from the device with good ON/OFF contrast of the device.
Keywords: Raman spectroscopy, UV-Vis spectroscopy, Viologen, Electrochromism
———————–xxxxxxxxxxxxxxxxx———————–
1Corresponding author email: [email protected]
1
arX
iv:1
607.
0449
5v1
[co
nd-m
at.m
es-h
all]
15
Jul 2
016
1 Introduction
An electrochromic device, as name suggests, is a device which changes color as a result of an electrical
bias. This phenomenon of bias induced color change, called electrochromism, was first observed in the
nineteenth century[1]. Electrochromism has been studied in recent times because of many applications in
science and technology.[2-5] Detailed reviews are available in the literature about electrochromic effects from
different chemicals and materials.[2,6] Electrochromic effects are observed as a result of redox processes
either in a solid-state device or in an electrochemical cell. Origin of this property lies in the fact that many
materials show multiple redox states with different optical properties (e.g. absorption spectra). Different
electrochromic materials are used as the active material, which could be in the form of metal oxide like
tungsten oxide[7] or a cationic molecule.[8-10]
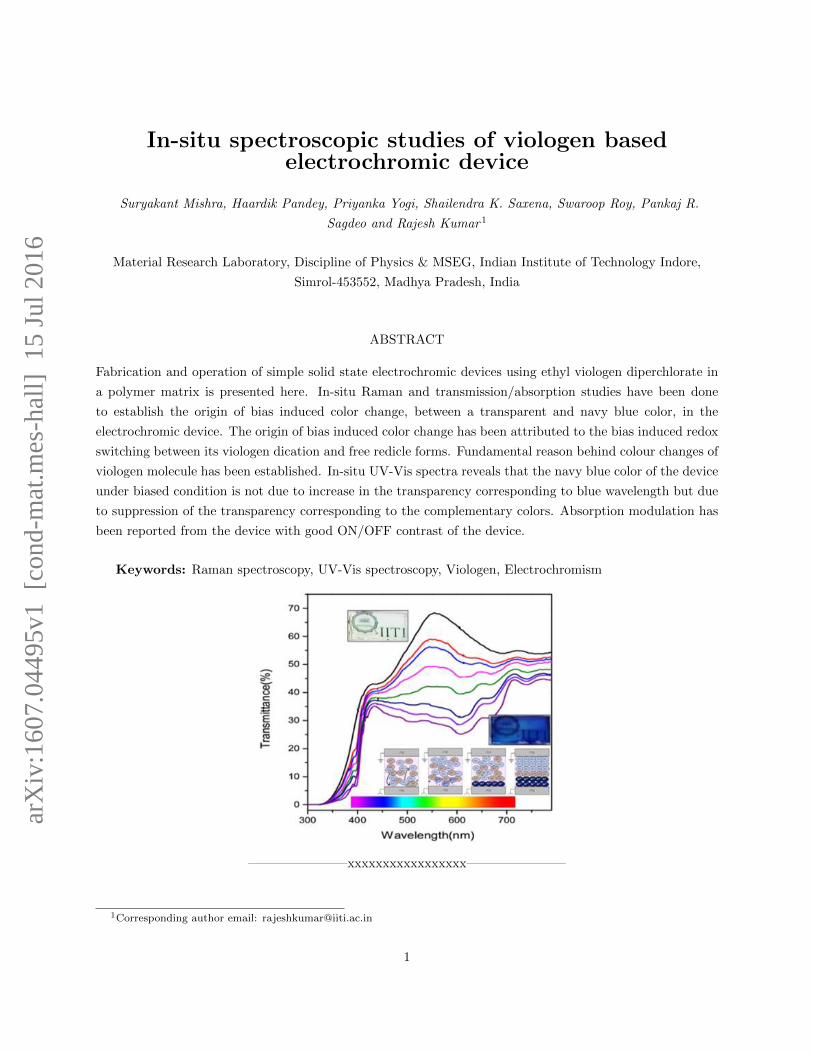
One particularly intriguing class of materials in this context is bipyridinium species, which are formed
upon N,N-diquaternization of 4,4’- bipyridine, also known as viologens. An example of such a violgen
molecule is shown in scheme-1. Viologen is an organic compound for potential use in flexible electrochromic
devices due to its activity in reversible redox reaction and excelent electron accepting nature. In other words,
Viologens[9],[11-14] are reducible materials used in solid-state electrochromic devices, which may undergo
one- or two-electron reductions.[9],[11-14] Ease of processing and use have stimulated intensive research
into the electrochromic properties of viologens. The current research was undertaken to better understand
viologen electrochromism and to simplify the device design for realization of a solid-state electrochromic
device.
Scheme 1: Ethyl Viologen molecule
Controlling the often complex stoichiometry of metal oxides is a complication when fabricating elec-
trochromic devices based on these materials[15,16]. In addition, many metal oxides lack sufficient trans-
parency for use in a wide range of applications. In contrast, viologen based materials are solution processable
and can yield flexible electrochromic devices. In order to achieve an electrochromic response in the solid
state, an ionically conducting matrix is required as well as a redox counter-reaction.
Very recently, lithium perchlorate in polyethylene oxide (PEO) has been used successfully as a solid
electrolyte for organic electronics in general and thin film transistors in particular [10],[17-21]. Ethyl viologen
in PEO matrix can be a good choice for making viologen based eletrochromic devices, at least for testing
purposes. Ethyl viologen diperchlorate (EV (ClO4)2) can be a good candidate because it contains EV2+
which is a good electron acceptor and also contains perchlorate ion which can act as electrolyte. Its solution
in an appropriate solvent is transparent and does not absorb visible light. After accepting an electron it
gets reduced and form radical cation EV +. In the reduced state it shows absorption peak at 396 and
606nm which indicate blue color of the device[22]. The advantage with viologen is that it shows reversible
2
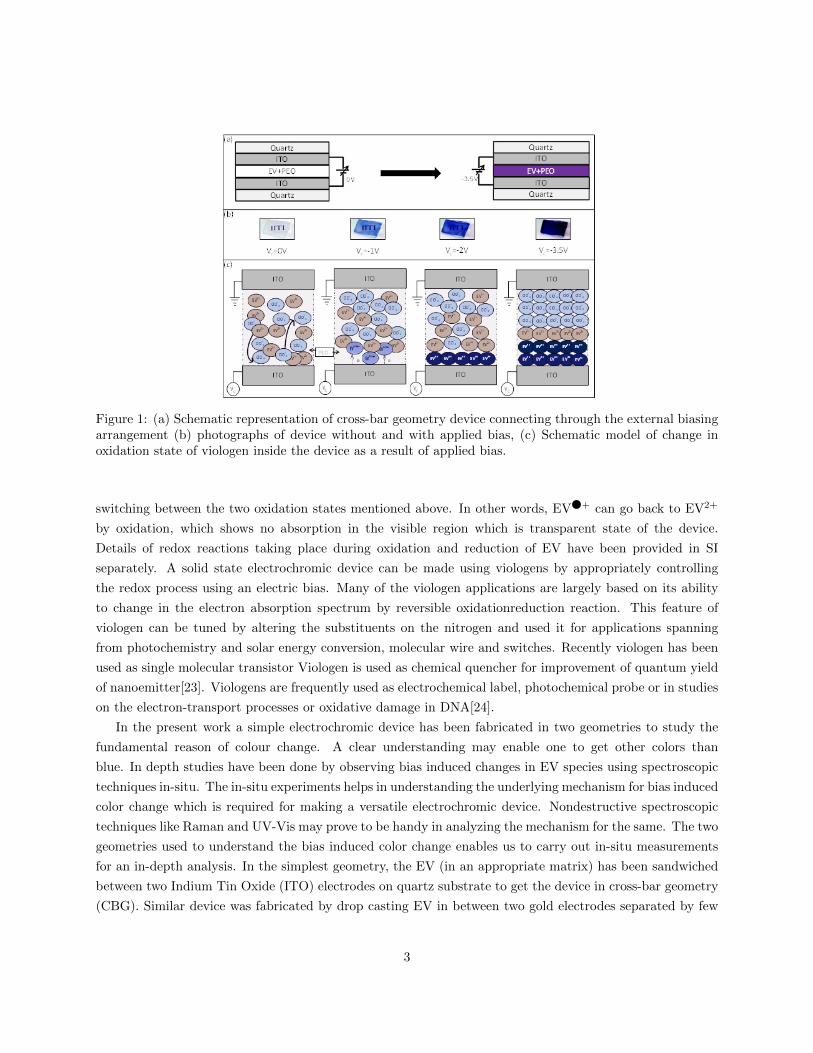
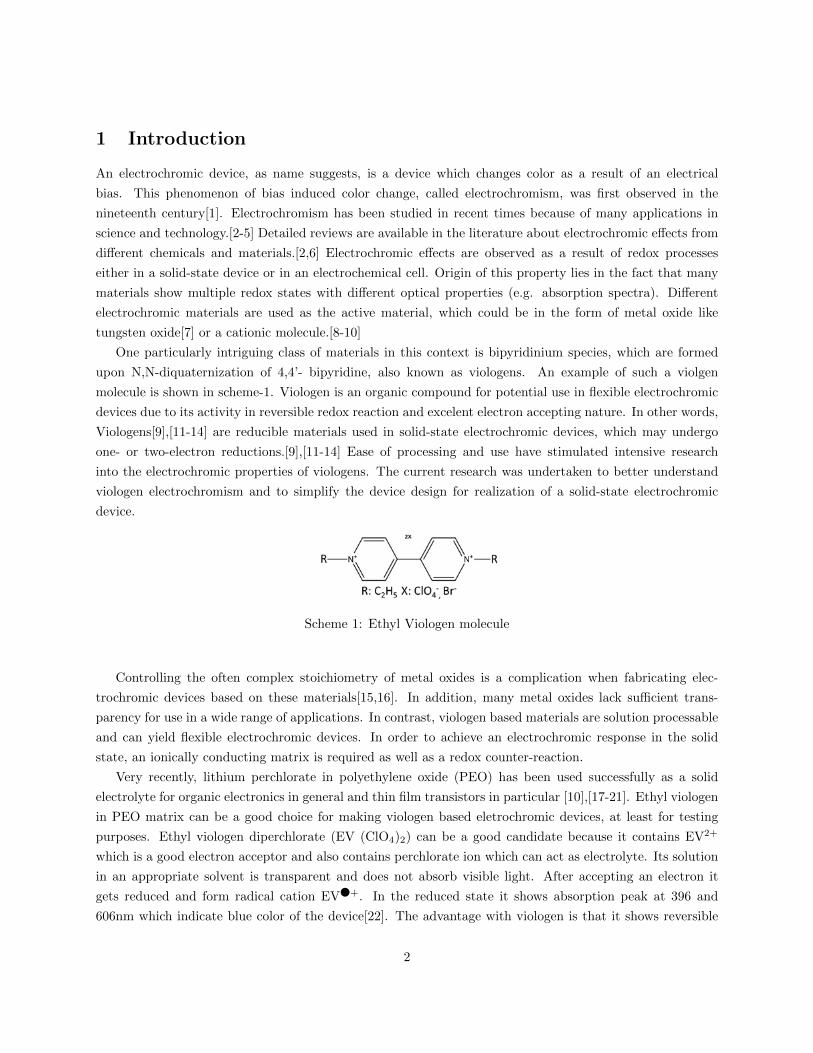
Figure 1: (a) Schematic representation of cross-bar geometry device connecting through the external biasingarrangement (b) photographs of device without and with applied bias, (c) Schematic model of change inoxidation state of viologen inside the device as a result of applied bias.
switching between the two oxidation states mentioned above. In other words, EV + can go back to EV2+
by oxidation, which shows no absorption in the visible region which is transparent state of the device.
Details of redox reactions taking place during oxidation and reduction of EV have been provided in SI
separately. A solid state electrochromic device can be made using viologens by appropriately controlling
the redox process using an electric bias. Many of the viologen applications are largely based on its ability
to change in the electron absorption spectrum by reversible oxidationreduction reaction. This feature of
viologen can be tuned by altering the substituents on the nitrogen and used it for applications spanning
from photochemistry and solar energy conversion, molecular wire and switches. Recently viologen has been
used as single molecular transistor Viologen is used as chemical quencher for improvement of quantum yield
of nanoemitter[23]. Viologens are frequently used as electrochemical label, photochemical probe or in studies
on the electron-transport processes or oxidative damage in DNA[24].
In the present work a simple electrochromic device has been fabricated in two geometries to study the
fundamental reason of colour change. A clear understanding may enable one to get other colors than
blue. In depth studies have been done by observing bias induced changes in EV species using spectroscopic
techniques in-situ. The in-situ experiments helps in understanding the underlying mechanism for bias induced
color change which is required for making a versatile electrochromic device. Nondestructive spectroscopic
techniques like Raman and UV-Vis may prove to be handy in analyzing the mechanism for the same. The two
geometries used to understand the bias induced color change enables us to carry out in-situ measurements
for an in-depth analysis. In the simplest geometry, the EV (in an appropriate matrix) has been sandwiched
between two Indium Tin Oxide (ITO) electrodes on quartz substrate to get the device in cross-bar geometry
(CBG). Similar device was fabricated by drop casting EV in between two gold electrodes separated by few
3
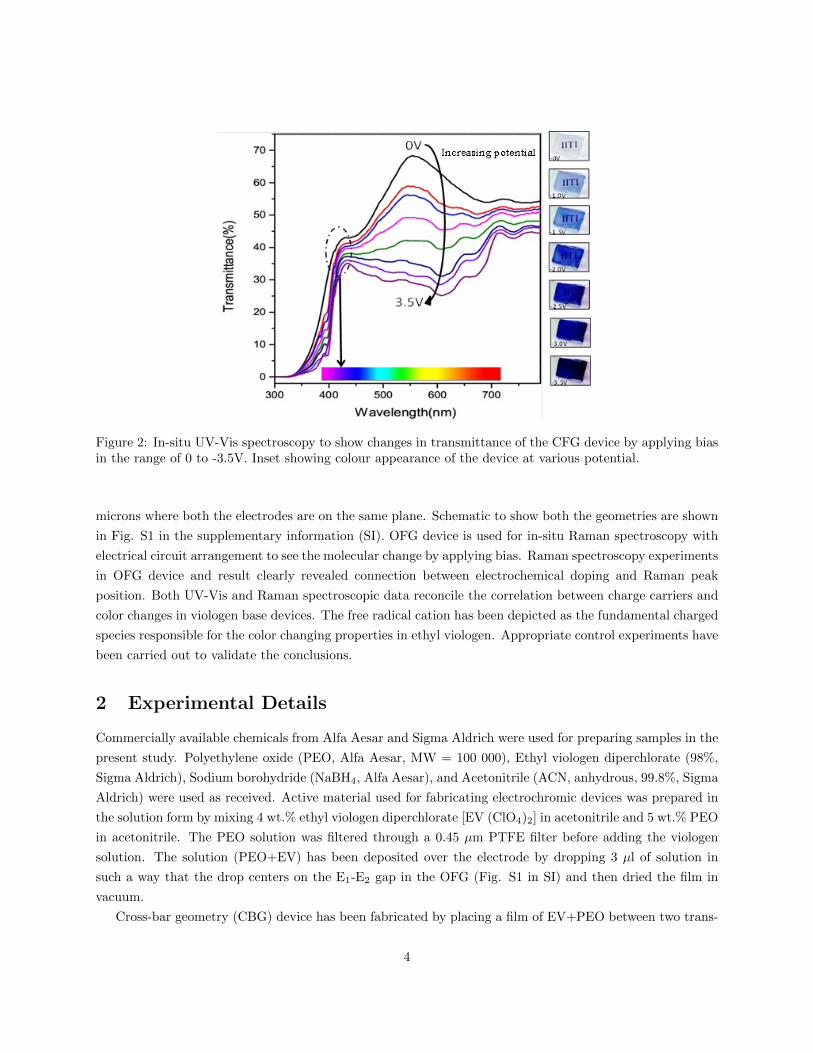
Figure 2: In-situ UV-Vis spectroscopy to show changes in transmittance of the CFG device by applying biasin the range of 0 to -3.5V. Inset showing colour appearance of the device at various potential.
microns where both the electrodes are on the same plane. Schematic to show both the geometries are shown
in Fig. S1 in the supplementary information (SI). OFG device is used for in-situ Raman spectroscopy with
electrical circuit arrangement to see the molecular change by applying bias. Raman spectroscopy experiments
in OFG device and result clearly revealed connection between electrochemical doping and Raman peak
position. Both UV-Vis and Raman spectroscopic data reconcile the correlation between charge carriers and
color changes in viologen base devices. The free radical cation has been depicted as the fundamental charged
species responsible for the color changing properties in ethyl viologen. Appropriate control experiments have
been carried out to validate the conclusions.
2 Experimental Details
Commercially available chemicals from Alfa Aesar and Sigma Aldrich were used for preparing samples in the
present study. Polyethylene oxide (PEO, Alfa Aesar, MW = 100 000), Ethyl viologen diperchlorate (98%,
Sigma Aldrich), Sodium borohydride (NaBH4, Alfa Aesar), and Acetonitrile (ACN, anhydrous, 99.8%, Sigma
Aldrich) were used as received. Active material used for fabricating electrochromic devices was prepared in
the solution form by mixing 4 wt.% ethyl viologen diperchlorate [EV (ClO4)2] in acetonitrile and 5 wt.% PEO
in acetonitrile. The PEO solution was filtered through a 0.45 µm PTFE filter before adding the viologen
solution. The solution (PEO+EV) has been deposited over the electrode by dropping 3 µl of solution in
such a way that the drop centers on the E1-E2 gap in the OFG (Fig. S1 in SI) and then dried the film in
vacuum.
Cross-bar geometry (CBG) device has been fabricated by placing a film of EV+PEO between two trans-
4
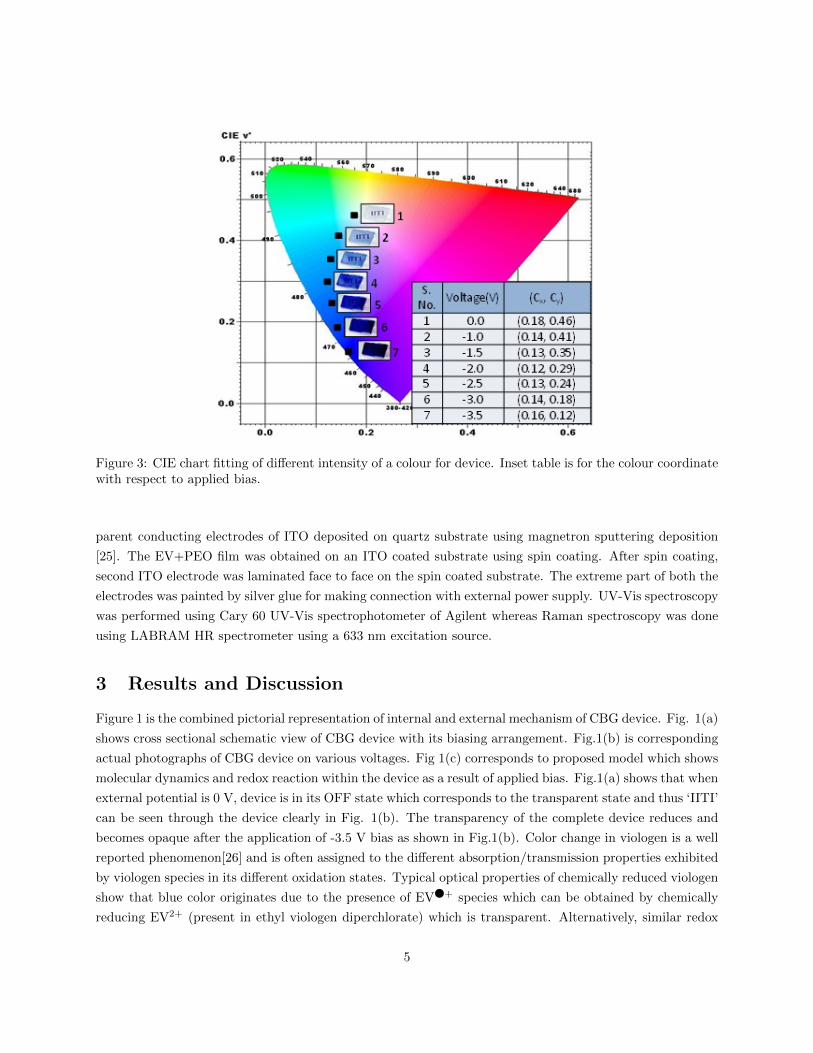
Figure 3: CIE chart fitting of different intensity of a colour for device. Inset table is for the colour coordinatewith respect to applied bias.
parent conducting electrodes of ITO deposited on quartz substrate using magnetron sputtering deposition
[25]. The EV+PEO film was obtained on an ITO coated substrate using spin coating. After spin coating,
second ITO electrode was laminated face to face on the spin coated substrate. The extreme part of both the
electrodes was painted by silver glue for making connection with external power supply. UV-Vis spectroscopy
was performed using Cary 60 UV-Vis spectrophotometer of Agilent whereas Raman spectroscopy was done
using LABRAM HR spectrometer using a 633 nm excitation source.
3 Results and Discussion
Figure 1 is the combined pictorial representation of internal and external mechanism of CBG device. Fig. 1(a)
shows cross sectional schematic view of CBG device with its biasing arrangement. Fig.1(b) is corresponding
actual photographs of CBG device on various voltages. Fig 1(c) corresponds to proposed model which shows
molecular dynamics and redox reaction within the device as a result of applied bias. Fig.1(a) shows that when
external potential is 0 V, device is in its OFF state which corresponds to the transparent state and thus ‘IITI’
can be seen through the device clearly in Fig. 1(b). The transparency of the complete device reduces and
becomes opaque after the application of -3.5 V bias as shown in Fig.1(b). Color change in viologen is a well
reported phenomenon[26] and is often assigned to the different absorption/transmission properties exhibited
by viologen species in its different oxidation states. Typical optical properties of chemically reduced viologen
show that blue color originates due to the presence of EV + species which can be obtained by chemically
reducing EV2+ (present in ethyl viologen diperchlorate) which is transparent. Alternatively, similar redox
5
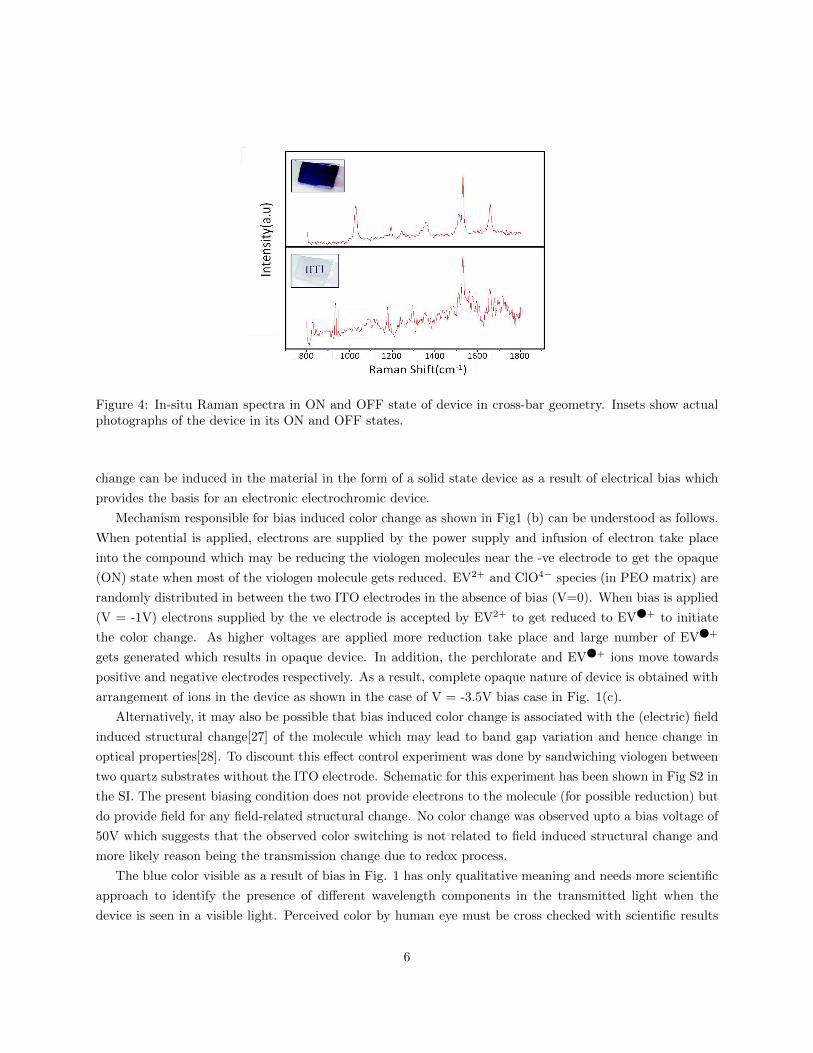
Figure 4: In-situ Raman spectra in ON and OFF state of device in cross-bar geometry. Insets show actualphotographs of the device in its ON and OFF states.
change can be induced in the material in the form of a solid state device as a result of electrical bias which
provides the basis for an electronic electrochromic device.
Mechanism responsible for bias induced color change as shown in Fig1 (b) can be understood as follows.
When potential is applied, electrons are supplied by the power supply and infusion of electron take place
into the compound which may be reducing the viologen molecules near the -ve electrode to get the opaque
(ON) state when most of the viologen molecule gets reduced. EV2+ and ClO4− species (in PEO matrix) are
randomly distributed in between the two ITO electrodes in the absence of bias (V=0). When bias is applied
(V = -1V) electrons supplied by the ve electrode is accepted by EV2+ to get reduced to EV + to initiate
the color change. As higher voltages are applied more reduction take place and large number of EV +
gets generated which results in opaque device. In addition, the perchlorate and EV + ions move towards
positive and negative electrodes respectively. As a result, complete opaque nature of device is obtained with
arrangement of ions in the device as shown in the case of V = -3.5V bias case in Fig. 1(c).
Alternatively, it may also be possible that bias induced color change is associated with the (electric) field
induced structural change[27] of the molecule which may lead to band gap variation and hence change in
optical properties[28]. To discount this effect control experiment was done by sandwiching viologen between
two quartz substrates without the ITO electrode. Schematic for this experiment has been shown in Fig S2 in
the SI. The present biasing condition does not provide electrons to the molecule (for possible reduction) but
do provide field for any field-related structural change. No color change was observed upto a bias voltage of
50V which suggests that the observed color switching is not related to field induced structural change and
more likely reason being the transmission change due to redox process.
The blue color visible as a result of bias in Fig. 1 has only qualitative meaning and needs more scientific
approach to identify the presence of different wavelength components in the transmitted light when the
device is seen in a visible light. Perceived color by human eye must be cross checked with scientific results
6
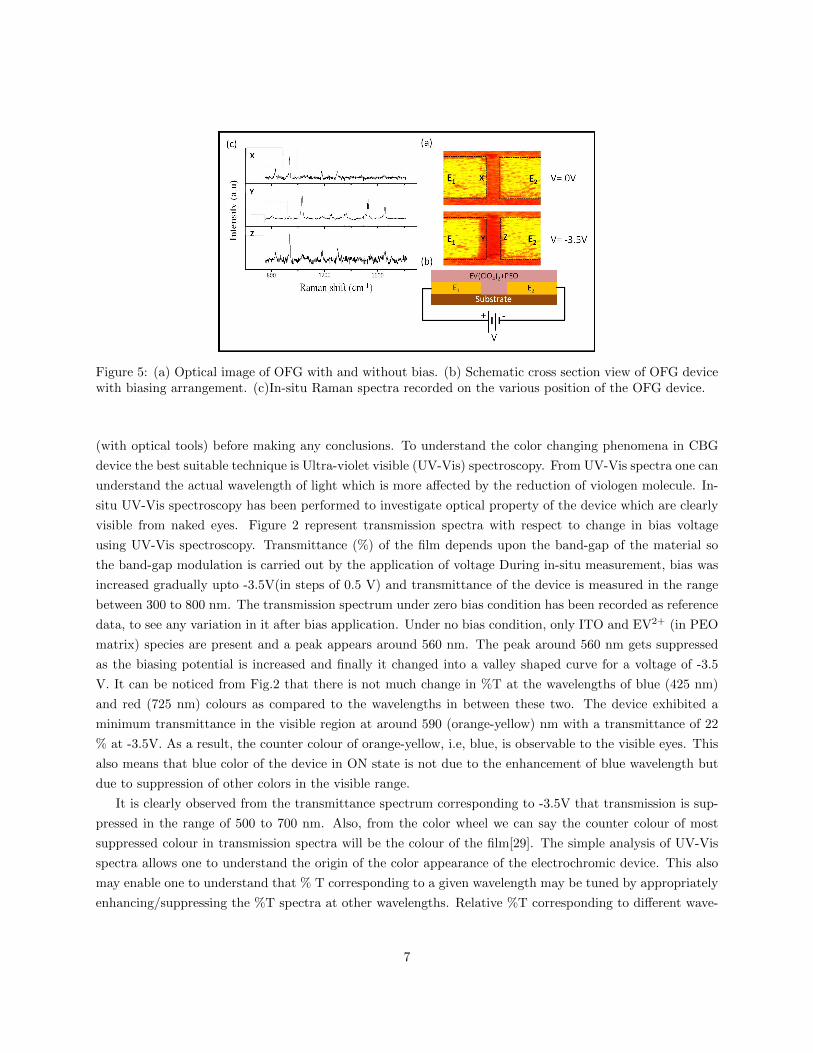
Figure 5: (a) Optical image of OFG with and without bias. (b) Schematic cross section view of OFG devicewith biasing arrangement. (c)In-situ Raman spectra recorded on the various position of the OFG device.
(with optical tools) before making any conclusions. To understand the color changing phenomena in CBG
device the best suitable technique is Ultra-violet visible (UV-Vis) spectroscopy. From UV-Vis spectra one can
understand the actual wavelength of light which is more affected by the reduction of viologen molecule. In-
situ UV-Vis spectroscopy has been performed to investigate optical property of the device which are clearly
visible from naked eyes. Figure 2 represent transmission spectra with respect to change in bias voltage
using UV-Vis spectroscopy. Transmittance (%) of the film depends upon the band-gap of the material so
the band-gap modulation is carried out by the application of voltage During in-situ measurement, bias was
increased gradually upto -3.5V(in steps of 0.5 V) and transmittance of the device is measured in the range
between 300 to 800 nm. The transmission spectrum under zero bias condition has been recorded as reference
data, to see any variation in it after bias application. Under no bias condition, only ITO and EV2+ (in PEO
matrix) species are present and a peak appears around 560 nm. The peak around 560 nm gets suppressed
as the biasing potential is increased and finally it changed into a valley shaped curve for a voltage of -3.5
V. It can be noticed from Fig.2 that there is not much change in %T at the wavelengths of blue (425 nm)
and red (725 nm) colours as compared to the wavelengths in between these two. The device exhibited a
minimum transmittance in the visible region at around 590 (orange-yellow) nm with a transmittance of 22
% at -3.5V. As a result, the counter colour of orange-yellow, i.e, blue, is observable to the visible eyes. This
also means that blue color of the device in ON state is not due to the enhancement of blue wavelength but
due to suppression of other colors in the visible range.
It is clearly observed from the transmittance spectrum corresponding to -3.5V that transmission is sup-
pressed in the range of 500 to 700 nm. Also, from the color wheel we can say the counter colour of most
suppressed colour in transmission spectra will be the colour of the film[29]. The simple analysis of UV-Vis
spectra allows one to understand the origin of the color appearance of the electrochromic device. This also
may enable one to understand that % T corresponding to a given wavelength may be tuned by appropriately
enhancing/suppressing the %T spectra at other wavelengths. Relative %T corresponding to different wave-
7
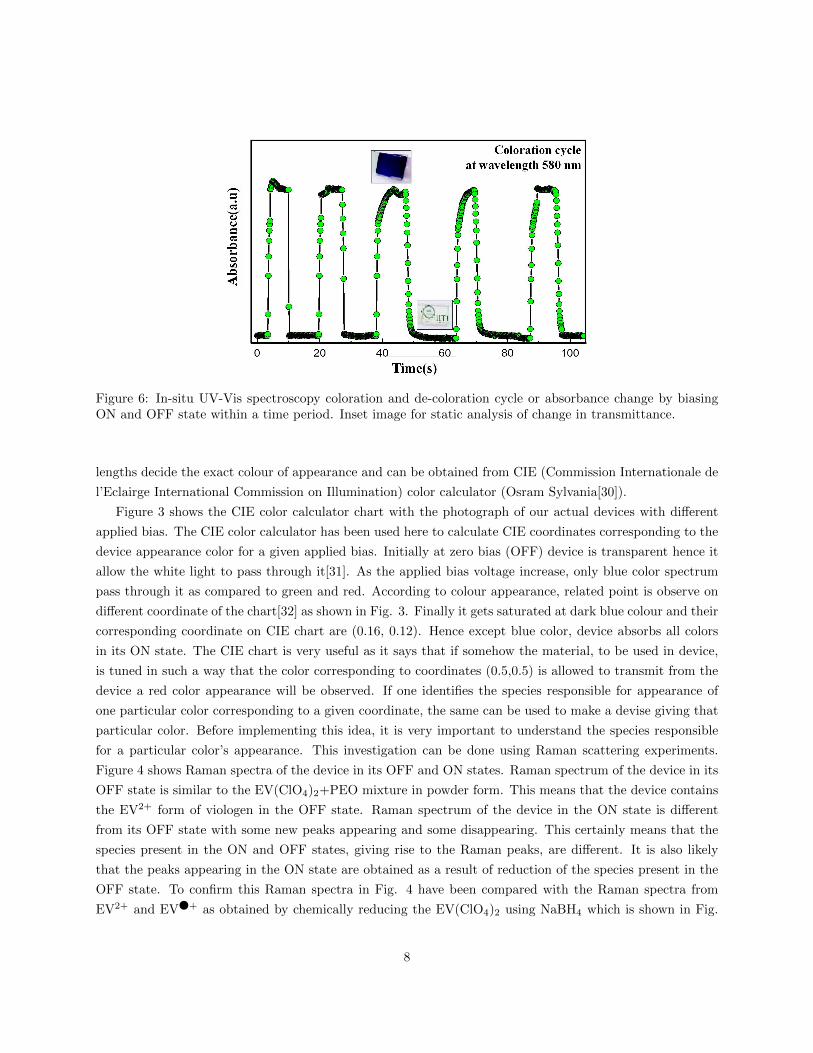
Figure 6: In-situ UV-Vis spectroscopy coloration and de-coloration cycle or absorbance change by biasingON and OFF state within a time period. Inset image for static analysis of change in transmittance.
lengths decide the exact colour of appearance and can be obtained from CIE (Commission Internationale de
l’Eclairge International Commission on Illumination) color calculator (Osram Sylvania[30]).
Figure 3 shows the CIE color calculator chart with the photograph of our actual devices with different
applied bias. The CIE color calculator has been used here to calculate CIE coordinates corresponding to the
device appearance color for a given applied bias. Initially at zero bias (OFF) device is transparent hence it
allow the white light to pass through it[31]. As the applied bias voltage increase, only blue color spectrum
pass through it as compared to green and red. According to colour appearance, related point is observe on
different coordinate of the chart[32] as shown in Fig. 3. Finally it gets saturated at dark blue colour and their
corresponding coordinate on CIE chart are (0.16, 0.12). Hence except blue color, device absorbs all colors
in its ON state. The CIE chart is very useful as it says that if somehow the material, to be used in device,
is tuned in such a way that the color corresponding to coordinates (0.5,0.5) is allowed to transmit from the
device a red color appearance will be observed. If one identifies the species responsible for appearance of
one particular color corresponding to a given coordinate, the same can be used to make a devise giving that
particular color. Before implementing this idea, it is very important to understand the species responsible
for a particular color’s appearance. This investigation can be done using Raman scattering experiments.
Figure 4 shows Raman spectra of the device in its OFF and ON states. Raman spectrum of the device in its
OFF state is similar to the EV(ClO4)2+PEO mixture in powder form. This means that the device contains
the EV2+ form of viologen in the OFF state. Raman spectrum of the device in the ON state is different
from its OFF state with some new peaks appearing and some disappearing. This certainly means that the
species present in the ON and OFF states, giving rise to the Raman peaks, are different. It is also likely
that the peaks appearing in the ON state are obtained as a result of reduction of the species present in the
OFF state. To confirm this Raman spectra in Fig. 4 have been compared with the Raman spectra from
EV2+ and EV + as obtained by chemically reducing the EV(ClO4)2 using NaBH4 which is shown in Fig.
8
S3 in the SI. Comparison of Fig. 4 and Fig. S3 shows that the OFF device contains EV2+ whereas the ON
device contains EV + in majority which means that EV2+ reduces to EV + as a result of applied bias more
likely at the ve electrode. This cannot be confirmed in the CBG because a spatial Raman spectroscopy is
not possible.
To confirm this, in-situ Raman spectroscopy of the device in OFG has been carried out. Device in OFG
was prepared by drop casting the active material (EV+PEO) on a pre-fabricated electrode system where two
gold electrodes are a few microns apart. A drop of prepared sample in the gap completes electrical circuit
and device will start working like electrochemical cell. Top view of the finished device is shown in Fig. 5(a)
without and with bias applied. The polarity scheme of the power supply to give bias is shown in Fig. 5(b),
which shows the cross-sectional schematic of the device. A color change on electrode E1 as a result of ve
bias on this electrode can be seen which is similar to the bias induced colour change in Fig. 2 . This can be
appreciated by comparing point X and Y in Fig. 5(a). Raman spectra has been recorded from points X,Y
and Z (Fig. 5(a)) to compare the effect of bias on the present chemical species in the device. These points
have been chosen for Raman measurements so that a comparison can be done between Raman signal from
a virgin device (point X), negative terminal (point Y, where reduction is possible) and positive terminal
(point Z) under biased condition. Fig. 5(c) shows Raman spectra at different position of OFG device under
different bias condition. Microscopic image in Fig.5(b) of OFG device shows colour change only on the
negative electrode of the device. During the electrochemically reduction, intensity of color between E1-E2
and on E1 electrode changed which attributes reduction of EV2+ molecule.
The corresponding Raman scattering studies have been done on E1 and E2. Alphabets X, Y, Z on the
microscopic images indicate the positions from where the Raman signals were collected. Raman spectrum
in figure 5(c) X was recorded from the E1 terminal of of an unbiased device, which shows major peak at 932
cm2+, the peaks corresponding to EV2+. Raman spectra 5(c)Y and 5(c)Z have been recorded under bias
of -3.5V on E1 and E2 respectively. Some additional peaks appear on the E1 electrode in biased condition,
spectrum 5(c)Y shows two prominent peaks corresponding to reduced viologen which are at 1028 and 1528
cm−1. With biasing potential, peak intensity is increases as the applied potential increases which shows the
formation of more free radical cations (EV + )There is no change in the spectrum recorded on E2 where
+ve terminal of the power supply is connected.
For the comparative study of various peaks positions, Raman spectra of neutral and chemically reduced
form of EV(ClO4)2 has been carried out to verify spectra obtain from electrode E1 and E2 under different bias
conditions (Fig. 5(c)). To identify and verify[33] the changes in EV2+, EV + and EVo concentration Raman
peaks of chemically reduced state of EV were studied. The solid EV(ClO4)2 powder was reduced using an
aqueous solution of sodium borohydride (NaBH4). Raman spectrum from this reduced state of EV(ClO4)2
is shown in Fig S3 in SI and it was observed that the EV powder turns dark-bluish immediately after mixing
with NaBH4 due to reduction of EV. This change of colour is due to variation in absorption spectrum. The
same solution turns back into transparent due to oxidation of EV + to EV2+ as higher oxidation state is the
more stable state in the ambient conditions. Raman spectrum from chemically reduced form of EV(ClO4)2
shows peaks at 1028 and 1528 cm−1 which are signatures of EV + species.(These peaks are marked by stars
in figure S4). It is now safe to conclude that the blue color observed in Fig. 2 as a result of applied bias is
due to the EV + species being generated at the ve terminal as a result of reduction of EV2+. By combining
9
the data in Figs 2, 5 & 3S, one can see that the Raman spectrum from the dark region on the device (E1
electrode in Fig. 5(a)) shows the presence of EV + species whereas the virgin device shows the signature
of stable EV2+. Therefore, the Raman spectra permit the conclusion that the mechanism of bias induced
color change in the electrochromic device is due to formation of free radical cation from viologen dication.
Above discussion confirms the origin of color change in the electrochromic device. It will be interesting
to see how fast and how many times the electrochromic device be turned ON and OFF. Figure 6 shows ON
and OFF cycles in terms of normalized absorbance corresponding to 580 nm which has been studies within a
specific time period[34]. Initially at 580 nm, on zero bias absorbance is in its lowest value, Al which reaches
the highest value Ah by applying potential (-3.5V) making it opaque for this wavelength. Figure 6 shows
that device can be turned ON and OFF five times in ∼100 seconds. It is worth mentioning that it takes
more time in returning to OFF state after removal of the applied bias because the returning to OFF state
is natural and is not under any external perturbation. A 50 % transparency in the second cycle onwards
has been considered as OFF state whereas ON state corresponds to 100 % transparency. Additionally,
contrast between the ON and OFF states can be calculated by defining colour contrast ratio (CCR) using
the following equation[35-37].
CCR(%) =Ti − TfTi
× 100
Here Ti and Tf are the initial and final values of transmittance for the device at wavelengths 580 nm.
The values of Ti and Tf are 80% and 12% giving a 68% variation in transmittance and CCR of nearly
85%. Figure 6 also shows that it takes approximately 1.5 seconds to switch between the ON and OFF states
of the device. An electrochromic device with 85% CCR is a very good device with an ability to switch in
1.5 seconds which can be improved if an external method is used for turning OFF the device of course by
modifying the device composition and geometry appropriately.
4 Conclusions
In-situ spectroscopic studies of viologen based electrochromic devices reveal that bias induced color change
appears due to bias induced change in oxidation state of viologen. The blue color of the device as a result
of negative bias is obtained due to presence of viologen frees redical (EV +). Raman spectra from the
devices under this bias condition confirms the presence of viologen free redical in both the geometries of
device. Raman signature corresponding to the free redical is seen on the electrode connected to the negative
polarity of the power supply (used to bias the device) whereas EV2+ (viologen dication) is present on the
other electrode which was connected to the positive polarity. Species on the positive terminal of the device
is same as the species present in the whole device in its virgin state. Since the cross bar geometry device is
symmetric, it shows color switching between transparent to navy blue aster application of bias irrespective
of the polarity. In-situ UV-Vis spectra reveals that the navy blue color of the device under biased condition
is not due to increase in the transparency corresponding to blue wavelength but due to suppression of the
transparency corresponding to the complementary colors. A 85 % contrast and 68 % variation in color has
been observed in the device
10
Acknowledgements
Authors acknowledge financial support from Department of Science and Technology (DST), Govt. of India.
Authors thank Professor R.L. McCreery (NINT, University of Alberta, Canada) for providing gold electrodes
and Professor A. Subrahmanyam (IIT Madras, India) for providing ITO electrodes. Authors are thankful
to Dr. V. Sathe (UGC-DAE CSR, Indore, India) for Raman measurements. Authors are also thankful to
MHRD, Govt. of India for providing fellowships.
11
References
[1] Electrochromism and Electrochromic Devices - Cambridge University Press
http://www.cambridge.org/catalogue/catalogue.asp?isbn=9780521822695&ss=cop (accessed Jul
13, 2016).
[2] Mortimer, R. J. Electrochromic Materials. Annu. Rev. Mater. Res. 2011, 41, 241268.
[3] Rosseinsky, D. R.; Mortimer, R. J. Electrochromic Systems and the Prospects for Devices. Adv. Mater.
2001, 13, 783793.
[4] Mortimer, R. J. Organic Electrochromic Materials. Electrochimica Acta 1999, 44, 29712981.
[5] Mortimer, R. J. Electrochromic Materials. Chem. Soc. Rev. 1997, 26, 147156.
[6] Oi, T. Electrochromic Materials. Annu. Rev. Mater. Sci. 1986, 16, 185201.
[7] Granqvist, C. G. Oxide Electrochromics: Why, How, and Whither. Sol. Energy Mater. Sol. Cells 2008,
92, 203208.
[8] Schoot, C. J.; Ponjee, J. J.; Dam, H. T. van; Doorn, R. A. van; Bolwijn, P. T. New Electrochromic
Memory Display. Appl. Phys. Lett. 1973, 23, 6465.
[9] Liu, B.; Blaszczyk, A.; Mayor, M.; Wandlowski, T. Redox-Switching in a Viologen-Type Adlayer:
An Electrochemical Shell-Isolated Nanoparticle Enhanced Raman Spectroscopy Study on Au(111)-(11)
Single Crystal Electrodes. ACS Nano 2011, 5, 56625672.
[10] Lu, C.; Fu, Q.; Huang, S.; Liu, J. Polymer Electrolyte-Gated Carbon Nanotube Field-Effect Transistor.
Nano Lett. 2004, 4, 623627.
[11] Mohammad, M. Methyl Viologen Neutral MV. 1. Preparation and Some Properties. J. Org. Chem.
1987, 52, 27792782.
[12] Lu, T.; Birke, R. L.; Lombardi, J. R. Surface Raman Spectroscopy of the Three Redox Forms of
Methylviologen. Langmuir 1986, 2, 305309.
[13] Michaelis, L.; Hill, E. S. THE VIOLOGEN INDICATORS. J. Gen. Physiol. 1933, 16, 859873.
[14] Han, B.; Li, Z.; Wandlowski, T.; Baszczyk, A.; Mayor, M. Potential-Induced Redox Switching in Violo-
gen Self-Assembled Monolayers: An ATRSEIRAS Approach. J. Phys. Chem. C 2007, 111, 1385513863.
[15] Yang, J. J.; Pickett, M. D.; Li, X.; Ohlberg, D. A. A.; Stewart, D. R.; Williams, R. S. Memristive
Switching Mechanism for Metal/oxide/metal Nanodevices. Nat. Nanotechnol. 2008, 3, 429433.
[16] Yao, J.; Sun, Z.; Zhong, L.; Natelson, D.; Tour, J. M. Resistive Switches and Memories from Silicon
Oxide. Nano Lett. 2010, 10, 41054110.
12
[17] Panzer, M. J.; Frisbie, C. D. Polymer Electrolyte-Gated Organic Field-Effect Transistors: Low-Voltage,
High-Current Switches for Organic Electronics and Testbeds for Probing Electrical Transport at High
Charge Carrier Density. J. Am. Chem. Soc. 2007, 129, 65996607.
[18] Panzer, M. J.; Frisbie, C. D. Polymer Electrolyte Gate Dielectric Reveals Finite Windows of High
Conductivity in Organic Thin Film Transistors at High Charge Carrier Densities. J. Am. Chem. Soc.
2005, 127, 69606961.
[19] Das, A.; Pisana, S.; Chakraborty, B.; Piscanec, S.; Saha, S. K.; Waghmare, U. V.; Novoselov, K. S.;
Krishnamurthy, H. R.; Geim, A. K.; Ferrari, A. C.; et al. Monitoring Dopants by Raman Scattering in
an Electrochemically Top-Gated Graphene Transistor. Nat. Nanotechnol. 2008, 3, 210215.
[20] Lee, J.; Kaake, L. G.; Cho, J. H.; Zhu, X.-Y.; Lodge, T. P.; Frisbie, C. D. Ion Gel-Gated Polymer
Thin-Film Transistors: Operating Mechanism and Characterization of Gate Dielectric Capacitance,
Switching Speed, and Stability. J. Phys. Chem. C 2009, 113, 89728981.
[21] Yuen, J. D.; Dhoot, A. S.; Namdas, E. B.; Coates, N. E.; Heeney, M.; McCulloch, I.; Moses, D.; Heeger,
A. J. Electrochemical Doping in Electrolyte-Gated Polymer Transistors. J. Am. Chem. Soc. 2007, 129,
1436714371.
[22] Pozo-Gonzalo, C.; Salsamendi, M.; Viuales, A.; Pomposo, J. A.; Grande, H.-J. Highly Transparent
Electrochromic Plastic Device That Changes to Purple and to Blue by Increasing the Potential. Sol.
Energy Mater. Sol. Cells 2009, 93, 20932097.
[23] Punj, D.; Regmi, R.; Devilez, A.; Plauchu, R.; Moparthi, S. B.; Stout, B.; Bonod, N.; Rigneault,
H.; Wenger, J. Self-Assembled Nanoparticle Dimer Antennas for Plasmonic-Enhanced Single-Molecule
Fluorescence Detection at Micromolar Concentrations. ACS Photonics 2015, 2, 10991107.
[24] Hariharan, M.; Joseph, J.; Ramaiah, D. Novel Bifunctional Viologen-Linked Pyrene Conjugates: Synthe-
sis and Study of Their Interactions with Nucleosides and DNA. J. Phys. Chem. B 2006, 110, 2467824686.
[25] Kurdesau, F.; Khripunov, G.; da Cunha, A. F.; Kaelin, M.; Tiwari, A. N. Comparative Study of ITO
Layers Deposited by DC and RF Magnetron Sputtering at Room Temperature. J. Non-Cryst. Solids
2006, 352, 14661470.
[26] Dam, H. T. van; Ponje, J. J. Electrochemically Generated Colored Films of Insoluble Viologen Radical
Compounds. J. Electrochem. Soc. 1974, 121, 15551558.
[27] Franzbach, D. J.; Gu, Y. J.; Chen, L. Q.; Webber, K. G. Electric Field-Induced Tetragonal to Or-
thorhombic Phase Transitions in [110]c-Oriented BaTiO3 Single Crystals. Appl. Phys. Lett. 2012, 101,
232904.
[28] Misra, R.; Jadhav, T.; Dhokale, B.; Mobin, S. M. Reversible Mechanochromism and Enhanced AIE in
Tetraphenylethene Substituted Phenanthroimidazoles. Chem. Commun. 2014, 50, 90769078.
13
[29] Amb, C. M.; Dyer, A. L.; Reynolds, J. R. Navigating the Color Palette of Solution-Processable Elec-
trochromic Polymers. Chem. Mater. 2011, 23, 397415.
[30] LED ColorCalculator https://www.sylvania.com/en-us/tools-and-resources/Pages/led-color-
calculator.aspx (accessed Mar 15, 2016).
[31] Singh, V.; Mishra, A. K. White Light Emission from Vegetable Extracts. Sci. Rep. 2015, 5, 11118.
[32] Quintanilla, M.; Ren, F.; Ma, D.; Vetrone, F. Light Management in Upconverting Nanoparticles: Ul-
trasmall Core/Shell Architectures to Tune the Emission Color. ACS Photonics 2014, 1, 662669.
[33] Liu, B.; Blaszczyk, A.; Mayor, M.; Wandlowski, T. Redox-Switching in a Viologen-Type Adlayer:
An Electrochemical Shell-Isolated Nanoparticle Enhanced Raman Spectroscopy Study on Au(111)-(11)
Single Crystal Electrodes. ACS Nano 2011, 5, 56625672.
[34] Jennings, J. R.; Lim, W. Y.; Zakeeruddin, S. M.; Grtzel, M.; Wang, Q. A Redox-Flow Electrochromic
Window. ACS Appl. Mater. Interfaces 2015, 7, 28272832.
[35] Hsiao, S.-H.; Liou, G.-S.; Kung, Y.-C.; Yen, H.-J. High Contrast Ratio and Rapid Switching
Electrochromic Polymeric Films Based on 4-(Dimethylamino)triphenylamine-Functionalized Aromatic
Polyamides. Macromolecules 2008, 41, 28002808.
[36] Sapp, S. A.; Sotzing, G. A.; Reynolds, J. R. High Contrast Ratio and Fast-Switching Dual Polymer
Electrochromic Devices. Chem. Mater. 1998, 10, 21012108.
[37] Chen, B.-H.; Kao, S.-Y.; Hu, C.-W.; Higuchi, M.; Ho, K.-C.; Liao, Y.-C. Printed Multicolor High-
Contrast Electrochromic Devices. ACS Appl. Mater. Interfaces 2015, 7, 2506925076.
.
14