Embed Size (px)
Citation preview
Annual report on
Baltic Marine Environment Protection Commission
Discharges observed during aerial surveillance
in the Baltic Sea 2014
Phot
o: L
aura
Mes
ki/H
ELC
OM
Published by: HELCOM – Baltic Marine Environment Protection Commission Katajanokanlaituri 6 B FI-00160 Helsinki Finland www.helcom.fi For bibliographic purposes this document should be cited as: HELCOM (2015), HELCOM Annual report on discharges observed during aerial surveillance in the Baltic Sea, 2014 Editor: Laura Meski, HELCOM Secretariat
1
Introduction
Co-operation on aerial surveillance within the Baltic Sea area was established already during the 1980s within the framework of the Helsinki Commission (HELCOM). Through the Helsinki Convention (Article 14, Annex VII Regulation 7) the Contracting Parties (the nine Baltic countries and the European Commission) have agreed to develop and apply individually or in co-operation, surveillance activities covering the Baltic Sea area in order to spot and monitor oil and other substances released into the sea.
The Contracting Parties have also committed themselves to undertake appropriate measures to conduct the surveillance by using, inter alia, airborne surveillance equipped with remote sensing systems. In addition to the provisions of the Helsinki Convention, the HELCOM Recommendation 34E/4 recommends the Contracting Parties to take actions to cover the whole of the Baltic Sea area with regular and efficient airborne surveillance, develop and improve the existing remote sensing systems and to co-ordinate surveillance activities which take place outside territorial waters.
The purpose of regional aerial surveillance is to detect spills of oil and other harmful substances and thus prevent violations of the existing regulations on prevention of pollution from ships. Such spills are a form of pollution which threatens the marine environment of the Baltic Sea area. If possible, an identity of a polluter should be established and the spill should be sampled from both the sea surface and on board the suspected offender to enable prosecution.
In order to follow-up these commitments, and to provide an overview of the situation in the region, the HELCOM Secretariat compiles annually data on discharges observed in the Baltic Sea area during national and joint co-ordinated aerial surveillance activities.
This report presents data from 1988 up to 2014. Data has been reported by the HELCOM Contracting Parties and quality assured by the HELCOM Secretariat. Please note that the report only covers aerial surveillance conducted with fixed-wing aircraft and thus does not comprise flight hours or detections made from i.e. helicopters or ships. This might cause a difference to reports based on such information. The focus of the report is on detected spills of mineral oil. However, for the first time in 2014, the Contracting Parties also reported spills of other detected substances as included in the report.
Aerial surveillance activity
In total, 3935 flight hours with fixed-wing aircraft were carried out in 2014 within aerial surveillance activities of the Baltic Sea countries (Table 1). This is a decrease of 9 % compared to the previous year (4317 in 2013) owing to participation in missions abroad, an increased number of other missions than environmental surveillance as well as budget cuts. Compared to the average number of flight hours 2000-2013 the decrease is 20%.
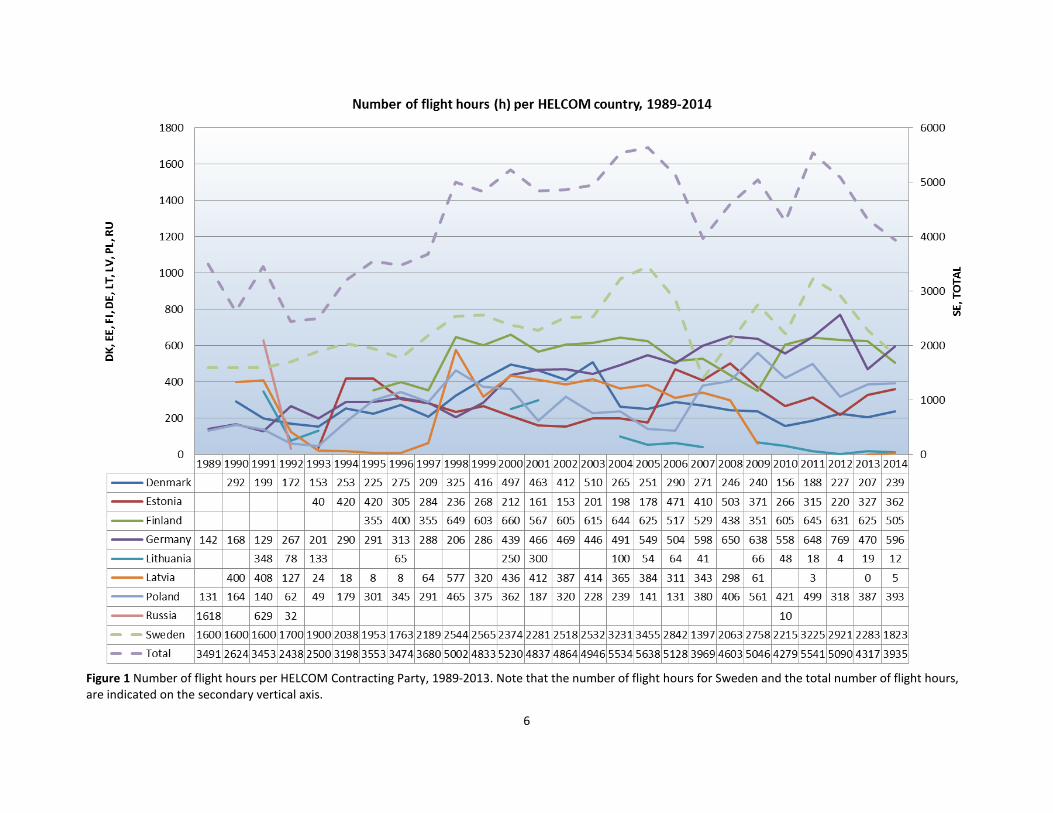
All Baltic Sea countries reported aerial surveillance related data except for Russia. The number of flight hours increased in most countries compared to 2013 but a significant decrease was seen in the flight hours in Finland and Sweden, which are two of the countries that are conducting most aerial surveillance in the Baltic Sea. Also Lithuania flew a few hours less than in 2014. The number of flight hours by individual HELCOM countries, in 1989-2014, is shown in Figure 1. Please note that the number of flight hours for Sweden and the total number of flight hours, are indicated on the secondary vertical axis in Figure 1. No regular aerial surveillance has been conducted in Russian waters since the beginning of 1990s and thus the number of spills in these areas are unknown. This also concerns Latvian waters where only sporadic surveillance has been conducted in the last five years.
Certain flight proportions should be ensured for detections in darkness, when deliberate discharges are more likely to occur, which means that the aircraft should be properly equipped to detect oil at night or during poor visibility. In 2014, five countries carried out flights at night (Figure 2), which constituted 15 % of
2
all flight hours (15 % in 2013). Most of these countries only conducted a minor share of their aerial surveillance night time while the number for Germany was 75% in 2014.
In addition to aerial surveillance the Contracting Parties utilize satellite images to detect illegal discharges of oil. Satellite surveillance in the Baltic Sea area has been intensified since 2007 thanks to the CleanSeaNet (CSN) satellite surveillance service, provided to the HELCOM countries by European Maritime Safety Agency (EMSA). The satellite images are delivered in near real time to provide first indication of possible oil slicks to be checked by aircraft on spot.
Altogether, EMSA provided 509 satellite scenes for the users of CleanSeaNet in the Baltic Sea in 2014 (565 in 2013), indicating 179 possible detections (130 in 2013). In the HELCOM area, 63 % of the spill indications were checked within three hours of the alert. Out of these 15 % were confirmed to be mineral oil (7 % in 2013). Satellite surveillance detections provided by EMSA in 2014, including confirmed mineral oil detections, is presented in Table 2.
Detected spills of mineral oil and other substances
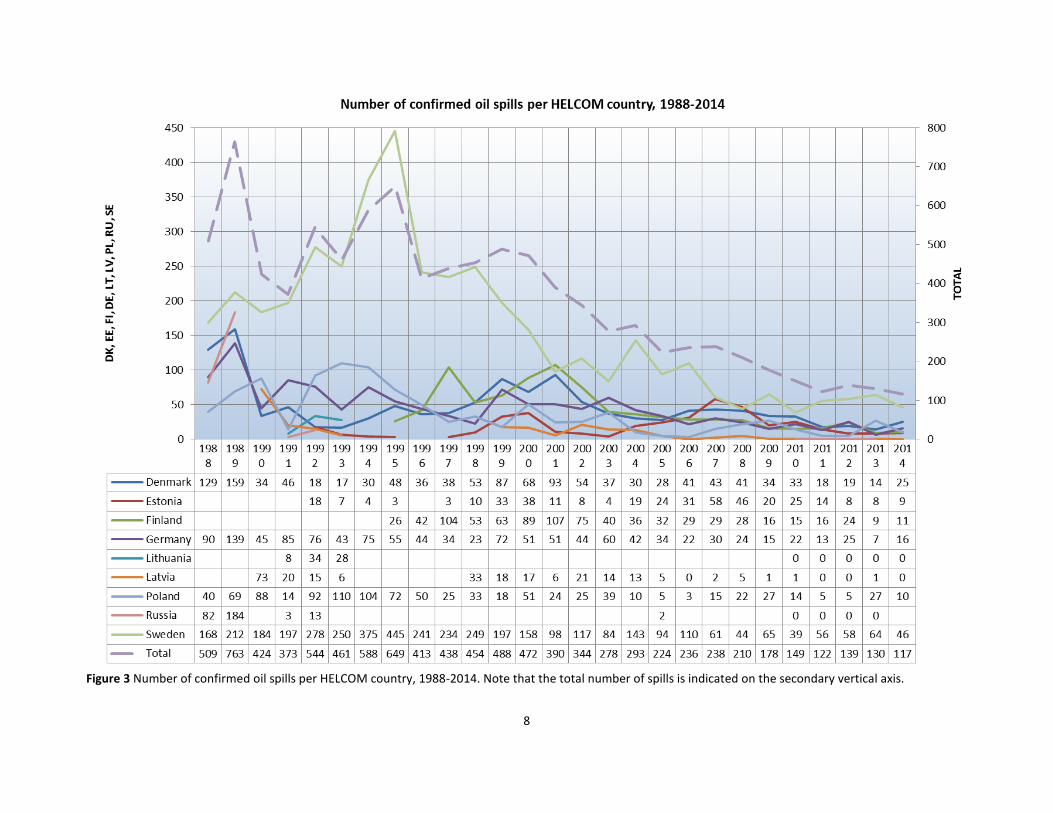
In general, the number of detected oil spills in the Baltic Sea has been constantly decreasing (Figure 3), even though the density of shipping has grown and the aerial surveillance activity in the countries has been substantially improved, e.g. the high number of flight hours has been maintained and remote sensing equipment on board aircrafts, like Side Looking Airborne Radar (SLAR), has been more widely used. This is a result of intensive aerial surveillance in the Baltic Sea which indicates to the ships that they are constantly being watched. The aerial surveillance is complemented by satellite surveillance to enable bigger area coverage and optimisation of flights effectiveness.
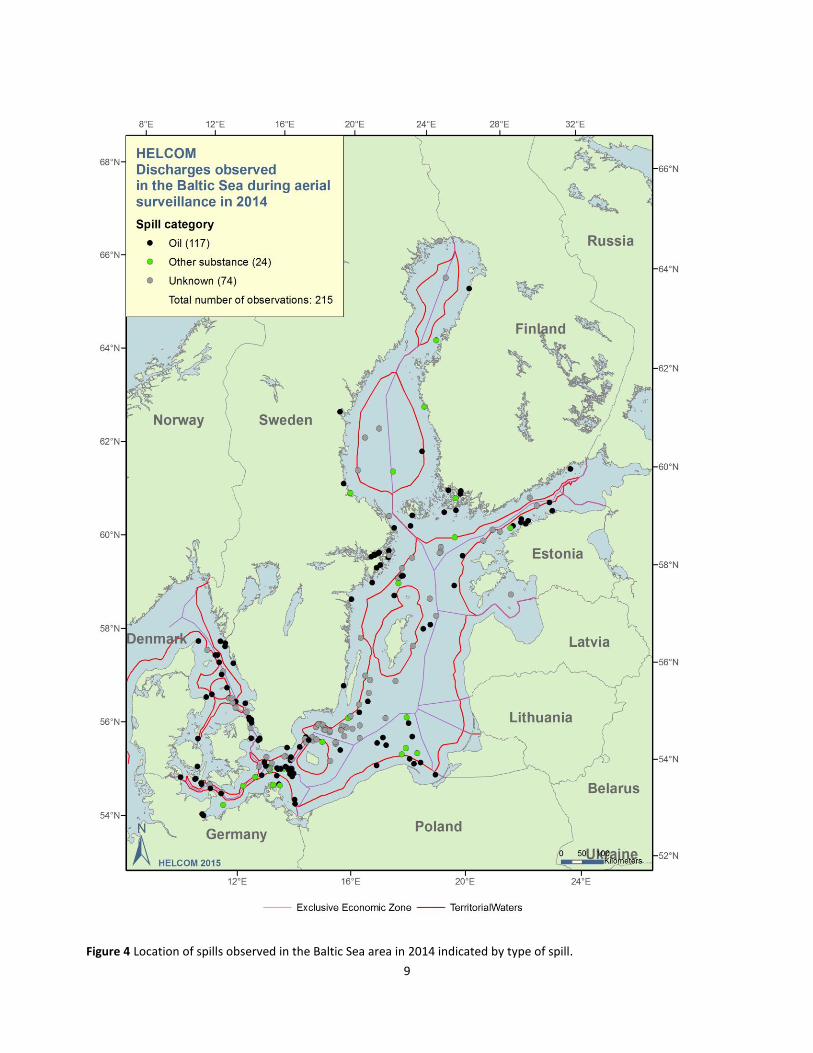
Altogether the HELCOM countries reported 215 spill observations in 2014 as presented in Figure 4 and Table 1. Most of the detected spills were confirmed as discharges of mineral oil, in total 117 spills. Yet, 46% of the spill observations were identified as other substances or unknown observations, which could not be visually verified as mineral oil or other substances. Methodology for identifying hazardous substances in aerial surveillance is not yet in place. These substances might cause a threat to the marine environment and would be important to be able to identify.
The number of mineral oil spills in 2014 (117) was the lowest ever recorded in the Baltic Sea pointing towards a continuous decreasing trend in oil spills. Compared to year 2013 the decrease was 9% but it should be noted that 18 oil spills last year were reported from the wreck m/s Georg Buchner, which sank on 30 May 2013 in Polish waters. Only one spill was recorded from the wreck in 2014. The number of oil spills observed during aerial surveillance activity in individual countries in 1988-2013 is presented in Figure 3. Please note that the total number of oil spills is indicated on the secondary vertical axis in Figure 3.
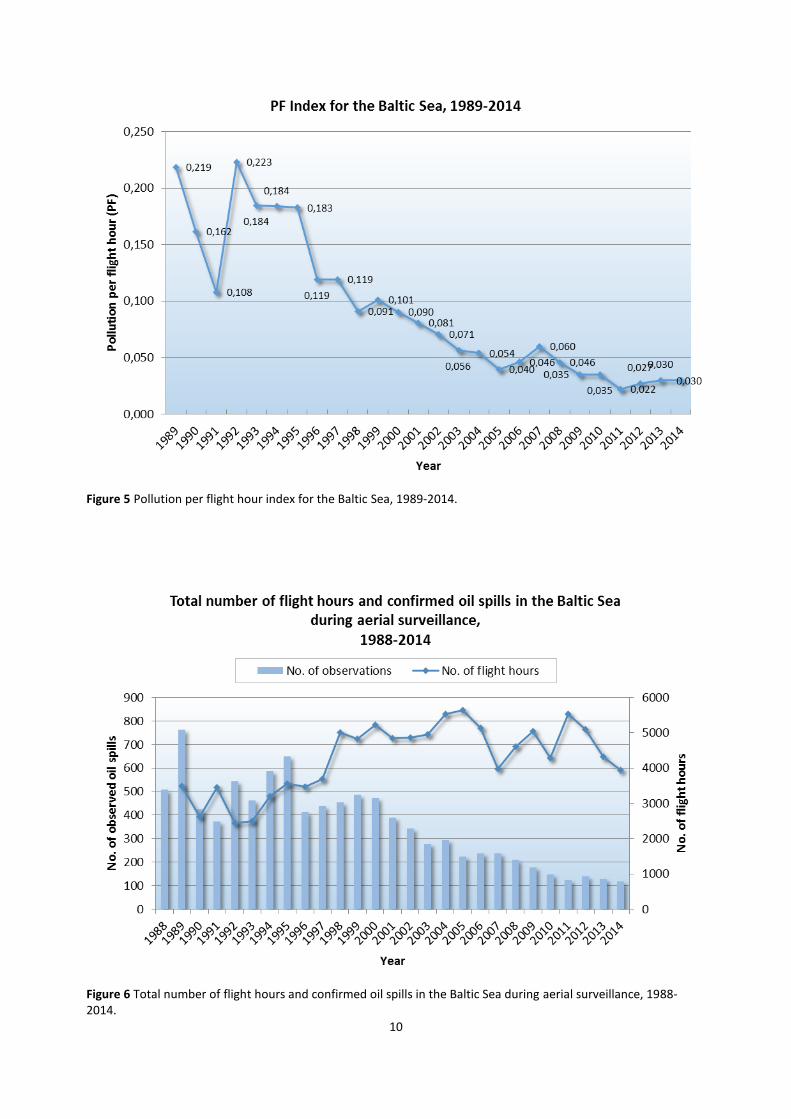
A good way to evaluate the number of illegal oil discharges is to reflect it as Pollution per Flight Hour (PF) Index, which compares the total number of observed oil spills to the total number of flight hours. Decreasing PF Index over the years indicates less oil spills or/and increased surveillance activity. In 2014 the PF index stayed on the same level as in 2013 (0.030) due to both the decrease in flight hours and oil spills (Figure 5). Figure 6 shows the total number of flight hours and observed oil spills during aerial surveillance in 1988-2014.
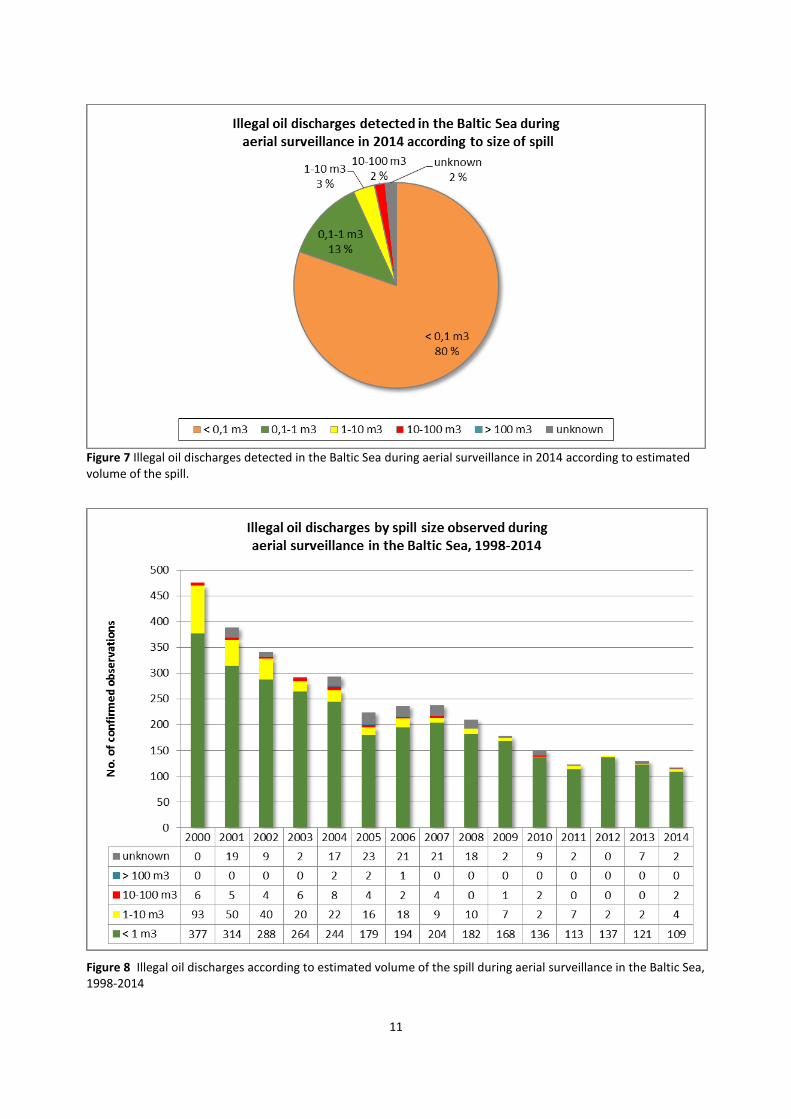
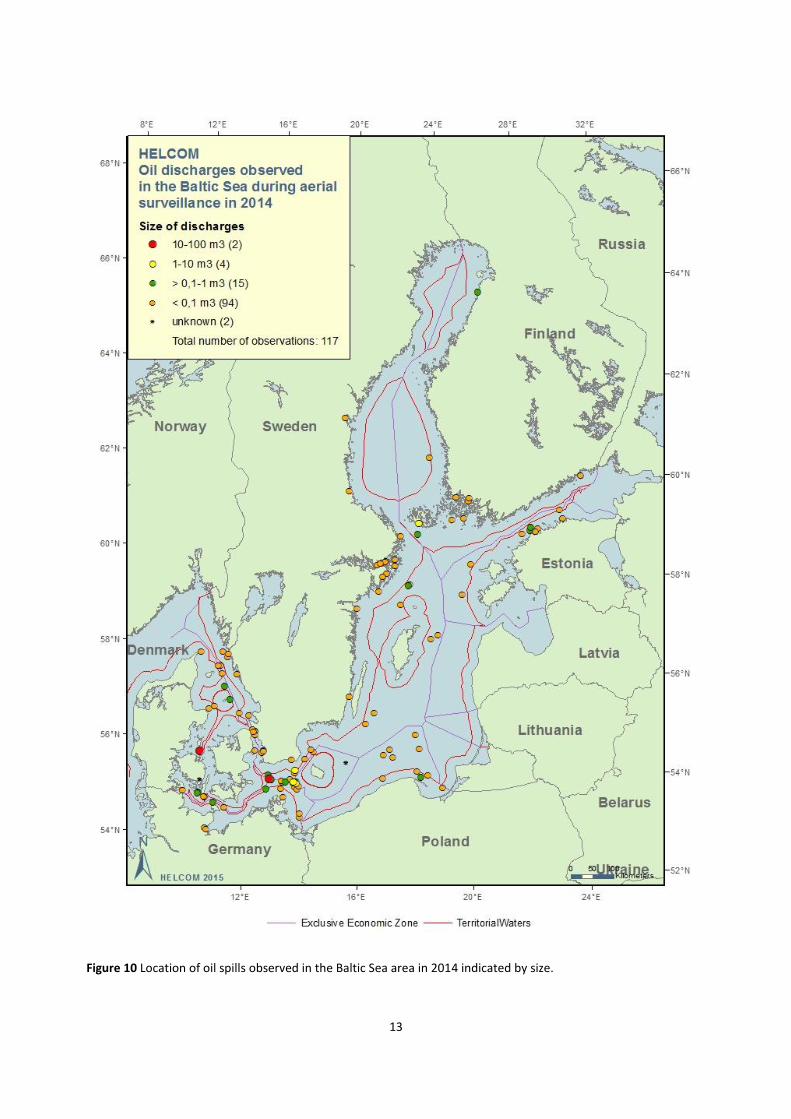
Of the total 117 mineral oil discharges detected in 2014, 109 (93 %) were smaller than 1 m3, and of these oil spills as many as 94 were even smaller than 0.1 m3 (100 litres). The share of each size category of oil spills is presented in Figure 7 and further divided by country waters in Table 3. The largest oil spills in 2014 were estimated to be 11 m3 and 16 m3 respectively. The total estimated minimum volume of oil spills observed in 2014 amounted to 42 m3. The estimated volume of the oil spill has steadily been decreasing and during the last years a significant decrease has been recorded. In 2013 the estimated volume of the oil spills was 11 m3, which was the lowest recorded. The increase in 2014 was mainly due to two spills over 10m3. The trend
3
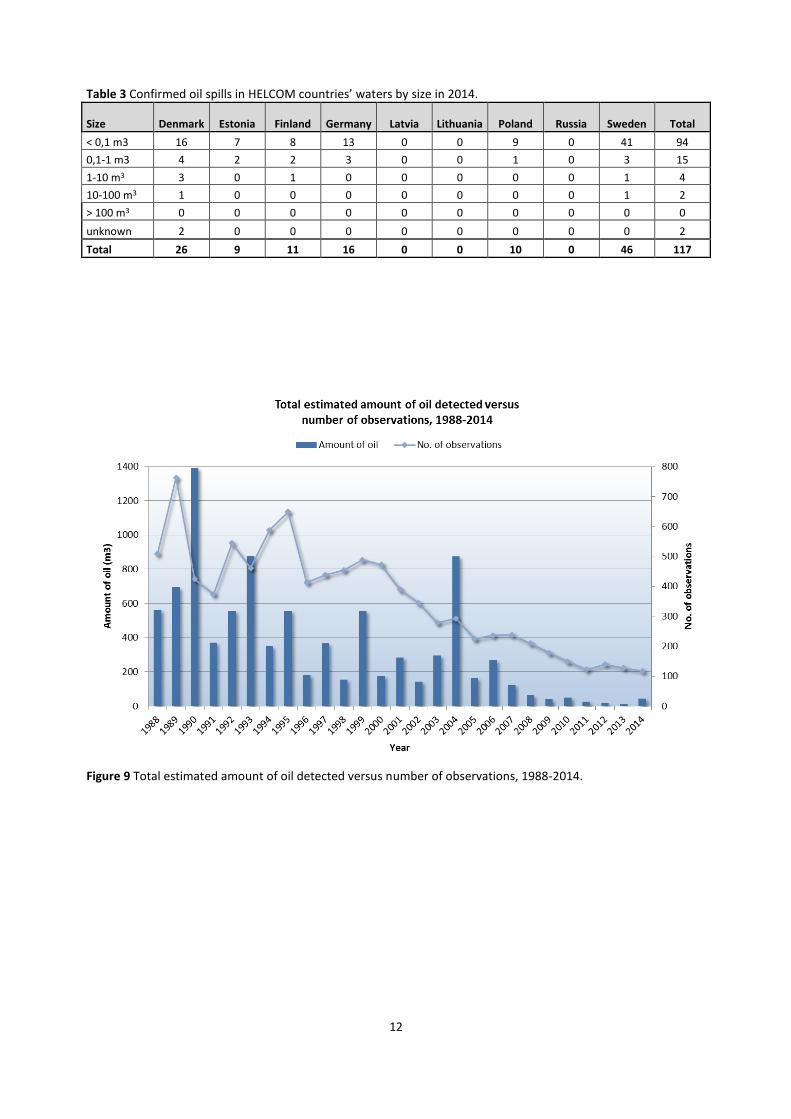
of the spill sizes for the years 1998-2014 is presented in Figure 8. Figure 9 further illustrates the trend in total amount of oil detected and the number of spills observed in 1988-2015. A map illustrating the location of the detected spills in 2014 by size is depicted in Figure 10.
In a vast majority of cases of detected discharges polluters remain unknown, which was also the case in 2014 (Table 1). The identification of ships suspected of illegally discharging oil into the sea is facilitated by the SeatrackWeb (STW) oil drift forecasting system developed within HELCOM. This tool, in combination with the HELCOM Automatic Identification System (AIS), is used for backtracking and forecasting simulation of detected oil spills, and matching the ship tracks with oil spill backtracking trajectory. STW/AIS has also been integrated with satellite information to increase the likelihood that polluters will be identified.
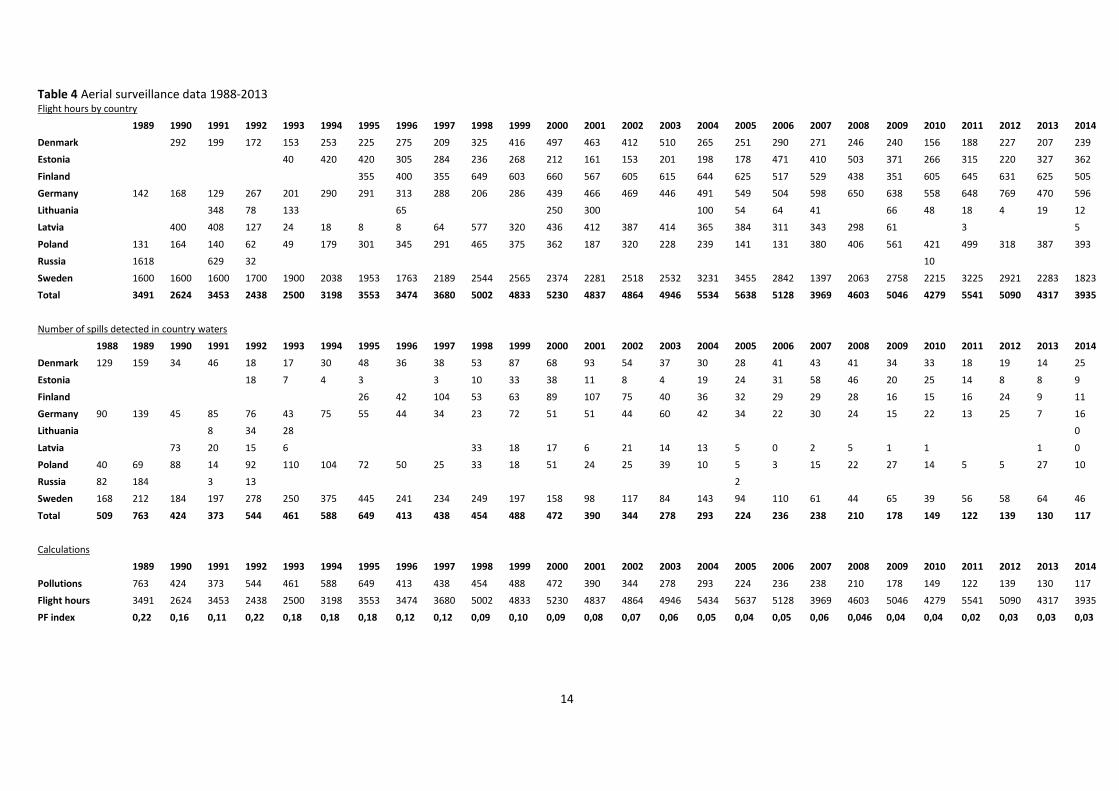
Aerial surveillance data for the years 1988-2014, including the number of flight hours per country, confirmed oil spills in country waters as well as data on the PF Index is contained in Table 4.
Data on the individual observed oil spills can be viewed and downloaded in the HELCOM map and data service (http://maps.helcom.fi/website/mapservice/index.html).
4
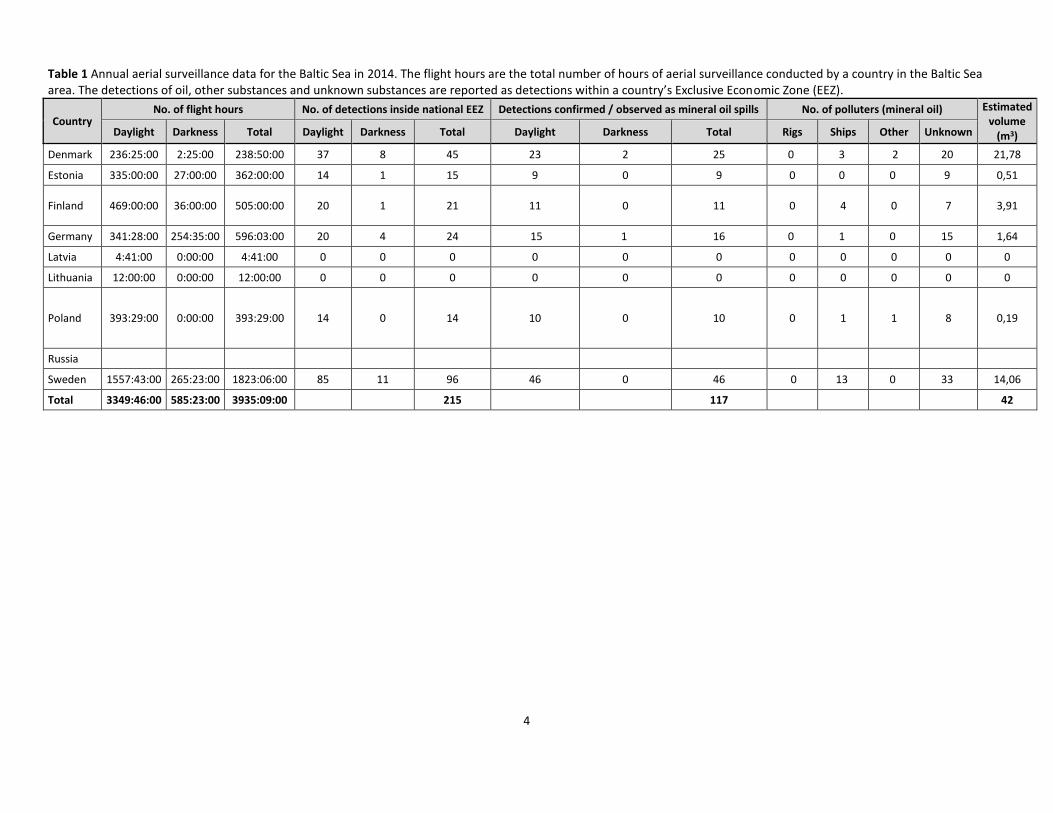
Table 1 Annual aerial surveillance data for the Baltic Sea in 2014. The flight hours are the total number of hours of aerial surveillance conducted by a country in the Baltic Sea area. The detections of oil, other substances and unknown substances are reported as detections within a country’s Exclusive Economic Zone (EEZ).
Country No. of flight hours No. of detections inside national EEZ Detections confirmed / observed as mineral oil spills No. of polluters (mineral oil) Estimated
volume (m3) Daylight Darkness Total Daylight Darkness Total Daylight Darkness Total Rigs Ships Other Unknown
Denmark 236:25:00 2:25:00 238:50:00 37 8 45 23 2 25 0 3 2 20 21,78
Estonia 335:00:00 27:00:00 362:00:00 14 1 15 9 0 9 0 0 0 9 0,51
Finland 469:00:00 36:00:00 505:00:00 20 1 21 11 0 11 0 4 0 7 3,91
Germany 341:28:00 254:35:00 596:03:00 20 4 24 15 1 16 0 1 0 15 1,64
Latvia 4:41:00 0:00:00 4:41:00 0 0 0 0 0 0 0 0 0 0 0
Lithuania 12:00:00 0:00:00 12:00:00 0 0 0 0 0 0 0 0 0 0 0
Poland 393:29:00 0:00:00 393:29:00 14 0 14 10 0 10 0 1 1 8 0,19
Russia
Sweden 1557:43:00 265:23:00 1823:06:00 85 11 96 46 0 46 0 13 0 33 14,06
Total 3349:46:00 585:23:00 3935:09:00 215 117 42
5
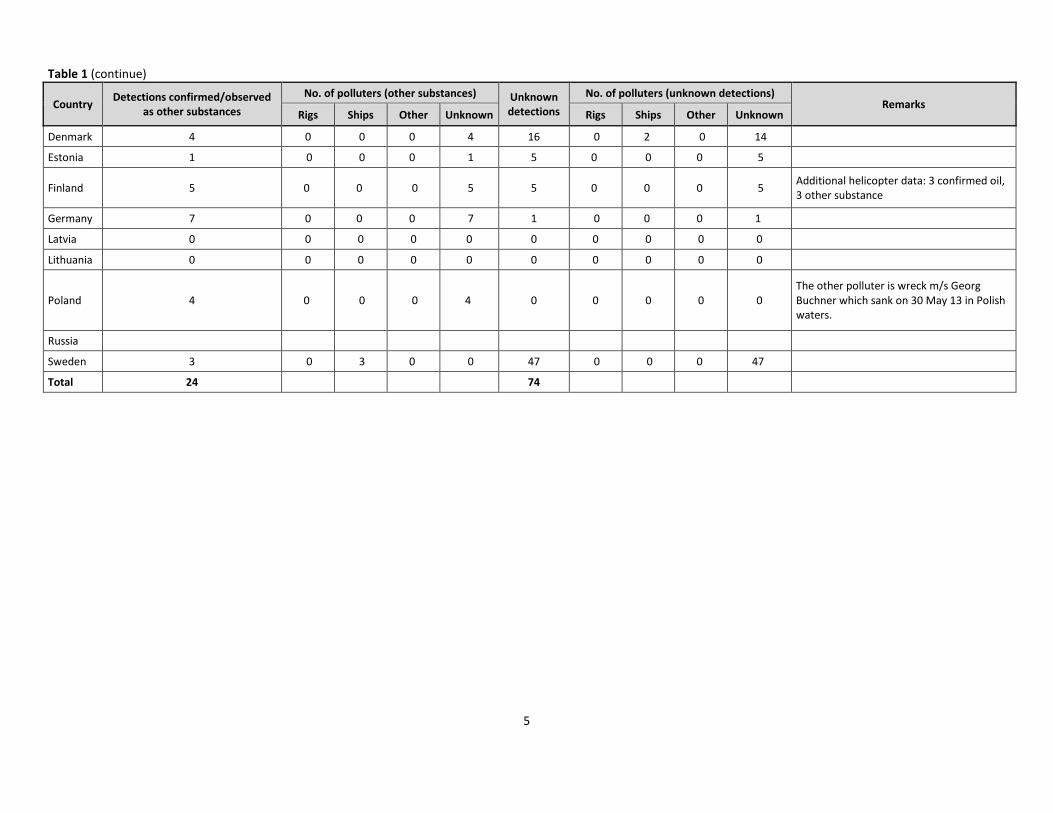
Table 1 (continue)
Country Detections confirmed/observed
as other substances
No. of polluters (other substances) Unknown detections
No. of polluters (unknown detections) Remarks
Rigs Ships Other Unknown Rigs Ships Other Unknown
Denmark 4 0 0 0 4 16 0 2 0 14
Estonia 1 0 0 0 1 5 0 0 0 5
Finland 5 0 0 0 5 5 0 0 0 5 Additional helicopter data: 3 confirmed oil, 3 other substance
Germany 7 0 0 0 7 1 0 0 0 1
Latvia 0 0 0 0 0 0 0 0 0 0
Lithuania 0 0 0 0 0 0 0 0 0 0
Poland 4 0 0 0 4 0 0 0 0 0 The other polluter is wreck m/s Georg Buchner which sank on 30 May 13 in Polish waters.
Russia
Sweden 3 0 3 0 0 47 0 0 0 47
Total 24 74
6
Figure 1 Number of flight hours per HELCOM Contracting Party, 1989-2013. Note that the number of flight hours for Sweden and the total number of flight hours, are indicated on the secondary vertical axis.

7
Figure 2 Number of flight hours per country in 2014.
Table 2 Satellite detections of spills in HELCOM countries waters provided by EMSA CleanSeaNet (CSN) in 2014, including verified detections.
Country waters
Satellite detections
Verified satellite detections by country
Not checked
or no feedback
(within 3h) Confirmed mineral oil
Confirmed other oil, chemical, sewage or garbage
Confirmed natural
phenomena Unknown substance Nothing found
Denmark 33 1 1 3 0 5 23
Estonia 6 0 0 4 0 0 2
Finland 8 0 0 0 0 2 6
Germany 18 7 1 2 2 4 2
Latvia 2 0 0 0 0 1 1
Lithuania 0 0 0 0 0 0 0
Poland 31 1 4 5 0 8 13
Russia 19 0 0 0 0 0 19
Sweden 62 1 3 3 3 6 46
Total 179 10 9 17 5 26 112
Disclaimer:
1) Feedback relates with the location of the spill and not with the country providing feedback (i.e. if Finland provides feedback for a spill in Estonian waters this is reported as verification in Estonian waters).
2) Information provided is based on feedback provided by the coastal States.
8
Figure 3 Number of confirmed oil spills per HELCOM country, 1988-2014. Note that the total number of spills is indicated on the secondary vertical axis.
9
Figure 4 Location of spills observed in the Baltic Sea area in 2014 indicated by type of spill.
10
Figure 5 Pollution per flight hour index for the Baltic Sea, 1989-2014.
Figure 6 Total number of flight hours and confirmed oil spills in the Baltic Sea during aerial surveillance, 1988-2014.
11
Figure 7 Illegal oil discharges detected in the Baltic Sea during aerial surveillance in 2014 according to estimated volume of the spill.
Figure 8 Illegal oil discharges according to estimated volume of the spill during aerial surveillance in the Baltic Sea, 1998-2014
12
Table 3 Confirmed oil spills in HELCOM countries’ waters by size in 2014.
Size Denmark Estonia Finland Germany Latvia Lithuania Poland Russia Sweden Total
< 0,1 m3 16 7 8 13 0 0 9 0 41 94
0,1-1 m3 4 2 2 3 0 0 1 0 3 15
1-10 m3 3 0 1 0 0 0 0 0 1 4
10-100 m3 1 0 0 0 0 0 0 0 1 2
> 100 m3 0 0 0 0 0 0 0 0 0 0
unknown 2 0 0 0 0 0 0 0 0 2
Total 26 9 11 16 0 0 10 0 46 117
Figure 9 Total estimated amount of oil detected versus number of observations, 1988-2014.
13
Figure 10 Location of oil spills observed in the Baltic Sea area in 2014 indicated by size.
14
Table 4 Aerial surveillance data 1988-2013 Flight hours by country
1989 1990 1991 1992 1993 1994 1995 1996 1997 1998 1999 2000 2001 2002 2003 2004 2005 2006 2007 2008 2009 2010 2011 2012 2013 2014
Denmark 292 199 172 153 253 225 275 209 325 416 497 463 412 510 265 251 290 271 246 240 156 188 227 207 239
Estonia 40 420 420 305 284 236 268 212 161 153 201 198 178 471 410 503 371 266 315 220 327 362
Finland 355 400 355 649 603 660 567 605 615 644 625 517 529 438 351 605 645 631 625 505
Germany 142 168 129 267 201 290 291 313 288 206 286 439 466 469 446 491 549 504 598 650 638 558 648 769 470 596
Lithuania 348 78 133 65 250 300 100 54 64 41 66 48 18 4 19 12
Latvia 400 408 127 24 18 8 8 64 577 320 436 412 387 414 365 384 311 343 298 61 3 5
Poland 131 164 140 62 49 179 301 345 291 465 375 362 187 320 228 239 141 131 380 406 561 421 499 318 387 393
Russia 1618 629 32 10
Sweden 1600 1600 1600 1700 1900 2038 1953 1763 2189 2544 2565 2374 2281 2518 2532 3231 3455 2842 1397 2063 2758 2215 3225 2921 2283 1823
Total 3491 2624 3453 2438 2500 3198 3553 3474 3680 5002 4833 5230 4837 4864 4946 5534 5638 5128 3969 4603 5046 4279 5541 5090 4317 3935
Number of spills detected in country waters
1988 1989 1990 1991 1992 1993 1994 1995 1996 1997 1998 1999 2000 2001 2002 2003 2004 2005 2006 2007 2008 2009 2010 2011 2012 2013 2014
Denmark 129 159 34 46 18 17 30 48 36 38 53 87 68 93 54 37 30 28 41 43 41 34 33 18 19 14 25
Estonia 18 7 4 3 3 10 33 38 11 8 4 19 24 31 58 46 20 25 14 8 8 9
Finland 26 42 104 53 63 89 107 75 40 36 32 29 29 28 16 15 16 24 9 11
Germany 90 139 45 85 76 43 75 55 44 34 23 72 51 51 44 60 42 34 22 30 24 15 22 13 25 7 16
Lithuania 8 34 28 0
Latvia 73 20 15 6 33 18 17 6 21 14 13 5 0 2 5 1 1 1 0
Poland 40 69 88 14 92 110 104 72 50 25 33 18 51 24 25 39 10 5 3 15 22 27 14 5 5 27 10
Russia 82 184 3 13 2
Sweden 168 212 184 197 278 250 375 445 241 234 249 197 158 98 117 84 143 94 110 61 44 65 39 56 58 64 46
Total 509 763 424 373 544 461 588 649 413 438 454 488 472 390 344 278 293 224 236 238 210 178 149 122 139 130 117
Calculations
1989 1990 1991 1992 1993 1994 1995 1996 1997 1998 1999 2000 2001 2002 2003 2004 2005 2006 2007 2008 2009 2010 2011 2012 2013 2014
Pollutions 763 424 373 544 461 588 649 413 438 454 488 472 390 344 278 293 224 236 238 210 178 149 122 139 130 117
Flight hours 3491 2624 3453 2438 2500 3198 3553 3474 3680 5002 4833 5230 4837 4864 4946 5434 5637 5128 3969 4603 5046 4279 5541 5090 4317 3935
PF index 0,22 0,16 0,11 0,22 0,18 0,18 0,18 0,12 0,12 0,09 0,10 0,09 0,08 0,07 0,06 0,05 0,04 0,05 0,06 0,046 0,04 0,04 0,02 0,03 0,03 0,03

www.helcom.fi