Embed Size (px)
Citation preview
© The Author(s) 2020. Published by Oxford University Press for the Infectious Diseases Society of America. This is an Open Access article distributed under the terms of the Creative Commons Attribution License (http://creativecommons.org/licenses/by/4.0/), which permits unrestricted reuse, distribution, and reproduction in any medium, provided the original work is properly cited.
In Vitro Antiviral Activity and Projection of Optimized Dosing Design of
Hydroxychloroquine for the Treatment of Severe Acute Respiratory Syndrome
Coronavirus 2 (SARS-CoV-2)
Xueting Yao1,#, Fei Ye2,#, Miao Zhang1,#, Cheng Cui1,#, Baoying Huang2,#, Peihua Niu2, Xu
Liu1, Li Zhao2, Erdan Dong3, Chunli Song4, Siyan Zhan5, Roujian Lu2, Haiyan Li1,3,*, Wenjie
Tan2,*, Dongyang Liu1,*
1 Drug Clinical Trial Center, Peking University Third Hospital, Beijing, 100191, China.
2 MHC Key Laboratory of Biosafety, National Institute for Viral Disease Control and
Prevention, China CDC, Beijing 102206, China.
3 Department of Cardiology and Institute of Vascular Medicine, Peking University Third
Hospital, Beijing, 100191, China.
4 Department of Orthopedics, Peking University Third Hospital, Beijing, 100191, China.
5 Research Center of Clinical Epidemiology, Peking University Third Hospital, Beijing,
100191, China.
#Xueting Yao, Fei Ye, Miao Zhang, Cheng Cui and Baoyin Huang contributed equally
*Dongyang Liu, Wenjie Tan and Haiyan Li contributed equally
Corresponding author: Dongyang Liu, Drug Clinical Trial Center, Peking University Third
Dow
nloaded from https://academ
ic.oup.com/cid/advance-article-abstract/doi/10.1093/cid/ciaa237/5801998 by U
niversity of Colorado H
ealth Sciences Center user on 13 M
arch 2020
2 / 25
Hospital, Beijing, China. ([email protected])
Main point: Hydroxychloroquine was found to be more potent than chloroquine at
inhibiting SARS-CoV-2 in vitro. Hydroxychloroquine sulfate 400 mg given twice
daily for 1 day, followed by 200 mg twice daily for 4 more days is recommended to
treat SARS-CoV-2 infection.
Dow
nloaded from https://academ
ic.oup.com/cid/advance-article-abstract/doi/10.1093/cid/ciaa237/5801998 by U
niversity of Colorado H
ealth Sciences Center user on 13 M
arch 2020

3 / 25
Abstract
Background. The Severe Acute Respiratory Syndrome Coronavirus 2 (SARS-CoV-2)
first broke out in Wuhan (China) and subsequently spread worldwide. Chloroquine
has been sporadically used in treating SARS-CoV-2 infection. Hydroxychloroquine
shares the same mechanism of action as chloroquine, but its more tolerable safety
profile makes it the preferred drug to treat malaria and autoimmune conditions. We
propose that the immunomodulatory effect of hydroxychloroquine also may be useful
in controlling the cytokine storm that occurs late-phase in critically ill SARS-CoV-2
infected patients. Currently, there is no evidence to support the use of
hydroxychloroquine in SARS-CoV-2 infection.
Methods. The pharmacological activity of chloroquine and hydroxychloroquine was
tested using SARS-CoV-2 infected Vero cells. Physiologically-based pharmacokinetic
models (PBPK) were implemented for both drugs separately by integrating their in
vitro data. Using the PBPK models, hydroxychloroquine concentrations in lung fluid
were simulated under 5 different dosing regimens to explore the most effective
regimen whilst considering the drug’s safety profile.
Results. Hydroxychloroquine (EC50=0.72 μM) was found to be more potent than
chloroquine (EC50=5.47 μM) in vitro. Based on PBPK models results, a loading dose
of 400 mg twice daily of hydroxychloroquine sulfate given orally, followed by a
maintenance dose of 200 mg given twice daily for 4 days is recommended for
SARS-CoV-2 infection, as it reached three times the potency of chloroquine
phosphate when given 500 mg twice daily 5 days in advance.
Conclusions. Hydroxychloroquine was found to be more potent than chloroquine to
Dow
nloaded from https://academ
ic.oup.com/cid/advance-article-abstract/doi/10.1093/cid/ciaa237/5801998 by U
niversity of Colorado H
ealth Sciences Center user on 13 M
arch 2020

4 / 25
inhibit SARS-CoV-2 in vitro.
Keywords. Chloroquine, Hydroxychloroquine, SARS-CoV-2
Dow
nloaded from https://academ
ic.oup.com/cid/advance-article-abstract/doi/10.1093/cid/ciaa237/5801998 by U
niversity of Colorado H
ealth Sciences Center user on 13 M
arch 2020

5 / 25
INTRODUCTION
In December 2019 the outbreak of a novel coronavirus, Severe Acute Respiratory
Syndrome Coronavirus 2 (SARS-CoV-2 or COVID-2019), was first reported in
Wuhan, China. The outbreak has since rapidly spread to other provinces in mainland
China, as well as other countries around the world. Currently the number of people
diagnosed with SARS-CoV-2 infection is increasing by approximately 1000 cases a
day. Unfortunately, to date, no drugs have approved by regulatory agencies for the
treatment of SARS-CoV-2 infection.
Chloroquine is a widely used anti-malarial with immunomodulatory effects [1-5]. In a
recent in vitro study chloroquine was found to inhibit the growth of SARS-CoV-2 in
vitro [6]. This finding has been supported by clinical studies conducted in
approximately one-hundred SARS-CoV-2 infected patients [7, 8].
Hydroxychloroquine is an analog of chloroquine that has fewer concerns about
drug-drug interactions. In the previous SARS outbreak, hydroxychloroquine was
reported to have anti-SARS-CoV activity in vitro [9]. This suggests that
hydroxychloroquine may be a potential pharmacological agent for the treatment of
COVID-19 infection. However, to date, there is no clinical evidence to support the
use of hydroxychloroquine as a treatment for SARS-CoV-2 infection.
The molecular mechanism of action of chloroquine and hydroxychloroquine has not
been fully elucidated. Findings from previous studies have suggested that chloroquine
and hydroxychloroquine may inhibit the coronavirus through a series of steps. Firstly,
the drugs can change the pH at the surface of the cell membrane and thus, inhibit the
fusion of the virus to the cell membrane. It can also inhibit nucleic acid replication,
Dow
nloaded from https://academ
ic.oup.com/cid/advance-article-abstract/doi/10.1093/cid/ciaa237/5801998 by U
niversity of Colorado H
ealth Sciences Center user on 13 M
arch 2020

6 / 25
glycosylation of viral proteins, virus assembly, new virus particle transport, virus
release and other processes to achieve its antiviral effects [10].
A reliable estimation of hydroxychloroquine and chloroquine concentrations in the
lung, the target tissue, may be used for guiding dose recommendations.
Physiologically-based pharmacokinetic (PBPK) models are a mathematical modelling
technique that can predict drug concentrations in human tissues in silico by
integrating physiological and drug disposition parameters. PBPK models are widely
used in drug development to help identify whether a clinical trial is warranted as well
as help guide the use of drugs based on predictions from well-validated models [11,
12].
In this study we aimed to: (i) investigate the antiviral and prophylactic activity of
hydroxychloroquine and chloroquine in vitro, (ii) build a PBPK model for
hydroxychloroquine and chloroquine using data from literature, and, (iii) predict drug
concentrations under different dosing regimens using the developed PBPK models.
METHODS
In Vitro Antiviral Activity Experiment
Experiment Materials
Chloroquine phosphate and hydroxychloroquine sulfate were purchased from Beijing
Innochem Science & Technology Co, Ltd. The lyophilized powder was diluted in
double distilled water to 10 mM. Hydroxychloroquine sulfate was readily soluble in
water. Chloroquine phosphate was dissolved by shaking the solution at room
temperature for 2 hours. The chloroquine and hydroxychloroquine solutions were
Dow
nloaded from https://academ
ic.oup.com/cid/advance-article-abstract/doi/10.1093/cid/ciaa237/5801998 by U
niversity of Colorado H
ealth Sciences Center user on 13 M
arch 2020

7 / 25
filtered through a 0.22 μm membrane and were then stored at −80°C. The clinically
isolated SARS-CoV-2 virus strain, C-Tan-nCoV Wuhan strain 01, was propagated in
Vero cells.
Cell Culture
The Vero cells were derived from the African green monkey kidney and were grown
in Dulbecco's Modified Eagle Medium (DMEM) (Sigma Aldrich, Boston, MA, USA)
supplemented with 5% fetal bovine serum (Logan, UT, USA). The cells were
maintained in a humidified atmosphere with 5% CO2 at 37°C. The culture medium
was replaced each day.
Antiviral Activity Assay
The anti-SARS-CoV-2 activity of chloroquine and hydroxychloroquine was
investigated in vitro. Cells were seeded into 96-well plates at a density of 1×10⁴
cells/well and were grown for 24 hours. The in vitro experiment was divided into two
sections, named: (i) the treatment study and (ii) the prophylactic study.
Treatment study: In the treatment study Vero cells were infected at a multiplicity of
infection (MOI) of 0.01 (100 PFU/well) for 2 hours at a temperature of 37°C .Virus
input was washed with DMEM and the cells were then treated with medium
containing either chloroquine or hydroxychloroquine at 0.032, 0.16, 0.80, 4, 20, 100
μM for 24 or 48 hours.
Drug pretreatment study: Vero cells were pretreated with chloroquine or
hydroxychloroquine for 2 hours and then, were removed from the drug-containing
Dow
nloaded from https://academ
ic.oup.com/cid/advance-article-abstract/doi/10.1093/cid/ciaa237/5801998 by U
niversity of Colorado H
ealth Sciences Center user on 13 M
arch 2020

8 / 25
medium. The virus-containing medium was then added to the infected Vero cells (as
described for the treatment study) for 2 hours. Following this, the virus-containing
medium was removed and replaced with fresh medium that did not contain drugs or
viruses.
The supernatant was collected, and, the RNA was extracted and analyzed by relative
quantification using RT-PCR (methods described in a previously published study) [13,
14].
Viral RNA Extraction and RT-PCR
Viral RNA was extracted from 100 μL of supernatant of infected cells using the
automated nucleic acid extraction system (TIANLONG, China) and the
manufacturer’s instructions. Detection of the SARS-CoV-2 virus was performed using
the One Step Prime Script RT-PCR kit (TaKaRa, Japan) on the Light Cycler 480
Real-Time PCR system (Roche, Rotkreuz, Switzerland) with primers. The following
sequences were used:
forward primer: 5ʹ-AGAAGATTGGTTAGATGATGATAGT-3ʹ;
reverse primer:5ʹ-TTCCATCTCTAATTGAGGTTGAACC-3ʹ;
and probe:5ʹ-FAM-TCCTCACTGCCGTCTTGTTG ACCA-BHQ1-3ʹ.
All experiments were conducted in triplicates. The relative expression was estimated
using the 2-△△Ct method.
Statistical Analysis
A sigmoidal concentration-response function, Y=Bottom + (Top-Bottom)/
(1+10^((LogEC50-X)*HillSlope)), was fit to the data using nonlinear regression. The
Dow
nloaded from https://academ
ic.oup.com/cid/advance-article-abstract/doi/10.1093/cid/ciaa237/5801998 by U
niversity of Colorado H
ealth Sciences Center user on 13 M
arch 2020
9 / 25
EC50 values were calculated using PRISM (GraphPad software, San Diego, CA,
USA).
PBPK Model Development, Validation and Simulation
The PBPK models for chloroquine and hydroxychloroquine were developed using
Simcyp simulator (version 18). The chloroquine compound file was provided by
Simcyp Limited (a Certara company, Blades Enterprise Centre, Sheffield, UK) and
the hydroxychloroquine compound file was self-built. Physical and chemical
parameters were obtained from the literature [15]. Pharmacokinetic parameters, such
as liver intrinsic clearance, fa and ka, were determined from clinical data [16]. These
data are summarized in supplement 1. The lung to blood concentration ratio for
chloroquine and hydroxychloroquine (obtained from animal studies) was used to
predict the drug concentration in the lungs [17, 18].
Validation Data
Published chloroquine and hydroxychloroquine clinical trial data were used to
validate the developed PBPK models (details summarized in supplement 2) [16,
19-23]. Data obtained from the literature in graphical form were extracted using Plot
Digitizer (version 2.26, GetData). Pharmacokinetic parameters that could not be
sourced from the literature were estimated using extracted data in Phoenix (version
8.6, Certara company).
Validation Method
Concentration-time profiles were simulated under different published clinical trial
Dow
nloaded from https://academ
ic.oup.com/cid/advance-article-abstract/doi/10.1093/cid/ciaa237/5801998 by U
niversity of Colorado H
ealth Sciences Center user on 13 M
arch 2020

10 / 25
protocols using the developed PBPK models for hydroxychloroquine and chloroquine
[16, 19-23]. The Simcyp “Healthy volunteer”, “Chinese healthy volunteer” and
“Pediatric” virtual populations were used in the simulations as the clinical trials were
conducted in Caucasian, Chinese and children populations, respectively.
Simulated exposure data was compared to observed data. The criterion to determine
model accuracy was based on whether the observed data fell within the 90%
confidence interval of the predicted values. The ratio of predicted pharmacokinetic
(PK) parameters (e.g. Cmax and AUC) to observed values was used to evaluate model
performance. The predicted values were considered reasonable if the ratio of
predicted to observed data was within a 2-fold range (0.5≤ratio≤2.0).
Simulation Method
The exposure of chloroquine and hydroxychloroquine in the lungs, plasma and blood
were simulated under different dosing regimens (shown in Table 1) using the
validated PBPK models. A correction factor for chloroquine base and
hydroxychloroquine base was input into the model simulations. Chloroquine
phosphate 500 mg is equivalent to 300 mg of chloroquine base and 200 mg of
hydroxychloroquine sulfate is equivalent to 155 mg of hydroxychloroquine base. The
“Chinese Healthy Volunteers” virtual population provided in Simcyp was used for the
simulations. All simulations were performed with 10 trials and 10 subjects per trial.
Virtual subjects were aged between 20 to 50 years of age, and, 50% of the subjects
were male and 50% female.
Dow
nloaded from https://academ
ic.oup.com/cid/advance-article-abstract/doi/10.1093/cid/ciaa237/5801998 by U
niversity of Colorado H
ealth Sciences Center user on 13 M
arch 2020
11 / 25
Dose regimen optimization
The PBPK models were used to predict the lung tissue concentrations of chloroquine
and hydroxychloroquine under different dosing regimens (Table 1). The lung trough
concentration on days 1, 3, 5 and 10 were adjusted by the plasma unbound fraction
(fu,plasma) to obtain the free lung trough concentration. The ratio of the free lung trough
concentration to the in vitro EC50 values (RLTEC) was calculated and the results
tabulated. In a recent clinical trial 500 mg of chloroquine phosphate given twice daily
was shown to be effective on study day 5 (RLTEC, day5). This dosing regimen for
chloroquine was used as the target for dose optimization for hydroxychloroquine (i.e.,
the RLTEC of hydroxychloroquine should not be lower than the RLTEC, day5 of
chloroquine at any time).
RESULTS
Antiviral Activity in vitro
Results from the in vitro study showed that both chloroquine and hydroxychloroquine
have good antiviral activity. Chloroquine and hydroxychloroquine were found to
decrease the viral replication in a concentration-dependent manner. The EC50 values
for chloroquine were 23.90 and 5.47 μM at 24 and 48 hours, respectively (Figure 1a).
EC50 values for hydroxychloroquine were 6.14 and 0.72 μM at 24 and 48 hours,
respectively (Figure 1b).
Antiviral Pre-treatment Activity in vitro
Hydroxychloroquine exhibited a superior in vitro antiviral effect in comparison to
Dow
nloaded from https://academ
ic.oup.com/cid/advance-article-abstract/doi/10.1093/cid/ciaa237/5801998 by U
niversity of Colorado H
ealth Sciences Center user on 13 M
arch 2020
12 / 25
chloroquine when drug was added prior to the viral challenge. The EC50 values for
chloroquine were >100 and 18.01 μM at 24 and 48 hours, respectively. EC50 values
for hydroxychloroquine were 6.25 and 5.85 μM at 24 and 48 hours, respectively. It
was noted that with longer incubation times the EC50 values for chloroquine and
hydroxychloroquine tended to decrease. The inhibitory effect of chloroquine was poor.
This was particularly evident at 24 hours, whereby, even at the highest concentration
of chloroquine used in the study, the inhibition rate did not exceed 50% (Figure 1c
and 1d).
PBPK model development, validation and simulation
Validation results
The predicted and observed plasma/blood concentration time profiles for chloroquine
and hydroxychloroquine is shown in Figure 2. Intravenous data was used to
understand the distribution and elimination phase of the two drugs, and, oral
administration data was used to understand the intracorporal absorption process. Most
of the observed data fell within the 90% prediction interval. The ratio of predicted to
observed PK parameters (Cmax and AUC) were within the range of 0.5 to 2.0 (details
summarized in supplement 2), indicating that the prediction accuracy of the developed
PBPK models was acceptable and could be used to simulate the different dosing
scenarios.
Simulation results
The simulated lung, blood and plasma concentration time profiles for chloroquine and
Dow
nloaded from https://academ
ic.oup.com/cid/advance-article-abstract/doi/10.1093/cid/ciaa237/5801998 by U
niversity of Colorado H
ealth Sciences Center user on 13 M
arch 2020

13 / 25
hydroxychloroquine under the different dosing regimens is shown in Figure 3. It can
be seen that the lung, blood and plasma concentrations of chloroquine increased
slowly after the first dose was given and was yet to reach steady state on day 10. The
simulated chloroquine concentration in lung tissue was much higher than in plasma,
where the lung to plasma ratio increased with time and reached a ratio of
approximately 400. The projected lung, blood and plasma concentrations of
hydroxychloroquine rapidly increased and reached steady state following the initial
loading dose and subsequent maintenance doses (Figure 3b to 3f).
Suggested dosing regimens for hydroxychloroquine to treat SARS-CoV-2
infection
The free lung trough concentrations were also projected from the simulations. The
ratio of free lung trough concentration to EC50 (RLTEC) under the different dosing
regimens is shown in Table 1. The RLTEC values of hydroxychloroquine were found to
be higher than the RLTEC values of chloroquine on days 1, 3, 5 and 10. This suggests
that hydroxychloroquine may achieve ideal clinical efficacy under the simulated
dosing regimens.
The RLTEC on day 1 was notably higher for hydroxychloroquine than for chloroquine.
This is likely to be due to the loading dose of hydroxychloroquine given, thus
enabling a faster clinical effect. There was no significant difference between the once
and twice daily maintenance dosing regimens (Regimen C and D, respectively) when
Dow
nloaded from https://academ
ic.oup.com/cid/advance-article-abstract/doi/10.1093/cid/ciaa237/5801998 by U
niversity of Colorado H
ealth Sciences Center user on 13 M
arch 2020

14 / 25
used from day 2 to day 10; hence, the once daily dosing regimen may be preferred to
improve patient compliance. Despite Regimen F being a 5 day treatment regimen, the
lung trough concentrations were still above the target concentration on day 10.
However, if the treatment duration of Regimen F was extended to 10 days (i.e.
Regimen E) it resulted in a higher drug concentration on day 10. Overall, Regimen F
may be the best regimen whilst considering both efficacy, safety and patient
compliance.
DISCUSSION
In this study, hydroxychloroquine exhibited better in vitro anti-SARS-CoV-2 activity
than chloroquine. This was demonstrated by the EC50 values for hydroxychloroquine
always being smaller than the EC50 values for chloroquine, indicating that
hydroxychloroquine has a more potent antiviral activity (shown in Figure 1). In the
study by Wang et al [6], chloroquine was shown to have an inhibitory effect on
SARS-CoV-2 with an EC50 value of 1.13 μM after a 48 hour incubation time. These
findings are comparable with our in vitro chloroquine results of an EC50 value of 5.47
μM. In addition, an unpublished clinical trial has demonstrated the therapeutic effect
of chloroquine in SARS-CoV-2 infected patients. On the basis of
hydroxychloroquine’s superior antiviral and prophylactic activity, as well as its more
tolerable safety profile in comparison to chloroquine, we believe that
hydroxychloroquine may be a promising drug for the treatment of SARS-CoV-2
infection [24].
Dow
nloaded from https://academ
ic.oup.com/cid/advance-article-abstract/doi/10.1093/cid/ciaa237/5801998 by U
niversity of Colorado H
ealth Sciences Center user on 13 M
arch 2020

15 / 25
In our study we noted that the EC50 values for hydroxychloroquine and chloroquine
decreased with longer incubation times. This suggests that incubation time may
influence the drug’s antiviral activity. Both hydroxychloroquine and chloroquine have
been reported to accumulate in cells [25]. It is possible that a longer incubation time
may provide more time for the drug to accumulate to higher intracellular
concentrations and ultimately exhibit a better antiviral effect [26]. Another possible
explanation is that the drug-induced cytotoxicity may take time to develop, and hence,
the drug effect may increase with time [27].
The PBPK model for hydroxychloroquine and chloroquine was validated with in vivo
PK data from humans, rats and mice. The model was able to reasonably predict drug
concentrations in human lung tissue. A permeability rate limiting model was
implemented in the PBPK model to mimic the characteristics of both drugs. In
addition, a high lung to plasma partition coefficient ratio (Kp ratio) was used to
imitate the drugs’ high accumulation in lung tissue. The Kp ratio for humans was
assumed to be same as the ratio for rats because there was no human data available.
This assumption may be reasonable as the transportation of both drugs is completely
via passive diffusion (i.e. no transporters are involved).
In some patients it has been reported that their immune response to the SARS-CoV-2
virus results in the increase of cytokines IL-6 and IL-10 [13, 28]. This may progress
to a cytokine storm, followed by multi-organ failure and potentially death. Both
hydroxychloroquine and chloroquine have immunomodulatory effects and can
Dow
nloaded from https://academ
ic.oup.com/cid/advance-article-abstract/doi/10.1093/cid/ciaa237/5801998 by U
niversity of Colorado H
ealth Sciences Center user on 13 M
arch 2020
16 / 25
suppress the increase of immune factors [29, 30]. Bearing this in mind, it is possible
that early treatment with either of the drugs may help prevent the progression of the
disease to a critical, life-threatening state. In critically ill SARS-CoV-2 infected
patients the use of corticosteroids may be harmful [31]. Whilst, the use of
immunosuppressants (e.g. tocilizumab) are not ideal either as it can suppress the
immune system and lead to an increased risk of infection [32]. In this setting,
hydroxychloroquine may be an ideal drug to treat SARS-CoV-2 infection as it can
inhibit the virus via its antiviral effects and help mediate the cytokine storm via its
immunomodulatory effects. Based on work conducted in our lab, we recommend the
concomitant use of low dose hydroxychloroquine with an anti-inflammatory drug to
help mitigate the cytokine storm in critically ill SARS-CoV-2 patients.
Several clinical trials are currently investigating the use of hydroxychloroquine to
treat SARS-CoV-2 infection. However, it is worth noting that the dosing regimens
used in these trials are mainly based on previous clinical experience, raising the
concern that adverse effects may occur in study participants (supplement 3). In this
study, an optimized dosing regimen was designed for hydroxychloroquine to have a
high loading dose and low maintenance dose based on it’s unique pharmacokinetics
(i.e. high accumulation in cells and long elimination half-life). Using PBPK modelling
and simulation techniques the optimal dosing regimen for hydroxychloroquine was
evaluated in in silico. The simulation results demonstrated that Regimen F was able to
achieve treatment efficacy as well as have a good safety profile, even considering
Dow
nloaded from https://academ
ic.oup.com/cid/advance-article-abstract/doi/10.1093/cid/ciaa237/5801998 by U
niversity of Colorado H
ealth Sciences Center user on 13 M
arch 2020

17 / 25
possible underestimation of drug efficacy to some extent. However, future clinical
trials evaluating this regimen are required before it can be readily used in the clinic.
The combination of the in vitro antiviral activity data and predicted drug
concentrations in this study are being used to support the design of dosing regimens
used in a future clinical trial.
Dow
nloaded from https://academ
ic.oup.com/cid/advance-article-abstract/doi/10.1093/cid/ciaa237/5801998 by U
niversity of Colorado H
ealth Sciences Center user on 13 M
arch 2020

18 / 25
Acknowledgements
We want to thank Dr. Lisa Almond and Luke Guilliatt from Simcyp Limited for
providing the chloroquine compound file.
Funding
This work was supported by the “13th Five-Year” National Major New Drug Projects
of China, Ministry of Science and Technology of the People’s Republic of China,
[grant number No.2017ZX09101001-002-001] and Bill & Melinda Gates Foundation
[OPP1204780].
Conflict of Interest
C.S., H.L., and D.L. have patents pending for Anti-microbial infection pharmoceutical
composition and its application. All other authors have no potential conflicts.
Dow
nloaded from https://academ
ic.oup.com/cid/advance-article-abstract/doi/10.1093/cid/ciaa237/5801998 by U
niversity of Colorado H
ealth Sciences Center user on 13 M
arch 2020

19 / 25
References
1. Romanelli F, Smith KM, Hoven AD. Chloroquine and hydroxychloroquine as inhibitors of human
immunodeficiency virus (HIV-1) activity. Curr Pharm Des. 2004. 10(21): 2643-8.
2. Keyaerts E, Vijgen L, Maes P, Neyts J, Van Ranst M. In vitro inhibition of severe acute respiratory
syndrome coronavirus by chloroquine. Biochem Biophys Res Commun. 2004. 323(1): 264-8.
3. Vincent MJ, Bergeron E, Benjannet S, et al. Chloroquine is a potent inhibitor of SARS coronavirus
infection and spread. Virol J. 2005. 2: 69.
4. Ooi EE, Chew JS, Loh JP, Chua RC. In vitro inhibition of human influenza A virus replication by
chloroquine. Virol J. 2006. 3: 39.
5. Li C, Zhu X, Ji X, et al. Chloroquine, a FDA-approved Drug, Prevents Zika Virus Infection and its
Associated Congenital Microcephaly in Mice. EBioMedicine. 2017. 24: 189-194.
6. Wang M, Cao R, Zhang L, et al. Remdesivir and chloroquine effectively inhibit the recently emerged novel
coronavirus (2019-nCoV) in vitro. Cell Res. 2020 .
7. Huang J. Efficacy of Chloroquine and Lopinavir/ Ritonavir in mild/general novel coronavirus (CoVID-19)
infections: a prospective, open-label, multicenter randomized controlled clinical study. 13 Feb 2020.
http://www.chictr.org.cn/showproj.aspx?proj=49263.
8. Li Y. Ministry of Science and Technology of China: chloroquine phosphate is effective in the treatment of
novel coronavirus pneumonia. 17 Feb. http://news.ynet.com/2020/02/17/2388070t70.html.
9. Biot C, Daher W, Chavain N, et al. Design and synthesis of hydroxyferroquine derivatives with antimalarial
and antiviral activities. J Med Chem. 2006. 49(9): 2845-9.
10. Fox RI. Mechanism of action of hydroxychloroquine as an antirheumatic drug. Semin Arthritis Rheum.
1993. 23(2 Suppl 1): 82-91.
11. FDA. Physiologically Based Pharmacokinetic Analyses-Format and Content Guidance for Industry. Aug
2018. https://www.fda.gov/media/101469/download.
12. Hsueh CH, Hsu V, Pan Y, Zhao P. Predictive Performance of Physiologically-Based Pharmacokinetic
Models in Predicting Drug-Drug Interactions Involving Enzyme Modulation. Clin Pharmacokinet. 2018.
57(10): 1337-1346.
13. Huang C, Wang Y, Li X, et al. Clinical features of patients infected with 2019 novel coronavirus in Wuhan,
China. Lancet. 2020. 395(10223): 497-506.
14. Zhu N, Zhang D, Wang W, et al. A Novel Coronavirus from Patients with Pneumonia in China, 2019. N
Engl J Med. 2020 .
15. Collins KP, Jackson KM, Gustafson DL. Hydroxychloroquine: A Physiologically-Based Pharmacokinetic
Model in the Context of Cancer-Related Autophagy Modulation. J Pharmacol Exp Ther. 2018. 365(3):
447-459.
16. Tett SE, Cutler DJ, Day RO, Brown KF. Bioavailability of hydroxychloroquine tablets in healthy
volunteers. Br J Clin Pharmacol. 1989. 27(6): 771-9.
17. Adelusi SA, Salako LA. Kinetics of the distribution and elimination of chloroquine in the rat. Gen
Pharmacol 1982;13:433-7.
18. McChesney EW. Animal toxicity and pharmacokinetics of hydroxychloroquine sulfate. Am J Med
1983;75:11-8.
19. Fan HW, Ma ZX, Chen J, Yang XY, Cheng JL, Li YB. Pharmacokinetics and Bioequivalence Study of
Hydroxychloroquine Sulfate Tablets in Chinese Healthy Volunteers by LC-MS/MS. Rheumatol Ther. 2015.
Dow
nloaded from https://academ
ic.oup.com/cid/advance-article-abstract/doi/10.1093/cid/ciaa237/5801998 by U
niversity of Colorado H
ealth Sciences Center user on 13 M
arch 2020

20 / 25
2(2): 183-195.
20. Tett SE, Cutler DJ, Day RO, Brown KF. A dose-ranging study of the pharmacokinetics of
hydroxy-chloroquine following intravenous administration to healthy volunteers. Br J Clin Pharmacol.
1988. 26(3): 303-13.
21. Walker O, Dawodu AH, Salako LA, Alván G, Johnson AO. Single dose disposition of chloroquine in
kwashiorkor and normal children--evidence for decreased absorption in kwashiorkor. Br J Clin Pharmacol.
1987. 23(4): 467-72.
22. Gustafsson LL, Walker O, Alván G, et al. Disposition of chloroquine in man after single intravenous and
oral doses. Br J Clin Pharmacol 1983;15:471-9.
23. Neuvonen PJ, Kivistö KT, Laine K, Pyykkö K. Prevention of chloroquine absorption by activated charcoal.
Hum Exp Toxicol. 1992. 11(2): 117-20.
24. Furst DE. Pharmacokinetics of hydroxychloroquine and chloroquine during treatment of rheumatic
diseases. Lupus. 1996. 5 Suppl 1: S11-5.
25. Quintart J, Leroy-Houyet MA, Trouet A, Baudhuin P. Endocytosis and chloroquine accumulation during
the cell cycle of hepatoma cells in culture. J Cell Biol. 1979. 82(3): 644-53.
26. Ying C, De Clercq E, Neyts J. Lamivudine, adefovir and tenofovir exhibit long-lasting anti-hepatitis B
virus activity in cell culture. J Viral Hepat. 2000. 7(1): 79-83.
27. Abdel-Aziz AK, Shouman S, El-Demerdash E, Elgendy M, Abdel-Naim AB. Chloroquine synergizes
sunitinib cytotoxicity via modulating autophagic, apoptotic and angiogenic machineries. Chem Biol
Interact. 2014. 217: 28-40.
28. Chen L, Liu HG, Liu W, et al. [Analysis of clinical features of 29 patients with 2019 novel coronavirus
pneumonia]. Zhonghua Jie He He Hu Xi Za Zhi 2020;43:E005.
29. Schrezenmeier E, Dörner T. Mechanisms of action of hydroxychloroquine and chloroquine: implications
for rheumatology. Nat Rev Rheumatol 2020.
30. Savarino A, Boelaert JR, Cassone A, Majori G, Cauda R. Effects of chloroquine on viral infections: an old
drug against today's diseases. Lancet Infect Dis 2003;3:722-7.
31. Lianhan S, Jianping Z, Yi H, Du Ronghui, Bin C. On the use of corticosteroids for 2019-nCoV pneumonia.
Lancet 2020.
32. Strand V, Ahadieh S, French J, et al. Systematic review and meta-analysis of serious infections with
tofacitinib and biologic disease-modifying antirheumatic drug treatment in rheumatoid arthritis clinical
trials. Arthritis Res Ther 2015;17:362.
Dow
nloaded from https://academ
ic.oup.com/cid/advance-article-abstract/doi/10.1093/cid/ciaa237/5801998 by U
niversity of Colorado H
ealth Sciences Center user on 13 M
arch 2020
21 / 25
Figures
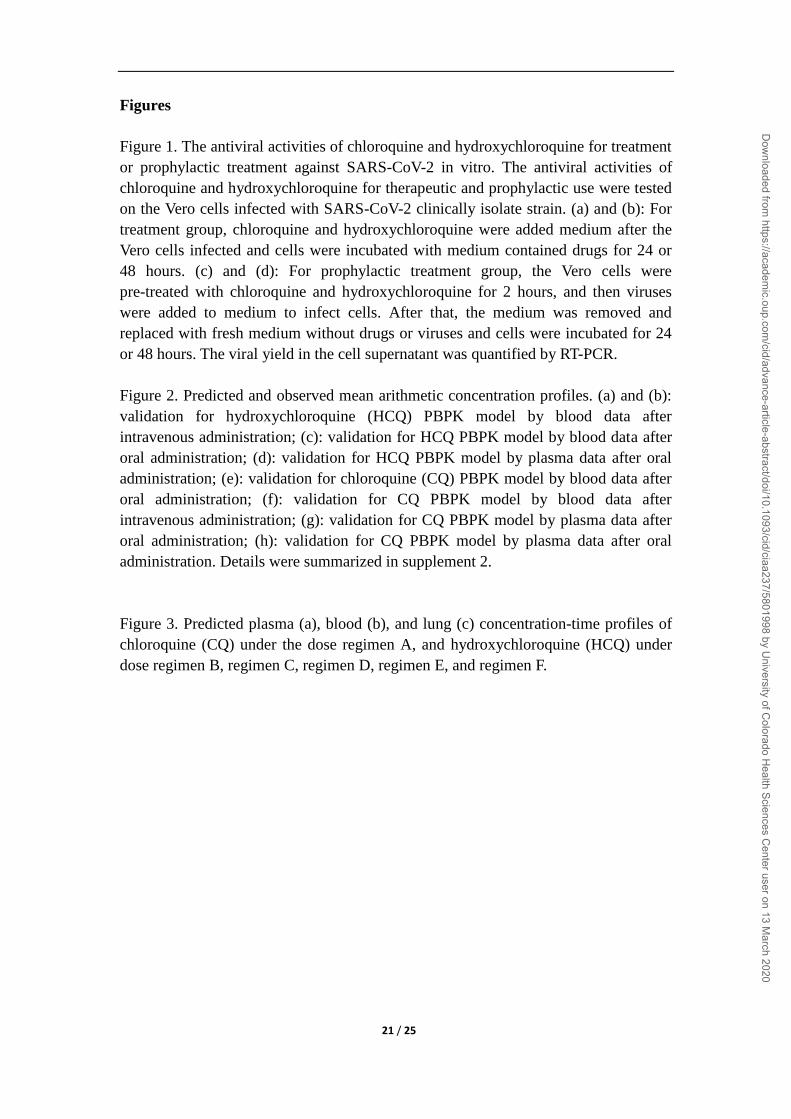
Figure 1. The antiviral activities of chloroquine and hydroxychloroquine for treatment
or prophylactic treatment against SARS-CoV-2 in vitro. The antiviral activities of
chloroquine and hydroxychloroquine for therapeutic and prophylactic use were tested
on the Vero cells infected with SARS-CoV-2 clinically isolate strain. (a) and (b): For
treatment group, chloroquine and hydroxychloroquine were added medium after the
Vero cells infected and cells were incubated with medium contained drugs for 24 or
48 hours. (c) and (d): For prophylactic treatment group, the Vero cells were
pre-treated with chloroquine and hydroxychloroquine for 2 hours, and then viruses
were added to medium to infect cells. After that, the medium was removed and
replaced with fresh medium without drugs or viruses and cells were incubated for 24
or 48 hours. The viral yield in the cell supernatant was quantified by RT-PCR.
Figure 2. Predicted and observed mean arithmetic concentration profiles. (a) and (b):
validation for hydroxychloroquine (HCQ) PBPK model by blood data after
intravenous administration; (c): validation for HCQ PBPK model by blood data after
oral administration; (d): validation for HCQ PBPK model by plasma data after oral
administration; (e): validation for chloroquine (CQ) PBPK model by blood data after
oral administration; (f): validation for CQ PBPK model by blood data after
intravenous administration; (g): validation for CQ PBPK model by plasma data after
oral administration; (h): validation for CQ PBPK model by plasma data after oral
administration. Details were summarized in supplement 2.
Figure 3. Predicted plasma (a), blood (b), and lung (c) concentration-time profiles of
chloroquine (CQ) under the dose regimen A, and hydroxychloroquine (HCQ) under
dose regimen B, regimen C, regimen D, regimen E, and regimen F.
Dow
nloaded from https://academ
ic.oup.com/cid/advance-article-abstract/doi/10.1093/cid/ciaa237/5801998 by U
niversity of Colorado H
ealth Sciences Center user on 13 M
arch 2020

22 / 25
Tables
Table 1: Ratios of free lung tissue trough concentration/EC50 (RLTEC) under different dosage
regimens
Drug NO
. Dosing Regimen
RLTEC
Day1 Day3 Day5 Day10
Chloroquine
phosphate A. D1-D10 500 mg BID 2.38 5.92 18.9 40.7
Hydroxychloroquine
sulfate
B. D1 800 mg+400 mg;
D2-D10 400 mg QD 33.3 55.1 103 168
C. D1 600 mg BID;
D2-D10 400 mg QD 31.7 54.7 103 169
D. D1 600 mg BID;
D2-D10 200 mg BID 31.7 53.1 101 167
E. D1 400 mg BID;
D2-D10 200 mg BID 21.0 38.9 85.4 154
F. D1 400 mg BID;
D2-D5 200 mg BID 21.0 38.9 85.4 83.3
RLTEC: ratio of free lung tissue trough concentration/EC50.
Dow
nloaded from https://academ
ic.oup.com/cid/advance-article-abstract/doi/10.1093/cid/ciaa237/5801998 by U
niversity of Colorado H
ealth Sciences Center user on 13 M
arch 2020

23 / 25
Figure 1
Dow
nloaded from https://academ
ic.oup.com/cid/advance-article-abstract/doi/10.1093/cid/ciaa237/5801998 by U
niversity of Colorado H
ealth Sciences Center user on 13 M
arch 2020

24 / 25
Figure 2
Dow
nloaded from https://academ
ic.oup.com/cid/advance-article-abstract/doi/10.1093/cid/ciaa237/5801998 by U
niversity of Colorado H
ealth Sciences Center user on 13 M
arch 2020

25 / 25
Figure 3
Dow
nloaded from https://academ
ic.oup.com/cid/advance-article-abstract/doi/10.1093/cid/ciaa237/5801998 by U
niversity of Colorado H
ealth Sciences Center user on 13 M
arch 2020