Embed Size (px)
Citation preview
An optical telescope to achieve a tracking and pointing model for radiotelescopes
S. Poppi(1)
, C. Pernechele(1)
, M. Morsiani(2)
, J. Roda(2)
, V. Chiomento(3)
,
E. Giro(3)
, A. Frigo(3)
, T. Pisanu(1)
, S.Righini (2)
, L. Traverso(3)
(1)
INAF – Astronomical Observatory of Cagliari (2)
INAF – IRA Institute of Radio Astronomy
(3) INAF – Astronomical Observatory of Padova
INTERNAL REPORT INAF-IRA#
Abstract A remotely controlled pointing optical telescope (Star Tracker - ST hereinafter) was built to aim for a precise pointing model and dynamic tracking in radio antennas. It was installed on the INAF-IRA (Institute of Radio Astronomy of the Italian National Institute for Astrophysics) 32 m radiotelescope in Medicina (Bologna – Italy). The ST is working to collect data for the pointing model and to evaluate the tracking performances of the antenna with sub-arcsec resolution. The optical system consists of a 18 cm aperture, f/10, Maksutov-Cassegrain catadioptric telescope, a Peltier cooled CCD camera, a shielding plate against bad weather and an automated electro-mechanical system to close/open the telescope cover. Here the ST performances (sensibility, plate scale and rotation angle), and first tracking measures are presented.
1. Introduction High precision pointing is one of the requirements for high frequency observations. Several millimetre and submillimetre telescopes are thus provided with optical pointing systems, or are developing them [1][2], in order to point and track with the highest possible accuracy. These systems consist of small optical telescopes with CCD cameras mounted in parallel to the antennas. In fact, an optical pointing system takes advantage of a higher number of stars than radio pointing . Moreover, small telescopes can achieve angular resolutions below the arcsecond scale. A ST could be implemented on the Sardinia Radio Telescope, (SRT) which will require a pointing accuracy better than 1 arcsec, since working at frequencies higher than 22GHz. For the time being, a prototype Star Tracker has been installed on the 32 meters VLBI antenna, located in Medicina (BO). This work has been done in the framework of the activities of the Metrology group of the Sardinia Radio Telescope project (GAI02-SRT).
2. The Star Tracker (ST) The Star Tracker (ST) is a 18 cm aperture catadioptric telescope with a Maksutov configuration and f/10 of numerical aperture. It has been provided with a Peltier cooled CCD camera model FingerLake CM9-1E. The parameters of both the telescope and the CCD are summarized in Tab.1 and Tab.2, respectively.
Model Astrotek Mirage 7
Optical Configuration Maksutov Cassegrain
Aperture 180 mm
Focal length 1800 mm
Tab. 1:Telescope parameters.
Model Finger Lake CM9-1E
Chip Model KAF-0261E
Cooling Peltier
Pixels 512 x 512
Pixel Size 20 µm
Field of View 19.5’ x 19.5’
Q. E. @580nm 65%
Full Well Capacity 500 Ke-
Tab. 2:CCD camera parameters.
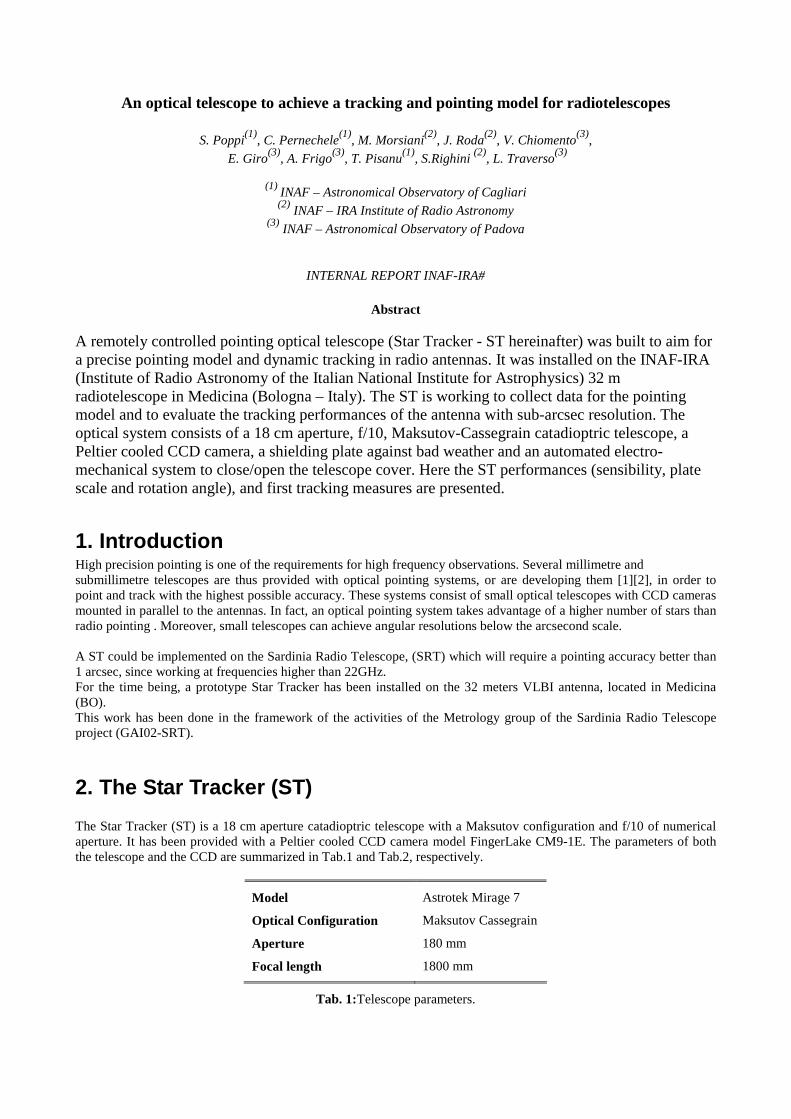
Tab.3 gives an estimate of the number of stars which can be seen in the ST field of view [3]. It is worth noting that for each field of view, it is possible to find approximately 2 stars brighter than mv = 11.
mv N stars degree-2 N stars in the ST FOV 4 0.012589 0.001262 5 0.038905 0.003901 6 0.117490 0.011782 7 0.346737 0.034770 8 1.000000 0.100278 9 2.818383 0.282621 10 8.128305 0.815088 11 21.877616 2.193839
Tab. 3: Number of stars per square degree brighter than mV.
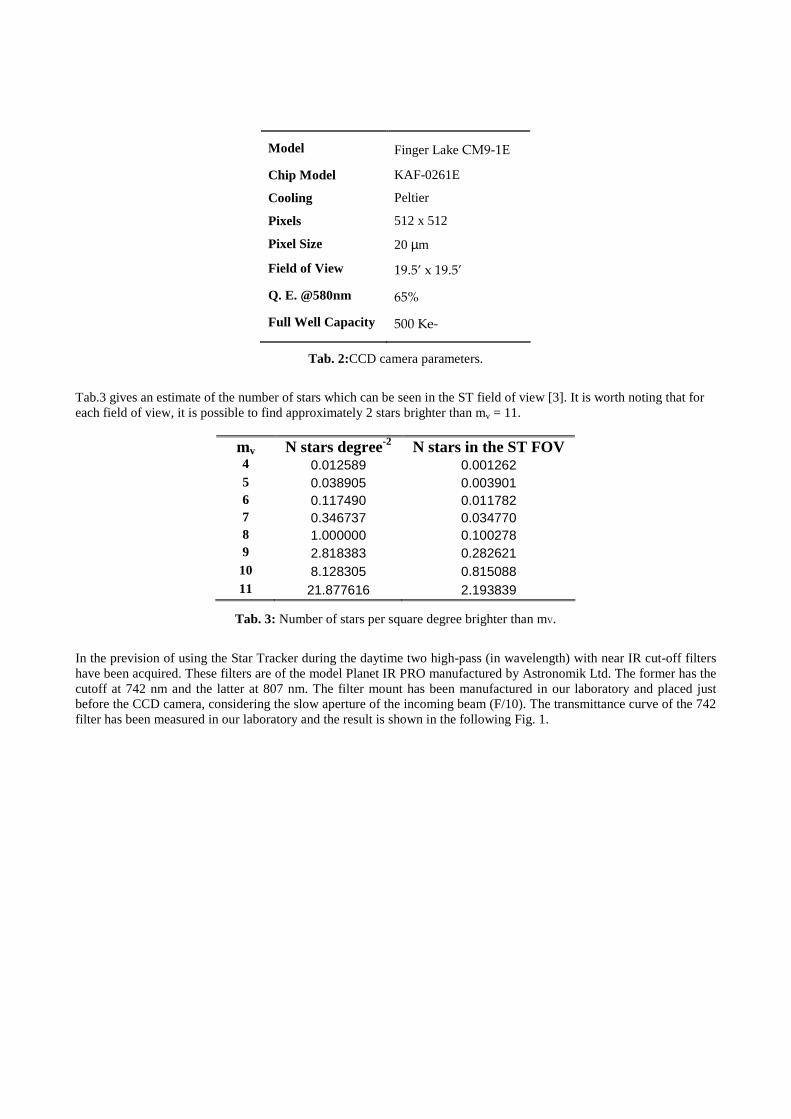
In the prevision of using the Star Tracker during the daytime two high-pass (in wavelength) with near IR cut-off filters have been acquired. These filters are of the model Planet IR PRO manufactured by Astronomik Ltd. The former has the cutoff at 742 nm and the latter at 807 nm. The filter mount has been manufactured in our laboratory and placed just before the CCD camera, considering the slow aperture of the incoming beam (F/10). The transmittance curve of the 742 filter has been measured in our laboratory and the result is shown in the following Fig. 1.
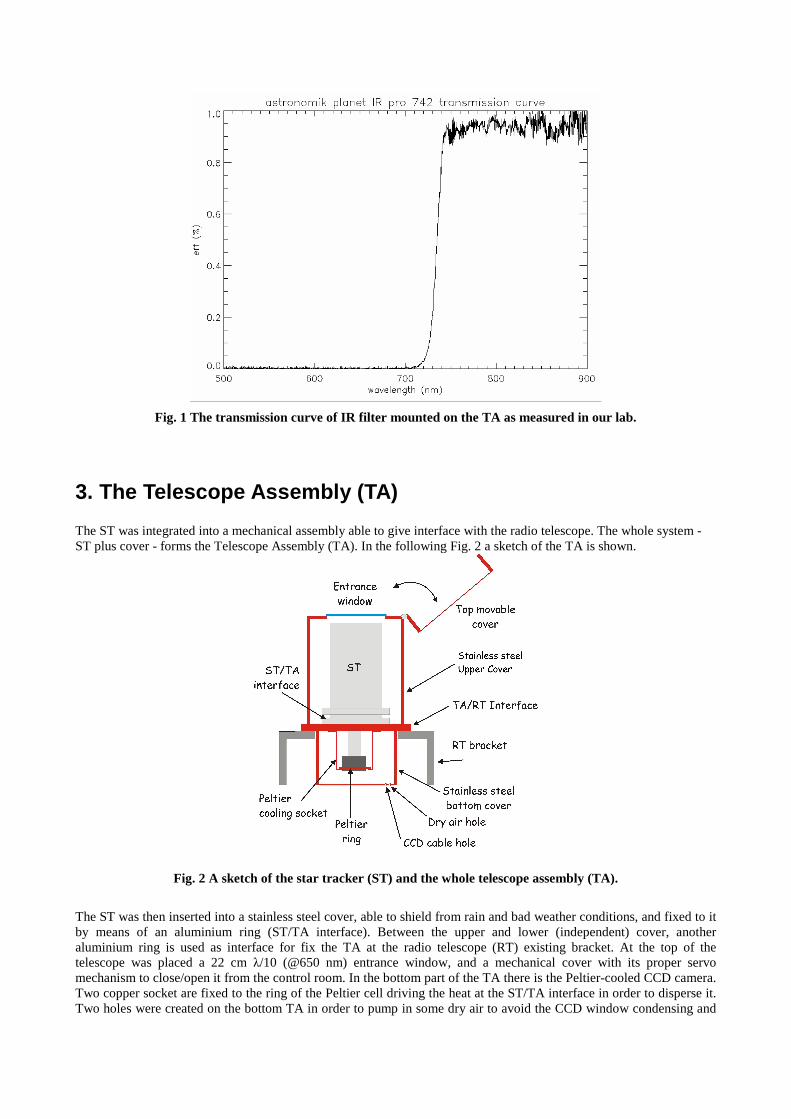
Fig. 1 The transmission curve of IR filter mounted on the TA as measured in our lab.
3. The Telescope Assembly (TA) The ST was integrated into a mechanical assembly able to give interface with the radio telescope. The whole system - ST plus cover - forms the Telescope Assembly (TA). In the following Fig. 2 a sketch of the TA is shown.
Fig. 2 A sketch of the star tracker (ST) and the whole telescope assembly (TA).
The ST was then inserted into a stainless steel cover, able to shield from rain and bad weather conditions, and fixed to it by means of an aluminium ring (ST/TA interface). Between the upper and lower (independent) cover, another aluminium ring is used as interface for fix the TA at the radio telescope (RT) existing bracket. At the top of the telescope was placed a 22 cm λ/10 (@650 nm) entrance window, and a mechanical cover with its proper servo mechanism to close/open it from the control room. In the bottom part of the TA there is the Peltier-cooled CCD camera. Two copper socket are fixed to the ring of the Peltier cell driving the heat at the ST/TA interface in order to disperse it. Two holes were created on the bottom TA in order to pump in some dry air to avoid the CCD window condensing and
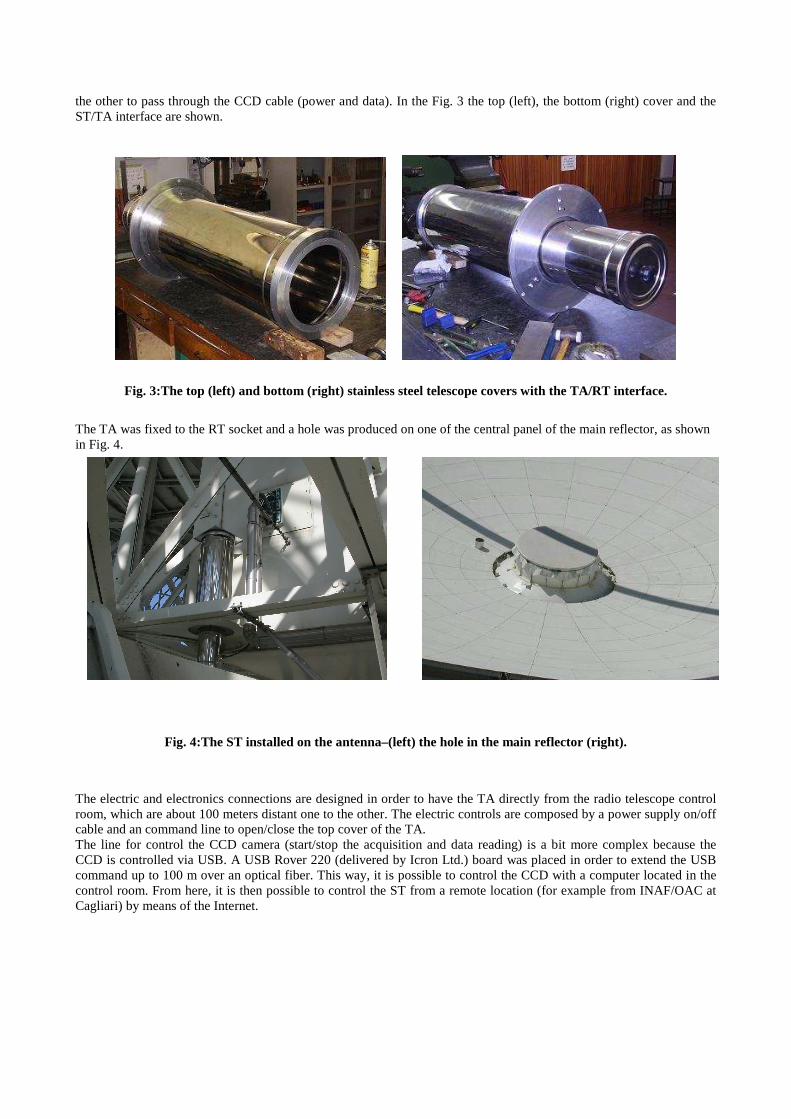
the other to pass through the CCD cable (power and data). In the Fig. 3 the top (left), the bottom (right) cover and the ST/TA interface are shown.
Fig. 3:The top (left) and bottom (right) stainless steel telescope covers with the TA/RT interface.
The TA was fixed to the RT socket and a hole was produced on one of the central panel of the main reflector, as shown in Fig. 4.
Fig. 4:The ST installed on the antenna–(left) the hole in the main reflector (right).
The electric and electronics connections are designed in order to have the TA directly from the radio telescope control room, which are about 100 meters distant one to the other. The electric controls are composed by a power supply on/off cable and an command line to open/close the top cover of the TA. The line for control the CCD camera (start/stop the acquisition and data reading) is a bit more complex because the CCD is controlled via USB. A USB Rover 220 (delivered by Icron Ltd.) board was placed in order to extend the USB command up to 100 m over an optical fiber. This way, it is possible to control the CCD with a computer located in the control room. From here, it is then possible to control the ST from a remote location (for example from INAF/OAC at Cagliari) by means of the Internet.
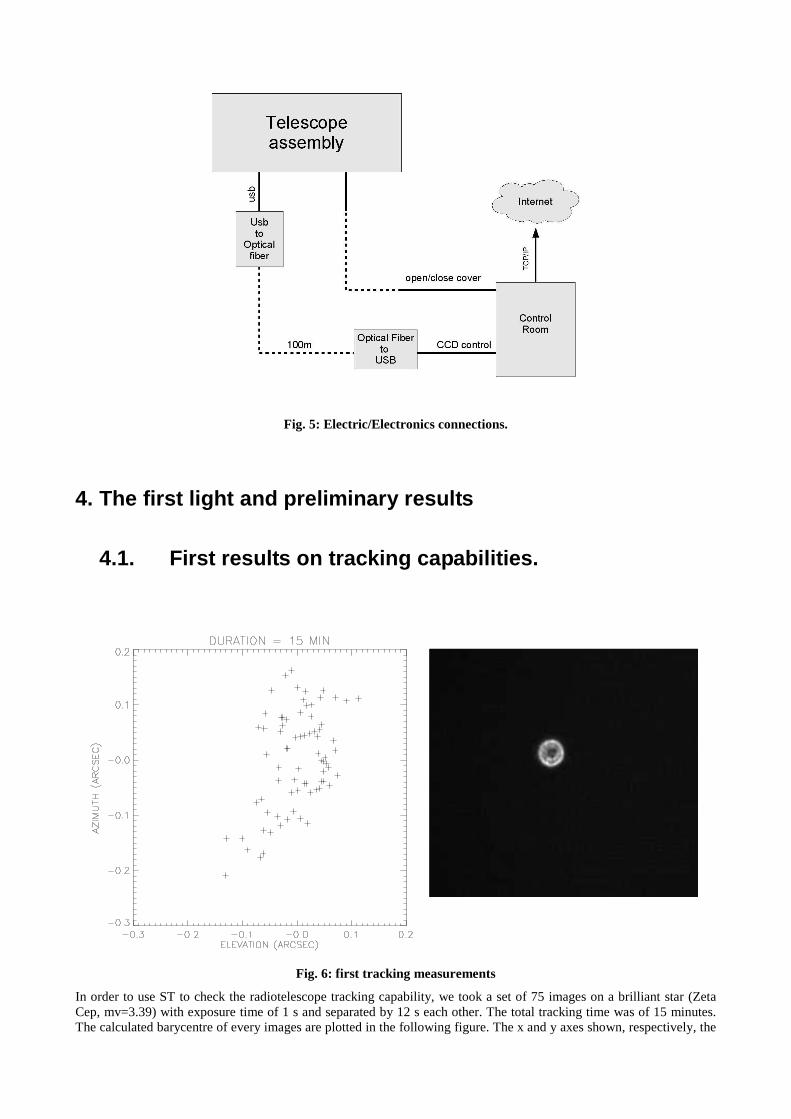
Fig. 5: Electric/Electronics connections.
4. The first light and preliminary results
4.1. First results on tracking capabilities.
Fig. 6: first tracking measurements
In order to use ST to check the radiotelescope tracking capability, we took a set of 75 images on a brilliant star (Zeta Cep, mv=3.39) with exposure time of 1 s and separated by 12 s each other. The total tracking time was of 15 minutes. The calculated barycentre of every images are plotted in the following figure. The x and y axes shown, respectively, the
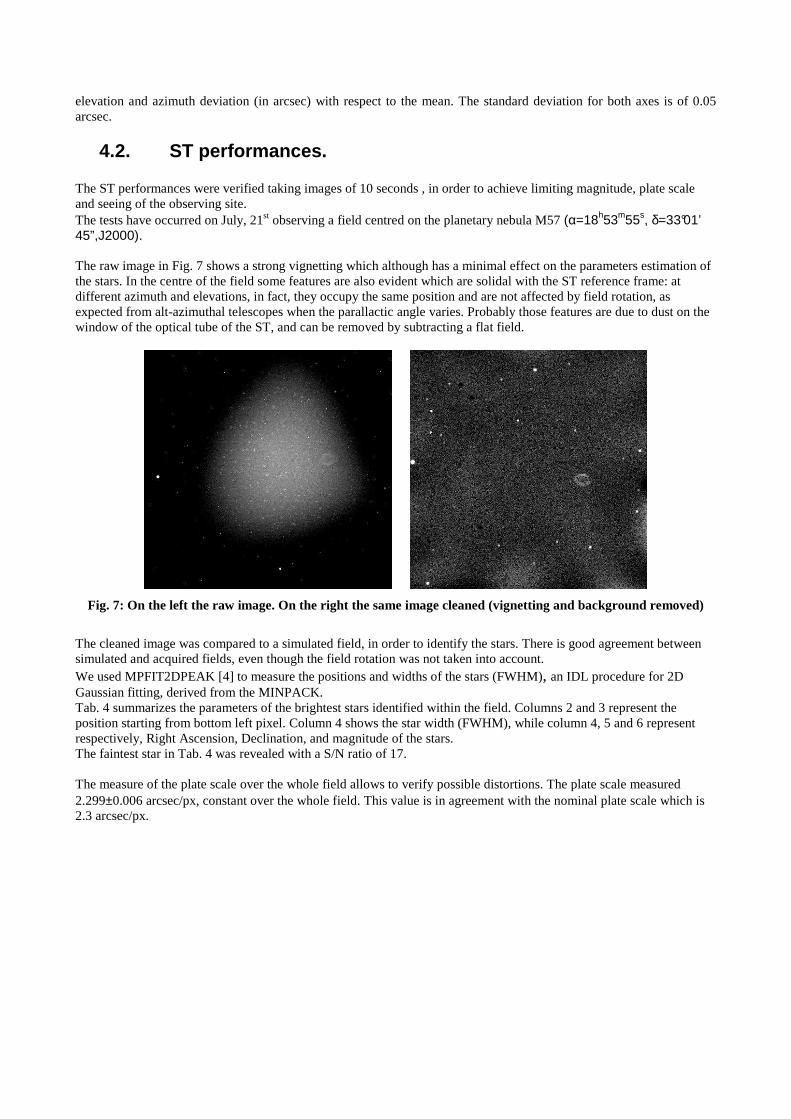
elevation and azimuth deviation (in arcsec) with respect to the mean. The standard deviation for both axes is of 0.05 arcsec.
4.2. ST performances. The ST performances were verified taking images of 10 seconds , in order to achieve limiting magnitude, plate scale and seeing of the observing site. The tests have occurred on July, 21st observing a field centred on the planetary nebula M57 (α=18h53m55s, δ=33°01’ 45”,J2000). The raw image in Fig. 7 shows a strong vignetting which although has a minimal effect on the parameters estimation of the stars. In the centre of the field some features are also evident which are solidal with the ST reference frame: at different azimuth and elevations, in fact, they occupy the same position and are not affected by field rotation, as expected from alt-azimuthal telescopes when the parallactic angle varies. Probably those features are due to dust on the window of the optical tube of the ST, and can be removed by subtracting a flat field.
Fig. 7: On the left the raw image. On the right the same image cleaned (vignetting and background removed)
The cleaned image was compared to a simulated field, in order to identify the stars. There is good agreement between simulated and acquired fields, even though the field rotation was not taken into account. We used MPFIT2DPEAK [4] to measure the positions and widths of the stars (FWHM), an IDL procedure for 2D Gaussian fitting, derived from the MINPACK. Tab. 4 summarizes the parameters of the brightest stars identified within the field. Columns 2 and 3 represent the position starting from bottom left pixel. Column 4 shows the star width (FWHM), while column 4, 5 and 6 represent respectively, Right Ascension, Declination, and magnitude of the stars. The faintest star in Tab. 4 was revealed with a S/N ratio of 17. The measure of the plate scale over the whole field allows to verify possible distortions. The plate scale measured 2.299±0.006 arcsec/px, constant over the whole field. This value is in agreement with the nominal plate scale which is 2.3 arcsec/px.
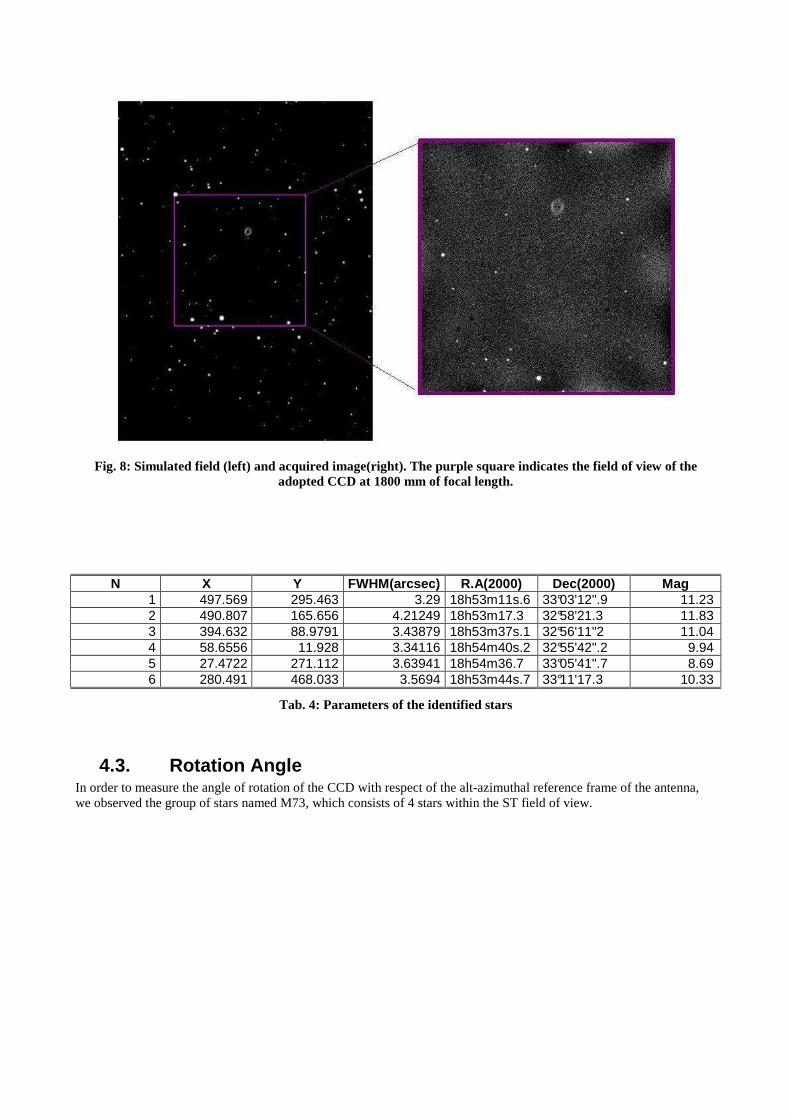
Fig. 8: Simulated field (left) and acquired image(right). The purple square indicates the field of view of the adopted CCD at 1800 mm of focal length.
N X Y FWHM(arcsec) R.A(2000) Dec(2000) Mag
1 497.569 295.463 3.29 18h53m11s.6 33°03'12".9 11.23 2 490.807 165.656 4.21249 18h53m17.3 32°58'21.3 11.83 3 394.632 88.9791 3.43879 18h53m37s.1 32°56'11"2 11.04 4 58.6556 11.928 3.34116 18h54m40s.2 32°55'42".2 9.94 5 27.4722 271.112 3.63941 18h54m36.7 33°05'41".7 8.69 6 280.491 468.033 3.5694 18h53m44s.7 33°11'17.3 10.33
Tab. 4: Parameters of the identified stars
4.3. Rotation Angle In order to measure the angle of rotation of the CCD with respect of the alt-azimuthal reference frame of the antenna, we observed the group of stars named M73, which consists of 4 stars within the ST field of view.
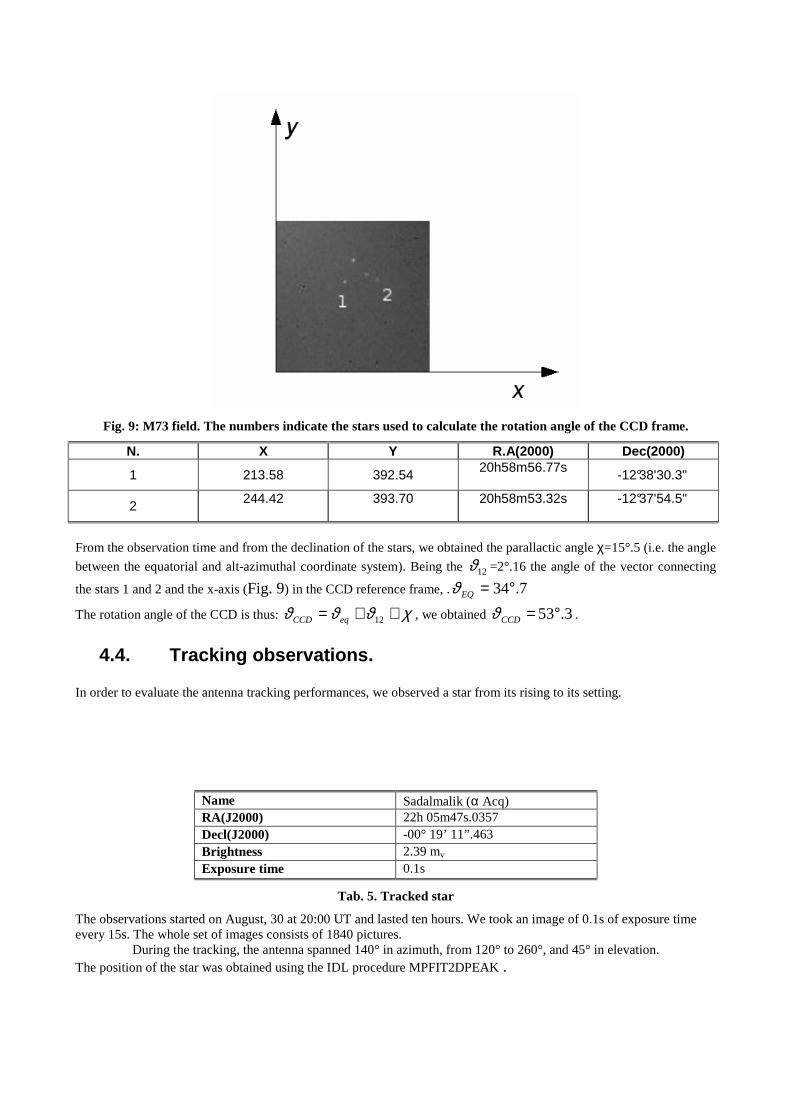
Fig. 9: M73 field. The numbers indicate the stars used to calculate the rotation angle of the CCD frame.
N. X Y R.A(2000) Dec(2000)
1 213.58 392.54 20h58m56.77s
-12°38'30.3"
2 244.42
393.70
20h58m53.32s
-12°37'54.5"
From the observation time and from the declination of the stars, we obtained the parallactic angle χ=15°.5 (i.e. the angle
between the equatorial and alt-azimuthal coordinate system). Being the 12ϑ =2°.16 the angle of the vector connecting
the stars 1 and 2 and the x-axis (Fig. 9) in the CCD reference frame, . 7.34°=EQϑ
The rotation angle of the CCD is thus: χϑϑϑ ++= 12eqCCD , we obtained 3.53°=CCDϑ .
4.4. Tracking observations. In order to evaluate the antenna tracking performances, we observed a star from its rising to its setting.
Name Sadalmalik (α Acq) RA(J2000) 22h 05m47s.0357 Decl(J2000) -00° 19’ 11”.463 Brightness 2.39 mv Exposure time 0.1s
Tab. 5. Tracked star
The observations started on August, 30 at 20:00 UT and lasted ten hours. We took an image of 0.1s of exposure time every 15s. The whole set of images consists of 1840 pictures.
During the tracking, the antenna spanned 140° in azimuth, from 120° to 260°, and 45° in elevation. The position of the star was obtained using the IDL procedure MPFIT2DPEAK .
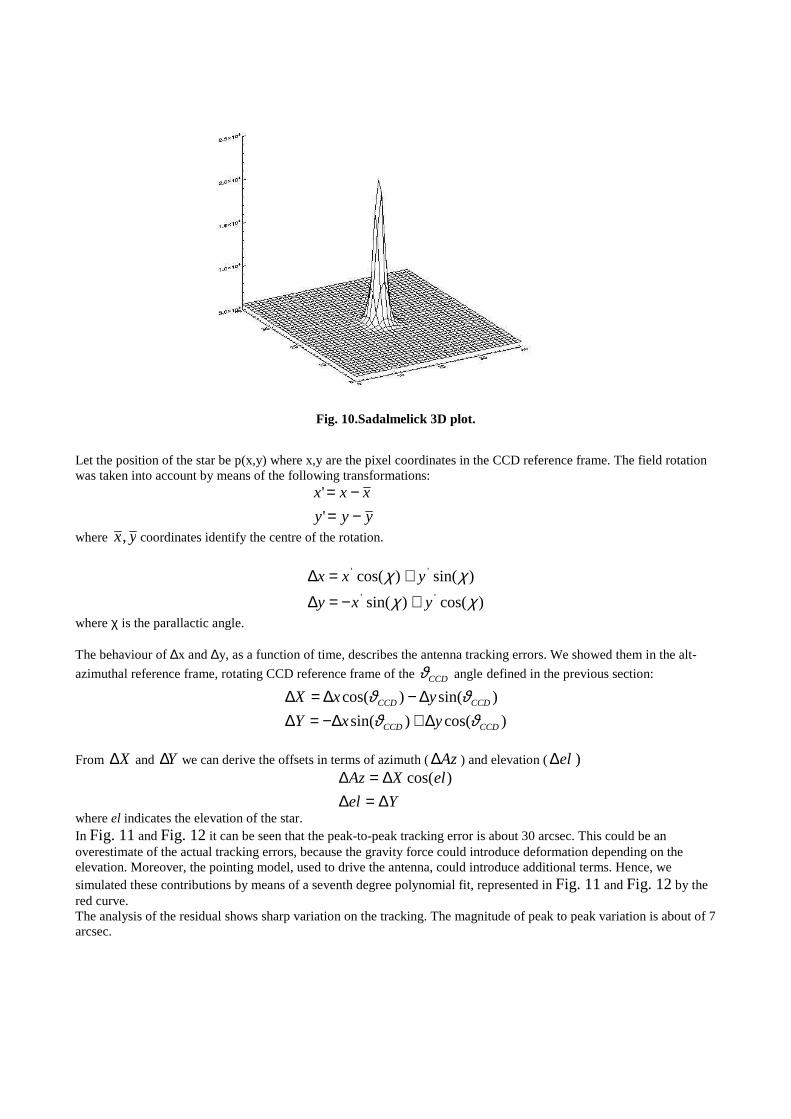
Fig. 10.Sadalmelick 3D plot.
Let the position of the star be p(x,y) where x,y are the pixel coordinates in the CCD reference frame. The field rotation was taken into account by means of the following transformations:
yyy
xxx
−=−=
'
'
where yx, coordinates identify the centre of the rotation.
)cos()sin(
)sin()cos(''
''
χχχχ
yxy
yxx
+−=∆+=∆
where χ is the parallactic angle. The behaviour of ∆x and ∆y, as a function of time, describes the antenna tracking errors. We showed them in the alt-
azimuthal reference frame, rotating CCD reference frame of the CCDϑ angle defined in the previous section:
)cos()sin(
)sin()cos(
CCDCCD
CCDCCD
yxY
yxX
ϑϑϑϑ
∆+∆−=∆∆−∆=∆
From X∆ and Y∆ we can derive the offsets in terms of azimuth (Az∆ ) and elevation ( el∆ )
Yel
elXAz
∆=∆∆=∆ )cos(
where el indicates the elevation of the star. In Fig. 11 and Fig. 12 it can be seen that the peak-to-peak tracking error is about 30 arcsec. This could be an overestimate of the actual tracking errors, because the gravity force could introduce deformation depending on the elevation. Moreover, the pointing model, used to drive the antenna, could introduce additional terms. Hence, we simulated these contributions by means of a seventh degree polynomial fit, represented in Fig. 11 and Fig. 12 by the red curve. The analysis of the residual shows sharp variation on the tracking. The magnitude of peak to peak variation is about of 7 arcsec.
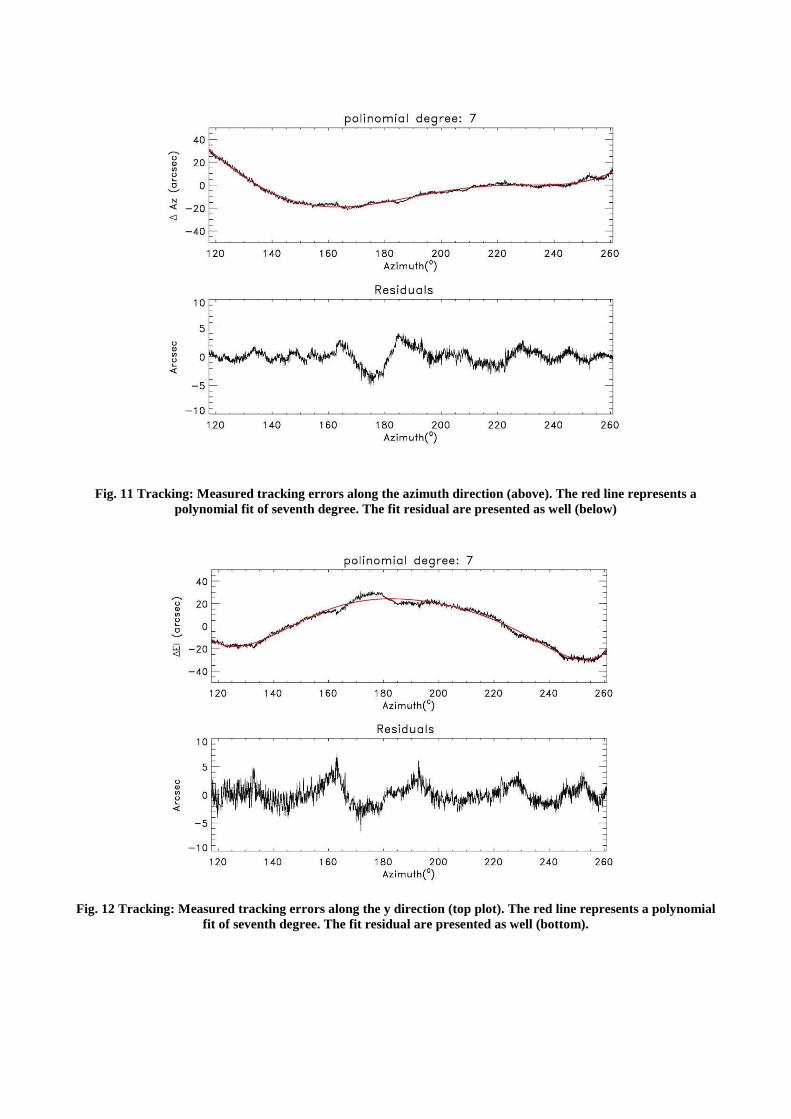
Fig. 11 Tracking: Measured tracking errors along the azimuth direction (above). The red line represents a polynomial fit of seventh degree. The fit residual are presented as well (below)
Fig. 12 Tracking: Measured tracking errors along the y direction (top plot). The red line represents a polynomial
fit of seventh degree. The fit residual are presented as well (bottom).
Rail (August 2006)
-10
-5
0
5
10
120 130 140 150 160 170 180 190 200 210 220 230 240 250 260azimuth (°)
Incl
inom
eter
s (A
rcse
c)EL
XEL
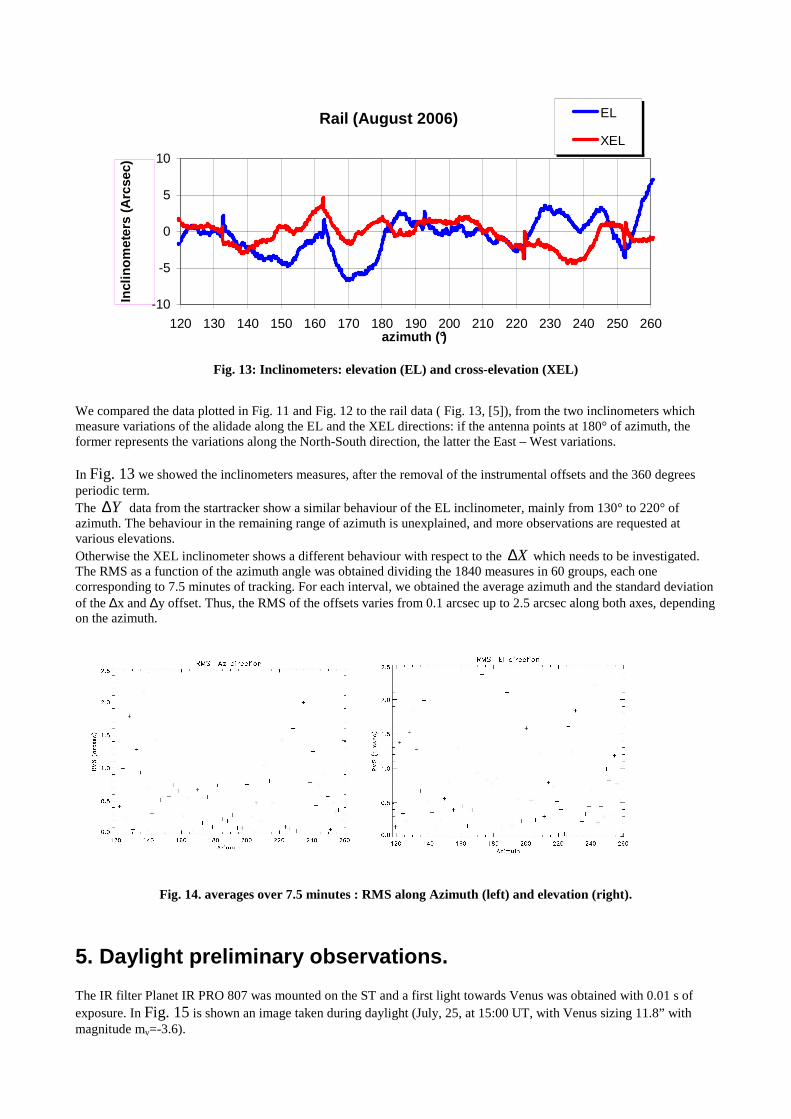
Fig. 13: Inclinometers: elevation (EL) and cross-elevation (XEL)
We compared the data plotted in Fig. 11 and Fig. 12 to the rail data ( Fig. 13, [5]), from the two inclinometers which measure variations of the alidade along the EL and the XEL directions: if the antenna points at 180° of azimuth, the former represents the variations along the North-South direction, the latter the East – West variations. In Fig. 13 we showed the inclinometers measures, after the removal of the instrumental offsets and the 360 degrees periodic term. The Y∆ data from the startracker show a similar behaviour of the EL inclinometer, mainly from 130° to 220° of azimuth. The behaviour in the remaining range of azimuth is unexplained, and more observations are requested at various elevations. Otherwise the XEL inclinometer shows a different behaviour with respect to the X∆ which needs to be investigated. The RMS as a function of the azimuth angle was obtained dividing the 1840 measures in 60 groups, each one corresponding to 7.5 minutes of tracking. For each interval, we obtained the average azimuth and the standard deviation of the ∆x and ∆y offset. Thus, the RMS of the offsets varies from 0.1 arcsec up to 2.5 arcsec along both axes, depending on the azimuth.
Fig. 14. averages over 7.5 minutes : RMS along Azimuth (left) and elevation (right).
5. Daylight preliminary observations. The IR filter Planet IR PRO 807 was mounted on the ST and a first light towards Venus was obtained with 0.01 s of exposure. In Fig. 15 is shown an image taken during daylight (July, 25, at 15:00 UT, with Venus sizing 11.8” with magnitude mv=-3.6).
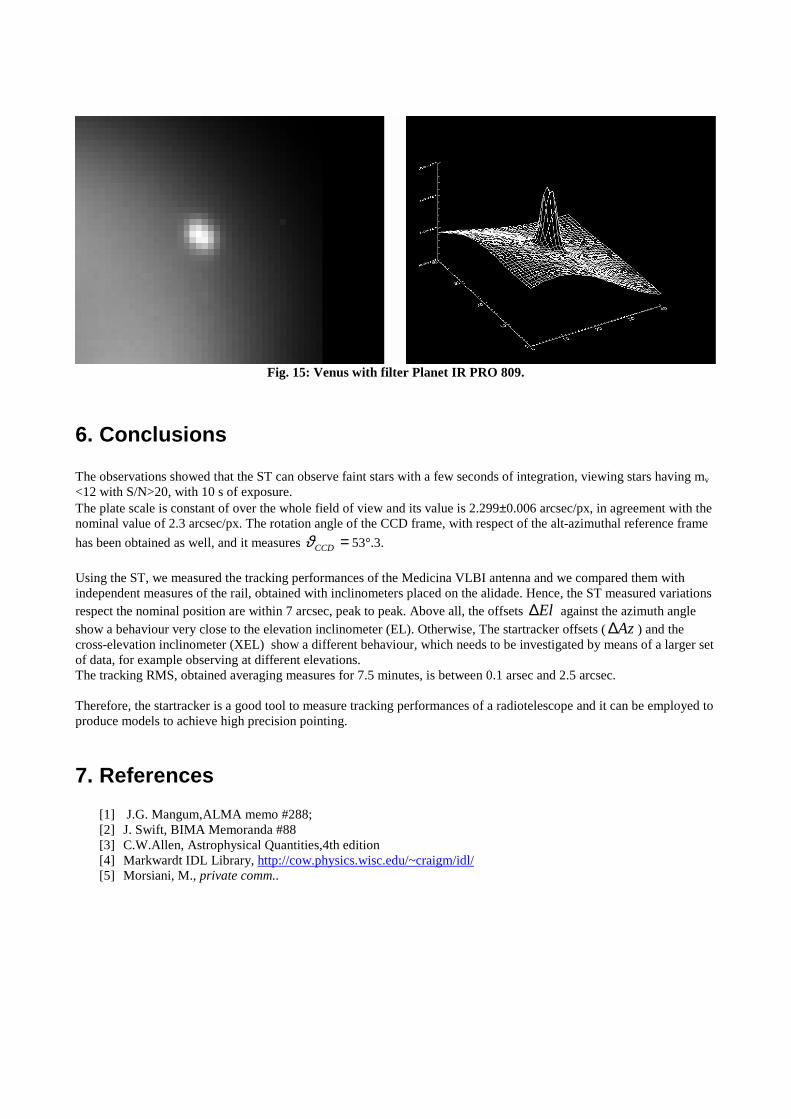
Fig. 15: Venus with filter Planet IR PRO 809.
6. Conclusions The observations showed that the ST can observe faint stars with a few seconds of integration, viewing stars having mv
<12 with S/N>20, with 10 s of exposure. The plate scale is constant of over the whole field of view and its value is 2.299±0.006 arcsec/px, in agreement with the nominal value of 2.3 arcsec/px. The rotation angle of the CCD frame, with respect of the alt-azimuthal reference frame
has been obtained as well, and it measures =CCDϑ 53°.3.
Using the ST, we measured the tracking performances of the Medicina VLBI antenna and we compared them with independent measures of the rail, obtained with inclinometers placed on the alidade. Hence, the ST measured variations respect the nominal position are within 7 arcsec, peak to peak. Above all, the offsets El∆ against the azimuth angle show a behaviour very close to the elevation inclinometer (EL). Otherwise, The startracker offsets (Az∆ ) and the cross-elevation inclinometer (XEL) show a different behaviour, which needs to be investigated by means of a larger set of data, for example observing at different elevations. The tracking RMS, obtained averaging measures for 7.5 minutes, is between 0.1 arsec and 2.5 arcsec. Therefore, the startracker is a good tool to measure tracking performances of a radiotelescope and it can be employed to produce models to achieve high precision pointing.
7. References [1] J.G. Mangum,ALMA memo #288; [2] J. Swift, BIMA Memoranda #88 [3] C.W.Allen, Astrophysical Quantities,4th edition [4] Markwardt IDL Library, http://cow.physics.wisc.edu/~craigm/idl/ [5] Morsiani, M., private comm..


![Marco Molinaro Astronomical Data Center Forum 10-11 June ...g-vo.org/cosadie-dcforum/slides/MarcoMolinaro_HowPublishVO.pdf · 6/10/2013 · Marco Molinaro [INAF-OATs IA2] – Astronomical](https://img.pdfslide.net/doc/110x75/60e0767770a05a1578022927/marco-molinaro-astronomical-data-center-forum-10-11-june-g-voorgcosadie-dcforumslidesmarcomolinaro.jpg)