Embed Size (px)
Citation preview

1
INCIDENCE MEASURES OVERVIEW
Monday January 7, 2019 12:00 PM – 1:00pm Central
Presenters: Dana P. Edelson, MD, MS
Jeanette Previdi, MPH, BSN, RN, CPPSChristina Sterzing, RHIA

2
Dana Edelson, MD, MS, FAHA, FHM - DisclosuresHospitalist & Executive Medical Director For Rescue Care, University Of Chicago
Research support:• Philips Healthcare• Early SenseOwnership interests:• Founder and CEO, QuantHC• Patent pending, ARCD.P0535US.P2
Meet Our Presenters
Patient Safety and Quality AdvisorPatient Safety and Quality Department
Jeanette Previdi, MPH, BSN, RN, CPPS
Healthcare Data ManagerAmerican Heart Association
Christina Sterzing, RHIA
3
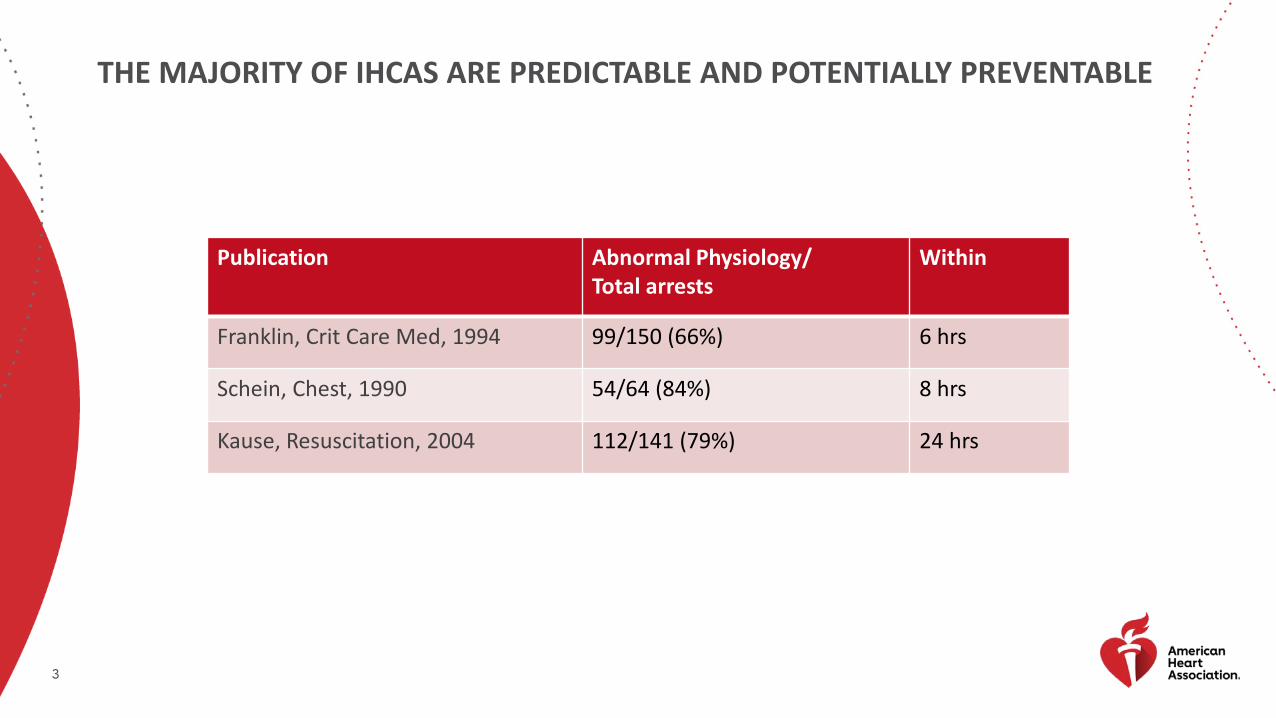
THE MAJORITY OF IHCAS ARE PREDICTABLE AND POTENTIALLY PREVENTABLE
Publication Abnormal Physiology/Total arrests
Within
Franklin, Crit Care Med, 1994 99/150 (66%) 6 hrs
Schein, Chest, 1990 54/64 (84%) 8 hrs
Kause, Resuscitation, 2004 112/141 (79%) 24 hrs

4Part 4: Systems of Care and Continuous Quality Improvement, Volume: 132, Issue: 18_suppl_2, Pages: S397-S413, DOI: (10.1161/CIR.0000000000000258)
PREVENTION LINK ADDED TO IHCA CHAIN OF SURVIVAL IN 2015

5
MEASURING OUTCOMES OF IHCA IS NOT ENOUGHIHCA INCIDENCE RATES ARE INVERSELY CORRELATED WITH SURVIVAL RATES
FACTORS SHOWN TO IMPACT IHCA INCIDENCE INCLUDE:
• NURSE-BED STAFFING RATIOS
• ICU BED AVAILABILITY
• OTHER PATIENTS DETERIORATING NEARBY
• RAPID RESPONSE ACTIVATIONSJones D, et al. Critical Care 2005, 9:R808-R815
Chen L, et al. JAMA Intern Med. 2013;173(13):1186-1195.
Town J, et al. Crit Care Med. 2014 Sep;42(9):2037-41.
Volchenboum S et al, JAMA. 2016;316(24):2674-2675.

6Date of download: 1/7/2019 Copyright © 2013 American Medical
Association. All rights reserved.
JAMA Intern Med. 2013;173(13):1186-1195. doi:10.1001/jamainternmed.2013.1026
HOSPITAL VARIATION IN IHCA INCIDENCEGWTG-R DATA
Median: 4.02 / 1000 admissions (IQR 2.95-5.65)

7
REGIONAL DISTRIBUTION OF IHCA BY STATE NATIONAL INPATIENT SAMPLE DATA
Circulation. 2015;131:1415-1425. DOI: 10.1161/CIRCULATIONAHA.114.014542.
Overall incidence:2.85 IHCAs / 1000 admissions

8
IHCA INCIDENCE VARIATION BY YEARGWTG-R + ANNUAL SURVEY DATA
Crit Care Med. 2011 November ; 39(11): 2401–2406. doi:10.1097/CCM.0b013e3182257459.
Mean IHCA event rate:9.2 / 10,000 bed-days (IQR 5.8 to 12 / 1000)

9
MEASURING INCIDENCE OF IHCA
NUMERATOR CONSIDERATIONS
• Billed vs reported
• Index vs all
• Include vs exclude: DNAR, staff/visitors, ED, ambulatory/observation
DENOMINATOR CONSIDERATIONS
• Admissions vs patient days
• Include vs exclude: DNAR, staff/visitors, ED, ambulatory/observation

10
MEASURING INCIDENCE: TOP CANDIDATES
INDEX IHCA / 1000 ADMISSIONS (OPTION)
• Most commonly reported measure
• Ignores multiple arrests in one patient
• Noise created by ICU and pediatric admissions and variations in length of stay
IHCA /10,000 HOSPITALIZED DAYS (PREFERRED)
• Allows for more than one per patient
• Allows measurement by specific populations: ward, pediatrics, etc
• Similar to how Clostridium Difficile rates are measured

11
PROPOSED OUTCOME MEASURE: WARD CARDIAC ARREST RATETHIRD INTERNATIONAL CONSENSUS CONFERENCE ON RAPID RESPONSE SYSTEMS AND MEDICAL EMERGENCY TEAMS
NUMERATOR: NON-ICU, NON-PROCEDURAL IHCA
DENOMINATOR: 10,000 ADULT WARD DAYS
INCLUSIONS: STEP-DOWN/HDU, OBSERVATION PATIENTS/DAY CASES, WARD PATIENTS IN DIAGNOSTIC AREAS. NUMERATOR INCLUDES NON DNR PATIENTS FOUND DEAD IN BED.
EXCLUSIONS: ALL ICU PATIENTS REGARDLESS OF LOCATION (EG DIAGNOSTIC AREA). ALL ARRESTS OCCURRING IN AN OR, ER, PACU, CATH LAB, OR OTHER PROCEDURAL AREA, REGARDLESS OF ADMISSION STATUS. OUTPATIENTS/VISITORS/EMPLOYEES. EXCLUDES DNR DEATHS.
LEVEL: ESSENTIAL
Presented at the 15th iSRRS Conference, Bolonga, Italy, July 2018

12
COMPARING METRICSVIZIENT MEMBER SURVEY [N=49]
Measure Median Rate (IQR)
Billed IHCA / 1,000 admissions 5.86 (4.42 – 6.88)
Billed IHCA / 10,000 total patient days 9.85 (7.75 – 12.3)
Reported Ward IHCA / 10,000 ward days 4.46 (2.46 – 7.21)

13
CALL TO ACTION: Setting National Accreditation Standards For Cardiac Arrest For Hospital And Healthcare Systems
Jeanette Previdi, MPH, BSN, RN, CPPS

14
2015 IOM REPORTSTRATEGIES TO IMPROVE CARDIAC ARREST SURVIVAL - A TIME TO ACT
“THE IOM COMMITTEE RECOMMENDS THAT A NATIONAL REGISTRY BE ESTABLISHED TO TRACK CARDIAC ARREST EVENTS AND MAKE INFORMATION ABOUT CARDIAC ARREST INCIDENCE AND OUTCOMES PUBLICLY AVAILABLE.
THIS WOULD HELP INCREASE PUBLIC AWARENESS RELATED TO CARDIAC ARREST, IMPROVE ACCOUNTABILITY FOR EMS SYSTEM AND HEALTH CARE SYSTEM PERFORMANCE, AND PINPOINT INTERVENTIONS THAT CAN BEST IMPROVE THE PUBLIC’S HEALTH.
FURTHERMORE, A STANDARD SET OF DEFINITIONS AND DATA ELEMENTS ACROSS LOCAL, STATE, NATIONAL, AND INTERNATIONAL LINES WOULD HELP TO REDUCE UNNECESSARY CONFUSION IN AN ALREADY COMPLEX FIELD.“

15
WHY SET NATIONAL ACCREDITATION STANDARDS FOR CARDIAC ARREST FOR HOSPITAL & HEALTH CARE SYSTEMS?
To Respond To The Institute Of Medicine (IOM) Report – “Strategies To Improve Cardiac Arrest Survival: A Time To Act (2015)”
• Recommendation #4: Set National Accreditation Standards for Cardiac Arrest for Hospital and Health Care Systems
To Help Achieve The American Heart Association’s Emergency Cardiovascular Care (ECC) Committee’s 10-year Goal For Doubling Out-of-hospital (OHCA) And In-hospital (IHCA) Cardiac Arrest Survival
• Incidence of IHCA is approximately 209,000 people per year in U.S. with mean event rate of 0.92/1000 bed days
• IHCA survival is low and ranges from 19 - 38%• (Merchant RM et al. Incidence of treated cardiac arrest in hospitalized patients in the United
States. Crit Care Med. 2011;39:2401-2406)
To Better Identify Disparities And Highlight Improvement Opportunities For IHCA Survival
• Measurement & reporting of key metrics are essential in order to benchmark care, address challenges of resuscitation and highlight opportunities for improvement

16
WHY SET NATIONAL ACCREDITATION STANDARDS FOR CARDIAC ARREST FOR HOSPITAL & HEALTH CARE SYSTEMS?
Mandatory Reporting Of Certain Process Measures (I.E. AMI And CHF Core Measures) And Outcome Measures (I.E. Mortality, Readmissions, Patient Safety Indicators And Hospital-acquired Conditions) Have Lead To Vast Improvements Over Time, Especially When Tied Into Public Reporting and/or Financial Penalties
• Voluntary reporting of IHCA data is low across the United States (ex. <10% of hospitals report cardiac arrest data to GWTG-Resuscitation)
• There are no financial or quality incentives for hospitals to report cardiac arrest data

17
WHY SET NATIONAL ACCREDITATION STANDARDS FOR CARDIAC ARREST FOR HOSPITAL & HEALTH CARE SYSTEMS?
Cardiac Arrest Survival Is Generally Higher When It Occurs In The Critical Care Setting, Yet In-hospital Cardiac Arrests Outside An ICU Setting Occur Approximately 33% Of The Time In Adult Patients And 5% Of The Time In Pediatric Patients
• Location of cardiac arrest and many other important metrics are not part of any mandatory cardiac arrest reporting requirements
• A number of early warning scores are available to help identify adult and pediatric patients at risk for deterioration
• It is important to understand the IHCA event rate in terms of arrests that are not inevitable and are preventable
• There may be financial and quality of life burdens associated with poor neurological outcomes after resuscitation in less than ideal settings

18
WHY SET NATIONAL ACCREDITATION STANDARDS FOR CARDIAC ARREST FOR HOSPITAL & HEALTH CARE SYSTEMS?
Presence Of Advance Directives and/or Do-Not-Resuscitate (DNR) Orders May Decrease Incidence Of Resuscitation When Not Appropriate
• The inclusion of an advance directive in the hospital medical record, even if one does exist, is low
• Presence of advance directives and/or DNR orders are not included as part of any mandatory cardiac arrest reporting requirements
• There may be financial and quality of life burdens associated with poor outcomes after resuscitative efforts in patients for whom resuscitation may have been inappropriate and/or against their wishes

19
CURRENT STATE
NATIONAL DATA EXISTS FOR OUT OF HOSPITAL ARREST (OHCA)
• Cardiac Arrest Registry to Enhance Survival (CARES)
• Resuscitation Outcomes Consortium (ROC)
• Participation is voluntary, of limited scope and primarily a research tool

20
CURRENT STATE• Get With The Guidelines™ (GWTG) registry
captures limited and partial data
• Unknown number of hospitals and hospital systems collect resuscitation data
• No centralized data
• No standardized measures

21
FUTURE STATE
• Standardized measures
• All Hospitals and Health Systems aggregate, analyze, and report data
• Clinicians use data to prevent cardiac arrest
• Incidence of Cardiac Arrest decreases

22
AFTER ALL, ISN’T CARDIAC ARREST THE ULTIMATE POTENTIALLY PREVENTABLE HOSPITAL-ACQUIRED CONDITION?
22
LET’S WORK TOGETHER TO SET NATIONAL ACCREDITATION STANDARDS FOR CARDIAC ARREST.
LET’S GIVE HOSPITALS & HEALTH CARE SYSTEMS THE TOOLS THEY NEED TO BE ABLE TO:
• Identify opportunities for improvement
• Benchmark themselves against high performing organizations across the country
• Make a difference in improving survival from in-hospital cardiac arrest!
Call to Action

23 23
THEY ARE COUNTING ON YOU!
http://www.heart.org

24
Thank you for all that you do to improve the quality of care for our
patients!
24

25
PMT OVERVIEWChristina Sterzing, RHIA

26
REPORTS OVERVIEW
• Annual incidence of adult in-hospital cardiac arrests occurring in a non-critical care area per 10,000 adult non-critical bed days.
• Annual incidence of pediatric in-hospital cardiac arrests occurring in a non-critical care area per 10,000 pediatric non-critical bed days.
• Annual incidence of adult in-hospital cardiac arrests occurring in a critical care area per 10,000 adult critical bed days.
• Annual incidence of in-hospital cardiac arrests occurring in a critical care area per 10,000 pediatric and neonatal critical care bed days stratified by the following populations:
• Pediatric <=1-18• Neonate >=24 hours - <1• Newly born<24 hours and born this admission

27
ADDITIONAL INFORMATION
Data entry is optional for the 2019 recognition submission
period. We are considering making this a requirement for Get
With The Guidelines-Resuscitation Recognition going forward.
Data for the previous year should be entered by February 15,
2019.
See webinar handouts for a printable CRF and data definitions.
Data will be preserved year over year for Contiguous Reporting

28
WHERE TO ENTER DATA IN THE PMT
ON THE COMMUNITY PAGE, SCROLL DOWN TO “MY
HOSPITAL CHARACTERISTICS”.
CLICK ON “UPDATE RESUS SITE CHARACTERISTICS”.

29
WHERE TO ENTER DATA IN THE PMT (CONT.)
ON THE SITE CHARACTERISTICS
FORM, SCROLL DOWN TO “IHCA”
MAKE SURE YOU “SAVE CHANGES”

30
HOW TO FIND THE DATA DEFINITIONS IN THE PMT
DATA DEFINITIONS ARE LOCATED IN THE CODING INSTRUCTIONS.
ON THE PATIENT GRID, CLICK ON “CODING INSTRUCTIONS”
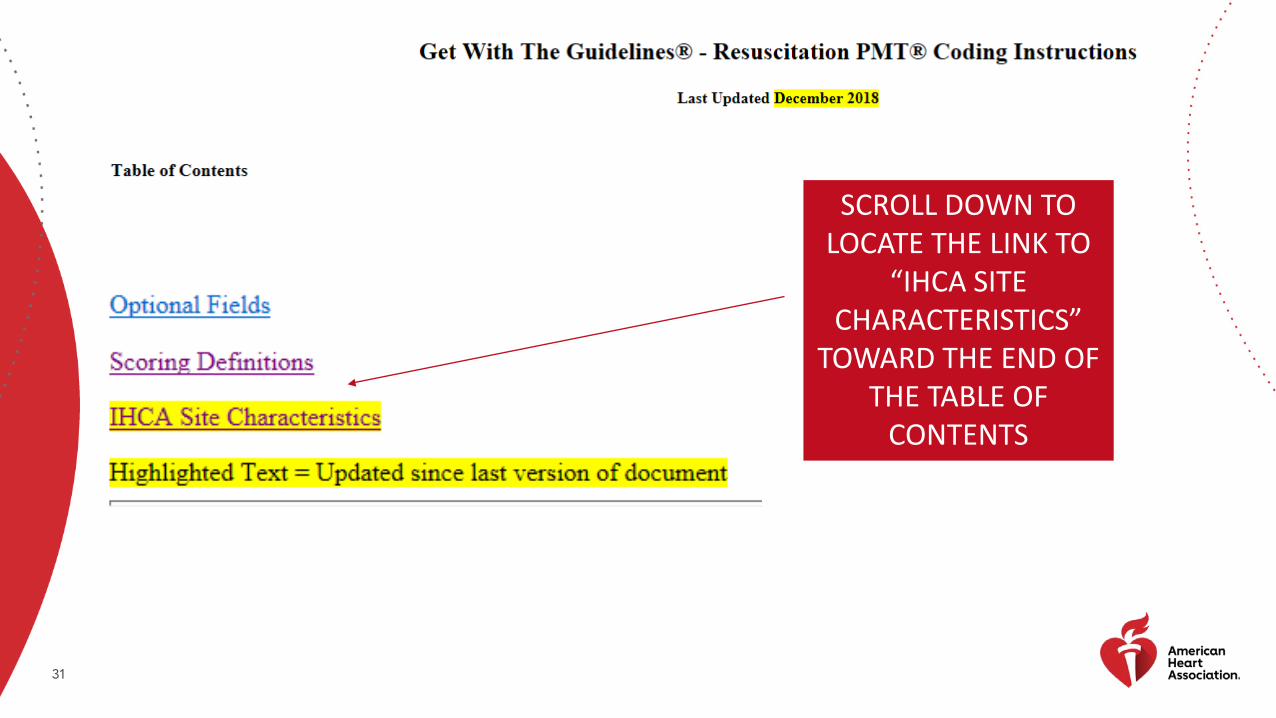
31
SCROLL DOWN TO LOCATE THE LINK TO
“IHCA SITE CHARACTERISTICS”
TOWARD THE END OF THE TABLE OF
CONTENTS

32
DATA DEFINITIONS
• Note: all inpatients and observation patients should be included.
• Med/surg bed days: the number of occupied bed days in the adult med/surg units (non-procedural, non-critical, and licensed beds) January 1 through December 31.
• Ped ward bed days: the number of occupied bed days in all pediatric med/surg units (non-procedural, non-critical, and licensed beds) January 1 through December 31.
• Total adult admissions: enter the total adult admissions from January 1 through December 31 for patients 18 years or older.
• Total ped admissions: enter the total pediatric (patients >=1 year old to <18 years old) admissions from January 1 through December 31.

33
• Total neonate/infant admissions: Enter the total neonate/infant (patients >24 hours old to <1 years old) admissions from January 1 through December 31.
• Total newly born admissions: Enter the total newly born (born this admission or <24hrs old) admissions from January 1 through December 31.
• Adult ICU bed days: The number of occupied bed days in the all Adult Intensive Care Units from January 1 through December 31.
• Ped ICU bed days: The number of occupied bed days in all Pediatric Intensive Care Units from January 1 through December 31.
• NICU (neonatal intensive care unit) bed days: The number of occupied bed days in all Neonatal Intensive Care Units from January 1 through December 31.
DATA DEFINITIONS (CONT.)

34
Start with your Finance Office Other departments to contact: Quality and/or Nursing Departments CFO or Finance Office VP Quality CNO Office Administration Business Intelligence (BI)
WHERE CAN YOU FIND OCCUPIED BED DAYS AND ADMISSIONS INFORMATION?

35
EXAMPLES
The finance department may maintain this as a standard report provided to each unit for budgeting purposes.
This information is provided by Unit Managers via the midnight census to Administration.
In some institutions, this information may have been developed by HIM as part of their overall finance and billing.

36
Tanya Lane Truitt, RN MS
Senior Manager QSI Programs & Operations: Resuscitation & HF
Get With The Guidelines®
Liz OlsonProgram Manager, Get With The Guidelines – Resuscitation & [email protected]
CONTACT US TO LEARN MORE
37
Thank You For Your Active Participation and Contributions to
Get With The Guidelines-Resuscitation!
1/7/2019©2010, American Heart Association