Embed Size (px)
Citation preview

INCIDENT MANAGEMENT PERFORMANCE MEASURES
By
Kevin N. Balke, Ph.D., P.E. TransLink® Research Center Director
David W. Fenno, P.E. Assistant Research Engineer
and
Brooke Ullman
Associate Transportation Researcher
Sponsored by: Federal Highway Administration U.S. Department of Transportation
Contract Number: DTFH61-01-C-000182
November 2002
TEXAS TRANSPORTATION INSTITUTE The Texas A&M University System
College Station, TX 77843-3135


iii
DISCLAIMER The contents of this report reflect the views of the authors, who are responsible for the facts and the accuracy of the data presented herein. The contents do not necessarily reflect the official view or policies of the Federal Highway Administration (FHWA). This report does not constitute a standard, specification, or regulation. The engineer in charge was Kevin N. Balke, Ph.D, P.E., (Texas, #66529).

iv
ACKNOWLEDGMENTS The project team would like to acknowledge the following individuals for contributing information and their time to this project:
• Sgt. A.W. Bowdoin, Sheriff Office, Harris County, Texas • Jeff Galas, Traffic Systems Center Manager, Illinois Department of Transportation • Matt Volz, ITS Coordinator, Kansas Department of Transportation • Farouk Aboukar, District ITS Engineer, Ohio Department of Transportation • Ron Perry, Research Director, Fire Department, Phoenix, Arizona • Rod Mead, Operations Manager, Colorado Department of Transportation • Dan Howard, Senior Operations Manager, New York Department of Transportation • J. Thomas Bruff, Engineering Coordinator, Southeast Michigan Council of Governments • Jim Hogan, Traffic Operations Manager, New Jersey Department of Transportation • Juanita Lowe, Public Relations Coordinator, Kansas Department of Transportation • Jeanette Rash, President, Incident Management Services • B.J. Lowery, Police Department, Houston, Texas • Bill Jacobs, Incident Management Director, Tennessee Department of Transportation • Jill Greene, Operator, Arizona Department of Transportation • Charles Manuel, Emergency Management Services Coordinator, Arizona Department of
Transportation • James Mona, Supervising Engineer, Connecticut Department of Transportation • Carlton Allen, Freeway Operation Supervisor, Houston District, Texas Department of
Transportation • Pat Irwin, Director of Traffic Operations, San Antonio District, Texas Department of
Transportation • Brian Burk, Traffic Engineer, Austin District, Texas Department of Transportation • Turbell Martin, TMC Branch Chief, District 11, California Department of Transportation • Nick Thompson, Metro Division, Office of Traffic Engineering, Minnesota Department
of Transportation • Alvin Marquess, Operations Manager, Maryland State Highway Administration • Rob Stone, State Incident Management Engineer, North Carolina Department of
Transportation • Paul King, TMC Traffic Engineer, District 12, California Department of Transportation
The authors would also like to thank David Helman with the Federal Highway Administration, U.S. Department of Transportation for his technical guidance and support throughout this project.

v
TABLE OF CONTENTS LIST OF FIGURES ...................................................................................................................... vii LIST OF TABLES........................................................................................................................ vii SECTION 1. INTRODUCTION AND BACKGROUND............................................................. 1
OBJECTIVES............................................................................................................................. 1 SCOPE ........................................................................................................................................ 2 METHODOLOGY ..................................................................................................................... 2 ORGANIZATION OF REPORT................................................................................................ 2
SECTION 2. REVIEW OF LITERATURE .................................................................................. 3 WHAT IS AN INCIDENT?........................................................................................................ 3
Transportation Perspective...................................................................................................... 3 Emergency Services Perspective ............................................................................................ 3
CLASSIFICATION OF INCIDENTS........................................................................................ 4 Transportation Perspective...................................................................................................... 4 Emergency Services Perspective ............................................................................................ 5
PERFORMANCE MEASURES................................................................................................. 5 Transportation Perspective...................................................................................................... 5 Emergency Services Perspective ............................................................................................ 8
COLLECTION AND STORAGE OF INCIDENT MANAGEMENT DATA .......................... 9 Transportation Perspective...................................................................................................... 9 Emergency Services Perspective ............................................................................................ 9
STANDARD OPERATING PROCEDURES .......................................................................... 15 Transportation Perspective.................................................................................................... 15 Emergency Services Perspective .......................................................................................... 18
SECTION 3. SURVEY OF INCIDENT RESPONDERS ........................................................... 19 METHODOLOGY ................................................................................................................... 19 RESPONSE RATE ................................................................................................................... 20 FINDINGS................................................................................................................................ 20
Definition of Incident............................................................................................................ 20 Classification Of Incidents.................................................................................................... 21 Information Collected Per Incident....................................................................................... 24 Collection and Retention of Incident Data............................................................................ 32 Incident Management Performance Measures...................................................................... 36 Operational Definition of Incident Management Performance Measures ............................ 36 Origins of Performance Measures ........................................................................................ 41 Costs of Generating Performance Measures......................................................................... 43 Incident Management Performance Reports......................................................................... 43 Integration of Incident Records and Information.................................................................. 47 Issues Involved in Establishing an Incident Management System ....................................... 48 Most Important Things To Be Measured in Incident Management Program....................... 53
SECTION 4. SUMMARY AND RECOMMENDATIONS....................................................... 55 SUMMARY OF FINDINGS .................................................................................................... 55 RECOMMENDATIONS.......................................................................................................... 56 SUGGESTIONS FOR FUTURE RESEARCH........................................................................ 58

vi
REFERENCES ............................................................................................................................. 60 APPENDIX A. RADIO DISPATCH CODES FROM SELECT LAW ENFORCEMENT AND EMERGENCY RESPONSE AGENCIES .......................................................................... 62
A-1. REVISED OFFICIAL APCO TEN SIGNALS ............................................................... 63 A-2. CALIFORNIA HIGHWAY PATROL RADIO CODES ................................................ 64 A-3. DALLAS PD RADIO SIGNAL CODES........................................................................ 65 A-4. F.D.N.Y. RADIO CODES............................................................................................... 66
APPENDIX B. SAMPLE PERFORMANCE MEASURE REPORTS PRODUCED BY MINNESOTA DEPARTMENT OF TRANSPORTATION ........................................................ 71
B - 1 . SAMPLE OF DAILY INCIDENT MANAGEMENT PERFORMANCE REPORT USED BY MNDOT.................................................................................................................. 72 B- 2. SAMPLE OF MONTHLY INCIDENT MANAGEMENT PERFORMANCE REPORT PRODUCED BY MNDOT....................................................................................................... 73 B - 3. SAMPLE OF YEARLY INCIDENT MANAGEMENT PERFORMANCE REPORT PRODUCED BY MNDOT....................................................................................................... 75
APPENDIX C. SAMPLE PERFORMANCE MEASURE REPORTS PRODUCED BY MOTORIST ASSISTANCE PROGRAM IN HOUSTON, TX. .................................................. 78 APPENDIX D. INCIDENT MANAGEMENT PERFORMANCE MEASURE SURVEY ....... 84

vii
LIST OF FIGURES Figure 1. Sample Incident Logging Screen from Freeway Management Software Used
in Texas................................................................................................................................ 11 Figure 2. Log Showing Typical Incident Management Information Logged by
Service Patrols. ..................................................................................................................... 13 Figure 3. Sample of Typical Operator Screen Commonly Used in Computer Aided Dispatch
Systems. ................................................................................................................................ 14 Figure 4. Incident Report Form for Logging Information in National Fire Incident Reporting
System................................................................................................................................... 14
LIST OF TABLES Table 1. Definition of Incident by Survey Respondents.............................................................. 22 Table 2. Criteria Used to Categorize Incidents and How It Effects Incident Response .............. 25 Table 3. Information Collected About Each Incident Event........................................................ 29 Table 4. Collection and Storage Methods, Retention, and Integration Policies of Incident
Information ........................................................................................................................... 33 Table 5. Typical Performance Measure Routinely Computed by Agencies................................ 37 Table 6. Operational Definition of Performance Measures Used to Evaluate Response
Systems ................................................................................................................................. 39 Table 7. Origin of Operational Definition for Performance Measures Being Used .................... 42 Table 8. Other Performance Measures Not Currently Being Collected, but Desirable............... 42 Table 9. Estimated Cost for Collecting, Processing, and Reporting Performance Measures...... 43 Table 10. Aggregation Level of Performance Reports ................................................................ 44 Table 11. Frequency at Which Performance Measures Reported................................................ 45 Table 12. Uses for Performance Measure Reports ...................................................................... 46 Table 13. Timeliness, Usefulness, and Accuracy of Incident Management Performance
Measures ............................................................................................................................... 47 Table 14. Other Sources of Incident Information in Jurisdiction ................................................ 49 Table 15. Integration of Incident Information with Other Agencies ........................................... 50 Table 16. Issues Faced in Setting Up Incident Management System.......................................... 52 Table 17. Most Important Thing to Measure in Incident Management Program ........................ 54

1
SECTION 1. INTRODUCTION AND BACKGROUND Incidents continue to be a major source of congestion on freeways. Because of the significance of incidents on traffic operations, law enforcement, emergency service providers, and transportation agencies are banning together in many metropolitan areas in the United States to practice “incident management.” Incident management is defined as the “systematic, planned, and coordinated use of human, institutional, mechanical, and technical resources to reduce the duration and impact of incidents, and improve the safety of motorist, crash victims, and incident responders.” (1) The level of incident management varies considerably from location to location. Many locations in the United States use motorist assistance patrols or service patrols that roam the freeways looking for incidents and providing necessary assistance to clear stalled or disabled vehicles off the roadway. Other locations have built a complex traffic control system that uses video surveillance cameras and automatic incident detection systems to monitor the status of the freeway and detect potential problem situations. Regardless of the size and complexity of the incident management system in operations, decision-makers and operators want to know how well the goals and objectives of their incident management systems are currently being met. Performance monitoring (or measurement) is the “use of statistical evidence to determine progress toward specific defined organizational objectives.”(2) Through performance measurement, transportation agencies and emergency response providers can accomplish the following:
• Set goals and objectives defining how well their incident detection and response capabilities should be in their communities;
• Detect problems with their incident management procedures in their area and identify corrective measures for addressing these problems,
• Manage, describe, and improve the incident response in their area, and • Document the accomplishments, benefits, and effectiveness of their response process.
In many locations throughout the United States, different agencies with different primary missions are responsible for different elements of the incident response process. For example, the mission of a transportation agency is to restore the normal flow of traffic on the freeway as quickly as possible while the primary mission of emergency service providers is prevention of further loss of life and property. During an incident event, different agencies with normally separate (and sometime competing) missions converge. Before improvements in the response can be discussed and identified, the different agencies have to understand each other’s perspective.
OBJECTIVES The goal of this task order is to begin the process of understanding the perspective of the different response agencies. The specific objectives of the task order are as follows:
• To provide a better understanding of how agencies measure their performance in organized traffic incident management; and

2
• To identify the difference, if any, in the definitions of relevant measures of performance in incident management (such as detection time, response time, clearance time, etc.).
SCOPE The scope of this task order was limited to the preparation, execution, and reporting of the results of a survey of transportation, law enforcement, fire, and EMS/rescue agencies as well as the preparation, execution, and reporting of the results of the pertinent literature on the measures used by agencies to gauge the performance of their incident management systems. The scope of this project did not include any field studies to collect any performance measures from actual incident management systems. The researchers relied upon the results of the survey and the literature review to form their conclusions and recommendations.
METHODOLOGY A two-pronged approach was used to examine the issues of incident management performance measures. The first prong was to review the available transportation and emergency services literature related to measuring the performance of incident management systems in the United States. Both traditional transportation databases as well as non-traditional databases were searched looking for pertinent literature. Most of the literature related to emergency services was identified, however, through Internet searches. As the second prong to the approach, TTI conducted a survey of representatives from traffic, law enforcement, and emergency service providers with active incident management program. The survey team asked a series of prepared questions in telephone interviews. The questions represented the basic level of information that was to be collected from each area. The same general questions were asked of both transportation agency and emergency service provider representatives.
ORGANIZATION OF REPORT The remainder of this report is divided into three sections. Section 2 presents the results of a search of transportation and emergency provider literature, specifically focused on traffic incident management. Section 3 presents the results of a survey of practitioners that deal with incident management on a daily basis. Section 4 contains recommendations and suggested future research dealing with performance measures for incident management.

3
SECTION 2. REVIEW OF LITERATURE This section contains a summary of the available literature related to incident management, and performance measures for incident management systems. It should be mentioned that there is very little literature from the law enforcement/emergency service providers’ perspective directly related to transportation-related incident management and performance measures. Most of the information presented here for the emergency services perspective was derived or inferred from a limited number of references.
WHAT IS AN INCIDENT?
Transportation Perspective One big issue that has to resolved before incident management performance measures can be developed is what, exactly, is an incident. Transportation providers and emergency responders tend to have different definitions for what constitutes an incident. This is primarily because of the different missions that transportation and emergency service providers have in many areas. Even within the transportation literature, transportation agencies and officials tend to define incidents differently. The Traffic Incident Management Handbook (1) defines an incident as “any non-recurring event that causes a reduction of roadway capacity or an abnormal increase in demand.” Under this definition, events such as traffic crashes, disabled vehicles, spilled cargo, highway maintenance and reconstruction projects, and special non-emergency events (e.g., ball games, concerts, or any other event that significantly affects roadway operations) are classified as an incident. The Traffic Management Data Dictionary (TMDD), as published by ITE and AASHTO, defines an incident as “an unplanned randomly occurring traffic event that adversely effects normal traffic operations.”(3) Developers of the TMDD distinguish incident conditions from planned activities, such as roadwork or maintenance activities by defining different data elements and message sets for both incident and planned roadway events. The 2000 Highway Capacity Manual (4) defines an incident as being “any occurrence on a roadway that impedes normal traffic flow.” While these definitions are very similar, they tend to suggest that within the transportation community, different officials tend to define incidents slightly differently. This can lead to confusion when dealing across jurisdictional boundaries and in reporting and interpreting incident management performance measures.
Emergency Services Perspective While there are no real clear-cut definitions of an incident, most law enforcement agency and emergency responders seem to define an “incident” as any event to which they are dispatched or requires a “response” or action by them. Generally, law enforcement and emergency responders view their mission as “public safety” and “prevention of loss of life and property.” Therefore, these agencies are driven to respond to events that might be perceived as having an impact on the public safety or the potential of loss of life. Major events, such as vehicle collisions, overturned vehicles, vehicle fire, would all be classified as an incident by both law enforcement and emergency responders because the nature of these events generally requires them to respond. Less critical events, such as stalled vehicles on the shoulder, debris in the roadway, etc., may not

4
be considered an “incident” in many locations because an action or response would not be required from a law enforcement and emergency response perspective. For example, fire departments generally do not classify stalled vehicles or debris in the roadway as an “incident” because they do not generally respond to those types of events. Again, this varies from location to location. It should also be noted that the definition of an incident by law enforcement and emergency responders includes more than just events effecting traffic. Potential suicides, structure fires, criminal activities, and other events off the roadway are considered to be “incidents” by law enforcement and emergency responders because these events require a response from these agencies. The definition of an incident also appears to be highly dependent upon the type of dispatching arrangements and structure of the emergency response agencies in an area. For example, in Dallas, the fire and police departments use a common 911dispatching center. If a call comes into the dispatching center requesting both a fire and police response, both are dispatched to the scene, even though there may not be a true need for both responses. The fire unit arriving on the scene then makes the determination if their presence is truly needed. Because they have been asked to respond to the scene, the fire department would generally classify this as an incident because their equipment is in a response mode and is unavailable to respond to another event. Because law enforcement vehicles can patrol sections of roadways, they may occasionally “happen” upon an incident scene (such as a stalled vehicle in a travel lane) and “respond” to that event without being dispatched. The decision as to whether or not classify this type of event as an incident seems to depend upon whether or not the event is a public safety concern requiring a response. For example, a stalled vehicle blocking a lane of traffic is generally viewed as a public safety issue because of the potential of the vehicle causing a secondary crash, and would generally be classified as an incident. Some law enforcement agencies may not necessarily classify a stalled vehicle on the shoulder as an “incident” requiring their response because it may not be viewed as mission critical and may not necessarily represent a public safety concern.
CLASSIFICATION OF INCIDENTS
Transportation Perspective From a transportation perspective, incidents tend to be classified based upon their impact on traffic operations. Many transportation agencies have devised ranking systems for classifying incidents to assist in determining the appropriate level of responses. For example, the Chattanooga Urban Area Metropolitan Planning Organization and the Chattanooga-Hamilton County Regional Planning Agency have devised a classification system that is based on traffic flow, impact/delay, incident characteristics and types of responders. (7) A Level 4 incident is one that typically is causing traffic delays of less than 30 minutes where traffic is only slightly impacted and can be relatively easily routed around the incident. A Level 3 incident is one lasting more than 30 minutes but less than an hour, and a moderate impact on traffic flow. Typically a Level 3 incident involves a collision without or just minor injuries. A Level 2 incident is one lasting more than 30 minutes, but less than 2 hours. In a Level 2 incident, the impacts on the flow of traffic are significant, and the incident probably involves injuries to

5
motorists. With a Level 2 incident, traffic management is essential and site management involves significant interagency cooperation. A Level 1 incident generally tends to be major events that close the roadway and cause major area-wide congestion. Many other areas use similar classification systems to help agencies define the appropriate level of response in the region.
Emergency Services Perspective While most transportation agencies tend to classify incidents based upon their impact on traffic operations, law enforcement and emergency response agencies tend to classify an incident on the number and severity of potential injuries and the number of apparatus required to affect an adequate response. Radio dispatching codes were used to gain insight into the way that different law enforcement and emergency providers classify incidents (see Appendix A for example of select radio codes). For the most part, because their level of responsibility varies from investigating potential criminal activities to maintaining law and order, law enforcement agencies generally tend to have more categories for classifying incidents than fire and emergency service responders. Appendix A contains the model dispatching codes developed by the Association of Public-Safety Communications Officers (APCO).(15) Of the approximately 100 dispatch codes, 14 are related to transportation events. Ten of the 14 are used to describe different incident-related type of responses. Most police agencies use fewer numbers of dispatching codes that are used to describe or classify different incident situations. Fire and emergency medical services generally use criteria that alert them to the number and type of apparatus that are going to be dispatched and the potential for loss of life. Dispatching codes for the New York City Fire Department are also shown in Appendix A. Relatively few dispatching codes (a total of 4) are used to describe traffic incidents.
PERFORMANCE MEASURES
Transportation Perspective Many transportation agencies do periodical assessments of their incident management systems. The Traffic Incident Management Handbook (1) reports that the most commonly used statistics in evaluating incident management programs include the following:
• The number of service patrol assists; • The average elapsed time from incident occurrence to detection; • The average elapsed time from the point at which the incident response team is called out
until its arrival on-scene; and • The average elapsed time to normal traffic flow restoration.
In May 2000, State Highway Administration of Maryland and the University of Maryland produced Performance Evaluation of CHART – An Incident Management Program – in 1997. (5) The purpose of the evaluation was to “assess the effectiveness of the Maryland CHART program with an emphasis on its ability to detect and respond to incidents on major freeways and
6
highways” and to assess “the efficiency of the entire incident management operations along with its resulting benefits.” The evaluation examined issues such as detection time, response travel time, clearance time, response time, and incident duration. The operational definitions used in the evaluation included the following:
• Detection Time – the elapse time between when an incident occurs to when it is detected • Preparation Time – the elapse time between when an incident is detected to when the
response vehicles are dispatched. • Response Travel Time – the elapse time between when the response vehicle was
dispatched and when response vehicles arrive at the incident scene. • Clearance Time – the elapse time between when response vehicles arrive at the incident
scene to when traffic completely recovers after the incident. • Response Time – the elapse time between when an incident is detected to when the
response vehicles arrive at the scene. • Incident Duration -- the elapse time between when an incident occurred to when the
response vehicles depart at the scene.
The report went on to present an analysis of incident characteristics. The researchers used 12 months of incident reports from all three of the traffic operations centers and accident report data from state police for completing this analysis. The researchers use these records to examine the distribution of incidents by the following:
• Roadway; • Blockage duration; • Peak and off-peak hours; • Weekday and weekend; • Lane blockage; and • Location (exit ramp numbers).
The researchers indicate that this information can be used to better design incident management strategies, such as the distribution of patrol vehicles around freeway segments of a high incident frequency; assessing the impact of areas under the average and the worst incident scenarios, and identifying hazardous highway segments from both the safety and operations perspectives. Using the incident data, the researchers also evaluated the effectiveness and efficiency of their incident detection system. The researchers used two primary measures of effectiveness in this evaluation:
• Incident response rate • Distribution of detection sources
For this evaluation, the researchers defined the incident response rate to be “ the ratio between the total number of traffic incidents reported to the CHART control center and those managed by the CHART incident response team.” Not surprisingly, the researchers reported response rates at the three TMCs to be 99%, 94.7%, and 92.3%. The researcher noted that no reasons were given in those incidents when the incident team did not respond. The researchers recommended that CHART operators “should clearly document such incident scenarios, and detail the reasons for those incidents to be handled by police alone.” In discussions with the CHART operators, the

7
researchers found that in some of those incidents, the response team was unable to respond because of “equipment limitations or manpower shortage.” The researchers also conducted an analysis of incident response efficiency specifically addressing the following:
• The time it took for an incident response unit to reach the reported incident site after the control center was informed
• The average travel distance for incident response units to reach the identified incident site.
• The approximate reduction in the incident blockage time due to the operations of CHART’s incident response program.
As noted above, the researchers defined response time as the “elapsed duration from the moment the control center received a reported incident to the physical presence of the incident management team at the target incident site.” In looking at the reduction in incident duration, the researchers noted that there are two ways of doing this. The first way is to perform a “before and after” comparison where response times to incidents before and after the system is operational. The researchers rightfully noted that in most locations, incident response time data prior to actual operations of a center is sparse, at best. They suggested that another way to examine the reduction in incident duration is to compare incident durations when the incident management team responded to incident durations when the incident management team did not respond. One drawback to this, however, is that data from when no response occurred may be limited in many centers. The report included information estimating benefits of incident management system. The researchers indicated that “despite well perceived benefits from an efficient incident management system, most state highway agencies, including MSHA, are facing the pressing need to justify their system investment and operating costs, especially in view of diminishing resources and increasing demand for infrastructure renovation.” The researchers indicated “to ensure the quality of analysis under the data limitations as well as resource constraints, the benefit assessment of CHART was focused only on those [measures] either directly measurable or quantifiable from the given data.” Therefore, the researcher focused on the following performance measures:
• The number of assistance request from drivers; • The reduction in secondary incidents; • The reduction in driver delay time; • The reduction in vehicle operating hours; • The reduction in fuel consumption; and • The reduction in vehicle emissions.
In their analysis, the researchers defined assistance requests as an event where the driver asked for assistance such as flat tire, shortage of gas, or some mechanical problem. The researchers noted that “ according to CHART staff, its response teams actually responded to many more assistance requests from drivers” than was used in the analysis, but because “most of the unreported driver assistance [requests] did not need major efforts or equipment from the

8
response unit,” no data were recorded on these events. This suggests several issues that must be addressed in assessing the performance of incident management systems:
• It is important to define the measures that are going to be used to evaluate the performance of the system PRIOR to analysis period so you know what data to collect.
• It is important to have the mechanisms in place to ensure that all the data that will be used to evaluate your system is collected.
The researchers also used the reduction in the number of secondary incidents in their assessment of the benefits of the CHART system. For the purposes of their evaluation, the researchers defined “secondary incidents” to be any incidents occurring within two hours after a major incident and within a two mile range of a reported incident.” In looking at the “reduction in secondary incidents,” the researchers estimated the number of secondary incident without CHART by factoring up the number of observed number of incidents by the percent reduction in average incident duration. The researchers used simulation to quantify the reductions in driver delay, fuel consumption, and vehicle emissions. While some agencies undertake performance assessments similar to that performed for the CHART system (i.e. a before-and-after comparison performed by an outside agency), other agencies produce performance reports on a more routine basis. For example, the Minnesota Department of Transportation (MnDOT) routinely produces performance reports that summarize the performance of their incident management system on a daily, monthly, or annual basis. (9) Samples of these reports are contained in Appendix B. These reports generally contain information on the following:
• The number and type of incident occurring; • The number and type of vehicle involved; • The number of times different agencies responded to incidents; and • The average response times by each responding agency.
Many agencies that have freeway service patrols or motorist assistance programs routinely produce performance reports. (11, 12). Generally, these reports include information on the following:
• The number of assists performed annually, quarterly, or per month, • The types of assists encountered, • The types of services rendered, • The time of the assists (e.g., Morning, Afternoon, Evening) • The average duration of assists.
Sample reports from the motorist assistance program in Houston, TX are shown in Appendix C.
Emergency Services Perspective In many respects, emergency service providers are much more cognizant of the benefits of performance measures. Many emergency service providers routinely monitor and produce reports that show their average response times. Historically, emergency service providers have used response times for justifying adding new equipment and staffing, and for strategic planning purposes (such as determining when new fire stations need to be added and where, etc.).

9
For example, the City of Austin Fire Department has a web site in which they report their average response times for each month. (13) Response times are summarized separately based on calls that come into the fire department dispatch and calls that go into the 911 dispatch center. In producing these reports, the City defines response time as the time “from the moment a call is received by the Fire Department Dispatch [or the 911 center] to the moment when an engine or truck company arrives on the scene.” The definition of response time used by the Fire Department seems to the representative of most emergency response systems.
COLLECTION AND STORAGE OF INCIDENT MANAGEMENT DATA
Transportation Perspective Many locales use their freeway management system software as the primary means of collecting and storing information about incidents on the freeway networks. Through various input screens, information about incidents is entered either by the operator or, at some locations, automatically by the system itself. The general type of information logged by most systems included the following:
• The roadway on which the incident occurred; • The location (cross-street, mile point, or incident reference system) of the incident; • The number of vehicles involved; • The severity of the incident (stalled vehicle, property-damage only, possible injuries,
etc.); • The source reporting the incident; • The number of lanes blocked; and • The potential duration of the blockage.
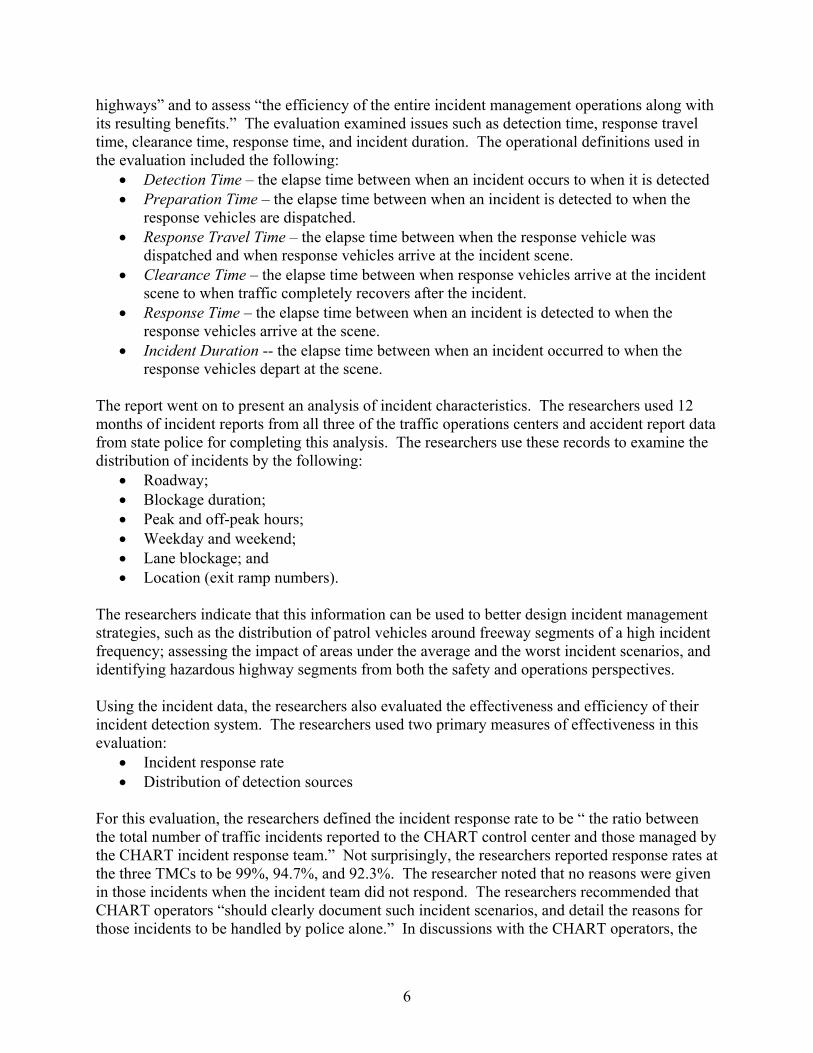
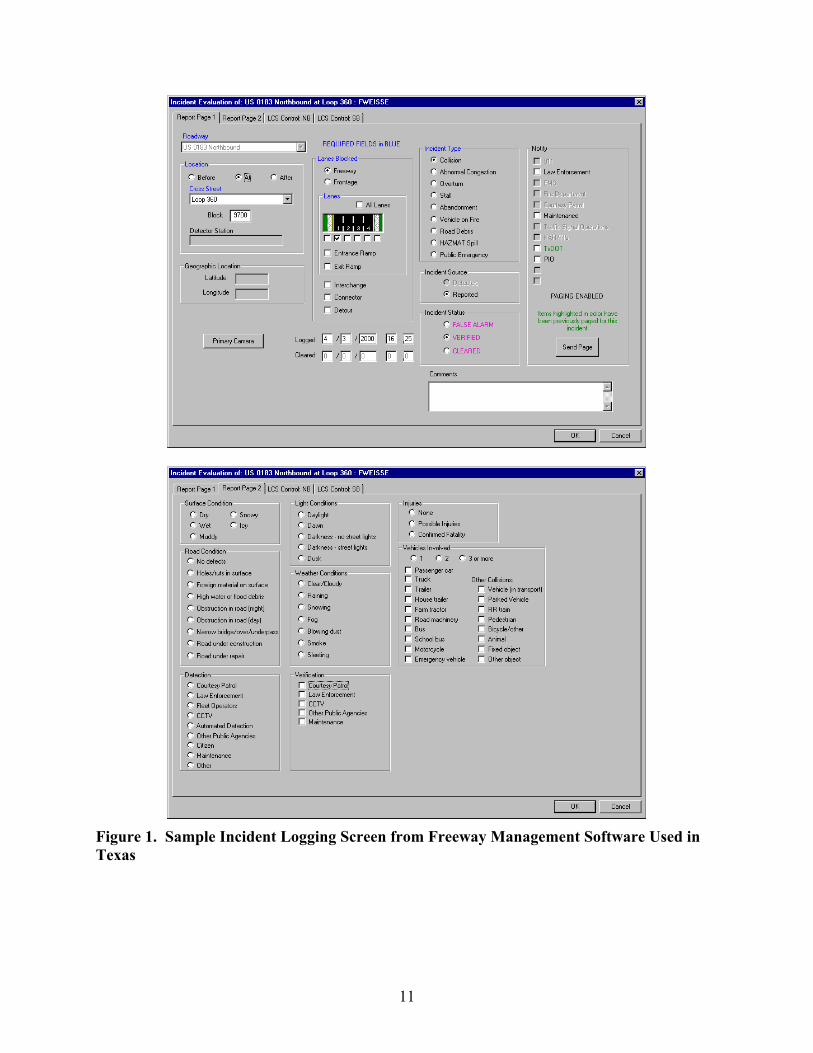
Figure 1 shows an example of two incident management data input screens employed in Texas. Another source of incident information is motorist assistance or service patrol logs. These logs are kept either by the responding officer in the field or by the dispatcher located in the control center. These logs generally contain the same information as the incident management software system, but are collected by the response individual. In most locations, service patrols are responsible for responding to minor incidents (such as stalled vehicles); therefore, the patrol logs are used more to keep track of what resources (such as fuel, etc.) are used in a response rather than as a mechanism for measuring performance such as response times, and response durations. Figure 2, which shows the type of information logged in a service patrol in Ohio, serves as a typical example of the type of information collected by most service patrol systems.
Emergency Services Perspective Many law enforcement and emergency service providers (either through their combined E911 dispatching centers or through their own dispatching centers) use Computer-Aided Dispatching (CAD) systems. According to Dispatch Monthly Magazine (16), 56% of local police departments with their own communication center and 70% of the sheriff departments with their own communications center use CAD to assist them in their dispatching. The numbers grow considerably when 911 and E911 dispatching centers are also incorporated. CAD systems were originally intended to speed-up the process of dispatching roving patrol officers to a scene; thus,

10
reducing response time. However, these systems generally have the capability for logging and storing large quantities of data that can be used to develop response performance measures. There are literally hundreds of different types of CAD software systems available on the market, but they generally log similar types of information about responses — most notably, the time that a request for assistance (or call) was entered in the dispatching system, the time response was dispatched, the time the response arrived on the scene, and the time the response vehicle “cleared” the call (or was available to receive another call). Some CAD systems have been integrated with automatic vehicle locating systems so that the location of vehicles is constantly monitored and event times such as vehicle arrival times and vehicle clear times are logged automatically by the CAD system. Figure 3 shows a screen capture of one version of a CAD system and illustrates the type of information that is captured in most CAD systems. The U.S. Fire Administration (USFA), part of the Federal Emergency Management Agency (FEMA), maintains a National Fire Data Center (NFDC) that collects, analyzes, and publishes statistical information about fires and fire responses. To gather this information, the NFDC established the National Fire Incident Reporting System (NFIRS).(18) Participating local fire departments fill out an Incident and Casualty Report as the fires occur. They then forward the completed forms to their state office where the data are validated and consolidated into a single database. A blank Incident and Casualty Report form is shown in Figure 4. One function of the Incident and Casualty Report is to serve as a model for the type of records that fire departments around the country should keep.(18) The type of data collected for each fire response includes the following:
• The day, date, and time of each fire event, • The type of situation found when the responders arrived on the scene, • The type of actions taken upon arrival (i.e., extinguished fire, provided first aid, etc.) • The type of property involved (including automobiles), • The source or cause of the fire, • Information about the property (address, owner, etc.), and • Information about the type of response provided (i.e., number and type of responders).
Several fields on this form illustrate the type of data that many fire and emergency medical service providers routinely collect. These fields are the Alarm Time, the Arrival Time, and the Time in Service. Each of these data entry fields are described as follows:
• Alarm Time — This is the exact time of day (hour and minute) when an alarm is received by a fire department alarm center. It is important for three reasons: (1) as a legal requirement for recording the precise time of an incident, (2) as information for determining the frequency of particular types of incidents by time period, and (3) as the starting time for going into action on an incident, which can be compared with Arrival Time to determine the length of time necessary to arrive at an incident [transportation agencies typically think of this as “Response Time”] and Time In Service to determine the total amount of time spent at the incident.
11
Figure 1. Sample Incident Logging Screen from Freeway Management Software Used in Texas
12

13
Figure 2. Log Showing Typical Incident Management Information Logged by Service Patrols

14
Figure 3. Sample of Typical Operator Screen Commonly Used in Computer Aided Dispatch Systems Source: K&K Computer Solutions Website (17)
Figure 4. Incident Report Form for Logging Information in National Fire Incident Reporting System
15
• Arrival Time — This is the actual clock time when the first responding units arrive at
the incident scene. This time is valuable to department management because it reflects the actual time spent in traveling to the scene of the incident. It is useful in determining the actual time spent at an incident and would indicate any delay between alarm and arrival.
• Time In Service — Although each fire department generally has their own operational definition for “time in service,” it is usually defined as the time when all or most of the equipment is again ready for response to another alarm, as determined by the officer in charge at the scene. This entry is generally in 24-hour clock time and is necessary along with Arrival Time for calculating the total time spend on an incident.
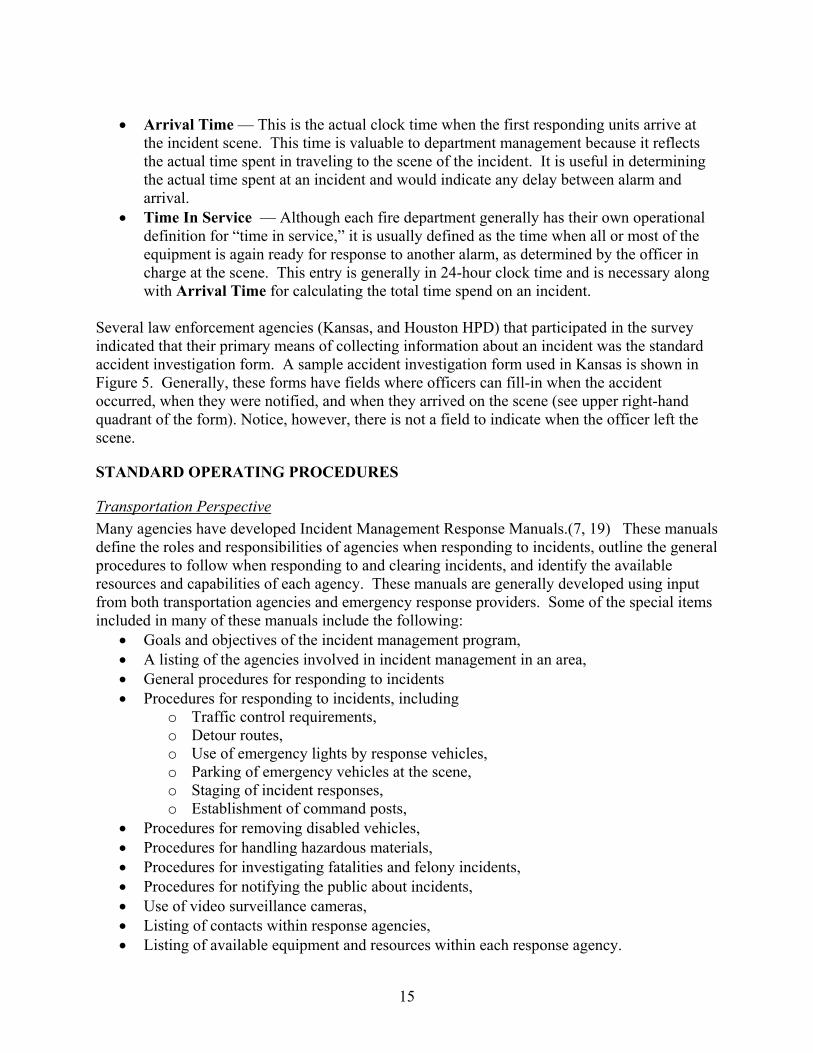
Several law enforcement agencies (Kansas, and Houston HPD) that participated in the survey indicated that their primary means of collecting information about an incident was the standard accident investigation form. A sample accident investigation form used in Kansas is shown in Figure 5. Generally, these forms have fields where officers can fill-in when the accident occurred, when they were notified, and when they arrived on the scene (see upper right-hand quadrant of the form). Notice, however, there is not a field to indicate when the officer left the scene.
STANDARD OPERATING PROCEDURES
Transportation Perspective Many agencies have developed Incident Management Response Manuals.(7, 19) These manuals define the roles and responsibilities of agencies when responding to incidents, outline the general procedures to follow when responding to and clearing incidents, and identify the available resources and capabilities of each agency. These manuals are generally developed using input from both transportation agencies and emergency response providers. Some of the special items included in many of these manuals include the following:
• Goals and objectives of the incident management program, • A listing of the agencies involved in incident management in an area, • General procedures for responding to incidents • Procedures for responding to incidents, including
o Traffic control requirements, o Detour routes, o Use of emergency lights by response vehicles, o Parking of emergency vehicles at the scene, o Staging of incident responses, o Establishment of command posts,
• Procedures for removing disabled vehicles, • Procedures for handling hazardous materials, • Procedures for investigating fatalities and felony incidents, • Procedures for notifying the public about incidents, • Use of video surveillance cameras, • Listing of contacts within response agencies, • Listing of available equipment and resources within each response agency.

16
Figure 5. State of Kansas Motor Vehicle Accident Report Form.

17
Figure 6. State of Kansas Motor Vehicle Accident Report Form (continued).

18
Emergency Services Perspective The U.S. Fire Administration (USFA) has published a Guide To Developing Effective Standard Operating Procedures for Fire and EMS Departments. (10) The guide is designed to “assist emergency service managers in establishing effective standard operating procedures (SOPs)” that “clearly spell out what is expected and required of personnel during emergency response and non-emergency activities.” This guide specifically states that the standard operating procedures should not tell firefighters how to do their jobs (i.e., technical skills) but describe a department’s rules for doing a job (i.e., procedural guidelines). It suggests that one important item that should be included in an agency’s SOP is how responders should operate on the roadway. While the guide does not provide any specific recommendations on how to do it, it does recommend to fire departments that the SOP cover such items as the following:
• Operations near moving traffic, • Traffic control procedures, • Use of warning devices, • Vehicle/scene stabilization, • Coordination with law enforcement personnel, • Standard procedures and precautions, and • Special situations (e.g., downed power lines)
USFA has also produced a Hazardous Materials Guide for First Responders(8), which provides a generalized approached for handling hazardous material spills and incidents. The guide gives first responders information about how to approach a potential hazardous material spill, what to look for, where to set up command posts, where to park vehicles, etc. It also provides information on regulatory considerations, training, and operations in and around hazardous material spills. Neither of these guides contain information on what performance measures fire and emergency response system should be computing or how.

19
SECTION 3. SURVEY OF INCIDENT RESPONDERS A survey instrument was developed to obtain information on how transportation, law enforcement, fire, and EMS/rescue agencies measure and report incident management performance measures in their jurisdiction. The survey instrument solicited information related to the following issues:
• How incidents are defined by agencies in their jurisdiction; • How information about incidents is tracked and recorded; • What, if any, measures they are collecting, calculating, or recording regarding incidents; • What are the cost of collecting, processing, and reporting the measurement and source
data; • If agencies are not using any measures, why not; • If they are planning to implement measures, why, when, and how; • How each measure is defined and calculated or measured; • How the measures were decided upon and by whom; • How long performance measure data have been collected and calculated; • To whom the measures are reported, and how often; • With whom the measures are shared; • What the recipients do with the measures; • What decisions are made based on or are influenced by the measures; • How the recipients feel about the measures (i.e. are they meaningful, are they timely, do
they provide the information necessary for effective decision-making); • The types of data collected about incidents, and the sources of the data; • Whether similar data exists from other sources (especially other incident management
partner agencies), whether the data from the different sources are compared to one another, and any findings from the comparison;
• What issues exist regarding measuring incident management performance, and how they have been dealt with;
• What are the best candidate measures, whether they are recording measures or not.
METHODOLOGY TTI used a telephone-interview type of format to collect the information from the different transportation, law enforcement, fire, and EMS/rescue agencies. A series of questions were developed that represented the basic level of information to be obtained from each agency. A copy of the survey document is contained in Appendix D.
A pilot test of the survey instrument was performed prior to conducting the actual survey. The purpose of the pilot test was to verify that the wording of the questions were clear and concise, to fine-tune the data collection methodology, and to assess whether the questions provided meaningful response. Based on the results of the pilot test, the survey document was revised slightly to clarify some of the questions.
20
To conduct the survey, members of the research team initially contacted, via the telephone, each of the identified individuals to request their participation in the survey. During this initial contact, the researcher arranged a convenient day and time to conduct the survey or identify alternative contacts. The researcher also obtained either a mailing address or an e-mail address to which the survey questions could be sent. The researcher then forwarded the actual survey questions to the respondent prior to actually conducting the survey. This was done so that the survey respondent would have adequate time to prepare his or her responses to the questions. At the scheduled day and time, the researcher contacted the survey respondent by telephone and administered the survey. The researcher documented the respondent’s answers to each question. The researcher also asked probing questions to clarify the response to survey question. The responses were then coded into a spreadsheet to aid in analysis. This spreadsheet has been provided to FHWA under a separate deliverable.
RESPONSE RATE A total of 54 individuals from 30 locations were identified as potential respondents to the survey. These individuals were identified from the following sources:
• The IEEE Incident Management Working Group, • The ITE Traffic Incident Management Committee, • The TRB Freeway Operations Committee, • Personal contacts, and • Internet searches of functioning traffic management centers.
A total of 23 individuals from 19 locations actually participated in the survey. The remainder of the individuals originally identified either did not reply to initial inquiries about participating in the survey, elected not to participate in the survey, or indicated that they did not have an active incident management program in their area. TTI planned to use representatives from the transportation agencies to identify appropriate individuals in the law enforcement and emergency service agencies to survey. One problem with this approach was that respondents were often unwilling to provide contact information of representatives from other agencies that were responsible for incident management. This was because either they did not know the correct person at the appropriate level or did not want to increase the workload of these individuals with trying to respond to the survey. Therefore, most of the insight into the emergency services perspective was obtained through the literature and a limited number of survey responses.
FINDINGS
Definition of Incident Most of the transportation agencies surveyed agree with the TMDD definition of an incident. Most agencies define an incident as any unexpected event that causes a temporary reduction in capacity. The term “temporary” is an important modifier because it implies that after the agency performs some type of initial operation or response (i.e., clearing wrecked vehicles from the travel lanes, removing a spilled load, etc.) the roadway can be reopened and normal capacity can

21
be resumed. For the most part, transportation agencies do not view highway maintenance and reconstruction projects and non-emergency events themselves as incidents, generally, because they are events that have planned means of accommodating traffic flow. Most transportation agencies do not consider the long-range effects of an incident as part of the initial incident. For example, most transportation agencies would not consider the repair of a collapsed bridge deck, or the removal of spilled cargo that has been pushed beyond the shoulder area as part of an incident, even though an event that they would describe as an incident was the primary cause of the loss of capacity. This is especially true when recovery efforts extend over multiple days. Most transportation agencies tend to classify incident events as being over once the initial response to the incident event has left the scene and when more traditional traffic control (i.e., work zone type traffic control) has been established at the scene. Interestingly, many transportation agencies also classify unexpected weather events (particularly snow and ice) as an “incident,” because they typically cause temporary reductions in capacity (i.e., once the snow event is over and the roadways are cleared, the “incident” is over), increase the potential for secondary events (such as crashes and stalled vehicles), and more importantly, require a “response” from the transportation agency (dispatching of snowplows and de-icing equipment, etc.). Some agencies also classify events involving select sensitive users, such as school buses, railroad crossing, etc. as incidents, primarily because these events may require special attention for political or public welfare reasons. Generally, events have to be on a roadway facility itself or in the right-of-way to be considered as an incident by transportation agencies. Events that occur off the right-of-way, such as a structure fire, are not routinely thought of as “incidents” by transportation agencies. Some agencies do log these events in their incident management software and may broadcast messages about these events through their motorist information systems.
Classification Of Incidents One goal of incident management is to ensure that the appropriate response personnel and equipment is provided at every incident. To aid in determining the appropriate level of response, many transportation and emergency service providers have developed systems of classifying incidents. Table 2 shows how the survey respondents replied to questions concerning methods and criteria for classifying incidents in their local area. The table also shows how the level of severity of the incident effects each agency’s response decisions.

22
Table 1. Definition of Incident by Survey Respondents
Agency Col
lisio
n
Ove
rtur
ned
Veh
icle
Stal
l in
Lan
e
Aba
ndon
ed v
ehic
le
In la
ne
Stal
l on
Shou
lder
Veh
icle
Fir
e
Haz
mat
Spi
ll
Aba
ndon
ed V
ehic
le
On
Shou
lder
Publ
ic E
mer
genc
y
Deb
ris R
oadw
ay
Other
Kansas DOT –Kansas City x x x x x x x x x
Only incidents requiring police accident reports are documented. Kansas DOT is currently in the process of building a TMC. They hope to have it operational by the end of this year to early next year. Currently, the state police and service patrol (operated by the police) are the only incident management elements in place. The police provide the DOT with copies of the accident reports for accidents on their facilities.
New Jersey DOT
x x x x x x x x x x Downed Utility Pole; downed signal pole; anything blocking a lane or shoulder
Arizona DOT x x x x x x x x x x Ohio DOT - Columbus x x x x x x x x x x Unexpected weather change
Tennessee DOT x x x x x x x x x x Anything effecting traffic flow
Phoenix Az, Fire Dept. x x x x x x x
Maryland State Hwy Admin - CHART
x x x x x x x Anything effecting traffic flow
Texas DOT -Austin x x x x x x x x x x
Texas DOT –San Antonio x x x x x x x x x x Weather; construction; maintenance
23
Table 1. Definition of Incident by Survey Respondents
Agency Col
lisio
n
Ove
rtur
ned
Veh
icle
Stal
l in
Lan
e
Aba
ndon
ed v
ehic
le
In la
ne
Stal
l on
Shou
lder
Veh
icle
Fir
e
Haz
mat
Spi
ll
Aba
ndon
ed V
ehic
le
On
Shou
lder
Publ
ic E
mer
genc
y
Deb
ris R
oadw
ay
Other Minnesota DOT - Minneapolis
x x x x x x x x x x
Caltrans - San Diego x x x x x x x x x
Incident Management Services-- Houston
Southeast Michigan COG - Detroit
x x x x x x x x x x
City of Houston -Police Dept
x x x x x x x x x x Assist TxDOT
New York DOT
x x x x x x x x x x Brush fire, pedestrian in restricted area, road work, traffic signal malfunction, non-recurring severe congestion
Colorado DOT Lakewood x x x x x x x x x x
Texas DOT - Houston x x x x x x x x x x
Illinois DOT - Chicago
x x x x x x x
Ice on pavement, water main breaks, flooding, anything that blocks one or more lane for 30 minutes or more, school bus involvement, railroad crossing involvement, fatality.
North Carolina DOT x x x x x x x x x x Anything effecting traffic flow
Connecticut DOT x x x x x x x x x x

24
A common classification scheme that describes the severity of the incident and/or the urgency of the response does not exist. For the most part, transportation agencies tend to classify incidents into two to three categories based upon the degree to which traffic is likely to be impacted (severity) and/or the number of lanes blocked. Some of the criteria that transportation agencies use to classify incidents include the following:
• Number of lanes blocked; • Estimated duration of blockage; • Severity and/or number of injuries involved; • Time-of-day; • Presence of hazardous materials; • Degree of damage to vehicles and/or infrastructure; • Type of vehicles involved (e.g., trucks, buses, etc.); and • Number of vehicles involved.
Emergency service providers, on the other hand, typically classify events based on the potential loss of life and/or the impact to public safety. Both of the emergency service providers use standards that have been defined by their industry as a means of classifying incidents. These standards take into account the presence of possible injuries or fatalities, and rely on dispatchers soliciting correct information from the individuals reporting the incidents.
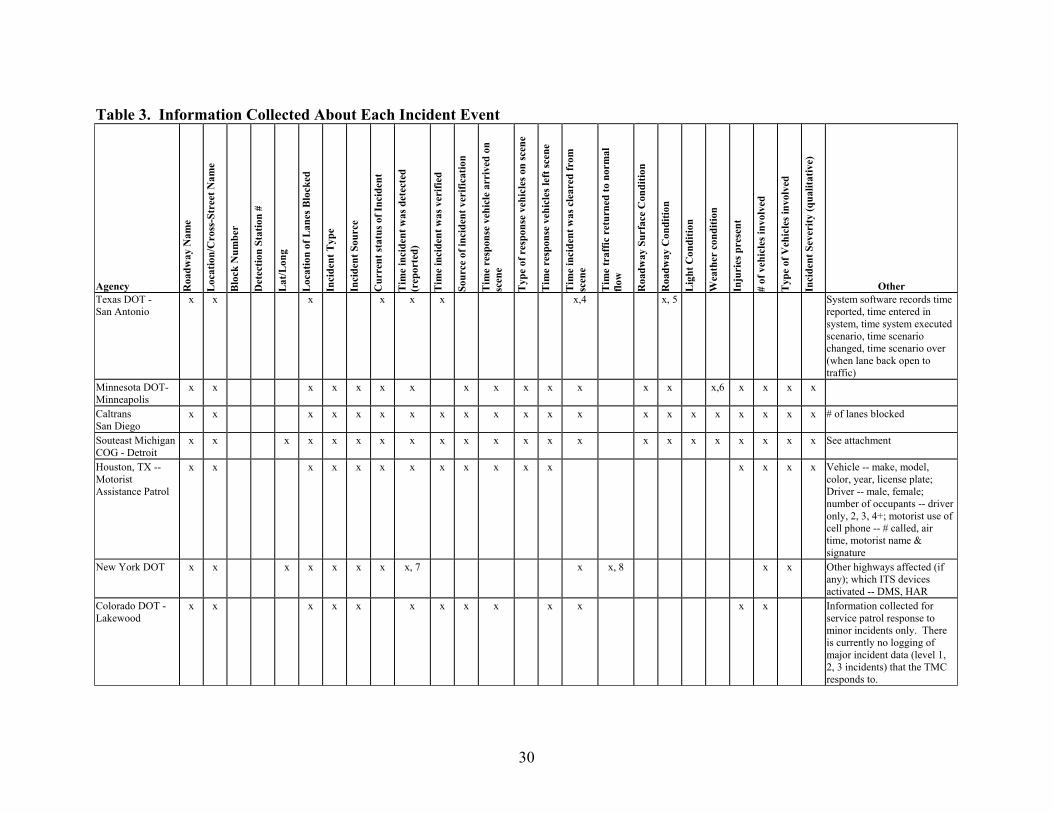
Information Collected Per Incident One attribute of a good performance measurement system is that data to generate performance measure be readily attainable in an economic manner.(1) This implies that in order for agencies to develop and use performance measures, the data must be readily available through their already existing systems. Responders are more likely to compute performance measures if they are already collecting the data to support them. Part of this survey effort was to look at what data is currently being collected by different agencies and how. Table 3 shows what information many of the transportation and emergency service providers are collecting about each incident event. Based on the survey responses, at a minimum, the following information is recorded by most agencies:
• The roadway name where the incident occurred; • The name of a nearby cross-street or location; • The location of the incident in the lanes (i.e., which lanes are blocked); • The type of incident; • The time at which the incident was detected or reported; • The time the first response vehicle arrived on the scene; and • The time the incident was cleared from the scene.
25
Table 2. Criteria Used to Categorize Incidents and How It Effects Incident Response
Agency Criteria Thresholds Response Variation New Jersey DOT
Major, Minor. Major incidents defined as those lasting more than one hour while minor incidents defined as those lasting less than 1 hour.
Minor incidents -- use ITS (DMS/HAR) if applicable. For major incidents, review to see if need to send IM response team. Team consists of state trooper and DOT traffic operations person, get to scene and try to speed clearance of incident.
Arizona DOT
Level 1, 2, 3 Level 1 -- fatality; unplanned closure in one or both direction affecting any state route; any incident involving HAZMAT, homicide, trains, or school buses; Level 2 -- traffic flow is restricted; requiring live AzDOT presence; fences cuts, livestock on roadway, or guard rail damage presenting hazard to motorist; red indication out / stop sign knockdown; large dead animal in lanes; roadway damage (large potholes, gravel on roadway); disabled vehicle blocking flow; structural damage that does not close hwy; threat of jumper that does not close hwy Level 3 -- Yellow/green indication out; debris not blocking roadway; disabled vehicle not blocking roadway; Maintenance; anything that can be handled at supervisor discretion; anything not requiring immediate ADOT response
What changes is who gets notified and how much of a hurry we are to get responses from them. Level 1 -- notify Admin Major (includes ADOT Director, and State engineer, and District Engineer). Level 2 - Notify Maintenance Supervisor by pager or phone. Level 3 -- notify supervisors via email, phone, radio.
OhioDOT- Columbus
Severity, time-of-day, congestion level
Lane blockages of more than one minute warrants activating DMS; DMS messages updated as lane blockage changes; Service patrol will work incidents expected to be under 15 minutes to clear, otherwise call for tow trucks
Incident response plan (IRM) addresses how to handle major incidents, stalled vehicles, debris, roadwork, congestion, fire/HAZMAT, freeway diversion. For minor fender benders, execute only what is helpful to motorist that doesn't cause a lot of inconvenience. For major incidents (e.g., fatality) and EMS is on the scene, execute full plan immediately.
Tennessee DOT
- - Long term - debriefings and updates
Phoenix, Az Fire Dept.
Use universal system U.S. Fire Adm. (thru FEMA website)
- Response bases on Inc. Management System (IMS) -- developed in California published 1985. Dispatchers - rotate

26
Table 2. Criteria Used to Categorize Incidents and How It Effects Incident Response
Agency Criteria Thresholds Response Variation Maryland State Hwy Adm - CHART
Property damage: person injured/fatality; Hazmat; emergency roadwork; -- 15 items out of FHWA Data Dictionary
- If longer than 2 hrs shutdown, preplanned detour routes. Dependent on magnitude of incident, different levels of notifications is given to agencies.
Texas DOT -Austin
HCM Level of Service Criteria; Reported vs. verified
Compare current volume/occupancy measures to HCM thresholds.
No impact on operations -- simply informational. Emergency services will look at speed. Haven't needed to classify incidents (respond to all incidents). Verified vs reported -- if reported, will look to verify with CCTV and then clear.
Texas DOT - San Antonio
Type of incident (I.e., debris, weather, accident). Severity of lanes closed; Severity of accident
Severity of lanes closed -- 2 or 3 lanes closed, classified as major incident. With crash scenes, major incident is one that requires EMS (get information via police). Major incident - when demand expected to exceed capacity.
TransGuide software system automatically prioritizes -- major incidents over minor incidents, minor incident in open lane. System uses operator inputs (I.e., description of incidents) to driver scenario process.
Minnesota DOT - Minneapolis
Major, Minor. Judgment call by operator. Used past experience, type of incident, Time-of-day, expected duration of incident (i.e., any road closure or any incident during peak period, hazmat or rollover) classified as major
Major incidents -- place motorist information system in overdrive. Broadcast radio messages every 10 minutes. With major incident, use DMSs to direct motorist to tune to station and continuously broadcast incident information. Will also call other media outlets. May pull in other operators if many going on at same time.
Caltrans –San Diego
Use California Highway patrol's radio call system (10 codes, 11 codes)
- Highest level codes, Caltrans will dispatch response immediately. With other codes, will wait until officer on-site. Will change response or dispatch response based on officers needs.
Incident Management Services – Houston, Tx
Only respond to major incident involving 18-wheeler rollovers/lost loads.
- -

27
Table 2. Criteria Used to Categorize Incidents and How It Effects Incident Response
Agency Criteria Thresholds Response Variation Southeast Michigan COG -- Detroit
No defined criteria (i.e., delay threshold severity). Michigan State Police Criminal Justice Information Center has a system to capture this information called the Automated Incident Command System (AICS).
There are no documented thresholds that I know of but there might be something defined by the State Police. They work by guidelines and training found in the Incident Command System (ICS). They also have a Computer Aided Dispatch (CAD) that dispatches the appropriate personnel for a particular event.
The dispatcher determines the appropriate response after assessing the call or by the person responding to the call once at the scene of the incident. Appropriate responses scenarios might also be determined through the use of ICS and CAD systems. Assistance is provided by the Michigan Intelligent Transportation Systems (ITS) Center if it is a freeway incident through the use of the cameras.
City of Houston, Tx Police Dept
Severity -- Major/Minor; Location -- Moving lane of traffic (right shoulder, left shoulder, lane(s) blocked - 1 2 3 4 5 6
Major = major freeway blockage; Minor = minimal freeway blockage
90% of incidents detected by roving patrol; 6% dispatched from TranStar; clear minor incidents alone; assist with traffic control at major incidents;
New York DOT
Combination of severity, anticipated duration, and time-of-day (e.g., peak or off-peak)
Level 1 -- no lane blocked - on shoulder; Level 2 -- 1 lane blocked 0-15 min (peak) 0-30 min (off-peak); Level 3 -- 1 lane blocked 15-30 mins (peak) or 30-60 mins (off-peak); Level 4 -- 1 or more blocked 30-60min (peak) 60-120(off-peak); Level 5 -- road closure, 1+blocked 60 min(peak) 60-120(off-peak)
The more severe the more they "throw" at it. They have communications with metro traffic and local media (if after metro traffic hours). Co-located in TMC with state police - get estimate from trooper for duration. Level 1-2: may or may not do anything. Higher levels - At first advise metro traffic/media of problem - if worse, recommend taking alternate route (but don't specify) - if really bad, recommend specific alternate route - more severe, use stronger DMS messages - use DMS to notify to tune to HAR - have 1 permanent HAR and 2 portable (1 portable being converted to permanent).
Colorado DOT - Lakewood
Mile High Courtesy patrol handles minor incidents. The TMC only responds to major incidents -- duration is the criteria used
3-tier system for major incidents -- total freeway closure or most lanes blocked Level 1 -- duration less than 30 minutes; Level 2 -- duration 30 minutes to 2 hours; Level 3 -- duration over 2 hours
Main response is public information. They have a broadcast fax system with 300 agencies/companies signed up including media, other public agencies, trucking firms, US military, US Postal Service, visitor centers, etc. Also post information on their website
28
Table 2. Criteria Used to Categorize Incidents and How It Effects Incident Response
Agency Criteria Thresholds Response Variation Texas DOT - Houston
Will follow that provided by law enforcement (Fatality/Injury = major, PDO = minor), as well as determining severity based upon lanes blocked and duration
Major: One lane > 30 min (TOD dependent); Two or more lanes > 15 min (TOD dependent); truck accidents, HazMat spills, bus accident, multi-vehicle accidents Minor: Other incidents
Different types of incidents require different level of response. For example, HFS is not contacted for a minor incident, however, HPD may be required and they are contacted the same as if it were a major incident. They are given all details known and it is left to them to determine their condition of response.
Illinois DOT - Chicago
Severity -- routine or incident; Lane blockage
1 or more lane closed for 30 minutes or more; total freeway closure for 15 minutes or more; Hazmat
More documentation for incidents than "routines", more public awareness for more major incidents -- media alerts, notify DOT personnel, DMS

29
Table 3. Information Collected About Each Incident Event
Agency Roa
dway
Nam
e
Loc
atio
n/C
ross
-Str
eet N
ame
Blo
ck N
umbe
r
Det
ectio
n St
atio
n #
Lat
/Lon
g
Loc
atio
n of
Lan
es B
lock
ed
Inci
dent
Typ
e
Inci
dent
Sou
rce
Cur
rent
stat
us o
f Inc
iden
t
Tim
e in
cide
nt w
as d
etec
ted
(rep
orte
d)
Tim
e in
cide
nt w
as v
erifi
ed
Sour
ce o
f inc
iden
t ver
ifica
tion
Tim
e re
spon
se v
ehic
le a
rriv
ed o
n sc
ene
Typ
e of
res
pons
e ve
hicl
es o
n sc
ene
Tim
e re
spon
se v
ehic
les l
eft s
cene
Tim
e in
cide
nt w
as c
lear
ed fr
om
scen
e
Tim
e tr
affic
ret
urne
d to
nor
mal
flo
w
Roa
dway
Sur
face
Con
ditio
n
Roa
dway
Con
ditio
n
Lig
ht C
ondi
tion
Wea
ther
con
ditio
n
Inju
ries
pre
sent
# of
veh
icle
s inv
olve
d
Typ
e of
Veh
icle
s inv
olve
d
Inci
dent
Sev
erity
(qua
litat
ive)
Other Kansas DOT, Kansas City
x x x x x x,1 x x x x x x x Property damage; diagram; names; vehicle makes; model, color, plate numbers
New Jersey DOT x x x x x x x x x x x x x x
Arizona DOT x x x x x x x x x x x,1 x x x,2 x x x x Route, direction, milepost, type of incident (accident with or without injuries/death); who was called out.
Ohio DOT- Columbus
x x x x x x x x x Miler maker system location
Tennesse DOT x x x x x x x Type of service; vehicle tag #; direction
Phoeniz , AZ Fire Dept
x x x x x x x x x x x x x,3 x x x x x x x x x x x Detailed info on injuries, seatbelts, child restraints; Trucks have live terminals and digital cameras to collect info
Maryland State Hwy Admin -- CHART
Texas DOT -Austin
x x x x x x x x x x x x x x x x System software records time that changes to any fields are made, including update to comments.
30
Table 3. Information Collected About Each Incident Event
Agency Roa
dway
Nam
e
Loc
atio
n/C
ross
-Str
eet N
ame
Blo
ck N
umbe
r
Det
ectio
n St
atio
n #
Lat
/Lon
g
Loc
atio
n of
Lan
es B
lock
ed
Inci
dent
Typ
e
Inci
dent
Sou
rce
Cur
rent
stat
us o
f Inc
iden
t
Tim
e in
cide
nt w
as d
etec
ted
(rep
orte
d)
Tim
e in
cide
nt w
as v
erifi
ed
Sour
ce o
f inc
iden
t ver
ifica
tion
Tim
e re
spon
se v
ehic
le a
rriv
ed o
n sc
ene
Typ
e of
res
pons
e ve
hicl
es o
n sc
ene
Tim
e re
spon
se v
ehic
les l
eft s
cene
Tim
e in
cide
nt w
as c
lear
ed fr
om
scen
e
Tim
e tr
affic
ret
urne
d to
nor
mal
flo
w
Roa
dway
Sur
face
Con
ditio
n
Roa
dway
Con
ditio
n
Lig
ht C
ondi
tion
Wea
ther
con
ditio
n
Inju
ries
pre
sent
# of
veh
icle
s inv
olve
d
Typ
e of
Veh
icle
s inv
olve
d
Inci
dent
Sev
erity
(qua
litat
ive)
Other Texas DOT - San Antonio
x x x x x x x,4 x, 5 System software records time reported, time entered in system, time system executed scenario, time scenario changed, time scenario over (when lane back open to traffic)
Minnesota DOT- Minneapolis
x x x x x x x x x x x x x x x,6 x x x x
Caltrans San Diego
x x x x x x x x x x x x x x x x x x x x x # of lanes blocked
Souteast Michigan COG - Detroit
x x x x x x x x x x x x x x x x x x x x x x See attachment
Houston, TX -- Motorist Assistance Patrol
x x x x x x x x x x x x x x x x Vehicle -- make, model, color, year, license plate; Driver -- male, female; number of occupants -- driver only, 2, 3, 4+; motorist use of cell phone -- # called, air time, motorist name & signature
New York DOT x x x x x x x x, 7 x x, 8 x x Other highways affected (if any); which ITS devices activated -- DMS, HAR
Colorado DOT - Lakewood
x x x x x x x x x x x x x Information collected for service patrol response to minor incidents only. There is currently no logging of major incident data (level 1, 2, 3 incidents) that the TMC responds to.

31
Table 3. Information Collected About Each Incident Event
Agency Roa
dway
Nam
e
Loc
atio
n/C
ross
-Str
eet N
ame
Blo
ck N
umbe
r
Det
ectio
n St
atio
n #
Lat
/Lon
g
Loc
atio
n of
Lan
es B
lock
ed
Inci
dent
Typ
e
Inci
dent
Sou
rce
Cur
rent
stat
us o
f Inc
iden
t
Tim
e in
cide
nt w
as d
etec
ted
(rep
orte
d)
Tim
e in
cide
nt w
as v
erifi
ed
Sour
ce o
f inc
iden
t ver
ifica
tion
Tim
e re
spon
se v
ehic
le a
rriv
ed o
n sc
ene
Typ
e of
res
pons
e ve
hicl
es o
n sc
ene
Tim
e re
spon
se v
ehic
les l
eft s
cene
Tim
e in
cide
nt w
as c
lear
ed fr
om
scen
e
Tim
e tr
affic
ret
urne
d to
nor
mal
flo
w
Roa
dway
Sur
face
Con
ditio
n
Roa
dway
Con
ditio
n
Lig
ht C
ondi
tion
Wea
ther
con
ditio
n
Inju
ries
pre
sent
# of
veh
icle
s inv
olve
d
Typ
e of
Veh
icle
s inv
olve
d
Inci
dent
Sev
erity
(qua
litat
ive)
Other Texas DOT – Houston
x x x x x x x x x x x x, 2 x x x x x x x Incident date; direction of travel; Before/After cross street
Illinois DOT – Chicago
x x x x x x x x x x x x x x x x x x x
City of Houston, Tx Police Dept
x x x x x HPD staffs a single console at TranStar. While more specific information is collected by the officer in the field, HPD at TranStar only logs some general information -- only for incidents that occur on the freeway system
North Carolina DOT
x x x x x x x x x x x Information only for motorist assistance patrols
Connecticut DOT x x x x x x x x x x x x x x x
1 = First on scene 2= removed from roadway altogether 3 = Individual dispatched, on scene, and benchmark points 4 = opening of lanes 5 = also record under maintenance/construction 6 = record weather at start of each shift as operator logs in 7 = time stamp when entered into MIST 8 = Not fields in software for this but try to indicate these in open comment field

32
Interestingly, only eleven agencies reported that they record the time that an incident was verified. However, in further discussion with the respondents, it was revealed that, in many cases, time the incident was detected (or reported) and the time the incident was verified are frequently the same time. Thirteen agencies reported that they record the time the first incident responders arrived on the scene. Similarly, slightly more than half of the respondents indicated that they routinely record the time the incident response vehicles leave the scene and/or the time the incident was cleared from the roadway. For the most part, agencies are primarily concerned with keeping track of the time that they implement or execute their response and are not overly concerned with recording the time that other responders perform certain functions. Only one agency reported that they record the time that the freeway returned to normal flow. A few common reasons cited for not recording this measure include the following:
• It is too hard to determine when “normal” flow occurs; • The congestion resulting from an incident last so long that operators tend to forget to go
back and log when normal traffic flow occurs; and • This time is not important to determining the effectiveness of the response.
Some respondents indicated that their software system automatically records the time (i.e., time stamps) every time the operator makes a change to the traffic control. For example, when the operator first initiates a message on a DMS, the time is logged by the system. If the operator changes the message, the time the new message is implemented by the system is logged. The advantage of this approach is that it takes the burden off the operator to log when certain changes are made.
Collection and Retention of Incident Data Table 4 summarizes how the respondents replied to questions concerning the collection and storage of incident data. An approximately equal number of agencies use manual (seven of the respondents) and automatic (eight of the respondents) means of collecting incident data. Four agencies reported that they use a combination of manual forms and automated systems for collecting information about incidents. In a few cases where agencies used manual data collection means, the forms were later transferred into automated systems for further processing and storage. Most agencies reported that their incident information either initially or eventually ended up in a database that could be queried. The survey also showed that information about specific incidents was generally kept for a long-time, with most agencies retaining their incident logs for three or more years. Agencies were also asked if they integrated their incident reports with any of the other incident responders. The general response was “no”; however, some agencies did state they have plans to begin integrating their freeway management center systems with a 911 dispatching center so that data from other agencies could be merged with incident records. This is expected to increase both the quality and quantity of data about incidents at these locations.
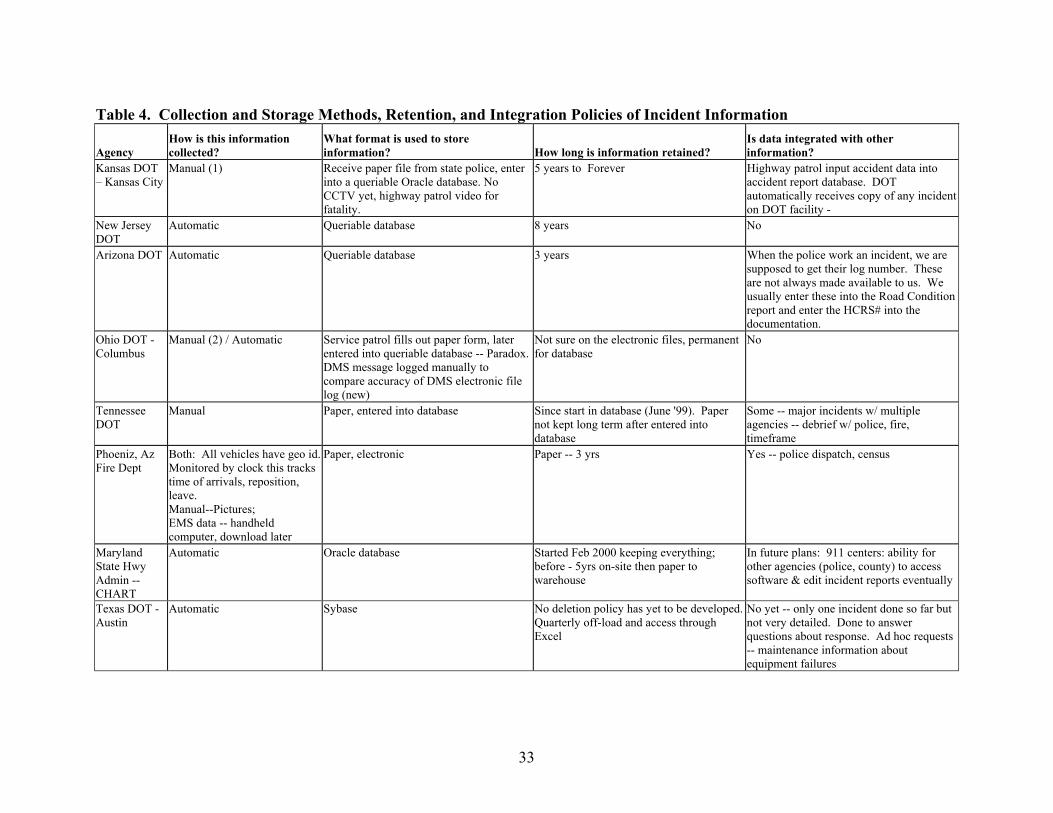
33
Table 4. Collection and Storage Methods, Retention, and Integration Policies of Incident Information
Agency How is this information collected?
What format is used to store information? How long is information retained?
Is data integrated with other information?
Kansas DOT – Kansas City
Manual (1) Receive paper file from state police, enter into a queriable Oracle database. No CCTV yet, highway patrol video for fatality.
5 years to Forever Highway patrol input accident data into accident report database. DOT automatically receives copy of any incident on DOT facility -
New Jersey DOT
Automatic Queriable database 8 years No
Arizona DOT Automatic Queriable database 3 years When the police work an incident, we are supposed to get their log number. These are not always made available to us. We usually enter these into the Road Condition report and enter the HCRS# into the documentation.
Ohio DOT - Columbus
Manual (2) / Automatic Service patrol fills out paper form, later entered into queriable database -- Paradox. DMS message logged manually to compare accuracy of DMS electronic file log (new)
Not sure on the electronic files, permanent for database
No
Tennessee DOT
Manual Paper, entered into database Since start in database (June '99). Paper not kept long term after entered into database
Some -- major incidents w/ multiple agencies -- debrief w/ police, fire, timeframe
Phoeniz, Az Fire Dept
Both: All vehicles have geo id. Monitored by clock this tracks time of arrivals, reposition, leave. Manual--Pictures; EMS data -- handheld computer, download later
Paper, electronic Paper -- 3 yrs Yes -- police dispatch, census
Maryland State Hwy Admin -- CHART
Automatic Oracle database Started Feb 2000 keeping everything; before - 5yrs on-site then paper to warehouse
In future plans: 911 centers: ability for other agencies (police, county) to access software & edit incident reports eventually
Texas DOT -Austin
Automatic Sybase No deletion policy has yet to be developed. Quarterly off-load and access through Excel
No yet -- only one incident done so far but not very detailed. Done to answer questions about response. Ad hoc requests -- maintenance information about equipment failures

34
Table 4. Collection and Storage Methods, Retention, and Integration Policies of Incident Information
Agency How is this information collected?
What format is used to store information? How long is information retained?
Is data integrated with other information?
Texas DOT –San Antonio
Automatic Electronic files Minimum of two years System tied directly to 911 map -- don't use one system to verify the other
Minnesota DOT - Minneapolis
Automatic queriable database -- Access (since 2001); prior to '01 – paper logs
Early '90 Recent had FHWA intern perform big analysis were compared police logs to system logs. Do not routinely perform comparison. Done on as needed basis and when staff available. Do produce annual volume/crash frequency report
Caltrans –San Diego
Manual Paper files and electronic files Less than 14 mo When needed.
Southeast Michigan COG – Detroit
Manual & Automatic Data stored in both paper and electronic formats. SEMCOG requests copies of the database and we query it using MS Access
SEMCOG has only just started to gather this data (over the past 5 years). Have kept all of it so far
Try to cross reference the MSP 911 data with the Freeway Courtesy Patrol data (checking to see how long abandon vehicle have been out on the roadway after they have been identified). Also integrate the MSP crash data (UD10 forms/database) with the incident database. Also integrate the incident information with road attribute file with includes fields like: lane, 85%ile speed; posted speed; land use, vehicle classification counts, traffic volume counts, etc.
Houston, Tx Motorist Assistance Patrol
Manual & Automatic Paper file, electronic files, queriable database -- Access
Data generated by MAP is compiled by TTI and returned to TxDOT for storing. Don't know how long they keep it
Yes. TTI compiles information and breaks numbers down to percentages.
New York DOT
Typed into MIST Queriable database -- Sybase Current six months active in system (last week of 6 months falls off each week); burn 6 mo. Data every week to CD for backup
Service patrol logs to different system, but if working an incident DOT is entering into MIST, then cross-reference to service patrol record entered.
Colorado DOT - Lakewood
Automatic -- Service patrol calls dispatch, dispatcher enters all info into database.
Oracle queriable database Indefinitely No
TxDOT - Houston
Automatic Flat files -- queriable database Indefinitely Not electronically. MAP files collected in same manner but different database

35
Table 4. Collection and Storage Methods, Retention, and Integration Policies of Incident Information
Agency How is this information collected?
What format is used to store information? How long is information retained?
Is data integrated with other information?
Illinois DOT – Chicago
Manual Paper file -- shared with DOT traffic, maintenance, and claims department
7 years Cross reference state police records; ETP service patrol uses fill-in the dot data cards, will soon be upgrading; the data is not routinely compared but the capability is there
City of Houston, TX Police Dept
Manual (3) Other (4) Paper. The Access database is used to enter incidents during each shift (two shifts per day). At the end of the shift, the daily activity log is printed. The database only retains the totals for the shift (data on individual incidents not saved in the database -- only on the printouts). The database is then used to prepare the monthly reports
Printouts of the daily activity logs are kept for 3 years.
North Carolina DOT
Manual (5) Queriable database Indefinitely (have been collecting for ~6yrs)
No
Connecticut DOT
Paper and electronic Incident reports are retained for 5 years No
(1) Accident Forms (2) Freeway service patrol incident log form (3) Accident reporting form filled out by officer in field, but does not go to TranStar (4) Incident data at TranStar is manually entered into an Access database (5) IMAP program -- called to TMC entered into database on local PC, moving to webpage to consolidate information
36
Incident Management Performance Measures Table 5 shows the general types of performance measures that are routinely computed by the agencies responding to the survey. Only half of the agencies responding indicated that they routinely compute incident-related performance measures. Not surprisingly, most of the agencies that are computing performance measures reported computing the following performance measures:
• Incident frequency, • Detection time, • Response time, and • Clearance time.
Operational Definition of Incident Management Performance Measures Table 6 shows the operational definitions that each agency is using to compute these performance measures. Interestingly enough, most agencies define “detection time” as the time that they were notified of the incident (i.e., the time that the incident was reported to them in their control center). Detection time is not defined as the time between when an incident actually occurred and when the agency was notified of the incident (either from emergency responders, operator observation, and direct report from citizen). Nearly all of the respondents indicated that they define “Response Time” as the elapse time between when the agency was first notified about an incident and when the first responder appeared on the scene. The primary difference in the way that agencies define response time is that emergency responders typically define response time as the time from when an incident was reported to their dispatcher to the time when their response vehicles arrive on the scene. Transportation agencies generally measure response time from when the call comes into the TMC (or service patrol dispatcher) to when first response vehicle arrives on the scene, regardless to which agency the vehicle belonged (i.e., this could be a fire vehicle, police vehicle, or service patrol vehicle). The problem with defining response time this way is that often times, the transportation agency does not have any control over when the emergency service providers are dispatched or the priorities that are assigned to different types of incidents. In many cases, the response time that is reported by many transportation agencies is actually the time between two unrelated events (i.e., notification of the incident and the dispatching and arrival of the response vehicles). This is especially true when the traffic management center (TMC) is not the first agency notified of the incident (which is generally the case in most metropolitan areas). Without integrating or comparing records from the dispatching agency, the response time may not represent the true response time of the first responder to the incident, but merely the time between unrelated events. Clearance time is another measure that varies dramatically between freeway management operators and emergency service providers. For the most part, transportation agencies define clearance time as between when the first responder arrives on the scene (regardless of which agency they work for) to when the incident is cleared from the roadway. Emergency service providers typically define clearance time as the time between when the first of their units arrive on the scene to when their unit leaves the scene and can be deployed elsewhere.

37
Table 5. Typical Performance Measure Routinely Computed by Agencies What measures do you routinely compute?
Agency
Do you calculate
Performance Measures?
Incident Frequency
Incident Rate
Detection Time
Response Time
Clearance Time
Number of Secondary Incidents
Time to Normal
Flow Incident
Delay Others Kansas DOT Yes x (1) Kansas DOT - Kansas City No (2) New Jersey DOT Yes x x x Arizona DOT Yes (3) x x x (4) Ohio DOT - Columbus No (5) Tennessee DOT No (6) City of Phoenix Fire Dept Yes x x x x x x x (7) Severity; Nature of Damage; Injuries Maryland State Hwy Admin – CHART
Yes (8) x x x x x x x Delay hours; environmental impacts; frequency by location; # of disabled vehicles assisted
Texas DOT -Austin No (9) Error logs -- preventative maintenance Texas DOT –San Antonio No (10) x x x Minnesota DOT – Minneapolis Yes x x (11) Caltrans –San Diego No (12) Southeast Michigan COG – Detroit
Yes x x x x x x x Air quality -- pollutants (e.g., amounts of VOC, NOx, and CO)
Houston, TX -Motorist Assistance Patrol
Yes (13) x x x (14) x x x
Types of assists provided (used to stock supplies); location of incidents (by corridor, by segment)
New York DOT No Colorado DOT – Lakewood No
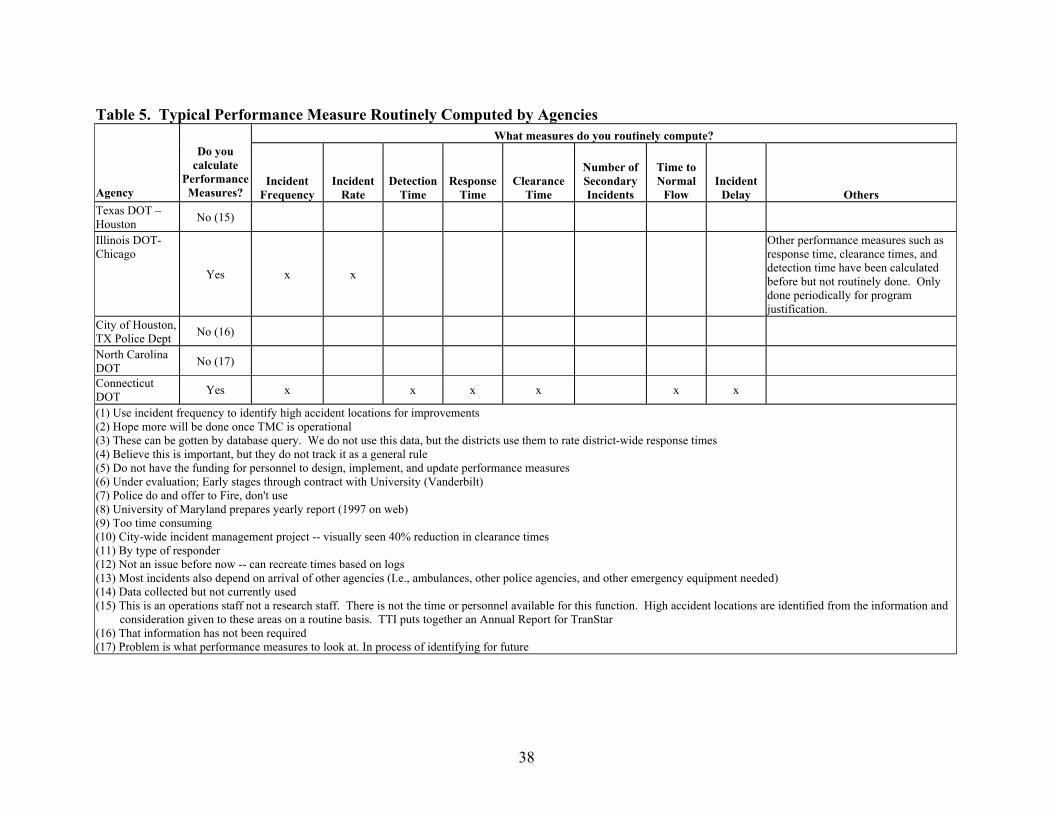
38
Table 5. Typical Performance Measure Routinely Computed by Agencies What measures do you routinely compute?
Agency
Do you calculate
Performance Measures?
Incident Frequency
Incident Rate
Detection Time
Response Time
Clearance Time
Number of Secondary Incidents
Time to Normal
Flow Incident
Delay Others Texas DOT – Houston No (15) Illinois DOT- Chicago
Yes x x
Other performance measures such as response time, clearance times, and detection time have been calculated before but not routinely done. Only done periodically for program justification.
City of Houston, TX Police Dept No (16) North Carolina DOT No (17) Connecticut DOT Yes x x x x x x (1) Use incident frequency to identify high accident locations for improvements (2) Hope more will be done once TMC is operational (3) These can be gotten by database query. We do not use this data, but the districts use them to rate district-wide response times (4) Believe this is important, but they do not track it as a general rule (5) Do not have the funding for personnel to design, implement, and update performance measures (6) Under evaluation; Early stages through contract with University (Vanderbilt) (7) Police do and offer to Fire, don't use (8) University of Maryland prepares yearly report (1997 on web) (9) Too time consuming (10) City-wide incident management project -- visually seen 40% reduction in clearance times (11) By type of responder (12) Not an issue before now -- can recreate times based on logs (13) Most incidents also depend on arrival of other agencies (I.e., ambulances, other police agencies, and other emergency equipment needed) (14) Data collected but not currently used (15) This is an operations staff not a research staff. There is not the time or personnel available for this function. High accident locations are identified from the information and
consideration given to these areas on a routine basis. TTI puts together an Annual Report for TranStar (16) That information has not been required (17) Problem is what performance measures to look at. In process of identifying for future

39
Table 6. Operational Definition of Performance Measures Used to Evaluate Response Systems Performance Measure Agency Operational Definition
City of Phoenix Fire Dept Time based, incident/shift, also calculate week, month, year and compare to last year Maryland State Hwy Admin – CHART How often occurs at a given location (mile post)
Incident Frequency
Connecticut DOT Any time there is a blockage of highway, an incident is established City of Phoenix Fire Dept # of incidents per month or year; look at each different category and calculate; use to shift response Incident Rate
Maryland State Hwy Admin – CHART ADT x # of incidents New Jersey DOT When DOT finds out about the incident Arizona DOT Delay from the time that an incident occurs until it is reported
City of Phoenix Fire Dept 1st report to dispatch; if official (Police, city); ask them when they detected. Keep track of who reported incident (official or civilian)
Maryland State Hwy Admin – CHART 1st person sees to calling it in
Texas DOT – San Antonio System parameter (2 minutes) -- use 20 sec interval data with rolling average (6 cycles). System usually 1 or so minutes after call
Caltran – San Diego "Reported Time" -- time when report comes into center Houston Motorist Assistance Patrol Time of notification, also driver estimate of time of occurrence
Detection Time
Connecticut DOT The time the incident is reported to the TOC via surveillance equipment or verified phone calls New Jersey DOT Time for DOT to get there
Arizona DOT Starts with live voice reports receiving page and then they are responding. Ends when unit reports they are on-scene.
City of Phoenix Fire Dept Time elapse between 1st dispatch contact to 1st vehicle on-scene Maryland State Hwy Admin – CHART Time call received until arrive on scene Texas DOT – San Antonio System logs time every time a change or update is made to response scenario
Minnesota DOT – Minneapolis Time detected to time responders arrived on scene; camera-based; not perfect -- only when operator observes when respond on scene
Caltran – San Diego Time when 1st responder arrive on-scene
Response Time
Houston Motorist Assistance Patrol Dispatch time and time of arrival

40
Table 6. Operational Definition of Performance Measures Used to Evaluate Response Systems Performance Measure Agency Operational Definition Connecticut DOT The time responders arrive on scene. Arrival time and response time are calculated for state police
only out of the Bridgeport operations center coverage area. ConnDOT only contacts its internal responders such as bridge safety, construction, maintenance, and electrical and service patrol when required. The contact time and arrival time is then kept. Arrival time only for emergency responders such as EMS, wrecker, fire, and environmental protections is also noted. DOT does not normally contact these responders initially
New Jersey DOT Time between detection and incident cleared from scene
Arizona DOT When unit reports they are clear or when operator sees all units clear. This is for when the ADOT vehicle leaves the scene.
City of Phoenix Fire Dept Time fire department declares incident over, usually as driving away from scene Maryland State Hwy Admin – CHART How long from notification to clear, or until delays clear / all lanes open is what they use Texas DOT – San Antonio Time 1st vehicle arrives on scene until lanes open Caltran – San Diego Time when roadway opened Houston Motorist Assistance Patrol Time incident ends and clearing of incident from roadway
Clearance Time
Connecticut DOT The time the accident or debris is removed from the travel way Arizona DOT Accidents that occur back in queue
City of Phoenix Fire Dept Count of accidents, injury, fire, hazmat each count as one not a different incident #; 1 incident with multiple parts
Maryland State Hwy Admin – CHART Pinpoint incident is created by delay from previous incident, call by operator Caltran – San Diego Don't know how to compute
Number of Secondary Incidents
Houston Motorist Assistance Patrol Time of notification City of Phoenix Fire Dept Set by incident commander. Wait at scene until flow returns to normal for time. Subjective. Maryland State Hwy Admin – CHART Back to operating capacity for time-of-day
Time to Normal Flow Houston Motorist Assistance Patrol When incident clears and blockage has been removed from freeway
Maryland State Hwy Admin – CHART Length of distance (5 mile delay) Max delay (example: 10 mile backup) Incident Delay Houston Motorist Assistance Patrol Time of duration

41
Most agencies agree that the number of secondary accidents resulting from an incident was a difficult measure to compute. In most cases, this was considered to be a subjective measure of the operator. One agency, however, defined a secondary accident to be any accident that occurred within a defined radius and time frame of the first incident. Both the distance and time parameters changed by time-of-day to reflect the different levels of congestion that forms around incidents. Maryland defines incident delays in term of queue distance. They generally use measures such as the length of congestion (e.g., a five-mile delay or a 10-mile backup) to help define incident delays. Queue distance is a parameter that can be observed almost instantaneously via the surveillance cameras while delay requires that the time it takes drivers to pass through the congestion be measured.
Origins of Performance Measures In Table 7, respondents were asked about the origin of the operational definitions being used to generate the performance measures (i.e., the driving force behind the generation of the performance measures they are currently using). Several of the respondents indicated that the performance measure that they are currently generating were developed by FHWA and are being used by FHWA and their local administration to monitor their performance over time. Several other of the respondents indicated that the measures they are currently using have evolved over time. As objectives of the control center changed or as new tasks and capabilities were added, new performance measures were added or old ones have been modified to reflect the new objectives of their system. Interestingly, both of the emergency service providers that replied to the survey indicated that they have been collecting performance measures that are standard for their industry. It appears that these performance measures are used as a resource management tool for evaluating staffing and asset allocations. In an attempt to gain insight into other potential performance measures, each respondent was asked if there were other performance measures that were not currently being generated by their system, but would be desirable or helpful to analyzing the effectiveness of the incident response in their area. Table 8 summarizes the responses obtained to these questions. For the most part, agencies’ response fit into two categories. One group of agencies wants to generate more of the traditional performance measure (such as incident frequencies, incident rates, detection time, response time, etc.) while the other group wants to collect performance measures that relate to administrative and institutional issues (such as operator workload, camera utilization by other entities, web page hits, etc.). Most agencies, however, basically agree that better quality of data needs to be entered into their systems to make the performance measures more meaningful.

42
Table 7. Origin of Operational Definition for Performance Measures Being Used
Agency How were these operational definitions derived? By whom? What was the process for deriving them? Were other agencies involved? If so who were they and how?
New Jersey DOT Derived over time, FHWA and management of traffic operations at DOT have asked for it Arizona DOT The software developers were in-house. They actually asked the operators what they wanted. We found
out what management wanted, and told the developers how we wanted to amass the data. We kept the screens simple and eliminated the garbage as we found we didn't use or management didn't need what the screen or a button was offering. We also deleted things that would not work (Emergency notification systems). Driven by available funds.
City of Phoenix Fire Dept
Labor management committee that deals with performance measures (3 union officers; 3 fire dept. managers; shift commanders, exec. office). 1960's. Devised definitions for measures and guides, reviewed annually
Maryland State Hwy Admin - CHART Work w/ FHWA over years, standard definitions Texas DOT - Austin Developed by Traffic Operation Divisions at Headquarters Minnesota DOT -- Minneapolis
Look at data recorded to see what information can be tracked over time. Looking for trends that can be addressed (e.g. Highway Helpers)
Southeast Michigan COG – Detroit By SEMCOG and the Metro Detroit Incident Coordinating Committee Houston-Motorist Assistance Patrols
We are a police agency. We follow normal police data gathering according to our Department SOP
Connecticut DOT General knowledge from other agencies thru 1-95 Corridor Coalition
Table 8. Other Performance Measures Not Currently Being Collected, but Desirable
Agency Are there other performance measures that you are not collecting but think would be beneficial?
New Jersey DOT Incident frequency, rate, secondary accidents, and incident delay Tennessee DOT Interfacing w/ police records ==> high incident rates, commuter times/speeds Maryland State Hwy Admin. – Chart
Balance of operator workload; tow response to scene
Texas DOT - Austin Institutional issues ==> camera control (other agencies causing problems); web page hits (how many people looking at cameras)
Texas DOT – San Antonio Travel times; partial restoring of capacity (i.e., when lanes where opened) Minnesota DOT -- Minneapolis
Better quality of information
Southeast Michigan COG – Detroit
Haven't really given it much thought only because we are focused on making the data better (more accurate). For example, a call may be taken and dispatched but the officer can't locate any incident so instead of clearing the call the record is left with no clear time or any explanation as to why the data is missing.
Houston- Motorist Assistance Patrols
No
New York DOT Would like to collect response time, clearance time, resumption of normal flow, and times individual lanes were open/closed. Got an estimate of $100K to upgrade MIST for these add-ons -- not being pursued right now.
Illinois DOT -- Chicago Detection time -- improving *999 and CCTV; Response time -- collecting data to calculate response time but not aware of it being used.
City of Houston, TX Police Department
Clearance time

43
Costs of Generating Performance Measures One objective of this task order was to capture information about the costs associated with collecting, processing, and reporting performance measures for incident management systems around the United States. Almost all of the responding agencies indicated that it was impossible to separate the costs of producing performance measure reports from their typical operating costs. For the most part, agencies consider the cost of collecting data for producing performance measures and performance measure reports as part of their normal operations, and the costs associated with producing special performance reports (such as those requested on demand) are included as part of their normal operating budgets. Table 9 summarizes a few of the responses received from individuals when questioned about the issue of costs.
Incident Management Performance Reports The respondents were also surveyed as to the type, frequency, and use of reports they produced that documented the performance of their incident management systems. These responses can be found in Table 10 through 13. Only eight of the responding agencies indicated that they routinely produce reports so they could monitor the performance of their incident management systems over time. Most of these agencies are reporting their performance measures on a system-wide basis. Five of the agencies also indicated that they routinely produce performance reports by roadway segment, and by facility as well. Many of the agencies reported that their software/data management systems are flexible enough to generate performance measure reports at any level. Table 11 shows the frequency at which the responding agencies produce performance reports while Table 12 summarizes the uses of the performance reports. The frequency at which agencies produce performance reports varies greatly and seems to be a function of their use. Almost all of the transportation agencies that responded indicated that they produce performance reports on a monthly or quarterly basis. Monthly reports are generally used by the operations staff to track use of resources and include such information as the number and type of incidents, the type of responses (or assistance), the devices and/or resources used to manage the incident, the schedules of staff, and the high incident locations. Mid-level administrative staff generally use quarterly reports to assist in the coordination of incident responses across institutional and/or jurisdictional boundaries.
Table 9. Estimated Cost for Collecting, Processing, and Reporting Performance Measures
Agency What would your estimate of cost to be for collecting, processing, and reporting you performance measures?
Arizona DOT The cost to set up the decision, notification, data collection system that is used for this was part of the AzTech funding.
Maryland State Hwy. Admin – CHART
Contract with University for performance measures
Caltrans – San Diego
Not a way to separate costs for this specific function

44
Both of the fire and police agencies that responded to the survey indicated that they generally produce daily reports of the “incidents” (not just those related to traffic operations) that they work. Watch commanders generally use these reports to assess the workload and readiness of the various units to respond to other types of incidents.
Table 10. Aggregation Level of Performance Reports
Agency By
Facility By
Segment System-
Wide Other Kansas DOT – Kansas City - - - Accident frequency can be on any of these levels New Jersey DOT - - x Arizona DOT - - x (1) Ohio DOT – Columbus - - - Tennessee DOT - - - City of Phoenix, AZ Fire Department x x x Maryland State Hwy. Admin – CHART x x x Upon request Texas DOT -Austin x x x Monthly reports on LCU failures; communications errors Texas DOT –San Antonio - - -
Everytime something is changed, system documents time; therefore, have complete "history" of response
Minnesota DOT- Minneapolis - - -
By responder on monthly basis; also produce annual crash/volume report, by location
Caltrans –San Diego - - - By incident Southeast Michigan COG – Detroit x x x Houston, Tx –Motorist Assistance Patrols x x x New York DOT - - - Colorado DOT – Lakewood - - - Texas DOT – Houston - - - Illinois DOT – Chicago x City of Houston, TX Police Department - - - North Carolina DOT - - - Connecticut DOT - - - (1) Think they are generated system-wide, but know they are grouped by Districts and ORGS (small operating units). Districts then examine the reports specific for their area.

45
Table 11. Frequency at Which Performance Measures Reported Agency How often are they produced?
New Jersey DOT Monthly Arizona DOT Quarterly City of Phoenix, AZ - Fire Dept. Daily (Captain gets his last shift & last shift before he arrived) Maryland State Hwy. Admin – CHART
Monthly-- # of incidents by reg; assists; use of devices (monthly meetings); Annually -- big picture by University, legislature, other agencies
Texas DOT – Austin Quarterly Texas DOT – San Antonio
As Needed basis -- have done 2 system wide evaluations; also use on-line survey on homepage to gauge motorist responses (subjective)
Minnesota DOT– Minneapolis Monthly and yearly -- incidents by type and response; special days (e.g., snow days) Caltrans-San Diego As needed basis -- some annual (accidents); monthly -- for meeting purposes Southeast Michigan COG – Detroit
Monthly (for operators); quarterly (coordinating committee); and annually (program evaluation)
Houston,Tx - Motorist Assistance Patrol Quarterly Colorado DOT– Lakewood Monthly Illinois DOT – Chicago Annually City of Houston, TX Police Dept Daily; monthly Connecticut DOT As needed basis; monthly All of the agencies indicated that they also produce annual reports for their systems. These annual reports generally provide an overall summary of the performance of the system and give a “big picture” view of the effectiveness of the system. High-level administrators typically use these annual reports to provide justification for continued operation or expansion of their incident management programs. These reports are also used to identify high incident or “hot spot” locations. Several agencies indicated that they would occasionally produce performance measure reports on individual or specific incidents. These reports are generally produced on an “as needed” basis and are used to critique the performance of the response agencies and to address problems with the responses to specific incidents. Generally, transportation agencies use these reports as a mechanism for improving coordination between response agencies.

46
Table 12. Uses for Performance Measure Reports
Agency How are these measures generally used in your system? New Jersey DOT Feds look at it, not really used by DOT though City of Phoenix, AZ – Fire Dept.
1) Response planning; 2) Budget planning; 3) Quality Assurance (10% detailed check); 4) Internal Assessment - by command officers, mostly fire side
Maryland State Hwy Admin – CHART
To get funding (big picture report); identify "hot spots"
Texas DOT – Austin Access queries through Sybase
Minnesota DOT– Minneapolis
Generally tracking trends; in past month or two started generating reports to track operators; use w/ media for political support
Caltrans— San Diego Automatically by the system software
Southeast Michigan COG – Detroit
They are provided to the Incident Management Coordinating Committee, MDOT, and the FCP operators. They are also provided to the MSP, as requested, for selective enforcement. MDOT uses the information for determining the benefit of the FCP program and to obtain additional funding for expansion.
Colorado DOT – Lakewood Statistics, program justification
Illinois DOT – Chicago
Incident frequency/rate used in justification of service patrol, used to determine locations for safety improvements
City of Houston, TX Police Dept Not sure how they are used
Connecticut DOT
Can be used to evaluate staffing schedules, determine high accident locations, and evaluate effective response time and performance.
Arizona DOT We use them to prove we are achieving our goals Texas DOT – San Antonio Justify giving less money to ITS
Houston, TX – Motorist Assistance Patrol
To determine success of program and deputy performance ratings.
Respondents were also asked to indicate whether they thought these performance reports were timely, useful, and accurate. Table 13 summarizes these responses. While most of the respondents generally felt the reports were timely and provided decision-makers with the appropriate level of information they need, a few questioned the usefulness (particularly from the viewpoint of the operators) and the accuracy of the information. Several respondents indicated that they did not exactly know how the higher-level administrators in their agencies actually used the information.

47
Table 13. Timeliness, Usefulness, and Accuracy of Incident Management Performance Measures
In general, do you think the information in these reports or the performance measures themselves to be …
Agency Timely? Useful? Accurate?
Provide the information necessary for effective
decision-making? New Jersey DOT Yes Yes(1) Yes No(2) Arizona DOT No(3) Yes No(4) Yes City of Phoenix, AZ – Fire Dept Yes Yes (5) Yes Yes Maryland State Hwy Admin – CHART Yes Yes Yes Yes Texas DOT - Austin No Yes Yes Yes Minnesota DOT– Minneapolis Yes Yes (6) No (7) Yes Caltrans-San Diego Yes - Yes Yes Southeast Michigan COG – Detroit Yes Yes Yes Yes Houston, TX. Motorist Assistance Patrol Yes Yes Yes Yes Colorado DOT– Lakewood Yes Yes Yes Yes Illinois DOT – Chicago Yes Yes Yes Yes City of Houston, TX Police Dept. Yes Not sure Yes Not sure Connecticut DOT Yes Yes Yes Yes (1) Somewhat -- not enough “meat” to be really useful, just break down number of incidents over and under one hour, by type, monthly average incident duration, etc. (2) Don't know enough to capture enough (3) Quarterly reports are up to 3 months behind today (4) It depends on where you get the data -- somehow different people can find different numbers (5) For targeted audience (6) Over time (7) Based on operators view - not as good as could be
Integration of Incident Records and Information Agencies were also asked about the kinds of incident information other agencies kept and their efforts to use this other information to supplement data used to develop incident management performance measures. Their responses are summarized in Tables 14 and 15. Although many agencies are aware of other sources of incident records (such as 911 dispatching logs), relatively few agencies indicated that they routinely integrate response information about incidents with other agencies (such as fire and police). Several agencies mentioned, however, that efforts were underway in their areas to integrate police and fire computer-aided dispatching (CAD) systems with their freeway management systems. These agencies anticipated that

48
integrating 911 CAD dispatching with their systems should greatly enhance response and record-keeping capabilities. Several agencies indicated that they do combine information (or harmonize information) with police and/or emergency response agencies on an “as needed” basis. Generally, this involves taking information for the transportation agency’s logs and matching them with information on the police or fire incident report forms. In those few cases when this is done, it is generally done as part of a debriefing effort between agencies after a major incident or as part of the preparation for litigation. Generally, when this is done, agencies find the exercise to be fruitful in helping to establish a timeline of response events to a specific incident, which, in turn allows them to more readily identify problems or bottlenecks in the response process.
Issues Involved in Establishing an Incident Management System Table 15 shows how various agencies responded to questions concerning the issues faced when establishing an incident management system. Common issues cited include the following:
• Bringing agencies together to work in a coordinated and integrated fashion; • Expanding the system to meet new objectives or added functionality with limited
resources; • Being the “new guy on the block” and having to establish a good working relationship
with other response agencies; • Providing consistent training for all agencies responsible for responding to incidents; • Working with emergency services to strike a balance between providing a safe work
environment for responders and maintaining traffic flow past the incident; • Maintaining security of the system and confidentiality of data without effecting
performance or response; • Getting accurate information entered into databases without overburdening operators
with too many data entry screens; • Asking operations centers to do too much with too little resources; and • Involving private towing industry in development of system.
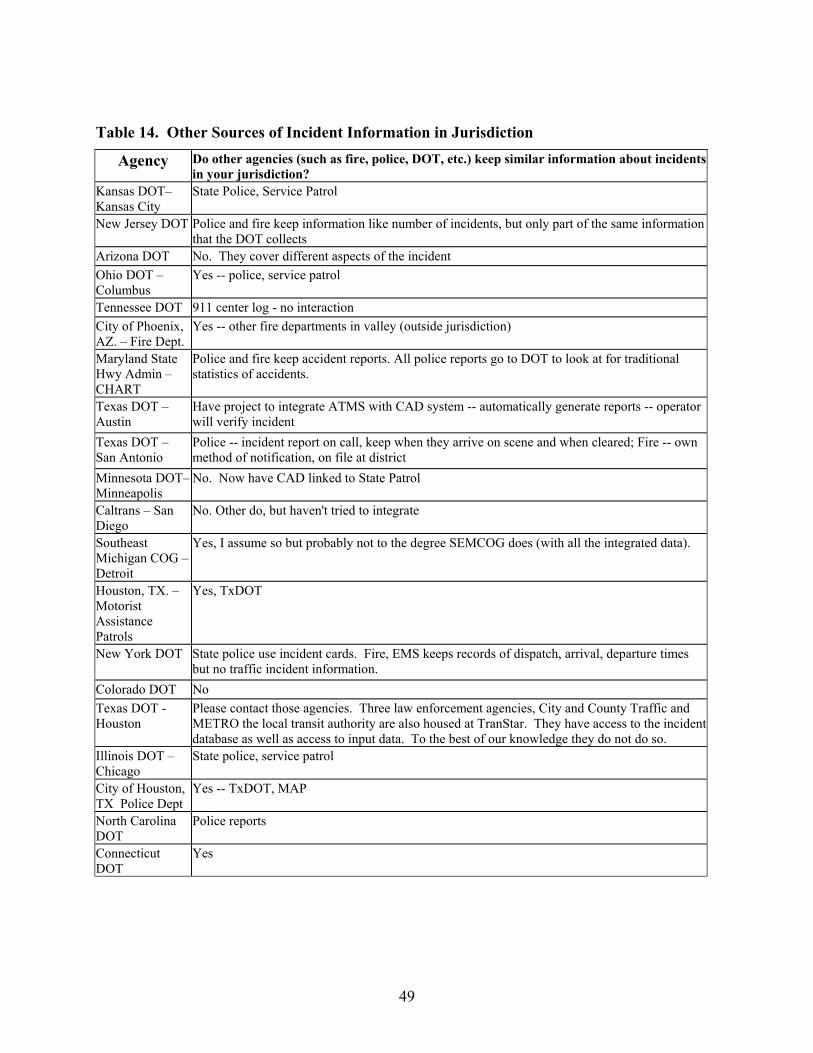
49
Table 14. Other Sources of Incident Information in Jurisdiction
Agency Do other agencies (such as fire, police, DOT, etc.) keep similar information about incidents in your jurisdiction?
Kansas DOT– Kansas City
State Police, Service Patrol
New Jersey DOT Police and fire keep information like number of incidents, but only part of the same information that the DOT collects
Arizona DOT No. They cover different aspects of the incident Ohio DOT – Columbus
Yes -- police, service patrol
Tennessee DOT 911 center log - no interaction City of Phoenix, AZ. – Fire Dept.
Yes -- other fire departments in valley (outside jurisdiction)
Maryland State Hwy Admin –CHART
Police and fire keep accident reports. All police reports go to DOT to look at for traditional statistics of accidents.
Texas DOT – Austin
Have project to integrate ATMS with CAD system -- automatically generate reports -- operator will verify incident
Texas DOT – San Antonio
Police -- incident report on call, keep when they arrive on scene and when cleared; Fire -- own method of notification, on file at district
Minnesota DOT– Minneapolis
No. Now have CAD linked to State Patrol
Caltrans – San Diego
No. Other do, but haven't tried to integrate
Southeast Michigan COG – Detroit
Yes, I assume so but probably not to the degree SEMCOG does (with all the integrated data).
Houston, TX. – Motorist Assistance Patrols
Yes, TxDOT
New York DOT State police use incident cards. Fire, EMS keeps records of dispatch, arrival, departure times but no traffic incident information.
Colorado DOT No Texas DOT - Houston
Please contact those agencies. Three law enforcement agencies, City and County Traffic and METRO the local transit authority are also housed at TranStar. They have access to the incident database as well as access to input data. To the best of our knowledge they do not do so.
Illinois DOT – Chicago
State police, service patrol
City of Houston, TX Police Dept
Yes -- TxDOT, MAP
North Carolina DOT
Police reports
Connecticut DOT
Yes
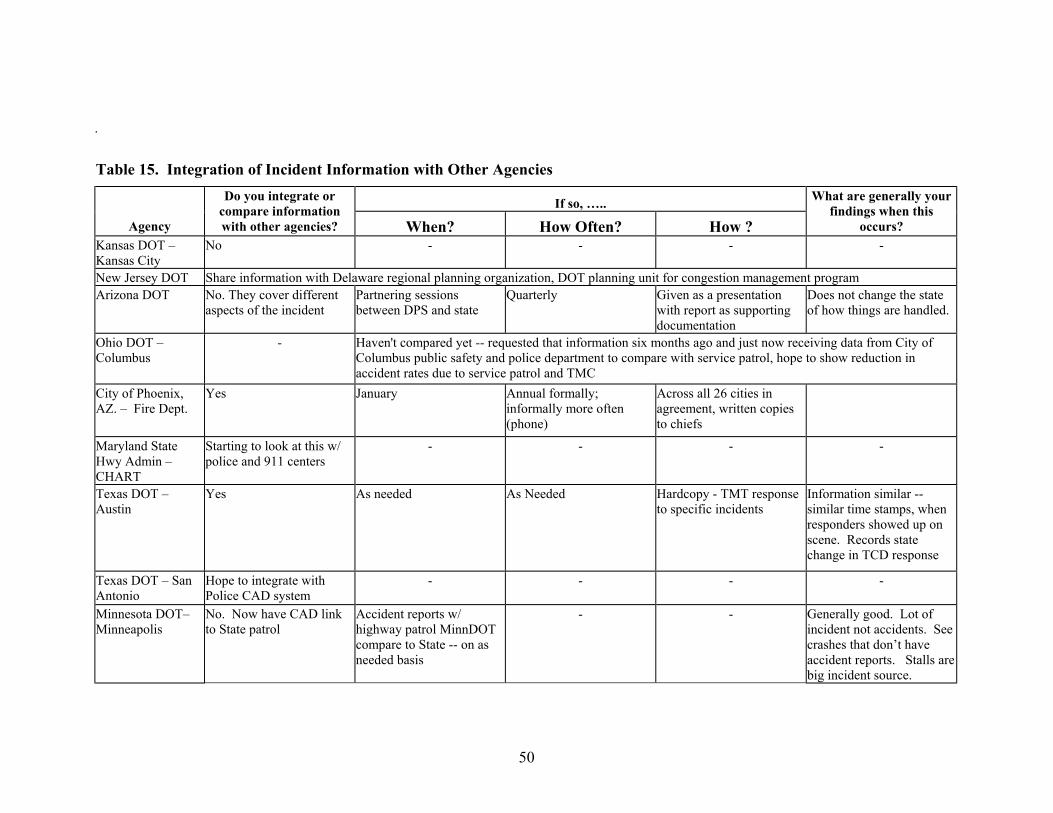
50
Table 15. Integration of Incident Information with Other Agencies
If so, …..
Agency
Do you integrate or compare information with other agencies? When? How Often? How ?
What are generally your findings when this
occurs? Kansas DOT – Kansas City
No - - - -
New Jersey DOT Share information with Delaware regional planning organization, DOT planning unit for congestion management program Arizona DOT No. They cover different
aspects of the incident Partnering sessions between DPS and state
Quarterly Given as a presentation with report as supporting documentation
Does not change the state of how things are handled.
Ohio DOT – Columbus
- Haven't compared yet -- requested that information six months ago and just now receiving data from City of Columbus public safety and police department to compare with service patrol, hope to show reduction in accident rates due to service patrol and TMC
City of Phoenix, AZ. – Fire Dept.
Yes January Annual formally; informally more often (phone)
Across all 26 cities in agreement, written copies to chiefs
Maryland State Hwy Admin – CHART
Starting to look at this w/ police and 911 centers
- - - -
Texas DOT – Austin
Yes As needed As Needed Hardcopy - TMT response to specific incidents
Information similar -- similar time stamps, when responders showed up on scene. Records state change in TCD response
Texas DOT – San Antonio
Hope to integrate with Police CAD system
- - - -
Minnesota DOT– Minneapolis
No. Now have CAD link to State patrol
Accident reports w/ highway patrol MinnDOT compare to State -- on as needed basis
- - Generally good. Lot of incident not accidents. See crashes that don’t have accident reports. Stalls are big incident source.

51
Table 15. Integration of Incident Information with Other Agencies
If so, …..
Agency
Do you integrate or compare information with other agencies? When? How Often? How ?
What are generally your findings when this
occurs? Caltrans – San Diego
Yes For specific reason – may debrief after major incident; serve in court case
Infrequently, rare - -
Southeast Michigan COG – Detroit
Yes Whenever we can - Using GIS Still being determined.
New York DOT Yes Can find out from state police (co located). Time incident came in -- can use to enter more accurate detection time than time stamp from MIST when entered (for major incidents)
- May get CAD system in future, be able to query other agency activities.
-
Texas DOT - Houston
- - - - Law enforcement does not share information readily with the DOT
City of Houston, TX Police Dept.
No - - - -
North Carolina DOT
Yes Varies -- regular meeting in areas to critique incident management
Monthly Meeting of interagency Committee
Depends on area. Don't want to point fingers in area. Good information for improving response.

52
Table 16. Issues Faced in Setting Up Incident Management System
Agency What kinds of issues were faced when setting up the system and how were they resolved? Kansas DOT– Kansas City
Current system is incident management manual. Manual is posted on website (www.kdot1.kfdot.org/public/kdot/kcmetro/kcindex). Website also includes press release, lane closures, etc.; before, had problems with police/fire unnecessarily blocking lanes (e.g., fire block 2 lanes to extinguish brush fire, police not clearing lanes fast enough; before, multiple agencies may respond to major incidents. No way to notify media, because each agency might want to use different diversion route. Now 30 cities, 12 counties, 2 states cooperate, use incident manual Juanita developed. She talked to each agency before developing manual to get input, then again after created to explain need for prompt response and clearance. Manual has planned diversions for specific locations, list of contacts, and also describes what agencies cover what, and when to notify other agencies including other states and federal agencies. Manual is updated 2 times/year. All agencies receive e-mail to notify of manual updates.
New Jersey DOT
Have problems trying to expand. Feds are behind expansion 100 percent as is the MPO, but design wants to spend money for paving, etc.
Arizona DOT We went from a Phoenix-only based operation to a statewide center. Created institutional barriers within the state DOT as local employees started to handle statewide system issues. Financial barriers were encountered in the form of communications needs. Operations were found to be non-uniform across the state. Training for the handling of incidents was found to be inconsistent. Creation of standards for training.
Ohio DOT– Columbus
It is going to take some time to develop a real collaborative effort with all of us to understand that we work for the same employer -- the taxpayer. City police work real well on freeway, understand the importance of quick removal of lane blocking incidents. Have problems with the fire department blocking too many lanes (e.g., blocking three lanes for a one lane blocking incident). Had a recent event where multiple units on the side of the freeway with the incident blocked extra lanes. An additional fire unit arrived on the other side of the freeway and blocked the inside lane, they were not needed but remained on scene in the vehicle. Police did not make them clear the area. Have heard fire agencies in other areas act similarly, may need Washington to act to change. Need better communication system between agencies, currently using cell phones.
Tennessee DOT
They are the "new guy". Initially, had warm welcome at scene. Has greatly improved over years. Quick clearance issues w/ fire dept. Trying to add this to fire training; Memorandum of understanding with TennDOT and local
City of Phoenix, AZ – Fire Dept.
System very old, built like snowball (began in 1945 with chiefs meeting and sharing; 1960 expanded kept information; 1971 began paramedics; 1977 HAZMAT); At each expansion, obstacles were City Manager asking why greater funds; labor sees this as extra added to their job -- collecting was a pain -- automation has minimized this.
Maryland State Hwy Admin –CHART
Hard to get code that is user (operator) friendly from contractor (off-the-shelf) -- want to create custom software
Texas DOT – Austin
How do we use the system -- when/how do we pull information from the system
Texas DOT – San Antonio
Security (keeping the system safe so someone can't corrupt the system) and confidentiality (displaying accidents without notify family, police need more detailed personal information than traffic)
Caltrans – San Diego
Too much to do; too little resources

53
Table 16. Issues Faced in Setting Up Incident Management System
Agency What kinds of issues were faced when setting up the system and how were they resolved? Houston, TX – Motorist Assistance Patrols
Funding -- type of vehicles to use, type of services to offer; Funding -- created a public/private partnership; Vehicles -- Carrying capacity and safety of vehicle; Services -- determined type of incidents that might occur while driving.
Colorado DOT – Lakewood
Getting accurate information to database, increased training; Response/clearance times reduced now through cooperation with police. DOT has provided police units with courtesy patrol radios, so courtesy patrol can contact police directly from the scene if police involvement needed.
Texas DOT - Houston
When the integrated incident management database was developed, input was requested of all TranStar partner agencies. This included Law Enforcement and Transit. There were features requested by Law Enforcement that have never been used because they choose not to get involved in inputting data. However incorporating these features expanded the database GUI beyond what was needed by TxDOT causing operators to have to sift through more functions than were required. However, it was deemed that too much was better than too little.
IlDOT Private towing industry complaints when starting up service patrol, those issues were ironed out over time. Some opposition to using tax dollars for service patrol, but have showed that the peak periods are shorter with the patrol than without. Been in the incident management business for 40 years, none of those guys left to talk to.
North Carolina DOT
Turf battles between agencies -- face-to-face talks
Most Important Things To Be Measured in Incident Management Program As a final question in the survey, respondents were asked what were the most important things to be measured in an incident management program, whether or not they were currently collecting the particular performance measures. Their responses are contained in Table 17. Almost all of the agencies agreed that monitoring time-related performance measures was important for gauging the success of an incident management program. Important time-related performance measures to the monitored include the following:
• Response time, • Duration on scene, • Clearance times, and • Detection times.
Many also cited the need to have performance measures that relate to the quality of the service being provided, or to quantify the ability of the system to monitor and effect a change in the traffic control. Several performance measures that agencies mentioned along these lines include the following:
• The amount of delay caused by incidents in the system; • The road user costs associated with congestion caused by incidents; • The reduction in the overall delay caused by incidents; • The reduction in the total duration of the incident (how long lanes were blocked); and • The reduction in driving time of the public through incident scenes.

54
Table 17. Most Important Thing to Measure in Incident Management Program
Agency In your opinion, what are the most important things to be measured, whether or not you are currently collecting?
New Jersey DOT Delay caused by incidents; road user costs, B/C -- how incident duration is reduced by ITS Arizona DOT Notification, detection, response time, on-scene time, clear time, and closing of incident Ohio DOT – Columbus It differs from urban area to urban area. The incident managers need to define their worst
enemy, e.g., Hazmat, roadway geometries, weather, etc. and collect data before and after program implemented to show reduction in performance measures for program justification.
Tennessee DOT Time of clearance -- moved to shoulder or exit; # of response units -- make sure isn't people there that don't need to be
City of Phoenix, AZ –- Fire Dept.
Time related measures; quality (of performance) related measures; info to tie performance to specific budget expenditures
Maryland State Hwy Admin. – CHART
More data you have, better off you are
Texas DOT - Austin Response time; traffic control device changes; when response is provided, who/how many need -- right now, we are more interested in did we do something, and not necessarily when we did something; finding information and making sure public has access to it.
Texas DOT – San Antonio
Incident detection time; power of system that allows you to make changes in system; ability of system to monitor system and recommend changes; quality of information (data) -- direct impact on response; good PR program
Minnesota DOT – Minneapolis
Response time; clearance time -- when they arrive, when they are out of lanes, and when total clear; on-site measures to ensure scene safety
Caltrans – San Diego What decision-makers are doing; when is significant to people and decision-makers Southeast Michigan COG – Detroit
Clear times, time it takes to return to free flow conditions, time and locations of occurrences, location of abandoned vehicles
Houston, TX. Motorist Assistance Patrols
Services offered, reduction in delays in driving time for the public due to traffic incidents
New York DOT Response time; clearance time; resumption to normal flow; times individual lanes opened/closed; secondary accidents -- can reduce if get the work out quickly of existing incidents
Texas DOT - Houston Accident: location, frequency, time of day, surface conditions; Detection: time, method frequency; Response time; Clearance time; time required to dissipate the queue. Quantitative differences in these areas by type of incident
Illinois DOT – Chicago Cause and effect of incident; Incident type vs. congestion factor; Will be upgrading computers and software -- new database should improve information data collection and reporting.
City of Houston, TX Police Dept.
Time incident occurred; location - street and intersection; response time; clearance time; lane closure information
North Carolina DOT Incident duration; response by agencies; effectiveness of response
55
SECTION 4. SUMMARY AND RECOMMENDATIONS
SUMMARY OF FINDINGS The following represents a summary of the major finding from research conducted as part of this task order:
• Transportation agencies define incidents differently than emergency service providers. Transportation agencies typically define an incident to be any unexpected event that causes a temporary reduction in the traffic carrying ability (i.e., capacity) of a facility. Emergency service providers use the word “incident” to describe any event to which they have to respond, whether it is on the roadway or not. Usually these events involve situations where there is the potential for loss of life, possible injuries, property damage, or potential criminal activities.
• While the actual measures vary slightly from location to location and between agencies, most transportation and emergency service providers are currently using performance measures to assess how well their incident management systems are functioning.
• Both transportation and emergency response providers recognize the need for collecting and storing information about incidents. Transportation agencies generally collect information about all aspects of traffic incidents (such as the arrival and departure times of all response vehicles). Emergency service providers generally collect information only related to their agency (i.e., the response time of fire trucks to the incident scene).
• Transportation agencies generally use performance measure to quantify the effectiveness of the overall incident management process, while emergency service providers generally use the information as a resource management tool to justify additional staffing and equipment.
• Most transportation agencies use the following measures to assess the performance of their incident management systems: • Number (or frequency) of incidents; • Detection time; • Response time; and • Clearance time.
• For the most part, emergency service providers use “response time” and time spent on scene. Measures such as the number of secondary incidents and the time to normal flow are difficult to define and collect without using operator judgment.
• While most transportation agencies indicated that they define “detection time” as the time differential between when an incident occurred and when it was first detected or reported to any official response agency, most only record “detection time” as the time of day at which the incident was reported to the TMC.
• Both transportation agencies and emergency service providers use “response time” as a critical performance measure; however, the operational definition of this measure varies significantly. Transportation agencies generally define “response time” as the time differential between when an incident was reported to the TMC to when the first responder from any official response agency arrived on-scene. Emergency service

56
providers generally define “response time” as the time differential between when a call was received by their dispatcher to when their first response vehicle arrived on-scene.
• The operational definition of “clearance time” also varies considerably between transportation agencies and emergency service providers. Transportation agencies typically define “clearance time” as the time differential between when the first responders arrive on the scene to when the capacity of the facility has been fully restored (i.e., when the incident has been removed from the travel lanes). Emergency service providers define clearance time as the time when all or most of the response equipment is again ready to respond to another event at another location.
• Emergency service providers define incident duration (or total time spent at the scene) as the time differential between when they first received a request for service (i.e., issued an alarm) to when they have been cleared to leave an incident scene. Transportation agencies generally define incident duration as the time from when a TMC is alerted of an incident until when the incident has been cleared from the roadway.
• The performance measures (and the way that they are defined) used by emergency service providers are fairly standard across their industry. National reporting database (such as the National Fire Incident Reporting System) have caused emergency service providers to adopt common terminology and collect data in a consistent manner. For transportation agencies, the type and manner in which performance measures are defined are local decisions.
• Many transportation agencies are currently producing performance reports routinely. Reports are frequently produced on a monthly, quarterly, or annual basis. Mid-level administrators are generally using monthly and quarterly reports to assist in managing assets and resources. Higher-level administrators use annual reports.
• While most agencies are willing to share incident information and performance measures with other agencies, this is rarely done, except on an as needed basis to evaluate a response or address a specific problem that has occurred at a particular incident.
• At some locations, emergency service providers and transportation agencies are beginning to work towards integrating dispatching and incident management recording keeping systems. This should allow for more accurate and better quality data from which to develop incident management performance measures.
• Most transportation agencies use a combination of automated and paper-based systems to gather performance measure data, but one common complaint about these systems is that the quality of information in their databases needed to be improved significantly.
RECOMMENDATIONS First, incident management officials need recognize that having a “one size fits all” approach for incident management performance measures may not be possible. The same set of performance measures that are used to evaluate the more routine types of traffic incidents (such as an two-vehicle collision, or a stalled vehicle) cannot be used to assess the performance of the system during complex, major events (such as a multiple vehicle collision involving multiple fatalities and/or serious injuries with major structural damage). It is recommended, however, that all agencies reconstruct and review the timeline of response events that occur with such incidents to identify and resolve potential problems with the responses prior to another major event.
57
For the more “routine” type of incidents, there seems to be a need for two sets of performance measures. The first set would be used to describe the overall effectiveness and responsiveness of the incident management process in a region. Administrators in the various response agencies could use this first set of performance measures to identify mechanisms for improving response and coordination between agencies. This first set would include measures such as the following:
• Incident Notification Time – This would represent the time it takes for all the appropriate response agencies to become aware of an incident. It would be computed by taking the time differential between when the first detection/report of an incident to any agency (whether it be fire, police, 911-dispatch, or TMC) to when the other response agencies also receive notification of the incident. This performance measure would need to be computed separately for each of the official response agencies.
• First-Responder Response Time – This would represent what many transportation agencies and emergency service responders are calling “response time”. This performance measure would be the time differential between the first report of an incident to any agency to when the first official responder from any agency arrived on the scene.
• Incident Assessment Time – This time would represent the duration it takes the first responder to determine what needs to be done to clear the incident and when capacity of the roadway is first partially restored. This performance measure would be defined as the time differential between when the first responder arrived on the scene and when the first action is taken to fully or partial restore capacity (for example, opening one previous blocked lane of traffic).
• Total Blockage Duration – This time would represent the total amount of time that freeway capacity is reduced. This performance measure would be defined as the time differential between when the first responder arrived on the scene to when the freeway capacity was fully restored (i.e., all lanes opened).
• Total Incident Duration – This time would represent the total amount of time that the incident had an effect on traffic operations. This performance measure would be defined as the time differential between when the event was first reported to any official response agency until when the last official response vehicle left the scene.
Other statistics that agencies may want to collect include the following:
• The frequency (or percentage of total incidents) at which each official response agency was the “first detector.”
• The frequency (or percentage of total incidents) at which each official response agency was the “first responder.”
• The frequency (or percentage of total incidents) where capacity was partially restored. • The frequency (or percentage of total incidents) at which each official response agency
was the last to leave the scene. Obviously, this evaluation becomes more feasible and practical for locations where recording keeping systems from all the response agencies are integrated and coordinated. Being able to perform this type of analysis requires that the evaluator have the capabilities for constructing a complete timeline across agencies for every incident. Recognizing its complexity, it is recommended that this type of evaluation occur annually in most regions.

58
The other set of performance measures that agencies may want to consider collecting would be those that are directly related to their own specific mission in the incident management process. An example of this type of performance measure would include the “response time” that most emergency service providers and service patrol operations are currently collecting. These types of performance measures would be generally geared toward helping agencies track the use of resource or to assess an agency’s performance towards a specific objective (i.e., the fire department’s objective is to have a 3 minute response time to all alarms). In most locations in the United States, the role of the transportation agencies (with the exception of service patrols) is one of support and demand management. For the agency specific performance measures, transportation agencies, and in particular TMCs, need to develop objectives and performance measures that more directly related to their specific mission in the incident response process. Examples of these types of performance measure might include the following:
• The time lag between when an incident was reported to a TMC and when devices were activated on the roadway;
• The average delay to motorists through an incident site; • The average queue length associated with different incident types; • The average amount of diversion generated by the traffic control devices used in
managing an incident. How to actually measure these performance measures directly in the field and how they relate to the objectives of a region’s incident management process is the subject of future research.
SUGGESTIONS FOR FUTURE RESEARCH Historically, transportation research has focused on identifying techniques and strategies for improving the “response” side of the equation (i.e., how do we detect incidents quicker, how can we get police and fire agencies to respond quicker to incidents, how can we clear the incident faster, etc.). While this reducing response times and restoring capacity is critical to managing an incident, it is only half of the equation and, to a large degree, out of the direct control of the transportation agency. While coordinating responses with emergency service providers is essential and perhaps can provide the greatest order of magnitude reduction in congestion, transportation agencies cannot assert much influence over how quickly emergency service providers response and clear incidents. Because most of the response process is out of the control of a transportation agency, we believe that the research emphasis needs to drift away from looking at what transportation agencies can do to reduce detection and response times to incidents and focus more on the harder questions of how incident management systems can be used to influence the “demand” side of the equation. Examples of the types of questions that need to be explored through additional research include the following:
• What are agencies trying to accomplish with their incident management systems? By activating traffic control and motor information systems in response to incidents, what kind of impact are agencies trying to affect on traffic operations? What are agencies hoping to accomplish?
• How effective are the response techniques (the DMSs, the ramp metering system, the lane control signals, etc.) at reducing the amount of delay caused by motorists,

59
encouraging diversion, etc.? How do agencies measure the effectiveness of these devices and strategies in real-time?
• How do we need to change our detection and surveillance systems to be able to measure the effectiveness of our incident management strategies?
• What are the incremental impacts of combining traffic control devices (e.g., lane control signals coupled with DMS signs, the systematic use of ramp meters, etc.) during incident conditions?

60
REFERENCES
1. Traffic Incident Management Handbook. Prepared for Federal Highway Administration,
Office of Travel Management. P.B. Farradyne. November 2000. (http://www.itsdocs.fhwa.dot.gov/jpodocs/rept_mis/@9201!.pdf)
2. Transportation Performance Measures Web Page. Federal Highway Administration,
Operations Core Business Unit, Office of Travel Management. http://www.ops.fhwa.dot.gov/Travel/Deployment_Task_Force/perf_measures.htm
3. Traffic Management Data Dictionary (TMDD) and Message Sets for External Traffic
Management Center Communications (MS/ETMCC) Website. Institute of Transportation Engineers. (http://www.ite.org/tmdd)
4. Highway Capacity Manual. Transportation Research Board, National Research Council,
Washington, D.C., 2000. 5. Performance Evaluation of CHART — An Incident Management Program — in 1997.
Prepared by Dr. Gang-Lan Chang, Deepak Shrestha of the University of Maryland, College Park and Jean Yves Point-Du-Jour of the State Highway Administration of Maryland. May 2000.
6. Summary of Incident Management Practices in the I-95 Coalition. 7. Chattanooga Urban Area Highway Incident Management Plan. Prepared by the
Chattanooga Urban Area Metropolitan Planning Organization and the Chattanooga-Hamilton County Regional Planning Agency. (http://www.chcrpa.org)
8. Hazardous Materials Guide. Federal Emergency Management Agency, U.S. Fire
Administration. (http://www.usfa.fema.hazmat) 9. MDOT’s Freeway Courtesy Patrol 2001 Activities Report. Southeast Michigan Council of
Governments, Detrioit, MI. March 2002. 10. Guide To Developing Effective Standard Operating Procedures for Fire and EMS
Departments. Federal Emergency Management Agency, U.S. Fire Administration. (http://usfa.fema.gov/downloads/pdf/publications/fa-197.pdf)
11. Houston Motorist Assistance Program. Quarterly Report. Period July 2000-September
2000. Texas Transportation Institute. Texas A&M University System, College Station, TX. 12. Personal communication with Nick Thompson, Minnesota Department of Transportation.
March 2002.

61
13. City of Austin-Austin Fire Department Website. (http://www.ci.austin.tx.us/fire/fdavg.htm) 14. International Association of Chief of Police Website. (http://www.theiacp.org/index.htm) 15. International Association of Public-Safety Communications Officials Website.
(http://www.apcointl.org) 16. Dispatch Monthly Magazine. (http://www.911dispatch.com/cad/cadsoftware.html). 17. K&K Computer Solutions Website. (http://kk-police.epagecity.com/site/
epage/2113_196.htm) 18. National Fire Incident Reporting System Website. Federal Emergency Management
Agency, U.S. Fire Administration. (http://www.usfa.fema.gov/dhtml/inside-usfa/nfirs.cfm) 19. Kansas City Incident Management Program Manual. Developed by the Kansas Department
of Transportation, and the Missouri Department of Transportation. Spring 1999.

62
APPENDIX A. RADIO DISPATCH CODES FROM SELECT LAW ENFORCEMENT AND EMERGENCY RESPONSE AGENCIES
APPENDIX A-1. REVISED OFFICIAL APCO TEN SIGNALS APPENDIX A-2. CALIFORNIA HIGHWAY PATROL RADIO CODES APPENDIX A-3. DALLAS PD RADIO SIGNAL CODES APPENDIX A-4. F.D.N.Y. RADIO CODES

63
A-1. REVISED OFFICIAL APCO TEN SIGNALS 10-1 Unable To Copy Re-Locate 10-2 Signals Good 10-3 Stop Transmitting 10-4 Acknowledgement 10-5 Relay 10-6 Busy Stand-By 10-7 Out Of Service 10-8 In Service 10-9 Repeat 10-10 Fight In Progress 10-11 Dog Case 10-12 Stand By (stop) 10-13 Weather & Road Report 10-14 Report Of Prowler 10-15 Civil Disturbance 10-16 Domestic Trouble 10-17 Meet Complainant 10-18 Complete Assgn. Quickly 10-19 Return To --------- 10-20 Location 10-21 Call----By Telephone 10-22 Disregard 10-23 Arrived At Scene 10-24 Assignment Completed 10-25 Report In Person To---- 10-26 Detaining Subject, Expid 10-27 Drivers License Info. 10-28 Vehicle Registration 10-29 Check Records For Want 10-30 Illegal Use Of Radio 10-31 Crime In Progress 10-32 Man With Gun 10-33 Emergency 10-34 Riot 10-35 Major Crime Alert 10-36 Correct Time 10-37 Inves. Susp. Vehicle 10-38 Stopping Susp. Vehicle (give complete discript) 10-39 Urgent (light/siren) 10-40 Silent Run 10-41 Beginning Tour Of Duty 10-42 Ending Tour Of Duty 10-43 Information 10-44 Request Permission To Leave
Patrol---For--- 10-45 Animal Carcass In Road
10-46 Assist Motorist 10-47 Emerg. Road Repairs Needed 10-48 Traffic Standard Repair 10-49 Traffic Light Out 10-50 Traffic Accident-F, PI, PD 10-51 Wrecker Needed 10-52 Ambulance Needed 10-53 Road Blocked 10-54 Livestock On Highway 10-55 Intoxicated Driver 10-56 Intoxicated Person 10-57 Hit & Run--F, PI, Pd 10-58 Direct Traffic 10-59 Convoy Or Escort 10-60 Squad In Vicinity 10-61 Personnel In Area 10-62 Reply To Message 10-63 Prepare To Make Written Cpy. 10-64 Message For Local Del. 10-65 Net Message Assgn. 10-66 Message Cancellation 10-67 Clear To Read Net Msg. 10-68 Dispatch Information 10-69 Message Received 10-70 Fire Alarm 10-71 Advise Nature Of Fire(size, type,
contents of bldg.) 10-72 Report Progress On Fire 10-73 Smoke Report 10-74 Negative 10-75 In Contact With 10-76 En Route 10-77 ETA 10-78 Need Assistance 10-79 Notify Coroner 10-82 Reserve Lodging 10-84 If Meeting----Advise ETA 10-85 Will Be Late 10-87 Pick Up Checks For Dist. 10-88 Advise Telephone # Of---- 10-90 Bank Alarm 10-91 Unnecessary Use Of Radio 10-93 Blockade 10-94 Drag Racing 10-96 Mental Subject 10-98 Prison/Jail Break 10-99 Records Indicate Want/Stolen
Source: http://www.bearcat1.com/radioco.htm

64
A-2. CALIFORNIA HIGHWAY PATROL RADIO CODES 104 = MESSAGE RECEIVED 106 = BUSY 1013 = ADVISE ROAD OR WEATHER CONDITIONS 1014 = PROVIDE ESCORT 1020 = LOCATION REQUESTED 1021 = TELEPHONE _________ 1022 = DISREGARD 1023 = STANDBY 1031 = ATTEMPTED SUICIDE 1039 = MESSAGE OR ITEM DELIVERED 1097 = ON SCENE 1098 = ASSIGNMENT COMPLETED 1110 = TAKE A REPORT 1124 = ABANDONED VEHICLE 1125 = TRAFFIC HAZARD 1126 = DISABLED VEHICLE 1141 = AMBULANCE REQUIRED 1142 = PARAMEDICS REQUIRED 1144 = POSSIBLE FATALITY 1148 = PROVIDE TRANSPORTATION 1166 = DEFECTIVE TRAFFIC SIGNALS 1179 = ACCIDENT - AMBULANCE RESPONDING 1180 = ACCIDENT - MAJOR INJURY 1181 = ACCIDENT - MINOR INJURY 1182 = ACCIDENT - PROPERTY DAMAGE 1184 = TRAFFIC CONTROL 1185 = TOW TRUCK REQUIRED OR REQUESTED 1186 = BOMB THREAT 1187 = BOMB FOUND 1198 = MEET Source: http://cad.chp.ca.gov/body_glossary.htm

65
A-3. DALLAS PD RADIO SIGNAL CODES Signal Description |Signal Description ------ ----------- |------ ----------- DH Drug House |34 Suicide 2 Witness |35 *Emergency Blood Transfer 3 Hang up call |36 Abandon Child 4 911 Hang up |37 Street Blockage 6 Disturbance |38 Meet Complainant 6G Random Gunfire |39 Racing, Speeding 6X Major Disturb. |41-40 Kidnapping in Progress 7X Major Accident |41 Felony 8 Drunk |42 Pursuit 9 Theft |44 *Person in Danger 11 Burglary |50 Eat 12 Burglar Alarm |51 Coffee 13 Prowler |52 City Court 14 *Cutting |53 County Court 15 *ASSIST OFFICER |54 Escort 16 Injured Person |55 Traffic Violation 18 Fire Alarm |56 Out to Station 19 *Shooting |57 Out to Garage 20 Robbery |58 Routine Investigation 21 Holdup Alarm |59 Follow-Up Investigation 22 Animal Complaint |60 Special Assignment 23 Parking Viol. |61 Foot Patrol 24 Abandonded Prop. |62 Public Service 25 Criminal Assault |63 Cover Element 26 Missing Person |64 Radio Shop 27 Dead Person |65 Use Telephone 28 Sick Person |66 End Duty Tour 29 Open Building |67 Monitor Radio 30 Prisoner |41-20 *Robbery in Progress 31 Crim. Mischief |41-25 *Criminal Assault in Progress 32 Sus. Person |41-40 *Kidnapping in Progress 33 Poisoning * Automatically dispatched as a Code 3 call ---------------------------------------------------------- Communication Codes are as follows: Code 1: Normal Response (no lights or sirens) Code 3: Emergency Lights & Sirens Code 4: Disregard Code 5: En Route Code 6: Arrived Code 10: Known Offender Code 10C: Known Dangerous Offender Code 10W: Felony Warrant Code 10X: Stolen Vehicle Source: http://www.policescanner.com/dalcodes.html
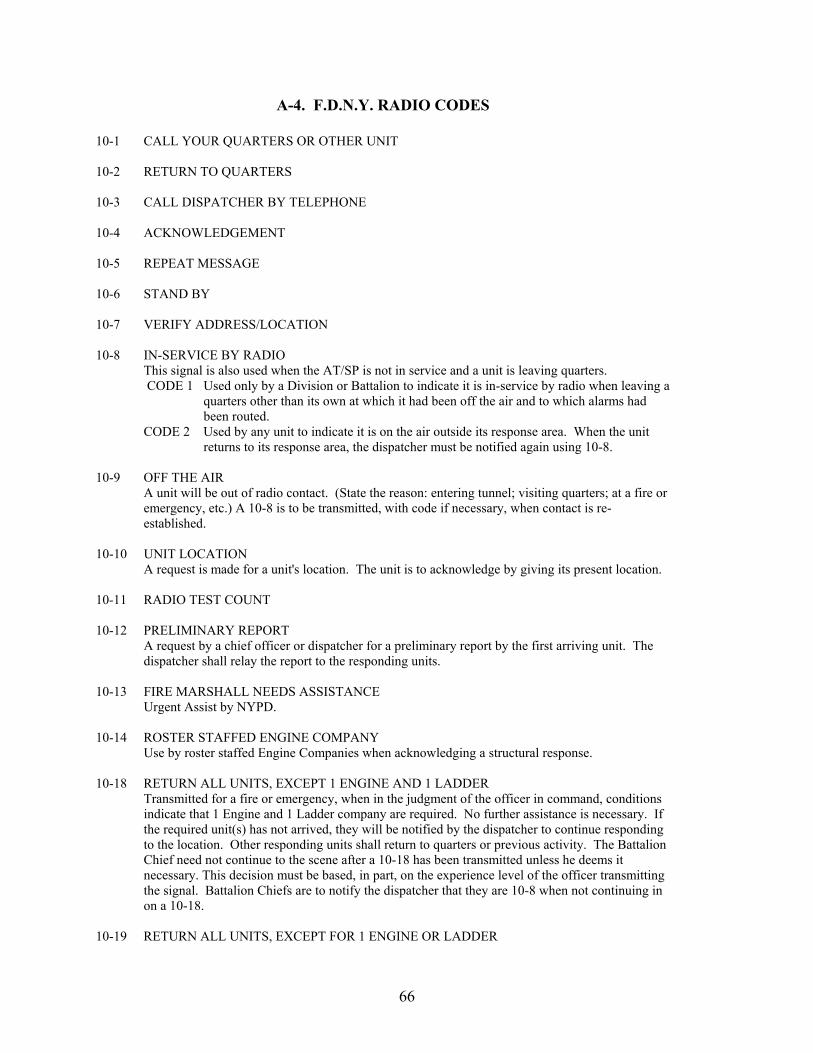
66
A-4. F.D.N.Y. RADIO CODES 10-1 CALL YOUR QUARTERS OR OTHER UNIT 10-2 RETURN TO QUARTERS 10-3 CALL DISPATCHER BY TELEPHONE 10-4 ACKNOWLEDGEMENT 10-5 REPEAT MESSAGE 10-6 STAND BY 10-7 VERIFY ADDRESS/LOCATION 10-8 IN-SERVICE BY RADIO
This signal is also used when the AT/SP is not in service and a unit is leaving quarters. CODE 1 Used only by a Division or Battalion to indicate it is in-service by radio when leaving a
quarters other than its own at which it had been off the air and to which alarms had been routed.
CODE 2 Used by any unit to indicate it is on the air outside its response area. When the unit returns to its response area, the dispatcher must be notified again using 10-8.
10-9 OFF THE AIR
A unit will be out of radio contact. (State the reason: entering tunnel; visiting quarters; at a fire or emergency, etc.) A 10-8 is to be transmitted, with code if necessary, when contact is re-established.
10-10 UNIT LOCATION A request is made for a unit's location. The unit is to acknowledge by giving its present location.
10-11 RADIO TEST COUNT 10-12 PRELIMINARY REPORT
A request by a chief officer or dispatcher for a preliminary report by the first arriving unit. The dispatcher shall relay the report to the responding units.
10-13 FIRE MARSHALL NEEDS ASSISTANCE Urgent Assist by NYPD.
10-14 ROSTER STAFFED ENGINE COMPANY Use by roster staffed Engine Companies when acknowledging a structural response.
10-18 RETURN ALL UNITS, EXCEPT 1 ENGINE AND 1 LADDER Transmitted for a fire or emergency, when in the judgment of the officer in command, conditions indicate that 1 Engine and 1 Ladder company are required. No further assistance is necessary. If the required unit(s) has not arrived, they will be notified by the dispatcher to continue responding to the location. Other responding units shall return to quarters or previous activity. The Battalion Chief need not continue to the scene after a 10-18 has been transmitted unless he deems it necessary. This decision must be based, in part, on the experience level of the officer transmitting the signal. Battalion Chiefs are to notify the dispatcher that they are 10-8 when not continuing in on a 10-18.
10-19 RETURN ALL UNITS, EXCEPT FOR 1 ENGINE OR LADDER

67
Transmitted for a fire or emergency, when in the judgment of the officer is command, conditions indicate that 1 Engine or 1 Ladder Company is required. No further assistance is necessary. If the required unit(s) has not arrived they will be notified by the dispatcher to continue responding to the location. Other responding units shall return to quarters or other activity. The Battalion Chief need not continue to the scene after a 10-19 has been transmitted unless he deems in necessary. This decision must be based, in part, on the experience level of the officer transmitting the signal. Battalion Chiefs are to notify the dispatcher that they are 10-8 when not continuing in on a 10-19.
10-20 PROCEED AT REDUCED SPEED No warning devices are to be used and all traffic regulations are to be observed. 10-21 BRUSH FIRE 10-22 OUTSIDE RUBBISH FIRE 10-23 ABANDON/DERELICT VEHICLE FIRE (ADV)
A fire in a vehicle which has no value other than salvage and no owner can be located. 10-24 AUTO FIRE A fire in a vehicle with plates or in any vehicle having a value greater than that of salvage. 10-25 MANHOLE or TRANSFORMER VAULT FIRE
CODE 1 Fire has extended from the manhole or conduit into a building. CODE 2 Fire has blown one or more manhole covers, or smoke is issuing from a manhole under
pressure. CODE 3 Smoke is seeping from a manhole.
10-26 FOOD ON STOVE 10-27 COMPACTOR FIRE
Fire has not extended from compactor or shaft
10-28 SUBWAY OR RAILROAD SYSTEM - FIRE, EMERGENCY OR SMOKE CONDITION (CODE REQUIRED)
CODE 1 NYCTA. CODE 2 Other than NYCTA. 10-31 CLOGGED INCINERATOR Fire has not extended from shaft. 10-32 DEFECTIVE OIL BURNER Fire has not extended from fire box. 10-33 ODOR OF SMOKE
A smoke condition caused by a nearby working fire or fires such as barbecues, salamanders, etc.
10-34 SPRINKLER SYSTEM EMERGENCY CODE 1 Defective sprinkler device or system (defective alarm valve, broken pipe, etc.) CODE 2 Unwarranted sprinkler alarm. Not defective (surge in pressure, people working on system, etc.) CODE 3 Sprinkler has been activated by heat source not associated with an accidental fire.
10-35 ALARM SYSTEM EMERGENCY
Other than a sprinkler system. CODE 1 Defective alarm device or system.

68
CODE 2 Unwarranted alarm. Not defective (accidentally activated by cigarette smoke; low battery, etc.)
CODE 3 Recorded alarm. 10-36 AUTOMOBILE EMERGENCY
Any type of automobile accident or washdown of a fuel spill. CODE 1 Washdown CODE 2 No injury or washdown CODE 3 Injury CODE 4 Extrication
10-37 ASSIST CIVILIAN
First Aid or other call for assistance. CODE 1 Victim deceased CODE 2 Victim not breathing CODE 3 Victim injured
10-38 CARBON MONOXIDE RESPONSE
CODE 1 DETECTOR ACTIVATION - Defective, low battery, unwarranted. CODE 2 CO INCIDENT - Readings from 1 - 9 PPM. CODE 3 CO EMERGENCY - Readings over 9 PPM. CODE 4 No detector activation during incident or emergency.
10-40 GAS OR ELECTRICAL EMERGENCY
CODE 1 Gas Emergency. (Gas main leak; gas leak in structure; efective gas appliance; etc.) CODE 2 Electrical emergency. (Wires down; sparking fixture; short circuit; etc.) CODE 3 Water condition. CODE 4 Steam leak. NOTE: Do not use 10-40 where the emergency causes a structural fire.
10-41 SUSPICIOUS FIRE (CODE REQUIRED) Fire Marshall investigation is required. CODE 1 Occupied Structure or Vehicle. A Structure (commercial, residential, public), or
vehicle (car, bus or train) which is occupied at the time of the fire. This also includes a vacant apartment in an occupied building, or a store with a dwelling above.
CODE 2 Unoccupied Structure. A structure (commercial, residential, public) normally occupied which is unoccupied at the time of the fire.
CODE 3 Unoccupied Vehicle. A vehicle (car, bus or train) with or without plates which is unoccupied a the time of the fire.
CODE 4 Vacant Structure. A vacant building or building under construction or demolition. (If there are squatters or workmen in structure, transmit a CODE 1.)
10-44 PUBLIC AMBULANCE
A request for a public ambulance. Specify the reason.
10-45 D.O.A. OR SERIOUS INJURY Transmitted IMMEDIATELY upon the discovery of a fatality or serious injury at a fire or emergency. This shall be followed as soon as possible with the appropriate Code and the number of victims. CODE 1 Victim Deceased CODE 2 Victim suffering serious injury. (Apparently life threatening) CODE 3 Victim suffering serious injury. (Apparently NOT life threatening.) NOTE: Do not transmit this signal for minor injuries.

69
10-47 POLICE RESPONSE Police assistance is needed for crowd or traffic control, security, apprehension, etc. (specify
reason) 10-48 POLICE RESPONSE FOR HARASSMENT Firefighters are being harassed an police assistance is needed immediately. 10-51 CANCELLATION OF OUTSIDE ACTIVITIES
Transmitted when outside activities are to be canceled. When the conditions that caused suspension of outside activities, the following message will be transmitted by radio, voice alarm and teleprinter: "All units shall resume outside activity forthwith."
10-60 MAJOR EMERGENCY RESPONSE
Transmitted for a collapse, airplane crash (except airport crash boxes 0037-LaGuardia Airport, and 0269-Kennedy Airport) train derailment, or similar emergency with the potential for multiple casualties. The following will respond. 3 Engines, 2 Ladders, 3 Rescue Companies (including Res3cuE with the Collapse Unit) 5 Battalion Chiefs, 1 Tactical Service Unit, HazMat, Field Communications Unit, Squad Company 1 with Technical Response Vehicle, 1 Deputy Chief, 1 Safety Battalion.
10-70 WATER RELAY REQUIRED
A notification that the first arriving engine has no positive water source and a water relay is required. 10-75 NOTIFICATION OF A FIRE OR EMERGENCY
A notification signal transmitted when, in the judgment of the officer in command, conditions indicate a fire or emergency that requires a total response of the following units: 4 Engines, 2 Ladders, 2 Battalion Chiefs, 1 Rescue Company and Squad Company. Officers transmitting a 10-75 shall also state if it is for a fire or emergency and if a building is involved along with the type of building.
10-76 NOTIFICATION OF A FIRE IN A HIGH-RISE BUILDING A notification signal transmitted when, in the judgment of the officer in command, conditions indicate a fire in a high-rise building that requires a total response of the following units: 5 engines (1 is CFR), 5 Ladders (1 is fast), 3 Battalion Chiefs,Engine 3 and High Rise Unit, 1 Deputy Chief, Field Communications Unit, 1 Rescue Company, Mask Service Unit, PIO, Command Post Company, 1 Squad company, 1 Tac unit. (restricted use of Citywide frequency, for operation of the High-Rise repeater.)
10-77 HIGH-RISE MULTIPLE DWELLING FIRE
High-rise multiple dwelling fire (Response of 5 engines, 5 ladders, 3 battalion chiefs, 1 deputy, 1 rescue, 1 squad, the Special Operations battalion chief, a safety coordinator, transmitted by the Incident Commander after size up and the Safety Operating battalion chief.)
10-80 HAZARDOUS MATERIALS INCIDENT
The Initial notification by field units of a hazardous materials incident. Responders are to proceed with caution to avoid entering a restricted area. Code will transmitted by the Incident Commander after size up and evaluations of the incident. CODE 1 An incident confined to a small area and which does not pose an immediate threat to
life or property. Can be controlled by a unit or units up to and including: 3 Engines, 2 Ladders, and 2 Battalion Chiefs.
CODE 2 An incident involving a greater hazard or larger area which posses a potential threat to life or property. Following units will respond: 3 Engines, 2 Ladders, 2 Battalion Chiefs, 1 Deputy Chief, HazMat Company 1, 1 Safety Battalion and Field Communications Unit.

70
10-84 UNITS ARRIVED AT SCENE All units shall IMMEDIATELY transmit a 10-84 by Radio or MDT when arriving at the box of the incident. Other signals should not be given with the 10-84 except where the situation is apparent on arrival. This signal must be followed within 5 minutes by a preliminary report including the appropriate radio code signal or additional information by first arriving unit. Fire commanders and Chiefs within their command are to take necessary steps to insure that units are transmitting the 10-84 signal for responses. Chief officers shall transmit a 10-84 upon their arrival at an alarm.
10-85 FIRE MARSHALL REQUIRES ADDITIONAL UNITS
Used for additional units (other than NYPD - See 10-13) 10-86 FOAM OPERATION
Transmitted for a fire or emergency requiring any type of foam concentrate in addition to that carried by units on the scene. The following are to respond: 2 Foam Carriers, 1 Satellite Hose Wagon, 1 Foam Coordinator (Batt.Chief). CODE 1 Maximum amount of Flouroprotein foam required. In addition to units on the 10-86
the remainder of the Foam Carriers and all Bulk Foam Units will respond. CODE 2 Flouroprotein foam required. In addition to units on 10-86 the remainder of the Foam
Carriers will respond. CODE 3 High Expansion Foam required. The High Expansion Foam Unit will respond. Units
on 10-86 will also respond. NOTE: On all Special Calls for foam (Foam carrier or High Expansion Foam) the associated
Engine Company will respond with both pieces of apparatus and all members.
10-91 EMERGENCY; FD NOT REQUIRED. 10-92 MALICIOUS FALSE ALARM
Indicates that a false alarm was transmitted with malicious intent. 10-99 UNITS WILL BE OPERATING FOR A LEAST 30 MINUTES
An operating unit or all units at an incident will be unavailable for at least 30 minutes. The unit(s) is to state the reason it will not be available.
Source: http://www.nyfd.com/radio.html
71
APPENDIX B. SAMPLE PERFORMANCE MEASURE REPORTS PRODUCED BY MINNESOTA DEPARTMENT
OF TRANSPORTATION
APPENDIX B - 1 . SAMPLE OF DAILY INCIDENT MANAGEMENT PERFORMANCE REPORT USED BY MNDOT.
APPENDIX B- 2. SAMPLE OF MONTHLY INCIDENT MANAGEMENT
PERFORMANCE REPORT PRODUCED BY MNDOT.
APPENDIX B - 3. SAMPLE OF YEARLY INCIDENT MANAGEMENT PERFORMANCE REPORT PRODUCED BY MNDOT.

72
B - 1 . SAMPLE OF DAILY INCIDENT MANAGEMENT PERFORMANCE REPORT USED BY MNDOT.

73
B- 2. SAMPLE OF MONTHLY INCIDENT MANAGEMENT PERFORMANCE REPORT PRODUCED BY MNDOT.
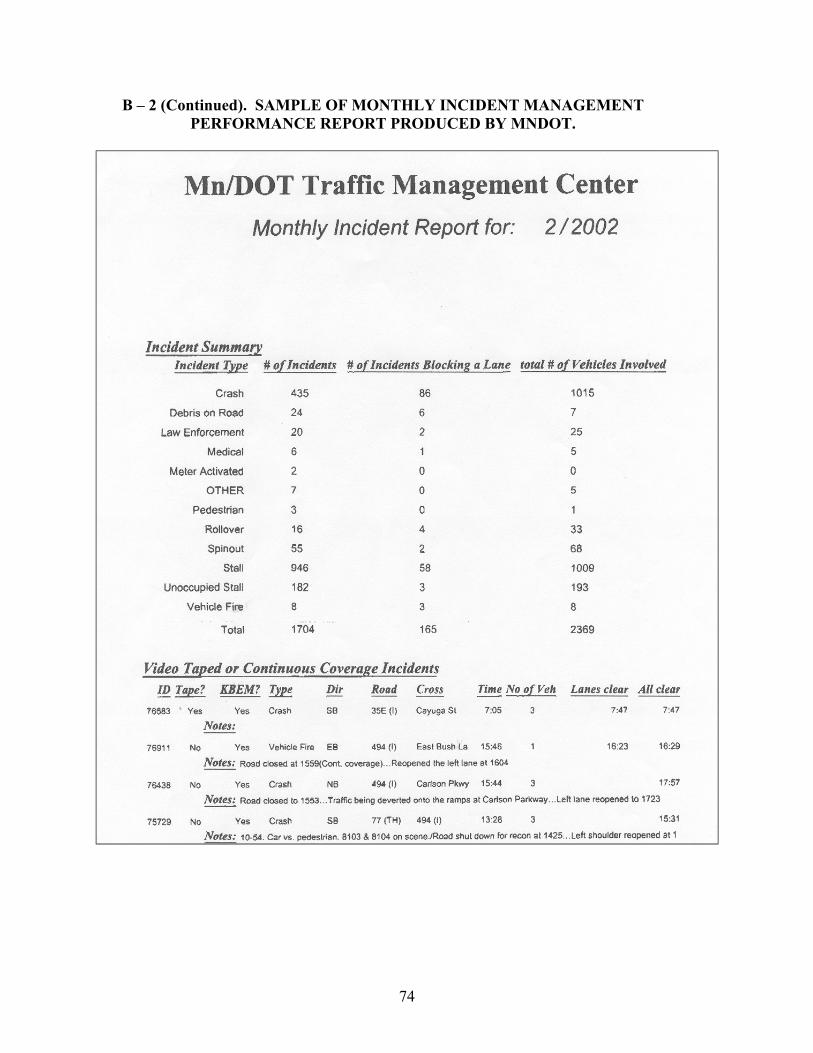
74
B – 2 (Continued). SAMPLE OF MONTHLY INCIDENT MANAGEMENT PERFORMANCE REPORT PRODUCED BY MNDOT.

75
B - 3. SAMPLE OF YEARLY INCIDENT MANAGEMENT PERFORMANCE REPORT PRODUCED BY MNDOT.
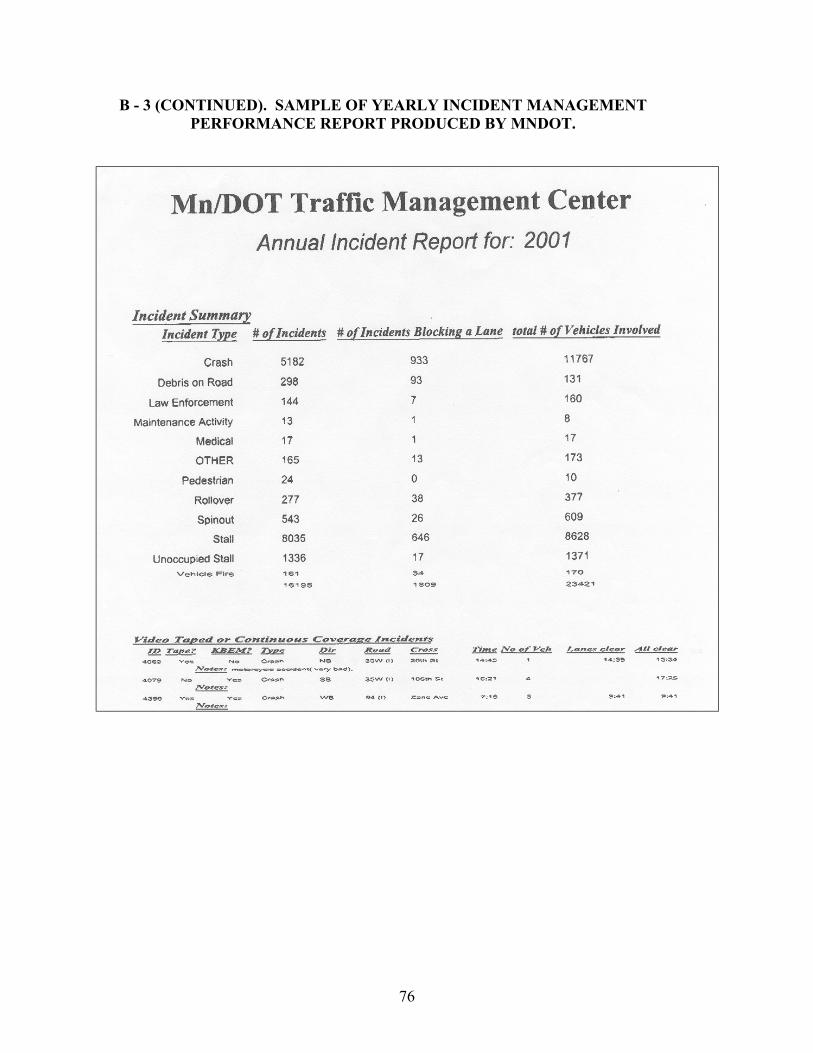
76
B - 3 (CONTINUED). SAMPLE OF YEARLY INCIDENT MANAGEMENT PERFORMANCE REPORT PRODUCED BY MNDOT.

77
B - 3 (CONTINUED). SAMPLE OF YEARLY INCIDENT MANAGEMENT PERFORMANCE REPORT PRODUCED BY MNDOT.

78
APPENDIX C. SAMPLE PERFORMANCE MEASURE REPORTS PRODUCED BY MOTORIST ASSISTANCE
PROGRAM IN HOUSTON, TX.

79

80

81

82

83

84
APPENDIX D. INCIDENT MANAGEMENT PERFORMANCE MEASURE SURVEY
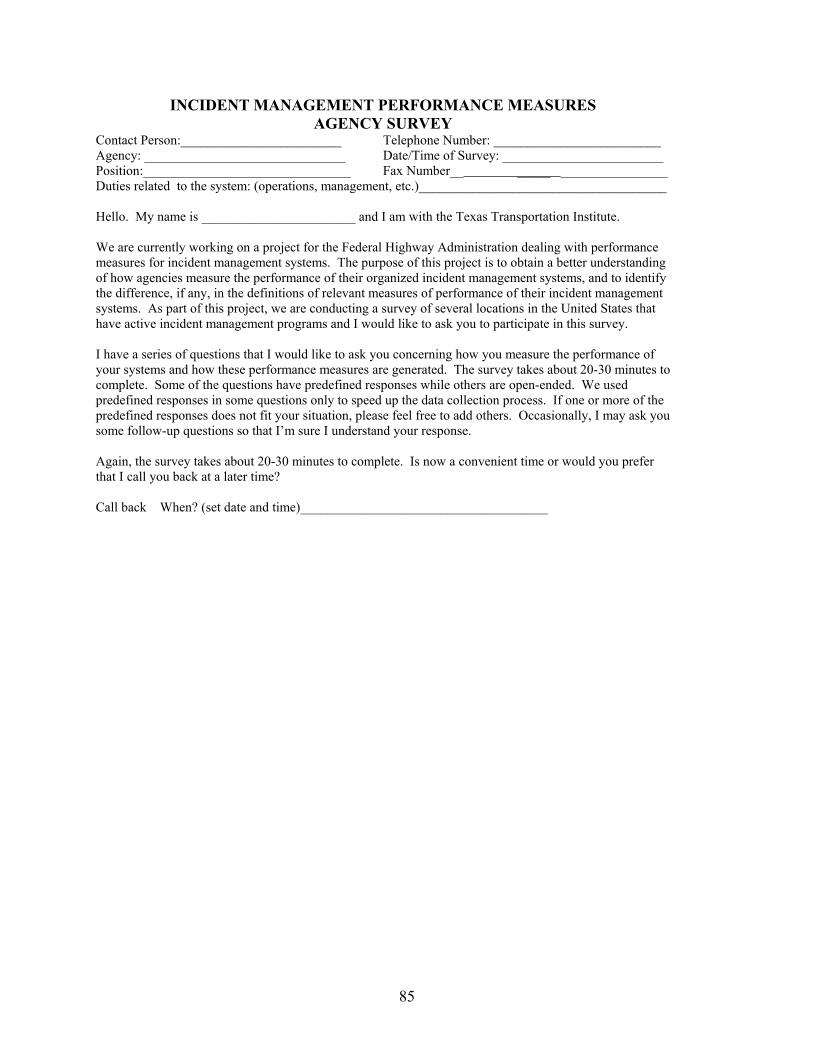
85
INCIDENT MANAGEMENT PERFORMANCE MEASURES AGENCY SURVEY
Contact Person:________________________ Telephone Number: _________________________ Agency: ______________________________ Date/Time of Survey: ________________________ Position:_______________________________ Fax Number__ _____ ________________ Duties related to the system: (operations, management, etc.)_____________________________________ Hello. My name is _______________________ and I am with the Texas Transportation Institute. We are currently working on a project for the Federal Highway Administration dealing with performance measures for incident management systems. The purpose of this project is to obtain a better understanding of how agencies measure the performance of their organized incident management systems, and to identify the difference, if any, in the definitions of relevant measures of performance of their incident management systems. As part of this project, we are conducting a survey of several locations in the United States that have active incident management programs and I would like to ask you to participate in this survey. I have a series of questions that I would like to ask you concerning how you measure the performance of your systems and how these performance measures are generated. The survey takes about 20-30 minutes to complete. Some of the questions have predefined responses while others are open-ended. We used predefined responses in some questions only to speed up the data collection process. If one or more of the predefined responses does not fit your situation, please feel free to add others. Occasionally, I may ask you some follow-up questions so that I’m sure I understand your response. Again, the survey takes about 20-30 minutes to complete. Is now a convenient time or would you prefer that I call you back at a later time? Call back When? (set date and time)_____________________________________

86
1. DEFINITIONS -- In looking at the literature, it appears that different agencies define what an incident is differently. In the first series of questions, we are trying to understand how different agencies define incidents and how this might effect their response.
1.1. From your agencies perspectives, what events affecting traffic does you agency
define as an “incident”? Collisions Overturned vehicles Stalled/Disabled vehicle in a travel
lane Abandoned vehicle in a travel lane Stalled vehicle on the shoulder
Vehicle on Fire HAZMAT Spill Abandoned vehicle on shoulder Public Emergency Debris on roadway
All the above Any others? (please identify)
1.2. Does your agency have a system for classifying incidents?
No GO TO SECTION 2 Yes
1.3. What criterion is (are) used (e.g., severity, duration of blockages, etc.)? 1.4. What are the thresholds for each classification level? 1.5. How is this classification system used? In other words, how does your response differ
based upon the classification of the incident?

87
2. INFORMATION COLLECTED PER INCIDENT – Different agencies and different
systems collect incident data differently. With these questions, we are trying to get a handle on what information about incidents different agency collect, how they do it, how long they keep incident information, etc.
2.1. Does your agency keep a permanent or semi-permanent log of events for each type of
incident? No. Why not?
GO TO SECTION 3!
Yes Continue below 2.2. What information is collected about each incident?
Roadway Name Location/Cross –Street Name Block Number Detector Station # Geographic Location (lat/long) Location of Lanes Blocked Incident Type Incident Source (Detected by system or Reported by cell phone, courtesy patrol, etc.) The current status of the incident i.e., whether it has been Detected, Verified, Canceled,
etc.) Time incident was detected Time incident was verified Source of incident verification Time response vehicles arrived on scene (Do you record each individual vehicle arrivals
or collectively?) Type of response vehicles on scene Time response vehicles left scene Time incident was cleared from scene (What is your definition of clearance – moved to
shoulder, response vehicles departs, removed from roadway altogether, other? Time traffic returned to normal flow Roadway Surface Condition Roadway Condition (Wet, Dry, etc) Light Condition (Daylight, Nighttime, Dawn, Dusk, etc.) Weather Conditions Injuries Present # of Vehicle Involved Type of Vehicle Involved Incident severity (qualitative) Others (Please Specify)

88
2.3. How is this information collected? Manual forms -- Can I get a copy of your incident logging forms? Automatically through freeway management software -- Can I get a screen capture of
your logging screen? Other:
2.4. In what format is this information stored (paper file, electronic file, queriable database)? 2.5. How long to you generally retain this information? 2.6. Are other sources of incident information ever integrated with yours to cross-reference or
verify your information (i.e. police logs, accident reports, courtesy patrol records, etc.)? If so, what sources?
2.7. What would you estimate the cost to be for collecting, processing, and reporting your
incident measures?

89
3. PERFORMANCE MEASURES 3.1. Do you calculate different performance measures from the information you routinely
collect about each incident (e.g., incident duration, response times, etc.)? Yes Continue Below No Why not?
3.2. What measures do you routinely compute to assess the performance of your incident
management program? Incident Frequency Incident Rate Detection Time Response Time Clearance Time Number of Secondary Incidents Time to Normal Flow Incident Delay Others:
3.3. What are your operational definitions for each performance measure (i.e., when does the
clock start and stop for each performance measure) Incident Frequency Incident Rate Detection Time Response Time Clearance Time

90
Number of Secondary Incidents Time to Normal Flow Incident Delay Others: 3.4. How are these reports generated?
By facility System Wide By Segment Other:
3.5. How were these operational definitions derived? By whom? What was the process for
deriving them? Were other agencies involved? If so, who were they and how? 3.6. Are there other performance measures that you are not collecting, but you think would be
beneficial for you to know as they relate to the performance of your incident management system? If so, what are they and how would you measure it?

91
3.7. How long have you been collecting and calculating these performance measures? 3.8. What would you estimate the cost to be for collecting, processing, and reporting your
incident mgmt. measures?

92
4. USE OF PERFORMANCE MEASURES 4.1. Do you commonly generate any reports, tables, summary statistics, etc. that use these
performance measures? Yes Request Copy of typical report and continue No. Do you have any plans?
o No GO TO SECTION 5! o Yes Continue below
What kinds of reports/tables/summary statistics? 4.2. When do expect to start producing them? 4.3. How are you planning to produce them? 4.4. Why are you going to start producing them? 4.5. How are these performance measures generally used in your system? 4.6. How often are they produced?
On an as needed basis Daily Weekly Bi-weekly
Monthly Quarterly Semi-Annually Annually
Other (Please specify)

93
4.7. With whom are these performance measures shared (within agency, other agencies,
public)? 4.8. How does your agency use the information in these reports? What decisions are made
based on or are influenced by these measures? 4.9. In general, do you think the information in these reports or the performance measures
themselves to be: 4.9.1. Timely
Yes No. Why?
4.9.2. Useful
Yes No. Why?
4.9.3. Accurate
Yes No. Why?
4.9.4. Provide the information necessary for effective decision-making?
Yes No. Why?

94
5. INSTITUTIONAL ISSUES 5.1. Do other agencies (such as fire, police, DOT, etc.) keep similar information about
incidents in your jurisdiction? 5.2. Do you integrate or compare your information with other agencies?
When?
How often?
How? 5.3. What are generally your findings when this occurs? 5.4. What kind of issues did you face when you set up your system and how did you deal with
them? 5.5. In your opinion, what are the most important things to be measuring, whether or not you
currently collecting?

95
6. CONTACTS IN OTHER AGENGIES As part of this project, we would also like to ask these same questions to other agencies that are active in your incident management program. Would it be possible for you to give me the name and telephone number of your contacts in the other agencies that participate in local incident management program?
STATE DOT: CITY DOT(s): POLICE: FIRE: EMS: Others: