Embed Size (px)
Citation preview

Income of New Retired Workers by Age at First Benefit Receipt:
Findings From the New Beneficiary Survey by Linda Drazga Maxfield*
Using data from the New Beneficiary Survey (NBS) of the Social Security Administration (SSA), this article examines how income sources and total monthly income received by new- ly retired social security beneficiaries vary with the age at which the first benefit check was received. The NBS respondents who received a first benefit at age 65 or older were better off eco- nomically than were those who received a first benefit at ages 62-64. At the time of the interview, 18-30 months after receiv- ing a first benefit, these older beneficiaries had higher levels of total income and were more likely to have income from earn- ings and assets. Pension receipt rates did not vary by the age at which the first social security benefit was received except for married women retired workers, for whom the rate was higher at the older ages. The largest proportion of aggregate income (slightly more than one-third) was derived from social security benefits. More than 90 percent of the NBS Medicare-only respondents-a sample of nonbeneficiaries who were eligible for monthly cash benefits but had established their entitlement only for the purpose of enrolling in the Medicare pro- gram-reported earnings income. They had lower rates of pen- sion receipt and higher rates of asset income receipt than the retired workers. The Medicare-only respondents had substan- tially higher incomes than did retired workers, and most of their aggregate income was from earnings. The NBS retirees were generally in better financial condition than a group of social security beneficiaries aged 65 or older from all benefit categories in the Current Population Survey Income Supple- ment with whom they were compared.
This article presents an overview of the relationship between the age at which social security retired-worker benefits are first received and income, as reported by men and women who recently began receiving such benefits. The sources of income and the total income of these new beneficiaries are described by the age at which
* Program Analysis Staff and Division of Economic Research, Of- fice of Research, Statistics, and International Policy, Office of Policy, Social Security Administration. The New Beneficiary Survey was con- ducted under contract with the Institute for Survey Research at Tem- ple University in Philadelphia, Pa., with Linda Drazga Maxfield as SSA’s project officer. Programming support for appendix tables A-E was provided under subcontract by Mathematics Policy Research of Washington, D.C.
the individual received a first benefit check for retire- ment. The data are from the Social Security Administra- tion’s (SSA’s) 1982 New Beneficiary Survey (NBS). 1 Included in the NBS are persons who first received retired-worker benefits at age 62 or older during the period from June 1980 to May 1981 and a sample of persons aged 65 or older enrolled in the Medicare pro- gram who were insured for retired-worker benefits but had not received them as of July 1982. Typically, such “Medicare-only” enrollees do not receive cash benefits
t For a description of the NBS design, see Linda Drazga Maxfield, “The 1982 New Beneficiary Survey: An Introduction,” Social Secu- rity Bulletin, November 1983, pages 3-l 1.
Social Security Bulletin, July 1985/Vol. 48, No. 7 7
because they are working and have sufficiently high earnings that their benefits are fully withheld under the social security earnings test.* They are included in the NBS sample to represent nonretired older workers eligi- ble for social security benefit payments.
The NBS personal interviews were conducted in Octo- ber-December 1982 with a nationally representative sample of selected new beneficiaries drawn from SSA’s Master Beneficiary Record (MBR). The interviews were scheduled 18-30 months after receipt of the first retired- worker benefit check to allow for a period of ad- justment to the change in lifestyle brought about by retirement and its diminished earnings. The income data reflect the respondent’s reported income sources and total income at the time of the interview, not at the time of first benefit receipt. The age variables used in the tables, including detailed appendix tables A-E, tabulate income data by the respondent’s age at receipt of the first benefit.
The discussion is divided into four sections. The first describes the age distribution of the NBS retired work- ers at the time of receipt of the first retired-worker bene- fit and the relationship of marital status to age at receipt of the first benefit. The second deals with the four major sources of retirement income-social security benefits, earnings, employer-provided pensions, and income from assets. The third section discusses total income and median income levels for the retired-worker and Medicare-only samples. The final section analyzes the shares of aggregate income derived from selected income sources.
Age and Marital Status at First Benefit Receipt
The age at which an individual applies for a benefit affects the benefit amount. A worker fully insured un- der the social security program may apply for full retired-worker benefits at age 65. If a claim is made from age 62 (the youngest age permitted by law) through age 64, the amount is actuarially reduced by 5/9 of 1 percent for each month that the applicant is younger than age 65. Thus, if benefits were received from the month in which an individual attained age 62, the benefit amount is reduced by 20 percent. For indi- viduals waiting until after age 65 to receive benefits, increments for delayed retirement will increase the monthly benefit amount.
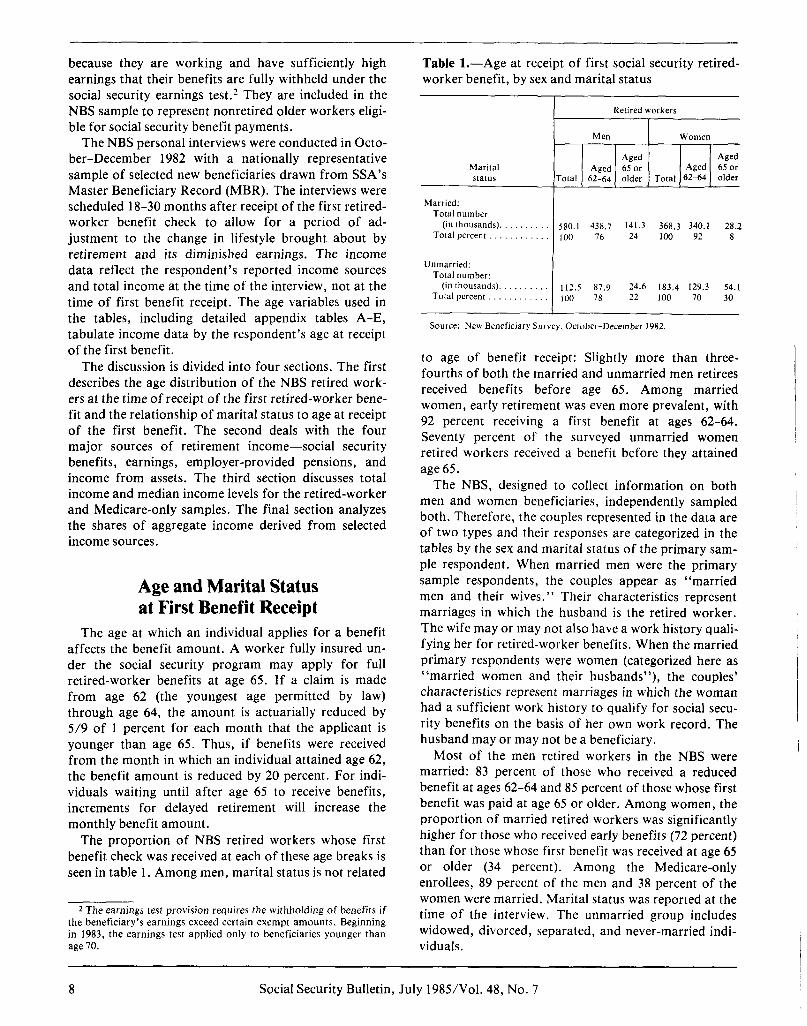
The proportion of NBS retired workers whose first benefit check was received at each of these age breaks is seen in table 1. Among men, marital status is not related
2 The earnings test provision requires the withholding of benefits if the beneficiary’s earnings exceed certain exempt amounts. Beginning in 1983, the earnings test applied only to beneficiaries younger than age 70.
Table l.-Age at receipt of first social security retired- worker benefit, by sex and marital status
Retired workers
Marital status
MelI Women
Aged Aged Aged 65 or Aged 65or
Total 62-64 older Total G-64 older
Married: Total number
(in thousands). 580.1 438.7 141.3 368.3 340.1 28.2 Total percent t()o 76 24 100 92 8
Unmarried: Total number:
(ifl thousands). 112.5 87.9 24.6 183.4 129.3 54.1 Total percent 100 78 22 100 70 30
Source: New Beneficiary Survey, October-December 1982.
to age of benefit receipt: Slightly more than three- fourths of both the married and unmarried men retirees received benefits before age 65. Among married women, early retirement was even more prevalent, with 92 percent receiving a first benefit at ages 62-64. Seventy percent of the surveyed unmarried women retired workers received a benefit before they attained age 65.
The NBS, designed to collect information on both men and women beneficiaries, independently sampled both. Therefore, the couples represented in the data are of two types and their responses are categorized in the tables by the sex and marital status of the primary sam- ple respondent. When married men were the primary sample respondents, the couples appear as “married men and their wives.” Their characteristics represent marriages in which the husband is the retired worker. The wife may or may not also have a work history quali- fying her for retired-worker benefits. When the married primary respondents were women (categorized here as “married women and their husbands”), the couples’ characteristics represent marriages in which the woman had a sufficient work history to qualify for social secu- rity benefits on the basis of her own work record. The husband may or may not be a beneficiary.
Most of the men retired workers in the NBS were married: 83 percent of those who received a reduced benefit at ages 62-64 and 85 percent of those whose first benefit was paid at age 65 or older. Among women, the proportion of married retired workers was significantly higher for those who received early benefits (72 percent) than for those whose first benefit was received at age 65 or older (34 percent). Among the Medicare-only enrollees, 89 percent of the men and 38 percent of the women were married. Marital status was reported at the time of the interview. The unmarried group includes widowed, divorced, separated, and never-married indi- viduals.
8 Social Security Bulletin, July 1985IVol. 48, No. 7

Sources of Income The NBS included questions about the amounts of
income received from different sources for each of the 3 months preceding the month of interview.s For married couples, the individual receiving the income-husband or wife-was determined. The survey also recorded receipt of income from asset holdings such as savings accounts, stocks or bonds, real property, or businesses. For married couples, asset income was attributed to the couple jointly. The four major classes of retirement income-social security benefits, earnings, employer- provided pensions, and asset income-are discussed below and are related to the age at which the respondent first received retired-worker benefits.
Social Security Benefits
Almost all retired-worker respondents were receiving social security benefits at the time of the NBS interview. About 98-99 percent of those retired workers who received a benefit before age 65 reported social security benefit income (table 2). Lower rates of benefit receipt (yet always at least 90 percent) prevailed among those who claimed benefits at age 65 or older.
It was not expected that each NBS retired worker would be receiving a current monthly benefit even though a first benefit payment had been received in June 1980-May 1981. If a beneficiary works and earns more than the amount allowed under the social security earnings test, some or all benefits may be withheld for all or part of the year.4
As mentioned earlier, the design of the NBS permits study of the spouses of men and women retired workers. Generally more husbands of retired-worker women (75 percent) received social security benefits than did wives of retired men (51 percent).5 Only for these wives did benefit receipt rates vary for the older and younger new beneficiaries. About three-fourths of the husbands of women respondents received social security benefits regardless of whether the woman had received her first benefit payment before or after attaining age 65. In con-
3 A general overview of the sources of income for newly retired workers was the subject of an earlier NBS study. See Linda Drazga Maxfield and Virginia P. Reno, “Distribution of Income Sources of Recent Retirees: l&dings From the New Beneficiary Survey,” Social Security Bulletin, January 1985, pages 7-13. The focus of this article differs from the January article’s focus in that it presents retired- worker income variations by the age at which the first benefit was received and it includes the income characteristics of both the married women retired workers and their husbands and the Medicare-only respondents.
4 The earnings test is administered on an annual basis. In 1982, the annual earnings exempt amounts were $4,440 for persons younger than age 65 and $6,000 for those aged 65-71. For beneficiaries earning more than these amounts, social security benefits are reduced by $1 for each $2 of earnings above the exempt amount.
s For married respondents, the total percent of spouses with their own social security income is found by summing the “Self and spouse” and “Spouse only” percentages in table 2.
trast, the wives of retired-worker men were more likely to be social security beneficiaries if their husbands had received benefits at age 65 or older (64 percent) rather than at ages 62-64 (47 percent).
The majority of Medicare-only respondents (87-94 percent), although entitled to social security cash bene- fits by July 1982, were not receiving monthly benefit checks at the end of 1982. Their spouses, however, were often social security beneficiaries: 29 percent of the wives of men Medicare-only enrollees and 67 percent of the husbands of women Medicare-only enrollees were receiving monthly benefits.
Earnings
At the time of the NBS interview, a large minority of the respondent retired workers received income from their own earnings (table 3). Among unmarried retired women (30 percent) and married men retirees (27 per- cent) the proportions were similar. The unmarried men (22 percent) and married retired-worker women (19 per- cent) were less likely to have earnings.
Current earnings were more common among retired workers whose first benefit was received at age 65 or older than among those who received early retirement benefits. Among those who delayed retirement to age 65 or older, rates of earnings receipt were notably consist- ent at 34-35 percent, regardless of sex or marital status.
The earnings of a spouse of a retired worker 6 were also an important source of income. Husbands of women retired workers reported earned income at the time of the interview only slightly more often (31 per- cent) than did the wives of retired men (27 percent). In a couple where the retired worker received benefits before age 65 and where the spouse had current earnings, it was more likely that only the spouse, instead of both mar- riage partners, had such earnings. The incidence of spouse-only and both partners having earnings was more nearly equal for couples in which benefits were re- ceived at the older ages.
Among the Medicare-only respondents, the percent- age of respondents with their own earnings was very high-never below 92 percent. A comparison of the high proportion of Medicare-only enrollees who had income from earnings (table 3) with the low percentage who had social security benefit income (table 2) leads to the conclusion that these nonbeneficiary men and women have strong attachments to the labor force.
Husbands of Medicare-only enrollees were more likely (51 percent) than the husbands of women retired workers (31 percent) to have had earnings at the time of the interview. However, the wives of men retirees and of men enrolled for Medicare only had nearly identical
6 For married respondents, the total percent of spouses with their own earnings is found by summing the “Self and spouse” and “Spouse only” percentages in table 3.
Social Security Bulletin, July 1985/Vol. 48, No. 7 9
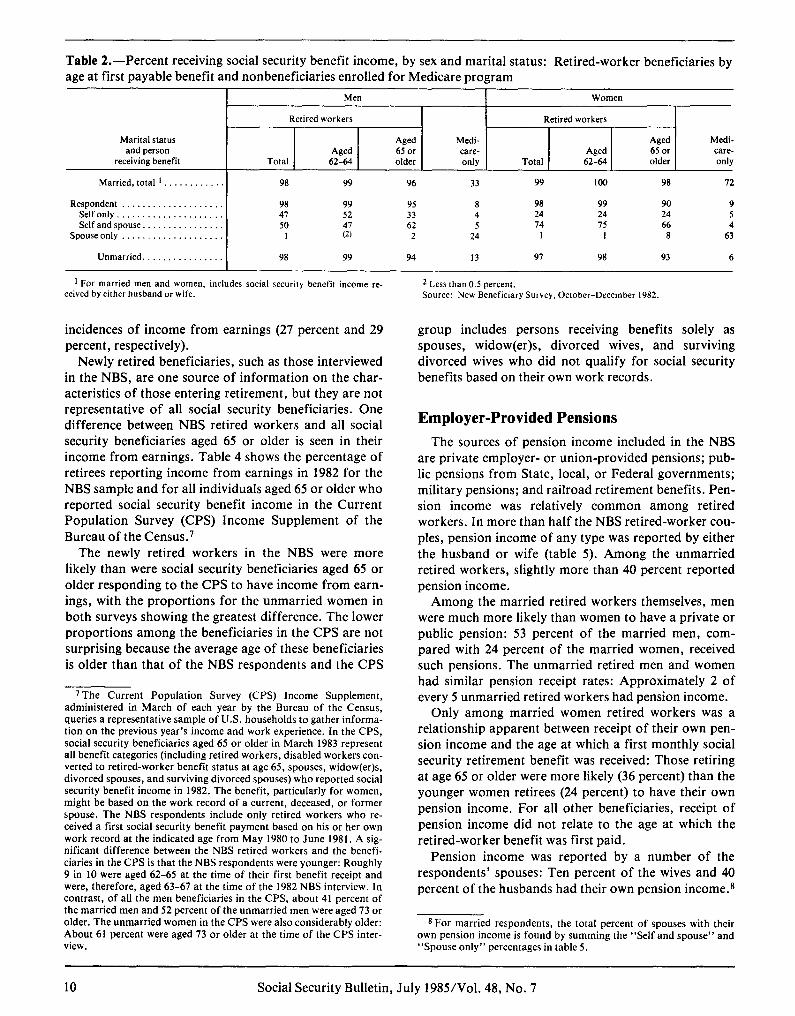
Table 2.-Percent receiving social security benefit income, by sex and marital status: Retired-worker beneficiaries by age at first payable benefit and nonbeneficiaries enrolled for Medicare program
Marital status and person
receiving benefit
Married, total I. . . .
Respondent . . . . . . . . . . . . . . . . . . . Self only. . . . . Self and spouse. . .
Spouse only . . . . . . . . . .
Unmarried. . . . . . .
Men
Retired workers
Aged Total 62-64
98 99
98 99 47 52 50
;12: 1
98 99
Aged Medi- 65 or care- older only
96 33
95 8 33 4 62 5
2 24
94 13
Women
Retired workers
Aged Total 62-64
99 100
98 99 24 24 74 75
I I
97 98
Aged Medi- 65 or care- older only
98 72
90 9 24 5 66 4
a 63
93 6
’ For married men and women, includes social security benefit income re- z Less than 0.5 percent. ceived by either husband or wife. Source: New Beneficiary Survey, October-December 1982.
incidences of income from earnings (27 percent and 29 percent, respectively).
Newly retired beneficiaries, such as those interviewed in the NBS, are one source of information on the char- acteristics of those entering retirement, but they are not representative of all social security beneficiaries. One difference between NBS retired workers and all social security beneficiaries aged 65 or older is seen in their income from earnings. Table 4 shows the percentage of retirees reporting income from earnings in 1982 for the NBS sample and for all individuals aged 65 or older who reported social security benefit income in the Current Population Survey (CPS) Income Supplement of the Bureau of the Census.’
group includes persons receiving benefits solely as spouses, widow(er)s, divorced wives, and surviving divorced wives who did not qualify for social security benefits based on their own work records.
Employer-Provided Pensions
The newly retired workers in the NBS were more likely than were social security beneficiaries aged 65 or older responding to the CPS to have income from earn- ings, with the proportions for the unmarried women in both surveys showing the greatest difference. The lower proportions among the beneficiaries in the CPS are not surprising because the average age of these beneficiaries is older than that of the NBS respondents and the CPS
The sources of pension income included in the NBS are private employer- or union-provided pensions; pub- lic pensions from State, local, or Federal governments; military pensions; and railroad retirement benefits. Pen- sion income was relatively common among retired workers. In more than half the NBS retired-worker cou- ples, pension income of any type was reported by either the husband or wife (table 5). Among the unmarried retired workers, slightly more than 40 percent reported pension income.
‘The Current Population Survey (CPS) Income Supplement, administered in March of each year by the Bureau of the Census, queries a representative sample of U.S. households to gather informa- tion on the previous year’s income and work experience. In the CPS, social security beneficiaries aged 65 or older in March 1983 represent all benefit categories (including retired workers, disabled workers con- verted to retired-worker benefit status at age 65, spouses, widow(er)s, divorced spouses, and surviving divorced spouses) who reported social security benefit income in 1982. The benefit, particularly for women, might be based on the work record of a current, deceased, or former spouse. The NBS respondents include only retired workers who re- ceived a first social security benefit payment based on his or her own work record at the indicated age from May 1980 to June 1981. A sig- nificant difference between the NBS retired workers and the benefi- ciaries in the CPS is that the NBS respondents were younger: Roughly 9 in 10 were aged 62-65 at the time of their first benefit receipt and were, therefore, aged 63-67 at the time of the 1982 NBS interview. In contrast, of all the men beneficiaries in the CPS, about 41 percent of the married men and 52 percent of the unmarried men were aged 73 or older. The unmarried women in the CPS were also considerably older: About 61 percent were aged 73 or older at the time of the CPS inter- view.
Among the married retired workers themselves, men were much more likely than women to have a private or public pension: 53 percent of the married men, com- pared with 24 percent of the married women, received such pensions. The unmarried retired men and women had similar pension receipt rates: Approximately 2 of every 5 unmarried retired workers had pension income.
Only among married women retired workers was a relationship apparent between receipt of their own pen- sion income and the age at which a first monthly social security retirement benefit was received: Those retiring at age 65 or older were more likely (36 percent) than the younger women retirees (24 percent) to have their own pension income. For all other beneficiaries, receipt of pension income did not relate to the age at which the retired-worker benefit was first paid.
Pension income was reported by a number of the respondents’ spouses: Ten percent of the wives and 40 percent of the husbands had their own pension income.8
s For married respondents, the total percent of spouses with their own pension income is found by summing the “Self and spouse” and “Spouse only” percentages in table 5.
Social Security Bulletin, July 19851Vol. 48, No. 7

Table 3.-Percent receiving income from earnings, by sex and marital status: Retired-worker beneficiaries by age at first payable benefit and nonbeneficiaries enrolled for Medicare program
Marital status and person
receiving income
Married, total t
Respondent . . . Self only. . Self and spouse.
Spouse only
Unmarried. . .
Men
Retired workers
Aged Total 62-64
44 42
27 24 17 15 10 IO 17 18
22 18
Aged Medi- 65 or care- older only
48 95
35 93 25 66 II 27 12 2
35 92
Women
Retired workers
Aged Total 62-64
42 41
19 18 11 10 8 8
23 23
30 29
Aged Medi- 65 or care older only
57 98
35 94 19 48 15 46 22 5
34 99
’ For married men and women, includes earnings received by either husband or wife.
Married women retired workers had higher pension receipt rates (24 percent) than did the wives of the retired men (10 percent). This difference is not surpris- ing because the wife of a retired worker also may have been either a retired worker or a spouse beneficiary who, by definition, had not earned sufficient credits in social security covered employment to qualify as a bene- ficiary on her own employment history. With a scant or sporadic work record, she would be less likely to qualify for her own pension. It is also possible that the wives of the men respondents may have been too young to retire and claim pension benefits for which they will be eligi- ble. In contrast, all the women retired workers had to be at least age 62 to receive this type of social security bene- fit.
Private pensions were more widely received than pub- lic pensions and were most often received by married men respondents (36 percent). Married women them- selves were least likely (15 percent) to report private pen- sion income. The same pattern of receipt rates held for public pensions, although variations by marital status and sex were much less pronounced. In fact, among those retiring at age 65 or older, married women were at least as likely (18 percent) as were all other groups
Table 4.-Percent with income from earnings in 1982, by sex and marital status
Marital status and sex
Married men and their wives.
New Current Beneficiary Population
Survey t Survey 2
44 33
Unmarried: Men . . . . . . . . . . . . . . . . Women......................
22 15 30 9
t Includes only married men retired workers and their wives and unmarried retired workers interviewed in October-December 1982 who received a first re- tired-worker benefit payment during mid-1980 to mid-1981.
2 Includes all couples and unmarried persons aged 65 or older in 1983 who re- ported receipt of social security benefits in 1982 in the Current Population Sur- vey (CPS) March 1983 Income Supplement. Source: Susan Grad, Income of the Population 55 and Over, 1982, Office of Retirement and Survivors Insur- ance and Office of Policy, Social Security Administration, March 1984, table 3.
Source: New Beneficiary Survey, October-December 1982.
(14-18 percent) to report the receipt of public pension income.
Rates of pension receipt among the Medicare-only sample of the NBS were several times lower than rates for retired workers. Pensions were most common among men Medicare-only respondents: 18 percent for unmarried men and 17 percent for married men. Un- married women Medicare-only enrollees were almost as likely (14 percent) as the men, and substantially more likely than married women Medicare-only enrollees (6 percent), to report any type of pension income.
The NBS newly retired workers reported higher rates of pension income receipt than previous new benefi- ciaries had reported. In table 6, NBS pension receipt data are presented with income data acquired during SSA’s 1970 Survey of Newly Entitled Beneficiaries.9 For respondents in both surveys, the proportion with their own pension income was higher in 1982 than in 1970. The difference was most dramatic for women-particu- larly married women, whose receipt rate of their own private and public pensions doubled in the period.
It should be noted again that the increases in pension receipt rates shown in table 6 are for new retired-worker beneficiaries and are not representative of all aged social security beneficiaries. This point is illustrated in table 7 where the rates of pension receipt reported by the NBS retired workers are shown alongside the rates for all aged beneficiaries reporting in the CPS. The receipt rates for couples, shown in table 7, include receipt by husband or wife.
For the unmarried men and for couples, both private and public pension receipt rates were slightly higher for the NBS retired workers than for all aged beneficiaries in the CPS. The range was different for unmarried women, however: Private pension income receipt was significantly higher for the unmarried women retired workers in the NBS than for the CPS respondents.
9 See Reaching Retirement Age: Findings From a Survey of Newly Entitled Workers, 1968-70 (Research Report No. 47), Office of Re- search and Statistics, Social Security Administration, 1976.
Social Security Bulletin, July 19851Vol. 48, No. 7 11

Table 5.-Percent receiving retirement benefits other than social security, by sex and marital status: Retired-worker beneficiaries by age at first payable benefit and nonbeneficiaries enrolled for Medicare program
Marital status and person
receiving income
Married, total t ............
Respondent .................... Self only ..................... Self and spouse. ...............
Spouse only ....................
Unmarried. ...............
Married, total t ............
Respondent .................... Self only. .................... Self and spouse. ...............
Spouse only ....................
Unmarried. ...............
Married, total t ............
Respondent .................... Self only. .................... Self and spouse. ...............
Spouse only ....................
Unmarried. ...............
Men Women I I
Private or public pension
56 57 53 22 54 54 54 31
53 54 50 17 24 24 36 6 46 47 44 16 13 13 21 2
7 7 6 1 11 11 15 4 3 3 3 5 29 30 18 25
41 41 41 18 43 42 45 14
Private pension 2
39 39 37 11 37 37 35 24
36 37 35 9 15 15 18 32 33 32 9 9 9 11 0: 4 4 3 (3) 6 6 7 3 2 2 3 2 22 22 16 21
26 26 28 12 28 28 29 10
Public pension
20 21 20 12 21 20 25 8
19 19 18 9 10 9 18 3
17 17 16 8 7 7 14 2 2 2 I 2 2 4 (3: 2 2 2 3 11 11 7 5
16 17 14 6 16 14 18 4
t For married men and women, includes pension income received by either husband or wife.
* includes railroad retirement pension.
These women were twice as likely to have private pen- sion income (28 percent) as were the unmarried women aged 65 or older (14 percent) in the CPS. Once again, the sharply divergent receipt rates may be explained in part by the difference in the composition of these two groups: NBS retired workers were eligible for benefits based on their own earnings histories, while aged benefi- ciaries in the CPS include dependent beneficiaries (such as spouses, widow(er)s, divorced wives, and surviving divorced wives) with little or no labor-force attachment and thus little chance for pension eligibility.
Income from Asset Holdings The NBS questionnaire covered a wide range of mate-
rial about income received from asset holdings such as savings, checking, or money market accounts; certifi- cates of deposit; stocks; bonds; income from property rentals; annuity payments; and withdrawals from Keogh or Individual Retirement Accounts (IRA’s). Married respondents were asked about asset income received by either the respondent or the spouse. (These data for married respondents are not available sepa- rately for husbands and wives.)
3 Less than0.5 percent. Source: New Beneficiary Survey, October-December 1982.
A majority of the NBS respondents in all categories reported income from assets (table 8). Eighty-three per- cent of the married retired workers and their spouses reported such income. Unmarried retired workers were less likely than the married couples to have asset income. Generally, unmarried women had asset income more often than unmarried men-72 percent and 63 percent, respectively.
The older NBS married couples reported asset income more frequently than couples in which the retired work- er received benefits before age 65. Among the unmar- ried retired workers, rates of asset income receipt were also higher for the older new beneficiaries. Although unmarried women generally reported asset income more often than single men, the gap disappeared when the first retired-worker benefit was not received until age 65 or older. For these older unmarried men and women re- tired workers, the rate was essentially identical (77-78 percent).
Nonbeneficiaries enrolled for Medicare only reported asset income more frequently than did any of the retired-worker groups surveyed (table 8). In all instances, more than 90 percent of these respondents
12 Social Security Bulletin, July 1985/Vol. 48, No. 7
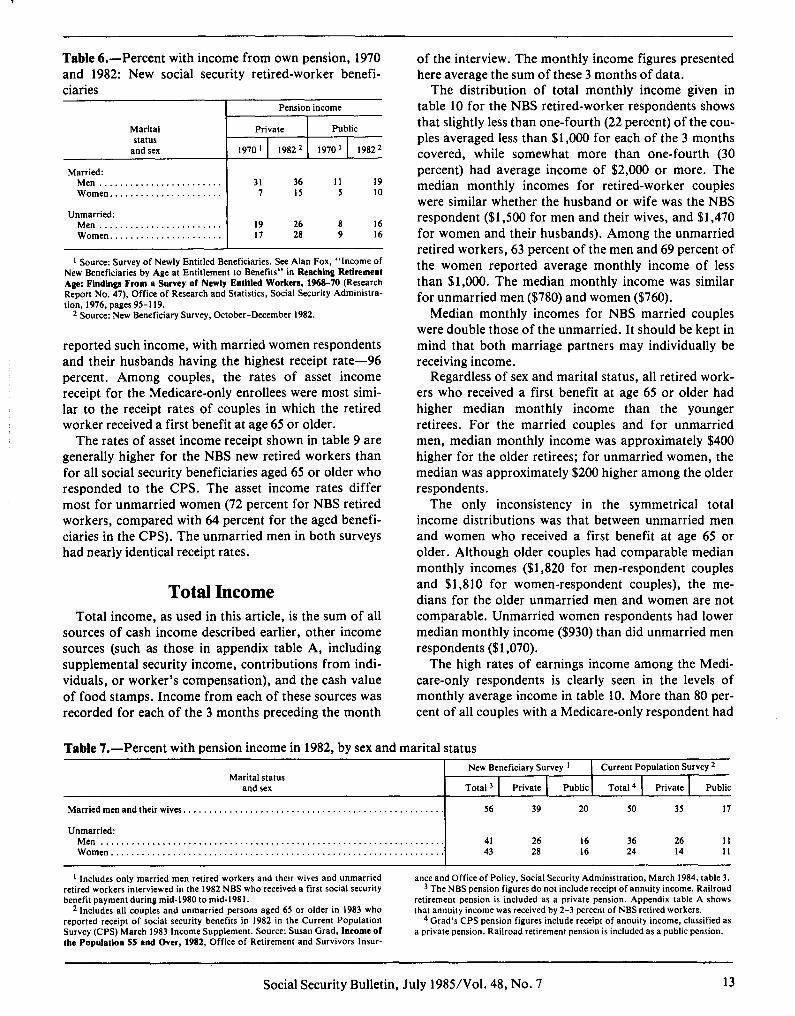
Table 6.-Percent with income from own pension, 1970 and 1982: New social security retired-worker benefi- ciaries
Pension income
Marital Private Public status
and sex 1970 ’ 19822 1970 ’ 19822
Married: Men . . . . . . . . . . . . . . . . . . . . . . . . 31 36 11 19 Women...................... 1 15 5 10
Unmarried: Men . . . . . . . . . . . . . . . . . . . . . . . . 19 26 a 16 Women...................... 17 28 9 16
t Source: Survey of Newly Entitled Beneficiaries. See Alan Fox, “Income of New Beneficiaries by Age at Entitlement to Benefits” in Reaching Retirement Age: Findings From a Survey of Newly Entitled Workers, 1968-70 (Research Report No. 47), Office of Research and Statistics, Social Security Administra- tion, 1976, pages 95-119.
2 Source: New Beneficiary Survey, October-December 1982.
reported such income, with married women respondents and their husbands having the highest receipt rate-96 percent. Among couples, the rates of asset income receipt for the Medicare-only enrollees were most simi- lar to the receipt rates of couples in which the retired worker received a first benefit at age 65 or older.
The rates of asset income receipt shown in table 9 are generally higher for the NBS new retired workers than for all social security beneficiaries aged 65 or older who responded to the CPS. The asset income rates differ most for unmarried women (72 percent for NBS retired workers, compared with 64 percent for the aged benefi- ciaries in the CPS). The unmarried men in both surveys had nearly identical receipt rates.
Total Income Total income, as used in this article, is the sum of all
sources of cash income described earlier, other income sources (such as those in appendix table A, including supplemental security income, contributions from indi- viduals, or worker’s compensation), and the cash value of food stamps. Income from each of these sources was recorded for each of the 3 months preceding the month
of the interview. The monthly income figures presented here average the sum of these 3 months of data.
The distribution of total monthly income given in table 10 for the NBS retired-worker respondents shows that slightly less than one-fourth (22 percent) of the cou- ples averaged less than $1,000 for each of the 3 months covered, while somewhat more than one-fourth (30 percent) had average income of $2,000 or more. The median monthly incomes for retired-worker couples were similar whether the husband or wife was the NBS respondent ($1,500 for men and their wives, and $1,470 for women and their husbands). Among the unmarried retired workers, 63 percent of the men and 69 percent of the women reported average monthly income of less than $1,000. The median monthly income was similar for unmarried men ($780) and women ($760).
Median monthly incomes for NBS married couples were double those of the unmarried. It should be kept in mind that both marriage partners may individually be receiving income.
Regardless of sex and marital status, all retired work- ers who received a first benefit at age 65 or older had higher median monthly income than the younger retirees. For the married couples and for unmarried men, median monthly income was approximately $400 higher for the older retirees; for unmarried women, the median was approximately $200 higher among the older respondents.
The only inconsistency in the symmetrical total income distributions was that between unmarried men and women who received a first benefit at age 65 or older. Although older couples had comparable median monthly incomes ($1,820 for men-respondent couples and $1,810 for women-respondent couples), the me- dians for the older unmarried men and women are not comparable. Unmarried women respondents had lower median monthly income ($930) than did unmarried men respondents ($1,070).
The high rates of earnings income among the Medi- care-only respondents is clearly seen in the levels of monthly average income in table 10. More than 80 per- cent of all couples with a Medicare-only respondent had
Table 7.-Percent with pension income in 1982, by sex and marital status
Marital status and sex
Married men and their wives. . . . . . . . . . . . . . . . . . . . . . . . . . . . . . . . . . . . . . . . . .
Unmarried: Men . . . . . . . . . . . . . . . . . . . . . . . . . . . . . . . . . . . . . . . . . . . . . . . . . . . . . . . . . . . . . . . . . . . Women . . . . . . . . . . . . . . . . . . . . . . . . . . . . . . . . . . . . . . . . . . . . . . . . . . . . . . . . . . . . . . . . .
New Beneficiary Survey t Current Population Survey 2
Total 3 Private Public Total 4 Private Public
56 39 20 50 35 17
41 26 16 36 26 11 43 28 16 24 14 I1
t Includes only married men retired workers and their wives and unmarried retired workers interviewed in the 1982 NBS who received a first social security benefit payment during mid-1980 to mid-1981.
* includes all couples and unmarried persons aged 65 or older in 1983 who reported receipt of social security benefits in 1982 in the Current Population Survey (CPS) March 1983 Income Supplement. Source: Susan Grad, Income of the Population 55 and Over, 1982, Office of Retirement and Survivors Insur-
ante and Office of Policy, Social Security Administration, March 1984, table 3. 3 The NBS pension figures do not include receipt of annuity income. Railroad
retirement pension is included as a private pension. Appendix table A shows that annuity income was received by 2-3 percent of NBS retired workers.
4 Grad’s CPS pension figures include receipt of annuity income, classified as a private pension. Railroad retirement pension is included as a public pension.
Social Security Bulletin, July 1985/Vol. 48, No. 7 13

Table ((.-Percent receiving income from asset holdings, by sex and marital status: Retired-worker beneficiaries by age at first payable benefit and non- beneficiaries enrolled for Medicare program
Marital status
Retired workers Medi-
Aged Aged 65 care- Total 62-64 or older only
Men
Married ‘. 83 81 90 94 Unmarried 63 58 78 93
Women
Married ’ . . 83 83 88 96 Unmarried . . . . 72 70 77 91
’ For married men and women, data arc for couple and include asset income of husband and wife.
Source: New Beneficiary Survey, October-December 1982.
total average monthly income exceeding $2,000. Their total income distributions were markedly higher than those of the married men and women retired workers. For the unmarried, as well, the Medicare-only respond- ents had significantly higher levels of monthly income than did the retired workers. Eighty percent of the un- married Medicare-only men enrollees and 75 percent of the unmarried women had average income exceeding $1,500 a month.
It is again important to note that the new beneficiaries in the NBS are representative only of retired workers who received a first benefit payment in mid-1980 through mid-1981. In table 11, the average monthly total income of the NBS retired workers is shown with that of the social security beneficiaries aged 65 or older in the CPS. In all cases, the newly retired NBS respond- ents had higher average monthly incomes than did the aged beneficiaries in the CPS. The disparity between the median incomes of these two groups is approximately $100 lower for unmarried men than for either couples or unmarried women. This pattern follows the pattern seen earlier for receipt rates of earnings and pension income.
rable 9.-Percent with asset income’ in 1982, by sex and marital status
Marital status and sex
New Current Beneficiary Population
Survey * Survey 3
Married men and their wives. . . 83 78
Unmarried: Men . Women......................
63 61 72 64
’ The NBS asset income receipt figures include receipt of annuity income; the CPS receipt figures do not.
2 Includes only married men retired workers and their wives and unmarried retired workers interviewed in the 1982 NBS who received a first social security benefit payment during mid-1980 to mid-1981.
3 Includes all couples and unmarried persons aged 65 or older in 1983 who reported receipt of social security benefits in 1982 in the Current Population Survey (CPS) March 1983 Income Supplement. Source: Susan Grad, Income of’ the Population 55 and Over, 1982, Office of Retirement and Survivors lnsur- ante and Office of Policy, Social Security Administration, March 1984, table 3.
Shares of Aggregate Income
To this point, the analysis has concentrated on the income distribution of NBS respondents. Another way to analyze income among the retired is to measure the proportion of aggregate income dollars derived from each income source. To determine aggregate income shares, the dollars of income from each major source are summed over all individuals and then divided by the summed grand total of all dollars from all income sources. In table 12, these shares are shown by selected income sources.
Social security benefits were the single largest compo- nent of aggregate dollar income. Unmarried NBS retired workers as a group received a larger share of ag- gregate income from social security benefits (40 percent for men and 42 percent for women) than did the married respondents (34 percent for couples with men respond- ents and 36 percent for couples with women re- spondents). The proportion of social security dollars to aggregate income varied little within each sex, marital status, and benefit receipt age group.
The proportion of aggregate dollars derived from asset income was relatively constant (20-23 percent) for married and unmarried retired workers. For men, the proportion was only slightly higher at the older retire- ment ages than at the younger ages.
In contrast to the picture that emerges for asset in- come, among all the NBS retired workers the share of income from earnings differed significantly with the age at which the first benefit was received. The difference was most noticeable among unmarried men. Those who retired at or after age 65 received 26 percent of their aggregate income from earnings; for those who retired before age 65, only 10 percent of aggregate income came from earnings. For the other three retired-worker groups, earnings constituted a greater share of aggre- gate income for those who retired after age 64 than for those who retired at ages 62-64. This finding-that earnings made up a greater proportion of aggregate income for older retirees than for younger retired workers-is consistent with the earlier conclusion (table 3) that retired workers who received a benefit at age 65 or older were more likely to have earnings income than were retired workers who first received a benefit at ages 62-64.
The distribution of aggregate income shares for the NBS respondents enrolled for Medicare only was very different from that of the retired workers. For the Medi- care-only respondents, earnings were the major com- ponent of aggregate dollars. Earnings accounted for four-fifths of aggregate income dollars for unmarried women Medicare-only enrollees, and approximately two-thirds of aggregate income dollars for all Medicare- only couples and unmarried men Medicare-only en- rollees. Asset income was the second largest component
14 Social Security Bulletin, July 19851Vol. 48, No. 7
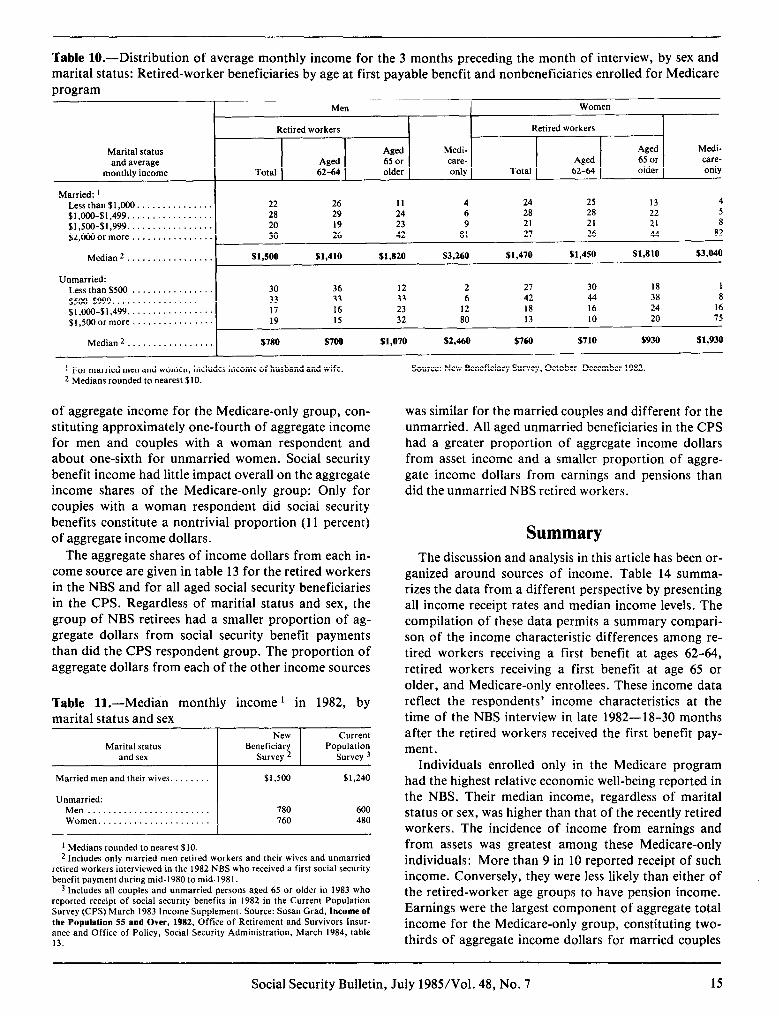
Table lO.-Distribution of average monthly income for the 3 months preceding the month of interview, by sex and marital status: Retired-worker beneficiaries by age at first payable benefit and nonbeneficiaries enrolled for Medicare program
Men women
Retired workers Retired workers
Marital status Aged Medi- Aged Medi-
and average Aged 65 or care- Aged 65 or care-
monthly income Total 62-64 older only Total 62-64 older only
Married: I Less than $1,000. .............. $1.000-$1.499. ................ $1,500~$1.999 ................. $2,OOOormore ................
22 26 II II 4 4 24 24 25 25 13 13 4 4
28 29 24 24 6 6 28 28 28 28 22 22 5 5
20 19 23 9 21 21 21 21 21 21 8 8
30 26 42 81 27 26 44 44 82 82
Median 2 . . . . . . . . . . . . . . . . . $1,500 $1,410 $1,820 $3,260 $1,470 $1,450 $1,810 $3,040
Unmarried: Less than $500 ................ $500~$999 .................... $1,000~$1,499. ................ $1,5000rmore.. ..............
30 36 12 12 2 2 27 27 30 30 18 1X 1 38 38 8 33 33 33 6 42 44
17 16 23 12 18 18 16 16 24 24 16 16
19 15 32 32 80 80 13 13 10 10 20 20 75 75
Median 2 . . . . . . . . . $780 $700 $1.070 $2,460 $760 $710 $930 $1,930
1 For married men and women, includes income of husband and wife. 2 Medians rounded to nearest $10.
of aggregate income for the Medicare-only group, con- stituting approximately one-fourth of aggregate income for men and couples with a woman respondent and about one-sixth for unmarried women. Social security benefit income had little impact overall on the aggregate income shares of the Medicare-only group: Only for couples with a woman respondent did social security benefits constitute a nontrivial proportion (11 percent) of aggregate income dollars.
The aggregate shares of income dollars from each in- come source are given in table 13 for the retired workers in the NBS and for all aged social security beneficiaries in the CPS. Regardless of maritial status and sex, the group of NBS retirees had a smaller proportion of ag- gregate dollars from social security benefit payments than did the CPS respondent group. The proportion of aggregate dollars from each of the other income sources
Table Il.-Median monthly income 1 in 1982, by marital status and sex
Marital status and sex I New Current
Beneficiary Population Survey 2 Survey 3
Married men and their wives. ....... $1,500 51,240
Unmarried: Men ........................ Women ......................
780 600 760 480
1 Medians rounded to nearest $10. 2 Includes only married men retired workers and their wives and unmarried
retired workers interviewed in the 1982 NBS who received a first social security benefit payment during mid-1980 to mid-1981.
3 Includes all couples and unmarried persons aged 65 or older in 1983 who reported receipt of social security benefits in 1982 in the Current Population Survey (CPS) March 1983 Income Supplement. Source: Susan Grad, Income of the Population 55 and Over, 1982, Office of Retirement and Survivors Insur- ance and Office of Policy, Social Security Administration, March 1984, table 13.
Source: New Beneficiary Survey, October-December 1982.
was similar for the married couples and different for the unmarried. All aged unmarried beneficiaries in the CPS had a greater proportion of aggregate income dollars from asset income and a smaller proportion of aggre- gate income dollars from earnings and pensions than did the unmarried NBS retired workers.
Summary The discussion and analysis in this article has been or-
ganized around sources of income. Table 14 summa- rizes the data from a different perspective by presenting all income receipt rates and median income levels. The compilation of these data permits a summary compari- son of the income characteristic differences among re- tired workers receiving a first benefit at ages 62-64, retired workers receiving a first benefit at age 65 or older, and Medicare-only enrollees. These income data reflect the respondents’ income characteristics at the time of the NBS interview in late 1982-18-30 months after the retired workers received the first benefit pay- ment.
Individuals enrolled only in the Medicare program had the highest relative economic well-being reported in the NBS. Their median income, regardless of marital status or sex, was higher than that of the recently retired workers. The incidence of income from earnings and from assets was greatest among these Medicare-only individuals: More than 9 in 10 reported receipt of such income. Conversely, they were less likely than either of the retired-worker age groups to have pension income. Earnings were the largest component of aggregate total income for the Medicare-only group, constituting two- thirds of aggregate income dollars for married couples
Social Security Bulletin, July 19850’01.48, No. 7 15
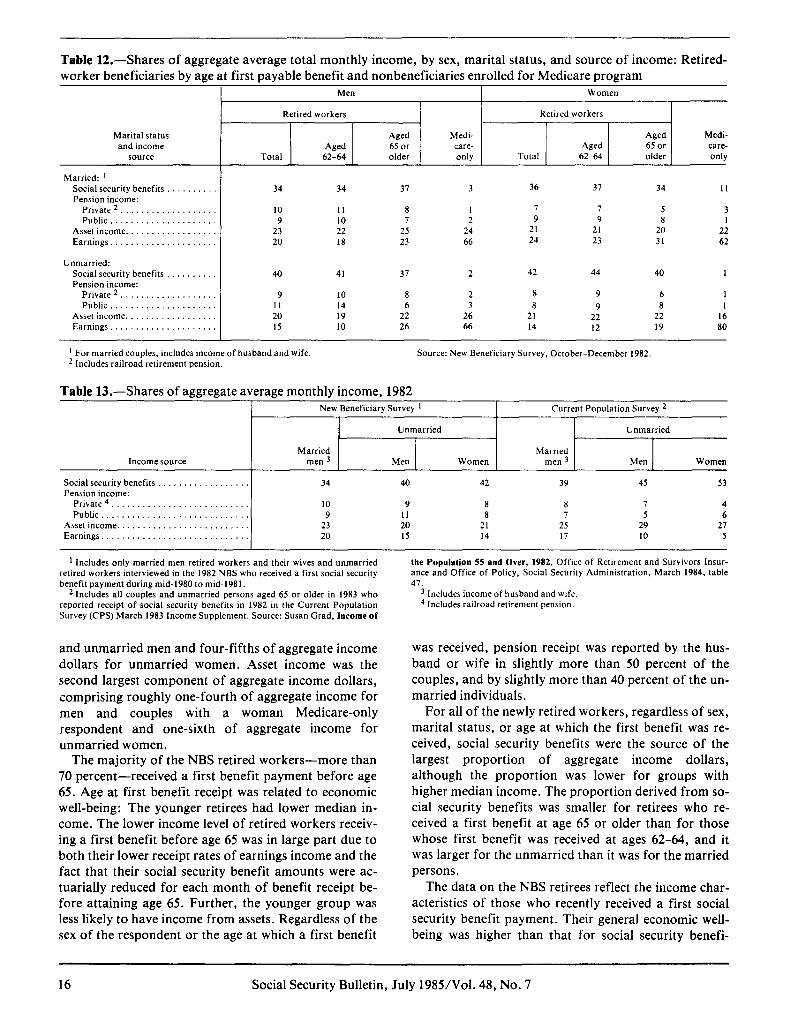
Table 12.-Shares of aggregate average total monthly income, by sex, marital status, and source of income: Retired- worker beneficiaries bv age at first uavable benefit and nonbeneficiaries enrolled for Medicare nrogram
Marital status and income
source
Married: t Social security benefits Pension income:
Private 2 Public. . .
Asset income. . . Earnings. . .
Unmarried: Social security benefits . Pension income:
Private 2 . Public .
Asset income.. . . . Earnings. , . . . . .
- . - Men
Retired workers
Aged Total 62-64
Aged Medi- 65 or care- older only
- - Women
Retired workers
Aged Total 62-64
Aged Medi- 65 or care- older only
34 34 37 3 36 37 34 I1
10 11 8 I 7 7 5 3 9 10 7 2 9 9 8 I
23 22 25 24 21 21 20 22 20 18 23 66 24 23 31 62
40 41 37 2 42 44 40 1
9 10 8 2 8 9 6 I 11 I4 6 3 8 9 8 I 20 I9 22 26 21 22 22 16 15 10 26 66 14 12 19 80
t For married couples, includes income of husband and wife. 2 Includes railroad retirement pension.
Source: New Beneficiary Survey, October-December 1982.
Table 13.-Shares of aggregate average monthly income, 1982 New Beneficiary Survey ’ Current Population Survey 2
I I I
Income source Married
men 3
Unmarried
Men Women Married
men 3
Unmarried
Men Women
Social security benefits Pension income:
Private 4. . Public. .
Asset income. . . Earnings. . .
34 40 42 39 45 53
IO 9 8 8 7 4 9 II 8 7 5 6
23 20 21 25 29 27 20 I5 14 17 10 5
t Includes only married men retired workers and their wives and unmarried the Population 55 and Over, 1982, Office of Retirement and Survivors Insur- retired workers interviewed in the 1982 NBS who received a first social security ance and Office of Policy, Social Security Administration, March 1984, table benefit payment during mid-1980 to mid-1981. 47.
2 Includes all couples and unmarried persons aged 65 or older in 1983 who reported receipt of social security benefits in 1982 in the Current Population Survey (CPS) March 1983 Income Supplement. Source: Susan Grad, income of
3 Includes income of husband and wife. 4 Includes railroad retirement pension.
and unmarried men and four-fifths of aggregate income dollars for unmarried women. Asset income was the second largest component of aggregate income dollars, comprising roughly one-fourth of aggregate income for men and couples with a woman Medicare-only respondent and one-sixth of aggregate income for unmarried women.
was received, pension receipt was reported by the hus- band or wife in slightly more than 50 percent of the couples, and by slightly more than 40 percent of the un- married individuals.
The majority of the NBS retired workers-more than 70 percent-received a first benefit payment before age 65. Age at first benefit receipt was related to economic well-being: The younger retirees had lower median in- come. The lower income level of retired workers receiv- ing a first benefit before age 65 was in large part due to both their lower receipt rates of earnings income and the fact that their social security benefit amounts were ac- tuarially reduced for each month of benefit receipt be- fore attaining age 65. Further, the younger group was less likely to have income from assets. Regardless of the sex of the respondent or the age at which a first benefit
For all of the newly retired workers, regardless of sex, marital status, or age at which the first benefit was re- ceived, social security benefits were the source of the largest proportion of aggregate income dollars, although the proportion was lower for groups with higher median income. The proportion derived from so- cial security benefits was smaller for retirees who re- ceived a first benefit at age 65 or older than for those whose first benefit was received at ages 62-64, and it was larger for the unmarried than it was for the married persons.
The data on the NBS retirees reflect the income char- acteristics of those who recently received a first social security benefit payment. Their general economic well- being was higher than that for social security benefi-
16 Social Security Bulletin, July 1985/Vol. 48, No. 7
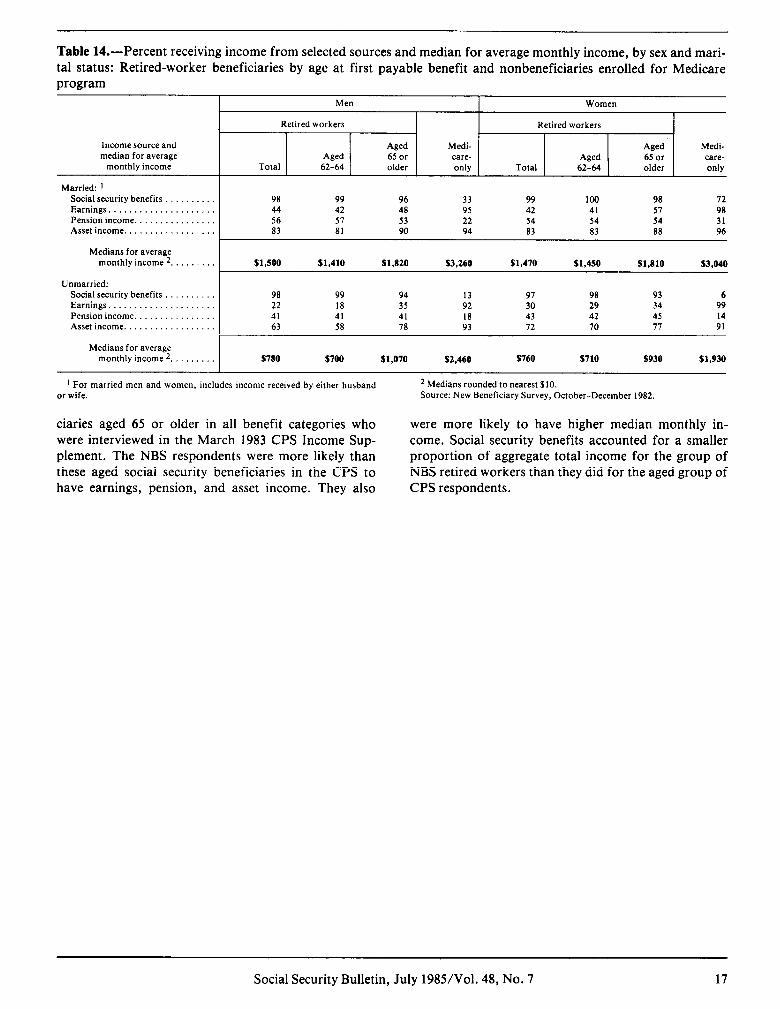
Table 14.-Percent receiving income from selected sources and median for average monthly income, by sex and mari- tal status: Retired-worker beneficiaries by age at first payable benefit and nonbeneficiaries enrolled for Medicare program
Income source and median for average
monthly income
Men
Retired workers
Aged Total 62-64
Aged 65 or older
Medi- care- only
Women
Retired workers
Aged Total 62-64
Aged 65 or older
Medi- care- only
Married: t Social security benefits . 98 99 96 33 99 100 98 72 Earnings. . . . . . . . 44 42 48 95 42 41 57 98 Pension income. . . . . . . . . . . 56 57 53 22 54 54 54 31 Asset income. . . 83 81 90 94 83 83 88 96
Medians for average monthly income 2. $1,500 $1,410 $1,820 $3,260 $1,470 $1,450 $1.810 $3.040
Unmarried: Social security benefits . . . . . 98 99 94 I3 97 98 93 6 Earnings. . . . . . . . . . . . . . . . 22 18 35 92 30 29 34 99 Pension income. . . . . 41 41 41 18 43 42 45 14 Asset income. . 63 58 78 93 72 70 77 91
Medians for average monthly income 2. . $780 $700 $1,070 $2,460 s760 $710 $930 $1,930
’ For married men and women, includes income received by either husband or wife.
2 Medians rounded to nearest $10. Source: New Beneficiary Survey, October-December 1982.
ciaries aged 65 or older in all benefit categories who were interviewed in the March 1983 CPS Income Sup- plement. The NBS respondents were more likely than these aged social security beneficiaries in the CPS to have earnings, pension, and asset income. They also
were more likely to have higher median monthly in- come. Social security benefits accounted for a smaller proportion of aggregate total income for the group of NBS retired workers than they did for the aged group of CPS respondents.
Social Security Bulletin, July 1985/Vol. 48, No. 7 17

Table A.-Sources of income l in 3 months immediately preceding interview, by sex and marital status: Retired- worker beneficiaries by age at first payable benefit and nonbeneficiaries enrolled for Medicare program 2
Income SDULCe in prior 3 months
Total number (in thousands)................
Percent receiving-- Earnings ...................................... Social Security ............................... Retirement benefits other than Social Security
Other public pensions ....................... Government employee pensions ..............
Federal ................................. state ox local .......................... tlilitary ................................
Private pensions ............................ Railroad retirement .......................
Income from assets ............................ Interest .................................... Income from IRA OL Keo h
e Other income from asse s ........................................ Dividends ................................. Rental property ........................... Roomers or boarders ....................... Estates, trusts O* royalties .............. Payments received on personal loans ....... Prrvate annuities .........................
Veterans’ benefits ............................
Alimony or child support ...................... Income from relatives OL others ...............
In the household ............................ Not in the household ........................
In-kind benefits .............................. Public housing or xent subsidies ............ Energy assistance ...........................
Percent of respondents receiving-- Earnings...................................... Social Security............................... Retirement benefits other than Social Security
Other public pensions ...................... . Private pensions ............................
Income from IRA or Keogh ......................
Total number (in thousands1 ................
Percenf receiving-- Earnings ...................................... Social Security ............................... Retirement benefits other than Social Security
Other public pensions.....: ................. Go;Eiw",;;t employee penslons
.. ......... .............................
State 0~ local ................... ........................ Military:
Private penslans ..................... Railroad retirement ................ . .
Income from assets ..................... . . Interest .................................... Income from IRA or Keo h
. Other income from asse s ........................................ Dividends ................................. Rental property ........................... Roomers OL boarders...................: ... Estates, trusts OL royalties .............. Payments received on personal loans ....... Private annuities .........................
Veterans' benefits ............................ Black lung benefits...: Unemployment compensation Workers corn ensation Public Assis awe. E
..................................................................... ..: ...
Supplemental Security Income ...................................... Food stem s State OL E ocsi’;ei~;;;;‘inci;i~~~‘~~~~::::::
Alimony OL child support ...................... Income from relatives OL others ...............
In the household ............................ Not in the household ........................
See foornotes at end of table
.
.
.
.
.
.
Retired workers
lotal
nedi- Rge 62-65 Rge 65 and wex oexe
only
Total 62 63-64 Total 65 66 and VJe?Z
tlarried men and their wives
438.7 273.8 164.9 141.3
13 6:2
1:::
1::
45.1 98.3
:62.; 16:9
1lf::
393:;
834 81.9
2:::
‘E
12 5:4
2:
1::
1::
1;;
.l
z”sj
:4 2:6
2.3
1::
372:::
90:;
62::
k’:
:1
:7’ .2
1.4
1:‘:
24.1
Ez 19:o
“Xi
1.7 .3
1::
‘:Z
4.5
:::
21.4
Harried women and their husbands
368.3 340.1 273.4 66.2. 28.2 21.6 6.6 16.3
1;:‘:
32.58 1:s
83.1
39.1 99.9 53.7 20.2
“zi 1;::
3::;
81.7 80.1
1.8
:::9’ Q.tj
.I
6::
2:
1.4
:‘;
::
:: 1.4
1::
18 Social Security Bulletin, July 1985/Vol. 48, No. 7

TabIF A.-Sources of income ’ in 3 months immediately preceding interview, by sex and marital status: Retired- worker beneficiaries by age at first payable benefit and nonbeneficiaries enrolled for Medicare program 2-Continued
Income source in prior 3 months
In-kind benefits ............................... Public housing OL rent subsidies ............. Energy assistance ............................
Percent of respondents receiving-- Earnings....................................... Social Security................................ Retirement benefits other than Social Security.
Other public pensions ................. Private pensions ......................
Income from IRA or Keogh ................
Total number (in thousands)................. 112.5 87.9 59.8 28.2 24.6 13.2 11.4
Percent receiving-- Earninss....................................... Social-Security................................ Retirement benefits other than Social Security.
Other public pensions ................ Government employee pensions .......
Federal .......................... state or local ................... Hilitary .........................
Private pensions Rallroad retirement .....................................
Income from assets ..................... Interest ............................. Income from IRR OL Keo h
? Oth+r,income from asse s .......................... Dlvldends .......................... Rental property .................... Roomers or boarders ................ Estates, trusts OL royalties ....... Payments received on personal loans Private annuities ..................
Veterans' benefits ..................... Black lung benefits .................... Unemployment compensation .............. Workers' corn ensation Public Assis e
.................. ante ......................
Sup Foo stamps a;
lemental Security Income ......... ............................
State or local welfare, including AFDC. Alimony OI child support ................. Income from relatives or others ..........
In the household ....................... Not 1" the household ...................
In-kind benefits ....................... Public housing or rent subsidies ..... Energy assistance ....................
See footnotes at end of table.
Retired workers
Age 62-64 Age 65 and ovex
Total Total 62 63-6'1 Total 65 66 and
over
tlsrried uomen and their husbands
tledi- CaIe only
‘2 3.1 :*: 2.1 .6 1.8 '2 7:: 1.0
2.1 ::i 2:s -NJ.5 1:: 1.1 1.4 1::
19.1 17.9 15.4
x
36.3 93.5
98.0 98.6 "2: "Pi
i::; %! E
15.2 1r(:9 1:::
:;::
19:2
17:1 i:.: kf
12.5 1.0 .8 .9 .5 'Z 3.4 2:
Unmarried men
i:i ::; 1.9 9.6
1; 6:: 3.2 3.7
2 2.1 1.3
.9
18.1
x ;;I;
4:9
k? 26.0
g;
:5
'27" 3:9 1.1
7L;
11.5
::
7::
f::
:: 2.5 l.s
.9
17.1
:t:: 17.6
'i:!
E 23.9
:i:;
:o
2:; 3.4
'3
T.! 11:s
.O
.8
5.5 :Z
f.$ :8
20.4
:i:; 15.4 15.0
4.0
i.t 30:3
;.:i
1:5
'2; 4.9
1::
F! 10:6
:i .4
E 1:4
.O
2:':
1:;
ii::; z-z '$2
;:i 28.1
.6 77.7
'Z 23:l
'2.2 1:3
i::
E 12
:Z
::; 1.8
:i .9
:i
34.2 93.8
K
'14 s:e 3.7
33::
w
19:: 11.0
2.4 1.9
2
1::
:i
4::
2;:
:;: 1.2
:i
8.3 3.9 5.2
9.1 i:;
11.0 4.4 8.1
Z:i 2.2
:-: 1:9
z.: 3:4
36.7
x 15:7
'?: 11:6
1.1 21.6
79:: 77.6
$%
718 .5
i::
z.z :5
1.1
;:;
17
:?
:i .7
Social Security Bulletin, July 1985/Vol. 48, No. 7 19

Table A.--Sources of income ’ in 3 months immediately preceding interview, by sex and marital status: Retired- worker beneficiaries by age at first payable benefit and nonbeneficiaries enrolled for Medicare program 2-Continued
Retired workers
Income source in prior 3 months
Total
Hedi- Age 62-64 Age 65 and OWL caxe
only
Total 62 63-64 Total 65 66 and over
Unmarried women
Total nulnber (in thousands)................. 183.4 129.3
Percent. receiving-- Earnings ....................................... Social Security ................................ Retirement benefits other than Social Security.
Other public pensions.....: Go;E$;;;ft employee pensxons
.. ......... ........................................................ State ox local ...........................
................................ tlilitary : Private penslons .............................
Railroad retirement ........................ Income from assets .............................
Interest ..................................... Income from IRA OL Keo h ..................... Other income from asse s f .....................
Dividends .................................. Rental property ............................ Roomers OI boarders ........................ Estates, trusts OL royalties ... ............ Payments received on personal 1~ 08ns ........ Private annuities .............. ............
Veterans’ benefits ................. ............ Black lung benefits...:
....................................
............ Unemployment compensation ............ Workers corn ensation Public Assis anoe
.,a.,
............ .................. ............
Foox Sup lemental Security Income ............
... .............. :::::. ........... state OL ocal welfare, including AFDC .......
Alimony or child support ....................... Income from relatives OI othezs ................
In the household ............................. Hot in the household .........................
In-kind benefits ............................... Public housing OL rent subsidies ............. Energy assistance ............................
:::
FII 1:5
1:: .6
z.7" 5:2
1:::
E 1:3
10.5
2::
11.5
4::
I Missing information on source of income is imputed. Totals may not add to 100 percent because of rounding.
2 Retired-worker beneficiaries with first payable benefit in June 1980-May
1981 and nonbeneficiaries aged 65 or older enrolled for Medicare program by July 1982.
Source: New Beneficiary Survey, October-December 1982.
20 Social Security Bulletin, July 1985/Vol. 48, No. 7

Table B.-Average monthly total income,’ by sex and marital status: Retired-worker beneficiaries by age at first pay- able benefit and nonbeneficiaries enrolled for
Average monthly total income
Total number (in thousands) ................ 580.1 'IZZ 273.8 Total percent ............................... 100.0 100.0
%:i Ki 89.0 52.3 188.7 100.0 100.0 100.0
Under 5400 ...................................... 5400-5599 ....................................... 5600-5799 ....................................... 5800-5999 .......................................
51.000-51.199 ................................... 51.200-51.399 ................................... 51.400-51.599 ................................... 51.600-51.799 ................................... 51.800-51.999 ...................................
$2.000-52.199 ................................... $2,200~*2,3gg ...................................
52.400-52,599 ................................... 52.600-52,799 ................................... 52,800-52,999 ...................................
53.000-53.999 .................................. $4,000-54,999 ................................... 55,000 or Doze .................................
u (roundedhQ$f&& $lp,. .............
Total number (in thousands) ............... Total percent ..............................
Under 5400 ..................................... $400-5599 ...................................... 5600-5799 ...................................... 5800-5999 ......................................
*1.000-51,199 .................................. 51.200-51,399 .................................. 51.400-51.599 .................................. 51.600-51,799 .................................. $1.800-$1,999 ..................................
$2.000-52.199 .................................. F&2,200-52,399 .................................. s2,400-52,599 .................................. 52.600-52,799 .................................. 52,800-52,999 ..................................
*3.000-53,999 .................................. 54.000-54.999 .................................. 55,000 OL maze .................................
w (youndrc] fn nearest $3) ...............
Seefootnotesatendoftable.
[edicare program 2
Retired uorkers
Redi- Age 62-64 Age 65 and OWL cab?
only Total
Total 62 63-64 Total 65 66 and ovez
Harried men and their wives
8.3
:i:;
$$
5.5
43::
:::
E 3:(1
it:92 ::i 1.3
2:
::::
i-;: 6:6
5.h
3.8
i:p
;:;
9:2
10.9
'"9-Z '5:;
5.2
3.9
i:f
2.2 1.4
9:3
E-i 1;;:
7.8
53::
:.i 1:6
:*i .7
5:2
;f:f
9:s 8.6
6.1
6.1 3.8
4.0 3.1
i-2 6:3
:-A .5
5:2
1;::
:Oo?i 9:'
6.q
6.2
:-t 2:4
:::
S:b
i.: 717
5.5
5.8
;:3
11.4
1:::
51.500 51,410 51.380 $1.470 51,820 51,760 51.960 53,260
tlarried women and their husbands
:;::i 340.1 100.0 273.4 100.0 100.0 66.8 100.0 28.2 100.0 21.6 10::: 100.0 16.3
*1,u70 51,450 51.400 51,640 51,810 51,830 51.720 53.040
Social Security Bulletin, July 1985/Vol. 48, No. 7 21

Table B.-Average monthly total income,’ by sex and marital status: Retired-worker beneficiaries by age at first pay- able benefit and nonbeneficiaries enrolled for Medicare program 2-Continued
Retired workers I
Average monthly total income
Total number (in thousands) ............... Total percent ..............................
Under 5200 ..................................... 5200-5299 ...................................... $300-5399 ...................................... 5400-5499 ......................................
5500-5599 ...................................... 5600-5699 ...................................... 5700-5799 ...................................... 5EOO-5899 ...................................... 5900~$999 ......................................
51,000-51,499 .................................. 51,500-51,999 .................................. 52,000 OL moxe .................................
tledian (rounded to nearest 53) ..................
Total number (in thousands) ......... Total percent ........................
Under 5200 ............................... 6200-5299 ................................ 5300-5399 ................................ 5400-5499 ................................
5500-5599 ................................ 56004699 ................................ 5700-5799 ................................ 5800-5899 ................................ 5900-5999 ................................
51,000-51,499 ............................ Y1.500-51,999 ............................ E2.000 OL mo+e ...........................
fledian (rounded fn pearesf 5u) ...........
Total
tiedi- Age 62-64 Age 65 end ovex CBLe
Only
Total 62 63-64 Total 65 66 and O”eL
Unmarried men
112.5 87.9 59.8 28.2 24.6 13.2 11.4 22.8 100.0 100.0 100.0 100.0 100.0 100.0 100.0 100.0
i:: 2.5 Z:i 1.4 1.7 1.8 1.6
9.6 1;:: 12.8 Z:i t:; :;:
12.1 15.0 17.3 10.0 !$a ;:a
1.7 1:
Z:! 8.1 6.2 z:: 2:: 2: ;:: 56:: ':i
::: 7.9 6.0 E:Y 'E ::: '6.;: z.: 5.8 5.1 3.5 8:5 8.3 9:7 6:8
17.3 1:::
7:;: 8.3
5780 5700
'E 7.0
5580
21.9 23.0 29.3 12.3 11.0 6.0 13.8 18.2 1::;
:::: 27.5 60.8 18.9
5860 51,070 5990 51,290 52.460
Unmarried women
E:tt 129.3 100.0 100.0 73.3 100.0 56.0 100.0 5q.1 100.0 37.3 100.0 16.8 100.0 26.7
2:; 7.6 9.4
1;::
i:: 7.7
8.4 3.1
1:::
7.0
'Z 8.9 7.7
4.3
1::: 12.7
6.1
% 8.2 7.9
'2
::
::
:.: 2:o
18.2 7.3 5.7
15.6 Z:Z
'E
3.2
?:i
5.9
24.5 24.9 23.7 'A:; '::: 1::;
15.7 30.2 44.7
5760 5710 5630 5790 5930 5920 5950 51,930
t Missing information on total income amounts is imputed. Totals may not 1981 and nonbeneficiaries aged 65 or older enrolled for Medicare program by add to 100 percent because of rounding. July 1982.
2 Retired-worker beneficiaries with first payable benefit in June 1980-May Source: New Beneficiary Survey, October-December 1982.
22 Social Security Bulletin, July 1985/Vol. 48, No. 7
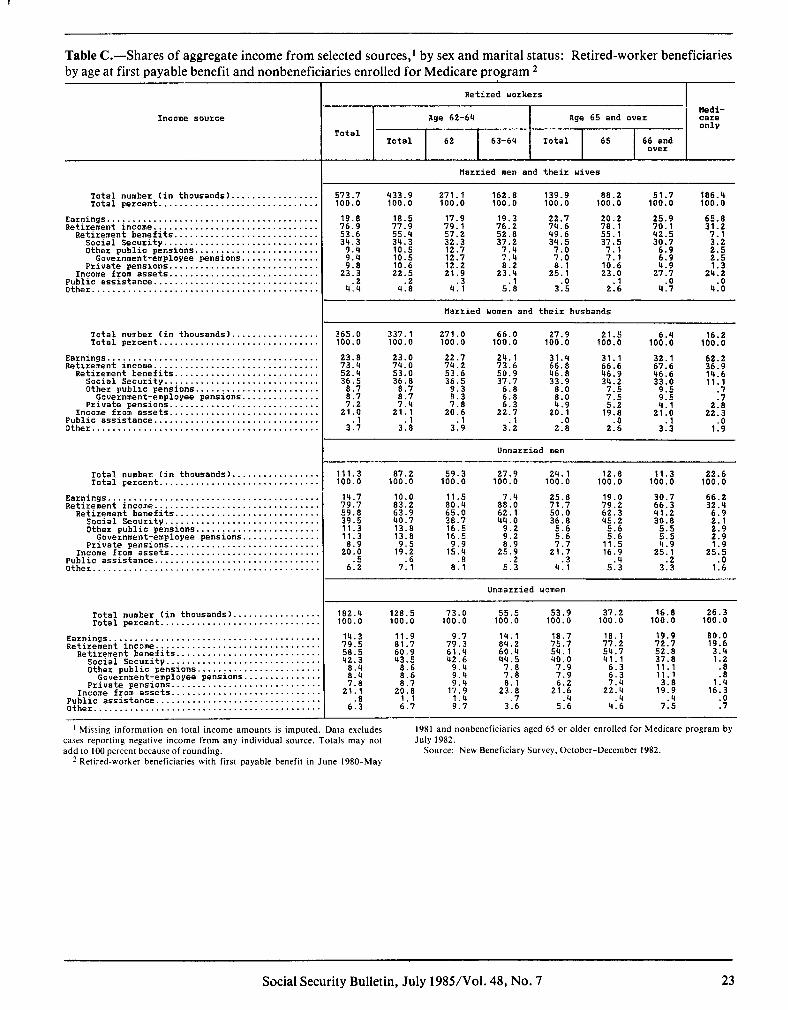
Table C.-Shares of aggregate income from selected sources,’ by sex and marital status: Retired-worker beneficiaries by age at first payable benefit and nonbeneficiaries enrolled for Medicare program 2
Retired workers
tledi- Age 62-64 Age 65 and over care
only Total
Total 62 63-64 Total 65 66 and O”eL
Income source
Married men and their wives
Total number (in thousands)... . . Total percent................. . .
. . .
. . . :iK ‘(:E 271.1 100.0 1%: 100.0 139.9 100.0 88.2 100.0 51.7 %:ll
Ear?lngs...: Retirement Income
.......................................
Retirement benefits ............. Social Security ............... Other public pensions .........
~0vernment;employee pensions Private penslons ..............
Income from assets .............. Public sssistance ................. Other .............................
. . . . 19.8 76.9
“3E 9:4
z:If 23.3
4:t
18.5
:z 34:3 10.5
1::: 22.5
.2
17.9 79.1
:I4
E.:: 12.2 21.9
4::
22.7
W
“;:?I
78:: 25.1
3::
25.9 70.1
2:::
iri
27:i 4.7
. . . . . . . . . . . . . . . . . . . .
. . . . . .
......
......
......
......
......
.....
..... 418
narried women and their husbands
:tE? 337.1 100.0 271.0 100.0 100.0 66.0 100.0 27.9 100.0 21.5 1oKJ 16.2 100.0
Total number (in thousands)... Total percent.................
. . . . . .
. . . . . .
. . . . . . .
. . . . . . .
. . . . . . .
. . . . . . .
. . . . . . .
. . . . . . .
. . . . . . .
23.8 23.0 22.7 24.1 31.4 31.1 32.1 xi 74.0 53.0 :::: 73.6
36:s
2: 66.6 E !Ei
36.8 :t:‘: $3 33:o ;‘;‘:‘;
8s::: k:: “Z “2:
9.3 ::t
2::: 21.1 7.4 20.6 7.8 22.7 6.3 20:1 E 19.8 $I 21.0 t{;
2
2:::
3:: 3:: 3:; 3::. 2:: 2:: 3:: 1:;
Earnings ...................... Retirement income.:
Retlzement benefits .................... Social Security ........... Other public pensions .....
Government-employee pens Private pensions ..........
Income from assets .......... Public assistance ............. Other .........................
. . . . .
. . . . .
. . . . .
. . . . . f.... ions. . . . . . . . . . .
Unmarried men
:&i 100.0 87.2 100.0 59.3 100.0 27.9 100.0 24.1 100.0 12.8 100.0 11.3 100.0 22.6 Total number (in thousands) ................ Total percent ..............................
Earnings ........................................ Retirement income ...............................
Retirement benefits ........................... Social Security ............................. Other public pensions .......................
Government-employee pensions .............. Private pensions ............................
Income from assets ............................ Public assistance ............................... Other ...........................................
14.7
CC;:
::::
‘tki
20:t 6.2
10.0
!zE 40:7
lit:! 9.5
19.2
7::
11.5 80.4
%:8 16.5 16.5
9.9 15.4
8::
44.0 ::2” 8.9
25:; 5.3
25.8
:::I 36.8
2.2 7:7
21.7
4::
19.0
;I;::
“5: 5:6
E :4
5.3
. _ 25.1
3::
Unmarried woinen
182.4 E:Z 73.0 55.5 53.9 37.2 16.8 26.3 100.0 100.0 100.0 100.0 100.0 100.0 100.0
Total number (in thousands) ........ Total percent ......................
Earnings ............................... Retirement income ......................
Retirement benefits .................. Social Security .................... Other public pensions ..............
Government-employee PenSiOnS ..... Private pensions ...................
Income ffom assets ;l;;f;c assistance
.. .. ..... ..................................................................
14.3
75r:
4;;;
8.4 7.8 21.1
6::
11.9
81.7 60.9
43.5
2:: 2::;
2::
9.7
%
42:6
Z:? 9.4 7::
9.7
14.1
84.2 60.4
“E
718 8.1 ““3
3.6
18.7 18.1
:::: x
40.0 7.9 41:1
7.9 i:: 2::: 2x
5:: 4:46
19.9
72.7
%4 11:1
11.1 3.8 19.9
7::
E 3:4
‘2
1:: 16.3
1:
. .
. .
. .
. .
. .
. .
. . .
’ Missing information on total income amounts is imputed. Data excludes
cases reporting negative income from any individual source. Totals may not add to 100 percent because of rounding.
z Retired-worker beneficiaries with first payable benefit in June 1980-May
1981 and nonbeneficiaries aged 65 or older enrolled for Medicare program by
July 1982. Source: New Beneficiary Survey, October-December 1982.
Social Security Bulletin, July 1985IVol. 48, No. 7 23
Table D.-Income from second pension and/or earnings, l by sex and marital status: Retired-worker beneficiaries by age at first payable benefit and nonbeneficiaries enrolled for Medicare program 2
Second pension and earnings
Total number (in thousands).................. Total percent................................
With Second pension: Earnings .......................................
Resuondent only has earnings ................ Spouse only has earnings..; .................. Both have earnings ...........................
No earnings ....................................
With No Second Pension: Earnings ................ ..! ....................
Respondent only has earnings ................. Spouse only has earnings ..................... Both have earnings ...........................
No earnings ....................................
Total number (in thousands) .................. Total percent ................................
With Second Pension: Earnings..................: ....................
Respondent only has earnings ................ Spouse only has earnings ..................... Both have earnings ...........................
No earnings ....................................
With Ne Second Pension: Earnmgs..................c ....................
Respondent only has earnxngs ................. Spouse only has earnings ..................... Both have earnings ...........................
No earnings ....................................
Total number (in thousands) ................. Total percent ..............................
With Second Pension: Earnings ...................................... No earnings ...................................
With N? Second Pension: Earnlngg ...................................... No earnings ...................................
Total number (in thousands) ................ Total percent ..............................
With Second Pension: Earnings ...................................... No eammgs ...................................
With No Second Pension: Earnings ...................................... No earnings ...................................
Retired workers
Age 62-64 Age 65 end ovez
Total Total 62 63-64 Total 65 66 and
over
tlarried men and their wives
tledi- oare only
580.1 100.0
‘i:i 9.1
373::
25.4
‘V 6:8
18.9
438.7 :ii:: 16’4.9 141.3 89.0 52.3 100.0 100.0 100.0 100.0 100.0 %:B
‘E 18.5
3817 ;:;
1::: 16.9 5.4 19.5 20.6 17.5
!I:: ki i:: K
:7
hi:; 35.6 i:i: 3::: 3::: 2’4:; ::i
“E “?Z Tkf 28.1
fZ i::: 75.1
8.8 9:r 7.8 813 Vi 1z 1::: 1;::
I14 17:6
;.i “E 23:6 19.3 21:5 3.0
Married women and their husbands
340.1 100.0
7::
?:2 38.9
“E
‘2:: 20:4
fEl1
14.0
$; 39.7
25.1 1;::
21.1 5.2
100.0 66.8
Yi 717
3::;
“i.1: 11:6
17.1 9.1
100.0 28.2
“25 % 30.5
:?I ll:o
11:::
100.0 21.6
“Z 12.4 2;::
:Z!
1::: 12.1
10:::
17.6
ftf 33.2
:If .: 1:;;
14.8
100.0 16.3
fVi
4:;
X
Unmarried men
1~~:~ 100.0 87.9 100.0 59.8 100.0 28.2 100.0 24.6 100.0 13.2 100.0 11.4 100.0 22.8
5.0 4.4 3.1 36.2 36.9 36.9 3::: 32:: 3::: 3;:: ‘::T
16.8 13.7 14.0 13.2 41.9 45.0 46.0 42.9 E:i ;::: ii:: ‘Z:‘:
Unmarried women
183.4 lE:o’ 73.3 56.0 w.1 37.3 16.8 26.7 100.0 100.0 100.0 100.0 100.0 100.0 100.0
5.6 5.3 37.5 36.9 3%
5.5 38.0 3;:; ‘A: 363:: 13:i
24.7 23.4 32.2 34.5 i::: 26.1 30.2 30.4 ;;I:; :::i 29.7 85:i
1 Missing information on source of income is imputed. Totals may not add to 1981 and nonbeneficiaries aged 65 or older enrolled for Medicare program by 100 percent because of rounding. July 1982.
2 Retired-worker beneficiaries with first payable benefit in June 1980-May Source: New Beneficiary Survey. October-December 1982.
24 Social Security Bulletin, July 1985/Vol. 48, No. 7

Table E.-Income from earnings and average monthly total income,’ by sex and marital status: Retired-worker bene- ficiaries by age at first payable benefit and nonbeneficiaries enrolled for Medicare program *
Retired workers
Earnings and average monthly total income
Total number (in thousands)................. 580.1 438.7 273.8 164.9 141.3 89.0 52.3 188.7
Total number (in thousands) ................ Total percent ...............................
Under 51,000 ..................................... 51,000-51.499 .................................... 51.500-52.q99 .................................... 52,500 OI moxe ...................................
&&&I cm to nearest 5j.Q) ................
Without rarningl
Total number (in thousands) ................ Total percent ...............................
Under 51.000. .................................... 51.000-51,499 .................................... 51,500-52,499 .................................... 52,500 OL maze ...................................
M (rounded JQ pearesf 5j.Q) ..............
Total number (in thousands)................. 368.3 340.1 273.4 66.8 28.2 21.6 6.6 16.3
Total number (in thousands) ................ Total percent ...............................
Under 51.000 ..................................... 51.000-51.499 ...................... 51.500-52.499 ...................... 52;500 or-mxe....................
JIaaLl(rovndedtin5z
..............
..............
..............
..............
Without gamin=
Total number (in thousands) Total percent...............:
..............
.............. Under S1.000 ..................................... Jl,OOO-51,499 .................................... 51,500-52,q99 .................................... 52,500 OL more ...................................
u (rounded&g oearest 5J.Q) ...............
See footnotesatendoftable.
Medi- Age 62-64 Rge 65 and over care
Total 0"lY
Total 62 63-64 Total 65 66 and D"eL
Married wren and their wives
186.2 100.0
19.6
2:: 18.7
51,530
1%:
22.8
ii::: 16.0
51.470
74.4 100.0
16.9
f::; io.9
51,600
162.0 90.5 100.0 100.0
31.6 29.1
1":::
67.2 100.0
6.9 16.6
3379::
52,150
74.1 100.0
14.0
3z.i 19:3
40.6 100.0
$6
30.8
51.980
26.6 100.0
6.5 12.1 31.9 49.5
92.480
170:: i
::;I 21.5 70.3
53,330
'I8.4 25.7 10.1 100.0 100.0 100.0
13.9
:;:t 18.4
14.2 28.7 36.5 20.6
:::i 16.9 30.5
61,390 $1.330 51,330 $1.350 51,600 51,590 51.610 51,330
Married home" and their husbands
154.5 %:05 loO~:oO
31.5 16.0 12.6 3.4 16.0 100.0 100.0 100.0 100.0 100.0 100.0
12.4 14.1 E
2712
25.5 36.Q
24.0
18.4 fi:G
21.4
22:: 40.2
27.8
8.8 4.8 14.5 17.3
2:; E7"
'Z 22:o :.:
:::i 69.2
11.740 51,700 51.650 51,840 52,160 $2.160 52,190 53,060
fk: 201.6 100.0 166.4 100.0 100.0 35.3 100.0 12.2 10::: 10;:; (2) (2) :s 30.1
31:r :cz ii.:
2:::
ii.: 20.2 (2)
10:7 it:: ::*i
3i.i 2.:
11.0 12:3 1';:; 36:9 I:: 13.6 (2)
Il.320 51,310 51,290 51.420 31.470 5l.'k60 11,540 (21
Social Security Bulletin, July 1985/Vol. 48, No. 7 25

Table E.-Income from earnings and average monthly total income,’ by sex and marital status: Retired-worker bene- ficiaries by age at first payable benefit and nonbeneficiaries enrolled for Medicare program *-Continued
1
Earnings and average monthly total income
Total
Retired workers
Medi- Rge 62-64 Age 65 and over care
only
Total 62 63-64 Total 65 66 and over
Total number (in thousands)................. 112.5 87.9 59.8 28.2 2’6.6 13.2 11.4 22.8
Total number (in thousands) ................ Tote1 percent ...............................
Under 5500 ....................................... 5500-5999...~ .................................... 51.000-51.499 .................................... 51,500 or more ...................................
Jledinn (rounded to nearest 5jJ) ....................
Without earninqq
Total number (in thousands1 ................ Total percent ...............................
Under 5500 ....................................... 5500-5999 ........................................ 51,000-51,499 .................................... 51,500 or moxe ...................................
Ilna_ino (rounded to nearest 5j.Q). . . . . . . . . . . . . . .
Total number (in thousands)................. 183.4 129.3 73.3 56.0 54.1 37.3 16.8 26.7
Total numbez (in thousands) . . . . . . . . . . . . . . . . Total percent...............................
Under 5500 ....................................... 5500-5999 ........................................ 51.000-51.499 .................................... 51,500 01 more ...................................
J&&&Q (rounded &g nearest 5_19) _..............
Without earninqs
Total number (in thousands) . . . . . . . . . . . . . . . . Total percent...............................
Under 5500 ....................................... 5500-5999 ........................................ 51,000-51.q99 .................................... 51,500 OL more ...................................
E&an kound-d TV oearest 51p)...............
Unmarried men
24.6 15.9 8.7 100.0 100.0 t:; Iii 100.0
3x 15.6 I;; I:;
4.9 19.7
23% ;i:i (2) 21.3 17.8 (2) I:! 54.1
5960 5800 (2) (2) 51,570
87.9 100.0
29.1
El:: 17.8
5720
72.0 100.0
i’;::
E
5650
49.5 100.0
X 13.1 15.0
5550
22.Q 100.0
27.1
E:$ 15.8
5830
15.9 100.0
15.8 39.6
2:
5930 5890 5990
4.5 100.0
$4
32:1
51.250
lo!:‘0
15.5
2.: 14:5
10::;
1;:;
7;::
52,320
7.2 100.0
16.1
:;:t 29.5
21.0 100.0
6:: 13.7 79.5
52,490
Unmarried women
55.6 37.1 19.4 17.7 100.0 100.0 100.0 100.0
11.1 12.7 39.2
22 13:1
:2::
10.7 12:o
5:::
ii:: f!:I
5880 6800 5690 5890
100.0 92.2 100.0 53.9
32.1 44.1
‘I:.: 10:2 :::7” 6.9
5660 5600
100.0 38.3
k! 1;:;
5700
18.5 100.0
10.1 31.4
:;:5”
51,110
12.3 100.0
$:]
2215
51,100
10::;
13.0 26.5
25”
51,170
35.7 25.0 10.6 100.0 100.0 100.0
x 20:s
ii:; 23.5
16.3 15.3
5830 5820 5850
26.3 100.0
.7
I!2 75:s
51,940
’ Missing information on source of income is imputed. Totals may not add to 100 percent because of rounding.
2 Retired-worker beneficiaries with first payable benefit in June 1980-May
1981 and nonbeneficiaries aged 65 or older enrolled for Medicare program by July 1982.
Source: New Beneficiary Survey, October-December 1982.
26 Social Security Bulletin, July 1985/Vol. 48, No. 7