Embed Size (px)
Citation preview
1
Income Shocks and Household Risk-Coping Strategies: The
Role of Formal Insurance in Rural Vietnam
Development Economics Research Group (DERG)
University of Copenhagen (UoC)
Central Institute for Economic Management (CIEM)
Ministry of Planning and Investment (MPI) of Vietnam
Centre for Agricultural Policy (CAP)
Institute of Policy and Strategy for Agriculture and Rural Development (IPSARD)
Ministry of Agriculture and Rural Development (MARD) of Vietnam
Specific Authors:
Carol Newman*
Fiona Wainwright*
Nguyen Le Hoa**
Bui Thi Uyen**
Le Vu Ngoc Kien**
Luu Duk Khai***
Prepared under the Agriculture and Rural Development (ARD) Programme
Royal Embassy of Denmark of Vietnam
* Department of Economics, Trinity College Dublin and DERG/UoC
** CAP / IPSARD
*** CIEM
2
1. Introduction
A fundamental problem facing rural households in many developing countries is how
to maintain satisfactory levels of consumption in the face of adverse income shocks.
These shocks can affect a household’s welfare by negatively impacting on household
income, existing household wealth and the health of household members. This in-
depth study considers the various strategies rural households in Vietnam employ to
cope with adverse income shocks. We categorise shocks as either idiosyncratic (for
example, injury, illness, death, divorce, etc.) that affect an individual household or
income earner only, or spatially covariant (for example, a flood which affects all
households in a particular location) that can affect entire communities. In many cases
the former type of shock can be insurable in formal financial markets, while the latter
are generally non-insurable in a formal way due to supply-side constraints.
Using panel data from rural households in Vietnam, we explore the impact of adverse
income shocks on households based on a subjective measure of risk-coping ability
and supplement this analysis with an investigation of the consumption smoothing
ability of households. We also explore the extent to which savings stocks in the form
of liquid assets (livestock holdings, grain stores, savings and borrowings) are used as
a form of self-insurance or risk-coping strategy and the role that formal insurance
plays in reducing the need for self-insurance instruments.
In developing countries, exposure to risk remains a significant cause of poverty for
poor farmers (Fafchamps, 2009). The nature of the shock will have implications for a
household’s ability to cope and its consequences (Dercon, 2002). For example,
spatially covariant shocks, and, in particular, weather related events such as rainfall,
can negatively impact on human welfare.1 There is also much evidence to support the
detrimental effect that the occurrence of idiosyncratic income shocks can have on a
household (Morduch, 2004; Townsend, 1994; Udry, 1991). In addition to having an
impact on a household’s ability to cope, the nature of the shock is also important for
understanding the strategies households use to cope with its adverse consequences.
Idiosyncratic shocks can be insured informally at a community level, or, if available,
via formal insurance contracts with a third-party insurer. Recent literature suggests
that the lack of formal insurance, both in terms of market availability and actual take-
up, is one of the key drivers of persistent levels of poverty in developing countries
(Morduch, 2002). Spatially covariant shocks are more difficult to insure collectively
and formal insurance contracts are extremely rare for reasons of moral hazard and
adverse selection.2
Consequently, households living in risky environments must
develop alternative strategies to reduce the impact of shocks on their livelihoods
(Dercon, 2002).
1 For example, Alderman et al (2006) find that detrimental weather can impact on the nutrition and
height of children while Jacoby and Skoufias (1997) find that weather related events can affect school
attendance and enrolment. In contrast, Deaton (1997) finds that spatially covariant shocks in certain
villages in Cote d’Ivoire explain little of the variation in household income. 2 As well as supply side constraints Cole et al (2010) find that credit constraints and trust are significant
barriers to the uptake of rainfall insurance in India.
3
Alderman and Paxson (1994) distinguish between risk-management and risk-coping
strategies whereby the former attempt to affect how risky the income generating
process is (‘income smoothing’) while the latter deal with the consequences of income
risk, i.e. income shocks, after the event (‘consumption smoothing’). A considerable
body of literature on savings and consumption smoothing explores the concept of
precautionary savings (Zeldes, 1989; Kimball, 1990; Deaton, 1991, 1992; Udry, 1994).
The evidence suggests that in rural populations where credit constraints are binding,
inefficient savings behaviour is likely to occur.3 The savings of many poor households
appear to be a pre-emptive response to income shocks rather than a long term
investment decision. In addition to accumulating savings stores for precautionary (and
other inter-temporal) motives, evidence also suggests that risk-averse households
accumulate other forms of liquid assets for self-insurance purposes, which under
severe credit constraints they may be forced to sell to smooth consumption.4
In this paper we explore the extent to which rural households in Vietnam cope with
adverse income shocks. Our data come from the Vietnamese Access to Resources
Household Survey for 2006, 2008 and 2010 and include detailed information on
households’ financial resources, access to and purchase of formal insurance, and the
incidence of idiosyncratic and spatially covariant shocks. We distinguish between
spatially covariant and idiosyncratic shocks and also consider the extent to which
formal insurance contracts and precautionary savings instruments help households to
cope. Our primary hypothesis is that in the absence of formal insurance contracts for
spatially covariant risk transfer, a risk-averse household engages in precautionary
savings strategies to buffer against forms of spatially covariant risk while formally
insuring against forms of idiosyncratic risk. In addition to forms of household savings
(for example, formal savings instruments, informal savings and ROSCAs), this paper
also considers other forms of asset accumulation in the form of livestock holdings and
crop stores as precautionary saving strategies against spatially covariant risk, as well
as borrowing.
The remainder of the paper is organised as follow. Section 2 provides some relevant
background on Vietnam highlighting the vulnerability of households to adverse
income shocks and the state of development formal financial markets (credit, savings
and insurance) in terms of their ability to help households cope with such shocks.
Section 3 outlines the empirical approach used to explore these issues while Section 4
describes the data. Section 5 discusses the empirical findings and Section 6 concludes.
2. Vietnamese Background and Context
2.1 Vulnerability to shocks
Macroeconomic instability, high inflation and underdeveloped legal systems can have
a significant negative impact on the value of household resources. In developing
countries, however, other types of risk are also common leading to extremely variable
3 Udry (1994) found evidence of precautionary savings in rural villages of northern Nigeria where he
showed that these households saved significantly in anticipation of transitory shocks. Deaton (1992)
found that significant savings were made in anticipation of income shocks in Cote d’Ivoire. 4 Rosenzweig and Wolpin (1993) provide evidence that farmers sell bullocks when faced with an
unfavourable crisis in Icrisat villages in India. Fafchamps et al (1998) find that livestock transactions in
the West African semi-arid tropics are responsive to income fluctuations while Lim and Townsend
(1998) find that the most effective approach to risk-coping at the household level is by self-insurance
through in-kind saving (for example, building up grain reserves and drawing them down as required).

4
incomes particularly for the most vulnerable groups. For example, adverse
movements in agricultural prices, unstable employment opportunities, or natural
disasters can all have a profound effect on households, particularly those relying on
agriculture for subsistence and their livelihoods.
In Vietnam households and individuals are particularly exposed to adverse income
shocks with those involved in agriculture the worst affected. According to a recent
UN report, Vietnam is one of the top ten countries in the world affected most by
natural disasters. Data from the Vietnamese Ministry of Agriculture and Rural
Development show that the total damage caused by natural disasters annually is about
1.5 percent of GDP, affecting 9,000 people and causing the death of 466 people. The
agricultural sector suffers more than all others.5 Between 1990 and 2008, Vietnam
experienced 194 extreme weather events. In 2008, there were 515 deaths, over
230,000 ha of rice and crops were completely destroyed, 1 million units of livestock
died, 54,000 ha of aquaculture property was damaged and 4,700 houses collapsed or
were swept away. In total, the total damage caused by natural disasters in 2008 was
estimated at over 11,500 billion VND.6 Agricultural production and rural areas were
affected the most.
Aside from weather related events, crop insects and animal diseases are also common
given the hot and humid tropical climate in Vietnam. In addition, given that most
Vietnamese farmers are smallholders, the knowledge and resources to prevent the
spread of disease are low. The Highly Pathogenic Avian Influenza (HPAI) was first
discovered in Vietnam in mid-2003. Since then, the country has endured 5 waves of
outbreaks with various government and international agency responses (Magalhaes et
al., 2006; Agrifood Consulting International, 2006). Over 51 million units of poultry
were destroyed with the total damage estimated at approximately 10,000 billion VND.
Other common diseases affecting livestock include New Caste, Gumboro, and Fowl
cholera. According to the National institute of Animal husbandry, approximately 40
to 53 percent of poultry is infected by New caste disease annually while 27-32 percent
are infected by Gumboro and a further 14-15 percent by Fowl cholera. The death rate
of free-range chickens from hatching to adulthood is 47 percent with costs for
veterinary medicine accounting for up to 10-12 percent of total costs.7 A recent
research report into the competitiveness of livestock in Vietnam found that livestock
disease occurred in all provinces investigated (12 in total) between 2008 and 2010.
The highest infection rate was in Long An with disease evident in approximately 70
percent of communes.8
Nguyen (2003) estimates that between 5 and 10 percent of Vietnam’s population is at
risk of poverty. Oxfam, using participatory poverty monitoring in rural communities
between 2005 and 2010, found that exposure to risk and adverse income shocks
increase the vulnerability of households, particularly the rural poor.9 Aside from price
volatility and natural disasters, the most common problem cited by farmers as
affecting livelihoods is the inability to work due to health problems. Moreover, when
asked about the risks and challenges anticipated in the coming 12 months, inability to
5 http://vnexpress.net/gl/xa-hoi/2007/10/3b9fb183/
6 Số liệu của Tổng cục Thống kê
7 http://www.vcn.vnn.vn/PrintPreview.aspx?ID=5616
8 LIFSAP: Livestock competitiveness and food safety project, report 2010
9 Participatory poverty monitoring in rural communities in Vietnam – Oxfam, Action aid, 2005-2010
5
work is cited as the most common concern. For the poor who lack capital, land and
education, labour is the most valuable asset and so the risk of ill-health which
prevents them from working and requires expensive health treatment is of particular
concern. Nguyen (2003) identifies five distinct groups of households that are
particularly vulnerable to risks of this kind. They include, female-headed households,
ethnic-minority households, landless households, poor households, and households
located in the Red River Delta area.
In summary, Vietnamese households are particularly exposed to significant adverse
income shocks and the most vulnerable groups in society are most affected. These
shocks range from weather related events and crop and livestock disease to
macroeconomic factors such as inflation and price instability. For the poorest
households health related risk is also of particular concern.
2.2 Formal coping mechanisms
Households can cope with adverse income shocks in a variety of ways. The optimal
form of risk coping is through insurance contracts that cover households income
losses in the event of an adverse shock. Vietnam’s insurance market is one of the
fastest growing markets in the world. Between 2000 and 2009, the Vietnamese life
insurance sector increased from US$51.12 million to US$671 million, and the non-life
sector from US$126 million to US$763 million (Business Monitor International Ltd.,
2010).10
According to the Vietnam Insurance Association, there are more than
120,000 insurance agents operating in Vietnam. The sector, however, is still small in
size and only a limited range of insurance products are available. The total value of
insurance premiums in Vietnam accounted for less than 2 percent of GDP in 2005,
compared to 9.5 percent in the US, 8.7 percent in the EU and 10.5 percent in Japan
suggesting that there is significant scope for growth in this sector in the future.
Health insurance products have developed particularly rapidly in Vietnam. The
percentage of patients (in-patient and out-patient) with health insurance or a free
health care certificate increased rapidly from 37.4 percent in 2004 to 66.7 percent in
2010.11
User fees for health care services were introduced in 1988 resulting in
significant increases in out-of pocket expenditure on health by households.
Compulsory health insurance schemes were instituted to redress the issues of access
by the poor but the main participants in health insurance plans are the better off
households (Wagstaff and Nguyen 2002).
Agriculture insurance, covering risks related to agricultural production, has the
potential to make a significant impact on the risk coping ability of rural farmers given
the dependence of the Vietnamese population on agriculture and the high degree of
exposure to agriculture related risk. However, agricultural insurance markets are
virtually undeveloped in Vietnam.
Approximately 1 percent of farmers are insured to protect against damage to crops,
0.24 for cattle, 0.1 percent for swine and 0.04 percent for poultry. Up to 2008, two
insurance companies provided agricultural insurance on a small scale: Baoviet and
Groupama. However, these businesses were found to be unprofitable and so only
10
Vietnam Insurance Report Q1 2010, Business Monitor International Ltd. 11
VHLSS 2010 -GSO
6
existed for a short time.12
In response, the Prime Minister issued Decision 315/QD-
TTg on the pilot provision of agriculture insurance in 20 provinces and cities across
Vietnam from 1st July 2011. Under the Decision, agricultural insurance will cover
paddy, livestock and poultry, and aquaculture. The State will pay the full insurance
premium for the poor and farming households and 80 percent of the insurance
premium for the nearly poor farming households. In addition, an exemption of 60
percent will be given to other farming households and 20 percent for agricultural
organisations.13
2.3 Informal coping mechanisms
While insurance markets exist in Vietnam, like many developing countries they are
not well developed and so many households must rely on other coping mechanisms.
Nguyen (2003) finds that the main risk-coping strategies adopted by households in
Vietnam are self-insurance strategies including selling assets, withdrawing savings,
borrowing from relatives and friends, or using credit. She also finds evidence however,
that Vietnam’s current safety net system fails to protect the most vulnerable groups.
Research by VASS and Oxfam finds that many poor households reduce consumption
in order to cope with income shocks. This is particularly the case for poor households
who are more likely to reduce the quantity and quality of their meals and healthcare
expenses than non-poor households. Non-poor households are more likely to reduce
social expenses (funerals, weddings, etc.) or rely on savings when faced with adverse
income shocks reducing the need to cut down on food and healthcare expenditure.
Selling assets such as livestock is also common among wealthier households.
Social support from communities and organisations is also important for the poor in
overcoming adverse income shocks. A long tradition and culture of risk sharing exists
in small communities in Vietnam. This includes support from friends and relatives but
also support from mass organisations such as the Women’s Union, Farmers’
Association, Veterans’ Association, and the Youth Union.
2.4 Government coping mechanisms
Government support to help individuals and communities cope with risks is provided
through various social protection policies. These policies cover three circles: the outer
circle includes measures for capacity building in risk mitigation and the reduction of
vulnerability such as vocational training, career orientation, agriculture extension,
support for poverty reduction, etc; the next inner circle includes prevention and
mitigation measures through insurance mechanisms including social insurance,
medical insurance and others; the innermost circle includes protection measures
through direct social support extended to those affected by risks through Decree
67/CP, and covers shocks relating to natural disasters and diseases.14
Vietnam’s public safety net covers a broad range of areas, including social protection,
hunger eradication, poverty reduction, social insurance, health insurance, and
employment and unemployment services. Initiatives are also carried out to assist
elderly people living alone, children in especially difficult circumstances, disabled
12
http://www.taichinhvietnam.com/taichinhvietnam/modules.php?name=News&file=article&sid=159 13
http://www.vietlaw.gov.vn/LAWNET/ 14
Participatory poverty monitoring in rural communities in Vietnam, Synthesis report, round 2, 2008-
2009
7
people, victims of natural calamities, and periodically starving people. In principle,
this safety net is designed by the government to help social beneficiaries, especially
those in vulnerable groups, with below minimum standards of living. In practice,
however, their effectiveness is unclear as they tend to be poorly funded and largely
reliant on scarce local resources. For example, in 1999 almost 1 million people were
eligible for such assistance but only 20 percent of them actually received an allowance
(MOLISA 1999b). Pensions and other employment-related social insurance payments
are provided only to workers in the formal sector (Nguyen, 2003).
3. Empirical Approach
Economy theory suggests that in risky environments, where no insurance markets
exist, households will accumulate precautionary savings and assets in order to protect
themselves against income and wealth variability. Precautionary savings, however,
are inefficient in the sense that they divert resources from productive investments and
from consumption. If risk can be insured through formal insurance contracts, then risk
averse households will choose to purchase insurance to protect themselves against
future income variability. In many developing countries formal insurance markets are
not well developed and will only offer insurance products that cover certain types of
risk and mainly risk that is idiosyncratic in nature. Aggregate or spatially covariant
risks, such as flooding or pest and livestock disease, are rarely insurable in formal
markets. Theory suggests that households will save and purchase insurance in order
to smooth consumption over time and so the realization of adverse income shocks
should not affect consumption levels between one period and the next but households
with insurance will precautionary save less than those without given that the
uncertainty associated with income due to idiosyncratic risks is eliminated.
Our empirical investigation focuses on: the extent to which households manage to
cope with adverse income shocks and whether this is reflected in their consumption
smoothing ability; the role of precautionary saving as a coping mechanism; and
whether formal insurance reduces the need for precautionary saving. We use three
separate empirical investigations to explore these issues. First, we use a subjective
measure of coping ability to analyse the determinants of households’ ability to cope
when faced with adverse income shocks. We exploit the panel dimension to our data
by using a fixed effects linear probability model that controls for time invariant
household heterogeneity. Time varying household characteristics are also included as
control variables. The key explanatory variables of interest are the different types of
income shocks and the severity and persistence of these shocks.
Second, we consider the extent to which households smooth consumption over time in
the face of income shocks of different types and consider whether consumption
smoothing ability varies depending on the presence of savings and formal insurance.
We first estimate parameters for a standard household consumption equation which
can be used to predict consumption levels that are consistent with consumption
smoothing. We then test the extent to which actual and predicted consumption levels
are statistically different. We analyse the extent to which deviations from permanent
consumption levels are attributable to shocks and explore whether these deviations are
correlated with savings and insurance instruments. To obtain parameters for the
general consumption function that represents households’ consumption smoothing
preferences we estimate a fixed effects regression of consumption on income, wealth
8
and other relevant explanatory factors that are consistent with the permanent income
hypothesis including age, education level of the household head, household size, etc.,
only using households that were not exposed to any shocks. The following model is
estimated separately for each region.
2
0 1 2 3 4 5
6 7 8
it it it it it it
it it it i it
lnCons ln Income lnWealth lnCredit Age Age
Education Sex Size u e
(1)
We use the estimated coefficients from equation (1) to predict household consumption
in each period using the observed data on each explanatory variable in that period.
Income reported lost due to adverse shocks in each period is added back in order to
capture the true ceteris paribus predicted level of consumption. If households manage
to smooth consumption then the estimated level of consumption, which takes into
account changes in observable consumption determinants should be the same as the
actual observed level of consumption in that period. We use a simple t-test to test for a
statistically significant difference between the two measures. Failure to reject the null
hypothesis will provide evidence of consumption smoothing. This test is performed
across different household groupings according to the category of shocks suffered,
whether savings or formal insurance are present and household income levels.
The second stage of our empirical investigation explores the mechanism of
consumption smoothing invoked by the household. There is ample evidence that
households across the developing world accumulate savings and liquid assets as a
form of precautionary saving (Fafchamps, 2009; Deaton, 1992; Deaton, 1991). As
discussed in Fafchamps et al (1998) and Newman et al (2011) households will choose
a portfolio of liquid assets which will depend on the individual returns to each type of
asset as well as the variance and co-variances of returns. In this paper we consider a
variety of different liquid asset types including formal and informal savings, livestock
holdings, crop stores and forms of borrowings (including formal and informal loans).
We expect households to allocate total savings (including any precautionary
component) across a range of different assets to buffer against unexpected income
shocks.
Identifying a causal relationship between the occurrence of an adverse income shock
and the depletion of the stock of liquid assets is complicated given that the effect of
the shock may be difficult to separate from other factors that may deplete household
liquid assets. For example, households that suffer the death of a family member may
have already begun depleting liquid asset stocks if that household member required
medical treatment for some time in advance of his or her death. The relationship
between shocks and the depletion of liquid assets can be identified using a panel
fixed-effects approach under certain assumptions. Our data facilitate the
disaggregation of overall shocks into their exogenous (spatially covariant) and
idiosyncratic components. Exogenous spatially covariant shocks are further
disaggregated into 1) economic (for example, crop price changes, key input price
changes/shortages) and 2) natural (for example, floods, typhoons, droughts etc)
components while our raw data motivate the classification of idiosyncratic shocks as 3)
insurable (for example, illness, injury or death of household member) and 4)
uninsurable (for example, crime/theft, divorce, family disputes etc). By their nature,
idiosyncratic shocks may be correlated with unobserved household characteristics that
affect a household’s financial decision making. Using a fixed effects estimation
9
procedure will eliminate any time invariant unobserved heterogeneity while the
inclusion of control variables for wealth, income, education and other household
characteristics attempt to capture any remaining time varying heterogeneity. The full
household level fixed effects model we estimate is given by:
ittiit
itititititit
ititit
ititititit
ev
dTransdNatdFreeInsdIdioIdInsdIdioI
dTransdFreeInsdIns
dIdioUdIdioIdEcondNata
9
1098
765
4321
'
δZ
(2)
Where 1
n
it itiA a
represents the aggregate household liquid asset value under
consideration adjusted to 2010 present values, itdNat ,
itdEcon , itdIdioI and
itdIdioU
are dummy variables indicating spatially covariant natural and economic and
idiosyncratic insurable and uninsurable shocks respectively, itZ represents a vector of
time variant household characteristics (including wealth levels which act as a proxy
for time variant household risk aversion), t represent time dummies,
iu
is a
household specific fixed effect and it
is the household random error term. We
assume that regional differences which control for insurance supply side variations
and asset pricing variations across regions (including variance/co-variances of asset
returns) are subsumed within the household fixed effect while the time dummies
control for average changes in asset values over time.
Our model also includes the binary variable, itdIns , which indicates whether the
household made any insurance claims on insurance contracts purchased (either
voluntary or compulsory) during the time period. The model also includes an
interaction term, itit dInsdIdioI * , capturing the effect on household liquid asset levels
of those households suffering an idiosyncratic and insurable shock and making an
insurance claim. We also include interactions between itdFreeIns , which captures
whether the household claimed insurance from state provided free insurance policies,
and the incidence of insurable idiosyncratic shocks. Our hypothesis is that the
estimated coefficients on both level and interaction terms should be significant with
the interaction term signalling the degree to which insurance serves to ease the
depletion of the liquid asset under financial stress.
Our analysis is further extended to consider the extent to which other risk-coping
strategies may serve to lessen the depletion of liquid assets. We consider public and
private transfers through the dummy itdTrans as an alternative way to smooth
consumption in the face of an adverse income shock.15
Government aid programs may
also act as an important safety net for those households suffering spatially covariant
natural shocks and this effect is captured through the interaction term it itdNat * dTrans .
15
While anecdotal evidence suggests that the Vietnamese government provides assistance via transfer
payments to households severely affected by natural disasters, the majority of public transfers in our
data are in the form of pensions and transfers from children. If households expect transfers in the event
of an income shock then they could be viewed as safety-nets that act as a substitute for insurance. It is
not clear whether this is the case for our sample of households, although given that there are no
insurance products available to protect against income losses associated with natural disasters it is
unlikely that the safety-net component of transfers will affect our results.
10
If external transfers help to lessen the depletion of liquid asset holdings in the event of
an adverse idiosyncratic or natural shock we would expect the coefficient on these
interaction terms to be positive and statistically significant.
4. Data
The data are taken from the Vietnam Access to Resources Household Survey
(VARHS) for 2006, 2008 and 2010 (CIEM et al, 2007; 2009; 2011). This survey was
carried out in rural areas of 12 provinces of Vietnam in the summer of each year
producing a balanced panel of 2,045 households spread over 161 districts and 456
communes.16
The survey was conducted during the same three month period each
year to ensure consistency and facilitating reasonable comparisons across time. The
VARHS explores issues surrounding Vietnamese rural households’ access to
resources and the constraints that these households face in managing their livelihoods.
Along with detailed demographic information on household members, the survey
includes sections on household assets, savings, credit (both formal and informal),
formal insurance, shocks and risk-coping, informal safety nets and the structure of
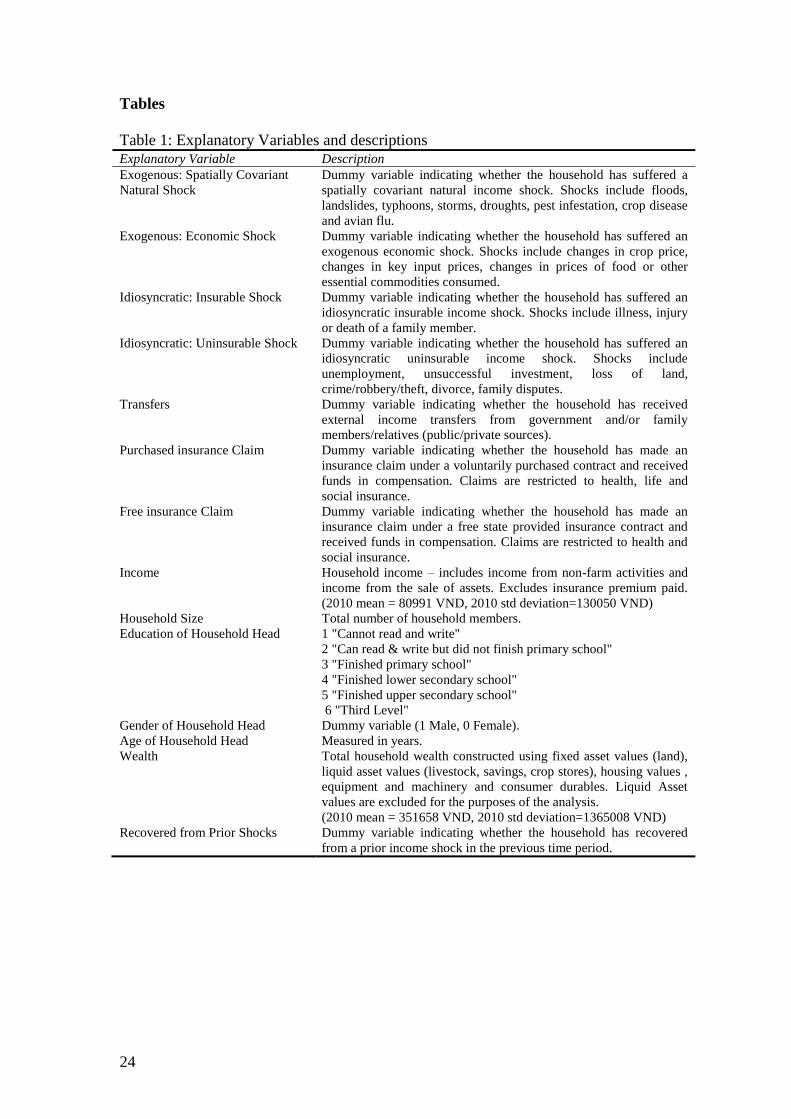
social capital. The full set of explanatory variables used in this analysis is described in
Table 1.
[INSERT TABLE 1 ABOUT HERE]
Information on income shocks are gathered by asking households to rank the shocks
suffered in order of importance and to provide an associated monetary loss in terms of
Vietnamese Dong (VND). Table 2 provides a more detailed breakdown of income
shocks and their sub-categories.
[INSERT TABLE 2 ABOUT HERE]
We find that that 42 per cent of households suffered an adverse income shock
between 2004 and 2006, 56 per cent between 2006 and 2008 and 50 per cent suffered
between 2008 and 2010. At a disaggregated level, in 2008 we find that 13 per cent of
households suffered an idiosyncratic shock only (down from 35 per cent in 2006)
while 73 per cent suffered an exogenous spatially covariant shock only thus providing
some support toward the dominance of spatially covariant over idiosyncratic shocks.
In 2010, spatially covariant shocks also dominate idiosyncratic shocks by 71 per cent
to 13 per cent, respectively. In 2006, 60 per cent of households report that they fully
recovered from the income shocks compared with 45 per cent and 53 per cent in 2008
and 2010, respectively, suggesting that households’ ability to cope has fallen over the
sample period. Recovery is less likely where households experience both spatially
covariant and idiosyncratic shocks.17
Disaggregating the household shock and recovery data across wealth groups reveals
that in all years, households in the wealthiest group suffer the least from income
shocks. Wealthier households are also more likely to recover from income shocks.
16
The survey was developed by the Development Economics Research Group, Department of
Economics, University of Copenhagen and the Institute of Labour Studies and Social Affairs, Hanoi
Vietnam. 17
Households are asked whether they have fully recovered from the effects of the adverse shock(s)
suffered during the current timeframe and this measure is therefore subjective.
11
These data suggest that while income shocks are problematic for households in all
wealth groups, recovery is more difficult for poorer households. We also find that a
greater proportion of ethnic minority households suffer from shocks and also
experience a greater number of shocks in all years. They also find it more difficult to
recover from the shocks suffered. Further analysis of the differences across
households in the incidence of shocks is provided in Appendix A1 where the
probability of each type of shock is regressed against a series of household
characteristics. The results suggest that low-income households and ethnic minorities
are the most vulnerable, particularly to the occurrence of natural disasters.
The extent of the losses to household income as a result of shocks varies considerably
over time. As revealed in Table 3, the size of losses fell from 60 percent of income in
2006 to 15 percent of income in 2010. In all cases, however, households in the lowest
income group suffer the greatest proportional losses. Natural disasters are the most
significant type of shock suffered followed by illness or death of a family member.
[INSERT TABLE 3 ABOUT HERE]
Table 4 describes the liquid asset holdings of households and how they are
accumulated or depleted for households that experience shocks. We find that the
proportion of households with savings increased between 2006 and 2010 from 61 per
cent to 72 per cent of households.18
The proportion of households with other types of
liquid asset holdings is relatively similar in each year while the proportion of
households with loans fell between 2006 and 2010.
[INSERT TABLE 4 ABOUT HERE]
Table 4 also details the change in the average value of different types of liquid asset
holdings of households between 2006 and 2008 and between 2008 and 2010,
disaggregated by whether the household experienced a shock or not. Households that
suffered a shock between 2006 and 2008 reduced their savings by an average of 1
million VND while households that did not suffer a shock increased their savings
levels. In contrast, between 2008 and 2010, all households increase their savings
levels on average, but households suffering from shocks increase their stock of
savings by less than those not suffering. We also find that the amount of loans
outstanding increases for households that suffer shocks which suggests that
households may turn to credit in times of financial stress.
In recent years, the Vietnamese formal insurance sector has experienced substantial
growth in terms of market penetration (see Section 2).19
The raw data reveal that
insurance is held by 82 per cent of households in 2010 (see Table 5). This includes all
types of insurance, voluntary and compulsory. Of those 24 per cent of households
hold purchased insurance contracts that insure them against the types of idiosyncratic
risks considered in our empirical analysis (health, life and social) and 29 percent of
households hold free insurance provided by the government (health and social).
Appendix A2 provides a brief description of each type of insurance. While over time
the uptake of insurance has increased between 2006 and 2010, the proportion of
18
In 2008 only 52 per cent of households had savings which may reflect that difficult year that many
rural households in Vietnam had in 2008 due to the food price crisis and inflation which followed. 19
The Knowledge Centre forecast formal insurance market growth of 12% between 2007 and 2011.
12
contracts which are voluntarily purchased is much lower in 2010 compared with 2006.
This is most likely due to the introduction of other types of risk coping mechanisms
by the Vietnamese government during the time period (see Section 2).20
[INSERT TABLE 5 ABOUT HERE]
As a guide to the profile of households holding purchased insurance, we also estimate
a simple probit model of purchased insurance participation and free insurance held for
each year of our data. The results for purchased insurance are presented in Table 6a
and for free insurance in Table 6b.21
Although subject to potential endogeneity bias
with respect to unobserved heterogeneous risk aversion (and other factors), the results
suggest that the probability of a household holding formal insurance is correlated with
the education level of the household head, household wealth and income.22
There is
also evidence that ethnicity plays an important role with households of Kinh or Hoa
origin much more likely to hold purchased insurance. The level of savings of the
household is also highly correlated with the likelihood of purchase of insurance in
2006. Overall, the consistency over the years of the correlation between insurance and
education, wealth, income and ethnicity, suggests that information or financial
constraints may exclude some households from insurance markets.23
This should be
borne in mind when interpreting our later findings.
[INSERT TABLES 6a AND 6b ABOUT HERE]
The results for free insurance, presented in Table 6b, are the opposite to what is found
for purchased insurance. Poorer households are less likely to have free insurance as
are households of Kinh or Hoa ethnicity. Male headed households are also less likely
to have free insurance. We also find a negative association between education and
free insurance but a positive association between household size and the incidence of
holding free insurance. These results are consistent with Vietnamese policy of
providing social safety nets to the poorest and most vulnerable groups as discussed in
Section 2.
5. Empirical Results
The summary statistics presented in Section 4 help to motivate the central research
questions of this paper concerning household risk-coping mechanisms and their
effectiveness. As discussed in Section 3, there are three parts to our empirical
investigation of these issues. First, we estimate a fixed effects linear probability model
of households’ ability to cope with shocks. The measure used is the households self
reporting of whether they recovered from the shock suffered. Second, we focus on
consumption responses to adverse shocks to gain an understanding of the extent to
which households manage to smooth their consumption over time and whether this
20
It should be noted that insurance against spatially covariant risk (for example, rainfall insurance) is
not available to households in our sample. 21
The Knowledge Centre forecast formal insurance market growth of 12% between 2007 and 2011. 22
This result is consistent with the findings of Cole et al (2010) in relation to rainfall insurance in India. 23
When households were asked whether they were willing to pay for crop insurance specifically wealth
and income were found to be the most important determining factors. Results are presented in
Appendix A3.

13
relates to their holdings of liquid assets and formal insurance. Third we examine the
depletion of household liquid assets in response to adverse income shocks to
determine whether these assets serve precautionary or self-insurance purposes. Taken
together, these steps should help us to gain a clearer understanding of the important
risk-coping strategies within rural Vietnam and their effectiveness.
5.1 Ability to Cope
The results of the fixed effects linear probability model of the likelihood of recovery
from an adverse income shock are presented in Table 7. We consider whether the
household holds liquid assets in the form of savings, livestock, crops stores and loans
together with other relevant wealth controls. The baseline model presented in column
(1) shows that income and wealth are strong predictors of a household’s ability to
recover from the shocks they suffer. The greater the level of borrowing of households
the less likely they are to recover from a shock suggesting that indebted households
find it more difficult to cope. There is no evidence to suggest that insurance plays a
role in the recovery process.
[INSERT TABLE 7 ABOUT HERE]
In column (2) the number of shocks suffered by the household is included. As is
consistent with the literature we find that the more shocks a household suffers the less
likely they are to recover. In column (3) the type of shock is added to the model.
Households that experience a natural shock, such as a weather related incident appear
to have fewer problems recovering. This suggests that coping mechanisms for
households that experience spatially covariant shocks may be better developed than
those for other types of shocks. It may be the case that external factors (for example,
government transfers) help to alleviate the adverse impacts of natural shocks. This
issue is explored further in the empirical section.
5.2 Consumption Smoothing
On the basis of subjective responses to coping with income shocks, 54 per cent of
households indicate reducing consumption is the most important risk-coping
mechanism. In addition, 25 per cent of households report that they increase
borrowings and sell assets. If coping mechanisms are operating effectively, be they
formal or informal, then households should smooth consumption over time regardless
of whether they suffer an income shock or not. To test whether this is the case, first, a
general consumption function is estimated separately for each region using the panel
of households that suffered no shocks over the sample period.24
The estimated
coefficients are used to predict consumption for 2006, 2008 and 2010 using the
observed data on the explanatory variables in each year.25
The mean levels of (log)
actual and predicted food expenditure and the difference between them are presented
in Table 8 along with t-tests of the significance of the difference between them.
Failure to reject the null hypothesis provides evidence of consumption smoothing.
Significantly positive (negative) differences indicate that the estimated value is
significantly lower (higher) than the actual suggesting that actual observed
consumption is higher (lower) than expected. Households are also grouped by
24
Results available on request. 25
For the estimated consumption calculation, income earned is adjusted for the realised shock amount
in order to generate a more accurate consumption prediction based on ceteris paribus effects.
14
category of shocks, the presence of formal insurance and other liquid savings
instruments and income.
[INSERT TABLE 8 ABOUT HERE]
We first consider the consumption patterns of households in 2006 and find that overall
households consume less than predicted by our model. The difference between actual
and predicted consumption levels is particularly high for households that suffer
shocks, both idiosyncratic and natural shocks. However, households with purchased
insurance that suffer shocks (all types) manage to smooth consumption. In contrast,
households with free insurance do not manage to smooth consumption which is likely
picking up an income effect.
The extent of the difference between actual and predicted consumption levels in 2006
is also correlated with the level of liquid asset holdings of the household. We find that
households with above median liquid assets smooth consumption when faced with
idiosyncratic shocks. Coupled with our findings for insurance this suggests that both
purchased insurance and precautionary saving serve as a buffer against unexpected
income losses. We find a similar result for income suggesting that even when the level
of income is controlled for households earning higher incomes manage to smooth
consumption in the face of income shocks to a greater extent than those on lower
income levels. This suggests that the poorest households remain the most vulnerable
to risk.
The results for 2008 and 2010 suggest that all households smooth consumption, even
when faced with idiosyncratic and natural shocks. However, the difference between
actual and predicted consumption levels is lower for households with no insurance
and for households with below median liquid asset holdings and income. The
difference is also lower for households with free insurance. This is most likely
correlated with an income effect as in both 2008 and 2010 households with below
median income and with free insurance that suffer shocks barely manage to smooth
consumption.
Overall, our results suggest that Vietnamese households manage to smooth
consumption over time, even in the face of idiosyncratic and natural shocks. This is
particularly the case in the more recent years of the sample. There is some evidence to
suggest that household’s ability to smooth consumption is somewhat correlated with
insurance and savings instruments, particularly in the case of idiosyncratic shocks.
The extent to which households deplete their stock of liquid assets and the role that
insurance plays in this is explored further in the third stage of our empirical analysis.
5.3 Total Liquid Assets
We now turn our attention away from consumption responses toward asset responses
in the face of income shocks. To explore this aspect of risk coping we estimate the
model presented in equation (2). For each asset class under consideration (total liquid
assets, savings, livestock, crop stores and loans), we use fixed effects estimation to
regress the level of household asset holdings (expressed in million VND) in each year
against our measures of exogenous spatially covariant and idiosyncratic shocks
together with income controls, wealth controls and household composition changes.
All value variables are adjusted to 2010 present values. Income shocks are

15
disaggregated by exogenous natural and economic and idiosyncratic, insurable and
uninsurable. We also include a dummy variable to control for external public and
private transfers together with a dummy variable to control for actual formal
insurance claims and free insurance claims. We focus explicitly on the types of
insurance claims that closely align with our category of idiosyncratic insurable shocks,
i.e. health, social and life insurance.
First, we determine whether households suffering any type of income shock
experience a statistically significant reduction in asset levels. Second, we disaggregate
the income shock measure into its exogenous and idiosyncratic components to explore
how each specific category of shock influences asset levels over time. Third, we
interact insurance claims and transfers with the incidence of shocks to establish
whether they help to reduce the impact of shocks on asset depletion. We also
disaggregate our results by wealth group to establish the extent to which the poor are
particularly vulnerable.26
Controls for income, household size, gender of household
head, age of the household head and age squared (to capture any lifecycle effects),
wealth (net of liquid assets), recovery from prior shocks (to control for persistence)
and time dummies (to control for average changes in asset values over time) are
included.
We first consider whether a household’s stock of total liquid assets (including all
savings, livestock and crops stores) is responsive to adverse income shocks. The
results are presented in Table 9a.
[INSERT TABLE 9a ABOUT HERE]
Column (1) reveals that shocks have a negative impact on the accumulation of total
liquid assets. Insurance claims and external transfers have no significant effect.
Disaggregating the income shock into its exogenous and idiosyncratic components
(Column 2) we find that both types of shock have a negative impact on the value of
liquid asset. A further breakdown of the type of shock (Column 3) reveals that both
exogenous economic and idiosyncratic insurable shocks serve to deplete total liquid
asset values over time, providing some evidence in support of our primary hypothesis
that household total liquid assets may serve precautionary savings purposes.27
Interacting formal insurance claims with idiosyncratic insurable shocks (Column 4)
has no significant effect on the level of liquid assets. The interaction between free
insurance claims and idiosyncratic insurable shocks (Column 5) has a positive and
significant effects indicating that while households that suffer these shocks deplete
their liquid asset savings those that receive free insurance transfers do so to a less of
an extent. This suggests that government safety nets play some role in supporting
households that are exposed to shocks of this kind. In Column 6, transfers (public and
private) are interacted with idiosyncratic insurable shocks. The interaction term is
negative and significant suggesting that households that experience shocks and are in
receipt of transfers deplete their savings to a greater extent than other households: in
26
Interpreting the results of such a disaggregation should be done with care given that households are
sampled from rural areas and so are on average poorer than the general population. As such the wealth
groups should be interpreted relative to the sample used rather than the population as a whole. 27
We cannot disentangle the precise amount of total liquid assets which was originally intended to
serve precautionary savings purposes from the amount serving other inter-temporal purposes.

16
other words, the availability of transfers does not prevent households from depleting
their liquid asset savings.
Disaggregating our sample into three wealth groups and running the model separately
for each group we find that exogenous economic shocks are important for the middle
wealth group while idiosyncratic insurable shocks are most problematic for the lowest
wealth group (see Table 9b). Free insurance claims, however, only benefit the middle
wealth group suggesting that while on aggregate free insurance is serving a social
safety net function it may not be reaching the poorest groups. We also find in Column
(6) that the interaction between idiosyncratic shocks and transfers is only negative and
significant for the wealthiest group. This suggests that wealthier households that
suffer idiosyncratic shocks might draw on many different mechanisms for coping
including depleting assets and relying on transfers from others.
INSERT TABLE 9b HERE
5.4 Livestock Holdings
To understand whether livestock serves as a buffer against adverse shocks we
estimate a fixed effects regression of livestock holdings values against our exogenous
spatially covariant and idiosyncratic shock measures. The results are presented in
Table 10.
[INSERT TABLE 10 ABOUT HERE]
There is no evidence to suggest that livestock acts as a buffer against overall income
shocks (Column 1). Disaggregating income shocks into their exogenous and
idiosyncratic components we find a negative and significant relationship between
idiosyncratic shocks and the value of livestock holdings (Column 2). There is no
evidence to suggest, however, that livestock acts as a buffer against spatially covariant
shocks. These findings support the partial equilibrium effects discussed in Fafchamps
et al (1998) whereby if livestock markets are not perfectly integrated then it is
difficult for this asset class to act as a buffer stock in the case of exogenous spatially
covariant shocks. In such closed market situations, net sales of livestock must sum to
zero at the commune/village level. Idiosyncratic insurable shocks, on the other hand,
facilitate the use of livestock as a risk-coping mechanism and we see some evidence
that this is the case (Column 3). Turning our attention to formal insurance effects, we
find that insurance claims are negatively related to total livestock values (Columns 1
to 6). The interaction between whether the households makes an insurance claim with
whether the household suffered an idiosyncratic insurable shock, however, is
statistically insignificant. We also find no evidence that free insurance or external
transfers act in any way to preserve livestock holdings.
Overall, our results provide some support for the hypothesis that livestock plays an
important role in consumption smoothing where idiosyncratic insurable shocks occur
but not for exogenous spatially covariant shocks (Rosenzweig and Wolpin (1993) find
a similar result).28
5.5 Financial Savings
28
The results do not vary across wealth group and so they are not included.
17
We estimate a similar model of the responsiveness of a household’s total stock of
savings to exogenous spatially covariant and idiosyncratic shocks. We also consider a
disaggregation of the total stock of savings into cash/gold stores. The results
pertaining to total savings stocks are presented in Table 11a.
[INSERT TABLES 11a AND 11b ABOUT HERE]
We find that the occurrence of an income shock depletes a household’s stock of total
savings over time (Column 1). Disaggregating income shocks by type we find that
while both exogenous spatially covariant and idiosyncratic shocks are important
(Column 2), spatially covariant natural shocks have the greatest impact (Column 3).
Also of note is the average negative effect on savings of households in receipt of free
insurance claims which suggests that these households are experiencing particular
financial difficulty. When the occurrence of free insurance claims is interacted with
idiosyncratic shocks (Column 5) we find that they serve to deplete the impact of
idiosyncratic shocks on household savings. When disaggregated by wealth group
(Table 11b) we find that this effect holds for the first and the second wealth group but
is of a greater magnitude for the latter. This adds further evidence to our claim that
social safety nets are important for households when faced with adverse income
shocks. We do not find any evidence that purchased insurance claims reduces the
impact of shocks on household savings.
Natural shocks also lead to a significant depletion of savings by households, however,
when transfers are interacted with natural shocks (Column 7 of Table 11a) we find
that those households in receipt of transfers deplete their savings to a lesser extent.
We interpret this result as providing some evidence regarding the importance of
external transfers in times of natural disaster, notwithstanding that the magnitude of
this assistance appears not to fully compensate for the total financial loss incurred by
the household.
Disaggregating total savings into its various components also reveals some interesting
findings, particularly for cash/gold held at home (see Table 12). We find that both
natural disasters and idiosyncratic insurable shocks deplete households’ stock of
cash/gold held at home.29
As for the total stock of saving, we find that transfers
feature significantly as a risk-coping mechanism in the face of natural disasters
although there is still a shortfall in terms of financial loss for the household. Free
insurance claims are also important in easing the depletion of cash/gold in the face of
idiosyncratic insurable shocks but we do not find the same effect for purchased
insurance. The complementarity between purchased insurance and savings
instruments suggests that insurance markets may be incomplete. We find no
significant evidence that either formal or informal savings serve as important risk-
coping mechanisms for the household.30
[INSERT TABLE 12 ABOUT HERE]
5.6 Crop storage
29
It possible that natural disasters such as flooding might physically destroy the stock of cash and gold
held by households. We cannot tell from our data whether or not this is the case. 30
The results for formal and informal savings are not presented but are available on request.

18
Crop stores in the form of rice, maize, potatoes etc., may also act as a form of
precautionary saving.31
Results of the impact of exogenous spatially covariant and
idiosyncratic shocks on the store of crops are presented in Table 13a.
[INSERT TABLES 13a AND 13b ABOUT HERE]
The results indicate that total crop stores are somewhat responsive to shocks (Column
1) but this result is not robust to the disaggregation of spatially covariant and
idiosyncratic shocks into their constituent components. Disaggregating by wealth
group (Table 13b) we find that for middle wealth groups (Column 3), idiosyncratic
uninsurable shocks serve to deplete household crop stores. There is no evidence that
insurance claims or transfers serve as a buffer against asset depletion. One possible
explanation for this is that for households that suffered an idiosyncratic uninsurable
shock, risk-coping may simply require that more harvest is consumed in the home to
offset the financial loss incurred. Households in the wealthiest group that make
insurance claims also deplete their stores of crops which once again suggests that in
times of financial stress wealthier households rely on a variety of different risk coping
mechanisms. There is also some evidence to suggest that wealthier households that
experience idiosyncratic insurable shocks also benefit from free insurance claims to
the extent that they reduce the need for households to deplete their crop stores. It
should be noted that these households are only wealthy relative to the sample of rural
households included in the survey and should not be considered representative of the
population of wealth households in Vietnam as a whole.
Overall, we find some evidence that crop stores are drawn down in times of financial
stress from uninsurable exogenous and idiosyncratic losses and thus appear to serve
precautionary savings purposes. Given that anecdotal evidence suggests that rural
Vietnamese households do not have the means to store large quantities of their crops
(due to the small scale of their production and a lack of storage facilities), it is not
surprising that we find very little evidence that crop stores are used as a risk-coping
mechanism for the poor.
5.7 Household Borrowing
Finally, we turn our attention to rural credit markets and test whether the existence of
credit instruments (or negative assets) serve as a risk-coping mechanism for rural
Vietnamese households. According to Dercon (2002), credit and insurance markets in
developing economies are typically absent or incomplete, either for good theoretical
reasons or as a result of bad policy (for surveys, see Bell (1988) or Besley (1994,
1995)). Typically, consumption loans are also rare. We use a fixed effects estimation
to regress the total outstanding household loan amounts against measures of spatially
covariant and idiosyncratic shocks to determine whether the household resorts to
borrowing to facilitate consumption smoothing when faced with adverse income
shocks. The results are presented in Table 14.
[INSERT TABLE 14 ABOUT HERE]
31
Park (2005) finds that the joint nature of production and savings decisions limits the income loss
associated with risk-coping, and the desire to store grain can explain why subsistence households are
frequently net purchasers but rarely net sellers of grain.

19
We find that total household loan amounts are positively and significantly responsive
to adverse income shocks, indicating that households increase borrowing in times of
financial hardship (Column 1). We disaggregate income shocks into their constituent
components and find that both exogenous and idiosyncratic shocks are associated with
higher levels of borrowing (Column 2). A further disaggregation of income shocks
suggests that all types of shocks, with the exception of endogenous uninsurable
shocks, significantly increase household borrowing (Column 3). It appears that rural
Vietnamese households resort to increasing their borrowings in times of financial
stress. We do not find any evidence that formal insurance claims, free insurance
claims or external transfers help to ease households’ debt burden. Disaggregating by
wealth group we find that the reliance on credit in times of financial hardship is most
characteristic of wealthier households who are more likely to have access to credit
than poorer households.32
6. Conclusion
In this paper, we examine the consequences of risk on the behaviour of Vietnamese
households by examining the ability of households to recover from adverse income
shocks through examining their consumption and asset depletion responses. We find
that households in rural Vietnam manage to smooth consumption in the face of
adverse income shocks and an important mechanism for smoothing consumption is
the use of precautionary saving. Households deplete their total stock of liquid assets in
response to exogenous economic shocks and idiosyncratic insurable shocks. Financial
savings, particularly cash and gold held at home, act as important buffers in the face
of spatially covariant natural shocks. Free insurance plays an important role in easing
the depletion of savings in response to idiosyncratic shocks while external transfers
are important for risk-coping in the face of natural disasters. Of particular note is the
fact that borrowing is increased when households are faced with idiosyncratic and
spatially covariant shocks.
These findings provide evidence for the importance of savings and insurance
instruments for the ability of households to consumption smooth where income risks
prevail. Savings for precautionary purposes may lead to lower welfare outcomes in
the long run given that they result in lower levels of consumption and use up
resources that could be put to more productive uses. This is exacerbated by the fact
that the uncertainty associated with income shocks may lead households to save
excessively in these forms. While our results suggest that the presence of free
insurance instruments reduces the need to draw down some forms of precautionary
savings in the event of adverse income shocks, there is strong evidence to suggest that
insurance markets do not fully cover idiosyncratic risks.
We find evidence that the poorest households and ethnic minorities are the most
vulnerable groups. The baseline model presented in this paper reveals that income and
wealth are strong predictors of the ability of households to recover from the shocks
they suffer. The greater the level of borrowing of households the less likely they are to
recover from a shock suggesting that indebted households find it more difficult to
cope. Free state-provided insurance is of greater benefit to the middle wealth group
32
The disaggregation by wealth group is not presented due to space constraints but the results are
available on request.
20
but does also act as a buffer for some poor households. There is a clear need for
government to ensure that social safety nets protect the most vulnerable in society.
Households that experience a natural shock, such as a weather related incident, appear
to have fewer problems recovering. This suggests that coping mechanisms for
households that experience spatially covariant shocks may be better developed than
those for other types of shocks. We find that natural shocks lead to a significant
depletion of savings by households but when transfers are interacted with natural
shocks we find that those households in receipt of transfers deplete their savings to a
lesser extent. This provides some evidence regarding the importance of external
transfers in times of natural disaster, notwithstanding that the magnitude of this
assistance appears not to fully compensate for the total financial loss incurred.
While government transfers help households to overcome the damage associated with
natural disasters, this comes at a substantial cost to the state. Few households have
access to agricultural insurance to protect against losses due to natural shocks and so
there is significant scope for the development of agricultural insurance products in
order to reduce the variability in income for farmers living in vulnerable areas, and to
reduce the cost government support schemes for these households.
In July 2011, the Vietnamese government introduced a pilot agricultural insurance
product in 20 provinces and cities across Vietnam.33
This programme aims to promote
the development of the agricultural insurance market by supporting 60 percent of the
premiums for households and 20 percent for organisations involved in agricultural
production. Moreover, poor households will receive support of between 80 and 100
percent of premiums.
Incentivizing the take-up of agricultural insurance is an important step forward,
however, many obstacles remain. For example, agricultural insurance is associated
with very high-risks and difficulties in calculating the types of risks that can be
insured, monitoring the incidence of insured events and calculating claims, represent
significant barriers. The Government also has an important role to play in creating the
legal transparency and competitive environment necessary for private insurance
companies to provide agricultural insurance. Close coordination between insurance
companies, credit institutions and farmer’s organisations will facilitate this process. It
is also important that agricultural insurance schemes are directed toward the
mitigation of risk for farmers rather than toward achieving social goals directly. If the
market operates effectively then it will lead to less variability in income for those
farmers affected, more profitable outcomes and reductions in poverty. In the interim,
however, the support programs currently in place play an important role in helping
households to cope. It is important that these support programs are maintained and
reorganised in a way that they reach the most vulnerable.
33
Decision 315/QD-TTg
21
References
Alderman, H. (1998). ‘Saving and Economic Shocks in Rural Pakistan’, Journal of
Development Economics, vol. 51(2), pp. 343–66.
Alderman, H., Hoddinott, J. and Kinsey, B. (2006). ‘Long-term Consequences of
Early Childhood Malnutrition’, Oxford Economic Papers, vol. 58(3), pp. 450-74.
Alderman, H. and Paxson, C. (1994). ‘Do the poor Insure? A Synthesis of the
Literature on Risk and Consumption in Developing Countries’, International
Economics Association, Moscow Meeting, Proceedings, Vol.4.
Bell, C. (1988). ‘Credit Markets, Contracts and Interlinked Transactions’, in Chenery,
H. and T.N. Srinivasan (eds), Handbook of Development Economics, vol. 1,
Amsterdam: North-Holland.
Besley, T. (1994). ‘Savings, Credit and Insurance’, in J. Behrman and T.N. Srinivasan
(eds), Handbook of Development Economics, vol. IIIA, Amsterdam: North-Holland.
Besley, T. (1995). ‘Nonmarket Institutions for Credit and Risk Sharing in Low-
Income Countries’, Journal of Economic Perspectives, vol. 9(Summer), pp. 115–27.
Briys, E. (1986). ‘Insurance and Consumption: The Continuous-Time Case’, Journal
of Risk and Insurance, vol. 53, pp. 718-723.
CIEM, DOE-University of Copenhagen, ILSSA, IPSARD (2007). Characteristics of
the Vietnamese Rural Economy: Evidence from a 2006 Rural Household Survey in 12
Provinces of Vietnam. Hanoi: Statistical Publishing House.
CIEM, DOE-University of Copenhagen, ILSSA, IPSARD (2009). Characteristics of
the Vietnamese Rural Economy: Evidence from a 2008 Rural Household Survey in 12
Provinces of Vietnam. Hanoi: Statistical Publishing House.
CIEM, DOE-University of Copenhagen, ILSSA, IPSARD (Forthcoming 2011).
Characteristics of the Vietnamese Rural Economy: Evidence from a 2010 Rural
Household Survey in 12 Provinces of Vietnam. Hanoi: Statistical Publishing House.
Cole, S., Giné, X., Tobacman, J., Topalova, P., Townsend, R. and Vickery, J. (2010).
‘Barriers to Household Risk Management: Evidence from India.’ Federal Reserve
Bank of New York Staff Report Number 373.
Deaton, A. (1991). ‘Savings and Liquidity Constraints’, Econometrica, vol. 59(5), pp.
1221–48.
Deaton, A. (1992). ‘Household Saving in LDCs: Credit Markets, Insurance and
Welfare’, Scandinavian Journal of Economics, vol. 94(2), pp. 253–73.
Deaton, A. (1997). The Analysis of Household Surveys: A Microeconomic Approach,
Baltimore: Johns Hopkins University Press.
22
Dercon, S. (2002). ‘Income Risk, Coping Strategies and Safety Nets’ World Bank
Research Observer, vol. 17(2), pp. 141-66.
Dionne, G. (2000). Handbook of Insurance, New York: Kluwer Academic Publishers.
Dionne, G and L. Eeckhoudt, (1984). ‘Insurance and Saving: Some Further Results’,
Insurance: Mathematics and Economics, vol. 3(2), pp. 101-110.
Fafchamps, M. (2009). ‘Vulnerability, Risk Management, and Agricultural
Development’, CEGA Working Paper Number AfD-0904.
Fafchamps, M., Czukas, K., and Udry, C. (1998). ‘Drought and Saving in West-
Africa: Are Livestock a Buffer Stock’, Journal of Development Economics, vol.
55(2), pp. 273–305.
Gollier, C. (1994). ‘Insurance and Precautionary Capital Accumulation in a
Continuous-Time Model’, Journal of Risk and Insurance vol. 61(1), pp. 78-95.
Jacoby, H. and Skoufias, E. (1997). ‘Risk, Financial Markets and Human Capital in a
Developing Country’, Review of Economic Studies, vol. 64(3), pp. 311–36.
Kimball, M. (1990). ‘Precautionary Saving and the Marginal Propensity to Consume’,
NBER Working Paper Number 3403.
Lim, Y. and Townsend, R., (1998). ‘General Equilibrium Models of Financial
Systems: Theory and Measurement in Village Economies.’ Review of Economic
Dynamics, vol. 1(1), pp. 59-118.
Morduch, J. (2004). ‘Consumption Smoothing Across Space: Tests for Village-Level
Responses to Risk’, In Dercon, S. (ed.), Insurance against Poverty, Oxford University
Press.
Morduch, J. (2002). ‘Micro-insurance: the next revolution’, In Banerjee, A. Benabou
R. and Mookherjee, D. (eds.) What we have learned about poverty? Oxford
University Press.
Newman, C., Tarp, F. and Van den Broeck, K. (2011). ‘Social Capital and Savings
Behaviour: Evidence from Vietnam.’ IIIS Discussion Paper Number 351.
Nguyen, Q.N. (2003). ‘Responses to poverty and risks in Vietnam: How effectively
does Vietnamese public safety net target vulnerable populations’ Research and
Development, Bank for Foreign Trade of Vietnam.
Park, A. (2006). ‘Risk and Household Grain Management in Developing Countries’,
The Economic Journal, vol. 116(514), pp.1088-115.
Rosenzweig, M. and Wolpin, K. (1993). ‘Credit Market Constraints, Consumption
Smoothing, and the Accumulation of Durable Production Assets in Low-income
Countries: Investment in Bullocks in India’, Journal of Political Economy, vol.
101(2), pp. 223–44.
23
Townsend, R. (1994). ‘Risk and Insurance in Village India’, Econometrica, vol.
62(3), pp. 539–91.
Udry, C. (1991). ‘Credit Markets in Northern Nigeria: Credit as Insurance in a Rural
Economy’, World Bank Economic Review, vol. 4(3), pp. 251–71.
Udry, C. (1994). ‘Risk and Insurance in a Rural Credit Market: An empirical
Investigation of Northern Nigeria’, Review of Economic Studies, vol. 61(3), pp. 495–
526.
Ventura, L. and Eisenhauer, J. (2005). ‘The Relevance of Precautionary Saving’,
German Economic Review, vol. 6(5), pp. 23-35.
Zeldes, S. (1989). ‘Optimal consumption with stochastic income: deviations from
certainty equivalence’, Quarterly Journal of Economics, vol. 104(2), pp. 275-298.
24
Tables
Table 1: Explanatory Variables and descriptions Explanatory Variable Description
Exogenous: Spatially Covariant
Natural Shock
Dummy variable indicating whether the household has suffered a
spatially covariant natural income shock. Shocks include floods,
landslides, typhoons, storms, droughts, pest infestation, crop disease
and avian flu.
Exogenous: Economic Shock Dummy variable indicating whether the household has suffered an
exogenous economic shock. Shocks include changes in crop price,
changes in key input prices, changes in prices of food or other
essential commodities consumed.
Idiosyncratic: Insurable Shock Dummy variable indicating whether the household has suffered an
idiosyncratic insurable income shock. Shocks include illness, injury
or death of a family member.
Idiosyncratic: Uninsurable Shock Dummy variable indicating whether the household has suffered an
idiosyncratic uninsurable income shock. Shocks include
unemployment, unsuccessful investment, loss of land,
crime/robbery/theft, divorce, family disputes.
Transfers Dummy variable indicating whether the household has received
external income transfers from government and/or family
members/relatives (public/private sources).
Purchased insurance Claim Dummy variable indicating whether the household has made an
insurance claim under a voluntarily purchased contract and received
funds in compensation. Claims are restricted to health, life and
social insurance.
Free insurance Claim Dummy variable indicating whether the household has made an
insurance claim under a free state provided insurance contract and
received funds in compensation. Claims are restricted to health and
social insurance.
Income Household income – includes income from non-farm activities and
income from the sale of assets. Excludes insurance premium paid.
(2010 mean = 80991 VND, 2010 std deviation=130050 VND)
Household Size Total number of household members.
Education of Household Head 1 "Cannot read and write"
2 "Can read & write but did not finish primary school"
3 "Finished primary school"
4 "Finished lower secondary school"
5 "Finished upper secondary school"
6 "Third Level"
Gender of Household Head Dummy variable (1 Male, 0 Female).
Age of Household Head Measured in years.
Wealth
Total household wealth constructed using fixed asset values (land),
liquid asset values (livestock, savings, crop stores), housing values ,
equipment and machinery and consumer durables. Liquid Asset
values are excluded for the purposes of the analysis.
(2010 mean = 351658 VND, 2010 std deviation=1365008 VND)
Recovered from Prior Shocks Dummy variable indicating whether the household has recovered
from a prior income shock in the previous time period.
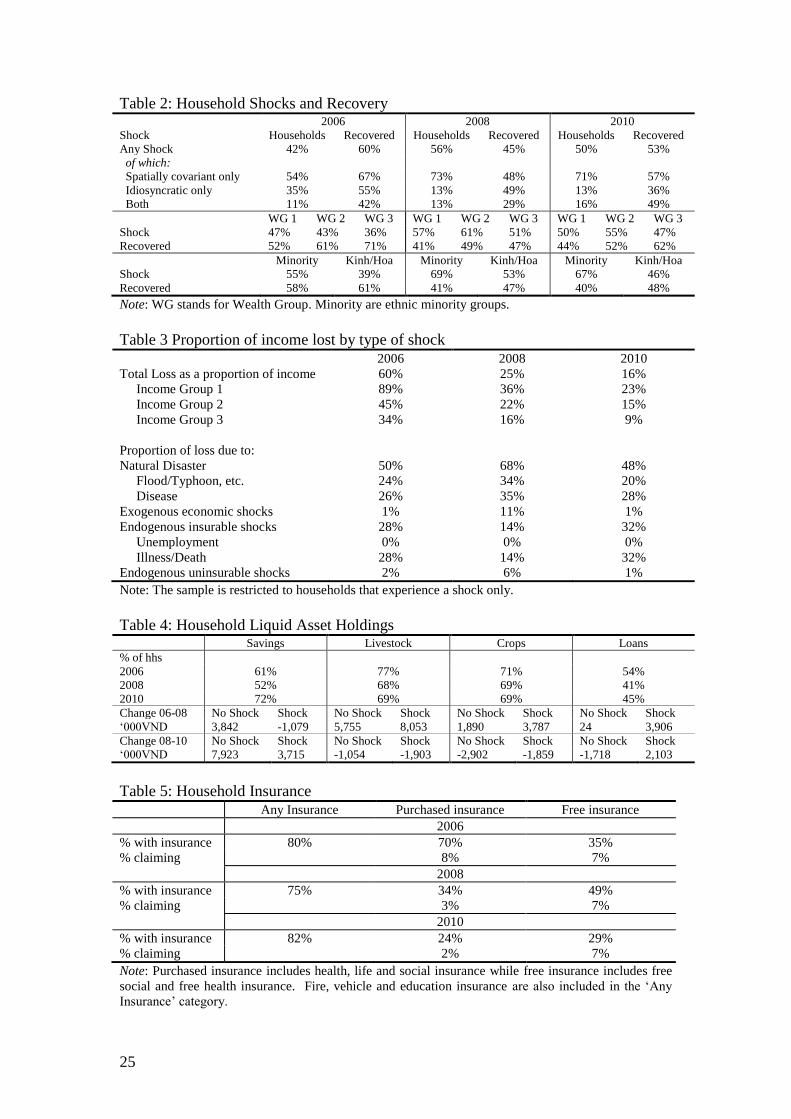
25
Table 2: Household Shocks and Recovery 2006 2008 2010
Shock Households Recovered Households Recovered Households Recovered
Any Shock 42% 60% 56% 45% 50% 53%
of which:
Spatially covariant only 54% 67% 73% 48% 71% 57%
Idiosyncratic only 35% 55% 13% 49% 13% 36%
Both 11% 42% 13% 29% 16% 49%
WG 1 WG 2 WG 3 WG 1 WG 2 WG 3 WG 1 WG 2 WG 3
Shock 47% 43% 36% 57% 61% 51% 50% 55% 47%
Recovered 52% 61% 71% 41% 49% 47% 44% 52% 62%
Minority Kinh/Hoa Minority Kinh/Hoa Minority Kinh/Hoa
Shock 55% 39% 69% 53% 67% 46%
Recovered 58% 61% 41% 47% 40% 48%
Note: WG stands for Wealth Group. Minority are ethnic minority groups.
Table 3 Proportion of income lost by type of shock 2006 2008 2010
Total Loss as a proportion of income 60% 25% 16%
Income Group 1 89% 36% 23%
Income Group 2 45% 22% 15%
Income Group 3 34% 16% 9%
Proportion of loss due to:
Natural Disaster 50% 68% 48%
Flood/Typhoon, etc. 24% 34% 20%
Disease 26% 35% 28%
Exogenous economic shocks 1% 11% 1%
Endogenous insurable shocks 28% 14% 32%
Unemployment 0% 0% 0%
Illness/Death 28% 14% 32%
Endogenous uninsurable shocks 2% 6% 1%
Note: The sample is restricted to households that experience a shock only.
Table 4: Household Liquid Asset Holdings Savings Livestock Crops Loans
% of hhs
2006 61% 77% 71% 54%
2008 52% 68% 69% 41%
2010 72% 69% 69% 45%
Change 06-08 No Shock Shock No Shock Shock No Shock Shock No Shock Shock
‘000VND 3,842 -1,079 5,755 8,053 1,890 3,787 24 3,906
Change 08-10 No Shock Shock No Shock Shock No Shock Shock No Shock Shock
‘000VND 7,923 3,715 -1,054 -1,903 -2,902 -1,859 -1,718 2,103
Table 5: Household Insurance Any Insurance Purchased insurance Free insurance
2006
% with insurance 80% 70% 35%
% claiming 8% 7%
2008
% with insurance 75% 34% 49%
% claiming 3% 7%
2010
% with insurance 82% 24% 29%
% claiming 2% 7%
Note: Purchased insurance includes health, life and social insurance while free insurance includes free
social and free health insurance. Fire, vehicle and education insurance are also included in the ‘Any
Insurance’ category.
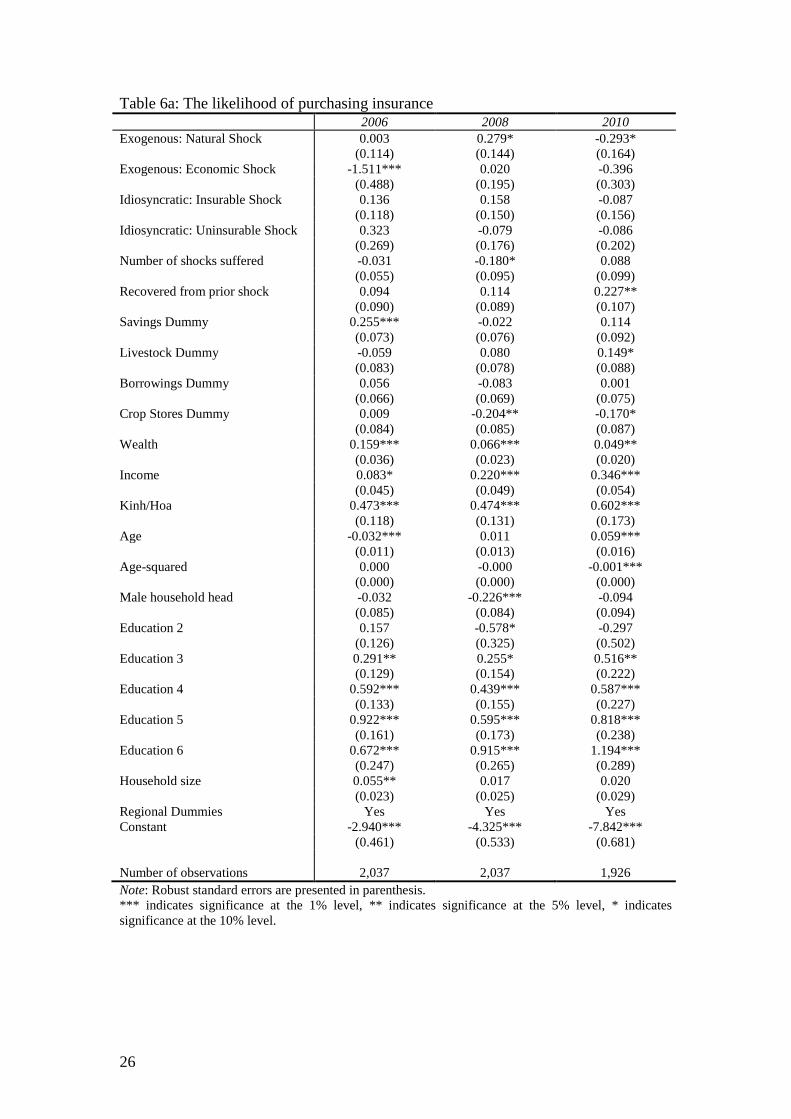
26
Table 6a: The likelihood of purchasing insurance 2006 2008 2010
Exogenous: Natural Shock 0.003 0.279* -0.293*
(0.114) (0.144) (0.164)
Exogenous: Economic Shock -1.511*** 0.020 -0.396
(0.488) (0.195) (0.303)
Idiosyncratic: Insurable Shock 0.136 0.158 -0.087
(0.118) (0.150) (0.156)
Idiosyncratic: Uninsurable Shock 0.323 -0.079 -0.086
(0.269) (0.176) (0.202)
Number of shocks suffered -0.031 -0.180* 0.088
(0.055) (0.095) (0.099)
Recovered from prior shock 0.094 0.114 0.227**
(0.090) (0.089) (0.107)
Savings Dummy 0.255*** -0.022 0.114
(0.073) (0.076) (0.092)
Livestock Dummy -0.059 0.080 0.149*
(0.083) (0.078) (0.088)
Borrowings Dummy 0.056 -0.083 0.001
(0.066) (0.069) (0.075)
Crop Stores Dummy 0.009 -0.204** -0.170*
(0.084) (0.085) (0.087)
Wealth 0.159*** 0.066*** 0.049**
(0.036) (0.023) (0.020)
Income 0.083* 0.220*** 0.346***
(0.045) (0.049) (0.054)
Kinh/Hoa 0.473*** 0.474*** 0.602***
(0.118) (0.131) (0.173)
Age -0.032*** 0.011 0.059***
(0.011) (0.013) (0.016)
Age-squared 0.000 -0.000 -0.001***
(0.000) (0.000) (0.000)
Male household head -0.032 -0.226*** -0.094
(0.085) (0.084) (0.094)
Education 2 0.157 -0.578* -0.297
(0.126) (0.325) (0.502)
Education 3 0.291** 0.255* 0.516**
(0.129) (0.154) (0.222)
Education 4 0.592*** 0.439*** 0.587***
(0.133) (0.155) (0.227)
Education 5 0.922*** 0.595*** 0.818***
(0.161) (0.173) (0.238)
Education 6 0.672*** 0.915*** 1.194***
(0.247) (0.265) (0.289)
Household size 0.055** 0.017 0.020
(0.023) (0.025) (0.029)
Regional Dummies Yes Yes Yes
Constant -2.940*** -4.325*** -7.842***
(0.461) (0.533) (0.681)
Number of observations 2,037 2,037 1,926
Note: Robust standard errors are presented in parenthesis.
*** indicates significance at the 1% level, ** indicates significance at the 5% level, * indicates
significance at the 10% level.

27
Table 6b: The likelihood of having free insurance 2006 2008 2010
Exogenous: Natural Shock -0.104 0.088 0.110
(0.121) (0.137) (0.141)
Exogenous: Economic Shock 0.657* -0.278 0.014
(0.389) (0.174) (0.231)
Idiosyncratic: Insurable Shock -0.055 0.250* 0.339**
(0.124) (0.134) (0.136)
Idiosyncratic: Uninsurable Shock -0.521 0.077 0.300*
(0.333) (0.181) (0.173)
Number of shocks suffered 0.106* -0.049 -0.054
(0.057) (0.086) (0.085)
Recovered from prior shock -0.025 -0.012 0.016
(0.094) (0.090) (0.089)
Savings Dummy -0.144* -0.013 -0.057
(0.080) (0.076) (0.073)
Livestock Dummy 0.325*** 0.118 -0.157*
(0.098) (0.078) (0.083)
Borrowings Dummy 0.053 0.166** 0.129*
(0.073) (0.070) (0.068)
Crop Stores Dummy -0.208** -0.166** -0.158*
(0.098) (0.084) (0.086)
Wealth -0.240*** -0.025 -0.068***
(0.041) (0.021) (0.018)
Income -0.014 -0.146*** -0.052
(0.051) (0.049) (0.050)
Kinh -0.671*** -0.947*** -0.201*
(0.115) (0.111) (0.120)
Age 0.017 0.005 -0.019
(0.012) (0.012) (0.012)
Age-squared -0.000 0.000 0.000
(0.000) (0.000) (0.000)
Male household head -0.316*** -0.111 -0.352***
(0.094) (0.085) (0.083)
Education 2 -0.259** 0.150 -0.010
(0.127) (0.204) (0.239)
Education 3 -0.256** -0.111 -0.146
(0.130) (0.130) (0.122)
Education 4 -0.203 -0.377*** -0.258**
(0.133) (0.132) (0.128)
Education 5 -0.240 -0.286* -0.387**
(0.164) (0.157) (0.152)
Education 6 0.242 -0.032 0.165
(0.261) (0.279) (0.224)
Household size 0.068*** 0.093*** 0.136***
(0.025) (0.025) (0.024)
Regional Dummies Yes Yes Yes
Constant 1.648*** 1.423*** 1.228**
(0.511) (0.513) (0.551)
Number of observations 2,003 2,037 2,036
Note: Robust standard errors are presented in parenthesis.
*** indicates significance at the 1% level, ** indicates significance at the 5% level, * indicates
significance at the 10% level.
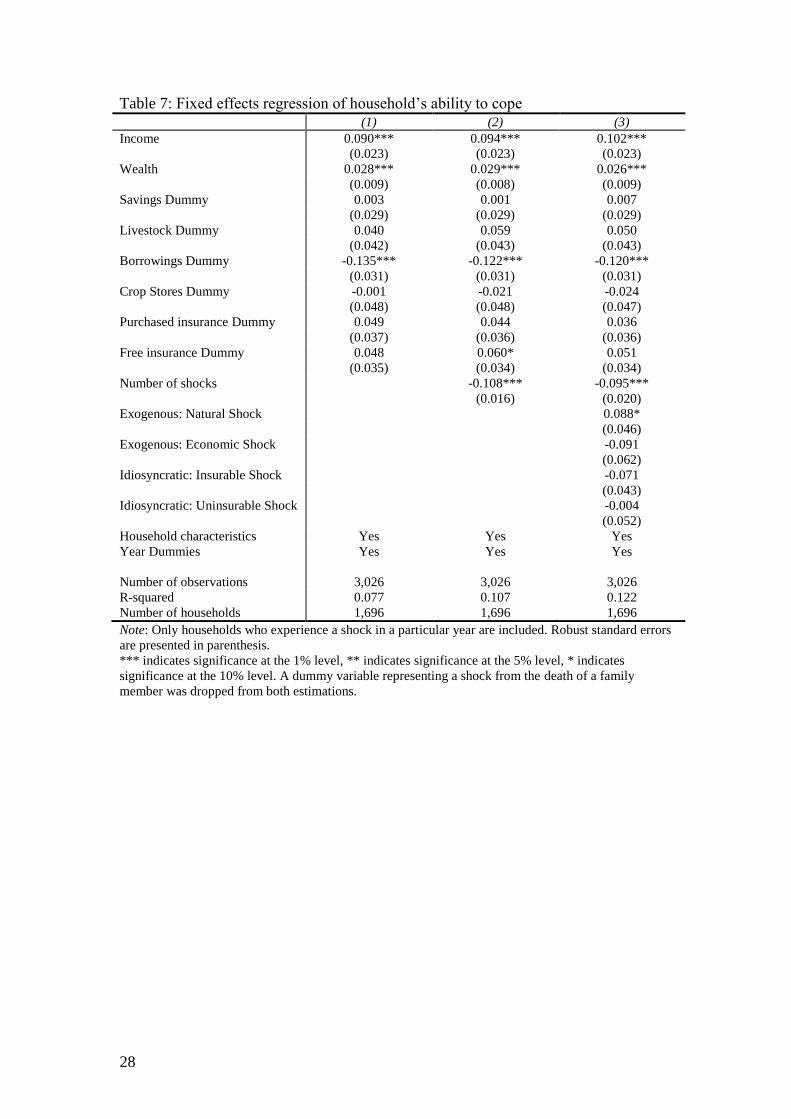
28
Table 7: Fixed effects regression of household’s ability to cope (1) (2) (3)
Income 0.090*** 0.094*** 0.102***
(0.023) (0.023) (0.023)
Wealth 0.028*** 0.029*** 0.026***
(0.009) (0.008) (0.009)
Savings Dummy 0.003 0.001 0.007
(0.029) (0.029) (0.029)
Livestock Dummy 0.040 0.059 0.050
(0.042) (0.043) (0.043)
Borrowings Dummy -0.135*** -0.122*** -0.120***
(0.031) (0.031) (0.031)
Crop Stores Dummy -0.001 -0.021 -0.024
(0.048) (0.048) (0.047)
Purchased insurance Dummy 0.049 0.044 0.036
(0.037) (0.036) (0.036)
Free insurance Dummy 0.048 0.060* 0.051
(0.035) (0.034) (0.034)
Number of shocks -0.108*** -0.095***
(0.016) (0.020)
Exogenous: Natural Shock 0.088*
(0.046)
Exogenous: Economic Shock -0.091
(0.062)
Idiosyncratic: Insurable Shock -0.071
(0.043)
Idiosyncratic: Uninsurable Shock -0.004
(0.052)
Household characteristics Yes Yes Yes
Year Dummies Yes Yes Yes
Number of observations 3,026 3,026 3,026
R-squared 0.077 0.107 0.122
Number of households 1,696 1,696 1,696
Note: Only households who experience a shock in a particular year are included. Robust standard errors
are presented in parenthesis.
*** indicates significance at the 1% level, ** indicates significance at the 5% level, * indicates
significance at the 10% level. A dummy variable representing a shock from the death of a family
member was dropped from both estimations.
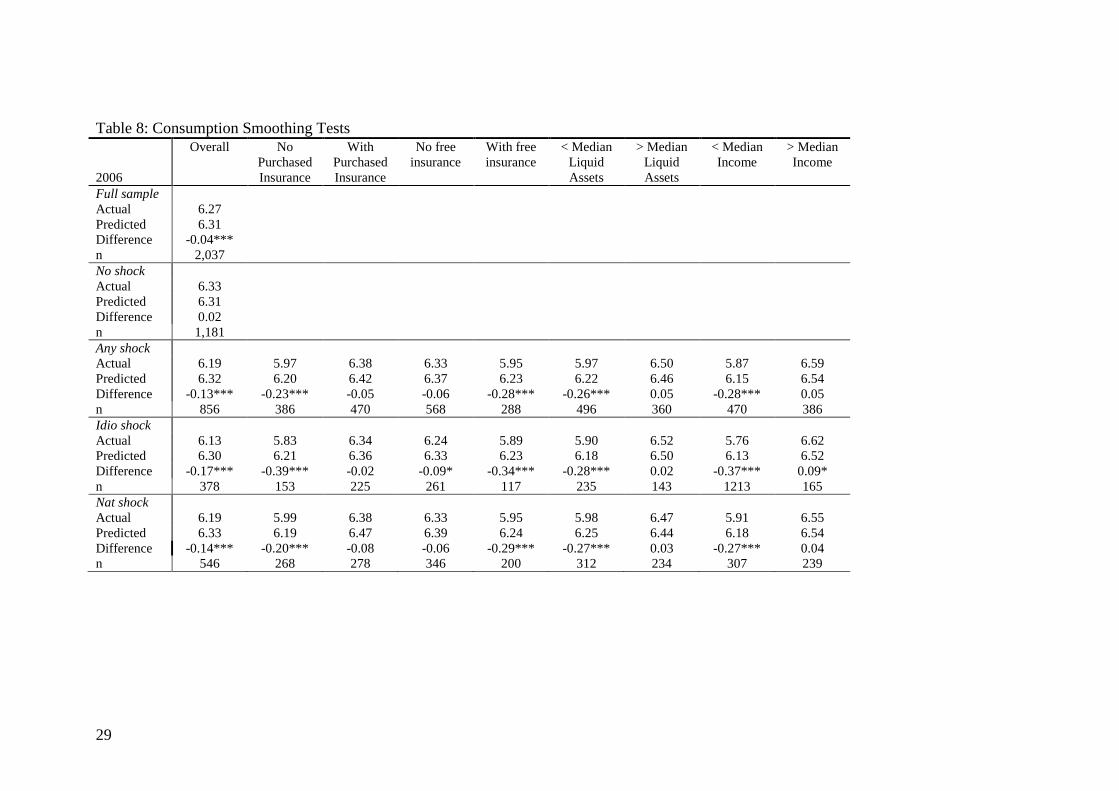
29
Table 8: Consumption Smoothing Tests
2006
Overall No
Purchased
Insurance
With
Purchased
Insurance
No free
insurance
With free
insurance
< Median
Liquid
Assets
> Median
Liquid
Assets
< Median
Income
> Median
Income
Full sample
Actual 6.27
Predicted 6.31
Difference -0.04***
n 2,037
No shock
Actual 6.33
Predicted 6.31
Difference 0.02
n 1,181
Any shock
Actual 6.19 5.97 6.38 6.33 5.95 5.97 6.50 5.87 6.59
Predicted 6.32 6.20 6.42 6.37 6.23 6.22 6.46 6.15 6.54
Difference -0.13*** -0.23*** -0.05 -0.06 -0.28*** -0.26*** 0.05 -0.28*** 0.05
n 856 386 470 568 288 496 360 470 386
Idio shock
Actual 6.13 5.83 6.34 6.24 5.89 5.90 6.52 5.76 6.62
Predicted 6.30 6.21 6.36 6.33 6.23 6.18 6.50 6.13 6.52
Difference -0.17*** -0.39*** -0.02 -0.09* -0.34*** -0.28*** 0.02 -0.37*** 0.09*
n 378 153 225 261 117 235 143 1213 165
Nat shock
Actual 6.19 5.99 6.38 6.33 5.95 5.98 6.47 5.91 6.55
Predicted 6.33 6.19 6.47 6.39 6.24 6.25 6.44 6.18 6.54
Difference -0.14*** -0.20*** -0.08 -0.06 -0.29*** -0.27*** 0.03 -0.27*** 0.04
n 546 268 278 346 200 312 234 307 239
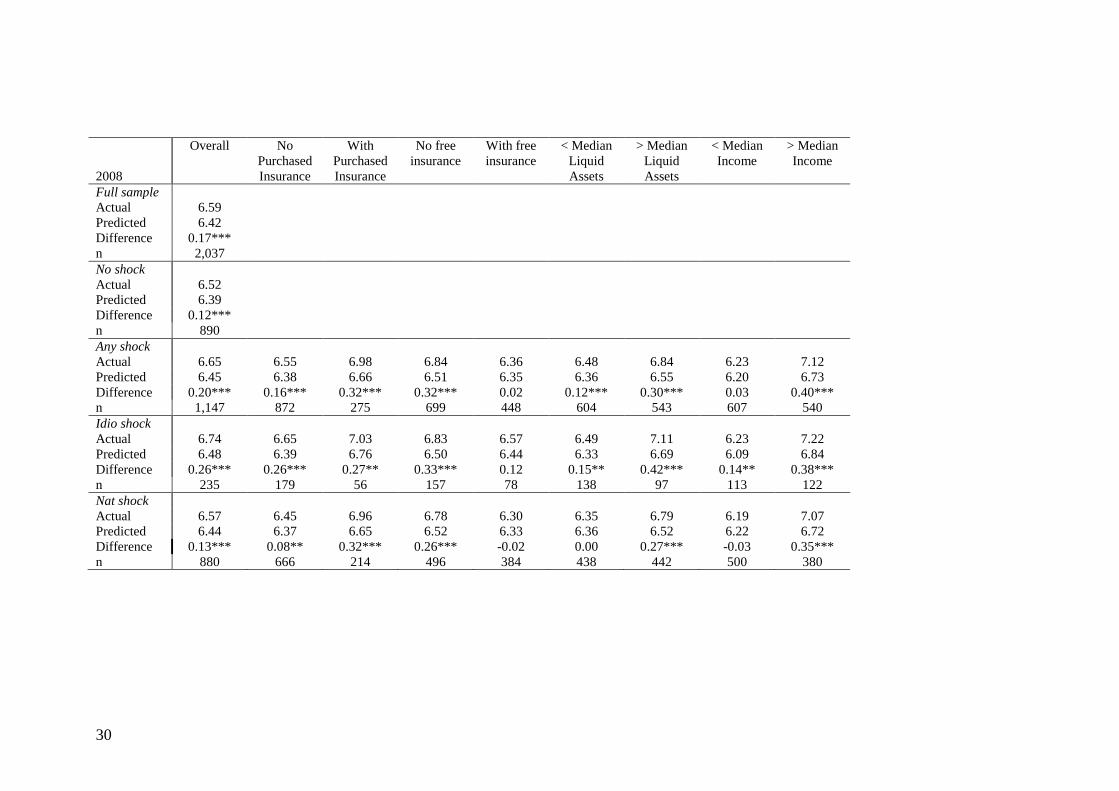
30
2008
Overall No
Purchased
Insurance
With
Purchased
Insurance
No free
insurance
With free
insurance
< Median
Liquid
Assets
> Median
Liquid
Assets
< Median
Income
> Median
Income
Full sample
Actual 6.59
Predicted 6.42
Difference 0.17***
n 2,037
No shock
Actual 6.52
Predicted 6.39
Difference 0.12***
n 890
Any shock
Actual 6.65 6.55 6.98 6.84 6.36 6.48 6.84 6.23 7.12
Predicted 6.45 6.38 6.66 6.51 6.35 6.36 6.55 6.20 6.73
Difference 0.20*** 0.16*** 0.32*** 0.32*** 0.02 0.12*** 0.30*** 0.03 0.40***
n 1,147 872 275 699 448 604 543 607 540
Idio shock
Actual 6.74 6.65 7.03 6.83 6.57 6.49 7.11 6.23 7.22
Predicted 6.48 6.39 6.76 6.50 6.44 6.33 6.69 6.09 6.84
Difference 0.26*** 0.26*** 0.27** 0.33*** 0.12 0.15** 0.42*** 0.14** 0.38***
n 235 179 56 157 78 138 97 113 122
Nat shock
Actual 6.57 6.45 6.96 6.78 6.30 6.35 6.79 6.19 7.07
Predicted 6.44 6.37 6.65 6.52 6.33 6.36 6.52 6.22 6.72
Difference 0.13*** 0.08** 0.32*** 0.26*** -0.02 0.00 0.27*** -0.03 0.35***
n 880 666 214 496 384 438 442 500 380
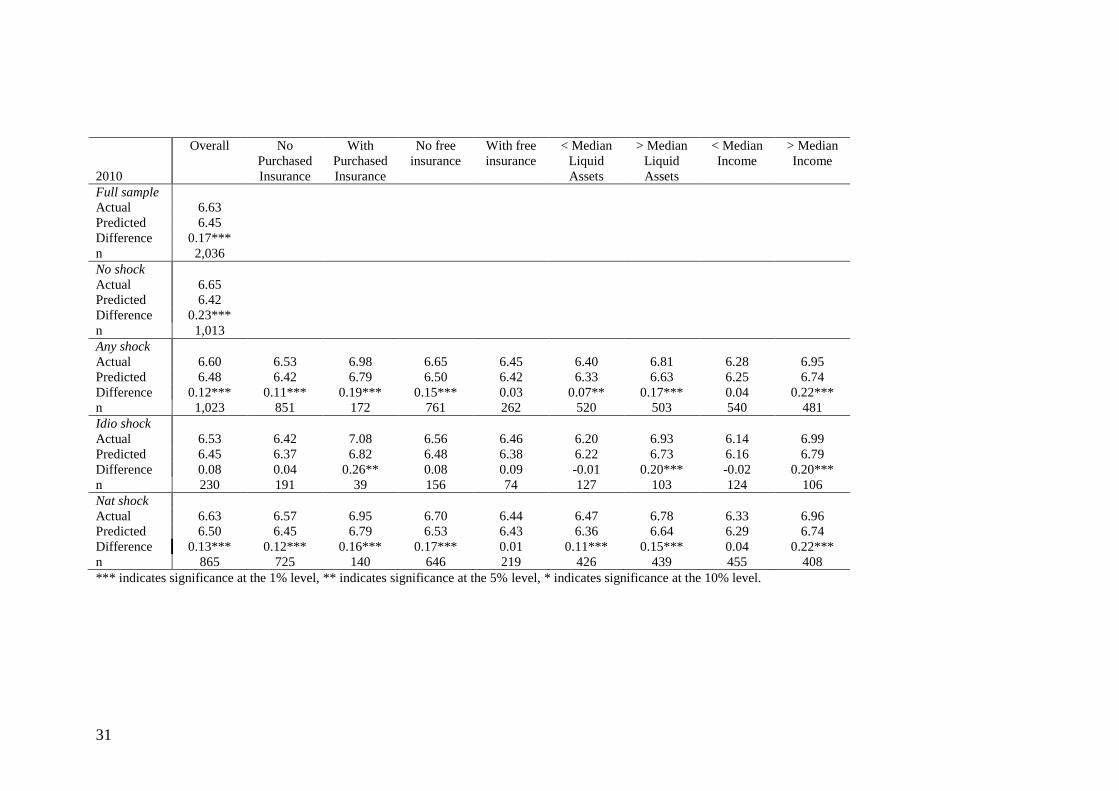
31
2010
Overall No
Purchased
Insurance
With
Purchased
Insurance
No free
insurance
With free
insurance
< Median
Liquid
Assets
> Median
Liquid
Assets
< Median
Income
> Median
Income
Full sample
Actual 6.63
Predicted 6.45
Difference 0.17***
n 2,036
No shock
Actual 6.65
Predicted 6.42
Difference 0.23***
n 1,013
Any shock
Actual 6.60 6.53 6.98 6.65 6.45 6.40 6.81 6.28 6.95
Predicted 6.48 6.42 6.79 6.50 6.42 6.33 6.63 6.25 6.74
Difference 0.12*** 0.11*** 0.19*** 0.15*** 0.03 0.07** 0.17*** 0.04 0.22***
n 1,023 851 172 761 262 520 503 540 481
Idio shock
Actual 6.53 6.42 7.08 6.56 6.46 6.20 6.93 6.14 6.99
Predicted 6.45 6.37 6.82 6.48 6.38 6.22 6.73 6.16 6.79
Difference 0.08 0.04 0.26** 0.08 0.09 -0.01 0.20*** -0.02 0.20***
n 230 191 39 156 74 127 103 124 106
Nat shock
Actual 6.63 6.57 6.95 6.70 6.44 6.47 6.78 6.33 6.96
Predicted 6.50 6.45 6.79 6.53 6.43 6.36 6.64 6.29 6.74
Difference 0.13*** 0.12*** 0.16*** 0.17*** 0.01 0.11*** 0.15*** 0.04 0.22***
n 865 725 140 646 219 426 439 455 408
*** indicates significance at the 1% level, ** indicates significance at the 5% level, * indicates significance at the 10% level.
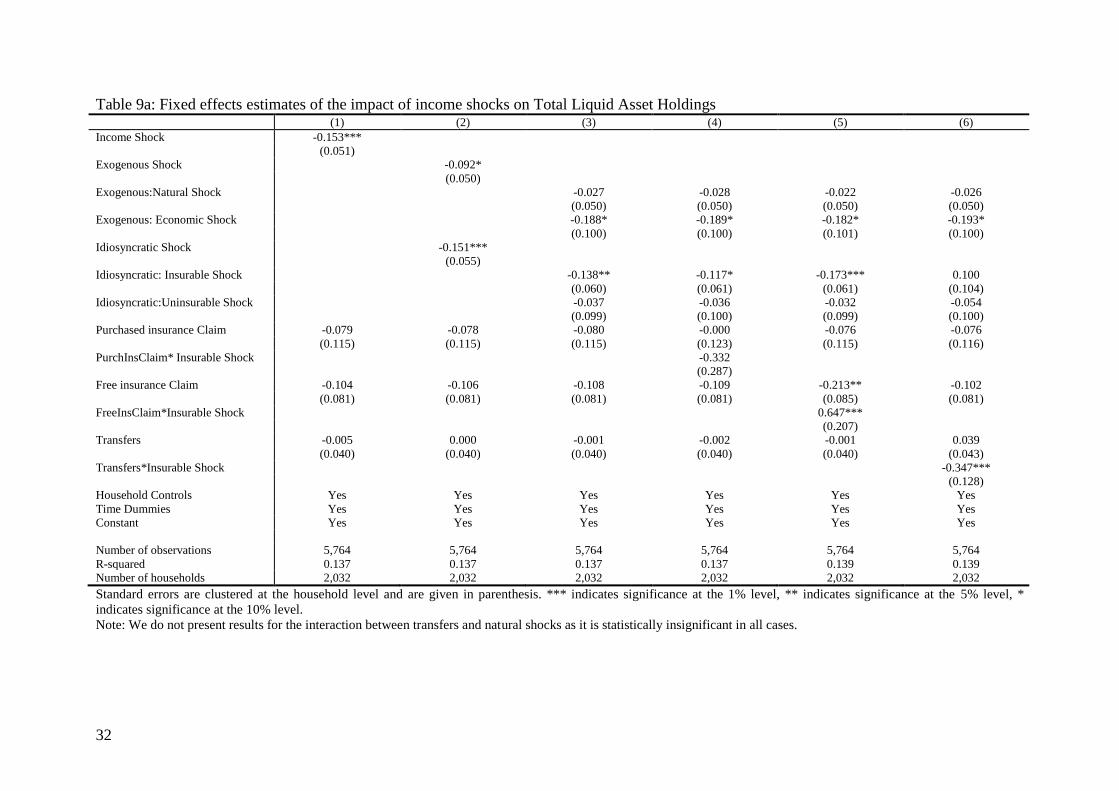
32
Table 9a: Fixed effects estimates of the impact of income shocks on Total Liquid Asset Holdings (1) (2) (3) (4) (5) (6)
Income Shock -0.153***
(0.051)
Exogenous Shock -0.092*
(0.050)
Exogenous:Natural Shock -0.027 -0.028 -0.022 -0.026
(0.050) (0.050) (0.050) (0.050)
Exogenous: Economic Shock -0.188* -0.189* -0.182* -0.193*
(0.100) (0.100) (0.101) (0.100)
Idiosyncratic Shock -0.151***
(0.055)
Idiosyncratic: Insurable Shock -0.138** -0.117* -0.173*** 0.100
(0.060) (0.061) (0.061) (0.104)
Idiosyncratic:Uninsurable Shock -0.037 -0.036 -0.032 -0.054
(0.099) (0.100) (0.099) (0.100)
Purchased insurance Claim -0.079 -0.078 -0.080 -0.000 -0.076 -0.076
(0.115) (0.115) (0.115) (0.123) (0.115) (0.116)
PurchInsClaim* Insurable Shock -0.332
(0.287)
Free insurance Claim -0.104 -0.106 -0.108 -0.109 -0.213** -0.102
(0.081) (0.081) (0.081) (0.081) (0.085) (0.081)
FreeInsClaim*Insurable Shock 0.647***
(0.207)
Transfers -0.005 0.000 -0.001 -0.002 -0.001 0.039
(0.040) (0.040) (0.040) (0.040) (0.040) (0.043)
Transfers*Insurable Shock -0.347***
(0.128)
Household Controls Yes Yes Yes Yes Yes Yes
Time Dummies Yes Yes Yes Yes Yes Yes
Constant Yes Yes Yes Yes Yes Yes
Number of observations 5,764 5,764 5,764 5,764 5,764 5,764
R-squared 0.137 0.137 0.137 0.137 0.139 0.139
Number of households 2,032 2,032 2,032 2,032 2,032 2,032
Standard errors are clustered at the household level and are given in parenthesis. *** indicates significance at the 1% level, ** indicates significance at the 5% level, *
indicates significance at the 10% level.
Note: We do not present results for the interaction between transfers and natural shocks as it is statistically insignificant in all cases.
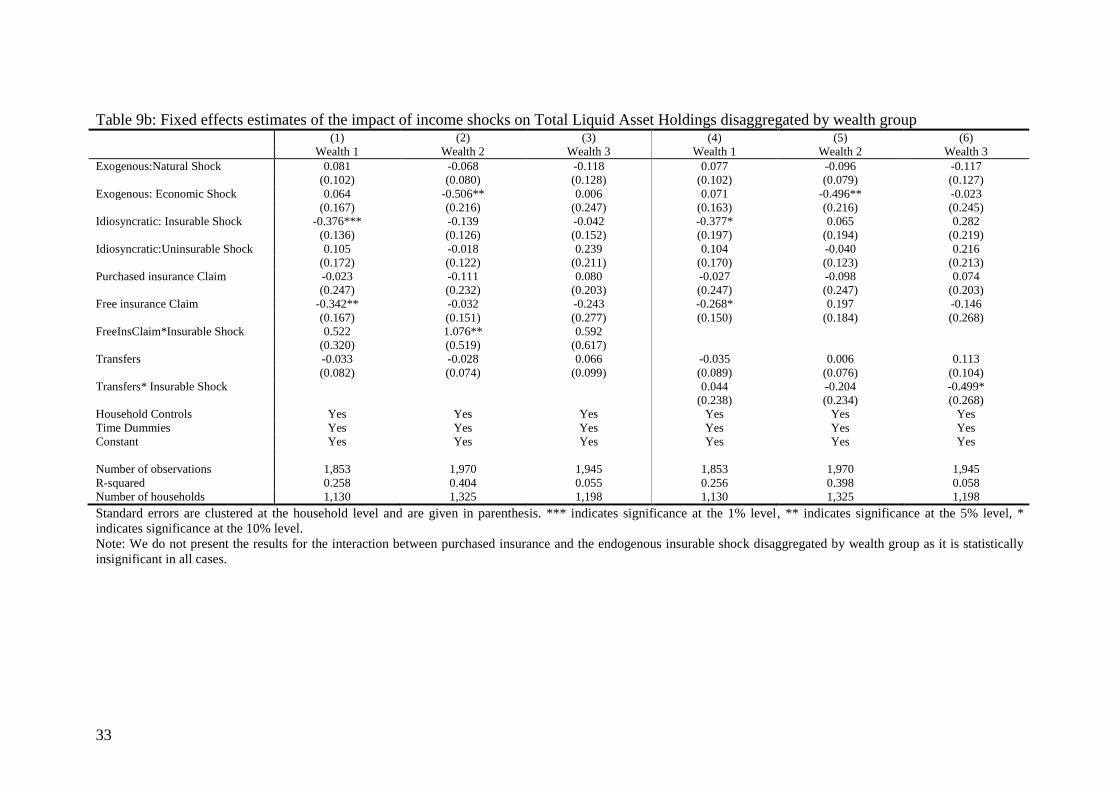
33
Table 9b: Fixed effects estimates of the impact of income shocks on Total Liquid Asset Holdings disaggregated by wealth group (1) (2) (3) (4) (5) (6)
Wealth 1 Wealth 2 Wealth 3 Wealth 1 Wealth 2 Wealth 3
Exogenous:Natural Shock 0.081 -0.068 -0.118 0.077 -0.096 -0.117
(0.102) (0.080) (0.128) (0.102) (0.079) (0.127)
Exogenous: Economic Shock 0.064 -0.506** 0.006 0.071 -0.496** -0.023
(0.167) (0.216) (0.247) (0.163) (0.216) (0.245)
Idiosyncratic: Insurable Shock -0.376*** -0.139 -0.042 -0.377* 0.065 0.282
(0.136) (0.126) (0.152) (0.197) (0.194) (0.219)
Idiosyncratic:Uninsurable Shock 0.105 -0.018 0.239 0.104 -0.040 0.216
(0.172) (0.122) (0.211) (0.170) (0.123) (0.213)
Purchased insurance Claim -0.023 -0.111 0.080 -0.027 -0.098 0.074
(0.247) (0.232) (0.203) (0.247) (0.247) (0.203)
Free insurance Claim -0.342** -0.032 -0.243 -0.268* 0.197 -0.146
(0.167) (0.151) (0.277) (0.150) (0.184) (0.268)
FreeInsClaim*Insurable Shock 0.522 1.076** 0.592
(0.320) (0.519) (0.617)
Transfers -0.033 -0.028 0.066 -0.035 0.006 0.113
(0.082) (0.074) (0.099) (0.089) (0.076) (0.104)
Transfers* Insurable Shock 0.044 -0.204 -0.499*
(0.238) (0.234) (0.268)
Household Controls Yes Yes Yes Yes Yes Yes
Time Dummies Yes Yes Yes Yes Yes Yes
Constant Yes Yes Yes Yes Yes Yes
Number of observations 1,853 1,970 1,945 1,853 1,970 1,945
R-squared 0.258 0.404 0.055 0.256 0.398 0.058
Number of households 1,130 1,325 1,198 1,130 1,325 1,198
Standard errors are clustered at the household level and are given in parenthesis. *** indicates significance at the 1% level, ** indicates significance at the 5% level, *
indicates significance at the 10% level.
Note: We do not present the results for the interaction between purchased insurance and the endogenous insurable shock disaggregated by wealth group as it is statistically
insignificant in all cases.

34
Table 10: Fixed effects estimates of the impact of income shocks on Total Livestock Holdings (1) (2) (3) (4) (5) (6)
Income Shock -0.023
(0.073)
Exogenous Shock 0.028
(0.066)
Exogenous:Natural Shock 0.010 0.010 0.013 0.010
(0.065) (0.065) (0.065) (0.065)
Exogenous: Economic Shock 0.023 0.023 0.030 0.021
(0.150) (0.150) (0.150) (0.150)
Idiosyncratic Shock -0.140*
(0.082)
Idiosyncratic: Insurable Shock -0.154* -0.157* -0.183** -0.056
(0.092) (0.093) (0.093) (0.141)
Idiosyncratic:Uninsurable Shock -0.104 -0.104 -0.096 -0.112
(0.124) (0.124) (0.124) (0.125)
Purchased insurance Claim -0.338* -0.327* -0.326* -0.336* -0.322* -0.326*
(0.173) (0.173) (0.173) (0.200) (0.174) (0.173)
PurchInsClaim* Insurable Shock 0.042
(0.429)
Free insurance Claim -0.009 -0.014 -0.014 -0.014 -0.091 -0.011
(0.132) (0.132) (0.132) (0.132) (0.139) (0.132)
FreeInsClaim*Insurable Shock 0.563
(0.365)
Transfers -0.025 -0.021 -0.022 -0.022 -0.023 -0.005
(0.062) (0.062) (0.062) (0.062) (0.062) (0.066)
Transfers*Natural Shock -0.143
(0.181)
Household Controls Yes Yes Yes Yes Yes Yes
Time Dummies Yes Yes Yes Yes Yes Yes
Constant Yes Yes Yes Yes Yes Yes
Number of observations 4,372 4,372 4,372 4,372 4,372 4,372
R-squared 0.356 0.357 0.357 0.357 0.357 0.357
Number of households 1,777 1,777 1,777 1,777 1,777 1,777
Standard errors are given in parenthesis. *** indicates significance at the 1% level, ** indicates significance at the 5% level, * indicates significance at the 10% level.
Note: We do not present results for the interaction between transfers and natural shocks as it is statistically insignificant in all cases. Nor do we do not present a
disaggregation by wealth group as none of the interaction terms are statistically significant.
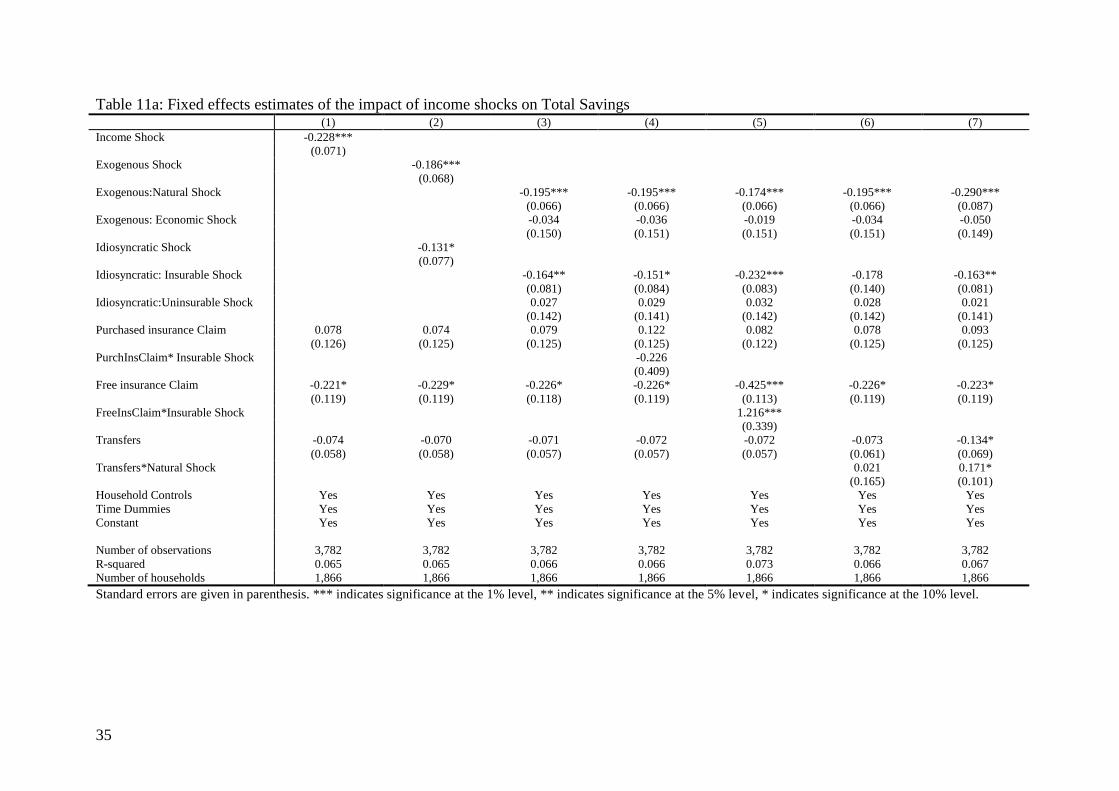
35
Table 11a: Fixed effects estimates of the impact of income shocks on Total Savings (1) (2) (3) (4) (5) (6) (7)
Income Shock -0.228***
(0.071)
Exogenous Shock -0.186***
(0.068)
Exogenous:Natural Shock -0.195*** -0.195*** -0.174*** -0.195*** -0.290***
(0.066) (0.066) (0.066) (0.066) (0.087)
Exogenous: Economic Shock -0.034 -0.036 -0.019 -0.034 -0.050
(0.150) (0.151) (0.151) (0.151) (0.149)
Idiosyncratic Shock -0.131*
(0.077)
Idiosyncratic: Insurable Shock -0.164** -0.151* -0.232*** -0.178 -0.163**
(0.081) (0.084) (0.083) (0.140) (0.081)
Idiosyncratic:Uninsurable Shock 0.027 0.029 0.032 0.028 0.021
(0.142) (0.141) (0.142) (0.142) (0.141)
Purchased insurance Claim 0.078 0.074 0.079 0.122 0.082 0.078 0.093
(0.126) (0.125) (0.125) (0.125) (0.122) (0.125) (0.125)
PurchInsClaim* Insurable Shock -0.226
(0.409)
Free insurance Claim -0.221* -0.229* -0.226* -0.226* -0.425*** -0.226* -0.223*
(0.119) (0.119) (0.118) (0.119) (0.113) (0.119) (0.119)
FreeInsClaim*Insurable Shock 1.216***
(0.339)
Transfers -0.074 -0.070 -0.071 -0.072 -0.072 -0.073 -0.134*
(0.058) (0.058) (0.057) (0.057) (0.057) (0.061) (0.069)
Transfers*Natural Shock 0.021 0.171*
(0.165) (0.101)
Household Controls Yes Yes Yes Yes Yes Yes Yes
Time Dummies Yes Yes Yes Yes Yes Yes Yes
Constant Yes Yes Yes Yes Yes Yes Yes
Number of observations 3,782 3,782 3,782 3,782 3,782 3,782 3,782
R-squared 0.065 0.065 0.066 0.066 0.073 0.066 0.067
Number of households 1,866 1,866 1,866 1,866 1,866 1,866 1,866
Standard errors are given in parenthesis. *** indicates significance at the 1% level, ** indicates significance at the 5% level, * indicates significance at the 10% level.
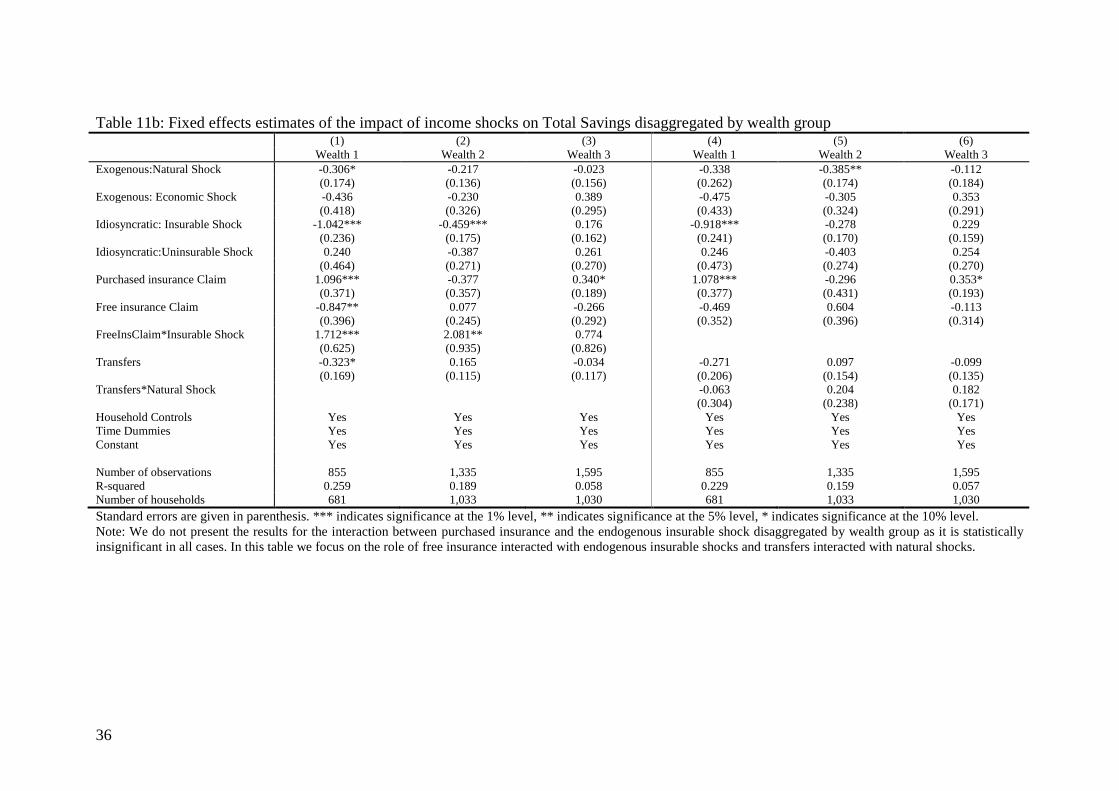
36
Table 11b: Fixed effects estimates of the impact of income shocks on Total Savings disaggregated by wealth group (1) (2) (3) (4) (5) (6)
Wealth 1 Wealth 2 Wealth 3 Wealth 1 Wealth 2 Wealth 3
Exogenous:Natural Shock -0.306* -0.217 -0.023 -0.338 -0.385** -0.112
(0.174) (0.136) (0.156) (0.262) (0.174) (0.184)
Exogenous: Economic Shock -0.436 -0.230 0.389 -0.475 -0.305 0.353
(0.418) (0.326) (0.295) (0.433) (0.324) (0.291)
Idiosyncratic: Insurable Shock -1.042*** -0.459*** 0.176 -0.918*** -0.278 0.229
(0.236) (0.175) (0.162) (0.241) (0.170) (0.159)
Idiosyncratic:Uninsurable Shock 0.240 -0.387 0.261 0.246 -0.403 0.254
(0.464) (0.271) (0.270) (0.473) (0.274) (0.270)
Purchased insurance Claim 1.096*** -0.377 0.340* 1.078*** -0.296 0.353*
(0.371) (0.357) (0.189) (0.377) (0.431) (0.193)
Free insurance Claim -0.847** 0.077 -0.266 -0.469 0.604 -0.113
(0.396) (0.245) (0.292) (0.352) (0.396) (0.314)
FreeInsClaim*Insurable Shock 1.712*** 2.081** 0.774
(0.625) (0.935) (0.826)
Transfers -0.323* 0.165 -0.034 -0.271 0.097 -0.099
(0.169) (0.115) (0.117) (0.206) (0.154) (0.135)
Transfers*Natural Shock -0.063 0.204 0.182
(0.304) (0.238) (0.171)
Household Controls Yes Yes Yes Yes Yes Yes
Time Dummies Yes Yes Yes Yes Yes Yes
Constant Yes Yes Yes Yes Yes Yes
Number of observations 855 1,335 1,595 855 1,335 1,595
R-squared 0.259 0.189 0.058 0.229 0.159 0.057
Number of households 681 1,033 1,030 681 1,033 1,030
Standard errors are given in parenthesis. *** indicates significance at the 1% level, ** indicates significance at the 5% level, * indicates significance at the 10% level.
Note: We do not present the results for the interaction between purchased insurance and the endogenous insurable shock disaggregated by wealth group as it is statistically
insignificant in all cases. In this table we focus on the role of free insurance interacted with endogenous insurable shocks and transfers interacted with natural shocks.
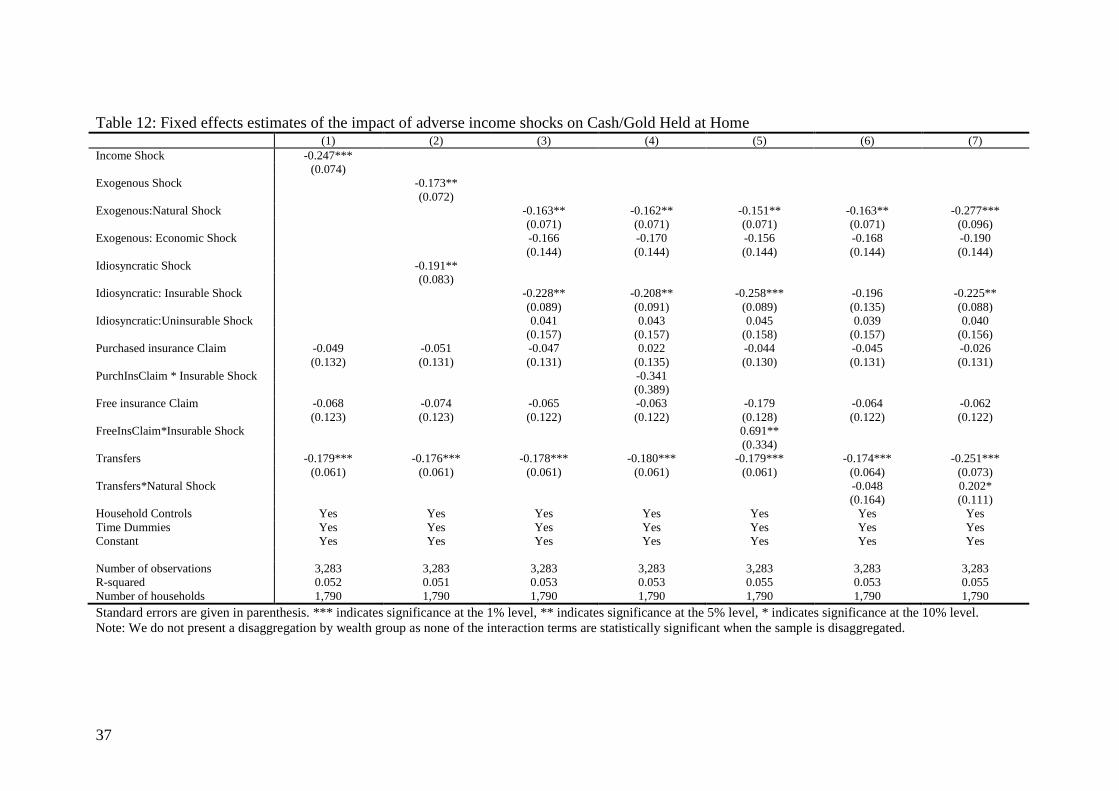
37
Table 12: Fixed effects estimates of the impact of adverse income shocks on Cash/Gold Held at Home (1) (2) (3) (4) (5) (6) (7)
Income Shock -0.247***
(0.074)
Exogenous Shock -0.173**
(0.072)
Exogenous:Natural Shock -0.163** -0.162** -0.151** -0.163** -0.277***
(0.071) (0.071) (0.071) (0.071) (0.096)
Exogenous: Economic Shock -0.166 -0.170 -0.156 -0.168 -0.190
(0.144) (0.144) (0.144) (0.144) (0.144)
Idiosyncratic Shock -0.191**
(0.083)
Idiosyncratic: Insurable Shock -0.228** -0.208** -0.258*** -0.196 -0.225**
(0.089) (0.091) (0.089) (0.135) (0.088)
Idiosyncratic:Uninsurable Shock 0.041 0.043 0.045 0.039 0.040
(0.157) (0.157) (0.158) (0.157) (0.156)
Purchased insurance Claim -0.049 -0.051 -0.047 0.022 -0.044 -0.045 -0.026
(0.132) (0.131) (0.131) (0.135) (0.130) (0.131) (0.131)
PurchInsClaim * Insurable Shock -0.341
(0.389)
Free insurance Claim -0.068 -0.074 -0.065 -0.063 -0.179 -0.064 -0.062
(0.123) (0.123) (0.122) (0.122) (0.128) (0.122) (0.122)
FreeInsClaim*Insurable Shock 0.691**
(0.334)
Transfers -0.179*** -0.176*** -0.178*** -0.180*** -0.179*** -0.174*** -0.251***
(0.061) (0.061) (0.061) (0.061) (0.061) (0.064) (0.073)
Transfers*Natural Shock -0.048 0.202*
(0.164) (0.111)
Household Controls Yes Yes Yes Yes Yes Yes Yes
Time Dummies Yes Yes Yes Yes Yes Yes Yes
Constant Yes Yes Yes Yes Yes Yes Yes
Number of observations 3,283 3,283 3,283 3,283 3,283 3,283 3,283
R-squared 0.052 0.051 0.053 0.053 0.055 0.053 0.055
Number of households 1,790 1,790 1,790 1,790 1,790 1,790 1,790
Standard errors are given in parenthesis. *** indicates significance at the 1% level, ** indicates significance at the 5% level, * indicates significance at the 10% level.
Note: We do not present a disaggregation by wealth group as none of the interaction terms are statistically significant when the sample is disaggregated.
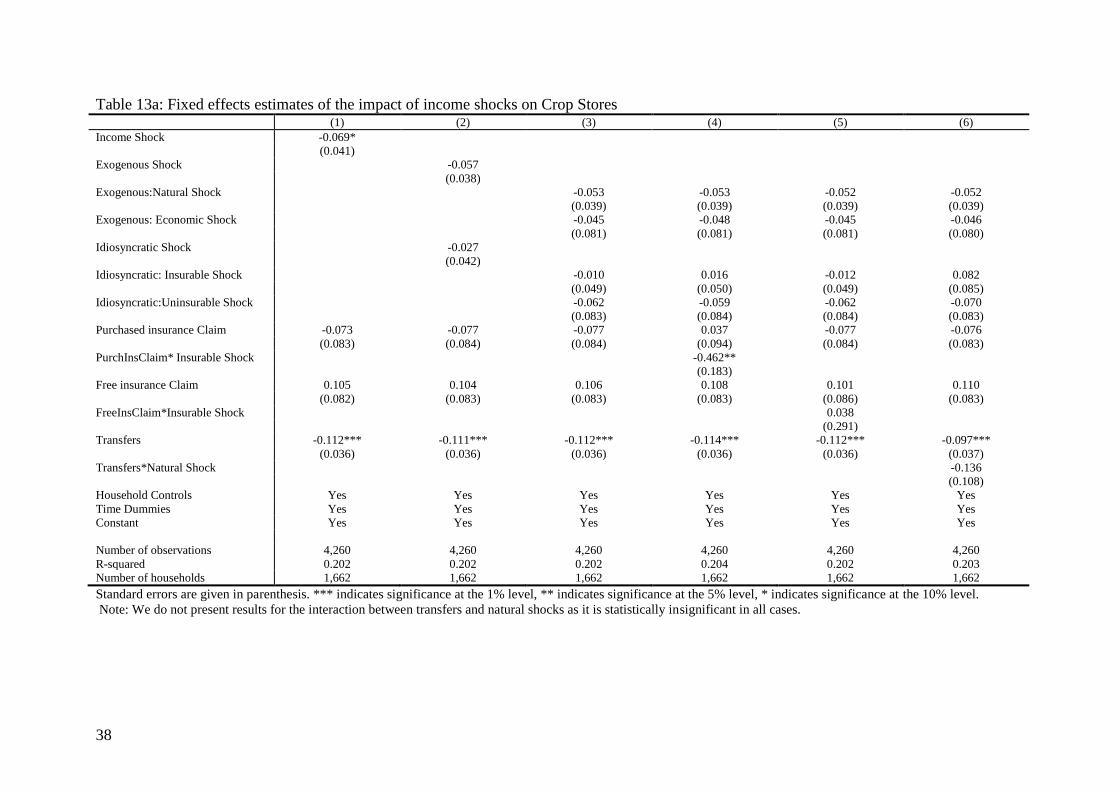
38
Table 13a: Fixed effects estimates of the impact of income shocks on Crop Stores (1) (2) (3) (4) (5) (6)
Income Shock -0.069*
(0.041)
Exogenous Shock -0.057
(0.038)
Exogenous:Natural Shock -0.053 -0.053 -0.052 -0.052
(0.039) (0.039) (0.039) (0.039)
Exogenous: Economic Shock -0.045 -0.048 -0.045 -0.046
(0.081) (0.081) (0.081) (0.080)
Idiosyncratic Shock -0.027
(0.042)
Idiosyncratic: Insurable Shock -0.010 0.016 -0.012 0.082
(0.049) (0.050) (0.049) (0.085)
Idiosyncratic:Uninsurable Shock -0.062 -0.059 -0.062 -0.070
(0.083) (0.084) (0.084) (0.083)
Purchased insurance Claim -0.073 -0.077 -0.077 0.037 -0.077 -0.076
(0.083) (0.084) (0.084) (0.094) (0.084) (0.083)
PurchInsClaim* Insurable Shock -0.462**
(0.183)
Free insurance Claim 0.105 0.104 0.106 0.108 0.101 0.110
(0.082) (0.083) (0.083) (0.083) (0.086) (0.083)
FreeInsClaim*Insurable Shock 0.038
(0.291)
Transfers -0.112*** -0.111*** -0.112*** -0.114*** -0.112*** -0.097***
(0.036) (0.036) (0.036) (0.036) (0.036) (0.037)
Transfers*Natural Shock -0.136
(0.108)
Household Controls Yes Yes Yes Yes Yes Yes
Time Dummies Yes Yes Yes Yes Yes Yes
Constant Yes Yes Yes Yes Yes Yes
Number of observations 4,260 4,260 4,260 4,260 4,260 4,260
R-squared 0.202 0.202 0.202 0.204 0.202 0.203
Number of households 1,662 1,662 1,662 1,662 1,662 1,662
Standard errors are given in parenthesis. *** indicates significance at the 1% level, ** indicates significance at the 5% level, * indicates significance at the 10% level.
Note: We do not present results for the interaction between transfers and natural shocks as it is statistically insignificant in all cases.

39
Table 13b: Fixed effects estimates of the impact of income shocks on Crop Stores disaggregated by wealth group (1) (2) (3) (4) (5) (6)
Wealth 1 Wealth 2 Wealth 3 Wealth 1 Wealth 2 Wealth 3
Exogenous:Natural Shock -0.059 0.013 -0.250* -0.063 0.008 -0.242
(0.084) (0.074) (0.150) (0.085) (0.075) (0.152)
Exogenous: Economic Shock 0.050 -0.175 0.118 0.078 -0.180 0.190
(0.221) (0.133) (0.316) (0.221) (0.133) (0.309)
Idiosyncratic: Insurable Shock -0.075 0.053 -0.164 -0.060 0.050 -0.276*
(0.112) (0.090) (0.166) (0.103) (0.092) (0.163)
Idiosyncratic:Uninsurable Shock 0.116 -0.379** -0.138 0.110 -0.390** -0.124
(0.144) (0.164) (0.228) (0.144) (0.165) (0.224)
Purchased insurance Claim 0.080 -0.081 0.229 0.008 -0.155 0.024
(0.179) (0.206) (0.255) (0.177) (0.193) (0.256)
PurchInsClaim * Insurable Shock -0.257 -0.372 -1.246***
(0.364) (0.517) (0.455)
Free insurance Claim -0.003 0.769*** -0.245 0.098 0.796*** -0.331
(0.162) (0.193) (0.350) (0.158) (0.220) (0.378)
FreeInsClaim *Insurable Shock -0.860 -0.146 0.892*
(0.604) (0.348) (0.518)
Transfers -0.093 0.106 -0.303** -0.084 0.113 -0.297**
(0.073) (0.070) (0.122) (0.073) (0.070) (0.124)
Household Controls Yes Yes Yes Yes Yes Yes
Time Dummies Yes Yes Yes Yes Yes Yes
Constant Yes Yes Yes Yes Yes Yes
Number of observations 1,476 1,579 1,205 1,476 1,579 1,205
R-squared 0.224 0.293 0.240 0.231 0.293 0.234
Number of households 918 1,060 862 918 1,060 862
Standard errors are given in parenthesis. *** indicates significance at the 1% level, ** indicates significance at the 5% level, * indicates significance at the 10% level.
Note: We do not present the results for the interaction between transfers and endogenous insurable shocks as it is statistically insignificant in all cases.
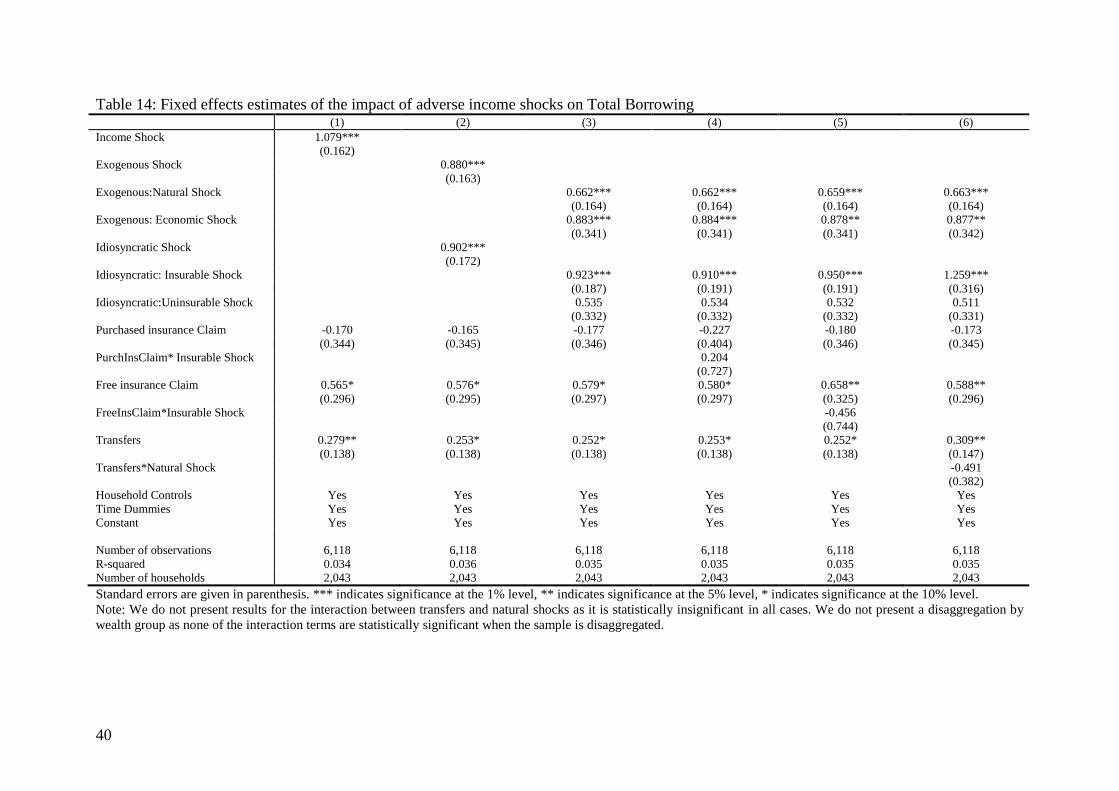
40
Table 14: Fixed effects estimates of the impact of adverse income shocks on Total Borrowing (1) (2) (3) (4) (5) (6)
Income Shock 1.079***
(0.162)
Exogenous Shock 0.880***
(0.163)
Exogenous:Natural Shock 0.662*** 0.662*** 0.659*** 0.663***
(0.164) (0.164) (0.164) (0.164)
Exogenous: Economic Shock 0.883*** 0.884*** 0.878** 0.877**
(0.341) (0.341) (0.341) (0.342)
Idiosyncratic Shock 0.902***
(0.172)
Idiosyncratic: Insurable Shock 0.923*** 0.910*** 0.950*** 1.259***
(0.187) (0.191) (0.191) (0.316)
Idiosyncratic:Uninsurable Shock 0.535 0.534 0.532 0.511
(0.332) (0.332) (0.332) (0.331)
Purchased insurance Claim -0.170 -0.165 -0.177 -0.227 -0.180 -0.173
(0.344) (0.345) (0.346) (0.404) (0.346) (0.345)
PurchInsClaim* Insurable Shock 0.204
(0.727)
Free insurance Claim 0.565* 0.576* 0.579* 0.580* 0.658** 0.588**
(0.296) (0.295) (0.297) (0.297) (0.325) (0.296)
FreeInsClaim*Insurable Shock -0.456
(0.744)
Transfers 0.279** 0.253* 0.252* 0.253* 0.252* 0.309**
(0.138) (0.138) (0.138) (0.138) (0.138) (0.147)
Transfers*Natural Shock -0.491
(0.382)
Household Controls Yes Yes Yes Yes Yes Yes
Time Dummies Yes Yes Yes Yes Yes Yes
Constant Yes Yes Yes Yes Yes Yes
Number of observations 6,118 6,118 6,118 6,118 6,118 6,118
R-squared 0.034 0.036 0.035 0.035 0.035 0.035
Number of households 2,043 2,043 2,043 2,043 2,043 2,043
Standard errors are given in parenthesis. *** indicates significance at the 1% level, ** indicates significance at the 5% level, * indicates significance at the 10% level.
Note: We do not present results for the interaction between transfers and natural shocks as it is statistically insignificant in all cases. We do not present a disaggregation by
wealth group as none of the interaction terms are statistically significant when the sample is disaggregated.
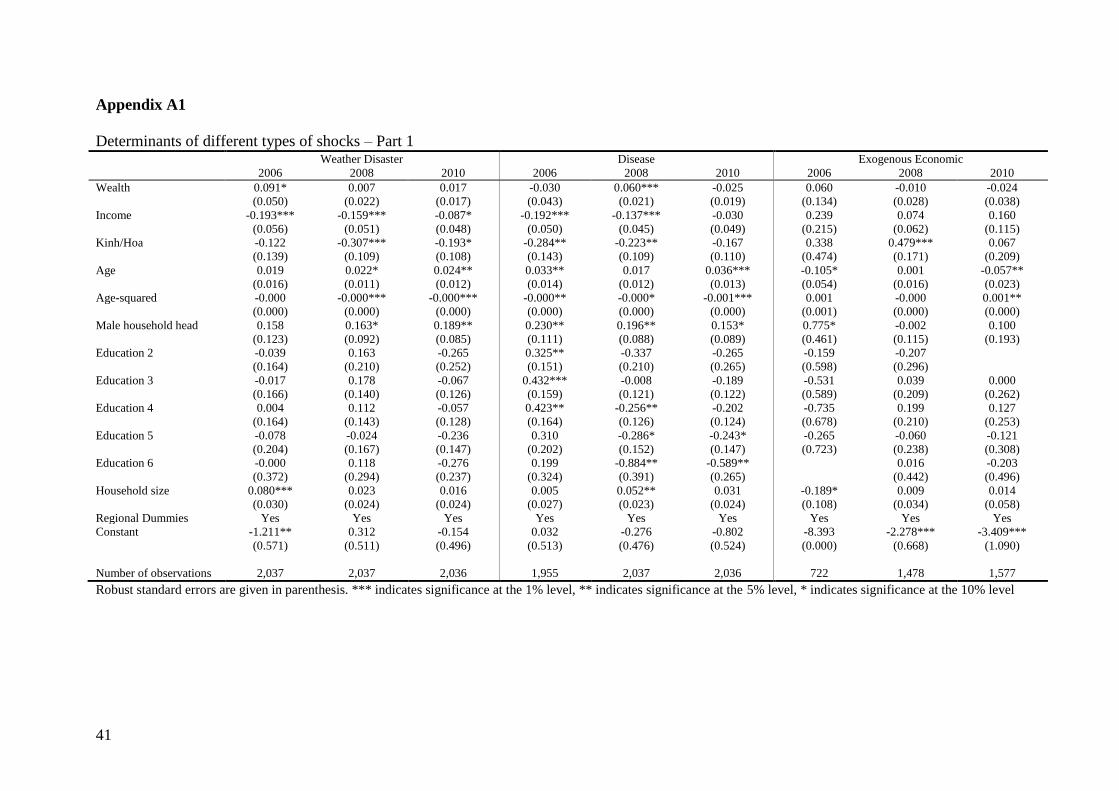
41
Appendix A1
Determinants of different types of shocks – Part 1 Weather Disaster Disease Exogenous Economic
2006 2008 2010 2006 2008 2010 2006 2008 2010
Wealth 0.091* 0.007 0.017 -0.030 0.060*** -0.025 0.060 -0.010 -0.024
(0.050) (0.022) (0.017) (0.043) (0.021) (0.019) (0.134) (0.028) (0.038)
Income -0.193*** -0.159*** -0.087* -0.192*** -0.137*** -0.030 0.239 0.074 0.160
(0.056) (0.051) (0.048) (0.050) (0.045) (0.049) (0.215) (0.062) (0.115)
Kinh/Hoa -0.122 -0.307*** -0.193* -0.284** -0.223** -0.167 0.338 0.479*** 0.067
(0.139) (0.109) (0.108) (0.143) (0.109) (0.110) (0.474) (0.171) (0.209)
Age 0.019 0.022* 0.024** 0.033** 0.017 0.036*** -0.105* 0.001 -0.057**
(0.016) (0.011) (0.012) (0.014) (0.012) (0.013) (0.054) (0.016) (0.023)
Age-squared -0.000 -0.000*** -0.000*** -0.000** -0.000* -0.001*** 0.001 -0.000 0.001**
(0.000) (0.000) (0.000) (0.000) (0.000) (0.000) (0.001) (0.000) (0.000)
Male household head 0.158 0.163* 0.189** 0.230** 0.196** 0.153* 0.775* -0.002 0.100
(0.123) (0.092) (0.085) (0.111) (0.088) (0.089) (0.461) (0.115) (0.193)
Education 2 -0.039 0.163 -0.265 0.325** -0.337 -0.265 -0.159 -0.207
(0.164) (0.210) (0.252) (0.151) (0.210) (0.265) (0.598) (0.296)
Education 3 -0.017 0.178 -0.067 0.432*** -0.008 -0.189 -0.531 0.039 0.000
(0.166) (0.140) (0.126) (0.159) (0.121) (0.122) (0.589) (0.209) (0.262)
Education 4 0.004 0.112 -0.057 0.423** -0.256** -0.202 -0.735 0.199 0.127
(0.164) (0.143) (0.128) (0.164) (0.126) (0.124) (0.678) (0.210) (0.253)
Education 5 -0.078 -0.024 -0.236 0.310 -0.286* -0.243* -0.265 -0.060 -0.121
(0.204) (0.167) (0.147) (0.202) (0.152) (0.147) (0.723) (0.238) (0.308)
Education 6 -0.000 0.118 -0.276 0.199 -0.884** -0.589** 0.016 -0.203
(0.372) (0.294) (0.237) (0.324) (0.391) (0.265) (0.442) (0.496)
Household size 0.080*** 0.023 0.016 0.005 0.052** 0.031 -0.189* 0.009 0.014
(0.030) (0.024) (0.024) (0.027) (0.023) (0.024) (0.108) (0.034) (0.058)
Regional Dummies Yes Yes Yes Yes Yes Yes Yes Yes Yes
Constant -1.211** 0.312 -0.154 0.032 -0.276 -0.802 -8.393 -2.278*** -3.409***
(0.571) (0.511) (0.496) (0.513) (0.476) (0.524) (0.000) (0.668) (1.090)
Number of observations 2,037 2,037 2,036 1,955 2,037 2,036 722 1,478 1,577
Robust standard errors are given in parenthesis. *** indicates significance at the 1% level, ** indicates significance at the 5% level, * indicates significance at the 10% level
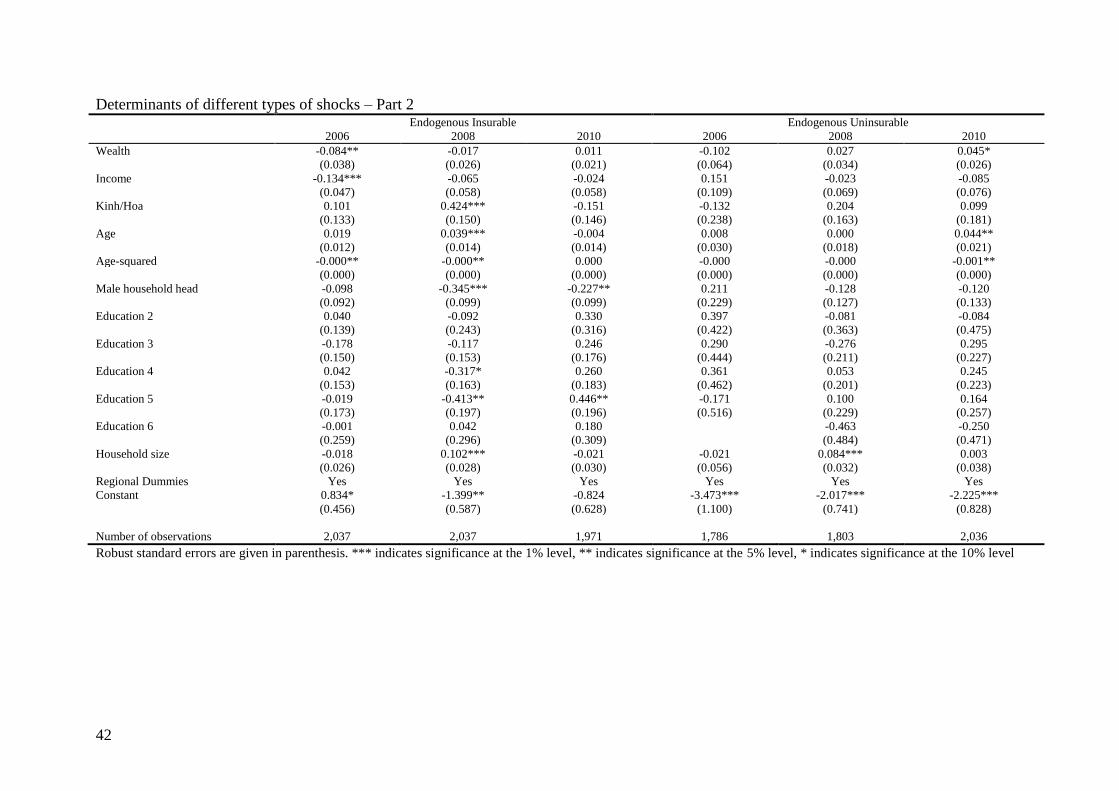
42
Determinants of different types of shocks – Part 2 Endogenous Insurable Endogenous Uninsurable
2006 2008 2010 2006 2008 2010
Wealth -0.084** -0.017 0.011 -0.102 0.027 0.045*
(0.038) (0.026) (0.021) (0.064) (0.034) (0.026)
Income -0.134*** -0.065 -0.024 0.151 -0.023 -0.085
(0.047) (0.058) (0.058) (0.109) (0.069) (0.076)
Kinh/Hoa 0.101 0.424*** -0.151 -0.132 0.204 0.099
(0.133) (0.150) (0.146) (0.238) (0.163) (0.181)
Age 0.019 0.039*** -0.004 0.008 0.000 0.044**
(0.012) (0.014) (0.014) (0.030) (0.018) (0.021)
Age-squared -0.000** -0.000** 0.000 -0.000 -0.000 -0.001**
(0.000) (0.000) (0.000) (0.000) (0.000) (0.000)
Male household head -0.098 -0.345*** -0.227** 0.211 -0.128 -0.120
(0.092) (0.099) (0.099) (0.229) (0.127) (0.133)
Education 2 0.040 -0.092 0.330 0.397 -0.081 -0.084
(0.139) (0.243) (0.316) (0.422) (0.363) (0.475)
Education 3 -0.178 -0.117 0.246 0.290 -0.276 0.295
(0.150) (0.153) (0.176) (0.444) (0.211) (0.227)
Education 4 0.042 -0.317* 0.260 0.361 0.053 0.245
(0.153) (0.163) (0.183) (0.462) (0.201) (0.223)
Education 5 -0.019 -0.413** 0.446** -0.171 0.100 0.164
(0.173) (0.197) (0.196) (0.516) (0.229) (0.257)
Education 6 -0.001 0.042 0.180 -0.463 -0.250
(0.259) (0.296) (0.309) (0.484) (0.471)
Household size -0.018 0.102*** -0.021 -0.021 0.084*** 0.003
(0.026) (0.028) (0.030) (0.056) (0.032) (0.038)
Regional Dummies Yes Yes Yes Yes Yes Yes
Constant 0.834* -1.399** -0.824 -3.473*** -2.017*** -2.225***
(0.456) (0.587) (0.628) (1.100) (0.741) (0.828)
Number of observations 2,037 2,037 1,971 1,786 1,803 2,036
Robust standard errors are given in parenthesis. *** indicates significance at the 1% level, ** indicates significance at the 5% level, * indicates significance at the 10% level
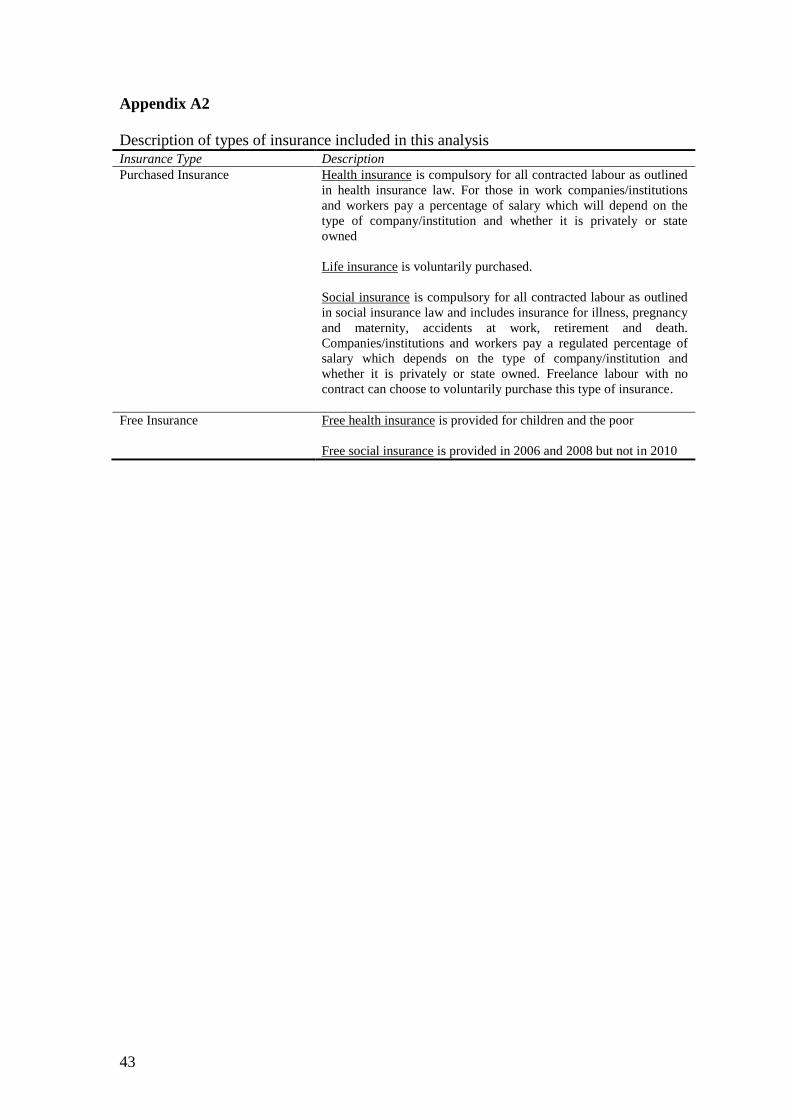
43
Appendix A2
Description of types of insurance included in this analysis Insurance Type Description
Purchased Insurance Health insurance is compulsory for all contracted labour as outlined
in health insurance law. For those in work companies/institutions
and workers pay a percentage of salary which will depend on the
type of company/institution and whether it is privately or state
owned
Life insurance is voluntarily purchased.
Social insurance is compulsory for all contracted labour as outlined
in social insurance law and includes insurance for illness, pregnancy
and maternity, accidents at work, retirement and death.
Companies/institutions and workers pay a regulated percentage of
salary which depends on the type of company/institution and
whether it is privately or state owned. Freelance labour with no
contract can choose to voluntarily purchase this type of insurance.
Free Insurance Free health insurance is provided for children and the poor
Free social insurance is provided in 2006 and 2008 but not in 2010
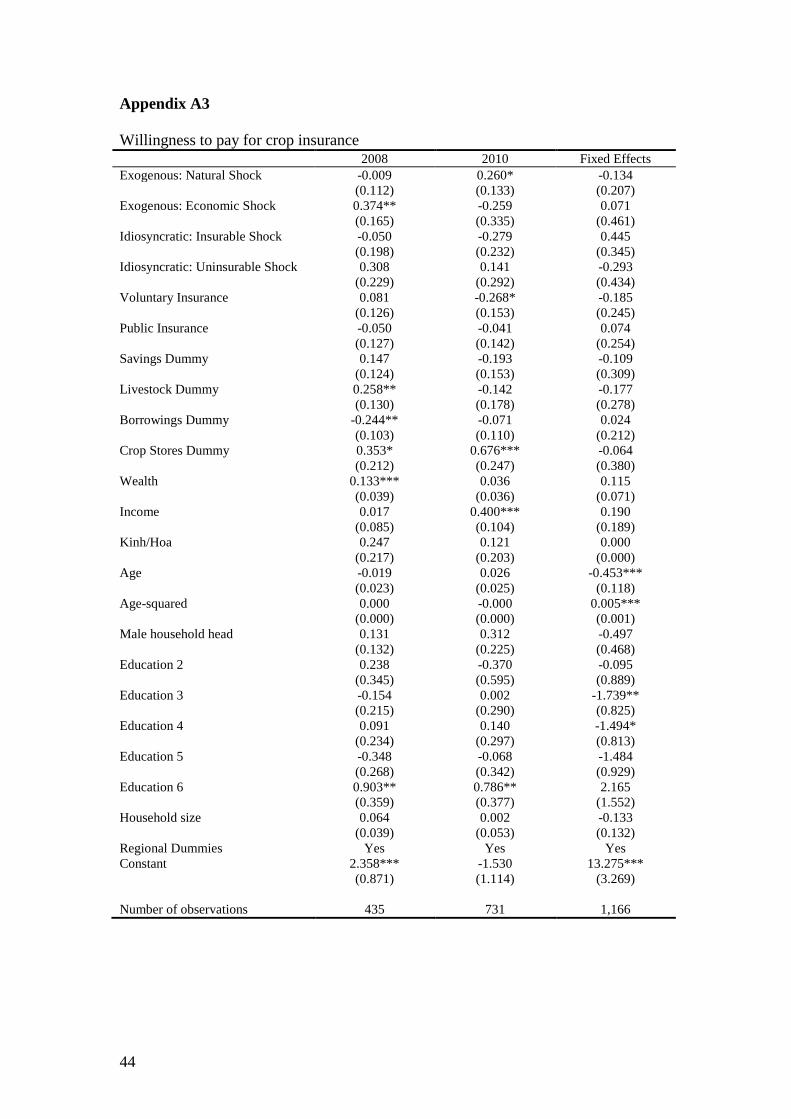
44
Appendix A3
Willingness to pay for crop insurance 2008 2010 Fixed Effects
Exogenous: Natural Shock -0.009 0.260* -0.134
(0.112) (0.133) (0.207)
Exogenous: Economic Shock 0.374** -0.259 0.071
(0.165) (0.335) (0.461)
Idiosyncratic: Insurable Shock -0.050 -0.279 0.445
(0.198) (0.232) (0.345)
Idiosyncratic: Uninsurable Shock 0.308 0.141 -0.293
(0.229) (0.292) (0.434)
Voluntary Insurance 0.081 -0.268* -0.185
(0.126) (0.153) (0.245)
Public Insurance -0.050 -0.041 0.074
(0.127) (0.142) (0.254)
Savings Dummy 0.147 -0.193 -0.109
(0.124) (0.153) (0.309)
Livestock Dummy 0.258** -0.142 -0.177
(0.130) (0.178) (0.278)
Borrowings Dummy -0.244** -0.071 0.024
(0.103) (0.110) (0.212)
Crop Stores Dummy 0.353* 0.676*** -0.064
(0.212) (0.247) (0.380)
Wealth 0.133*** 0.036 0.115
(0.039) (0.036) (0.071)
Income 0.017 0.400*** 0.190
(0.085) (0.104) (0.189)
Kinh/Hoa 0.247 0.121 0.000
(0.217) (0.203) (0.000)
Age -0.019 0.026 -0.453***
(0.023) (0.025) (0.118)
Age-squared 0.000 -0.000 0.005***
(0.000) (0.000) (0.001)
Male household head 0.131 0.312 -0.497
(0.132) (0.225) (0.468)
Education 2 0.238 -0.370 -0.095
(0.345) (0.595) (0.889)
Education 3 -0.154 0.002 -1.739**
(0.215) (0.290) (0.825)
Education 4 0.091 0.140 -1.494*
(0.234) (0.297) (0.813)
Education 5 -0.348 -0.068 -1.484
(0.268) (0.342) (0.929)
Education 6 0.903** 0.786** 2.165
(0.359) (0.377) (1.552)
Household size 0.064 0.002 -0.133
(0.039) (0.053) (0.132)
Regional Dummies Yes Yes Yes
Constant 2.358*** -1.530 13.275***
(0.871) (1.114) (3.269)
Number of observations 435 731 1,166