Embed Size (px)
Citation preview
AC 2008-922: INCORPORATING LABVIEW TO ENHANCE THE LEARNINGEXPERIENCE IN THE ELECTROMECHANICAL ANALYSIS LABORATORY
Rocio Alba-Flores, Alfred State CollegeRocio Alba-Flores received her M.S. and Ph.D. in Electrical Engineering from Tulane University.She is an Assistant Professor in the Electrical Engineering Technology Department at the StateUniversity of New York, Alfred. Her main areas of interest include control systems, robotics,digital systems, microprocessors, and signal and image processing.
David Hunt, State University of New York, AlfredDavid J. Hunt (M’97) was born and raised in rural western New York. He attended Alfred StateCollege from 1989-93, receiving his B.S. in electrical engineering technology in 1993. He did hisgraduate work at Alfred University from 1996-98, receiving his M.S. in electrical engineering in1998. His graduate thesis was “RF Plasma Deposition of Magnesium-Aluminum Oxide.” Prof.Hunt has worked at Alfred State College in the Electrical Engineering Technology Departmentsince 1998.
© American Society for Engineering Education, 2008
Page 13.734.1
Incorporating LabVIEW to enhance the learning experience in the
Electromechanical Analysis Laboratory
Abstract
This paper describes our experiences in incorporating data acquisition and virtual instruments in
the Electromechanical Analysis Laboratory to promote hands-on and real-world experiences to
students enrolled in the mechanical and the electromechanical engineering technology programs
at the State University of New York, Alfred. Because the students taking this course come from
two different backgrounds, mechanical engineering technology and electrical engineering
technology, the incorporation of virtual instruments has helped to balance the difference in the
backgrounds. The paper describes in detail how the experiments have been organized to ensure
that students from both backgrounds acquire the knowledge and skills in the mechanical and the
electrical components of the course.
Introduction
The present work describes our experiences in incorporating LabVIEW® in laboratory
experiments to help enhance the learning experience for the Electromechanical Analysis (EMA)
course in the Engineering Technology Department. The EMA course is a sophomore level
course, required for students enrolled in both the Mechanical Engineering Technology and the
Electromechanical Engineering Technology programs at the State University of New York,
Alfred. The EMA course presents an integrating experience of mechanisms and instrumentation.
This course emphasizes applications of material learned in courses involving statics, dynamics
and strength of materials and introduces students to vibrations. The integration of these subjects
is enhanced through laboratory experiments where students study different mechanisms with the
aid of transducers and electronic instrumentation. The material covered in the lectures include
the study of levers, links, slide mechanisms, cams, scotch yoke and the principles of force,
torque, velocity, acceleration, inertia and friction. The laboratory covers techniques of
instrumentation for research and development and automation including set-up and calibration of
transducers, readouts of electrical signals and data acquisition.
Since the Mechanical Engineering Technology program is offered by the Mechanical
Engineering Technology (MET) Department, and the Electromechanical Engineering
Technology program is offered by the Electrical Engineering Technology (EET) Department,
students taking the EMA course come from two very different backgrounds. Because of this,
students from the MET department have little or no knowledge and skills in measurement of
electrical signals, however, they have a more solid background in statics, dynamics and strength
of materials. On the other hand, students from the EET department lack knowledge and skills in
statics, dynamics and strength of materials, but are skillful in the measurement and principles of
electrical signals.
To balance this difference, the lectures and laboratory material have been carefully planned. To
enhance the learning process, the EMA course is a team taught course where the lecture is taught
by a MET faculty member, and the laboratory is taught by an EET faculty member. The
laboratory experience has been organized in such a way that students from both backgrounds will
Page 13.734.2
share strengths and experiences that will help each other to better learn the subject. As part of
these changes, data acquisition boards and LabVIEW®
software have been incorporated in the
EMA laboratory, substituting the traditional electronic equipment, such as, oscilloscopes, digital
multimeters, signal generators and signal conditioning circuits (such as electronic amplifiers and
filters). This change has been greatly welcomed by the MET students, who find the virtual
instruments more appealing to their knowledge and skills. On the other hand, the EET students
have also received very well the use of data acquisition and virtual instruments, since it offers a
new and interesting way of doing measurement of electrical signals.
Importance of Virtual Instruments.
Virtual instruments are flexible tools that promote hands-on and real-world experiences to
engineering students. Nowadays, virtual instruments are common in industry, and many
companies continue to invest in the virtual instrument concept because the cost of laboratory
equipment is significantly reduced with virtual instruments. By using virtual instruments,
companies easily modify testing, measurement, and control procedures without the need for
purchasing additional equipment. Therefore, students with skills in virtual instruments are better
prepared to meet the demands of industry 1,2,3
.
Virtual instruments can help to enhance engineering education in a variety of undergraduate
laboratory settings and can be adapted for different learning levels and environments. As
reported in the literature 4,5,6
, virtual instruments offer versatility in measurement and the
development of laboratory procedures as well as emulate industry standard practices. A virtual
instrument can be easily modified to create an individualized laboratory experience based on the
skills and knowledge of students while maintaining the fundamentals of the experiments. One of
the most desirable technical skills of engineering technology graduates is the ability to conduct
and design experiments (ABET Engineering Criteria c) .
Course Format and Description
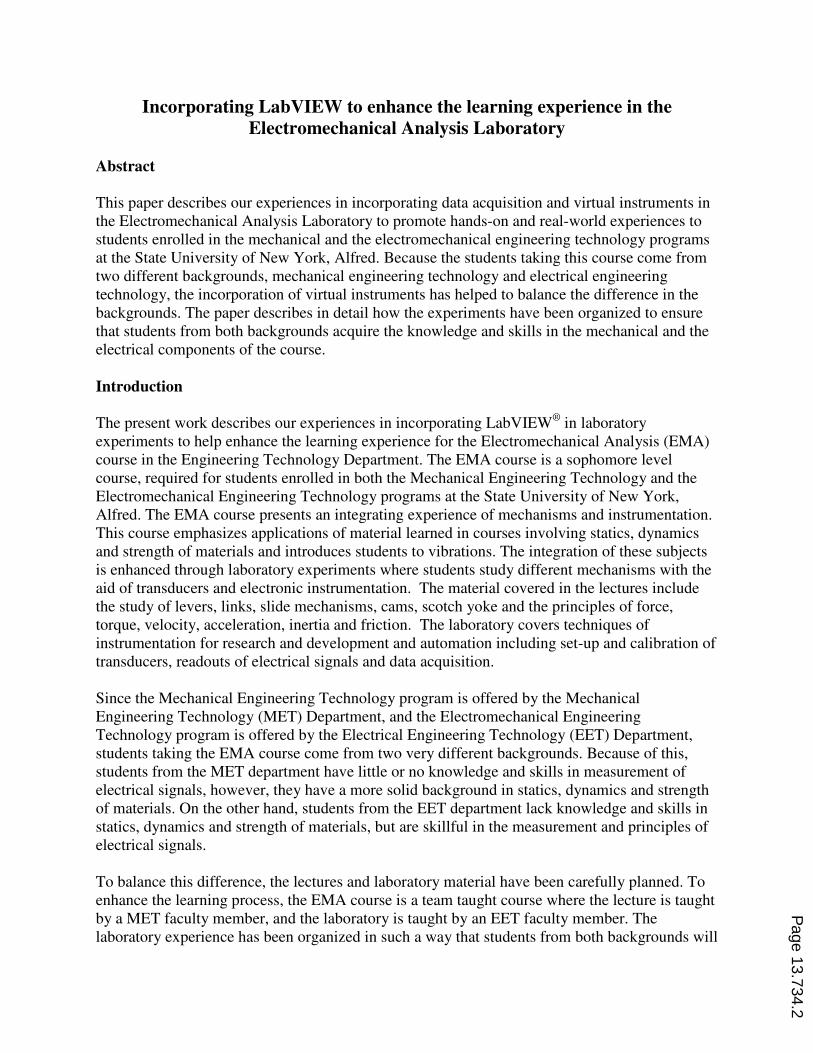
The Electromechanical Analysis course is a four-credit course that meets for three one-hour
lectures and one two-hour laboratory per week. The course learning objectives are shown in
Table 1. The EMA course is team taught, the lectures are taught by a MET faculty member and
the laboratory is taught by an EET faculty member. The topics covered in the lectures mainly
involve theoretical analysis of statics, dynamics, and strength of materials. A summary of the
topics covered in the lectures is given in Table 2.
Course Learning Objectives
• Apply basic methods of statics, dynamics and kinematic analysis
• Analyze the characteristics of common mechanisms
• Be able to work with, describe and use the common types of mechanical to electrical
transducers used in this course
• Be familiar with signal conditioning concepts, data acquisition, collection, and
interpretation from different transducer sources
Table 1. Course Learning Objectives
Page 13.734.3
Lecture Topics
• Static equilibrium. Free Body Diagrams. Elasticity
• Mechanics of materials. Rotation about a fixed axis.
• Mass moment of inertia
• Kinematics. Geometry of motion
• Position, velocity and acceleration
• Work and Kinetic Energy
• Vibrations
Table 2. Lecture Topics
The electrical aspects of the course are completely covered in the laboratory sessions. The topics
covered in the laboratory are related to instrumentation, transducers, electrical measurements and
data acquisition. Table 3 shows a list of typical laboratory experiments.
Introductory Labs 5 Weeks
Introduction to Electrical Measurements 7 basic stations
Introduction to Signal Conditioning Circuits 7 basic stations
Introduction to LabVIEW & Data Acquisition 7 basic stations
Lab Rotation A – Basic Applications 3 Weeks
Static Weight Scale Measurements 2 stations
Force Measurements 2 stations
Angular Displacement Measurements 2 stations
Lab Rotation B – Advanced Applications 6 Weeks
Flywheel Characteristics 1 station
Scotch Yoke Analysis 1 station
Center of Percussion 1 station
Punch Press Analysis 1 station
Linear Vibration Analysis 1 station
Cam Analysis 1 station
Table 3. EMA Laboratory Experiments
Details of the course topics, including laboratory handouts are linked to the course website 7.
The Electromechanical Analysis Laboratory
As mentioned before, the EMA course is a required course for students enrolled in both, the
Mechanical Engineering Technology (MET) and the Electromechanical Engineering Technology
programs (the latter being part of the Electrical Engineering Technology, EET, Department).
Usually the number of MET students is significantly larger than the EET students (80% or more
are MET students), therefore to ensure some heterogeneity in the laboratory teams, the lab
instructor assigns each student to a team (two to three students per team). Furthermore, to expose
students more to team setups, the instructor will reassign teams two or three times during the
semester.
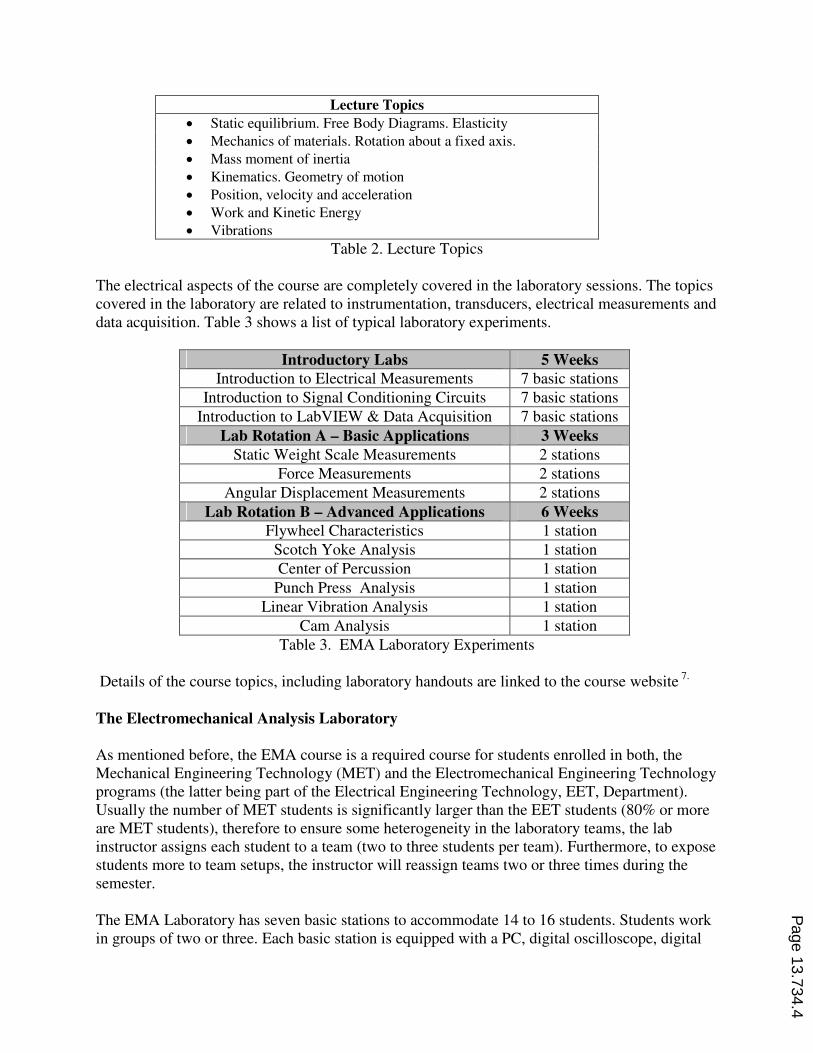
The EMA Laboratory has seven basic stations to accommodate 14 to 16 students. Students work
in groups of two or three. Each basic station is equipped with a PC, digital oscilloscope, digital
Page 13.734.4
multimeter, power supply, function generator and data acquisition board. The data acquisition
hardware and software is the NI PCI-6024E from National Instruments (200kS/s, 12 bit, 16-
Analog-Input, 8 digital I/O lines, two 24-bit counters) and LabVIEW® 7.1. Figure 1 shows a
basic EMA Lab station.
Figure 1 - Basic Electromechanical Analysis Lab Station
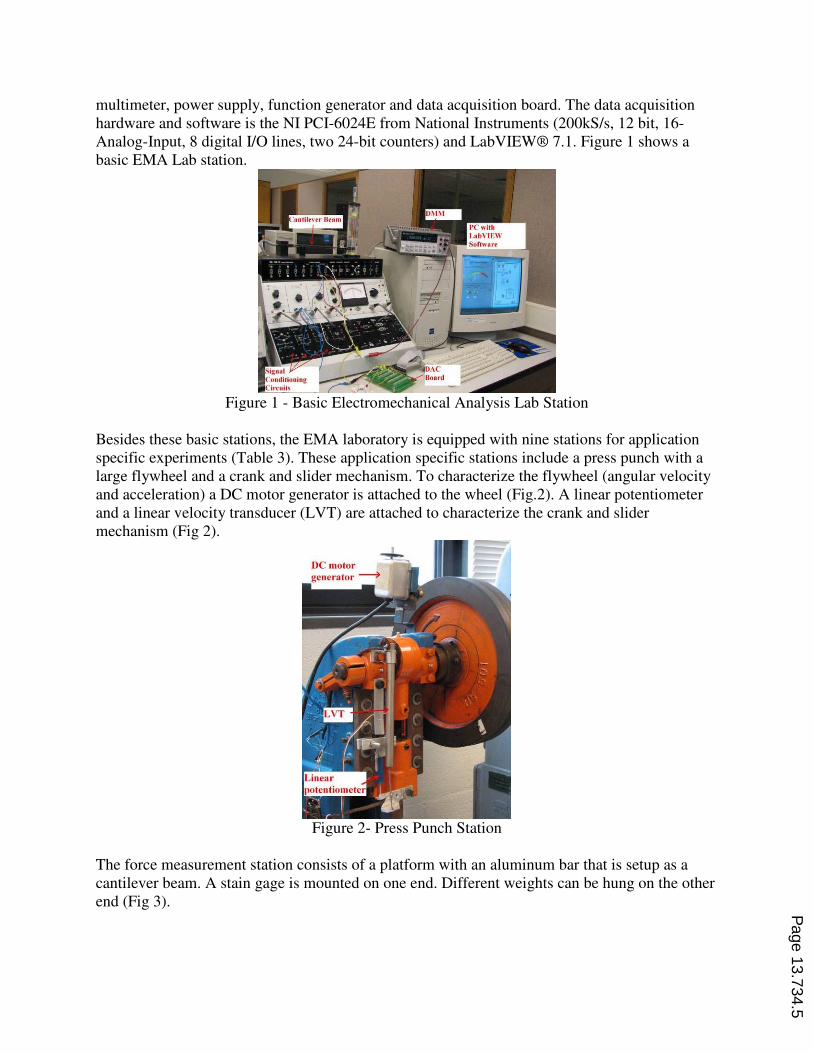
Besides these basic stations, the EMA laboratory is equipped with nine stations for application
specific experiments (Table 3). These application specific stations include a press punch with a
large flywheel and a crank and slider mechanism. To characterize the flywheel (angular velocity
and acceleration) a DC motor generator is attached to the wheel (Fig.2). A linear potentiometer
and a linear velocity transducer (LVT) are attached to characterize the crank and slider
mechanism (Fig 2).
Figure 2- Press Punch Station
The force measurement station consists of a platform with an aluminum bar that is setup as a
cantilever beam. A stain gage is mounted on one end. Different weights can be hung on the other
end (Fig 3). Page 13.734.5
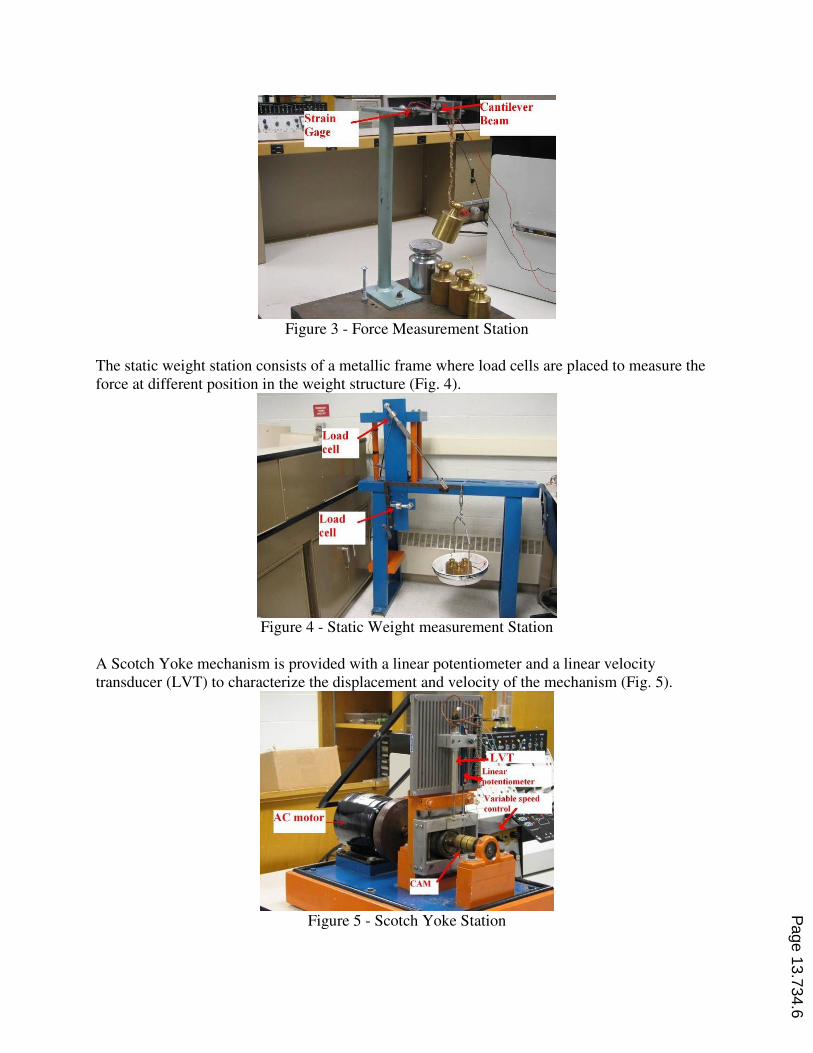
Figure 3 - Force Measurement Station
The static weight station consists of a metallic frame where load cells are placed to measure the
force at different position in the weight structure (Fig. 4).
Figure 4 - Static Weight measurement Station
A Scotch Yoke mechanism is provided with a linear potentiometer and a linear velocity
transducer (LVT) to characterize the displacement and velocity of the mechanism (Fig. 5).
Figure 5 - Scotch Yoke Station
Page 13.734.6
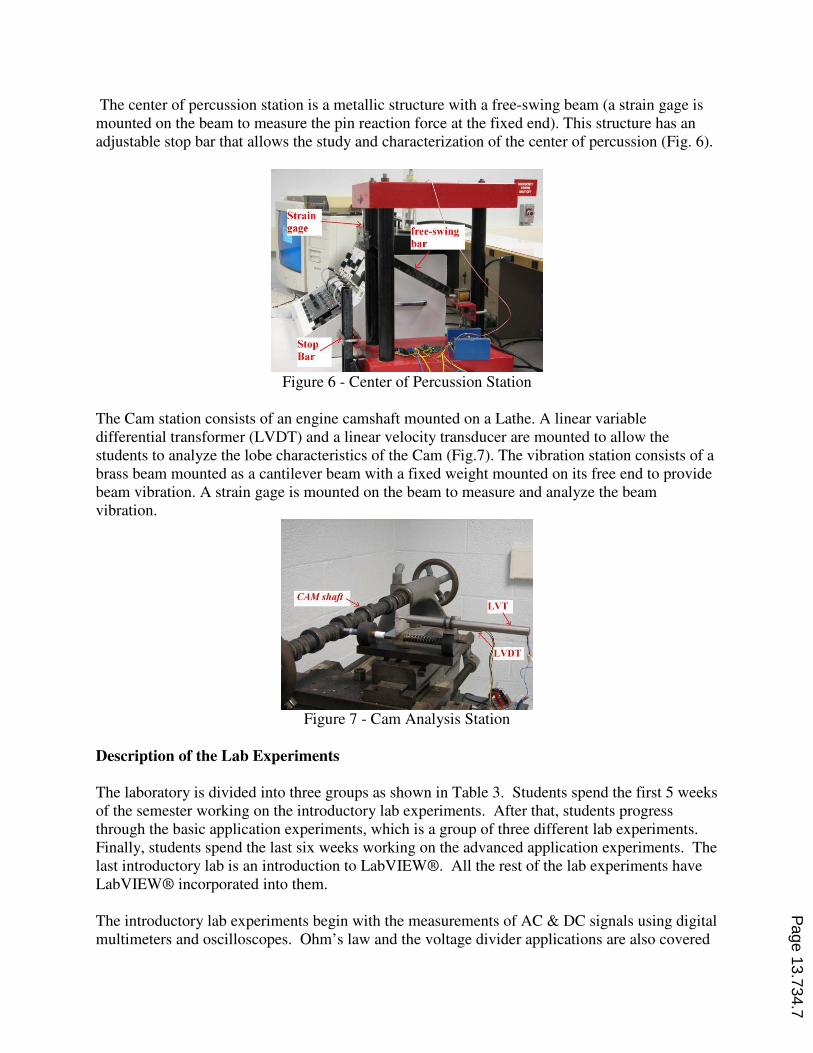
The center of percussion station is a metallic structure with a free-swing beam (a strain gage is
mounted on the beam to measure the pin reaction force at the fixed end). This structure has an
adjustable stop bar that allows the study and characterization of the center of percussion (Fig. 6).
Figure 6 - Center of Percussion Station
The Cam station consists of an engine camshaft mounted on a Lathe. A linear variable
differential transformer (LVDT) and a linear velocity transducer are mounted to allow the
students to analyze the lobe characteristics of the Cam (Fig.7). The vibration station consists of a
brass beam mounted as a cantilever beam with a fixed weight mounted on its free end to provide
beam vibration. A strain gage is mounted on the beam to measure and analyze the beam
vibration.
Figure 7 - Cam Analysis Station
Description of the Lab Experiments
The laboratory is divided into three groups as shown in Table 3. Students spend the first 5 weeks
of the semester working on the introductory lab experiments. After that, students progress
through the basic application experiments, which is a group of three different lab experiments.
Finally, students spend the last six weeks working on the advanced application experiments. The
last introductory lab is an introduction to LabVIEW®. All the rest of the lab experiments have
LabVIEW® incorporated into them.
The introductory lab experiments begin with the measurements of AC & DC signals using digital
multimeters and oscilloscopes. Ohm’s law and the voltage divider applications are also covered
Page 13.734.7
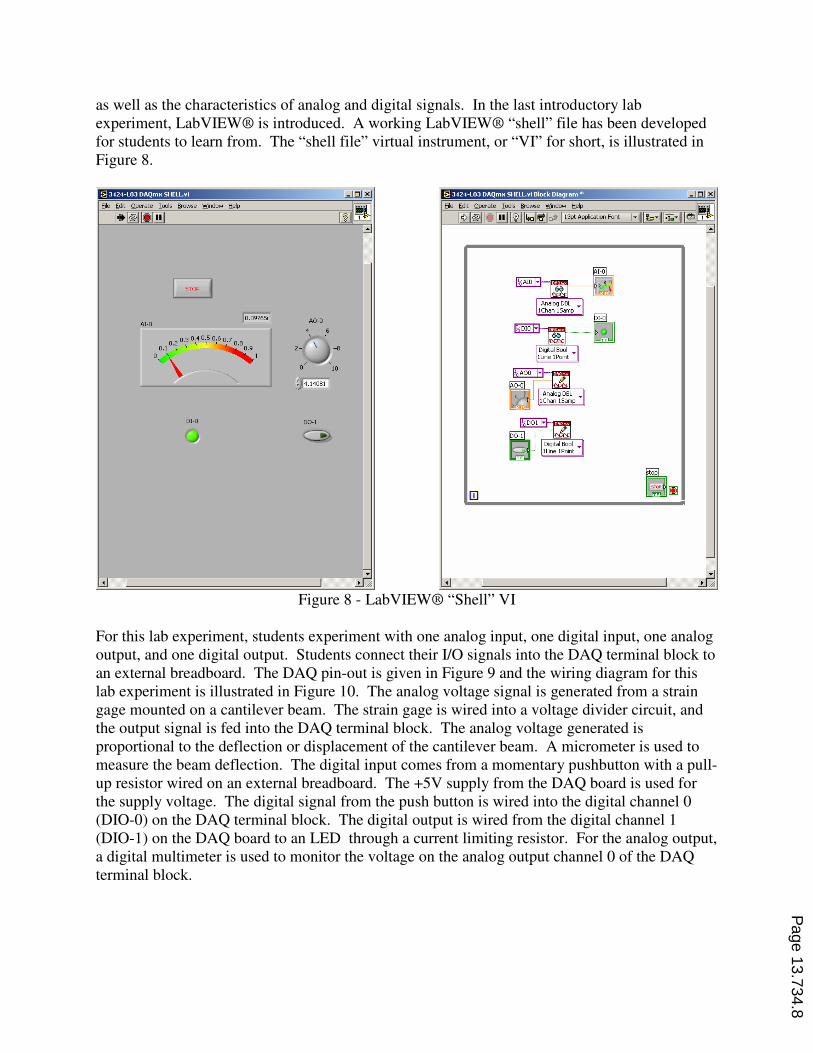
as well as the characteristics of analog and digital signals. In the last introductory lab
experiment, LabVIEW® is introduced. A working LabVIEW® “shell” file has been developed
for students to learn from. The “shell file” virtual instrument, or “VI” for short, is illustrated in
Figure 8.
Figure 8 - LabVIEW® “Shell” VI
For this lab experiment, students experiment with one analog input, one digital input, one analog
output, and one digital output. Students connect their I/O signals into the DAQ terminal block to
an external breadboard. The DAQ pin-out is given in Figure 9 and the wiring diagram for this
lab experiment is illustrated in Figure 10. The analog voltage signal is generated from a strain
gage mounted on a cantilever beam. The strain gage is wired into a voltage divider circuit, and
the output signal is fed into the DAQ terminal block. The analog voltage generated is
proportional to the deflection or displacement of the cantilever beam. A micrometer is used to
measure the beam deflection. The digital input comes from a momentary pushbutton with a pull-
up resistor wired on an external breadboard. The +5V supply from the DAQ board is used for
the supply voltage. The digital signal from the push button is wired into the digital channel 0
(DIO-0) on the DAQ terminal block. The digital output is wired from the digital channel 1
(DIO-1) on the DAQ board to an LED through a current limiting resistor. For the analog output,
a digital multimeter is used to monitor the voltage on the analog output channel 0 of the DAQ
terminal block.
Page 13.734.8
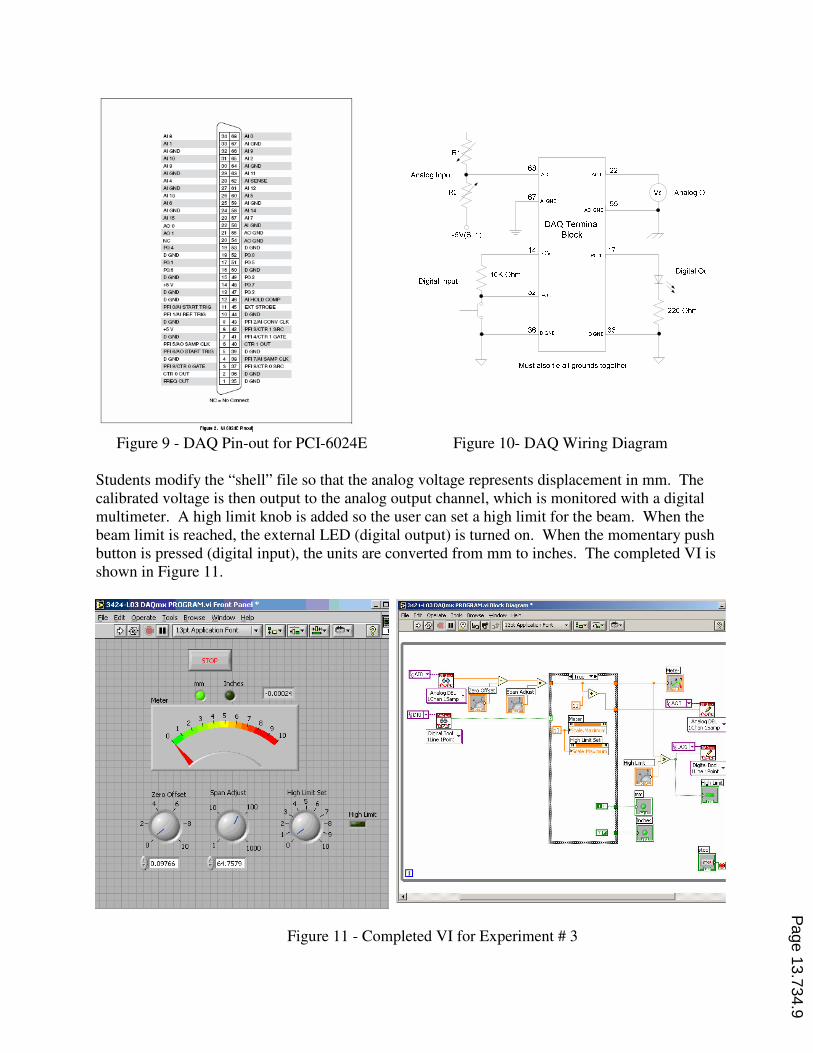
Figure 9 - DAQ Pin-out for PCI-6024E Figure 10- DAQ Wiring Diagram
Students modify the “shell” file so that the analog voltage represents displacement in mm. The
calibrated voltage is then output to the analog output channel, which is monitored with a digital
multimeter. A high limit knob is added so the user can set a high limit for the beam. When the
beam limit is reached, the external LED (digital output) is turned on. When the momentary push
button is pressed (digital input), the units are converted from mm to inches. The completed VI is
shown in Figure 11.
Figure 11 - Completed VI for Experiment # 3
Page 13.734.9
In the set of advanced application experiments, students perform the theoretical analysis of the
mechanisms under study and then, using the appropriate transducers and instrumentation tools
acquire the necessary data to perform an experimental analysis of the mechanism. Finally
students use Microsoft Excel™ to plot a series of theoretical and measured parameters associated
with the mechanisms under study. Conclusions from the analysis of the plots are derived. As an
example of this type of experiment, the Punch Press (Figure 2) experiment is described below.
The Punch Press Experiment
In the Press Punch experiment, students analyze the crank & slider mechanism of the punch
press. First, the critical dimensions such as the punch travel, link arms, and flywheel speed are
all measured. Students are then able to calculate the punch press displacement and velocity as a
function of the flywheel input angle 8. Students utilize Microsoft Excel™ to plot the
displacement vs. time and velocity vs. time plots. Next, students capture the displacement and
velocity data and compare their measurements to the calculated data.
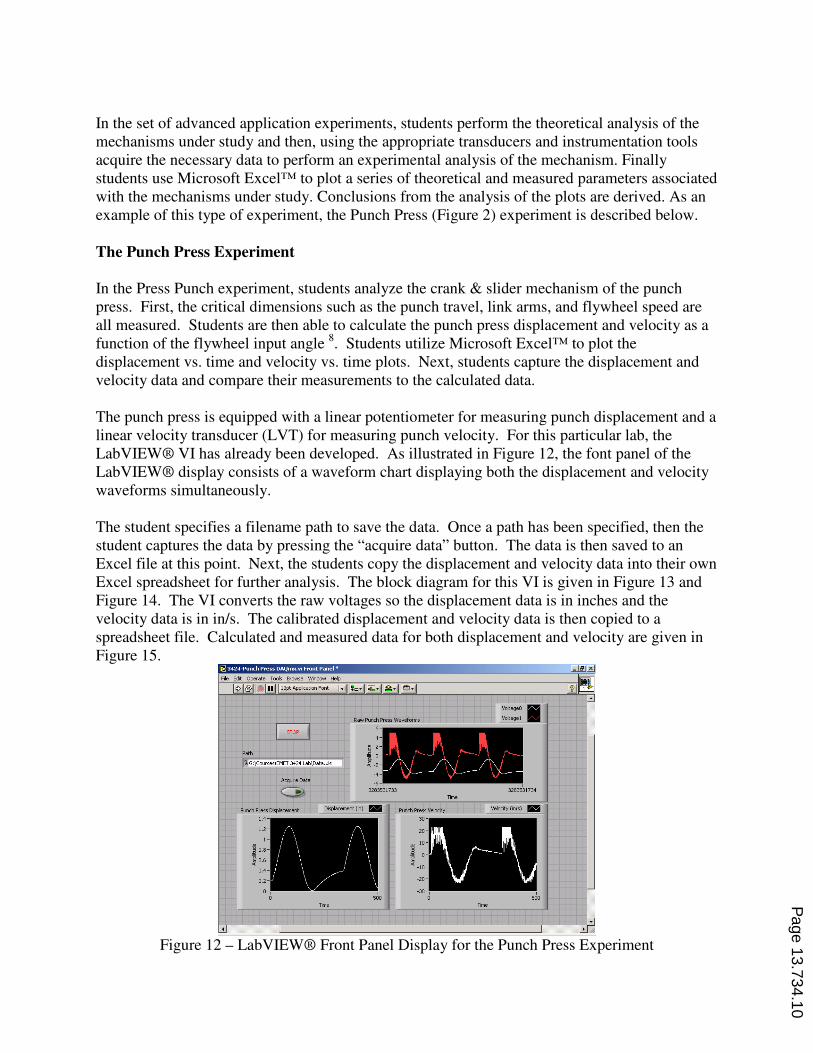
The punch press is equipped with a linear potentiometer for measuring punch displacement and a
linear velocity transducer (LVT) for measuring punch velocity. For this particular lab, the
LabVIEW® VI has already been developed. As illustrated in Figure 12, the font panel of the
LabVIEW® display consists of a waveform chart displaying both the displacement and velocity
waveforms simultaneously.
The student specifies a filename path to save the data. Once a path has been specified, then the
student captures the data by pressing the “acquire data” button. The data is then saved to an
Excel file at this point. Next, the students copy the displacement and velocity data into their own
Excel spreadsheet for further analysis. The block diagram for this VI is given in Figure 13 and
Figure 14. The VI converts the raw voltages so the displacement data is in inches and the
velocity data is in in/s. The calibrated displacement and velocity data is then copied to a
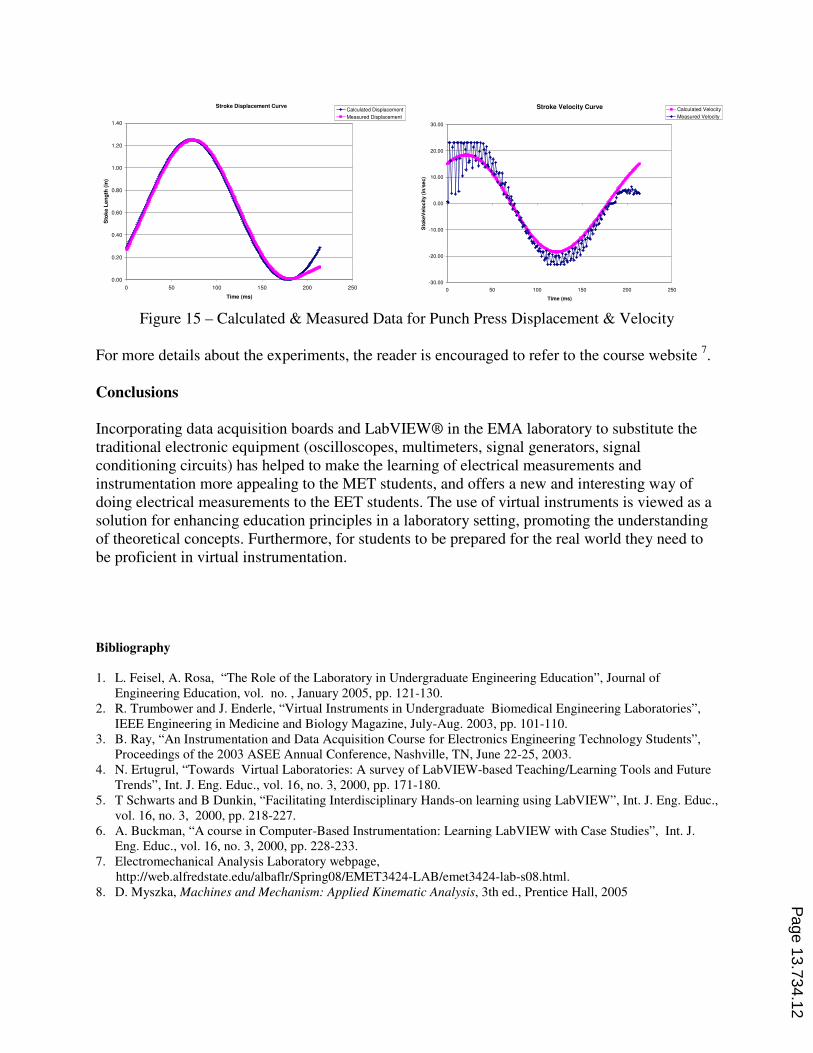
spreadsheet file. Calculated and measured data for both displacement and velocity are given in
Figure 15.
Figure 12 – LabVIEW® Front Panel Display for the Punch Press Experiment
Page 13.734.10
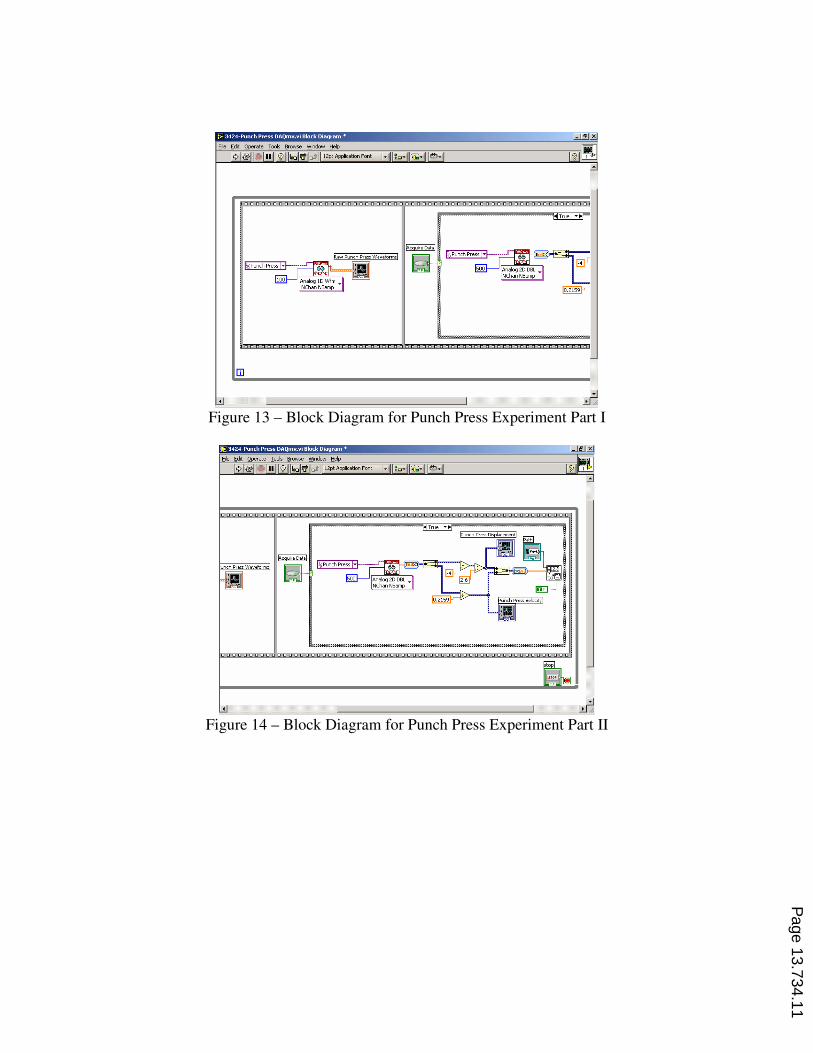
Figure 13 – Block Diagram for Punch Press Experiment Part I
Figure 14 – Block Diagram for Punch Press Experiment Part II
Page 13.734.11
Stroke Displacement Curve
0.00
0.20
0.40
0.60
0.80
1.00
1.20
1.40
0 50 100 150 200 250
Time (ms)
Sto
ke L
en
gth
(in
)Calculated Displacement
Measured Displacement
Stroke Velocity Curve
-30.00
-20.00
-10.00
0.00
10.00
20.00
30.00
0 50 100 150 200 250
Time (ms)
Sto
ke
Ve
loc
ity (
in/s
ec
)
Calculated Velocity
Measured Velocity
Figure 15 – Calculated & Measured Data for Punch Press Displacement & Velocity
For more details about the experiments, the reader is encouraged to refer to the course website 7.
Conclusions
Incorporating data acquisition boards and LabVIEW® in the EMA laboratory to substitute the
traditional electronic equipment (oscilloscopes, multimeters, signal generators, signal
conditioning circuits) has helped to make the learning of electrical measurements and
instrumentation more appealing to the MET students, and offers a new and interesting way of
doing electrical measurements to the EET students. The use of virtual instruments is viewed as a
solution for enhancing education principles in a laboratory setting, promoting the understanding
of theoretical concepts. Furthermore, for students to be prepared for the real world they need to
be proficient in virtual instrumentation.
Bibliography
1. L. Feisel, A. Rosa, “The Role of the Laboratory in Undergraduate Engineering Education”, Journal of
Engineering Education, vol. no. , January 2005, pp. 121-130.
2. R. Trumbower and J. Enderle, “Virtual Instruments in Undergraduate Biomedical Engineering Laboratories”,
IEEE Engineering in Medicine and Biology Magazine, July-Aug. 2003, pp. 101-110.
3. B. Ray, “An Instrumentation and Data Acquisition Course for Electronics Engineering Technology Students”,
Proceedings of the 2003 ASEE Annual Conference, Nashville, TN, June 22-25, 2003.
4. N. Ertugrul, “Towards Virtual Laboratories: A survey of LabVIEW-based Teaching/Learning Tools and Future
Trends”, Int. J. Eng. Educ., vol. 16, no. 3, 2000, pp. 171-180.
5. T Schwarts and B Dunkin, “Facilitating Interdisciplinary Hands-on learning using LabVIEW”, Int. J. Eng. Educ.,
vol. 16, no. 3, 2000, pp. 218-227.
6. A. Buckman, “A course in Computer-Based Instrumentation: Learning LabVIEW with Case Studies”, Int. J.
Eng. Educ., vol. 16, no. 3, 2000, pp. 228-233.
7. Electromechanical Analysis Laboratory webpage,
http://web.alfredstate.edu/albaflr/Spring08/EMET3424-LAB/emet3424-lab-s08.html.
8. D. Myszka, Machines and Mechanism: Applied Kinematic Analysis, 3th ed., Prentice Hall, 2005
Page 13.734.12