Embed Size (px)
Citation preview
INCREASED EXPRESSION AND ACTIVITY OF THE TRANSCRIPTION FACTOR FOXO1 IN NONALCOHOLIC STEATOHEPATITIS
Luca Valenti1 MD, Raffaela Rametta1 PhD, Paola Dongiovanni1 PhD, Marco Maggioni2 MD, Anna Ludovica Fracanzani1 MD, Marco Zappa3 MD, Enzo Lattuada3 MD, Giancarlo Roviaro3
MD, Silvia Fargion1 MD.
From the 1Department of Internal Medicine, Ospedale Maggiore Policlinico Mangiagalli Regina Elena IRCCS, University of Milano,
2Department Pathology, H San Paolo, Milano, 3Department of Surgery, Ospedale Maggiore Policlinico Mangiagalli Regina Elena IRCCS,
University of Milano, all in Milano, Italy. Authors declare that they do not have conflicts of interest relevant to this paper.
Running Title: FOXO1 and insulin resistance in NASH
Corresponding Author: Prof. Silvia Fargion,
Department of Internal Medicine, UO Medicina Interna IB, University of Milano Fondazione Policlinico Mangiagalli e Regina Elena IRCCS,
Via F Sforza 35, 20122 Milano, Italy, [email protected]
Received for publication 25 May 2007 and accepted in revised form 28 January 2008.
Diabetes Publish Ahead of Print, published online March 3, 2008
Copyright American Diabetes Association, Inc., 2008
FOXO1 and insulin resistance in NASH
2
ABSTRACT Objective: Nonalcoholic fatty liver, affecting 34% of the US population, is characterized by hepatic insulin resistance, which is more marked in the presence of steatohepatitis, and frequently precedes hyperglycemia. The molecular mechanisms underlying the relationship between fatty liver and insulin resistance are still under definition and have not been evaluated in humans. Aim was to evaluate the relationship between the expression and regulation of the transcription factor FOXO1, which mediates the effect of insulin on the gluconeogenic genes PEPCK and G6PC, and insulin resistance. Research Design and Methods: FOXO1, PEPCK and G6PC mRNA levels were evaluated in 86 subjects: 26 steatohepatitis, 28 steatosis alone, 14 normal liver histology without metabolic alterations, and 16 HCV chronic hepatitis, 8 with and 8 without steatosis. Protein expression and regulation of FOXO1, and upstream insulin signaling were analyzed in a subset. Results: Expression of PEPCK was higher in steatohepatitis compared to steatosis alone and normal liver, and correlated with the HOMA-R index. FOXO1 mRNA levels were higher in steatohepatitis, correlated with PEPCK and G6PC mRNA, and with HOMA-R. FOXO1 upregulation was confirmed at protein levels in steatohepatitis and, in the presence of oxidative stress, was associated with decreased Ser256-phosphorylation, decreased AKT1, and increased JNK1 activity. Consistently, immunohistochemistry showed increased FOXO1 expression and nuclear localization in steatohepatitis. FOXO1 mRNA levels correlated with nonalcoholic steatohepatitis activity score, and were modulated by drugs counteracting hepatic lipogenesis. Conclusions: FOXO1 expression and activity are increased in patients with steatohepatitis, and mRNA levels are correlated with hepatic insulin resistance.
FOXO1 and insulin resistance in NASH
3
onalcoholic fatty liver disease (NAFLD), affecting about 34% of the US population (1), is considered the
hepatic manifestation of the metabolic syndrome (MetS). NAFLD is characterized by hepatic insulin resistance, i.e. the inability of insulin to shut down hepatic glucose output (HGO) (2), pro-atherogenic dyslipidemia, and early vascular damage (3). In about a third of NAFLD cases, fatty liver is complicated by steatohepatitis (NASH), which is thought to be provoked by lipid peroxidation and mitochondrial dysfunction determining oxidative stress and cytokine release (4). The presence of NASH is associated with more severe metabolic derangement and insulin resistance, frequently evolving to glucose intolerance, and more advanced vascular damage (2; 3). Alterations in liver enzymes reportedly precede the development of the MetS and hyperglycemia (5; 6), and the majority of NASH patients develop diabetes or glucose intolerance at long-term follow-up (7; 8), thus suggesting a role of NASH in the debated pathogenic mechanism of MetS (9). In addition, fatty liver is frequently observed in chronic HCV hepatitis, and is associated with increased inflammation and heightened risk of type 2 diabetes (10).
Experimental models indicate that fatty liver may directly induce hepatic insulin resistance (11), and recent evidence suggests that deregulation of the insulin signaling pathway plays a role in this process (12). However, data concerning the regulation of the insulin signaling and gluconeogenic genes in patients with NAFLD are still unavailable. HGO is regulated by glucose-6-phosphatase, catalytic subunit (G6PC), and phosphoenolpyruvate-carboxy-kinase (PEPCK), rate limiting enzymes for gluconeogenesis and glucose release. Although several transcription factors have been shown to regulate gluconeogenesis, evidence is accumulating that in vivo
shutdown of HGO by insulin involves AKT dependent phosphorylation and nuclear exclusion of the forkhead transcription factor FOXO1, controlling the expression of G6PC and PEPCK. In mice, FOXO1 haplo-insufficiency reduced HGO, whereas FOXO1 overexpression increased gluconeogenesis (13). FOXO1 binds to, and is required for activation of gluconeogenesis by PGC-1� (14; 15) by C/EBP� and possibly C/EBP� (16), whose transcriptional activity is also downregualted by insulin signaling by induction of the inhibitory isoform LIP (17). Hepatic FOXO1 ablation impairs fasting and cAMP induced gluconeogenesis, and curtails excessive HGO caused by generalized ablation of Insulin Receptor (InsR), providing an unifying mechanisms for the regulation of HGO by hormonal cues (14). Furthermore, down-regulation of FOXO1 by antisense oligonucleotides reduced hepatic insulin resistance in a model of diet-induced obesity and fatty liver (18). Although NAFLD is characterized by hyperinsulinemia, under oxidative stress conditions, as those observed in NASH (4), FOXO1 becomes unresponsive to insulin because of interaction with the sirtuin deacetylase SIRT1, resulting in induction of glucogenetic genes (19; 20).
Therefore, deregulation of hepatic FOXO1 and the associated transcriptional machinery in response to steatosis and oxidative stress may play a role in the metabolic derangement of subjects with NAFLD by inducing HGO. To test this hypothesis in humans, we sought to demonstrate hepatic insulin resistance at gene expression level in patients with NAFLD, and to analyze the relationship between insulin resistance, FOXO1 expression / regulation, and gluconeogenesis. RESEARCH DESIGN AND METHODS Patients. We considered 86 subjects who underwent liver biopsy at the Department of
N
FOXO1 and insulin resistance in NASH
4
Internal Medicine (n=59) or Surgery (n=27). We included 26 patients with NASH, 28 with steatosis alone and 14 with normal liver biopsy. This latter group of controls was defined by I) the absence of viral hepatitis, metabolic alterations, and histological abnormalities including steatosis II) presence of normal ALT levels at the time of biopsy, which was performed for increased GGT/ferritin levels, or evaluation for living donor liver donation, or routinely in patients undergoing bariatric surgery. We also considered 16 patients with chronic HCV related hepatitis, 8 with and 8 without steatosis. Patients with diabetes, hypothyroidism, alcohol intake >40 g/week and severe hepatic fibrosis (bridging fibrosis and cirrhosis) were excluded; 5 patients with NASH had glucose intolerance. Eight patients with NAFLD were on therapy with drugs acting on hepatic insulin resistance and lipogenesis (21; 22) (henceforth defined as “treated”). The sample part unnecessary for histological diagnosis was processed only for RNA extraction.
Surgical samples were partly processed for histological evaluation, and partly for RNA and / or protein extraction. We collected suitable material to perform both analyses in 15 cases.
The study was approved by the Institutional Review Board of the Ospedale Policlinico, Mangiagalli e Regina Elena, Fondazione IRCCS of Milano, and each participating subject gave written informed consent. Study protocol and measurement of insulin resistance. Subjects were advised to maintain a standardized normoglucidic diet (50% carbohydrates, 35% fat and 15% protein) for 48 hours before the procedure. Compliance was confirmed by at least one family member or by a friend. Liver biopsies and blood tests were performed after overnight fasting (10 hours) and liver samples were routinely processed for histology or immediately frozen
in liquid nitrogen and stored at –80ºC in RNAlater (Invitrogen, Carlsbad, CA) for RNA, or lysed in RIPA buffer for proteins. Insulin was measured by radioimmuno-assay (Calbiochem, Bologna, Italy) and biochemistry performed by standard methods. Insulin resistance was evaluated by the HOMA-IR index, which mainly reflects hepatic insulin resistance (23) in subjects followed at the Department of Medicine. Since there is a linear relationship between insulin levels and HGO, and insulin acts by downregulating the expression of PEPCK and G6PC, we also arbitrarily estimated insulin resistance at gene expression level by adjusting PEPCK and G6PC mRNA levels per insulin levels. MetS was defined according to the ATP III criteria (24). Histological analysis. A single expert pathologist unaware of gene expression data evaluated all biopsies, which were staged according to Kleiner (25), based on the determination of the NASH activity score (NAS), the sum of steatosis severity (0-3), intralobular inflammation (0-3), and hepatocyte ballooning (0-2). The percentage of hepatocytes with steatosis was the mean value of at least 10 hepatic lobules per patient. Patients with probable (NAS 3-4) and definite NASH (NAS ≥ 5) were grouped together for analyses unless otherwise specified.
FOXO1 cellular distribution and intracellular localization were detected by immunohistochemistry on paraffin embedded tissue samples using the Cell Signaling antibody (Danvers, MA) in 15 representative subjects. Briefly, tissue samples were deparaffinated and hydrated, treated with EDTA (1 mM pH 8) to unmask antigens, and with 3% H2O2 to block endogenous peroxidase. Samples were then incubated with the primary antibody at 1:50 dilution and washed. The reaction was developed by the EnVision Dako system (Dako, Milan, Italy) and developed by diaminobenzidine. Mild contrast was provided by hematoxylin and
FOXO1 and insulin resistance in NASH
5
Meyer stainings. Antibody specificity and the ability to recognize FOXO1 intracellular localization under normal growth conditions, starving, and oxidative stress was confirmed in HepG2 by immuno-cytochemistry (not shown). Determination of mRNA levels. RNA was isolated by the RNeasy micro kit (Qiagen, Milano, Italy), digested with DNaseI, and quality evaluated by measuring the 260/280 nm absorbance ratio (≥ 1.8) and by electrophoresis. First-strand cDNA was synthesized using equal amounts (0.5 µg) of total RNA, with the SuperScript First Strand Synthesis system (Invitrogen, Carlsbad, CA). The mRNA levels were analyzed by qRT-PCR. The PCR mix contained TaqMan Universal Master Mix (1X), plus the assays specific for the genes of interest (MyScience, Applied Biosystem, Foster City, CA). All reactions were performed in triplicate with the ABI PRISM 7700 analyzer in a 25 µl final volume. Primers are available at: https://products.appliedbiosystems.com (Assay ID: Hs 00231106_m1, Hs 00356436_m1, Hs 00609178_m1, Hs 99999903_m1, Hs 00173304_m1, Hs 00232764_m1, Hs 00230853_m1). Results were normalized for �-actin. Protein analysis. Tissues (10 mg) were lysed in RIPA buffer containing 1 mM Na-orthovanadate, 200 mM PMSF, 0.02 �g/�l aprotinin. Equal amounts of proteins (25 �g) were separated by SDS-PAGE and transferred electrophoretically to nitrocellulose membrane (Biorad, Hercules, CA). The blot was incubated with anti- InsR-�, IRS-2, AKT1/2, FOXO1, PGC-1, JNK, p-JNK, SOD2, C/EBP�, C/EBP�, HNF-4, PPAR�, CREB, �-actin antibodies (from Santa Cruz, Santa Cruz, CA), p-AKT (Ser473), p-FOXO1 (Ser256) (Cell Signaling Technology, Danvers, MA), and anti- SIRT1 antibodies (Upstate, Chicago, IL). The gels were densitometrically scanned and images analyzed with the ImageJ software (26). Results were normalized for �-
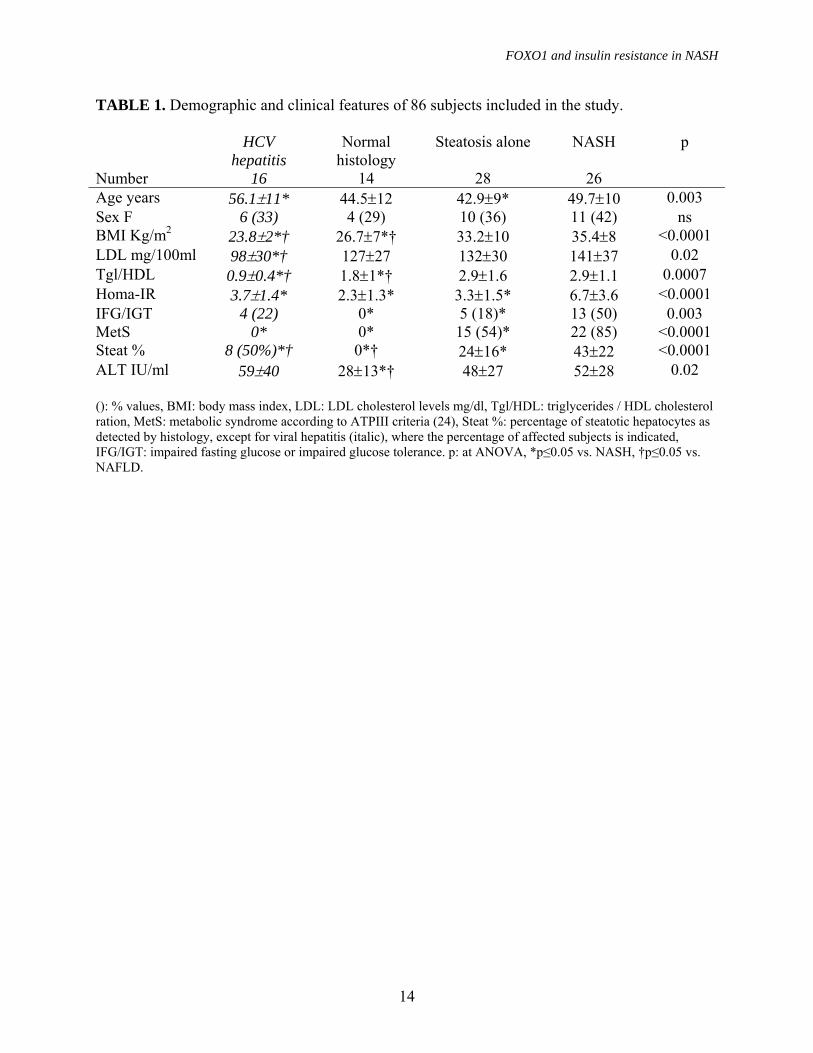
actin. To normalize results between gels, we used a single pooled lysate from untreated HepG2 hepatocytes. Oxidative stress was measured by protein carbonylation and anti-oxidant response by protein levels of SOD2, a bona fide FOXO target involved in the scavenging of mitochondrial derived superoxide (27). Protein carbonylation was measured by Oxyblot (Chemicon, Temecula, CA) (28), according to the manufacturer’s instructions. Statistical analysis. Due to non-normal distribution, normalized mRNA levels were log-transformed before data analysis. Results, expressed as mean±SD, were compared by ANOVA and post hoc analysis (Tukey-Kramer), and correlations performed by Pearson’s test. To analyze independent predictors of FOXO1 mRNA levels (above or below median levels) in patients without HCV chronic hepatitis, we performed nominal logistic regression analysis considering the severity of steatosis and necroinflammatory activity according to Kleiner, and therapy with insulin sensitizing drugs as independent variables. P was considered significant when <0.05 (two-tailed). Analyses were carried out with the JMP 6.0 statistical analysis software (SAS Institute Inc, Cary, NC, USA). RESULTS Patients characteristics. Clinical features of patients included in this study are shown in table 1. LDL cholesterol, BMI, triglycerides/HDL ratio, HOMA-IR index, the prevalence of MetS and impaired fasting glucose / glucose tolerance, and the percentage of steatotic cells were significantly different among groups, with the highest levels in NASH. Subjects with normal liver had lower ALT levels compared to other groups. Patients with NAFLD were older than those with steatosis alone. Patients submitted to bariatric surgery had higher BMI values, younger age, and higher prevalence of female
FOXO1 and insulin resistance in NASH
6
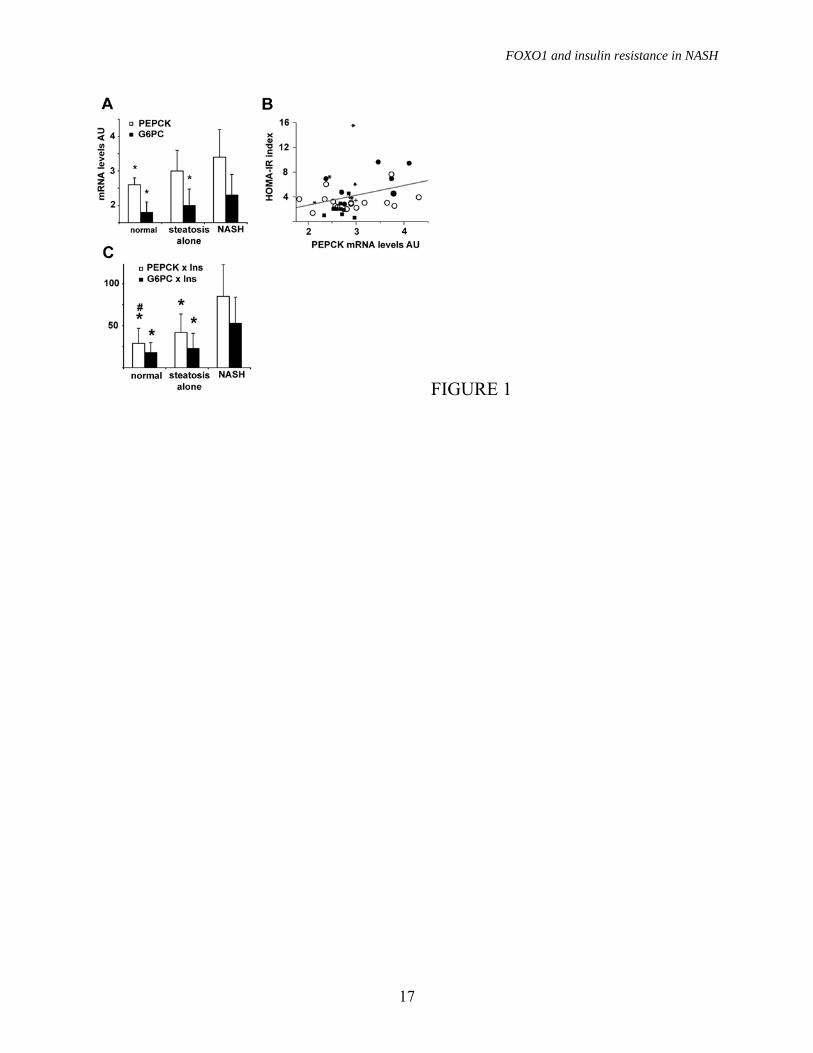
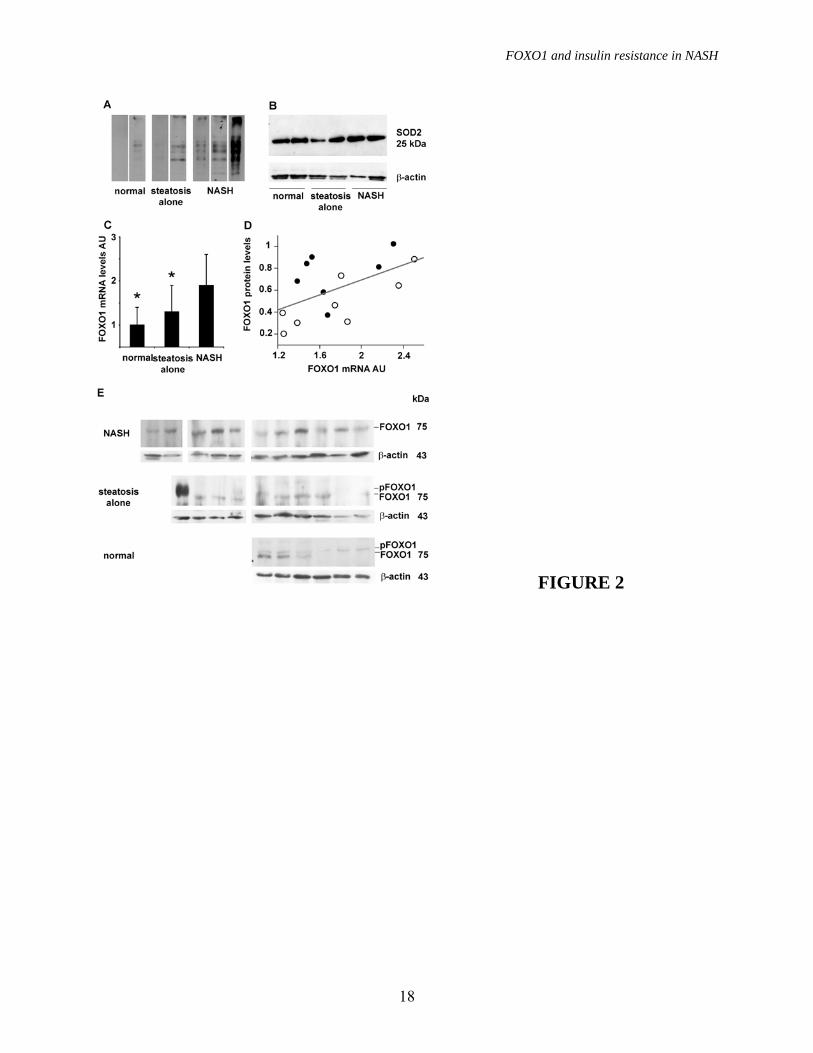
sex compared to those with suspected liver disease followed in the Internal Medicine Department (p<0.05, not shown). Insulin resistance and gluconeogenic genes. To test for the presence of hepatic insulin resistance at gene expression level, we first analyzed the expression of gluconeogenic genes in patients without HCV. The expression of PEPCK and G6PC was significantly different among groups (p=0.05), due to higher levels in NASH vs. normal liver for PEPCK, and higher level in NASH vs. normal liver and steatosis alone for G6PC (figure 1A). Mean PEPCK expression levels before log conversion were 4-fold higher in NASH vs. normal liver, and G6PC expression was 2.3-fold and 3.2-fold higher in NASH vs. steatosis alone and normal liver, respectively. PEPCK, but not G6PC expression, was significantly correlated with the HOMA-IR index (p=0.04; figure 1B). We estimated insulin resistance at gene expression level by adjusting PEPCK and G6PC mRNA levels per insulin levels in each patient. Both PEPCK x insulin (p=0.0006) and G6PC x insulin (p=0.0005) were significantly different among groups, due to higher levels in NASH compared to the other groups (figure 1C). PEPCK x insulin was also higher in steatosis alone than in normal liver. These results suggest that gluconeogenic genes are not downregulated by hyperinsulinemia and that overexpression of PEPCK is likely involved in the pathogenesis of insulin resistance in NASH. Oxidative stress levels. Oxidative stress levels were measured by protein carbonylation, as determined by Oxyblot, and the anti-oxidant response by detecting SOD2 protein levels. Results are shown in figure 2A, 2B and table 2. Both protein carbonylation and SOD2 levels were significantly different among groups (p<0.0001), due to higher levels in patients with NASH compared to those with simple steatosis and normal liver histology. Hepatic expression of FOXO1. Preliminary
experiments confirmed that FOXO1 was the most abundantly expressed FOXO in the liver also in humans, since mRNA levels were 14.5-fold higher than those of FOXO3A (p<0.0001), independently of liver pathological findings, whereas FOXO4 was almost undetectable in all evaluated samples. We thus focused our study on FOXO1.
To investigate the molecular mechanisms underpinning PEPCK and G6PC upregulation we analyzed the mRNA expression of FOXO1, and of its co-activators SIRT1 and PGC-1�. We observed significantly different FOXO1 expression among patients subdivided according to liver histopathological findings (P=0.0004), due to higher levels in NASH vs. both steatosis alone and subjects with normal liver (p<0.005 for both, figure 2C), whereas no significant differences were observed for SIRT1 and PGC-1� mRNA levels (not shown). In patients with NASH, mean FOXO1 mRNA levels were 6.3-fold higher than in those with normal liver biopsy, and 3.7-fold higher than in those with simple steatosis. FOXO1 expression was higher in NASH vs. simple steatosis and normal liver both in patients with and in those without morbid obesity (P<0.05 for both).
To determine whether increased FOXO1 mRNA levels translated into increased activity we first analyzed the relationship between normalized mRNA and protein levels. We observed a significant correlation between FOXO1 mRNA and protein levels (n=15, R2=0.3 P=0.03; figure 2D). FOXO1 protein levels were higher in patients with NAFLD, in particular in those with NASH, than in those with normal liver (figure 2E and table 2); moreover, upward shifting of FOXO1 in the majority of patients with normal liver and in some with simple steatosis suggested that FOXO1 is phosphorylated in normal liver, but is unphosphorylated and thus transcriptionally active in NASH.
FOXO1 and insulin resistance in NASH
7
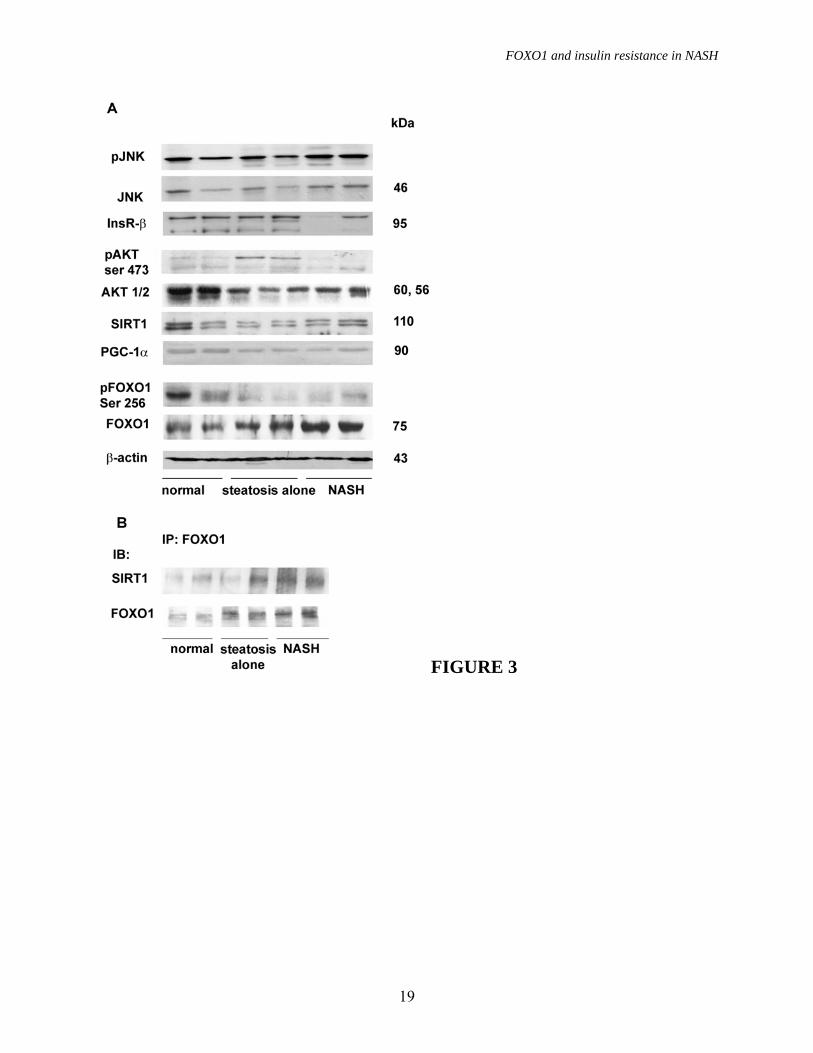
In contrast, FOXO1 mRNA levels were not significantly influenced by the presence of fatty liver in patients with chronic HCV hepatitis (1.47±0.3 vs. 1.51±0.3 in patients without and with steatosis, p=ns). FOXO1 regulation in the liver. We next analyzed FOXO1 post-translational regulation by Western blotting and immunoprecipitation. We show the results obtained in 2 obese patients with normal liver histology, 2 patients with steatosis alone, and 2 patients with definite NASH (NAS ≥ 5) in figure 3. Patients were representative of histological diagnoses, whereas results obtained in the overall series of patients are shown in table 2. Despite significantly higher insulin levels (not shown in detail), confirming results presented in figure 2, FOXO1 was less phosphorilated at Ser256 in NASH compared to steatosis alone and controls (figure 3A and table 2).
PGC-1� expression tended to decrease from subjects with normal liver histology, to simple steatosis and NASH (figure 3A and table 2). SIRT1 protein levels did not differ in NASH vs. simple steatosis and controls (table 2), but co-immunoprecipitation experiments showed a higher amount of SIRT1 associated with FOXO1 in patients with NASH compared to those with simple steatosis and those with normal liver histology (table 2 and figure 3B), suggesting increased interaction between FOXO1 and SIRT1 in NASH.
To determine whether the status of the upstream signaling pathways was also consistent with increased FOXO1 activity in NASH, we analyzed the expression of InsR, AKT/pAKT and JNK1/pJNK in patients with NAFLD and controls (figure 3A and table 2). We observed a significant downregulation of AKT1 in patients with steatosis compared to controls, whereas pAKT levels were decreased in NASH vs. controls, but highly variable in simple steatosis (as shown in table 2). InsR expression was decreased, whereas the expression and phosphorylation of the
stress kinase JNK1 were increased in NASH vs. other groups.
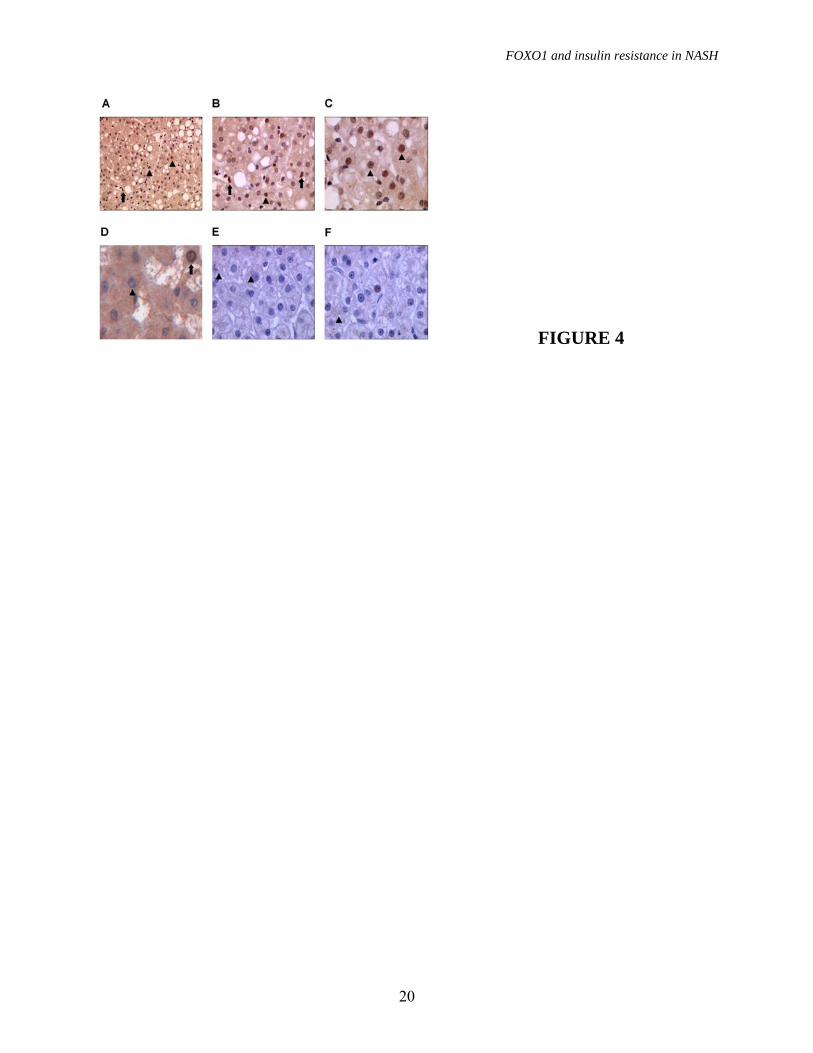
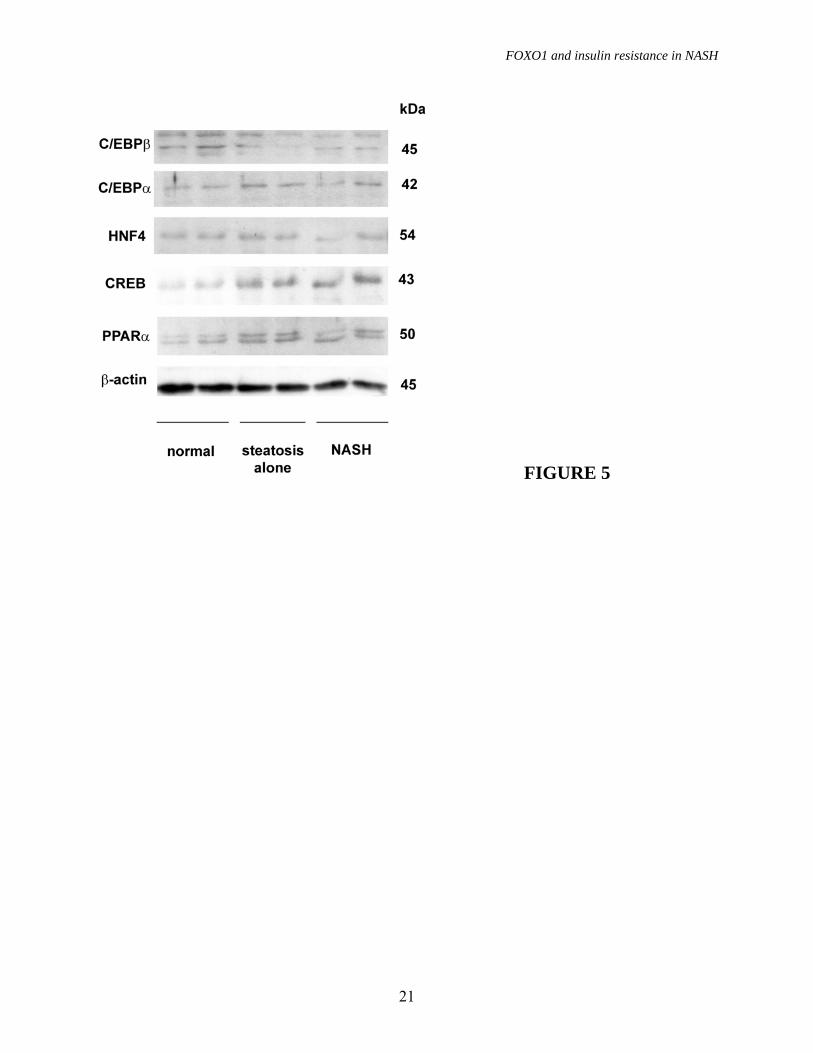
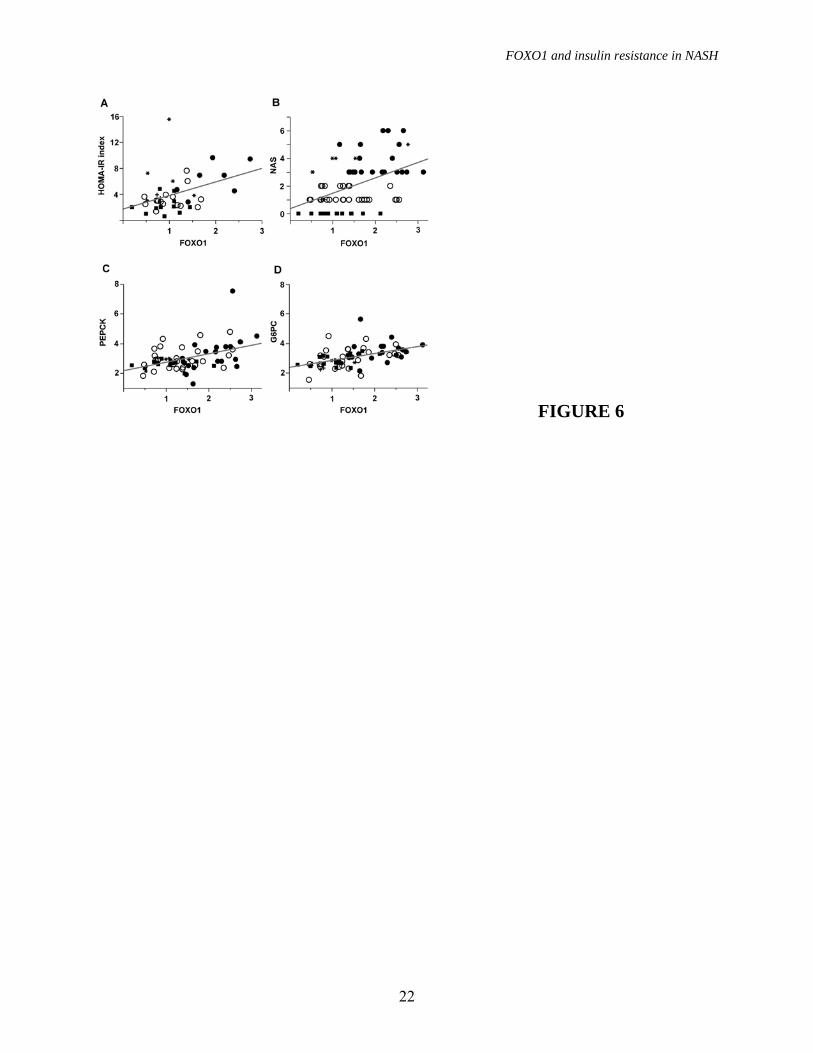
To determine the cellular localization of FOXO1, we performed immunohistochemical staining of liver samples. In patients with NASH (figure 4A, 4B, 4C), we observed diffuse hepatocellular nuclear staining, and scattered positive nuclei of Kupffer cells, whereas FOXO1 was mainly cytoplasmic in subjects with simple steatosis (figure 4D), and FOXO1 staining was minimal in subjects with normal liver (figure 4E, 4F). Taken together, these data suggest that FOXO1 expression is influenced by histopathological findings, and that FOXO1 activity is increased in hepatocytes in NASH. Expression of other transcription factors involved in gluconeogenesis and lipid metabolism. The expression of other transcription factors involved in gluconeogenesis and lipid metabolism was evaluated in the same patients considered in figure 3A; results are shown in figure 5. Expression of C/EBP�, C/EBP�, HNF-4 and PPAR-� was not higher in patients with NASH compared to that with simple steatosis and normal liver, whereas CREB protein levels were higher in subjects with fatty liver compared to those with normal histology. FOXO1, severity of steatohepatitis and insulin resistance. Since FOXO1 was increased in NASH, characterized by the presence of inflammation and hepatic insulin resistance, we next analyzed the relationship between FOXO1, the histological severity of the disease, and gluconeogenesis (figure 5). FOXO1 mRNA levels were correlated with HOMA-IR index (R2=0.2, P=0.01, figure 6A), and NAS (R2=0.2, P<0.0001, figure 6B). FOXO1 was significantly correlated with both intralobular inflammation according to Kleiner (R2=0.15, p=0.001), and the percentage of steatotic hepatocytes (R2=0.13, P=0.002), but not with the severity of fibrosis. FOXO1 mRNA levels were correlated with the expression of both PEPCK (R2=0.2,
FOXO1 and insulin resistance in NASH
8
P<0.0001, figure 6C) and G6PC (R2=0.25, P<0.0001, figure 6D). The correlation was even stronger when PEPCK and G6PC were adjusted for insulin levels (R2=0.4 and 0.35, respectively, <0.0001 for both). No significant correlation was observed between FOXO1 and PGC-1� / SIRT1mRNA levels.
In patients with chronic HCV hepatitis, FOXO1 mRNA levels were significantly associated with HOMA-IR (R2=0.2, p=0.05), but not with PEPCK and G6PC. Effect of therapy on FOXO1 mRNA levels. Finally, we analyzed the effect of pharmacological therapy on FOXO1 expression in patients with NAFLD. Eight of 54 patients were taking drugs acting directly or indirectly on hepatic insulin resistance or hepatic lipid metabolism (one PPAR-�, two PPAR-� agonists, and 6 metformin). FOXO1 expression was significantly influenced by the presence of NASH and treatment with insulin sensitizers (p<0.0001), being significantly higher in untreated patients with NASH compared to the other groups (NASH untreated 2.1±0.6, simple steatosis untreated 1.4±0.6, NASH treated 1.2±0.8, simple steatosis treated 1.1±0.7; p<0.05 for untreated patients with NASH vs. all the other groups). At logistic regression analysis considering steatosis, necroinflammatory activity, and therapy, high FOXO1 mRNA levels were independently associated with steatosis (OR 2.62 per unit increase, 95% confidence interval 1-7.7, p=0.05), necroinflammatory activity (OR 2.65 per unit increase, 95% confidence interval 1.2-6.8, p=0.02), and therapy (OR 0.23, 95% confidence interval 0.07-0.7, p=0.01). DISCUSSION
In this study, we measured insulin resistance at gene expression level in patients with NAFLD, a widely prevalent condition associated with the features of MetS (2; 3; 6), and investigated whether FOXO1 expression and activity were associated with insulin
resistance. Our results confirm and extend findings in animal models, indicating that increased FOXO1 activity may play a role in the pathogenesis of hepatic insulin resistance associated with NAFLD.
Since NAFLD is characterized by impaired suppression of HGO by insulin (2), we first determined mRNA expression of the rate-limiting gluconeogenic genes in patients and controls, and found that both PEPCK and G6PC were not downregulated by hyperinsulinemia in NAFLD. In fact, PEPCK and G6PC levels were increased in patients with NASH, characterized by severe hyperinsulinemia and a 30% prevalence of impaired glucose tolerance, and PEPCK expression correlated with the HOMA-IR index. Thus, we confirmed at gene expression level the hepatic insulin resistance observed in clamp studies and animal models of NAFLD, and the increased fasting HGO in those patients progressing towards hyperglycemia (2; 11; 29; 30).
We next reasoned that deregulation of the forkhead transcription factor FOXO1, demonstrated to mediate the effect of insulin on gluconeogenesis in animal models (13), may play a role in this process. To check this hypothesis, we measured the expression of FOXO1 and interacting nuclear factors (20). We observed a progressive increase in FOXO1 mRNA levels from subjects with normal liver to those with steatosis alone and NASH, and a significant correlation between FOXO1 mRNA and protein levels. In addition, we detected increased interaction between FOXO1 and SIRT1 in patients with simple steatosis, more marked in NASH, which was associated with a relative decrease in Ser256-posphorylation, findings consistent with increased transcriptional activity (19). Decreased PGC-1� expression suggests that increased recruitment of this coactivator at the promoter of gluconeogenic genes, due to interaction with FOXO1 and regulation by insulin signaling and SIRT1 (14; 31; 32),
FOXO1 and insulin resistance in NASH
9
rather than transcriptional induction, supports gluconeogenesis in NASH.
Interestingly, increased FOXO1 mRNA and protein levels have been observed in the liver in mouse models of diet induced insulin resistance (18; 33). The biological plausibility of transcriptional regulation of FOXO1 is reinforced by the finding of a positive correlation with the expression of its bona fide transcriptional targets PEPCK and G6PC, and the HOMA-IR index. Moreover, FOXO1 mRNA levels were independently associated with the degree of steatosis and necroinflammatory activity, suggesting that steatosis and inflammation are involved in FOXO1 regulation, possibly by inducing oxidative stress (28; 34), and negatively associated with treatment with insulin sensitizing drugs. Nevertheless, the low number of patients and the lack of prospective evaluation suggest caution in interpreting these latter results.
The activation status of the upstream insulin signaling pathway also favored increased FOXO1 activity. Indeed, we observed a significant decrease in AKT levels in patients with simple steatosis and NASH compared to controls. Decreased InsR expression in NASH and the mechanisms underpinning AKT downregulation deserve further evaluation. At the same time JNK1 and pJNK were increased in NASH compared to normal liver and simple steatosis, in agreement with what observed in rodent models of this disease (35). Interestingly, JNK has previously been shown to induce down-regulation of insulin signaling through IRS-1, which selectively regulates glucose metabolism in the liver (36), and to directly interact with FOXO1 favoring nuclear translocation, transcriptional activation, and gluconeogenesis (37), suggesting that increased JNK may be implicated in further activation of FOXO1 in NASH.
Thus, it appears that different mechanisms may be recruited to increase FOXO1 activity
in NASH. The first one involves progressive upregulation of mRNA levels secondary to steatosis and inflammation. The second encompasses sequential alterations in intracellular signaling pathways, i.e. decreased AKT activity associated with steatosis and increased JNK in patients progressing to NASH. The third is related to increased interaction with SIRT1 and other nuclear factors at gene promoters.
Immunohistochemical evaluation supports these conclusions by showing increased FOXO1 hepatocellular staining in patients with fatty liver, and prominent nuclear localization in patients with NASH. The functional significance of FOXO1 expression in hepatic non-parenchymal cells is still under definition: FOXO1 inhibits proliferation of hepatic stellate cells and fibrogenesis, but the activation status was not evaluated in NASH (38), and no data are available for Kupffer cells.
Importantly, our results do not implicate that FOXO1 is the only culprit of increased HGO in NASH, and in fact suggest that upregulation of CREB, regulated by cAMP and insulin signaling through TORC2 (39), may play a role, suggesting again an integrated hormonal control of gluconeogenesis by CREB / FOXO1 (14).
The study suffers from limitations related to the variability of human biological samples due to environmental and genetic confounders, but it also has strengths: we were able to test in humans molecular mechanisms of disease so far demonstrated only in animal studies providing complementary findings, including also patients affected by the MetS with clinical and demographic features reflecting those of the general population. In addition, we could analyze the relationship between liver inflammation related to metabolic disease, deeply connected with insulin resistance in previous studies (4; 40; 41), and metabolic gene expression.
FOXO1 and insulin resistance in NASH
10
In conclusion, we provide evidence that in humans a) fatty liver and steatohepatitis are associated with a progressive increase in the expression of gluconeogenic genes b) PEPCK expression correlates with HOMA-IR, reflecting whole body insulin resistance c) FOXO1 levels are increased in NASH due to increased mRNA levels d) in the presence of oxidative stress, FOXO1 is hypo-posphorylated at Ser256 and localized to the nucleus e) FOXO1 mRNA levels correlate with that of its targets PEPCK and G6PC, and with insulin resistance f) FOXO1 mRNA levels correlate with the severity of steatosis and necroinflammation and are possibly influenced by insulin sensitizing drugs.
The present and other Authors’ results (14) suggest that increased FOXO1 activity is involved in insulin resistance in patients with NAFLD by inducing gluconeogenic genes. Whether upregulation of FOXO1 expression
plays a causal role in the pathogenesis of MetS and is modulated by genetic factors (42), has to be evaluated in future studies. ACKNOWLEDGEMENTS
We thank Cristina Bertelli and Erika Fatta for clinical assistance, Patrizia Doi for technical assistance, Domenico Accili for suggestions. Grant support: COFIN 2004, FIRST 2004, FIRST 2005, Ricerca Corrente Ospedale Maggiore Policlinico Mangiagalli Regina Elena IRCCS 2004, 2005, 2006, Progetto Obesita’ Ospedale Maggiore Policlinico Mangiagalli RE IRCCS Milano, Centro di Ricerca Malattie Metaboliche ed Epatiche Universita’ di Milano. LV was supported for this project by a grant of the Societa’ Italiana Medicina Interna (SIMI).
FOXO1 and insulin resistance in NASH
11
REFERENCES 1. Browning JD, Szczepaniak LS, Dobbins R, Nuremberg P, Horton JD, Cohen JC, Grundy SM, Hobbs HH: Prevalence of hepatic steatosis in an urban population in the United States: impact of ethnicity. Hepatology 40:1387-1395, 2004 2. Marchesini G, Brizi M, Bianchi G, Tomassetti S, Bugianesi E, Lenzi M, McCullough AJ, Natale S, Forlani G, Melchionda N: Nonalcoholic fatty liver disease: a feature of the metabolic syndrome. Diabetes 50:1844-1850, 2001 3. Targher G, Bertolini L, Padovani R, Rodella S, Zoppini G, Zenari L, Cigolini M, Falezza G, Arcaro G: Relations between carotid artery wall thickness and liver histology in subjects with nonalcoholic fatty liver disease. Diabetes Care 29:1325-1330, 2006 4. Day CP: From fat to inflammation. Gastroenterology 130:207-210, 2006 5. Hanley AJ, Williams K, Festa A, Wagenknecht LE, D'Agostino RB, Jr., Haffner SM: Liver markers and development of the metabolic syndrome: the insulin resistance atherosclerosis study. Diabetes 54:3140-3147, 2005 6. Suzuki A, Angulo P, Lymp J, St Sauver J, Muto A, Okada T, Lindor K: Chronological development of elevated aminotransferases in a nonalcoholic population. Hepatology 41:64-71, 2005 7. Ekstedt M, Franzen LE, Mathiesen UL, Thorelius L, Holmqvist M, Bodemar G, Kechagias S: Long-term follow-up of patients with NAFLD and elevated liver enzymes. Hepatology 44:865-873, 2006 8. Adams LA, Lymp JF, St Sauver J, Sanderson SO, Lindor KD, Feldstein A, Angulo P: The natural history of nonalcoholic fatty liver disease: a population-based cohort study. Gastroenterology 129:113-121, 2005 9. Kahn R, Buse J, Ferrannini E, Stern M: The metabolic syndrome: time for a critical appraisal. Joint statement from the American Diabetes Association and the European Association for the Study of Diabetes. Diabetologia 48:1684-1699, 2005 10. Valenti L, Pulixi E, Fracanzani AL, Dongiovanni P, Maggioni M, Orsatti A, Gianni C, Fargion S: TNFalpha genotype affects TNFalpha release, insulin sensitivity and the severity of liver disease in HCV chronic hepatitis. J Hepatol 43:944-950, 2005 11. Samuel VT, Liu ZX, Qu X, Elder BD, Bilz S, Befroy D, Romanelli AJ, Shulman GI: Mechanism of hepatic insulin resistance in non-alcoholic fatty liver disease. J Biol Chem 279:32345-32353, 2004 12. Samuel VT, Liu ZX, Wang A, Beddow SA, Geisler JG, Kahn M, Zhang XM, Monia BP, Bhanot S, Shulman GI: Inhibition of protein kinase Cepsilon prevents hepatic insulin resistance in nonalcoholic fatty liver disease. J Clin Invest 117:739-745, 2007 13. Nakae J, Biggs WH, 3rd, Kitamura T, Cavenee WK, Wright CV, Arden KC, Accili D: Regulation of insulin action and pancreatic beta-cell function by mutated alleles of the gene encoding forkhead transcription factor Foxo1. Nat Genet 32:245-253, 2002 14. Matsumoto M, Pocai A, Rossetti L, Depinho RA, Accili D: Impaired regulation of hepatic glucose production in mice lacking the forkhead transcription factor foxo1 in liver. Cell Metab 6:208-216, 2007 15. Puigserver P, Rhee J, Donovan J, Walkey CJ, Yoon JC, Oriente F, Kitamura Y, Altomonte J, Dong H, Accili D, Spiegelman BM: Insulin-regulated hepatic gluconeogenesis through FOXO1-PGC-1alpha interaction. Nature 423:550-555, 2003
FOXO1 and insulin resistance in NASH
12
16. Sekine K, Chen YR, Kojima N, Ogata K, Fukamizu A, Miyajima A: Foxo1 links insulin signaling to C/EBPalpha and regulates gluconeogenesis during liver development. Embo J, 2007 17. Duong DT, Waltner-Law ME, Sears R, Sealy L, Granner DK: Insulin inhibits hepatocellular glucose production by utilizing liver-enriched transcriptional inhibitory protein to disrupt the association of CREB-binding protein and RNA polymerase II with the phosphoenolpyruvate carboxykinase gene promoter. J Biol Chem 277:32234-32242, 2002 18. Samuel VT, Choi CS, Phillips TG, Romanelli AJ, Geisler JG, Bhanot S, McKay R, Monia B, Shutter JR, Lindberg RA, Shulman GI, Veniant MM: Targeting foxo1 in mice using antisense oligonucleotide improves hepatic and peripheral insulin action. Diabetes 55:2042-2050, 2006 19. Frescas D, Valenti L, Accili D: Nuclear trapping of the forkhead transcription factor FoxO1 via Sirt-dependent deacetylation promotes expression of glucogenetic genes. J Biol Chem 280:20589-20595, 2005 20. Nakae J, Cao Y, Daitoku H, Fukamizu A, Ogawa W, Yano Y, Hayashi Y: The LXXLL motif of murine forkhead transcription factor FoxO1 mediates Sirt1-dependent transcriptional activity. J Clin Invest, 2006 21. Bugianesi E, Gentilcore E, Manini R, Natale S, Vanni E, Villanova N, David E, Rizzetto M, Marchesini G: A randomized controlled trial of metformin versus vitamin E or prescriptive diet in nonalcoholic fatty liver disease. Am J Gastroenterol 100:1082-1090, 2005 22. Belfort R, Harrison SA, Brown K, Darland C, Finch J, Hardies J, Balas B, Gastaldelli A, Tio F, Pulcini J, Berria R, Ma JZ, Dwivedi S, Havranek R, Fincke C, DeFronzo R, Bannayan GA, Schenker S, Cusi K: A placebo-controlled trial of pioglitazone in subjects with nonalcoholic steatohepatitis. N Engl J Med 355:2297-2307, 2006 23. Matsuda M, DeFronzo RA: Insulin sensitivity indices obtained from oral glucose tolerance testing: comparison with the euglycemic insulin clamp. Diabetes Care 22:1462-1470, 1999 24. Third Report of the National Cholesterol Education Program (NCEP) Expert Panel on Detection, Evaluation, and Treatment of High Blood Cholesterol in Adults (Adult Treatment Panel III) final report. Circulation 106:3143-3421, 2002 25. Kleiner DE, Brunt EM, Van Natta M, Behling C, Contos MJ, Cummings OW, Ferrell LD, Liu YC, Torbenson MS, Unalp-Arida A, Yeh M, McCullough AJ, Sanyal AJ: Design and validation of a histological scoring system for nonalcoholic fatty liver disease. Hepatology 41:1313-1321, 2005 26. Altomonte J, Cong L, Harbaran S, Richter A, Xu J, Meseck M, Dong HH: Foxo1 mediates insulin action on apoC-III and triglyceride metabolism. J Clin Invest 114:1493-1503, 2004 27. Kops GJ, Dansen TB, Polderman PE, Saarloos I, Wirtz KW, Coffer PJ, Huang TT, Bos JL, Medema RH, Burgering BM: Forkhead transcription factor FOXO3a protects quiescent cells from oxidative stress. Nature 419:316-321, 2002 28. Houstis N, Rosen ED, Lander ES: Reactive oxygen species have a causal role in multiple forms of insulin resistance. Nature 440:944-948, 2006 29. Seppala-Lindroos A, Vehkavaara S, Hakkinen AM, Goto T, Westerbacka J, Sovijarvi A, Halavaara J, Yki-Jarvinen H: Fat accumulation in the liver is associated with defects in insulin suppression of glucose production and serum free fatty acids independent of obesity in normal men. J Clin Endocrinol Metab 87:3023-3028, 2002 30. Bugianesi E, Gastaldelli A, Vanni E, Gambino R, Cassader M, Baldi S, Ponti V, Pagano G, Ferrannini E, Rizzetto M: Insulin resistance in non-diabetic patients with non-alcoholic fatty liver disease: sites and mechanisms. Diabetologia 48:634-642, 2005
FOXO1 and insulin resistance in NASH
13
31. Li X, Monks B, Ge Q, Birnbaum MJ: Akt/PKB regulates hepatic metabolism by directly inhibiting PGC-1alpha transcription coactivator. Nature 447:1012-1016, 2007 32. Rodgers JT, Lerin C, Haas W, Gygi SP, Spiegelman BM, Puigserver P: Nutrient control of glucose homeostasis through a complex of PGC-1alpha and SIRT1. Nature 434:113-118, 2005 33. Qu S, Su D, Altomonte J, Kamagate A, He J, Perdomo G, Tse T, Jiang Y, Dong HH: PPAR-{alpha} Mediates the Hypolipidemic Action of Fibrates by Antagonizing FoxO1. Am J Physiol Endocrinol Metab, 2006 34. van Gorp AG, Pomeranz KM, Birkenkamp KU, Hui RC, Lam EW, Coffer PJ: Chronic protein kinase B (PKB/c-akt) activation leads to apoptosis induced by oxidative stress-mediated Foxo3a transcriptional up-regulation. Cancer Res 66:10760-10769, 2006 35. Schattenberg JM, Singh R, Wang Y, Lefkowitch JH, Rigoli RM, Scherer PE, Czaja MJ: JNK1 but not JNK2 promotes the development of steatohepatitis in mice. Hepatology 43:163-172, 2006 36. Taniguchi CM, Ueki K, Kahn R: Complementary roles of IRS-1 and IRS-2 in the hepatic regulation of metabolism. J Clin Invest 115:718-727, 2005 37. Matsumoto M, Accili D: All roads lead to FoxO. Cell Metab 1:215-216, 2005 38. Adachi M, Osawa Y, Uchinami H, Kitamura T, Accili D, Brenner DA: The forkhead transcription factor FoxO1 regulates proliferation and transdifferentiation of hepatic stellate cells. Gastroenterology 132:1434-1446, 2007 39. Dentin R, Liu Y, Koo SH, Hedrick S, Vargas T, Heredia J, Yates J, 3rd, Montminy M: Insulin modulates gluconeogenesis by inhibition of the coactivator TORC2. Nature 449:366-369, 2007 40. Hotamisligil GS: Inflammatory pathways and insulin action. Int J Obes Relat Metab Disord 27 Suppl 3:S53-55, 2003 41. Valenti L, Fracanzani AL, Dongiovanni P, Santorelli G, Branchi A, Taioli E, Fiorelli G, Fargion S: Tumor necrosis factor alpha promoter polymorphisms and insulin resistance in nonalcoholic fatty liver disease. Gastroenterology 122:274-280, 2002 42. Kuningas M, Magi R, Westendorp RG, Slagboom PE, Remm M, van Heemst D: Haplotypes in the human Foxo1a and Foxo3a genes; impact on disease and mortality at old age. Eur J Hum Genet 15:294-301, 2007
FOXO1 and insulin resistance in NASH
14
TABLE 1. Demographic and clinical features of 86 subjects included in the study. HCV
hepatitis Normal
histology Steatosis alone NASH p
Number 16 14 28 26 Age years 56.1±11* 44.5±12 42.9±9* 49.7±10 0.003 Sex F 6 (33) 4 (29) 10 (36) 11 (42) ns BMI Kg/m2 23.8±2*† 26.7±7*† 33.2±10 35.4±8 <0.0001 LDL mg/100ml 98±30*† 127±27 132±30 141±37 0.02 Tgl/HDL 0.9±0.4*† 1.8±1*† 2.9±1.6 2.9±1.1 0.0007 Homa-IR 3.7±1.4* 2.3±1.3* 3.3±1.5* 6.7±3.6 <0.0001 IFG/IGT 4 (22) 0* 5 (18)* 13 (50) 0.003 MetS 0* 0* 15 (54)* 22 (85) <0.0001 Steat % 8 (50%)*† 0*† 24±16* 43±22 <0.0001 ALT IU/ml 59±40 28±13*† 48±27 52±28 0.02 (): % values, BMI: body mass index, LDL: LDL cholesterol levels mg/dl, Tgl/HDL: triglycerides / HDL cholesterol ration, MetS: metabolic syndrome according to ATPIII criteria (24), Steat %: percentage of steatotic hepatocytes as detected by histology, except for viral hepatitis (italic), where the percentage of affected subjects is indicated, IFG/IGT: impaired fasting glucose or impaired glucose tolerance. p: at ANOVA, *p≤0.05 vs. NASH, †p≤0.05 vs. NAFLD.
FOXO1 and insulin resistance in NASH
15
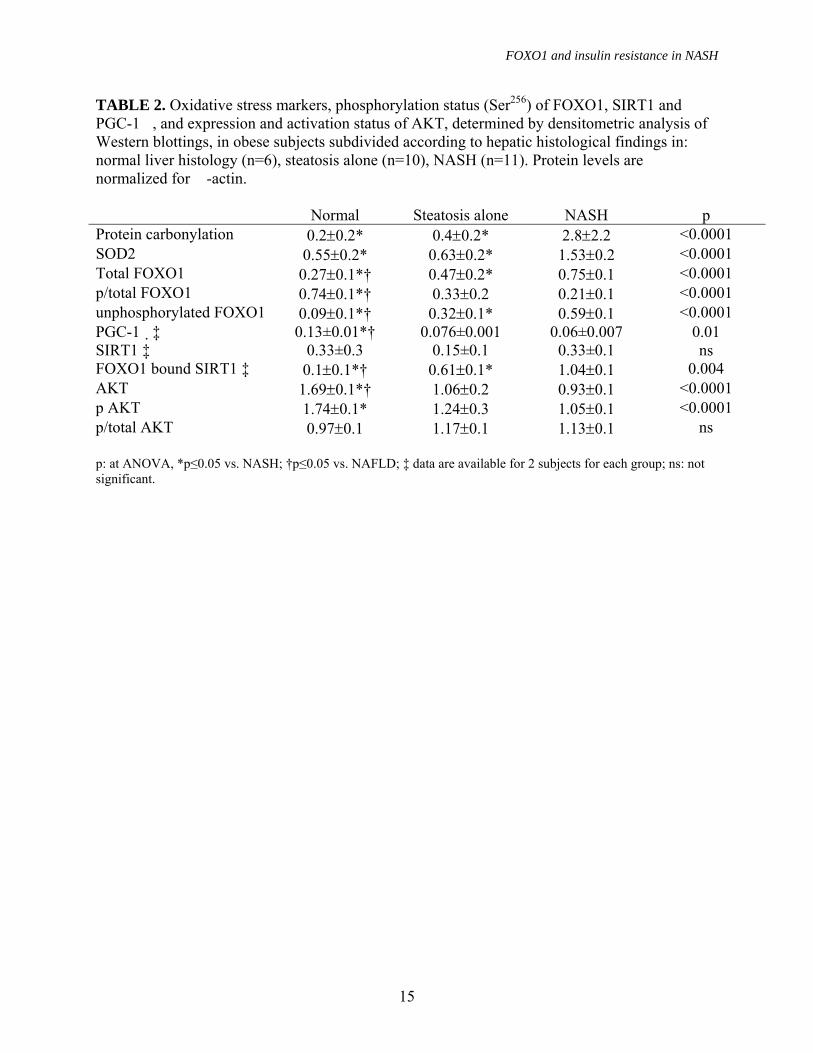
TABLE 2. Oxidative stress markers, phosphorylation status (Ser256) of FOXO1, SIRT1 and PGC-1�, and expression and activation status of AKT, determined by densitometric analysis of Western blottings, in obese subjects subdivided according to hepatic histological findings in: normal liver histology (n=6), steatosis alone (n=10), NASH (n=11). Protein levels are normalized for �-actin. Normal Steatosis alone NASH p Protein carbonylation 0.2±0.2* 0.4±0.2* 2.8±2.2 <0.0001 SOD2 0.55±0.2* 0.63±0.2* 1.53±0.2 <0.0001 Total FOXO1 0.27±0.1*† 0.47±0.2* 0.75±0.1 <0.0001 p/total FOXO1 0.74±0.1*† 0.33±0.2 0.21±0.1 <0.0001 unphosphorylated FOXO1 0.09±0.1*† 0.32±0.1* 0.59±0.1 <0.0001 PGC-1� ‡ 0.13±0.01*† 0.076±0.001 0.06±0.007 0.01 SIRT1 ‡ 0.33±0.3 0.15±0.1 0.33±0.1 ns FOXO1 bound SIRT1 ‡ 0.1±0.1*† 0.61±0.1* 1.04±0.1 0.004 AKT 1.69±0.1*† 1.06±0.2 0.93±0.1 <0.0001 p AKT 1.74±0.1* 1.24±0.3 1.05±0.1 <0.0001 p/total AKT 0.97±0.1 1.17±0.1 1.13±0.1 ns p: at ANOVA, *p≤0.05 vs. NASH; †p≤0.05 vs. NAFLD; ‡ data are available for 2 subjects for each group; ns: not significant.
FOXO1 and insulin resistance in NASH
16
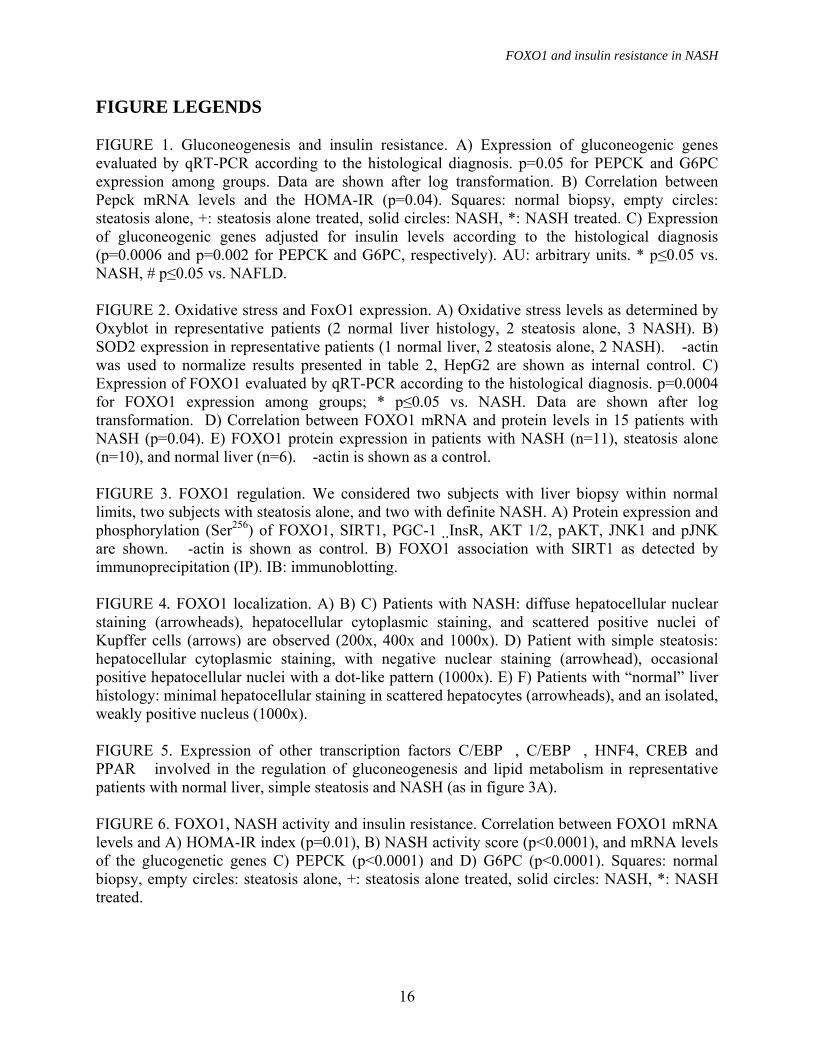
FIGURE LEGENDS FIGURE 1. Gluconeogenesis and insulin resistance. A) Expression of gluconeogenic genes evaluated by qRT-PCR according to the histological diagnosis. p=0.05 for PEPCK and G6PC expression among groups. Data are shown after log transformation. B) Correlation between Pepck mRNA levels and the HOMA-IR (p=0.04). Squares: normal biopsy, empty circles: steatosis alone, +: steatosis alone treated, solid circles: NASH, *: NASH treated. C) Expression of gluconeogenic genes adjusted for insulin levels according to the histological diagnosis (p=0.0006 and p=0.002 for PEPCK and G6PC, respectively). AU: arbitrary units. * p≤0.05 vs. NASH, # p≤0.05 vs. NAFLD. FIGURE 2. Oxidative stress and FoxO1 expression. A) Oxidative stress levels as determined by Oxyblot in representative patients (2 normal liver histology, 2 steatosis alone, 3 NASH). B) SOD2 expression in representative patients (1 normal liver, 2 steatosis alone, 2 NASH). �-actin was used to normalize results presented in table 2, HepG2 are shown as internal control. C) Expression of FOXO1 evaluated by qRT-PCR according to the histological diagnosis. p=0.0004 for FOXO1 expression among groups; * p≤0.05 vs. NASH. Data are shown after log transformation. D) Correlation between FOXO1 mRNA and protein levels in 15 patients with NASH (p=0.04). E) FOXO1 protein expression in patients with NASH (n=11), steatosis alone (n=10), and normal liver (n=6). �-actin is shown as a control. FIGURE 3. FOXO1 regulation. We considered two subjects with liver biopsy within normal limits, two subjects with steatosis alone, and two with definite NASH. A) Protein expression and phosphorylation (Ser256) of FOXO1, SIRT1, PGC-1� InsR, AKT 1/2, pAKT, JNK1 and pJNK are shown. �-actin is shown as control. B) FOXO1 association with SIRT1 as detected by immunoprecipitation (IP). IB: immunoblotting. FIGURE 4. FOXO1 localization. A) B) C) Patients with NASH: diffuse hepatocellular nuclear staining (arrowheads), hepatocellular cytoplasmic staining, and scattered positive nuclei of Kupffer cells (arrows) are observed (200x, 400x and 1000x). D) Patient with simple steatosis: hepatocellular cytoplasmic staining, with negative nuclear staining (arrowhead), occasional positive hepatocellular nuclei with a dot-like pattern (1000x). E) F) Patients with “normal” liver histology: minimal hepatocellular staining in scattered hepatocytes (arrowheads), and an isolated, weakly positive nucleus (1000x). FIGURE 5. Expression of other transcription factors C/EBP�, C/EBP�, HNF4, CREB and PPAR� involved in the regulation of gluconeogenesis and lipid metabolism in representative patients with normal liver, simple steatosis and NASH (as in figure 3A). FIGURE 6. FOXO1, NASH activity and insulin resistance. Correlation between FOXO1 mRNA levels and A) HOMA-IR index (p=0.01), B) NASH activity score (p<0.0001), and mRNA levels of the glucogenetic genes C) PEPCK (p<0.0001) and D) G6PC (p<0.0001). Squares: normal biopsy, empty circles: steatosis alone, +: steatosis alone treated, solid circles: NASH, *: NASH treated.
FOXO1 and insulin resistance in NASH
17
FIGURE 1
FOXO1 and insulin resistance in NASH
18
FIGURE 2
FOXO1 and insulin resistance in NASH
19
FIGURE 3
FOXO1 and insulin resistance in NASH
20
FIGURE 4
FOXO1 and insulin resistance in NASH
21
FIGURE 5
FOXO1 and insulin resistance in NASH
22
FIGURE 6