Embed Size (px)
Citation preview

Increasing alternative travel support for Special Educational Needs (SEN) students
- a behavioural approach
March 2019

The behaviour change hub (BCH) - our mission
Embed behavioural science practice
across the council
Discover route cause of problems
Design with people in mind
Make it easy
Create improvement feedback loops
Build an evidence base
Apply behavioural science to improve
outcomes, ways of working and
ensure services are designed to work
for people

Contents
Section Page
Executive Summary 4
The Challenge 9
The Approach 12
Define 14
Diagnose 22
Design 32
Test 41
Lessons Learnt 44
References & Credits 46
Contact Details 47

Executive summary
• Shift demand for Special
Educational Needs (SEN)
transport from Direct transport
to alternative travel options by
redesigning communications
using behavioural insights
across the customer pathway
• Test whether we can increase
awareness and number of
referrals for Independent
Travel Training from Schools
• Behavioural insights were
applied to a suite of
communications including
newsletters, leaflets, website
and emails
• An RCT tested whether a
behaviourally informed email
would increase the number of
Special Educational Needs
Co-ordinators (SENCO’s)
filling out expressions of
interest for Independent Travel
Training (ITT)
• Service staff were upskilled in
behavioural insights
• Service saw an overall
increase through more
expressions of interest in ITT
than previously forecast
• No statistically significant
difference between the
number of expressions of
interests completed for
treatment versus control email
• Managing demand by shifting
from expensive acute
provision to early intervention
and invest to save methods
can significantly reduce costs,
but take time for the benefits to
bear fruit
Activities & Goals Interventions Results

“We want our children to be able to travel safely to school, to arrive relaxed and
happy in order to learn and reach their full
potential”
How can we increase
uptake of
alternative travel
provisions?
Head of service, SEN Travel

Business case
Like most local authorities, in parallel with an increasing population and changes to the
SEND code of practice (2015) extending entitlements to SEN provision to age 25,
Croydon has seen a significant increase in the number of children presenting with
SEND and requiring home to school travel support.
Without the successful implementation of robust alternative travel options the
Council’s annual spend on SEND transport would increase by around £425,000 per
year and likely exceed £10 million within the next 5 years.
£ 7.4 mil 5 yr expend. growth £ 9.5 mil

To tackle rising costs, the service developed two alternative pathways:
The Service Plan
Independent
Travel
Training (ITT)
which
involves a
travel trainer
teaching
a child to
travel
independently
Personal
Transport
Budgets (PTBs)
which involves
paying a set
amount to
parents/carers/
students for them
to arrange
transport
themselves

1,322
1,687
761
558
77
75
58%
42%
6%
6%
The challenge in uptake of alternative pathways
Despite commercialising the ITT offer and generating a
healthy interest in ITT, the current provision was
overwhelmingly loaded towards providing direct
transport, with only 7% choosing PTBs and 5% taking up
ITT.
Whilst some students must receive direct transport
because of high level or complex needs, a significant
proportion have the capability to make use of alternative
provisions but choose not to.

THE CHALLENGE

How can we reframe the challenge through a behavioural lens?

How could a behavioural approach be developed to….
Increase uptake of alternative travel provision to enable the service to move
away from a model of rationing need through eligibility criteria and statutory
duties, in favour of a more financially sustainable preventative model centred on
empowering young people to develop resilience and independence.
This would require:
A shift in mindsets,
beliefs & behaviours…
…to recalibrate
expectations
…across all
stakeholders involved
in decisions about a
student’s transport
provision

THE APPROACH

DEFINE DIAGNOSE DESIGN TEST
Map service users pathways
Gather intelligence:• Data analysis• User insights• Observations• Journey maps
• Biases• Bottlenecks• Opportunities• Target behaviours
Intervention design• Co-design• Prioritise
• Measure impact A/B testing RCT’s
• Iterate and improve• Implement & Adapt
Learn, Iterate & Adapt
The Behaviour Change Hub ModelBCH projects follow a systematic process as set out below:

DEFINE

Overview of current council provisions, understand service user pathways and operational processes
Process mappingDesk research Field researchStakeholder interviews• Job shadowing • Process maps• User journey map
To identify the internal processes, paint points and bottlenecks that lead to difficulty in managing demand
Why?
• Policies and past research • Establish baseline• Literature review
Why?
• Wider teams & partners; • SEN team manager &
Coordinator, • Schools • SENCO & Family Support Officer
To understand the user journey and provide an overview of the overall user experience, and develop mental models of service users
Why?Why?To understand the key influencers in this project who make referrals or influence parents and young people’s decisions
• Promotional events• Travel planning meetings• ITT meetings• 1-1 interviews with parents
Identifying the problem – Research Programme
Data Analysis• Scope of influence • User segmentation• Quantify barriers & impact
Why?To identify bottlenecks in information provision and application process and identify potential for improvement
BCH conducted a research programme and behavioural audit to identify pain points and bottlenecks preventing
uptake of alternative pathways. Activities carried out during this phase are illustrated below:

Define – Data analysis
What we learnt:
Only young people with high complex needs require direct
transport, however the overwhelming majority of young people who
are suitable for alternative provision opt for direct transport.
DT= 93% ITT= 5% PTB = 7%
Insight for further exploration:
How can we help parents/carers/ decision makers overcome
behavioral barriers/ resistance and encourage to opt for alternative
transport provisions over direct transport from the outset or make
the shift from existing provision?
What we didAnalysis of existing data to
understand the scope of
influence, potential user
segmentation and baseline of
behaviors to be influenced.
Why?To identify bottlenecks in
information provision and
application process and
identify potential areas of
improvement.
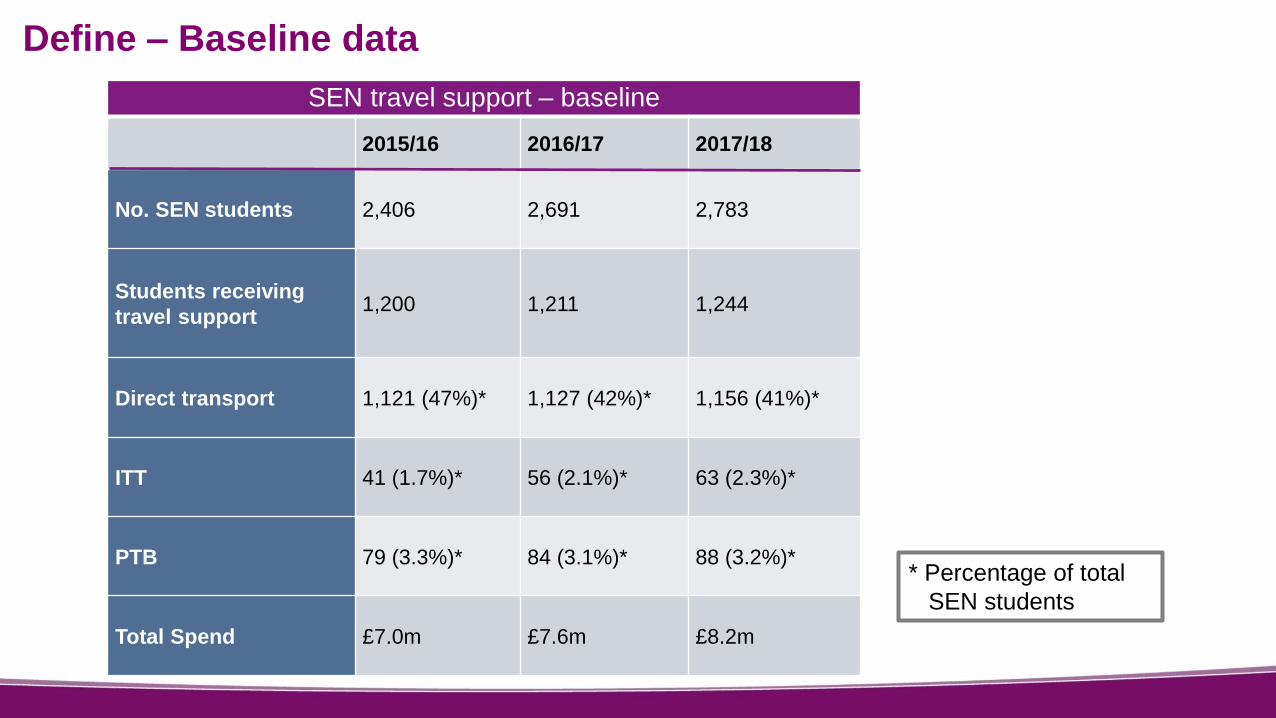
SEN travel support – baseline
2015/16 2016/17 2017/18
No. SEN students 2,406 2,691 2,783
Students receiving
travel support1,200 1,211 1,244
Direct transport 1,121 (47%)* 1,127 (42%)* 1,156 (41%)*
ITT 41 (1.7%)* 56 (2.1%)* 63 (2.3%)*
PTB 79 (3.3%)* 84 (3.1%)* 88 (3.2%)*
Total Spend £7.0m £7.6m £8.2m
Define – Baseline data
* Percentage of total
SEN students

ITT preferred pathway, over PTB, for following key reasons:
Financial:
- Cost-benefit analysis showed that ITT had bigger ROI than PTB
Positive Spillovers
- ITT has more sustainable benefits
- ITT promotes independence and provides more valuable life skills
- ITT better aligned with council’s wider strategic focus on prevention/early
intervention measures to managing demand
Negative Spillovers- ethical considerations of handing over a budget without
assessment of needs/ circumstances
Comparison of alternative travel provisions: Weighing up
which option to target:

Ethical responsibility
& unintended consequences
Potential negative spillover of PTBs:
Budget holder might not have capability/
financial literacy to manage a budget and/or
the provision could be used as a form of
control over another person
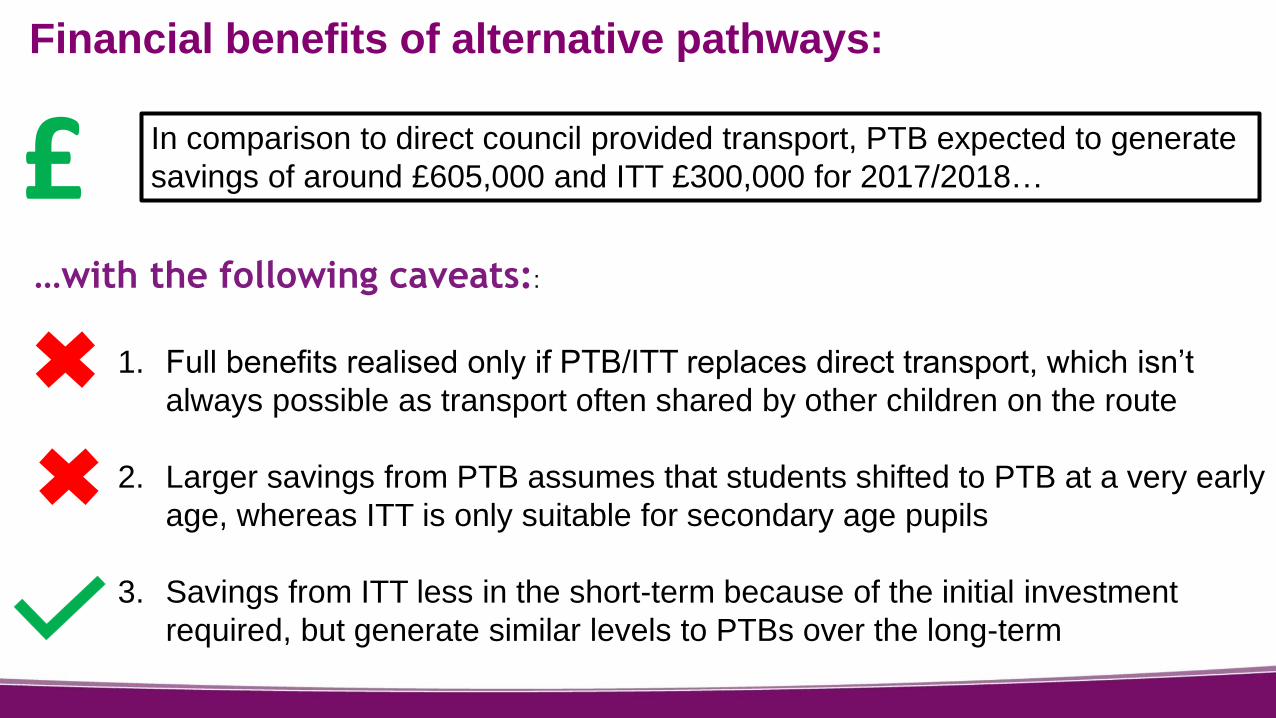
1. Full benefits realised only if PTB/ITT replaces direct transport, which isn’t
always possible as transport often shared by other children on the route
2. Larger savings from PTB assumes that students shifted to PTB at a very early
age, whereas ITT is only suitable for secondary age pupils
3. Savings from ITT less in the short-term because of the initial investment
required, but generate similar levels to PTBs over the long-term
Financial benefits of alternative pathways:
In comparison to direct council provided transport, PTB expected to generate
savings of around £605,000 and ITT £300,000 for 2017/2018…£…with the following caveats::
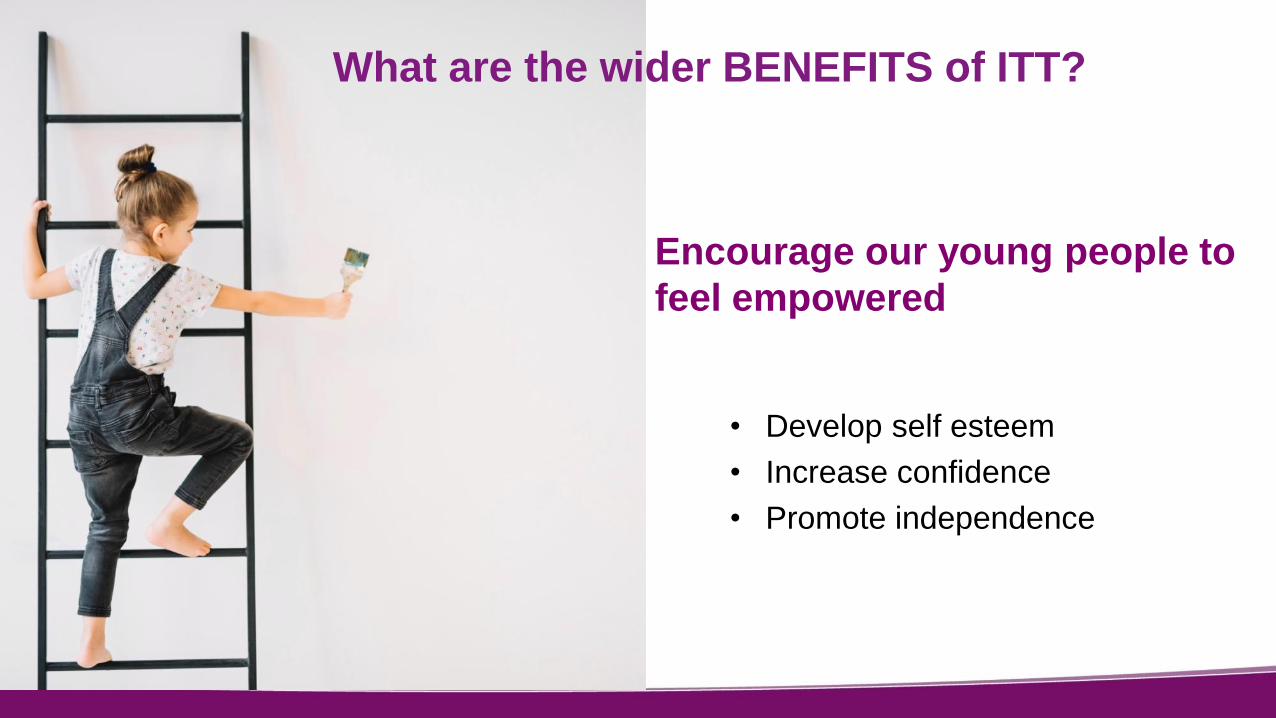
Encourage our young people to
feel empowered
• Develop self esteem
• Increase confidence
• Promote independence
What are the wider BENEFITS of ITT?

DIAGNOSE

Field Research
The main activities undertaken during this phase were:
• Referral process mapping
• One-to-one Interviews with stakeholders (service staff, teachers,
parents)
• Observation/Job shadowing
• Customer journey mapping

Process Mapping
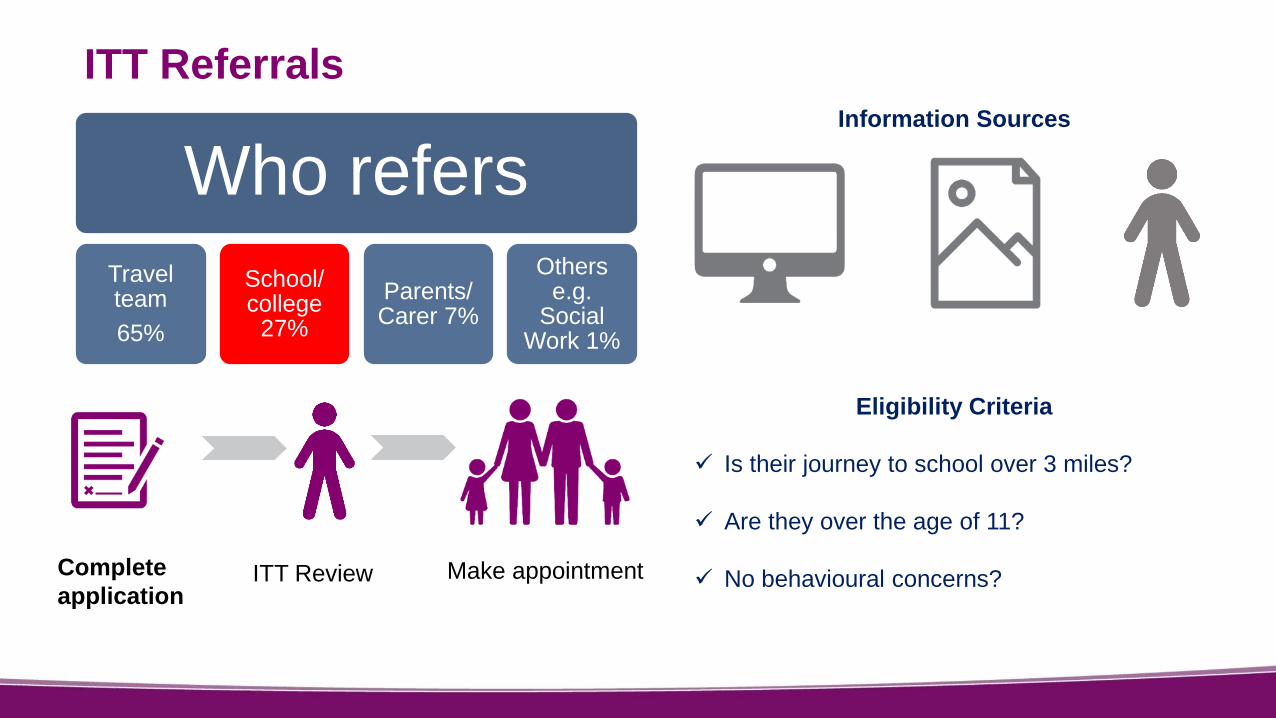
ITT Referrals
Eligibility Criteria
Is their journey to school over 3 miles?
Are they over the age of 11?
No behavioural concerns?
Who refers
Travel team
65%
School/ college
27%
Parents/ Carer 7%
Others e.g.
Social Work 1%
Complete
application ITT Review Make appointment
Information Sources

Summary of Pain Points in Referral Process
17 visits/
month
Χ Awareness
Χ Understanding
Contact with child
Χ Habit/ prompt
Χ Suitability decision
Χ Knowledge of website
Χ Understanding
Χ Usability
Χ Information Received
Χ Information Read
Χ Understanding
Alternative contact with
Council: EHCP Review Report
Χ Information for ITT
suitability captured
Additional Information Request
Χ Understanding
Χ Capacity/ Resource

Stakeholder Interviews - Insights from Service
Lack of objective problem analysis: Assumption of negative perception
of ITT by parents and schools, which has not been validated through data.
Interviews with schools suggest that independence is key to SEND
teachers and referrals are not made due to lack of knowledge, ease and
parents’ perceptions.
These beliefs may reflect a lack of response to a changing environment,
with existing views becoming entrenched over time, though group
membership and confirmation bias, instead of actively re-assessed.
This can lead to defensive framing in conversations and poorly targeted
communications.
Knowledge Bias: There was an assumption that schools knew the referral
process just as well as the service, which the interviews showed to be
erroneous
Endowment Effect: There is a strong sense of team belonging and
attachment to ITT within the service. This can lead to overestimation of the
value other people place on the service which leads to a heightened focus
on presenting benefits over simplifying the process and managing
expectations of negative consequences.
'Schools don't want to refer to ITT to avoid ruining the relationship with parents‘
'There is an element of fear that if parents show interest in Travel training we will take their names
down (to try and make them take up ITT)'

Stakeholder Interviews – Insights from Teachers
Lack of Knowledge: There is recognition that travel training
is important, but poor understanding of what it is and what the
referral process entails.
Memory Effects: Referrals are so rare, it appears most
schools do not think about them.
Diffusion of Responsibility: It’s not standard practice to
have a designated role who makes the referrals.
Punishment Avoidance (from parents): Perception of
parents as barriers for independence overall (including ITT),
and uncertain how to have conversations with parents.
“Having a prompt would be really beneficial.”“So where do I get the referral form?”
“Parents scared to let their child into the big wild world on his own”
“Council need to be firmer with families”

Stakeholder Interviews – Insights from Parents
• Risk Avoidance:
– Worry about the child’s safety (and inability to resume
transport after travel training).
– Worry about losing transport provisions and benefits
• Lack of Knowledge: Parents are often unaware of the process
until their interview with the service
– Assessment is seen as a formality and not to ensure safety of
the children
• Lack of Comprehension
– ESL, learning difficulties
• Present Day Bias: Parents feel travel training is important for the
future, but they are not ready.
– Immediate convenience of transport is valued higher than
travel training benefits (present bias)
– There is perception that their child will be one day (‘Magic 16’)
‘be ready’, but its not right now (optimism bias)
“I might get ran over if I step out the door, so of course I worry about him as he is also vulnerable”
“I worry about people that might watch him and realise he is vulnerable and take advantage”
“He has his vulnerability so the problem is not focus… He can tell you the route to London. (But) He will give his packed lunch to a beggar if he says he is hungry”

Gaps identified - Awareness & Comprehension
Service
“ITT has been around for years and we send info. to schools, so they should know.”
“I have heard of it and know the premise, but not what it entails.”
• Knowledge bias: isn’t it common
sense?
• Endowment effect: but it’s really
important!
• Staff turnover: someone, somewhere
knows…
• Diffusion of responsibility It’s not my job…
• Long leaflet: I didn’t have time to read it…
• Understanding: I just didn’t get it…
• Timing: I was dealing with an exam crisis…

Gaps identified - Process Knowledge
All you need to do is email us the form, and we will do the rest….
• Availability heuristic: but I can find it
easily…
• Optimism Bias: I could definitely find
a way…
• Endowment effect: but it’s really
important!
• Memory: I cannot remember where to
find it…
• Cognitive load: I looked at the form but
it was too long so I left it…
• Punishment aversion: It asked for
parental consent and I don’t know how
to start the conversation…

DESIGN

Design
• COM-B and debiasing frameworks were applied to address pain points
identified in the research
• Content design for behavioural prompts across the suite of
communications was based on a range of behavioural insights
• Co-creation workshop with service to feedback insights from discovery
phase, get buy in of new approach and co-design materials
• Intervention opportunities analysed using the APEASE framework from
the Behaviour Change Wheel and prioritised using the MoSCoW model
The following two pages provides examples of some of the behavioural
insights that were employed and a table of intervention ideas

Evidence based behavioural insights used in intervention design
Social Effects (minority influence)
Send letters to schools that are under referring
pupils for ITT:
‘You are not referring pupils to ITT, whilst other
similar schools in Croydon are’
‘To help you decide who can benefit from ITT you
can try…’
3%
73,406
Evidence of Social Effects
GP’s sent over-prescribing letters:
‘You are prescribing more compared to your
colleagues’
‘As an alternative to prescribing Antibiotics you can
try…’
-
Making the Application Easy
Attaching forms to the comms with an email
address to send them to can minimise perceived
difficulty and confusion, encouraging referrals.
Evidence of Application Ease
HMRC found that sending the user to the form instead
of website increased tax return completion
Use of User Stories (prototype decision
making)
Using ITT success stories of children with complex
needs can motivate teachers to refer.
Evidence of User Stories (prototype decision
making)
Parents of minority communities in the states were
more likely to enrol their children in school if they were
contacted with stories of similar families with children
successfully enrolled.
Minimising risk perception
Informing teachers that the risk the child faces is
low can increase referrals
Evidence of Minimising perceived risk
People are more likely to attend health screenings, if
they are provided with statistics that demonstrate they
overestimate mortality rate of the disease.

Intervention Ideas Aaffordability
Ppracticability
Eeffectiveness
Aacceptability
Ssafety
Eequity
SSustainability
MoS
CoW
Train all SEND children across the borough W
Predictive analytics for ITT eligibility S
Targeted comms campaigns to parents C
Behavioural prompt tools for one to one
parent visits W
Targeted comms campaign to Schools M
One to one school visits C
ITT suitability decision trees for teachers W
ITT suitability decision trees for service C
Including ITT suitability questionnaire into
EHCPlan review documents W
Including ITT suitability check box prompt
into EHCPlan review documents M
Align co-ordinated ITT / PTB approach
across all teams from council front door S

Key findings
The final list of interventions agreed were all based on the the design and delivery of a suite of
behaviourally informed communications with the goal of ‘making it easy’ to improve uptake of
ITT:
• ITT referral invitation campaign (chosen for trial)
• Behavioural insights workshops to upskill staff to apply BI to communications
• Revision of the application process, including redesign of application form, using BI
• Revision and redesign of the website using BI
• Leaflet redesign of ITT offer, to be used both for marketing and as a conversation guide during
consultations
• Increase awareness of ITT offer in schools to increase appropriate referrals
Within the timescale and budget of the project it was only possible to trial the ITT referral campaign
interventions.

Incentive expression of interest emailIDEA EXAMPLE
• What? – A behaviourally informed email
• Who? – Schools/ SENCO’s.
• When? – Tuesday/ Thursday morning
• How? – Travel trainer sends email from laptop
• Why? – Create awareness and elicit expressions of
interest
Impact measure: Number of responses
Next steps: Reminder email
Affordable Practical Effectiveness Acceptable Side-Effects Equity Sustainability MOSCOW
BCH Score Y Y Y Y N Y Y Must
ST Score Y Y Y Y N Y Y Must

Treatment email

Website Changes Example
Easy to access self-explanatory
categories
Salient deadline
Consequences- loss aversion
Explicit eligibility criteria: ease of
understanding the criteria deter
ineligible applications to save service
time
Ability to skip to relevant section: make
information easy to access
Informing users that the page is in
progress with requested feedback:
manage expectations, improve user
experience and gather further user
insight

Website Changes Example Cont.
Video with user’s talking about their ITT
experience: using existing service users as
messengers to improve trust and encourage ITT
uptake
Direct links to form and email: easy submission
encourage people to make referrals.
Explicitly stated next steps: used to manage
expectations, improving user experience and
reducing queries to service.
Explicitly stated benefits, framed as preventing
loss of freedom: incentivise ITT.

TEST

250 pupils
23 schools
23 schools Treatment Group
Control Group
Population Size
From 13,000
students, 600
identified within
target age group.
350 students
excluded due to
severity of
need/distance to
school. Therefore,
population comprised
250 children across
46 schools.
Trial designAn invitation email was redesigned using behavioural insights with a view to increasing the
number of expressions of interest for ITT from schools
Sample Size
A power analysis showed that a sample size of 30 would be sufficient but as the cost difference between
running a trial on sample of 30 or the universe of 46 schools was minimal we decided to run the trial on the
full universe in order to eliminate any possibility of sample bias.

ResultsFollowing implementation, response rates were measured over a two-week period. There were similar levels of response
from both the treatment and control groups and there was no statistical difference in the number of email responses from
schools for the control and treatment groups.
For completeness the data was analysed using a Chi square test of independence to examine the relationship between
the treatment and control group. The relationship between these variables was found not to be significant, X2(1) = 0.0, P
= 1.0. In conclusion, there was no significant difference in the response rate between the control group and the treatment
group.
However, the project generated a large increase
in ITT interest, which should translate into more
students undergoing ITT next year.
Hypothesised that the increase resulted from:
• increased awareness of ITT offer, resulting from
increased contact with stakeholders
• Hawthorne Effect – people modify their behaviour
(improved ways of working) because they are
being observed
No. of SEN students+8.50%
Direct transport-1.30%*
ITT +1.60%
PTB +12.50%
-2%
0%
2%
4%
6%
8%
10%
12%
14%
Change in Alternative Travel Uptake 2018/19 vs 2017/18 - post interventions
* Adj. for overall SEN growth

LESSONS LEARNT

1. Agile approach required - accepting goals might change as new intelligence/obstacles revealed
2. Plan project in sprints and ensure client is kept informed and understands rationale for changes
3. Conduct pre-mortem to identify risks and plan mitigating actions
4. Data & information provided should be verified – actual bottlenecks not always same as perceived by client
5. Use customer experience maps and personas to demonstrate pain points in practice - enables difficult
feedback to be depersonalised and given in a clear and constructive way
6. Establish data availability and quality at outset to ensure clear baselines and metrics of improvement -
SRO to create and manage data requirements; build in contingencies for data collection
7. Agree priorities – e.g. gathering longer-term evidence versus quick win improvements
8. Project governance important – get director buy-in to act if things get stuck or delayed
9. Difficulties and disappointments sometimes have silver linings – work with service and users generated
unexpectedly high interest in ITT, achieving goals indirectly through raised awareness
10. Unanticipated benefits - in addition to longer-term benefits, project will deliver “quick-wins” by helping service
to better manage demand and delivering service improvements through upskilling staff and overhauling
communications
Lessons learnt include:

Image credits
• Girl with rucksack: <a href="https://www.freepik.com/free-photos-vectors/background">Background photo created by freepik - www.freepik.com</a>
• Piggy bank: <a href="https://www.freepik.com/free-photos-vectors/vintage">Vintage photo created by ijeab - www.freepik.com</a>
• Brain: <a href="https://www.freepik.com/free-photos-vectors/background">Background photo created by freepik - www.freepik.com</a>
• Jigsaw: <a href="https://www.freepik.com/free-photos-vectors/business">Business vector created by rawpixel.com - www.freepik.com</a>
• Hands: <a href="https://www.freepik.com/free-photos-vectors/business">Business photo created by jcomp - www.freepik.com</a>
• RESEARCH <a href="https://www.freepik.com/free-photos-vectors/business">Business photo created by jcomp - www.freepik.com</a>
• JOB SHADOW: <a href="https://www.freepik.com/free-photos-vectors/business">Business photo created by pressfoto - www.freepik.com</a
• Child painting <a href="https://www.freepik.com/free-photos-vectors/background">Background photo created by freepik - www.freepik.com</a>
• Hands: <a href="https://www.freepik.com/free-photos-vectors/hand">Hand photo created by rawpixel.com - www.freepik.com</a>
• Couple laptop: <a href="https://www.freepik.com/free-photos-vectors/people">People photo created by yanalya - www.freepik.com</a>
• Team thumbs: <a href="https://www.freepik.com/free-photos-vectors/business">Business photo created by freepik - www.freepik.com</a>
• Lighbulb: <a href="https://www.freepik.com/free-photos-vectors/background">Background photo created by freepik - www.freepik.com</a>
• Lighbulb ideas: <a href="https://www.freepik.com/free-photos-vectors/background">Background photo created by freepik - www.freepik.com</a>
Thank you for the images credited by named contributors below:
References
Campbell, M.J., Julious, S.A. and Altman, D.G. (Oct. 28, 1995). Estimating Sample Sizes for Binary, Ordered
Categorical, and Continuous Outcomes in Two Group Comparisons. British Medical Journal, Vol. 311, No. 7013
pp. 1145-1148
Israel, G.D. (1992). Determining Sample Size. University of Florida Fact Sheet
Michie S, Atkins L, West R, The Behaviour Change Wheel (2014) http://www.behaviourchangewheel.com