Embed Size (px)
Citation preview
Increasing Funding Through Research
March 23, 2007
UTAH OFFICE OF TOURISM
The Situation in 2003
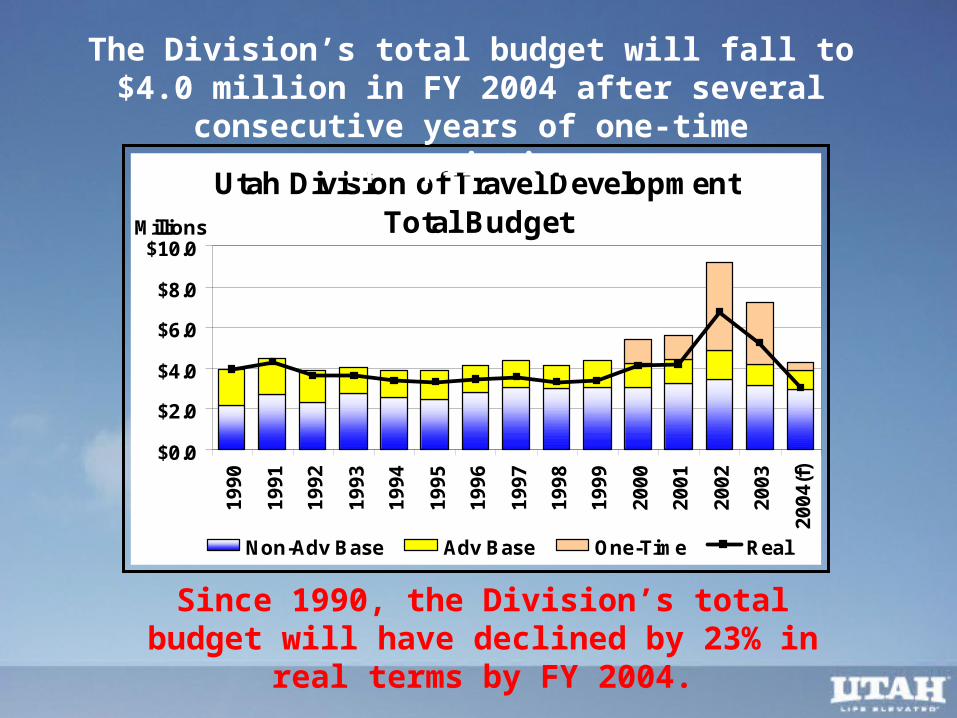
Utah Division of Travel Development Total Budget
$0.0
$2.0
$4.0
$6.0
$8.0
$10.01
99
0
19
91
19
92
19
93
19
94
19
95
19
96
19
97
19
98
19
99
20
00
20
01
20
02
20
03
20
04
(f)
Millions
Non-Adv Base Adv Base One-Time Real
The Division’s total budget will fall to $4.0 million in FY 2004 after several consecutive years of one-time appropriations.
Since 1990, the Division’s total budget will have declined by 23% in real terms by FY 2004.
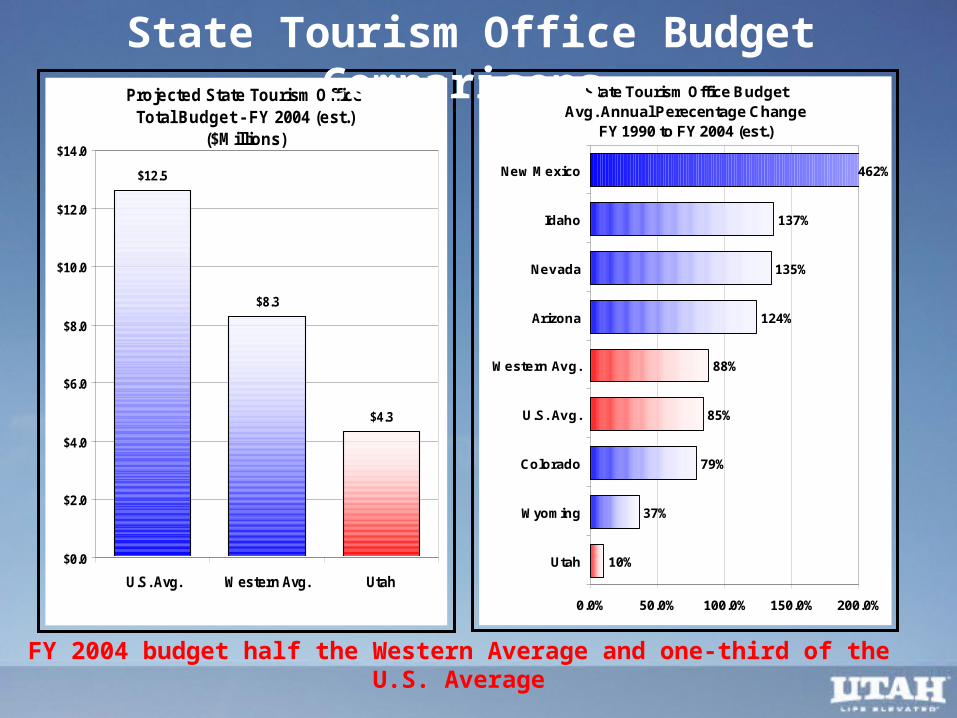
State Tourism Office BudgetAvg. Annual Perecentage Change
FY 1990 to FY 2004 (est.)
37%
79%
85%
88%
124%
135%
137%
462%
10%
0.0% 50.0% 100.0% 150.0% 200.0%
Utah
Wyoming
Colorado
U.S. Avg.
Western Avg.
Arizona
Nevada
Idaho
New Mexico
Projected State Tourism Office Total Budget - FY 2004 (est.)
($Millions)
$8.3
$4.3
$12.5
$0.0
$2.0
$4.0
$6.0
$8.0
$10.0
$12.0
$14.0
U.S. Avg. Western Avg. Utah
State Tourism Office Budget Comparisons
FY 2004 budget half the Western Average and one-third of the U.S. Average
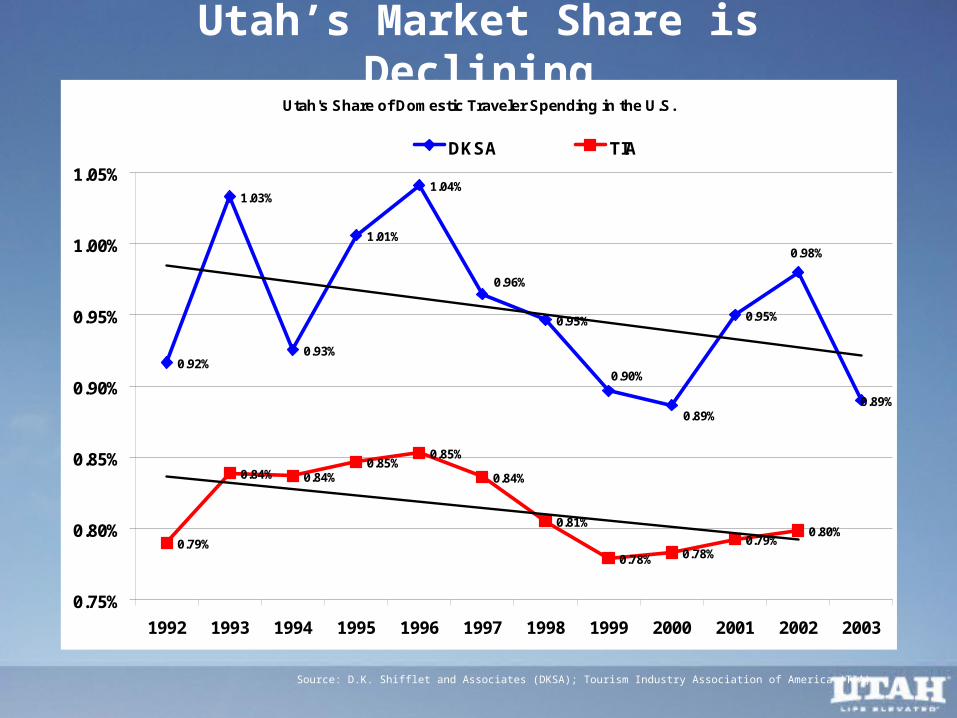
Utah’s Market Share is Declining
Source: D.K. Shifflet and Associates (DKSA); Tourism Industry Association of America (TIA)
Utah's Share of Domestic Traveler Spending in the U.S.
1.01%
0.95% 0.95%
0.89%
0.79%
0.84% 0.84%0.85%
0.85%
0.84%
0.81%
0.78% 0.78%0.79%
0.80%
0.96%
0.98%
0.89%
0.90%0.92%
0.93%
1.03%1.04%
0.75%
0.80%
0.85%
0.90%
0.95%
1.00%
1.05%
1992 1993 1994 1995 1996 1997 1998 1999 2000 2001 2002 2003
DKSA TIA
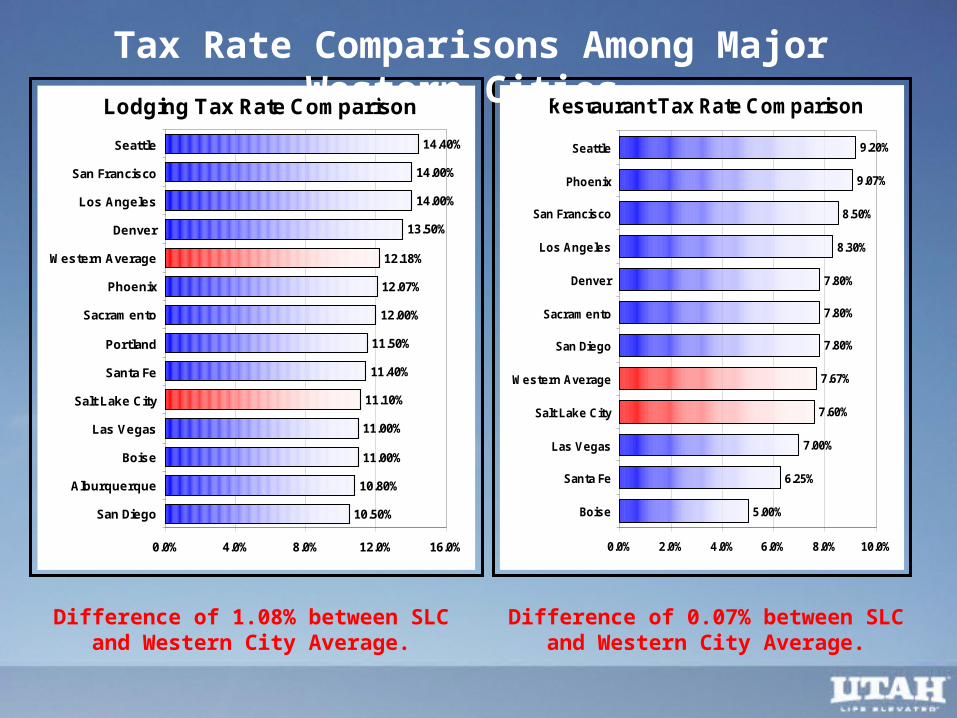
Lodging Tax Rate Comparison
10.50%
10.80%
11.00%
11.00%
11.10%
11.40%
11.50%
12.00%
12.07%
12.18%
13.50%
14.00%
14.00%
14.40%
0.0% 4.0% 8.0% 12.0% 16.0%
San Diego
Alburquerque
Boise
Las Vegas
Salt Lake City
Santa Fe
Portland
Sacramento
Phoenix
Western Average
Denver
Los Angeles
San Francisco
Seattle
Restaurant Tax Rate Comparison
5.00%
6.25%
7.00%
7.60%
7.67%
7.80%
7.80%
7.80%
8.30%
8.50%
9.07%
9.20%
0.0% 2.0% 4.0% 6.0% 8.0% 10.0%
Boise
Santa Fe
Las Vegas
Salt Lake City
Western Average
San Diego
Sacramento
Denver
Los Angeles
San Francisco
Phoenix
Seattle
Difference of 1.08% between SLC and Western City Average.
Difference of 0.07% between SLC and Western City Average.
Tax Rate Comparisons Among Major Western Cities
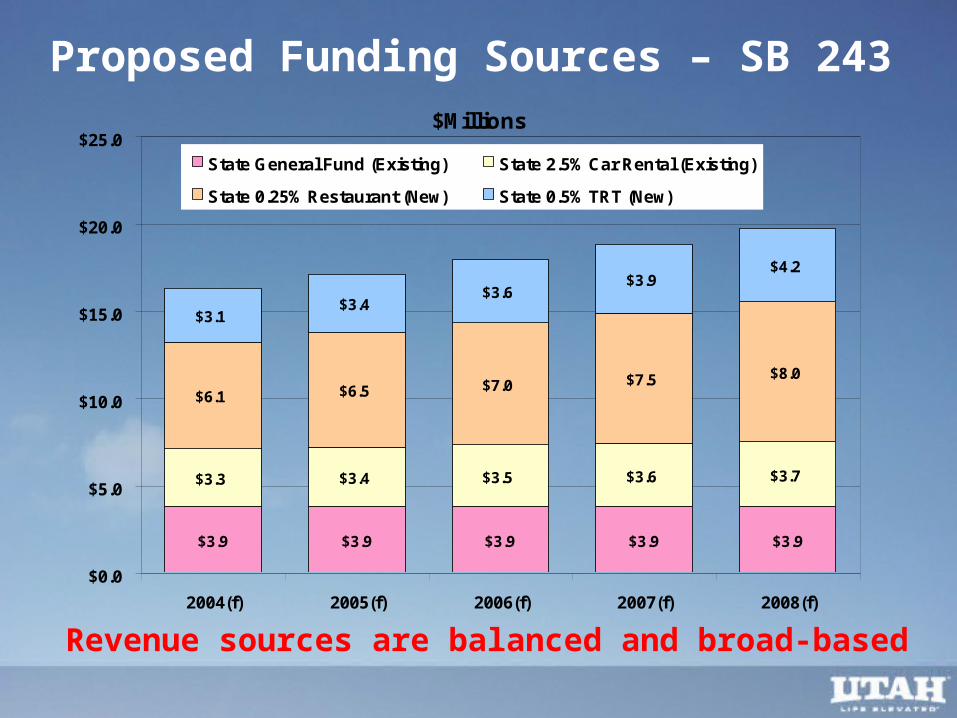
Revenue sources are balanced and broad-based
Proposed Funding Sources – SB 243 $Millions
$3.9 $3.9 $3.9 $3.9 $3.9
$3.3 $3.4 $3.5 $3.6 $3.7
$6.1 $6.5 $7.0 $7.5 $8.0
$3.1$3.4
$3.6$3.9
$4.2
$0.0
$5.0
$10.0
$15.0
$20.0
$25.0
2004(f) 2005(f) 2006(f) 2007(f) 2008(f)
State General Fund (Existing) State 2.5% Car Rental (Existing)
State 0.25% Restaurant (New) State 0.5% TRT (New)
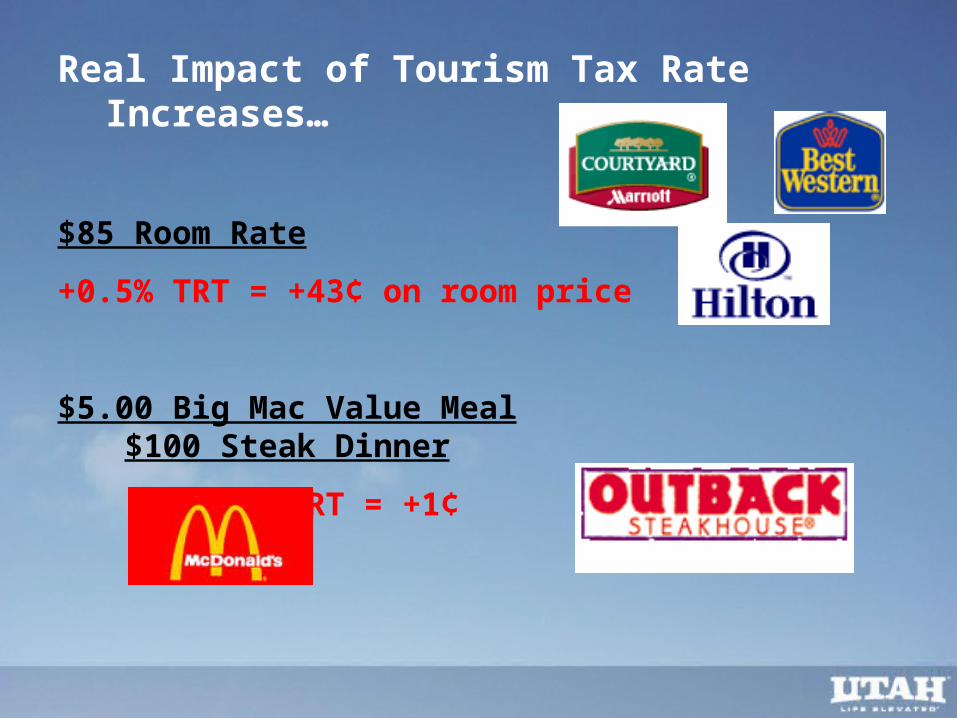
Real Impact of Tourism Tax Rate Increases…
$85 Room Rate
+0.5% TRT = +43¢ on room price
$5.00 Big Mac Value Meal $100 Steak Dinner
+0.25% RT = +1¢ = +25¢
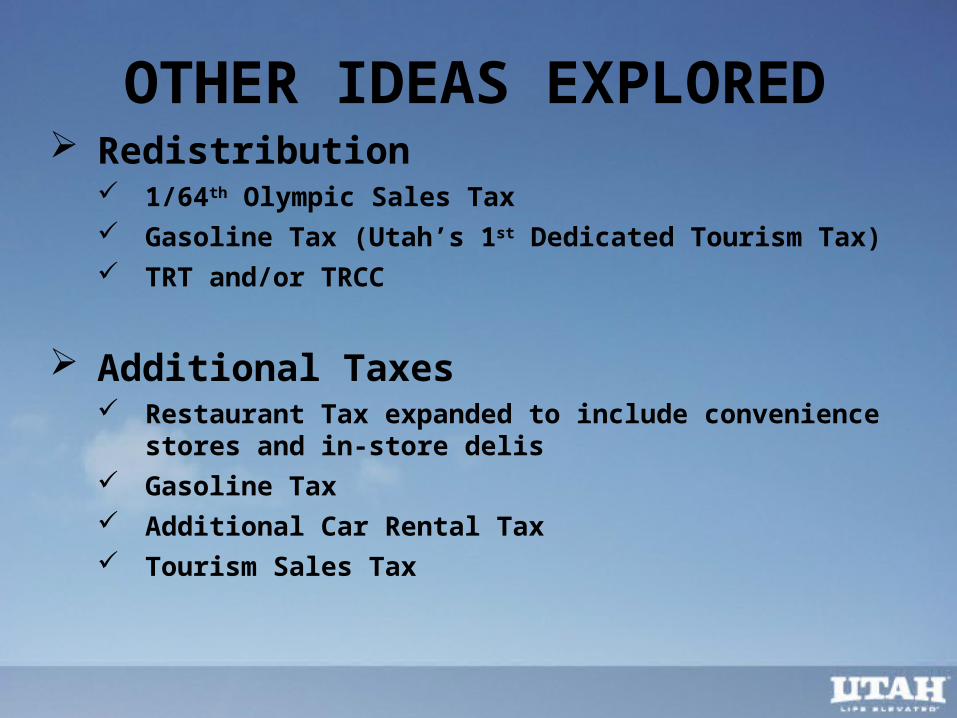
OTHER IDEAS EXPLORED Redistribution
1/64th Olympic Sales Tax Gasoline Tax (Utah’s 1st Dedicated Tourism Tax) TRT and/or TRCC
Additional Taxes Restaurant Tax expanded to include convenience stores and in-
store delis Gasoline Tax Additional Car Rental Tax Tourism Sales Tax
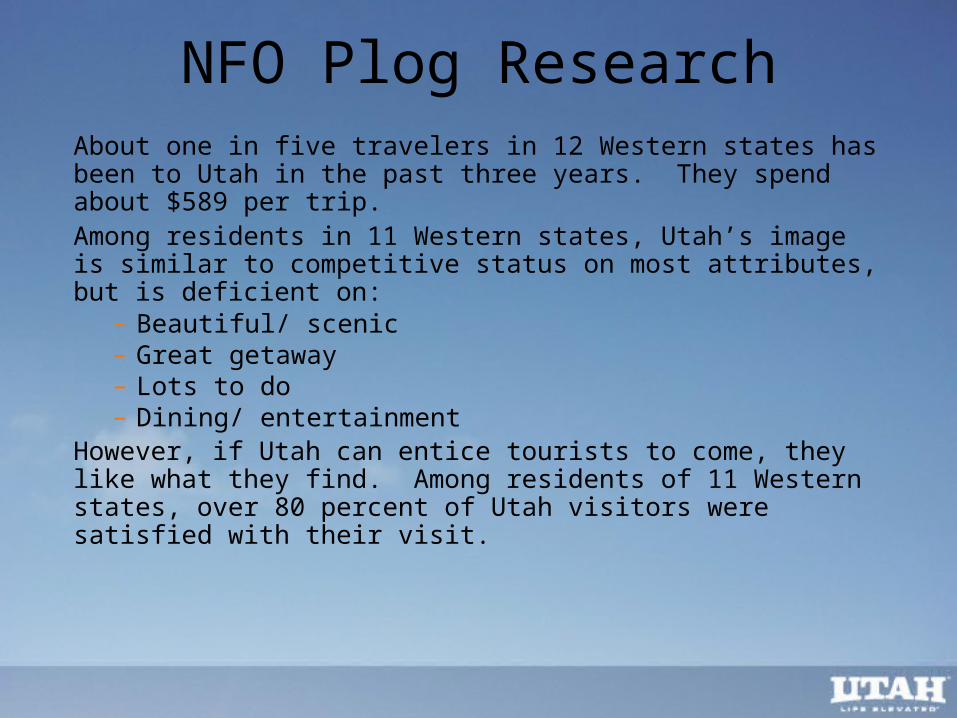
NFO Plog ResearchAbout one in five travelers in 12 Western states has been to Utah in the past three years. They spend about $589 per trip.Among residents in 11 Western states, Utah’s image is similar to competitive status on most attributes, but is deficient on:
– Beautiful/ scenic– Great getaway– Lots to do– Dining/ entertainment
However, if Utah can entice tourists to come, they like what they find. Among residents of 11 Western states, over 80 percent of Utah visitors were satisfied with their visit.
NFO Plog Research
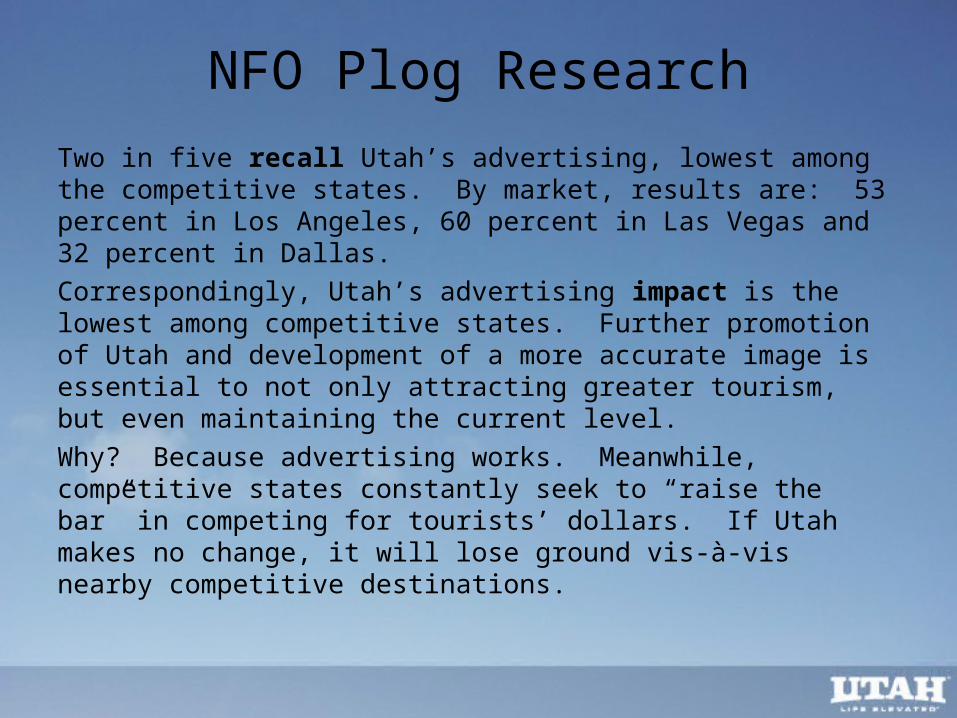
Two in five recall Utah’s advertising, lowest among the competitive states. By market, results are: 53 percent in Los Angeles, 60 percent in Las Vegas and 32 percent in Dallas.
Correspondingly, Utah’s advertising impact is the lowest among competitive states. Further promotion of Utah and development of a more accurate image is essential to not only attracting greater tourism, but even maintaining the current level.
Why? Because advertising works. Meanwhile, competitive states constantly seek to “raise the bar” in competing for tourists’ dollars. If Utah makes no change, it will lose ground vis-à-vis nearby competitive destinations.
NFO Plog Research
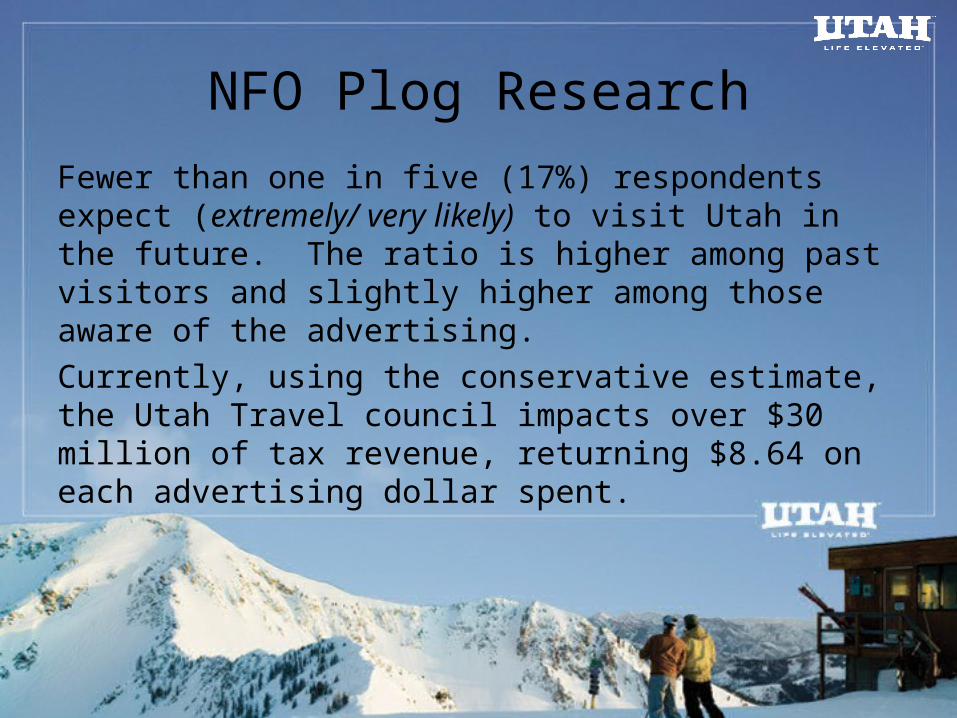
Fewer than one in five (17%) respondents expect (extremely/ very likely) to visit Utah in the future. The ratio is higher among past visitors and slightly higher among those aware of the advertising.
Currently, using the conservative estimate, the Utah Travel council impacts over $30 million of tax revenue, returning $8.64 on each advertising dollar spent.
New Legislative Assistance
• Senators Jenkins and Walker study the research and become convinced
– Tourism is High-Velocity Economic Development
• Senator Jenkins orders the industry to come together– He becomes personally involved
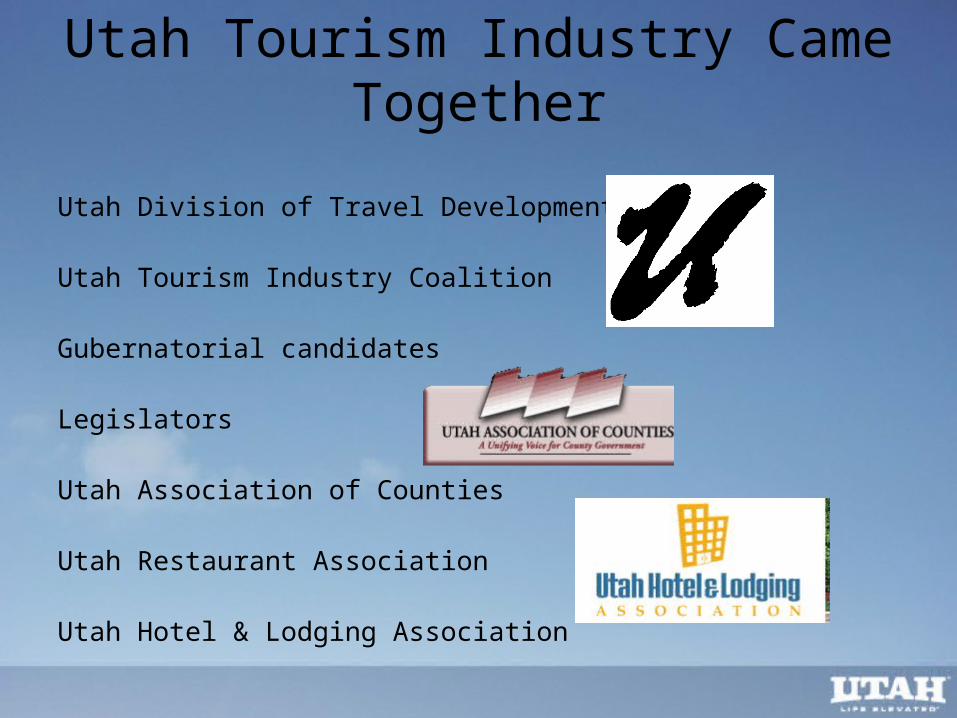
Utah Tourism Industry Came Together
Utah Division of Travel Development
Utah Tourism Industry Coalition
Gubernatorial candidates
Legislators
Utah Association of Counties
Utah Restaurant Association
Utah Hotel & Lodging Association
The Situation in 2004-05
HOW MUCH DO WE NEED?
$10 MILLION SEED REQUEST
For program of advertising, marketing, and branding as approved by the Board of Travel Development
In addition to the ongoing general fund appropriation of the Utah Travel Council’s (UTC) base operating budget
WHERE TO GET
THE MONEY? Tourism
Performance Marketing Fund
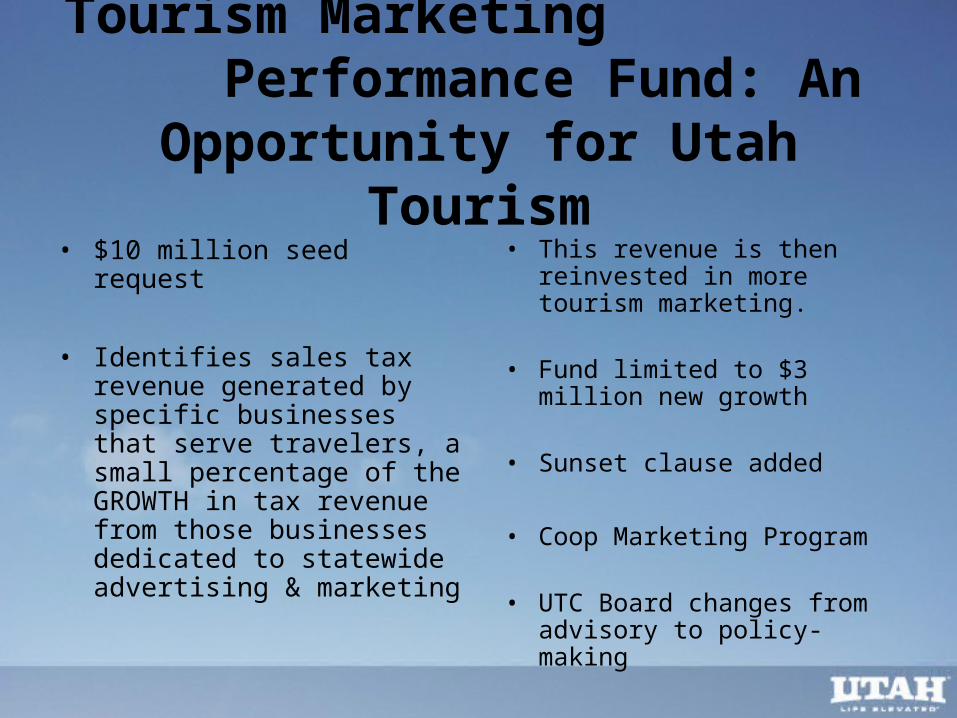
Tourism Marketing Performance Fund: An
Opportunity for Utah Tourism• $10 million seed request
• Identifies sales tax revenue generated by specific businesses that serve travelers, a small percentage of the GROWTH in tax revenue from those businesses dedicated to statewide advertising & marketing
• This revenue is then reinvested in more tourism marketing.
• Fund limited to $3 million new growth
• Sunset clause added
• Coop Marketing Program
• UTC Board changes from advisory to policy-making
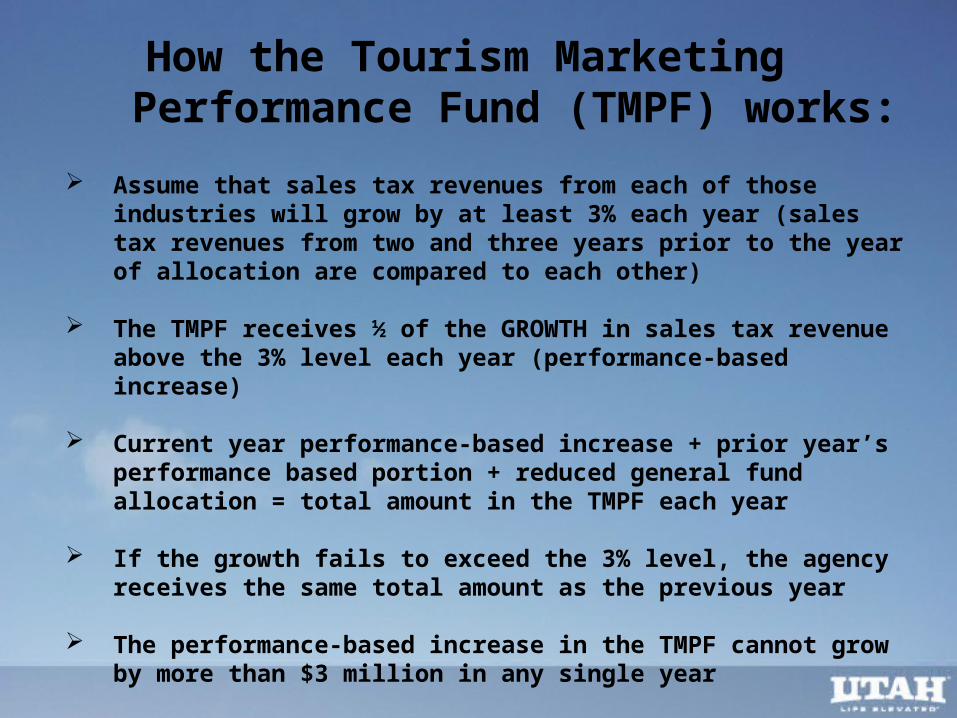
How the Tourism Marketing Performance Fund (TMPF) works:
Assume that sales tax revenues from each of those industries will grow by at least 3% each year (sales tax revenues from two and three years prior to the year of allocation are compared to each other)
The TMPF receives ½ of the GROWTH in sales tax revenue above the 3% level each year (performance-based increase)
Current year performance-based increase + prior year’s performance based portion + reduced general fund allocation = total amount in the TMPF each year
If the growth fails to exceed the 3% level, the agency receives the same total amount as the previous year
The performance-based increase in the TMPF cannot grow by more than $3 million in any single year
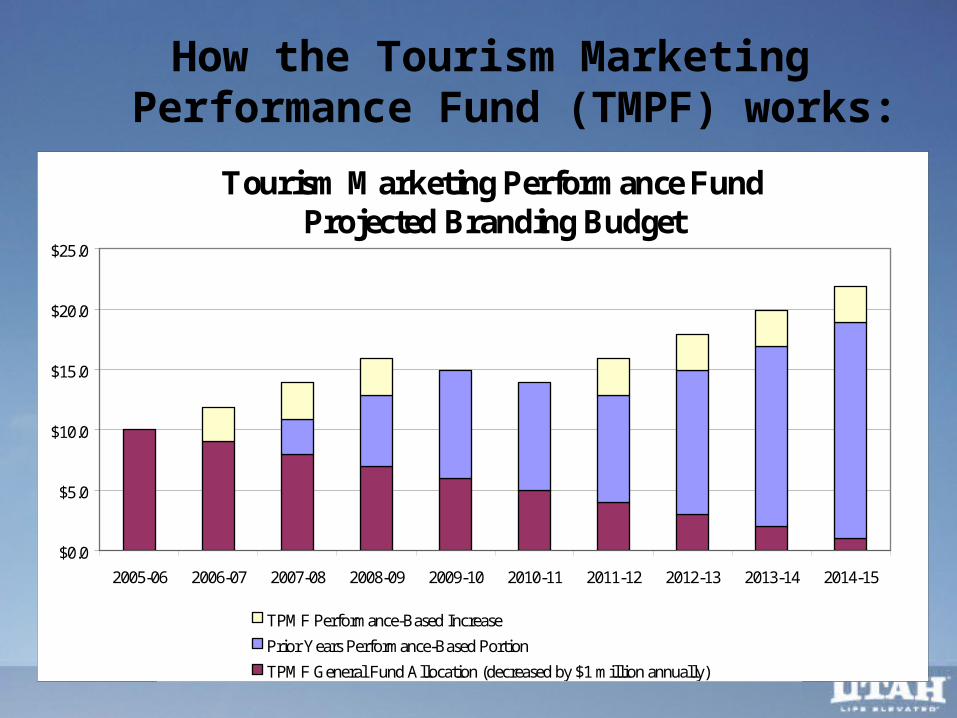
How the Tourism Marketing Performance Fund (TMPF) works:
Tourism Marketing Performance Fund Projected Branding Budget
$0.0
$5.0
$10.0
$15.0
$20.0
$25.0
2005-06 2006-07 2007-08 2008-09 2009-10 2010-11 2011-12 2012-13 2013-14 2014-15
TPMF Performance-Based Increase
Prior Years Performance-Based Portion
TPMF General Fund Allocation (decreased by $1 million annually)
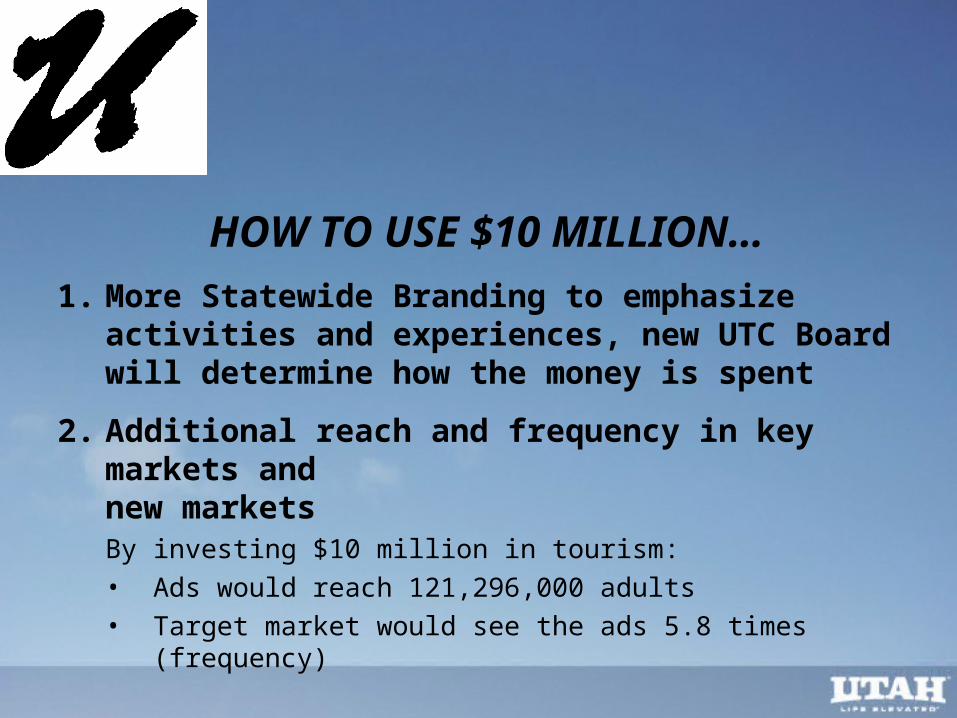
HOW TO USE $10 MILLION…
1. More Statewide Branding to emphasize activities and experiences, new UTC Board will determine how the money is spent
2. Additional reach and frequency in key markets andnew marketsBy investing $10 million in tourism:• Ads would reach 121,296,000 adults• Target market would see the ads 5.8 times (frequency)
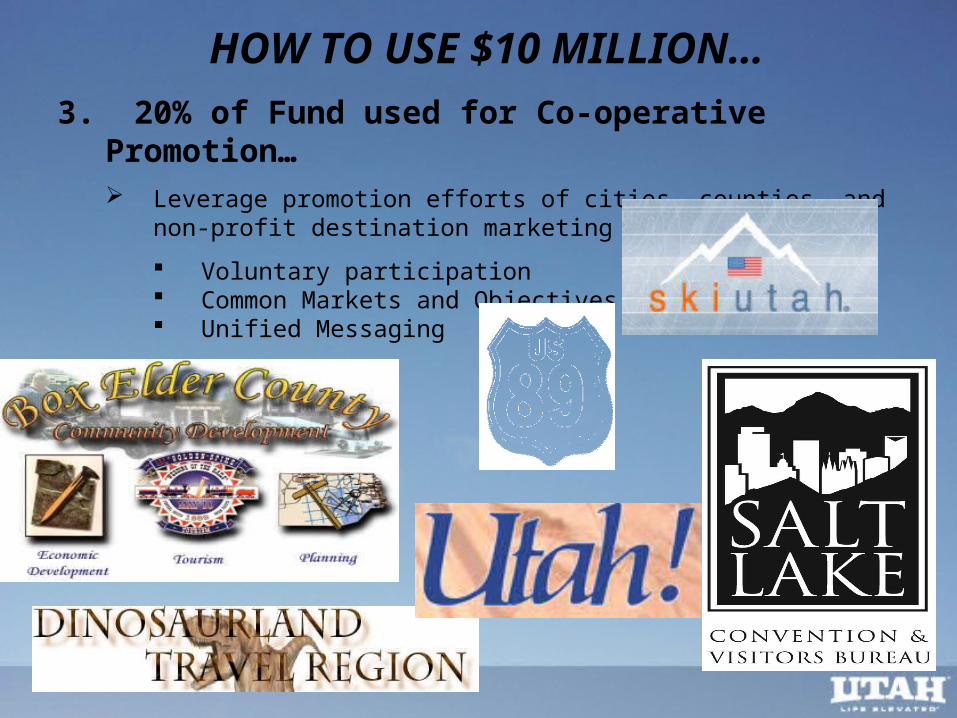
HOW TO USE $10 MILLION…
3. 20% of Fund used for Co-operative Promotion… Leverage promotion efforts of cities, counties, and non-profit destination
marketing organizations
Voluntary participation Common Markets and Objectives Unified Messaging
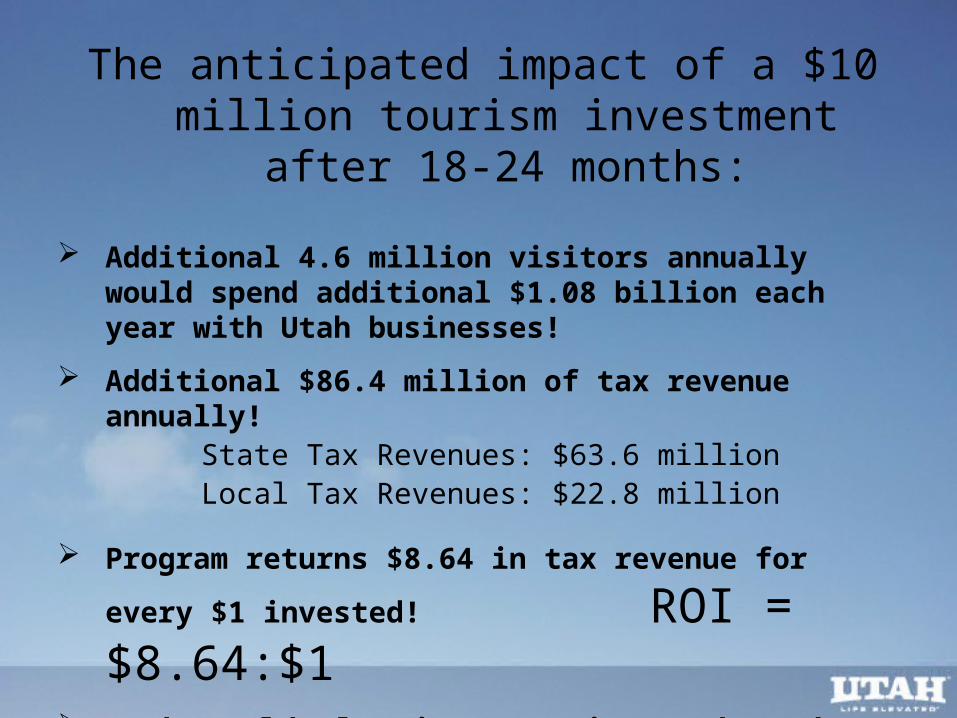
The anticipated impact of a $10 million tourism investment after 18-24 months:
Additional 4.6 million visitors annually would spend additional $1.08 billion each year with Utah businesses!
Additional $86.4 million of tax revenue annually! State Tax Revenues: $63.6 millionLocal Tax Revenues: $22.8 million
Program returns $8.64 in tax revenue for every $1
invested! ROI = $8.64:$1 Utah would also increase its market share
Source: Utah Travel Council

WHO BENEFITS?Utah Citizens Reduced annual tax burden of an additional $105 per housing
unit (in addition to the $420 in reduced taxes per housing unit that tourism is already providing)
Statewide distribution of an additional 13,333 jobs would be created (in addition to 108,000 jobs already existing due to tourism)
$8.64:$1 ROI of the citizens’ tax dollars
State Government Additional $63.6 million in tax revenues annually for
transportation, education, and other General Fund needs
High velocity economic development
Enhanced reputation for high quality of life could also lead to new businesses re-locating here
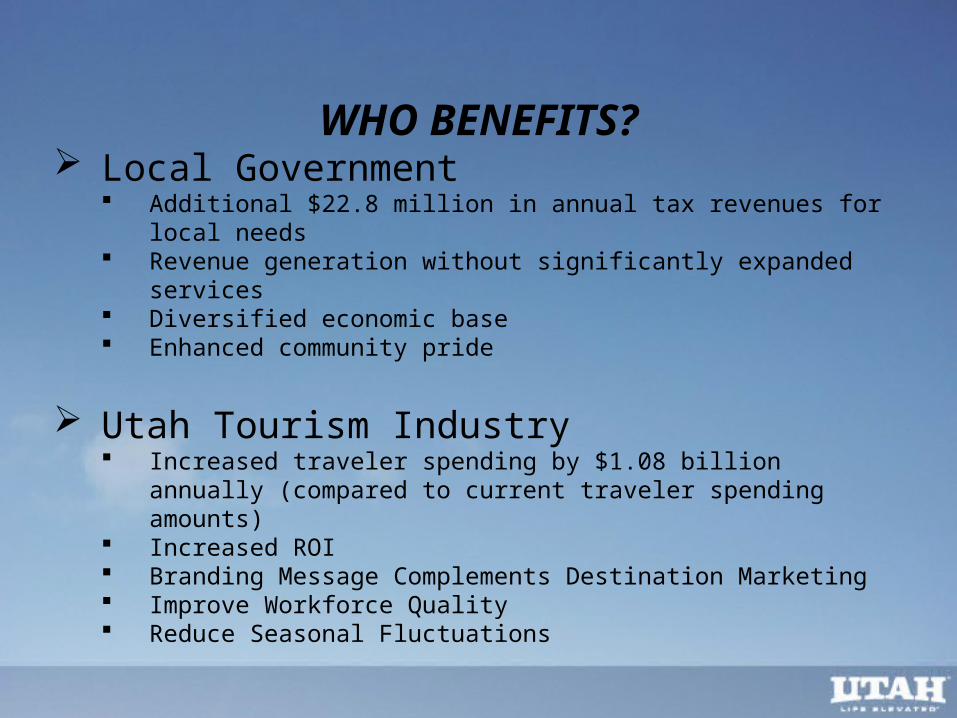
WHO BENEFITS? Local Government
Additional $22.8 million in annual tax revenues for local needs Revenue generation without significantly expanded services Diversified economic base Enhanced community pride
Utah Tourism Industry Increased traveler spending by $1.08 billion annually (compared to
current traveler spending amounts) Increased ROI Branding Message Complements Destination Marketing Improve Workforce Quality Reduce Seasonal Fluctuations
“Take-Aways”
With an ROI of $8.64:$1, tourism is a fantastic investment!
Focus on the objective – the state should invest in tourism because it’s high-velocity economic development
Supporting this legislation won’t require a tax increase, and it will ultimately generate an additional $63.6 million annually for the General Fund. This money can help pay for education, roads, and other necessary programs
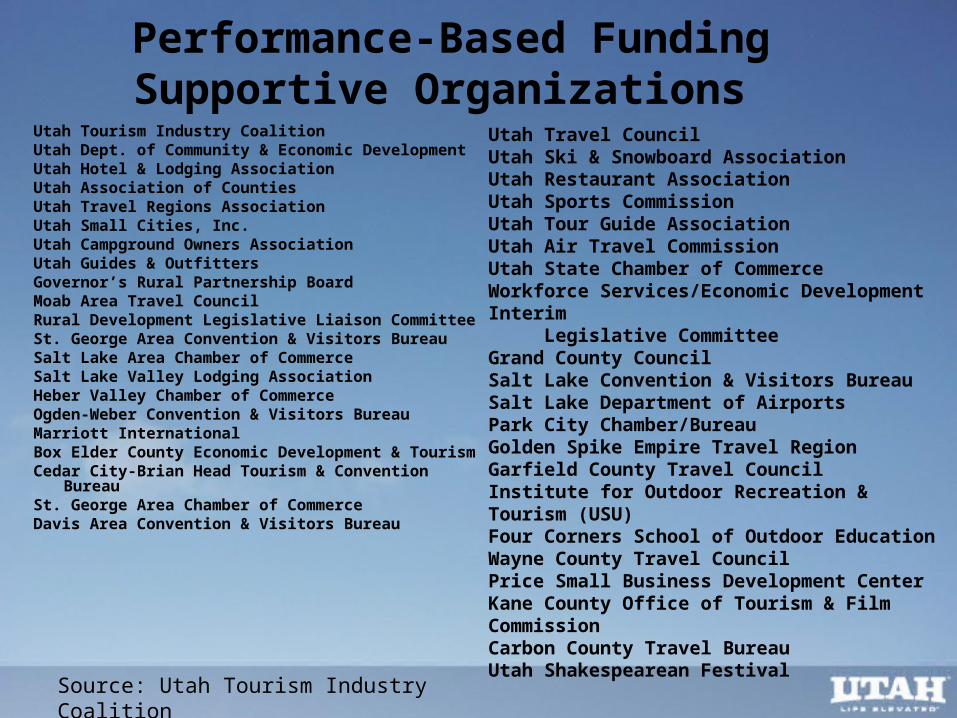
Performance-Based Funding Supportive Organizations
Utah Tourism Industry CoalitionUtah Dept. of Community & Economic DevelopmentUtah Hotel & Lodging AssociationUtah Association of CountiesUtah Travel Regions AssociationUtah Small Cities, Inc.Utah Campground Owners AssociationUtah Guides & OutfittersGovernor’s Rural Partnership BoardMoab Area Travel CouncilRural Development Legislative Liaison CommitteeSt. George Area Convention & Visitors BureauSalt Lake Area Chamber of CommerceSalt Lake Valley Lodging AssociationHeber Valley Chamber of CommerceOgden-Weber Convention & Visitors BureauMarriott InternationalBox Elder County Economic Development & TourismCedar City-Brian Head Tourism & Convention BureauSt. George Area Chamber of CommerceDavis Area Convention & Visitors Bureau
Utah Travel CouncilUtah Ski & Snowboard AssociationUtah Restaurant AssociationUtah Sports CommissionUtah Tour Guide AssociationUtah Air Travel CommissionUtah State Chamber of CommerceWorkforce Services/Economic Development Interim Legislative CommitteeGrand County CouncilSalt Lake Convention & Visitors BureauSalt Lake Department of AirportsPark City Chamber/BureauGolden Spike Empire Travel RegionGarfield County Travel CouncilInstitute for Outdoor Recreation & Tourism (USU)Four Corners School of Outdoor EducationWayne County Travel CouncilPrice Small Business Development CenterKane County Office of Tourism & Film CommissionCarbon County Travel BureauUtah Shakespearean Festival
Source: Utah Tourism Industry Coalition
We need your help!
*Grass Roots support from tourism oriented businesses and local elected
officials
*Contact your state legislator and encourage them to support Performance
Based Funding for the statewide advertising & promotion of Utah
tourism
*Get involved and be a part of the solution to this budget crises – we need
additional funding to advertise and market Utah as a tourism destination.
Utah Tourism Industry Coalition
135 East Main Street
Torrey, UT 84775
435-425-3997
www.utahtourism.org
Image Study by Strategic Marketing and
Research Inc.
Background and Objectives
• Assess overall image and level of familiarity with Utah;
• Compare attitudes/perceptions surrounding Utah as a destination;
• Measure top-of-mind and image perceptions of Utah;
• Define prevailing market position, or positioning profile, of the area;
• Investigate the competitive situation:
• Identify key motivators of visitation to Utah;
• Determine key differences between visitors and non-visitors; and
• Forward conclusions and recommendations relative to the research findings.
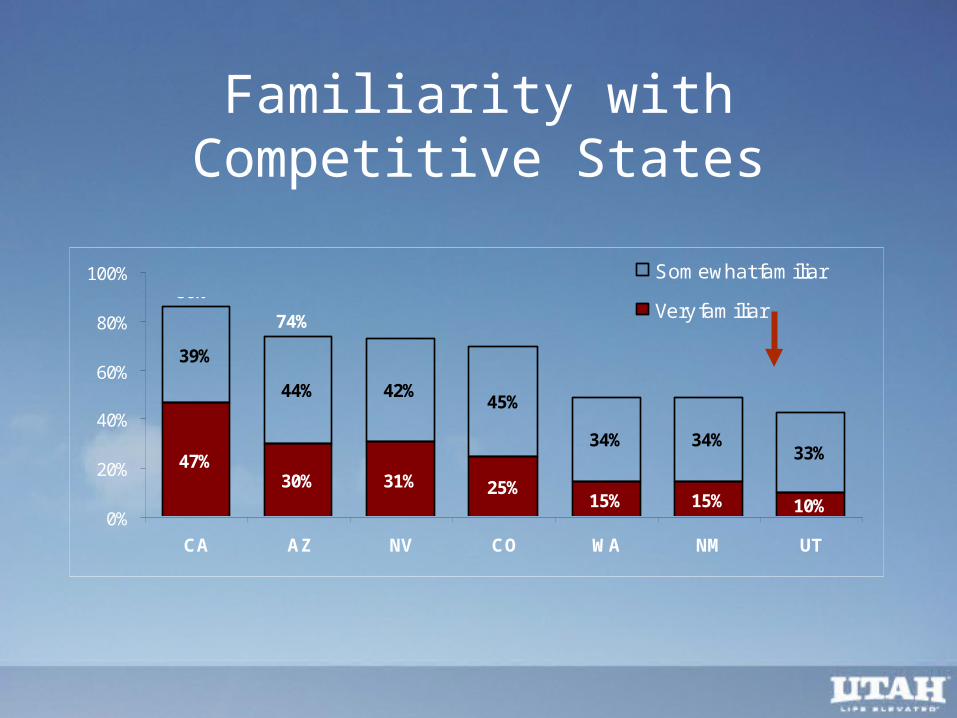
Familiarity with Competitive States
47%30% 31% 25%
15% 15% 10%
39%
44% 42%45%
34% 34%33%
0%
20%
40%
60%
80%
100%
CA AZ NV CO WA NM UT
Somewhat familiar
Very familiar74%
86%
71%74%
48%43%
49%
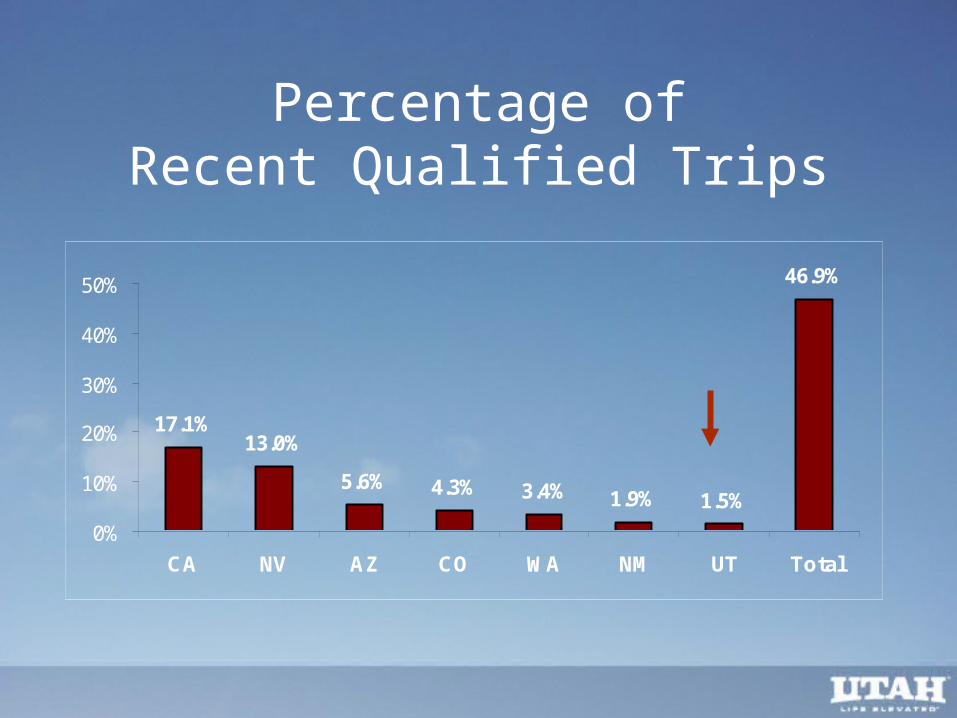
Percentage ofRecent Qualified Trips
17.1%13.0%
5.6% 4.3% 3.4% 1.9% 1.5%
46.9%
0%
10%
20%
30%
40%
50%
CA NV AZ CO WA NM UT Total
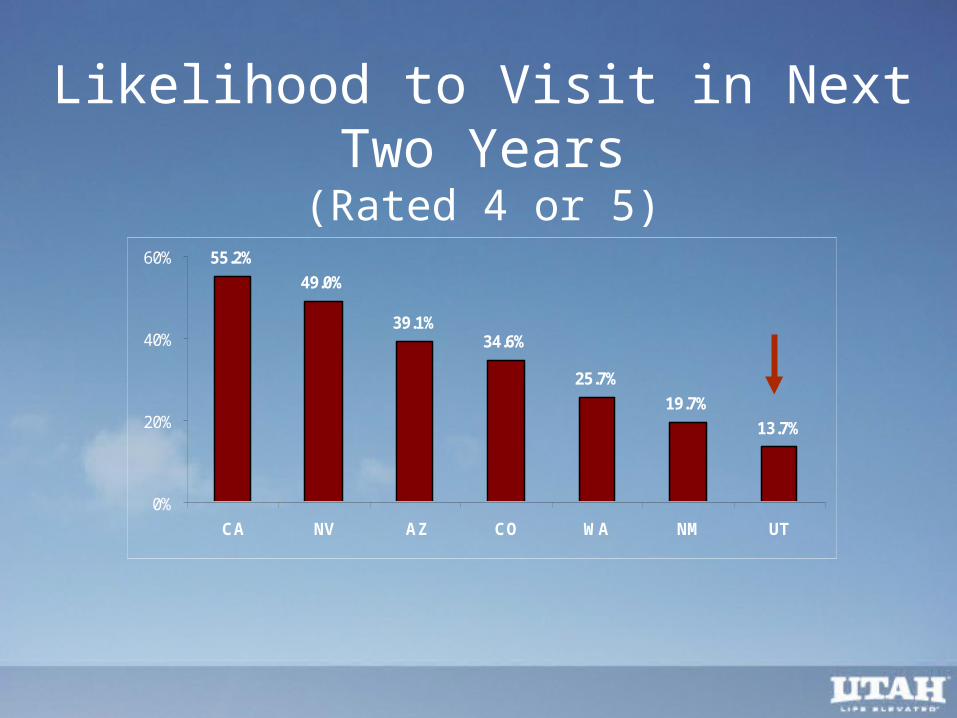
55.2%
49.0%
39.1%34.6%
25.7%
19.7%
13.7%
0%
20%
40%
60%
CA NV AZ CO WA NM UT
Likelihood to Visit in Next Two Years(Rated 4 or 5)
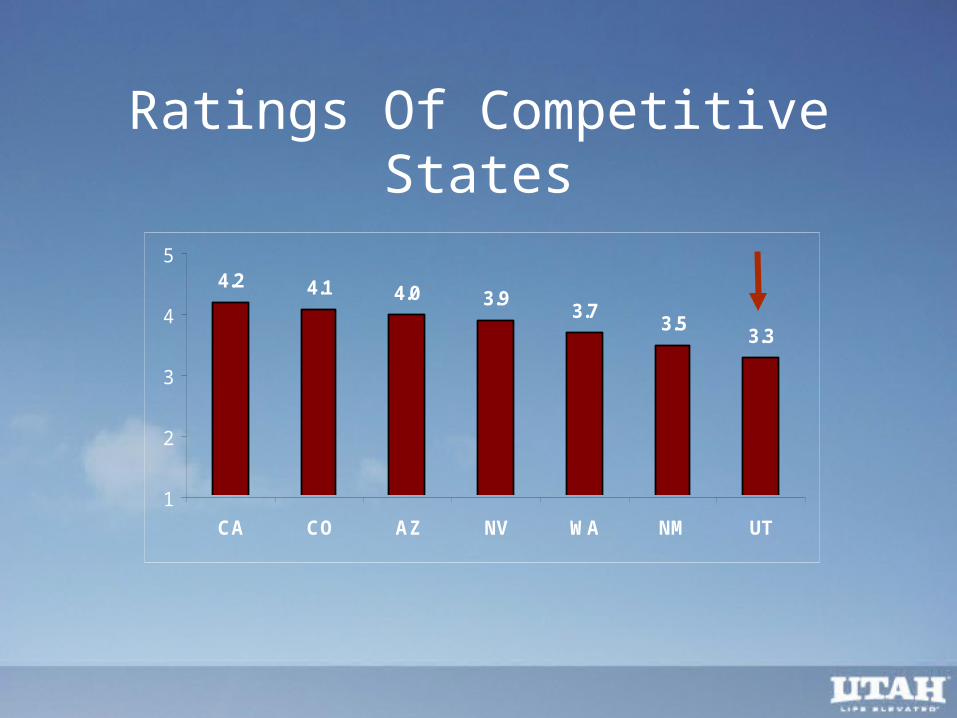
Ratings Of Competitive States
4.2 4.1 3.93.7
3.53.3
4.0
1
2
3
4
5
CA CO AZ NV WA NM UT
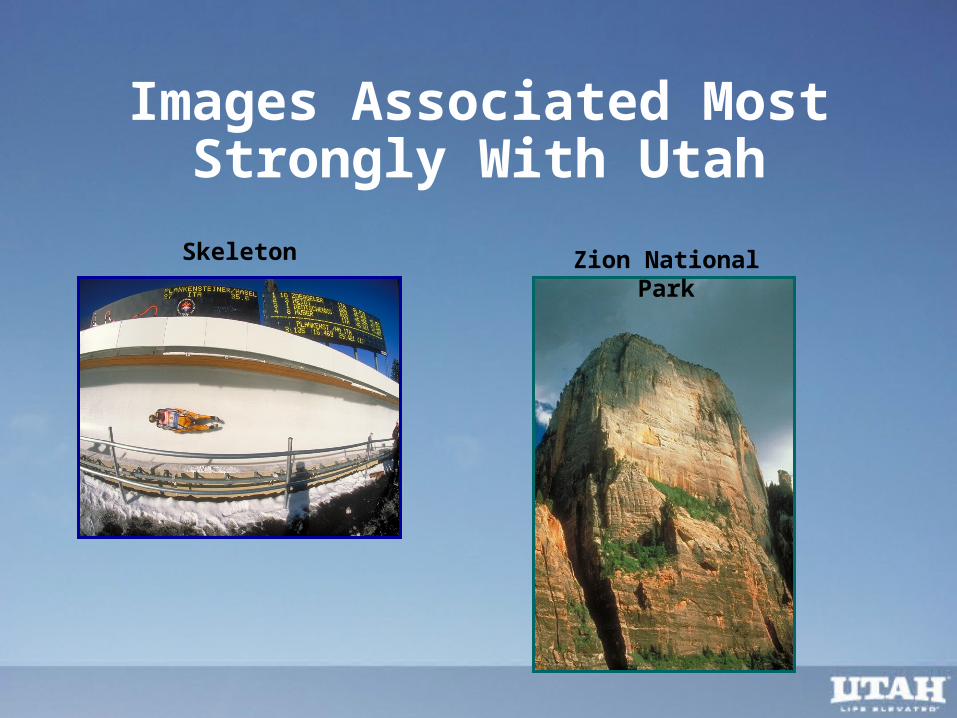
Images Associated Most Strongly With Utah
Skeleton Zion National Park

Image Associations
Images UT AZ
Arches National Park Delicate Arch 27.3% 39.2%
Bryce Amphitheater 20.2% 41.0%
Chimney Rock Capital Reef 19.1% 41.0%
Dead Horse Point State Park 8.8% 50.2%
Monument Valley 14.6% 36.1%
Needles Canyonland bikers 13.4% 41.7%
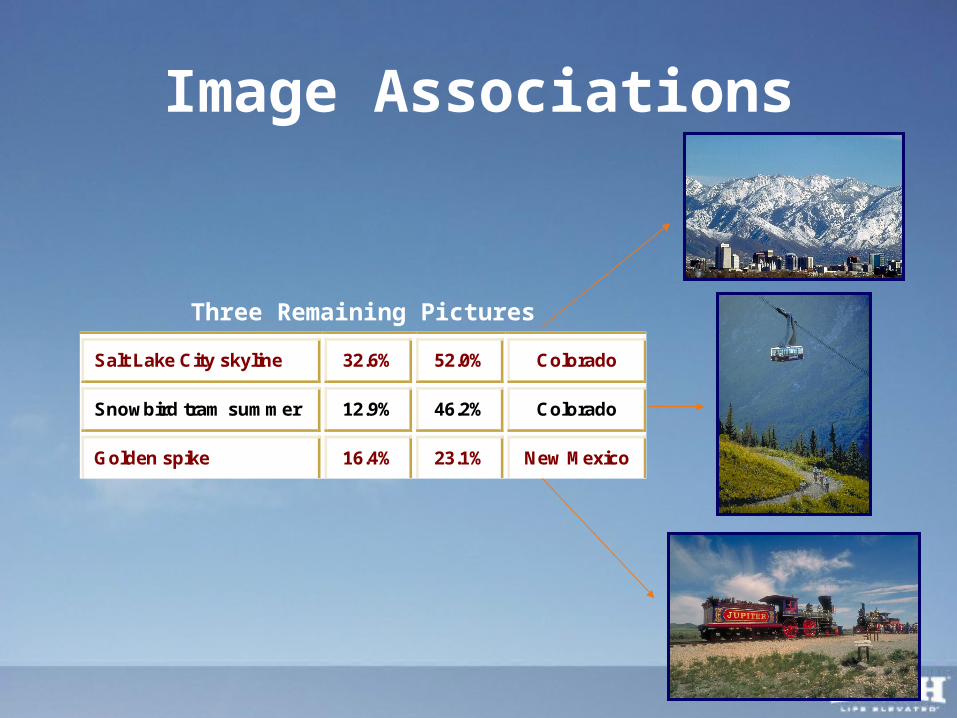
Image Associations
Salt Lake City skyline 32.6% 52.0% Colorado
Snowbird tram summer 12.9% 46.2% Colorado
Golden spike 16.4% 23.1% New Mexico
Three Remaining Pictures
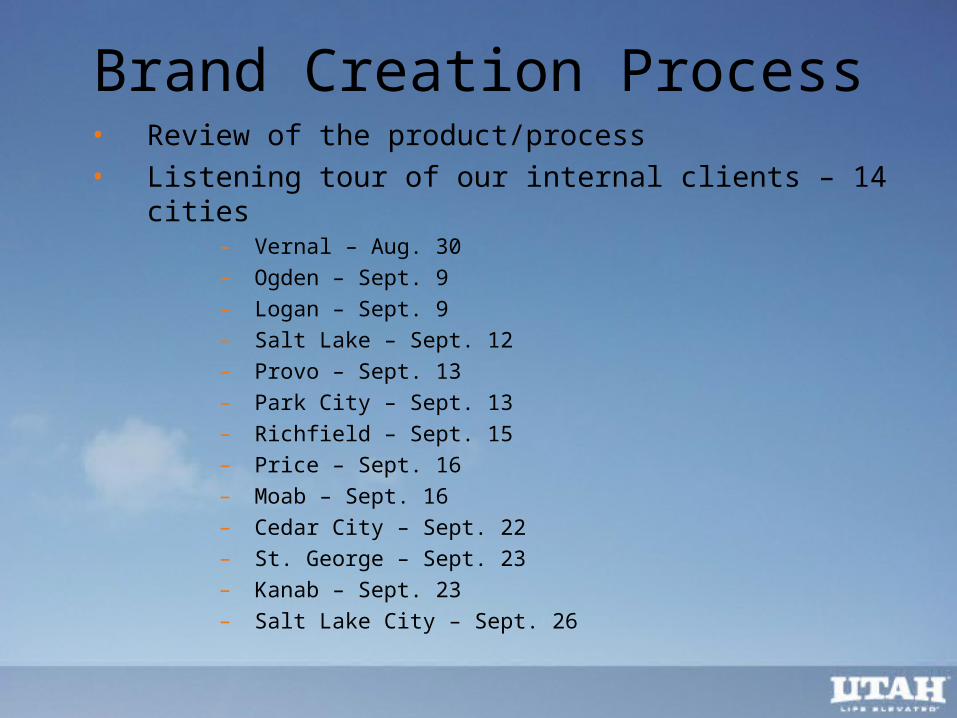
Brand Creation Process• Review of the product/process• Listening tour of our internal clients – 14 cities
– Vernal – Aug. 30– Ogden – Sept. 9– Logan – Sept. 9– Salt Lake – Sept. 12– Provo – Sept. 13– Park City – Sept. 13– Richfield – Sept. 15– Price – Sept. 16– Moab – Sept. 16– Cedar City – Sept. 22– St. George – Sept. 23– Kanab – Sept. 23– Salt Lake City – Sept. 26
Brand Creation Process
• Analysis of our external clients through research post Olympics & post 9/11
• Creation of brand hierarchy• Creation of the promise of brand essence• Consideration of the reach (cultural heritage, art,
state parks, and economic development)• Legacy (creative capability going forward)
Brand Development Timeline
• October Creative Development• Nov. 14-18 World Travel Market, London• Nov. 15 London Focus Group• Nov. 28-Dec. 2 Focus Groups in New York,
Chicago, Dallas, Los Angeles• Dec. 8 Focus Group in Salt Lake City• Dec. 5-12 Analyze research data, finalize creative
campaign• Dec. 12-31 Creative campaign/marketing plan• Jan. 6 Present draft of media/marketing plan
to Tourism Board
Brand Development Timeline• Jan. 9-12 Update creative campaign/elements to
tourism partners• Feb. 1 2nd Funding Cycle for Co-op Marketing• Feb. 8 Anniversary of 2002 Olympics/Unveil
creative campaign, to legislature, public, press
• Mar 3 Board approves brand platform• April 5 Brand Launch• April 7 Brand creative approved by Board• April 25 Board Marketing Retreat• May 5 Board will consider media buy

Cooperative Marketing Program FY 05-06, 06-07
• Deaflympics
• Ogden-Weber CVB
• American West Heritage Center
• Cache, Box Elder, Rich Counties
• Ogden Union Station
• Davis Area CVB
• Utah Valley CVB
• Thanksgiving Point
• Ski Utah
• Town of Alta
•Alta Resort Association
• Pioneer Theater Company
• Clark Planetarium, Utah Museum of Fine Arts, Thanksgiving Point Institute, Red Butte Garden
• Rotary International
• Bear River AOG
• Ogden Valley Business Association
• Sportsmen for Habitat
• Downtown Alliance
• Utah Festival Opera
• American Dream Foundation
• West Valley City
• SLC Airport
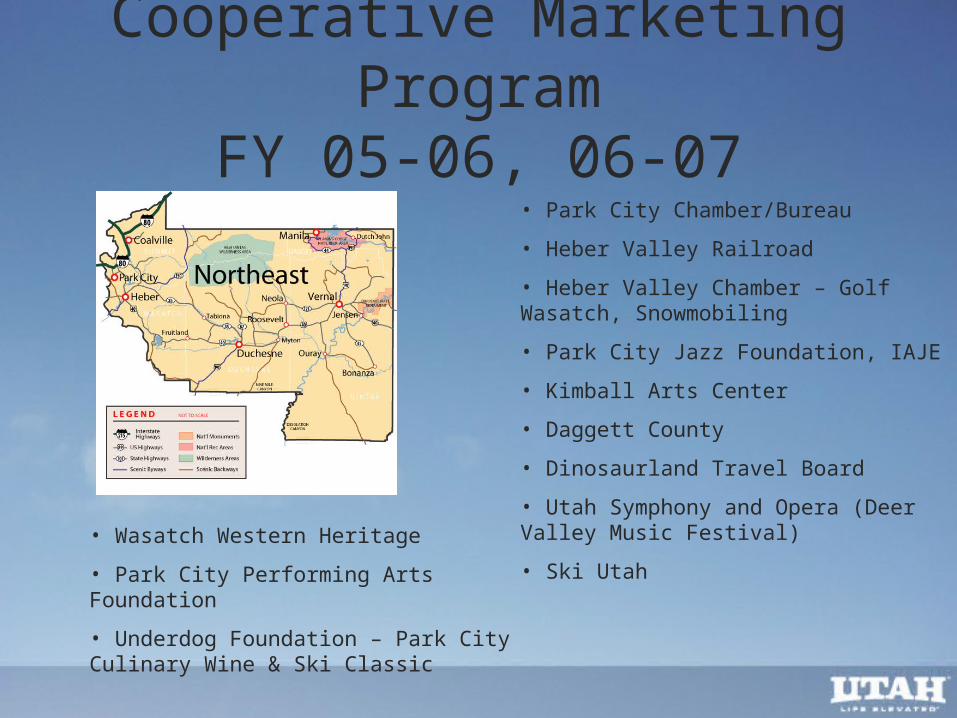
Cooperative Marketing ProgramFY 05-06, 06-07
• Park City Chamber/Bureau
• Heber Valley Railroad
• Heber Valley Chamber – Golf Wasatch, Snowmobiling
• Park City Jazz Foundation, IAJE
• Kimball Arts Center
• Daggett County
• Dinosaurland Travel Board
• Utah Symphony and Opera (Deer Valley Music Festival)
• Ski Utah
• Wasatch Western Heritage
• Park City Performing Arts Foundation
• Underdog Foundation – Park City Culinary Wine & Ski Classic
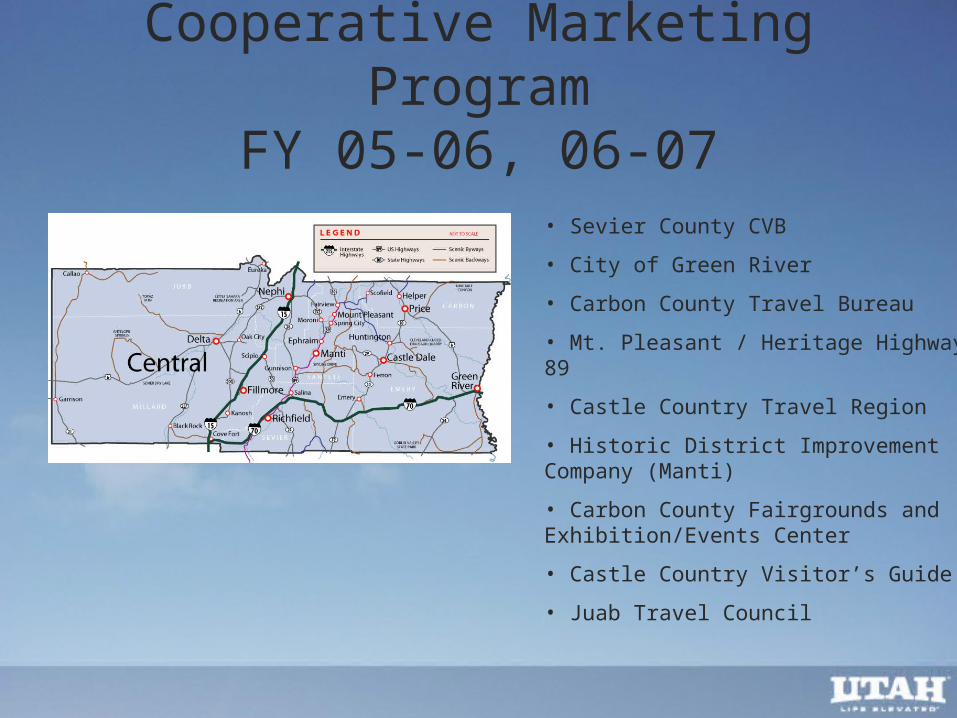
Cooperative Marketing ProgramFY 05-06, 06-07
• Sevier County CVB
• City of Green River
• Carbon County Travel Bureau
• Mt. Pleasant / Heritage Highway 89
• Castle Country Travel Region
• Historic District Improvement Company (Manti)
• Carbon County Fairgrounds and Exhibition/Events Center
• Castle Country Visitor’s Guide
• Juab Travel Council
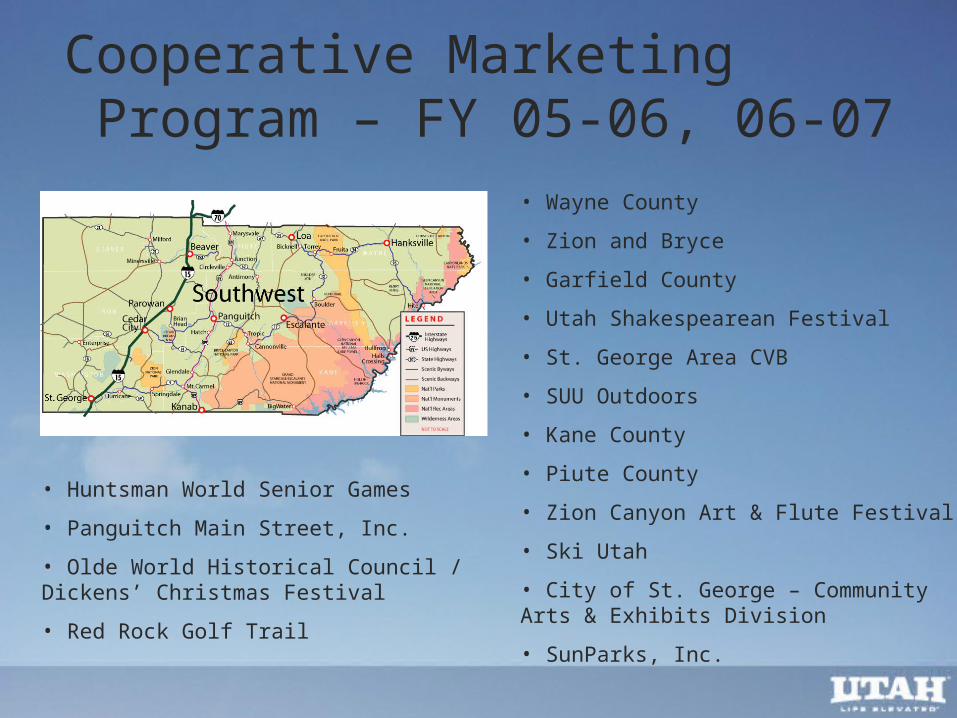
Cooperative Marketing Program – FY 05-06, 06-07
• Wayne County
• Zion and Bryce
• Garfield County
• Utah Shakespearean Festival
• St. George Area CVB
• SUU Outdoors
• Kane County
• Piute County
• Zion Canyon Art & Flute Festival
• Ski Utah
• City of St. George – Community Arts & Exhibits Division
• SunParks, Inc.
• Huntsman World Senior Games
• Panguitch Main Street, Inc.
• Olde World Historical Council / Dickens’ Christmas Festival
• Red Rock Golf Trail
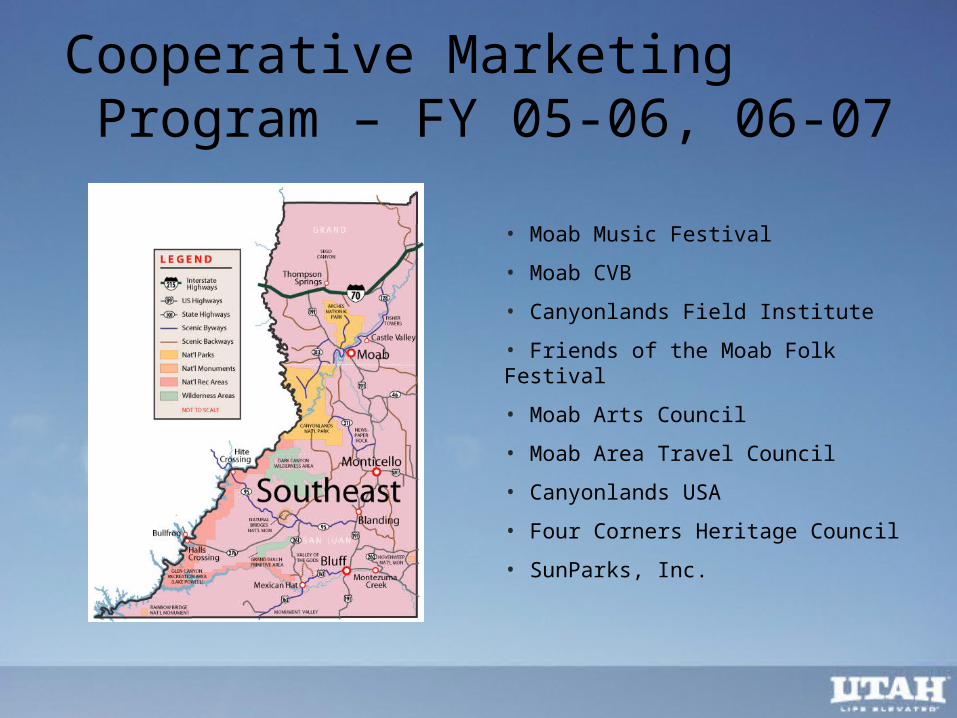
Cooperative Marketing Program – FY 05-06, 06-07
• Moab Music Festival
• Moab CVB
• Canyonlands Field Institute
• Friends of the Moab Folk Festival
• Moab Arts Council
• Moab Area Travel Council
• Canyonlands USA
• Four Corners Heritage Council
• SunParks, Inc.
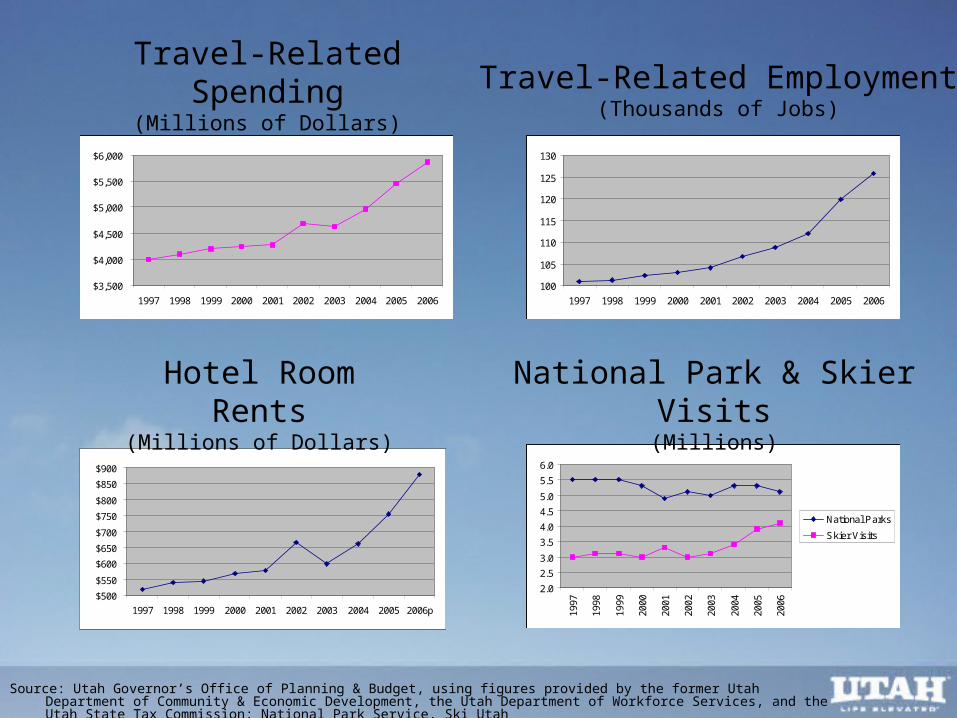
Travel-Related Spending(Millions of Dollars)
$3,500
$4,000
$4,500
$5,000
$5,500
$6,000
1997 1998 1999 2000 2001 2002 2003 2004 2005 2006
Source: Utah Governor’s Office of Planning & Budget, using figures provided by the former Utah Department of Community & Economic Development, the Utah Department of Workforce Services, and the Utah State Tax Commission; National Park Service, Ski Utah
100
105
110
115
120
125
130
1997 1998 1999 2000 2001 2002 2003 2004 2005 2006
Travel-Related Employment(Thousands of Jobs)
$500
$550
$600
$650
$700
$750
$800
$850
$900
1997 1998 1999 2000 2001 2002 2003 2004 2005 2006p
Hotel Room Rents(Millions of Dollars)
2.0
2.5
3.0
3.5
4.0
4.5
5.0
5.5
6.0
1997
1998
1999
2000
2001
2002
2003
2004
2005
2006
National Parks
Skier Visits
National Park & Skier Visits(Millions)
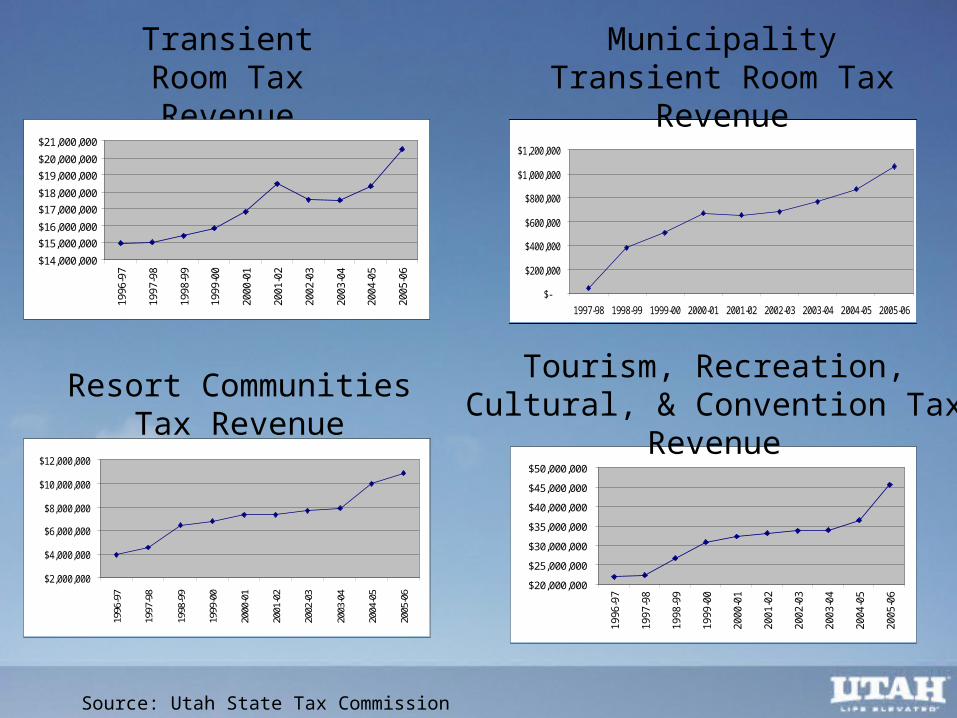
Transient Room Tax Revenue
Source: Utah State Tax Commission
$14,000,000
$15,000,000
$16,000,000
$17,000,000
$18,000,000
$19,000,000
$20,000,000
$21,000,000
1996
-97
1997
-98
1998
-99
1999
-00
2000
-01
2001
-02
2002
-03
2003
-04
2004
-05
2005
-06
$-
$200,000
$400,000
$600,000
$800,000
$1,000,000
$1,200,000
1997-98 1998-99 1999-00 2000-01 2001-02 2002-03 2003-04 2004-05 2005-06
Municipality Transient Room Tax Revenue
$2,000,000
$4,000,000
$6,000,000
$8,000,000
$10,000,000
$12,000,000
1996
-97
1997
-98
1998
-99
1999
-00
2000
-01
2001
-02
2002
-03
2003
-04
2004
-05
2005
-06
Resort Communities Tax Revenue
$20,000,000
$25,000,000
$30,000,000
$35,000,000
$40,000,000
$45,000,000
$50,000,000
1996
-97
1997
-98
1998
-99
1999
-00
2000
-01
2001
-02
2002
-03
2003
-04
2004
-05
2005
-06
Tourism, Recreation, Cultural, & Convention Tax Revenue
Key Points• Let the industry and government officials know you
are committed to obtaining professional research• Work with your industry trade organization – they
can pull in all facets of the industry• Find champions in the legislature who will take the
time to understand the impact tourism can have• Get support from the Governor• Present results to those providing the funding and
the industry
The Situation in 2006-07