Embed Size (px)
Citation preview

Increasing Net Present Value by a Third at an Operating Sublevel Cave Mine Using Draw Strategy Optimisation
Presented by Alex Campbell

Presentation Overview
• Three year project to optimise the draw strategy at the Ernest Henry SLC
• Achieved a 32% increase in mine NPV and developed a new process for draw strategy optimisation
• This presentation provides an overview of the project including:
• Summary of the Ernest Henry Mine
• Draw strategy overview
• Cave flow and recovery modelling
• Optimisation process
• Results and grade reconciliation

Mine Location
• Located 38km North East of Cloncurry
• Copper and gold deposit
• Open pit from 1997 to 2011
• First underground production in 2012
• Mine life to 2026
SLC
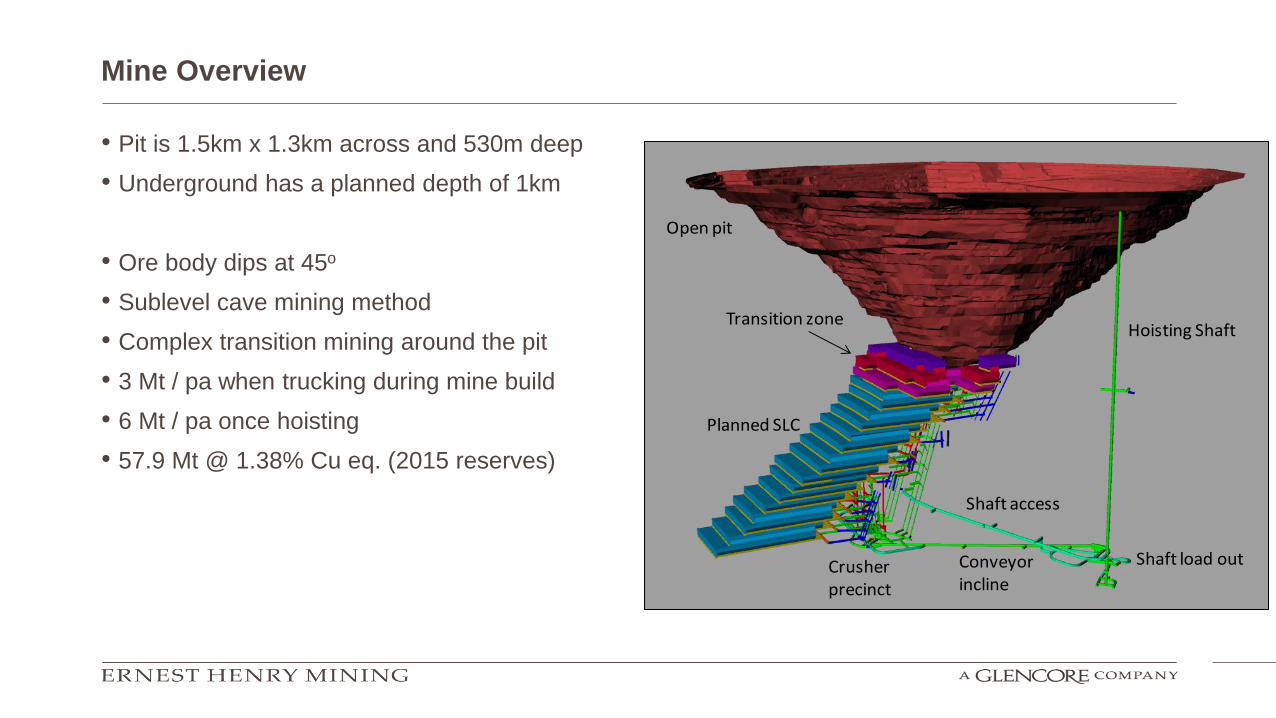
Mine Overview
• Pit is 1.5km x 1.3km across and 530m deep
• Underground has a planned depth of 1km
• Ore body dips at 45o
• Sublevel cave mining method
• Complex transition mining around the pit
• 3 Mt / pa when trucking during mine build
• 6 Mt / pa once hoisting
• 57.9 Mt @ 1.38% Cu eq. (2015 reserves)
Hoisting Shaft
Open pit
Shaft access
Conveyor incline
Shaft load out
Transition zone
Planned SLC
Crusher precinct

SLC Dilution and Recovery
• A potential disadvantage of sublevel caving is the relatively high dilution and ore loss
• Dilution of 15-30%
• Ore loss of 10% to 20%
• Dilution can be internal or external, planned or unplanned
• Many examples in the literature on the issue of dilution

Additional Challenges at the Ernest Henry SLC
• Ore body inclined at 45 degrees resulting in-
• A new source of hangingwall dilution on each level
• Draw constraints required along the hanging wall for air blast management
• A zone along the footwall without production rings below
• Ore has similar density to waste
• Ore is not (easily) visually distinguished from waste
• Sampling not always practical or timely with high turn over of production rings
• Therefore, the mine needed a tonnage based draw strategy determined by grade
modelling techniques

Flow Model Overview
• Flow modelling conducted using PGCA software
• Cellular automata solver
• Capable of simulating different particle properties for
different rock types and for fines
• Simulations are run to a prescribed tonnage or to a
user specified shut-off grade
• Model output includes tonnes and grade information
• All flow modelling conducted by site personnel
Draw Strategy Optimisation
What is the “optimal” draw strategy?
• Adheres to safety requirements
• Air blast, mud rush, cave propagation requirements
• Maximises economic return
• Optimum balance between ore recovery and dilution
• Exploits grade bearing external dilution where possible
• Ensures enough draw points are available so that production targets can be met

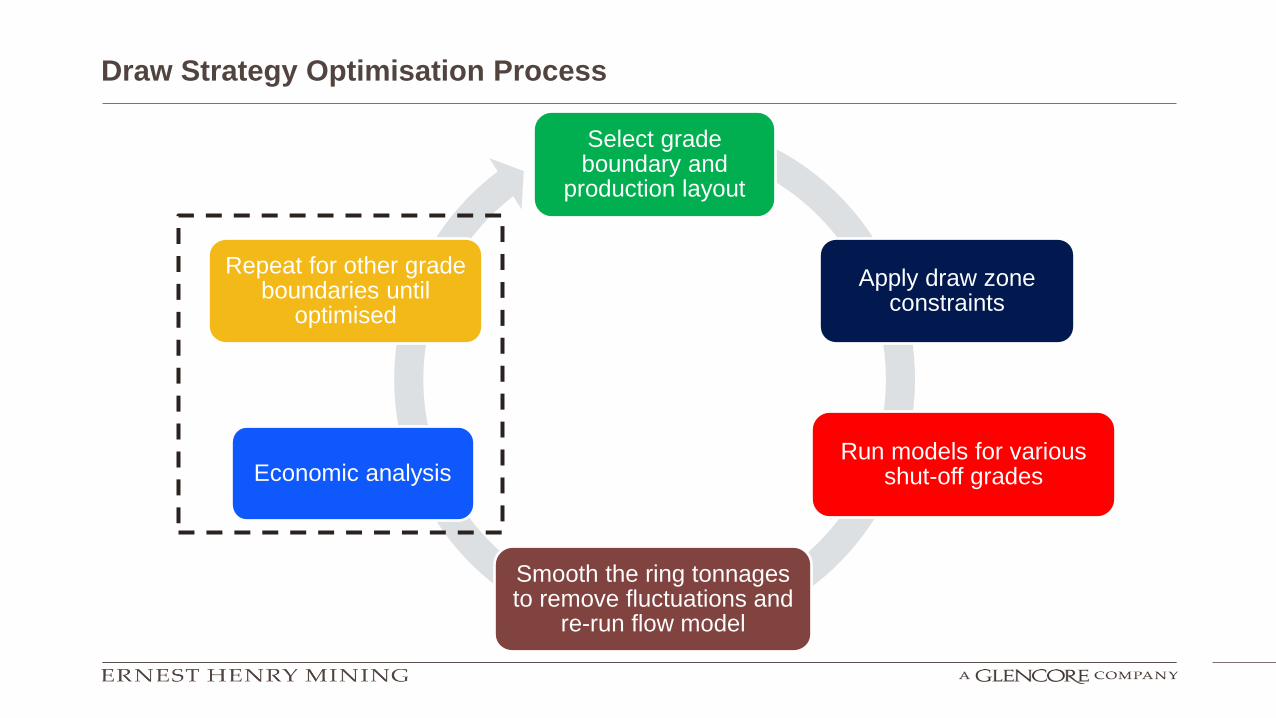
Draw Strategy Optimisation Process
Select grade boundary and
production layout
Apply draw zone constraints
Run models for various shut-off grades
Smooth the ring tonnages to remove fluctuations and
re-run flow model
Economic analysis
Repeat for other grade boundaries until
optimised

Draw Strategy Zones
• Constraints and shut-off grades are
applied by dividing the SLC into zones
Zone 1 – Hanging wall zone
• Low draw for air blast control
Zone 2 - Central zone
• Apply optimum shutoff grade
determined using iterative process of
flow models
Zone 3 - Footwall zone
• Mine to marginal break even grade as
ore cannot be recovered below
Zone 3
Zone 2
Zone 1

Footwall Overdraw
• The angle of the ore body can result in
ore loss along the footwall
• The footwall of each level is the last
opportunity to recovery grade the draw
column above
• Overdrawing to a break-even grade
maximises ore recovery in this zone
Remaining ore along the
footwall without overdraw

Footwall Overdraw Strategy
• Different options assessed for the footwall recovery including ring layout and final ring position
• Economics govern the exact location of the final ring…a balance between recovery and dilution
12
Footwall option with standard SLC rings Footwall option with draw bells
Unrecovered
ore
Additional
dilution
Unrecovered
ore
Additional
dilution

Ore Blanket Principal
• Dilution is unavoidable in SLC mines, but can be
managed using an ore blanket principle
• An “ore blanket” is formed by the low draw at the
hangingwall for air blast control
• The blanket is made up of grade bearing
material so that dilution is economic
• Any remaining ore is recovered at the footwall
by overdrawing
• The optimum ore blanket thickness is
determined via multiple flow model iterations
Ore blanket during a LOM flow model simulation
(facing North)
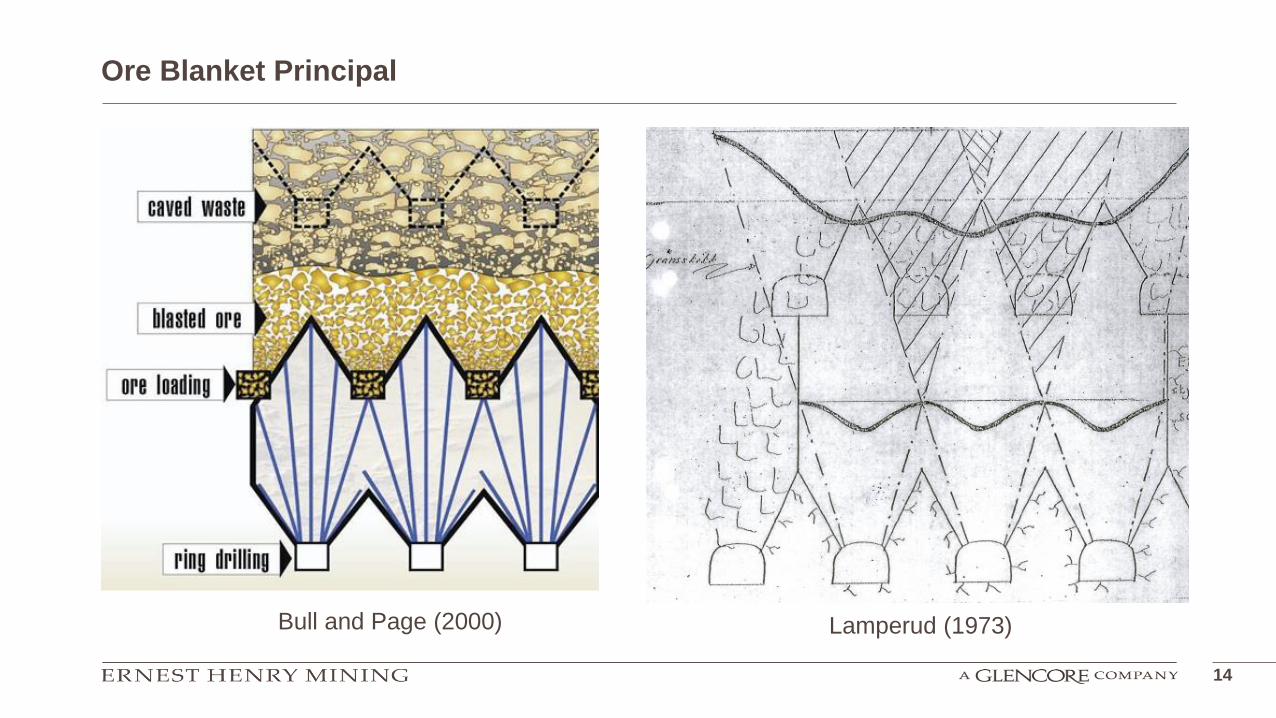
Ore Blanket Principal
14
Lamperud (1973) Bull and Page (2000)
Draw Strategy Optimisation Process
Select grade boundary and
production layout
Apply draw zone constraints
Run models for various shut-off grades
Smooth the ring tonnages to remove fluctuations and
re-run flow model
Economic analysis
Repeat for other grade boundaries until
optimised
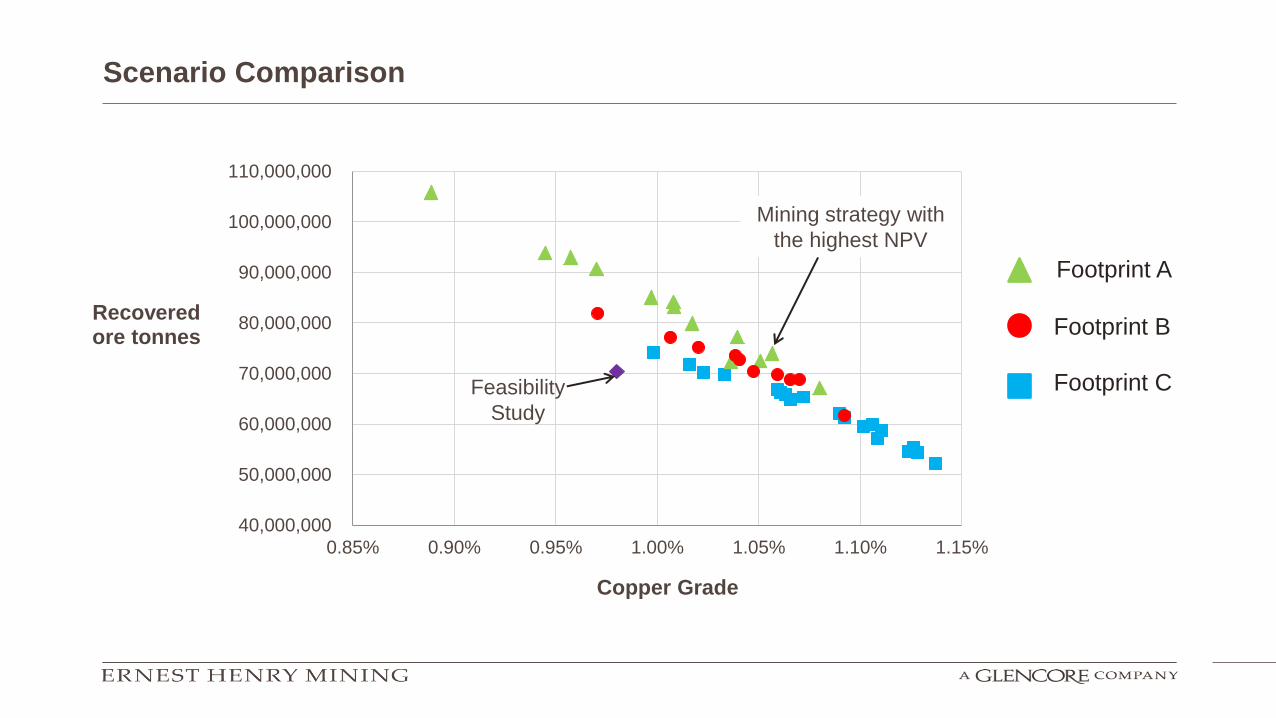
40,000,000
50,000,000
60,000,000
70,000,000
80,000,000
90,000,000
100,000,000
110,000,000
0.85% 0.90% 0.95% 1.00% 1.05% 1.10% 1.15%
Recovered ore tonnes
Copper Grade
Feasibility
Study
Mining strategy with
the highest NPV
Scenario Comparison
Footprint A
Footprint B
Footprint C

Economic Analysis and Cost Model
• Detailed cost model developed for
economic assessment
• Accurate economic evaluation was
critical to determining the “optimum”
draw strategy
• All costs included in the model and
scenario evaluation including-
• Mining
• Processing and transport
• Smelting, refining and sales
Underground development
8% Underground
production 14%
Fixed Plant Maintenance
4%
Mine Services 4%
Mobile Maintenance
12%
Administration, technical services,
management and site support
[PERCENTAGE]
Processing 18%
Transport [PERCENTAG
E]
Sales, smelting and refining
22%

Optimisation Results
• Over 200 draw strategy simulations were completed over three years
• NPV increased by 32%
• 10% increase in recovered grade compared to the feasibility study
• Increase in net smelter return (NSR) of almost 30% per tonne
• 6 month increase in mine life
• Cut-off grade reduced from 1.15% to 0.9% copper equivalent
• 101% metal recovery at 110% draw
• Significant improvements to the optimisation process:
• Flow modelling software updates and automated functions
• Draw strategy analysis and visualisation of results
• The same level of optimisation achieved in this project could now be completed in a matter of
weeks, rather than years
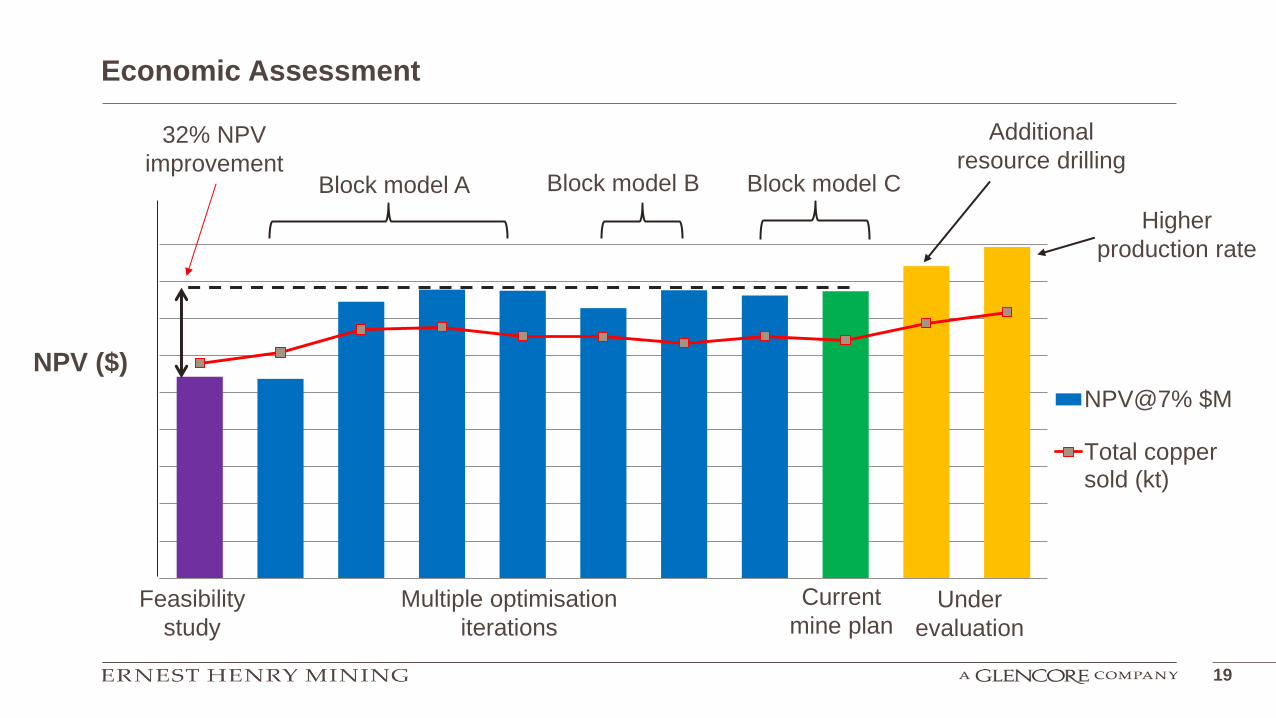
Economic Assessment
19
NPV@7% $M
Total coppersold (kt)
Feasibility
study
Multiple optimisation
iterations
Current
mine plan Under
evaluation
32% NPV
improvement Block model A Block model B Block model C
Additional
resource drilling
Higher
production rate
NPV ($)

Understanding flow model results - Recovered grade
20
0.9% Cu eq.
cut-off grade
Pit
1500 sublevel
(plan view)
Lower half of the
SLC not shown
Recovered
copper grade (%)

Understanding flow model results - Net Smelter Return (NSR)
21
High
Low
$ NSR per tonne
Lower half of the
SLC not shown
Pit

Grade and Metal Reconciliation
-
0.25
0.50
0.75
1.00
1.25
1.50
1.75
2.00
Ma
r-1
3
Ma
y-1
3
Ju
l-1
3
Se
p-1
3
No
v-1
3
Ja
n-1
4
Ma
r-1
4
Ma
y-1
4
Ju
l-1
4
Se
p-1
4
No
v-1
4
Ja
n-1
5
Ma
r-1
5
Ma
y-1
5
Ju
l-1
5
Se
p-1
5
C
op
pe
r E
qu
iva
len
t G
rad
e (
%)
Modelled vs Actual Grade
Actual Cu equiv grade Forecast Cu equiv grade
y = 1.01x R² = 0.956
0
2,000
4,000
6,000
8,000
10,000
0 2,000 4,000 6,000 8,000 10,000
Mo
de
lle
d C
op
pe
r E
qu
iva
len
t To
nn
es
Actual Copper Equivalent Tonnes
Modelled vs Actual Metal
Recap - How the NPV improvements were achieved
The optimisation process made significant economic improvements by:
• Modelling to determine the optimal draw for each ring.
• Applying a marginal break even grade along the footwall.
• Review of multiple footprint and cut-off grades.
• Increasing the draw percentage in high grade blocks to recovery metal earlier.
• Using an ore blanket to control dilution.
• Removing rings with a negative net smelter return (NSR)
• Reviewing the draw strategy quickly with changing economic factors and block model
updates

Future Improvements
• Calibration using marker recovery data
• Further validation of grade forecasts
• Automation of the optimisation process
• Automated footprint finder and mine design
• Application of this process at other mines

Questions