Embed Size (px)
Citation preview
APG_AR17_28.03.18_COVER_ARTWORK APG_AR17_28.03.18_COVER_ARTWORK
THE GLOBAL NATURAL RESOURCES ROYALTY COMPANY
2017
AN
NU
AL
RE
PO
RT
& A
CC
OU
NT
S A
ng
lo P
acific G
rou
p P
LC
THE GLOBAL NATURAL RESOURCES ROYALTY COMPANY2 0 1 7 A N N U A L R E P O R T & A C C O U N T S
Anglo Pacific Group PLC
A N G L O P A C I F I C G R O U P P L C
1 Savile Row, London W1S 3JR United Kingdom
T +44 (0)20 3435 7400 F +44 (0)20 7629 0370
www.anglopacificgroup.com
APG_AR17_28.03.18_COVER_ARTWORK APG_AR17_28.03.18_COVER_ARTWORK
Printed in the UK by CPI Colour on Amadeus Primo Silk FSC® certified paper.Amadeus Primo Silk is certified FSC®, is made using ECF pulp, and manufactured according to ISO 9001 and ISO 14001.
Designed and produced by Boonewww.boone-studio.com
C O N T E N T S
01 GROUP OVERVIEW02 AngloPacificataglance03 Miningroyaltiesexplained04 Ourportfolio06 Chairman’sstatement
08 STR ATEGIC REPORT08 ChiefExecutiveOfficer’sstatement10 Marketoverview12 Ourbusinessmodel14 Ourstrategy16 Newroyaltyacquisition18 Principalrisksanduncertainties24 Keyperformanceindicators25 Businessreview37 Financialreview42 Corporatesocialresponsibility
44 GOVERNANCE44 Corporategovernancereport45 TheBoard48 NominationCommittee49 AuditCommittee52 RemunerationCommittee53 Directors’remunerationreport66 Directors’report68 StatementofDirectors’responsibilities
69 FINANCIAL STATEMENTS69 Independentauditor’sreport75 Consolidatedincomestatement76 Consolidatedstatementofcomprehensiveincome77 ConsolidatedandCompanybalancesheets78 Consolidatedstatementofchangesinequity79 Companystatementofchangesinequity80 Consolidatedstatementofcashflows
andCompanystatementofcashflows81 Notestotheconsolidatedfinancialstatements
119 OTHER INFORMATION119 Shareholderstatistics119 Corporatedetails120 Forward-lookingstatements
Throughout this report a number of financial measures are used to assess the Group’s performance. The measures are defined as follows:
Operating profit/(loss)Operatingprofit/(loss)representstheGroup’sunderlyingoperatingperformancefromitsroyaltyinterests.Operatingprofit/(loss)isroyaltyincome,lessamortisationofroyaltiesandoperatingexpenses,andexcludesimpairments,revaluations andgain/(loss)ondisposals.Operatingprofit/(loss)reconciles to‘operatingprofit/(loss)beforeimpairments,revaluations andgain/(losses)ondisposals’ontheincomestatement.
Adjusted earnings per shareAdjustedearningsrepresentstheGroup’sunderlyingoperatingperformancefromcoreactivities.Adjustedearningsistheprofit/(loss)attributabletoequityholderslessallvaluationmovements,andnon-cashimpairments,amortisationcharges,sharebasedpayments,financecosts,anyassociateddeferredtaxandanyprofitorlossonnon-coreassetdisposals.Adjustedearningsdividedbytheweightedaveragenumberofsharesinissuegivesadjustedearningspershare.Referto note 11to thefinancialstatementsforadjustedearnings/(loss)pershare.
Dividend coverDividendcoveriscalculatedasthenumberoftimesadjustedearningspershareexceedsthedividendpershare.Referto note 12 tothefinancialstatementsfordividendcover.
Free cash flow per shareFreecashflowpershareiscalculatedbydividingnetcashgeneratedfromoperatingactivities,plusproceedsfromthedisposalofnon-coreassetsandanycashconsideredasrepaymentofprincipal,lessfinancecosts,bytheweightedaveragenumberofsharesinissue.Refertonote 33 tothefinancialstatementsforfreecashflowpershare.
P E R F O R M A N C E M E A S U R E S
F OR MOR E I N F O V I S I T www.anglopacificgroup.com
Anglo Pacific Group PLC (‘Anglo Pacific’, the ‘Company’ or the ‘Group’) is the only listed company on the London Stock Exchange focused on royalties connected with the mining of natural resources. Our strategy is to build a diversified portfolio of royalties and metal streams, focusing on accelerating income growth through acquiring royalties in cash or near-term cash producing assets.
It is an objective of the Company to pay a substantial portion of these royalties and metal streams to shareholders as dividends.
G R O U P O V E R V I E W
OUR AIM IS TO DEVELOP AS THE LEADING INTERNATIONAL DIVERSIFIED ROYALTY COMPANY WITH A PORTFOLIO CENTRED ON BASE METALS AND BULK MATERIALS
HOW W E A R E AC H I E V I NG OU R S T R AT E G Y – PAG E S 14 T O 17
F OR MOR E I N F O V I S I T www.anglopacificgroup.com
GR
OU
P O
VE
RV
IEW
STR
ATEGIC
REP
OR
T GO
VER
NA
NC
E FINA
NC
IAL S
TATEMEN
TS OTH
ER INFO
RM
ATION
01ANGLO PACIFIC GROUP PLC ANNUAL REPORT & ACCOUNTS 2017
APG_AR17_28.03.18_FRONT_ARTWORK
G R O U P O V E R V I E W
ANGLO PACIFIC AT A GLANCE
S H A R E H O L D E R R E T U R N S
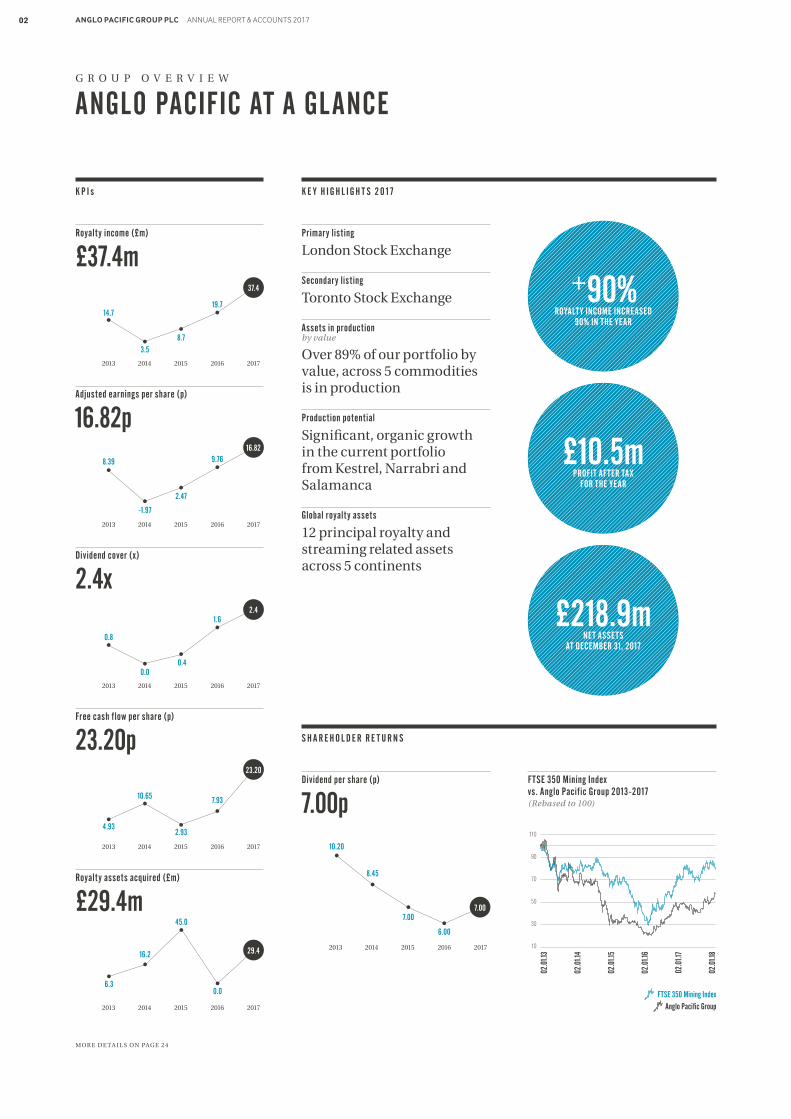
K E Y H I G H L I G H T S 2 0 1 7
Dividend per share (p)
7.00p
Primary listing
London Stock Exchange
Secondary listing
Toronto Stock Exchange
Assets in production by value
Over 89% of our portfolio by value, across 5 commodities is in production
Production potential
Significant, organic growth in the current portfolio from Kestrel, Narrabri and Salamanca
Global royalty assets
12 principal royalty and streaming related assets across 5 continents
MOR E DE T A I L S ON PAG E 2 4
K P I s
Royalty assets acquired (£m)
£29.4m
Adjusted earnings per share (p)
16.82p
Royalty income (£m)
£37.4m
Dividend cover (x)
2.4x
0.0
45.0
16.2
6.3
29.4
8.73.5
14.719.7
37.4
-1.97
8.39
2.47
9.7616.82
1.6
0.40.0
0.8
2.4
+90% ROYALTY INCOME INCREASED
90% IN THE YEAR
£218.9m NET ASSETS
AT DECEMBER 31, 2017
£10.5mPROFIT AFTER TAX
FOR THE YEAR
20172016201520142013
20172016201520142013
20172016201520142013
Free cash flow per share (p)
23.20p
7.93
2.93
10.65
4.93
23.20
20172016201520142013
20172016201520142013
6.00
7.007.00
8.45
10.20
20172016201520142013
FTSE 350 Mining Index vs. Anglo Pacific Group 2013-2017(Rebased to 100)
FTSE 350 Mining Index
Anglo Pacific Group
02.0
1.13
02.0
1.14
02.0
1.15
02.0
1.16
02.0
1.17
02.0
1.18
110
90
70
50
30
10
02 ANGLO PACIFIC GROUP PLC ANNUAL REPORT & ACCOUNTS 2017
APG_AR17_28.03.18_FRONT_ARTWORK
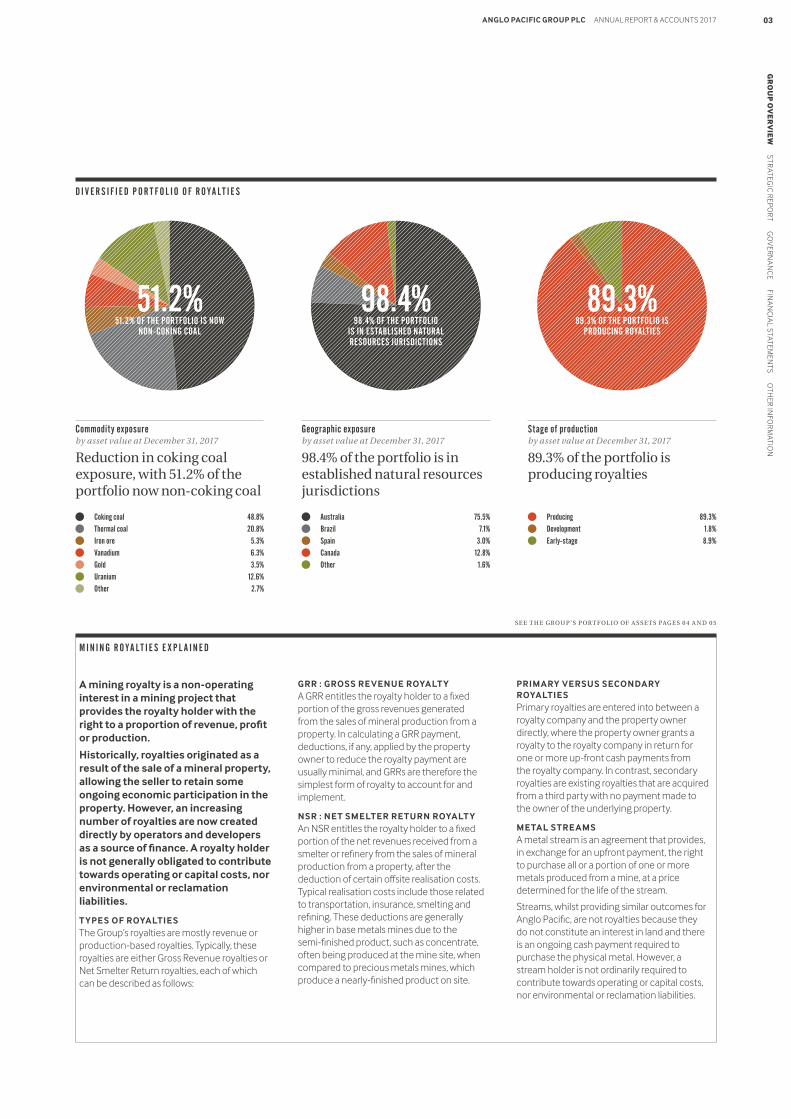
Commodity exposureby asset value at December 31, 2017
Reduction in coking coal exposure, with 51.2% of the portfolio now non-coking coal
Geographic exposureby asset value at December 31, 2017
98.4% of the portfolio is in established natural resources jurisdictions
Stage of productionby asset value at December 31, 2017
89.3% of the portfolio is producing royalties
A mining royalty is a non-operating interest in a mining project that provides the royalty holder with the right to a proportion of revenue, profit or production.
Historically, royalties originated as a result of the sale of a mineral property, allowing the seller to retain some ongoing economic participation in the property. However, an increasing number of royalties are now created directly by operators and developers as a source of finance. A royalty holder is not generally obligated to contribute towards operating or capital costs, nor environmental or reclamation liabilities.
T YPES OF ROYALTIESThe Group’s royalties are mostly revenue or production-based royalties. Typically, these royalties are either Gross Revenue royalties or Net Smelter Return royalties, each of which can be described as follows:
GRR : GROSS REVENUE ROYALT Y A GRR entitles the royalty holder to a fixed portion of the gross revenues generated from the sales of mineral production from a property. In calculating a GRR payment, deductions, if any, applied by the property owner to reduce the royalty payment are usually minimal, and GRRs are therefore the simplest form of royalty to account for and implement.
NSR : NET SMELTER RETURN ROYALT YAn NSR entitles the royalty holder to a fixed portion of the net revenues received from a smelter or refinery from the sales of mineral production from a property, after the deduction of certain offsite realisation costs. Typical realisation costs include those related to transportation, insurance, smelting and refining. These deductions are generally higher in base metals mines due to the semi-finished product, such as concentrate, often being produced at the mine site, when compared to precious metals mines, which produce a nearly-finished product on site.
PRIMARY VERSUS SECONDARY ROYALTIESPrimary royalties are entered into between a royalty company and the property owner directly, where the property owner grants a royalty to the royalty company in return for one or more up-front cash payments from the royalty company. In contrast, secondary royalties are existing royalties that are acquired from a third party with no payment made to the owner of the underlying property.
METAL STREAMSA metal stream is an agreement that provides, in exchange for an upfront payment, the right to purchase all or a portion of one or more metals produced from a mine, at a price determined for the life of the stream.
Streams, whilst providing similar outcomes for Anglo Pacific, are not royalties because they do not constitute an interest in land and there is an ongoing cash payment required to purchase the physical metal. However, a stream holder is not ordinarily required to contribute towards operating or capital costs, nor environmental or reclamation liabilities.
M I N I N G R O Y A L T I E S E X P L A I N E D
D I V E R S I F I E D P O R T F O L I O O F R O Y A L T I E S
S E E T H E G ROU P 'S P OR T F OL IO OF A S S E T S PAG E S 0 4 A N D 0 5
Coking coal 48.8%
Thermal coal 20.8%
Iron ore 5.3%
Vanadium 6.3%
Gold 3.5%
Uranium 12.6%
Other 2.7%
Australia 75.5%
Brazil 7.1%
Spain 3.0%
Canada 12.8%
Other 1.6%
Producing 89.3%
Development 1.8%
Early-stage 8.9%
89.3%89.3% OF THE PORTFOLIO IS
PRODUCING ROYALTIES
51.2%51.2% OF THE PORTFOLIO IS NOW
NON-COKING COAL
98.4% 98.4% OF THE PORTFOLIO
IS IN ESTABLISHED NATURAL RESOURCES JURISDICTIONS
GR
OU
P O
VE
RV
IEW
STR
ATEGIC
REP
OR
T GO
VER
NA
NC
E FINA
NC
IAL S
TATEMEN
TS OTH
ER INFO
RM
ATION
03ANGLO PACIFIC GROUP PLC ANNUAL REPORT & ACCOUNTS 2017
APG_AR17_28.03.18_FRONT_ARTWORK
G R O U P O V E R V I E W
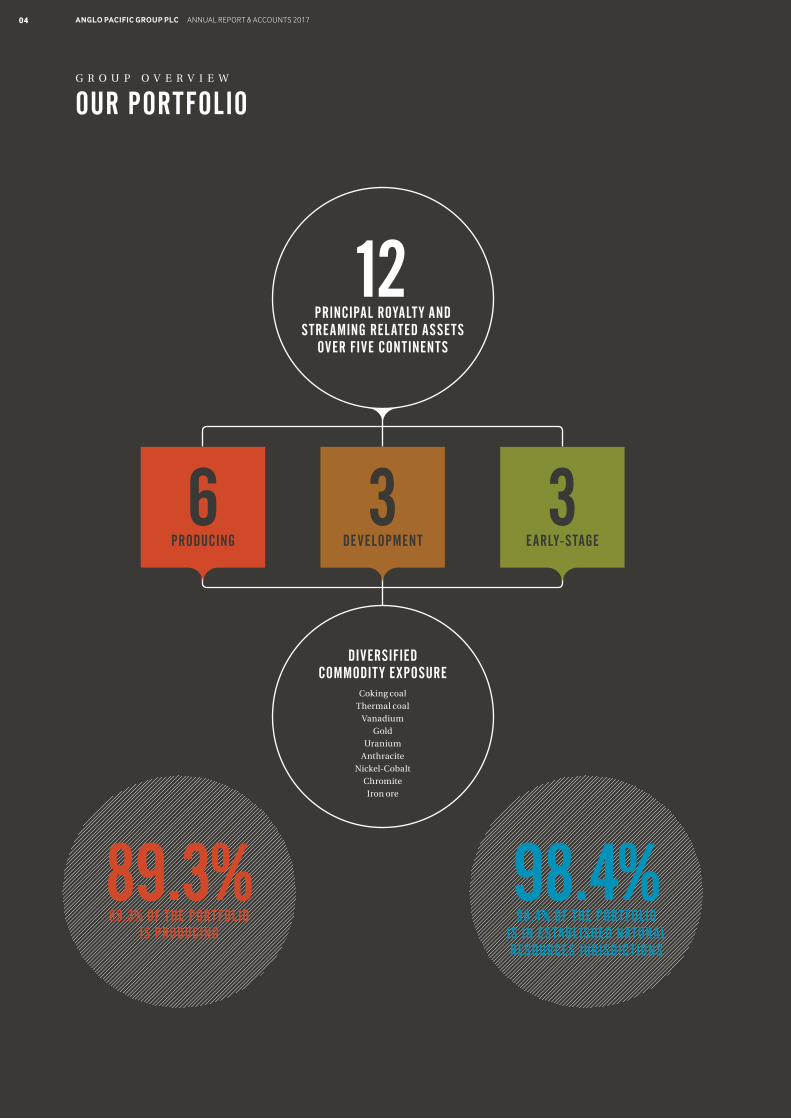
OUR PORTFOLIO
6 PRODUCING
3 DEVELOPMENT
3 EARLY-STAGE
12 PRINCIPAL ROYALT Y AND
STREAMING RELATED ASSETS OVER FIVE CONTINENTS
DIVERSIFIED COMMODIT Y EXPOSURE
Coking coal
Thermal coal
Vanadium
Gold
Uranium
Anthracite
Nickel-Cobalt
Chromite
Iron ore
89.3%89.3% OF THE PORTFOLIO
IS PRODUCING
98.4% 98.4% OF THE PORTFOLIO
IS IN ESTABLISHED NATURAL RESOURCES JURISDICTIONS
04 ANGLO PACIFIC GROUP PLC ANNUAL REPORT & ACCOUNTS 2017
APG_AR17_28.03.18_FRONT_ARTWORK
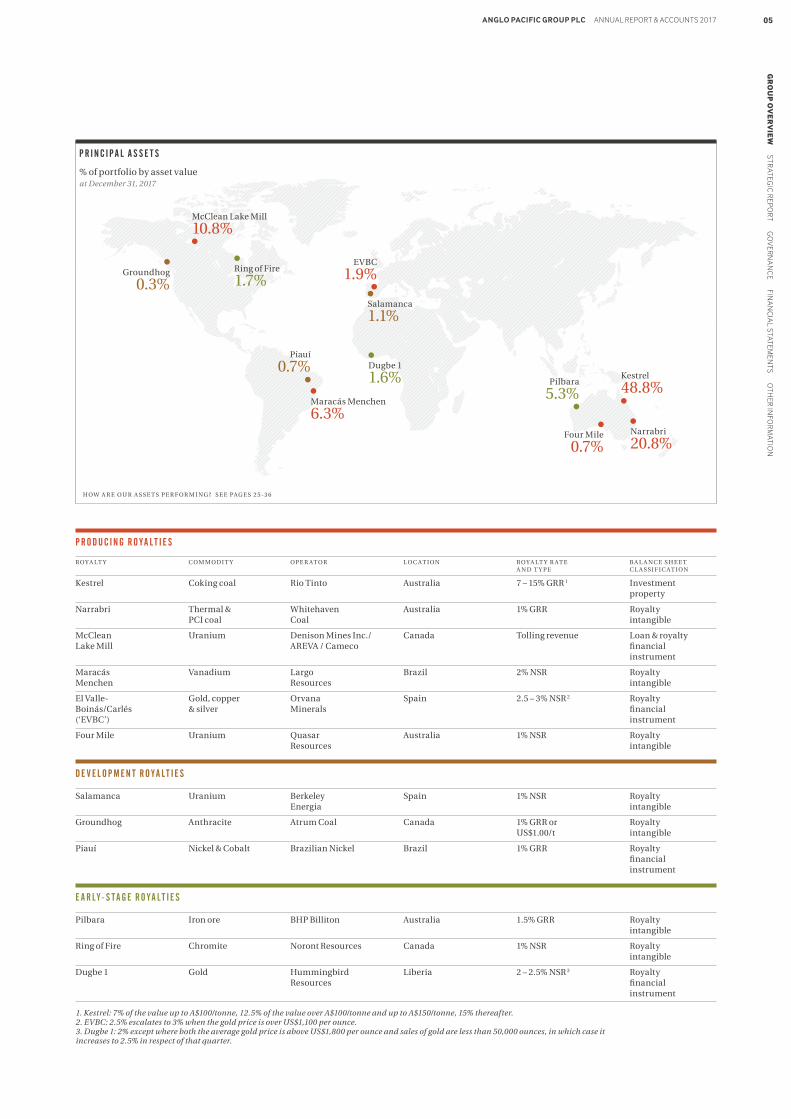
P R O D U C I N G R O Y A L T I E S
ROY A LT Y C OM MODI T Y OP E R AT OR L O C AT ION ROY A LT Y R AT E B A L A NC E S H E E T A N D T Y P E C L A S S I F IC AT ION
Kestrel Coking coal Rio Tinto Australia 7 – 15% GRR 1 Investment property
Narrabri Thermal & Whitehaven Australia 1% GRR Royalty PCI coal Coal intangible
McClean Uranium Denison Mines Inc./ Canada Tolling revenue Loan & royalty Lake Mill AREVA / Cameco financial instrument
Maracás Vanadium Largo Brazil 2% NSR Royalty Menchen Resources intangible
El Valle- Gold, copper Orvana Spain 2.5 – 3% NSR 2 Royalty Boinás/Carlés & silver Minerals financial (‘EVBC’) instrument
Four Mile Uranium Quasar Australia 1% NSR Royalty Resources intangible
D E V E L O P M E N T R O Y A L T I E S
Salamanca Uranium Berkeley Spain 1% NSR Royalty Energia intangible
Groundhog Anthracite Atrum Coal Canada 1% GRR or Royalty US$1.00/t intangible
Piauí Nickel & Cobalt Brazilian Nickel Brazil 1% GRR Royalty financial instrument
E A R LY- S T A G E R O Y A L T I E S
Pilbara Iron ore BHP Billiton Australia 1.5% GRR Royalty intangible
Ring of Fire Chromite Noront Resources Canada 1% NSR Royalty intangible
Dugbe 1 Gold Hummingbird Liberia 2 – 2.5% NSR 3 Royalty Resources financial instrument
1. Kestrel: 7% of the value up to A$100/tonne, 12.5% of the value over A$100/tonne and up to A$150/tonne, 15% thereafter.2. EVBC: 2.5% escalates to 3% when the gold price is over US$1,100 per ounce.3. Dugbe 1: 2% except where both the average gold price is above US$1,800 per ounce and sales of gold are less than 50,000 ounces, in which case it increases to 2.5% in respect of that quarter.
HOW A R E OU R A S S E T S P E R F OR M I NG ? S E E PAG E S 2 5 -3 6
P R I N C I P A L A S S E T S
% of portfolio by asset valueat December 31, 2017
Groundhog
0.3%Ring of Fire
1.7%Salamanca
1.1%
EVBC
1.9%
Dugbe 1
1.6%Maracás Menchen
6.3%
Pilbara
5.3%Kestrel
48.8%
Narrabri
20.8%Four Mile
0.7%
McClean Lake Mill
10.8%
Piauí
0.7%
GR
OU
P O
VE
RV
IEW
STR
ATEGIC
REP
OR
T GO
VER
NA
NC
E FINA
NC
IAL S
TATEMEN
TS OTH
ER INFO
RM
ATION
05ANGLO PACIFIC GROUP PLC ANNUAL REPORT & ACCOUNTS 2017
APG_AR17_28.03.18_FRONT_ARTWORK
WE ENTER 2018 IN A STRONG FINANCIAL POSITION AND WITH AN EXCITING PIPELINE FOR GROWTH
G R O U P O V E R V I E W
CHAIRMAN’S STATEMENT
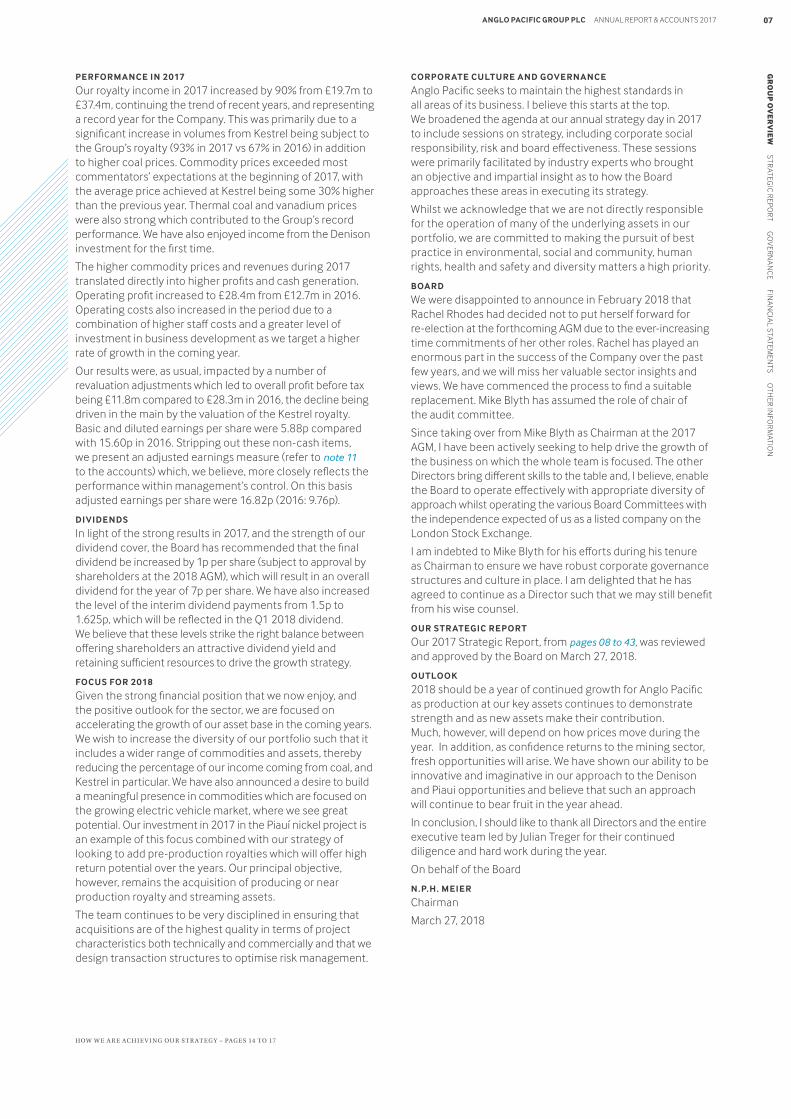
+120% OPERATING PROFIT INCREASED
FROM £12.7m TO £28.4m
+90% OUR ROYALTY INCOME INCREASED BY 90% FROM £19.7m TO £37.4m
16.82p ADJUSTED EARNINGS PER SHARE
16.82p (2016: 9.76p)
23.2pFREE CASH FLOW PER SHARE
23.2P (2016: 7.9p)
5.88p BASIC AND DILUTED EARNINGS
PER SHARE 5.88p (2016: 15.60p)
+235%CASH FLOW FROM OPERATIONS
This is my first report as Chairman, having assumed the role after the 2017 AGM. Undoubtedly, 2017 has been a year of considerable progress for Anglo Pacific with record royalty revenue, two successful transactions and an increase in the dividend whilst repaying our borrowings in full. We enter 2018 in a strong financial position and with an exciting pipeline for growth, which is the clear focus for the year ahead.
K E Y R E S U L T S
06 ANGLO PACIFIC GROUP PLC ANNUAL REPORT & ACCOUNTS 2017
APG_AR17_28.03.18_FRONT_ARTWORK
PERFORMANCE IN 2017
Our royalty income in 2017 increased by 90% from £19.7m to £37.4m, continuing the trend of recent years, and representing a record year for the Company. This was primarily due to a significant increase in volumes from Kestrel being subject to the Group’s royalty (93% in 2017 vs 67% in 2016) in addition to higher coal prices. Commodity prices exceeded most commentators’ expectations at the beginning of 2017, with the average price achieved at Kestrel being some 30% higher than the previous year. Thermal coal and vanadium prices were also strong which contributed to the Group’s record performance. We have also enjoyed income from the Denison investment for the first time.
The higher commodity prices and revenues during 2017 translated directly into higher profits and cash generation. Operating profit increased to £28.4m from £12.7m in 2016. Operating costs also increased in the period due to a combination of higher staff costs and a greater level of investment in business development as we target a higher rate of growth in the coming year.
Our results were, as usual, impacted by a number of revaluation adjustments which led to overall profit before tax being £11.8m compared to £28.3m in 2016, the decline being driven in the main by the valuation of the Kestrel royalty. Basic and diluted earnings per share were 5.88p compared with 15.60p in 2016. Stripping out these non-cash items, we present an adjusted earnings measure (refer to note 11 to the accounts) which, we believe, more closely reflects the performance within management’s control. On this basis adjusted earnings per share were 16.82p (2016: 9.76p).
DIVIDENDS
In light of the strong results in 2017, and the strength of our dividend cover, the Board has recommended that the final dividend be increased by 1p per share (subject to approval by shareholders at the 2018 AGM), which will result in an overall dividend for the year of 7p per share. We have also increased the level of the interim dividend payments from 1.5p to 1.625p, which will be reflected in the Q1 2018 dividend. We believe that these levels strike the right balance between offering shareholders an attractive dividend yield and retaining sufficient resources to drive the growth strategy.
FOCUS FOR 2018
Given the strong financial position that we now enjoy, and the positive outlook for the sector, we are focused on accelerating the growth of our asset base in the coming years. We wish to increase the diversity of our portfolio such that it includes a wider range of commodities and assets, thereby reducing the percentage of our income coming from coal, and Kestrel in particular. We have also announced a desire to build a meaningful presence in commodities which are focused on the growing electric vehicle market, where we see great potential. Our investment in 2017 in the Piauí nickel project is an example of this focus combined with our strategy of looking to add pre-production royalties which will offer high return potential over the years. Our principal objective, however, remains the acquisition of producing or near production royalty and streaming assets.
The team continues to be very disciplined in ensuring that acquisitions are of the highest quality in terms of project characteristics both technically and commercially and that we design transaction structures to optimise risk management.
CORPOR ATE CULTURE AND GOVERNANCE
Anglo Pacific seeks to maintain the highest standards in all areas of its business. I believe this starts at the top. We broadened the agenda at our annual strategy day in 2017 to include sessions on strategy, including corporate social responsibility, risk and board effectiveness. These sessions were primarily facilitated by industry experts who brought an objective and impartial insight as to how the Board approaches these areas in executing its strategy.
Whilst we acknowledge that we are not directly responsible for the operation of many of the underlying assets in our portfolio, we are committed to making the pursuit of best practice in environmental, social and community, human rights, health and safety and diversity matters a high priority.
BOARD
We were disappointed to announce in February 2018 that Rachel Rhodes had decided not to put herself forward for re-election at the forthcoming AGM due to the ever-increasing time commitments of her other roles. Rachel has played an enormous part in the success of the Company over the past few years, and we will miss her valuable sector insights and views. We have commenced the process to find a suitable replacement. Mike Blyth has assumed the role of chair of the audit committee.
Since taking over from Mike Blyth as Chairman at the 2017 AGM, I have been actively seeking to help drive the growth of the business on which the whole team is focused. The other Directors bring different skills to the table and, I believe, enable the Board to operate effectively with appropriate diversity of approach whilst operating the various Board Committees with the independence expected of us as a listed company on the London Stock Exchange.
I am indebted to Mike Blyth for his efforts during his tenure as Chairman to ensure we have robust corporate governance structures and culture in place. I am delighted that he has agreed to continue as a Director such that we may still benefit from his wise counsel.
OUR STR ATEGIC REPORT
Our 2017 Strategic Report, from pages 08 to 43, was reviewed and approved by the Board on March 27, 2018.
OUTLOOK
2018 should be a year of continued growth for Anglo Pacific as production at our key assets continues to demonstrate strength and as new assets make their contribution. Much, however, will depend on how prices move during the year. In addition, as confidence returns to the mining sector, fresh opportunities will arise. We have shown our ability to be innovative and imaginative in our approach to the Denison and Piaui opportunities and believe that such an approach will continue to bear fruit in the year ahead.
In conclusion, I should like to thank all Directors and the entire executive team led by Julian Treger for their continued diligence and hard work during the year.
On behalf of the Board
N.P.H. MEIER
Chairman
March 27, 2018
HOW W E A R E AC H I E V I NG OU R S T R AT E G Y – PAG E S 14 T O 17
GR
OU
P O
VE
RV
IEW
STR
ATEGIC
REP
OR
T GO
VER
NA
NC
E FINA
NC
IAL S
TATEMEN
TS OTH
ER INFO
RM
ATION
07ANGLO PACIFIC GROUP PLC ANNUAL REPORT & ACCOUNTS 2017
APG_AR17_28.03.18_FRONT_ARTWORK
S T R A T E G I C R E P O R T
CHIEF EXECUTIVE OFFICER’S STATEMENT
The business review on pages 25 to 36 and the finance review on pages 37 to 41, will provide the detail behind the significant increase in our KPIs during the year and a review of the performance and progress at the underlying operations over which we have royalties. As such, the following is my summary on the market, our focus for the year and some comments on the dividend.
MARKET OUTLOOK
The recovery of the mining sector has continued over the past year with prices generally rising. Despite being clearly in the upward phase of the cycle, there is still a good window for Anglo Pacific to make investments which will provide good returns in the coming years and we intend to take advantage of this opportunity.
Fortunately, our area of focus is also one of the most promising for commodity investment. The world is finally, for the first time in a decade, in a moment of coordinated global growth. The beneficiary of this will be the base and bulk materials which we specialise in and where demand is driven by GDP growth. Even more positively, the developments in new technologies such as electric vehicles and improved battery storage should create significant incremental demand for associated materials. In contrast to this positive demand picture, the supply side can be expected to be constrained for a number of years, first by the general lack of investment in new mines over the past five years but also by the continued relative scarcity of finance for new projects even today. The result should be an extenuated cycle longer than the previous one where Anglo Pacific, as a supplier of scarce capital to the sector, should be able to capture enhanced returns.
Within this context, we will continue to focus on base commodities like copper, nickel and zinc where we see visible industrial demand and deficits which could be increased by new technologies. We will also focus on alloys which can be used for light weighting and more specialised commodities such as vanadium, which we already have exposure to, and where we believe demand will outstrip supply. Opportunistically, we will look at bulks where we believe the price and risk equation is attractive.
In contrast, we believe many commodities are already in the upper range of their pricing and have more downside risk than upside, and we will be avoiding them. This includes gold which, though a beneficiary of inflation, may underperform in a situation where cryptocurrency alternative abounds, and interest rates increase holding costs. In addition materials such as lithium, are temporarily in short supply but we will need to model opportunities very conservatively for longer term investment given longer-term supply prospects.
THE FOCUS FOR THE YEAR AHEAD IS FIRMLY ON GROWING AND DIVERSIF YING THE PORTFOLIOAnglo Pacific delivered on its guidance during the year. Including the cash received from our Denison investment, our income more than doubled, the third consecutive year in which it has done so. With less organic revenue growth expected in 2018, the focus for the year ahead is firmly on growing and diversifying the portfolio. With a strong balance sheet and improved market fundamentals, we believe we are well placed to deliver innovative and accretive transactions in the year ahead.
HOW A R E OU R A S S E T S P E R F OR M I NG ? S E E PAG E S 2 5 -3 6
APG_AR17_28.03.18_FRONT_ARTWORK
08 ANGLO PACIFIC GROUP PLC ANNUAL REPORT & ACCOUNTS 2017
COAL OUTLOOK
The continuing strength of coal pricing has surprised many, particularly in the U.K. who had believed the commodity to be ex growth. In fact, coal consumption continues to increase in absolute terms though coal's share of the global energy mix is slowly declining. Demand for energy coal, particularly in the East, is being fuelled by higher demand for grid power from new sources like electric vehicles. At the same time, supply is being squeezed, first by the Chinese restrictions on low quality product which seem to be a permanent feature of the market, but also because of continued depletion of mines without any sizable investment in bringing on new capacity. As a result, we expect coal prices to be higher for longer than the market consensus (which is rising already).
Within the coal complex, we have always argued for longer-term exposure to the higher quality less polluting material which, we believe, will serve to reduce pollution quicker than the impact which the gradual introduction of clean technology will achieve in the medium term. The Chinese policy is supportive of this trend and, in the market, we have observed higher discounts or premia being applied to lower or higher quality products. We are pleased that our exposure is to premium cleaner product and are comfortable with our ongoing strategy of reducing, exposure to this commodity.
STR ATEGY
Consistent with the above market view and our enhanced balance sheet, we intend to accelerate our rate of growth in transforming Anglo Pacific into the preferred royalty vehicle for twenty first century commodities. There is a gap in the market to be a derisked mode of providing exposure to the raw material for new technologies and Anglo Pacific, as the only truly global non-precious metals royalty company, is well placed to occupy this niche. We believe that as we continue to execute on this pivot, the rating of the Company should increase.
Given our confident outlook, we are also prepared at this stage of the cycle to take slightly more risk and also to invest more in growth. We announced last year a new strategy to include development royalties as a new minor focus for our investments. We are pleased to have executed one of these and would hope for more in the current year. These investments should be largely funded through cash on hand. We have also decided to consider exposure to new geographies such as South America, Africa and Eastern Europe. However, we are unlikely to compound risk by investing in development opportunities in these countries, instead we will focus on operating assets.
From a financing perspective, with a strong balance sheet and income, we will seek to fund transactions by using our cash and by leveraging our balance sheet in the first instance. We have an undrawn revolving credit facility and believe this can be comfortably expanded whilst retaining low borrowing metrics. Should we come across larger transformative deals, we will consider other sources of finance.
DIVIDEND
Although our focus is on investing in growth at this stage of the cycle (and shareholders should thus expect ongoing higher due diligence costs), we will seek to balance this with continuing to pay a proportion of this growth to our shareholders in the form of progressive dividends. We announced an overhaul in our dividend structure during 2017 which created quarterly payments, reduced the period between announcement and payment by almost three months, and created a flexible final quarter dividend. This was well received by shareholders.
We put this policy into action with the recommendation (subject to shareholder approval) of a final dividend for the year of 2.5p per share which increased the level of total dividends for the year from 6p in 2016 to 7p for the year just gone. We have also reset the level of the quarterly interim dividends from 1.5p to 1.625p per share, meaning that the run rate for 2018 has increased from 6p to 6.5p per share, with any overall increase for 2018 being reserved for the final quarter. As such, and on a cash basis, shareholders will actually receive 7.375p per share in the next 12 months.
We believe this dividend policy strikes the right balance at this stage of the cycle between returns to shareholders and investing in growth.
OUTLOOK
We enter 2018 in a position of strength, having enjoyed a record 2017. Strong earnings have translated directly into cash flow, we are debt free and see many opportunities in what is still a capital constrained sector. We expect to generate significant cash as commodity prices continue to remain at much higher levels than anticipated even just 12 months ago. With less organic revenue growth anticipated in 2018, our focus is to accelerate the growth of our asset base by acquiring royalties which provide immediate cash flow or the potential to deliver significant growth over the longer term.
J . A . TREGER
Chief Executive Officer
March 27, 2018
APG_AR17_28.03.18_FRONT_ARTWORK
GR
OU
P OV
ERV
IEW S
TR
AT
EG
IC R
EP
OR
T G
OV
ERN
AN
CE FIN
AN
CIA
L STATEM
ENTS O
THER IN
FOR
MATIO
N09ANGLO PACIFIC GROUP PLC ANNUAL REPORT & ACCOUNTS 2017
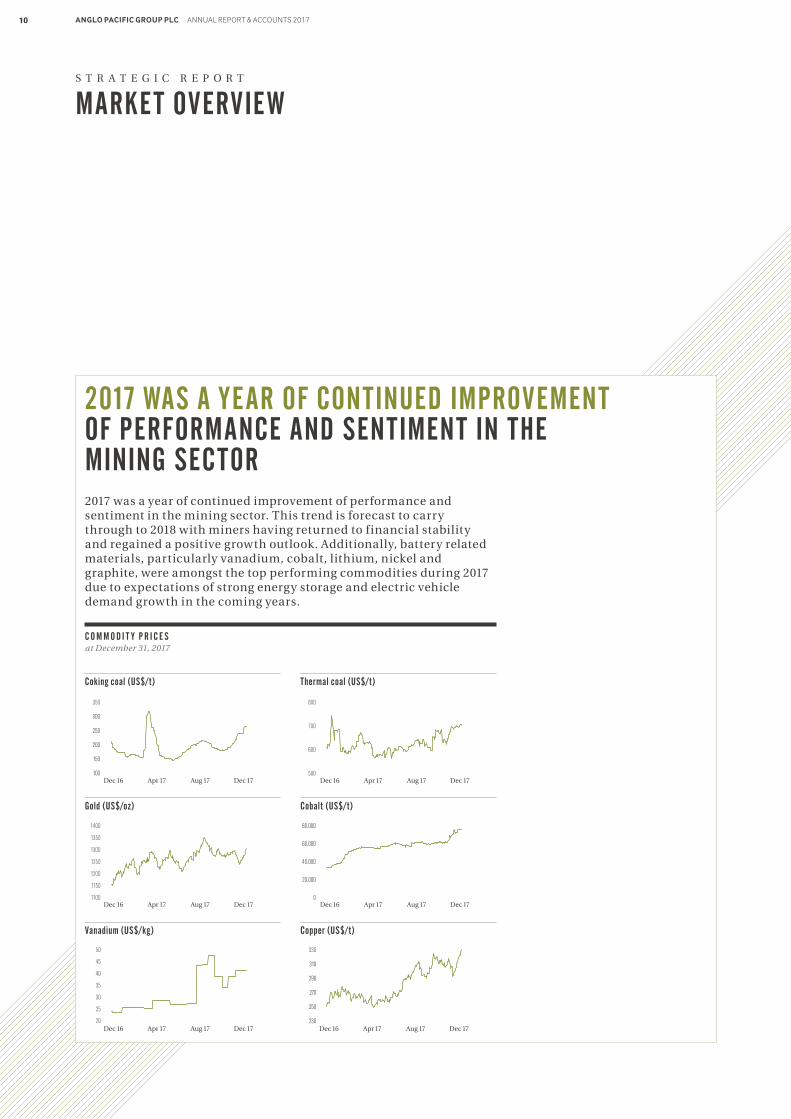
2017 was a year of continued improvement of performance and sentiment in the mining sector. This trend is forecast to carry through to 2018 with miners having returned to financial stability and regained a positive growth outlook. Additionally, battery related materials, particularly vanadium, cobalt, lithium, nickel and graphite, were amongst the top performing commodities during 2017 due to expectations of strong energy storage and electric vehicle demand growth in the coming years.
2017 WAS A YEAR OF CONTINUED IMPROVEMENT OF PERFORMANCE AND SENTIMENT IN THE MINING SECTOR
S T R A T E G I C R E P O R T
MARKET OVERVIEW
C O M M O D I T Y P R I C E S at December 31, 2017
Coking coal (US$/t)
350
300
250
200
150
100Dec 16 Apr 17 Aug 17 Dec 17
Dec 16 Apr 17 Aug 17 Dec 17
Gold (US$/oz)
1400
1350
1300
1250
1200
1150
1100
Dec 16 Apr 17 Aug 17 Dec 17
Vanadium (US$/kg)
50
45
40
35
30
25
20
Thermal coal (US$/t)
Dec 16 Apr 17 Aug 17 Dec 17
800
700
600
500
Dec 16 Apr 17 Aug 17 Dec 17
Cobalt (US$/t)
80,000
60,000
40,000
20,000
0
Dec 16 Apr 17 Aug 17 Dec 17
Copper (US$/t)
330
310
290
270
250
230
APG_AR17_28.03.18_FRONT_ARTWORK
10 ANGLO PACIFIC GROUP PLC ANNUAL REPORT & ACCOUNTS 2017
On the demand side, better than expected economic activity in China, combined with Chinese Government environmental initiatives which resulted in cutbacks in domestic Chinese processing and mining output, were prominent drivers of underlying commodity prices in 2017. Closures in iron ore mining and anticipated higher vanadium requirements in Chinese reinforcement steel were key factors behind the ~75% YoY increase in the price of vanadium over the course of 2017.
Supply side constraints also played a role in dictating commodity pricing dynamics; in particular coal, where lower Chinese production and logistical disruptions arising from seasonal factors, in particular Cyclone Debbie in April, which sent coking coal prices to a year high of US$314/t. Such supply side constraints were a key feature for many other commodities in 2017, including zinc, which hit its highest level in a decade (+32% YoY), aluminium (+34% YoY), and lead which rose to a six year high (+29% YoY).
A further theme that has supported underlying prices in certain commodities is speculation over future electric vehicle (EV) demand. Copper, in particular, hit a three-year high (+33% YoY) off the back of net long positioning in the futures market as well as supply side disruptions (Escondida, Grasberg) and strong Chinese demand. Cobalt also saw significant price gains (+130% YoY) from a combination of EV demand and long expected structural supply issues.
Stronger commodity pricing has helped strengthen balance sheets in 2017 with many of the majors choosing to increase capital return to shareholders via share buybacks and dividends. Capital discipline remained intact across the sector as companies focused on controlling capital expenditure and minimising operational costs. Companies largely opted to de-lever, with an estimated 15% reduction in net debt across the sector.
M&A deal value in the sector rose to US$51bn in 2017 (+15% YoY), its highest level since 2013, despite the number of transactions falling by 6% YoY. However, portfolio realignment was a key driver of M&A related activity, as diversified producers looked to divest non-core assets in favour of leaner, more consolidated portfolios.
This divestment trend opened up opportunities for financial investors, who were responsible for 22% of deal activity in 2017. Private equity investors showed a preference for copper, which saw ~70% of investment, with Africa being the most popular jurisdiction, seeing 13 deals, totalling US$1,036m (45%; 2017). The strong performances of coking and thermal coal in 2016 similarly led to large increases in deal flow, with coal acquisitions growing 156% YoY and steel transactions doubling in value to US$3.8bn.
Deal activity in the exploration space was also significantly more popular in 2017 with a total of 31 transactions, up from six in 2016. China continued to be a key driver of M&A activity at ~28% (2017) of value, closely followed by North America which captured ~25% (2017) of deal volume and led by number of transactions.
Rising commodity prices have also had an impact on equity valuations. In 2017 IPO and secondary market activity rose to its highest level in six years with US$2.8bn and US$30.7bn raised respectively.
Demand for debt instruments remained relatively unchanged, despite the easing of credit conditions with US$218bn raised, similar to the US$219bn recorded in 2016. Convertible bonds remained less prevalent, accounting for 1% (2017) of new capital.
Alternative financing options, such as mineral royalties and metal streams, continue to be a popular and well supported form of raising capital, especially in the mid to junior end of the mining sector. Our view is that the availability of traditional financing such as equity for development projects, or debt, will remain constrained in the near term. Anglo Pacific Group, through its current focus on bulks, base metal and battery material royalties and streams, enjoys a financing space which is far less crowded than its precious metals focused peers, and we continue to see a considerable number of new opportunities.
Looking towards 2018, we expect a continuation of the battery materials theme to drive an increasing proportion of M&A in mining and capital markets activity. Demand for these materials is predicted by some analysts to grow exponentially due to government commitments to shift to electric vehicles, and carmakers looking to lock-in longer-term access to materials supply. Whilst some investors remain wary on battery materials given price volatility, lithium assets in lower political risk regions such as South America and Australia should see growing interest, whilst cobalt assets outside of the Democratic Republic of Congo are likely to be of interest given the challenges posed in that country. The DRC’s heightened risk profile is driven in part by the recently revised mining code which includes increases in mining royalties, the government free carry and also an excess-profits tax, in addition to the re-designation of cobalt as a strategic metal.
The mining market outlook for 2018 remains broadly positive as commentators expect underlying commodity prices to remain strong, balance sheets to continue improving and equity valuations to tend towards mid-cycle multiples. A major driver for 2018 will be continued supply-side constraints driven in part by Chinese environmental reform initiatives which should continue to negatively impact supply. The political backdrop in key producing and trading countries will also increasingly impact sentiment towards the sector, especially as a potential trade war emerges between the US and China. Overall, volatility in 2018 should help surface attractive growth opportunities for Anglo Pacific.
1. EY Report, ‘Mergers, acquisitions and capital raising in mining and metals – 2018 Outlook’
APG_AR17_28.03.18_FRONT_ARTWORK
GR
OU
P OV
ERV
IEW S
TR
AT
EG
IC R
EP
OR
T G
OV
ERN
AN
CE FIN
AN
CIA
L STATEM
ENTS O
THER IN
FOR
MATIO
N11ANGLO PACIFIC GROUP PLC ANNUAL REPORT & ACCOUNTS 2017
S T R A T E G I C R E P O R T
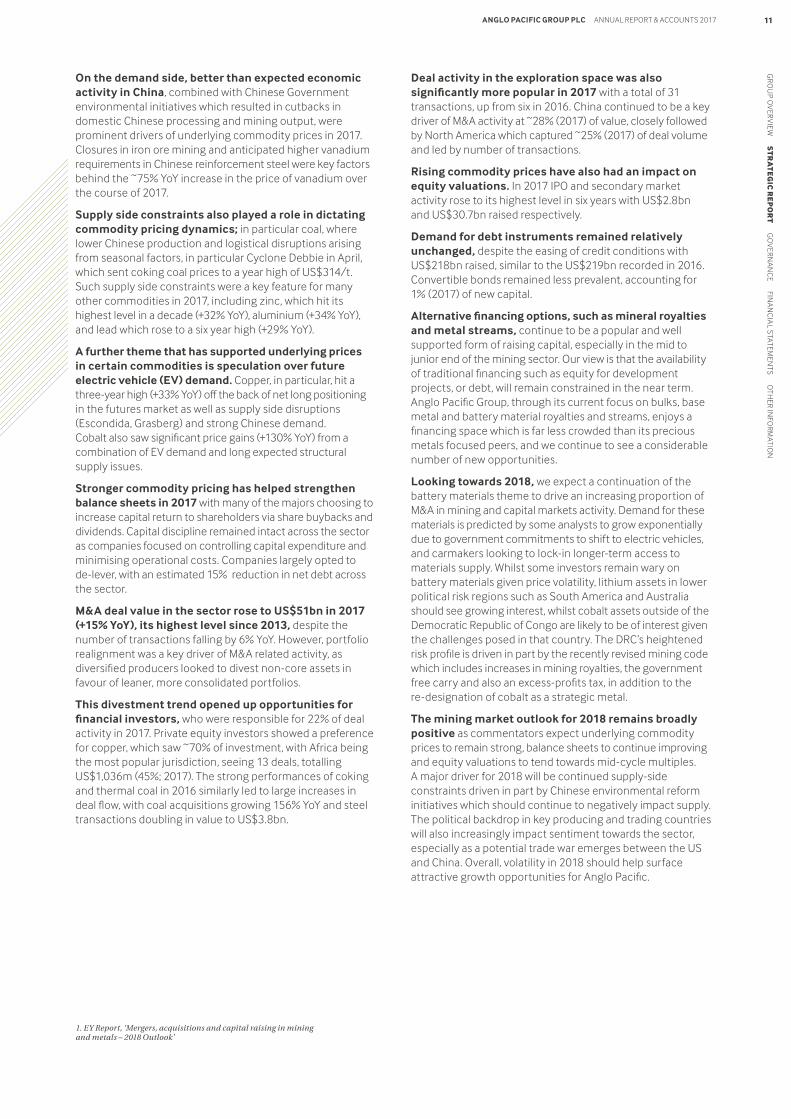
OUR BUSINESS MODEL
C R E A T IN G VA L U E F O R O U R
S H A R EHOL DER SC R E A T IN G VA L U E F O R O U R
COUN T ER PA R T IE S
Lower risk through top-line, revenue participation in mining companies
Lower volatility through commodity and geographic diversification
Exposure to increases in mineral reserves and production
Exposure to commodity price upside
An alternative form of financing to conventional equity, which can be an expensive form of finance
P R I M A R Y R O Y A L T I E S
Alternative form of finance to conventional debt providing greater flexibility and which does not impact on credit ratings
S E C O N D A R Y R O Y A L T I E S
Source of liquidity for holders of existing royalties
G
EN
ER
AT
IN
G
LO
NG
-T
ER
M
CA
SH
R
ET
UR
NS
WE
S
ER
VE
A
S
A
PA
RT
NE
R
TO
T
HE
M
IN
E
OP
ER
AT
OR
12 ANGLO PACIFIC GROUP PLC ANNUAL REPORT & ACCOUNTS 2017
APG_AR17_28.03.18_FRONT_ARTWORK
HO W W E CR E AT E VA L UE F OR OUR S H A R EHOL DER SOur most recent investments (Narrabri, Maracás Menchen, the Denison financing arrangement and Piauí) demonstrate, by adhering to exacting investment criteria and conducting rigorous due diligence, how management has created value for shareholders to date. We will look to leverage this experience and our reputation in the market to execute our strategy over the coming years.
Generating long-term cash returns
The Group is seeking to grow its portfolio of cash-generative royalties and streams by investing in producing or near-term producing assets with long mine lives. Given the relatively low overhead requirements of the business, the Group believes cash flow to shareholders can be maximised through economies of scale, which would allow for growth in the portfolio without significantly increasing our cost base.
Lower r isk through top-line, revenue par ticipation in mining companies
Revenue-based royalties limit the Group’s direct exposure to operating or capital cost inflation of the underlying mine operations, as there is no ongoing requirement for the Group to contribute to capital, exploration, environmental or other operating costs at mine sites.
Lower volatility through commodity and geographic diversif ication
The Group is seeking to build a diversified portfolio of royalties across a variety of different commodities and geographic locations. Investing in royalties across a wide spectrum of commodities and jurisdictions reduces the dependency on any one asset or location and any corresponding cyclicality. A fully diversified portfolio can help to reduce the level of income volatility, stabilising cash flows which contribute towards investment and dividend payments.
Exposure to increases in mineral reser ves and production
Royalty holders generally benefit from improvements made to the scale of a mining operation. Exploration success, or lower cut-off grades as a result of rising commodity prices, can serve to increase economic reserves and resources. Increased reserves will extend a mine’s life, or facilitate an expansion of the existing operations. Any subsequent increases in production will generally result in higher royalty payments, without the requirement of the royalty holder to contribute to the cost of expanding or optimising the operation.
Exposure to commodity pr ice upside
Royalties and streams provide exposure to underlying commodity prices. The Group expects to benefit from a rising commodity price environment, with the upside feeding through to increased royalty receipts.
HO W W E CR E AT E VA L UE F OR OUR COUN T ER PA R T IE SAn investment by Anglo Pacific, after conducting thorough due diligence, is seen as an endorsement of the project, which can provide other stakeholders with greater confidence and possibly result in a re-rating for the operator.
We ser ve as a par tner to the mine operator
Royalties and streams reduce the upfront capital required to fund the development of a project. These are generally structured as asset (or even by-product) specific, often leaving the remaining assets of the operator unencumbered for raising additional finance.
An alternative form of f inancing to conventional equity, which can be an expensive form of f inance
Compared to the issuance of new equity, royalties and streams do not depend on the prevailing state of the capital markets but are rather the result of bilateral negotiations. The issuance of new equity can also serve to dilute existing shareholders, particularly during periods of depressed share prices. Furthermore, as royalties and streams are asset specific, the reduction in the upside for existing shareholders can be limited to a certain mine or product.
PRIMARY ROYALTIES
Alternative form of f inance to conventional debt providing greater f lex ibility and which does not impact on credit ratings
Royalties and streams do not typically levy interest, nor do they typically require principal repayments or have a maturity date. More importantly, unlike conventional debt arrangements where interest payments tend to start immediately or are capitalised until cash payments can be made from a project’s cash flow, most royalties are payable only once the project comes into production and is generating sales. In addition, many forms of debt, such as project finance, include restrictive covenants and may require commodity price hedges to be put in place. These are not only typically costly in terms of fees, but can also limit the miner’s exposure to upside in the prices of their core commodities.
SECONDARY ROYALTIES
Source of liquidity for holders of ex isting royalties
The value of a royalty is realised over the duration of the mine life. Often royalty owners may have a need to free up cash in order to recycle capital. There is a limited secondary market for royalties and Anglo Pacific can be a source of valuable liquidity for private royalty holders.
APG_AR17_28.03.18_FRONT_ARTWORK
GR
OU
P OV
ERV
IEW S
TR
AT
EG
IC R
EP
OR
T G
OV
ERN
AN
CE FIN
AN
CIA
L STATEM
ENTS O
THER IN
FOR
MATIO
N13ANGLO PACIFIC GROUP PLC ANNUAL REPORT & ACCOUNTS 2017
S T R A T E G I C R E P O R T
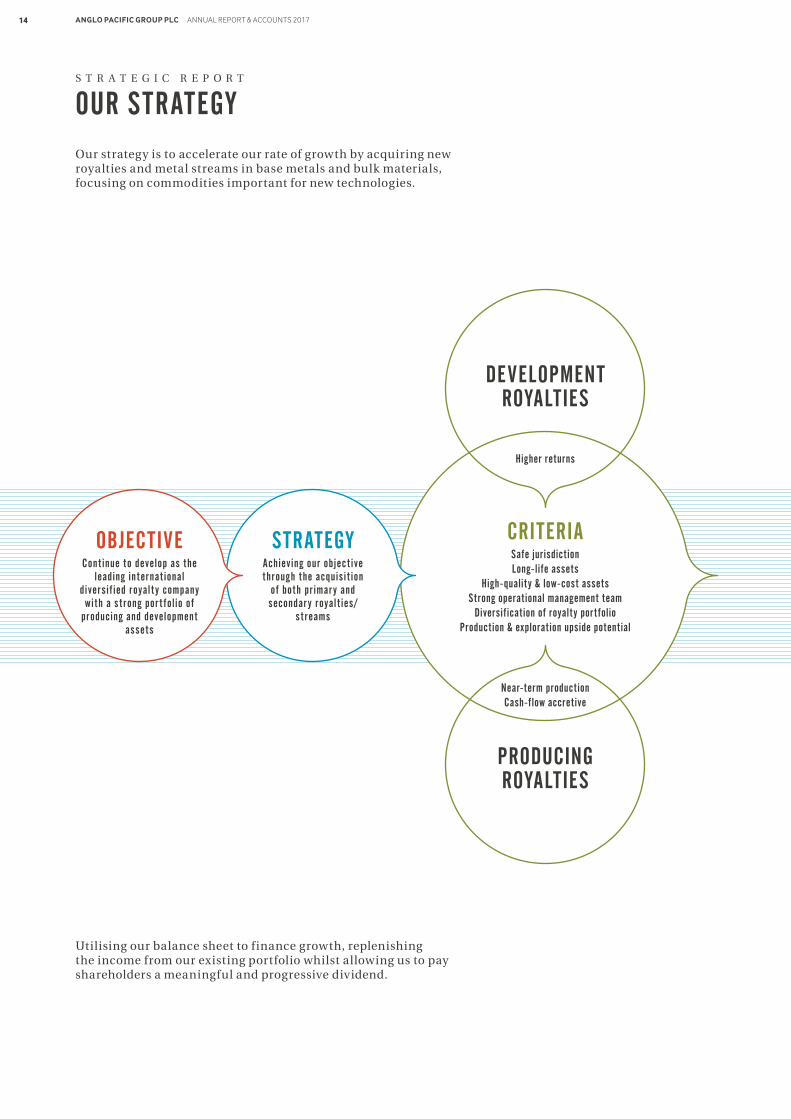
OUR STRATEGY
CRITERIASafe jurisdictionLong-life assets
High-quality & low-cost assetsStrong operational management team
Diversification of royalty portfolioProduction & exploration upside potential
Higher returns
DEVELOPMENT ROYALTIES
Near-term productionCash-flow accretive
PRODUCINGROYALTIES
STRATEGYAchieving our objective through the acquisition
of both pr imary and secondary royalties /
streams
OBJECTIVEContinue to develop as the
leading international diversif ied royalty company
with a strong por t folio of producing and development
assets
Our strategy is to accelerate our rate of growth by acquiring new royalties and metal streams in base metals and bulk materials, focusing on commodities important for new technologies.
Utilising our balance sheet to finance growth, replenishing the income from our existing portfolio whilst allowing us to pay shareholders a meaningful and progressive dividend.
APG_AR17_28.03.18_FRONT_ARTWORK
14 ANGLO PACIFIC GROUP PLC ANNUAL REPORT & ACCOUNTS 2017
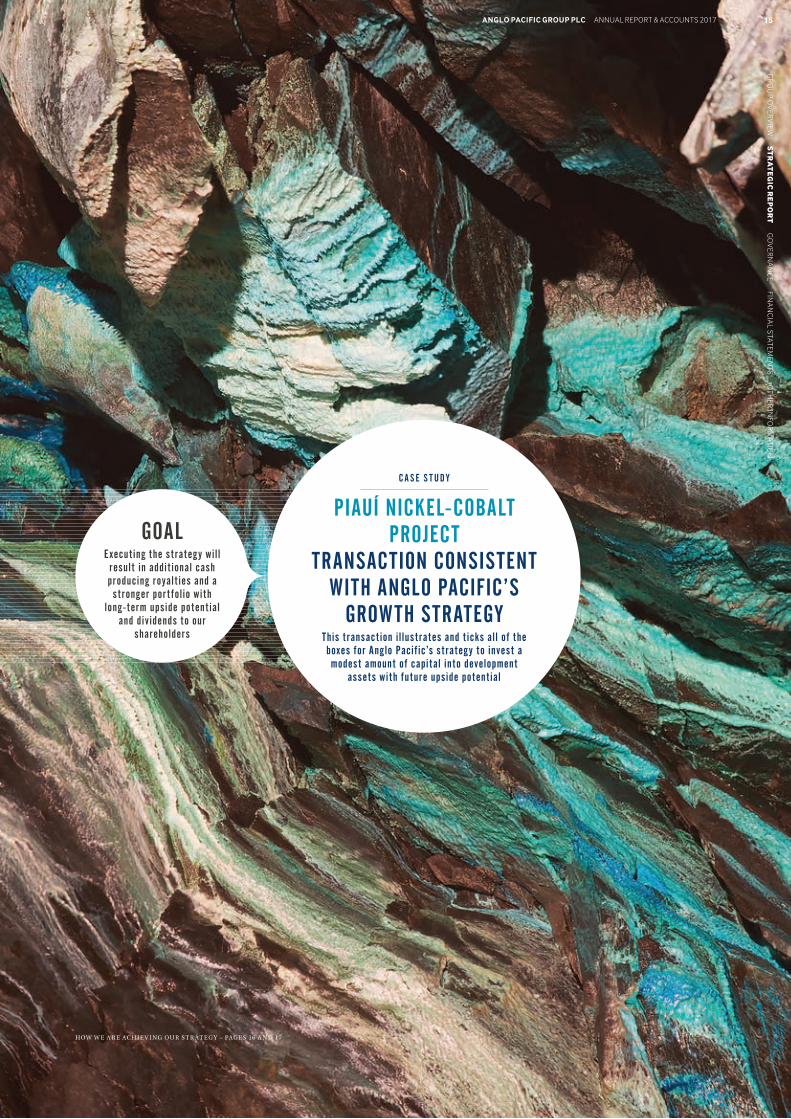
C A S E S T U D Y
PIAUÍ NICKEL-COBALT PROJECT
TRANSACTION CONSISTENT WITH ANGLO PACIFIC’S
GROWTH STRATEGYThis transaction illustrates and ticks all of the boxes for Anglo Pacif ic’s strategy to invest a modest amount of capital into development
assets with future upside potential
GOALExecuting the strategy will
result in additional cash producing royalties and a
stronger por t folio with long-term upside potential
and div idends to our shareholders
HOW W E A R E AC H I E V I NG OU R S T R AT E G Y – PAG E S 16 A N D 17
GR
OU
P OV
ERV
IEW S
TR
AT
EG
IC R
EP
OR
T G
OV
ERN
AN
CE FIN
AN
CIA
L STATEM
ENTS O
THER IN
FOR
MATIO
N15ANGLO PACIFIC GROUP PLC ANNUAL REPORT & ACCOUNTS 2017
APG_AR17_28.03.18_FRONT_ARTWORK
PIAUÍ NICKEL-COBALT PROJECT TRANSACTION CONSISTENT WITH ANGLO PACIFIC’S GROWTH STRATEGY
S T R A T E G I C R E P O R T
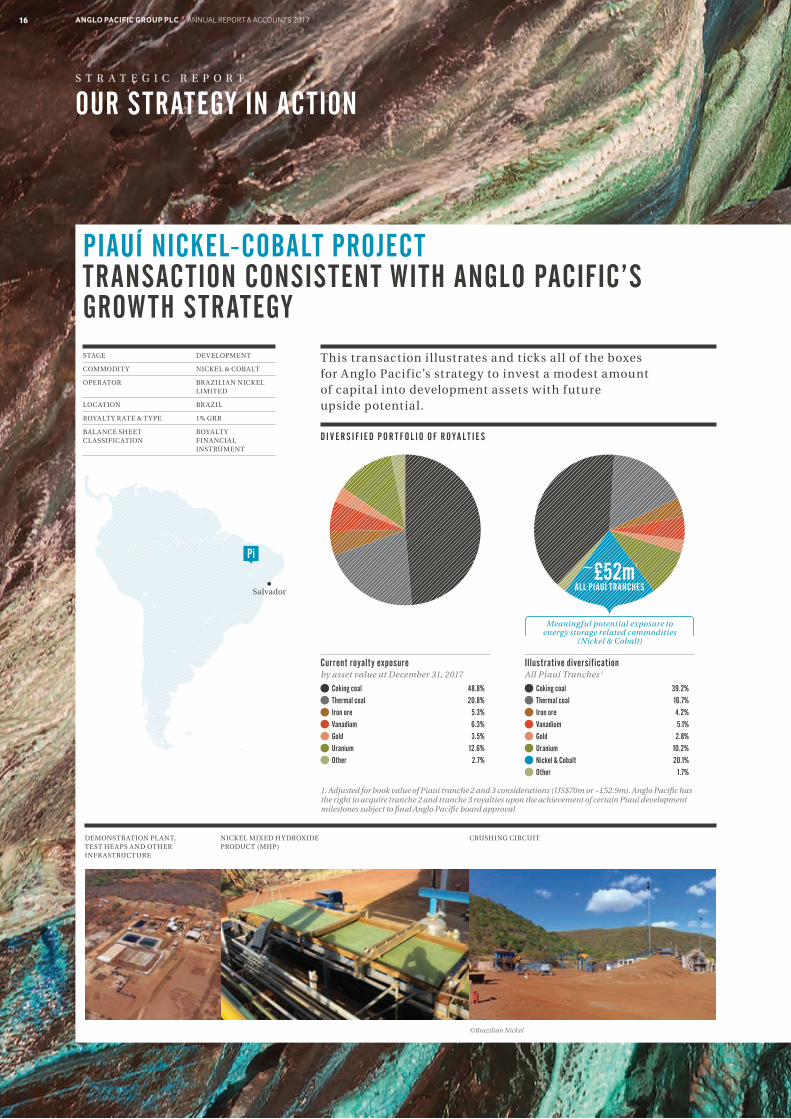
OUR STRATEGY IN ACTION
This transaction il lustrates and ticks all of the boxes for Anglo Pacif ic’s strateg y to invest a modest amount of capital into development assets with future upside potential.
DEMONSTR ATION PL ANT, TEST HEAPS AND OTHER INFR ASTRUCTURE
NICKEL MIXED HY DROXIDE PRODUCT (MHP)
CRUSHING CIRCUIT
©Brazilian Nickel
STAGE DEV ELOPMENT
COMMODITY NICKEL & COBALT
OPER ATOR BR A ZILIAN NICKEL LIMITED
LOCATION BR A ZIL
ROYALTY R ATE & TY PE 1% GRR
BAL ANCE SHEET ROYALTY CL ASSIFICATION FINANCIAL INSTRUMENT
Current royalty exposureby asset value at December 31, 2017
Coking coal 48.8%
Thermal coal 20.8%
Iron ore 5.3%
Vanadium 6.3%
Gold 3.5%
Uranium 12.6%
Other 2.7%
Illustrative diversificationAll Piauí Tranches 1
Coking coal 39.2%
Thermal coal 16.7%
Iron ore 4.2%
Vanadium 5.1%
Gold 2.8%
Uranium 10.2%
Nickel & Cobalt 20.1%
Other 1.7%
1. Adjusted for book value of Piauí tranche 2 and 3 considerations (US$70m or ~£52.9m). Anglo Pacific has the right to acquire tranche 2 and tranche 3 royalties upon the achievement of certain Piauí development milestones subject to final Anglo Pacific board approval
Salvador
Pi
Meaningful potential exposure to energy storage related commodities
(Nickel & Cobalt)
~£52m1 ALL PIAUÍ TRANCHES
D I V E R S I F I E D P O R T F O L I O O F R O Y A L T I E S
16 ANGLO PACIFIC GROUP PLC ANNUAL REPORT & ACCOUNTS 2017
APG_AR17_28.03.18_FRONT_ARTWORK
TRANSACTION HIGHLIGHTS
Anglo Pacific Group entered into a royalty agreement with Brazilian Nickel Ltd (Brazilian Nickel) to acquire an initial 1% gross revenue royalty (GRR) over the Piauí nickel-cobalt project (Piauí or the Project) for a US$2m (~£1.6m) cash payment
The initial US$2m consideration part funded further project assessment and the expansion of the existing nickel-cobalt demonstration plant to a nameplate production capacity of 1,000 tonnes of nickel per annum
Once the process is proven at the 1,000 tonnes of nickel per annum level, Brazilian Nickel intends to ramp-up production to 24,000 tonnes, or alternatively Brazilian Nickel may pursue a lower-capex staged development first ramping-up to 10,000 tonnes and then to 24,000 tonnes of nickel per annum
Upon the achievement of certain Piauí development milestones and Anglo Pacific board approval for each tranche, the Company has the right to invest up to a total of US$70m (~£51.9m) in additional GRRs with proceeds restricted to funding in-part the construction or expansion of a processing facility:
Under the staged ramp-up development scenario: US$20m for an incremental 2.0% GRR when plans for the construction of a processing plant with a nameplate capacity of 10,000 tonnes of nickel per annum are implemented and US$50m for an incremental 2.5% GRR when plans to ramp-up to 24,000 tonnes of nickel per annum are implemented; OR
US$70m for an incremental 3.0% GRR at the point when plans for the construction of a processing plant with a nameplate capacity of 24,000 tonnes of nickel per annum are implemented
The staged consideration approach allows for flexibility with regards to potential Piauí development scenarios as well as for the Project to be de-risked prior to Anglo Pacific proceeding with additional tranches
The transaction is in-line with the Company’s strategy to invest in development opportunities with significant growth potential to complement its existing portfolio of income producing assets.
GROW TH STRATEGY
Enhances Anglo Pacif ic exposure to energy storage & electr ic vehicle related commodities
High purity nickel and cobalt hydroxide products expected to be used for lithium ion batteries and in traditional markets 1
Further diversifies the Anglo Pacific royalty portfolio in addition to existing vanadium royalty.
Future growth potential
Potential for attractive returns once Project is ramped-up with ability to increase exposure as and when Piauí is de-risked
Low-cost operation 1
Operating costs expected to be less than US$ 3.00/lb of nickel after refining charges and cobalt credits 1
Established mining jur isdiction 1
Located in an area of Brazil with nearby water, power, and transport infrastructure in place 1
Par tnering with an experienced management team
Established track record in mining and nickel heap leach operations
Detailed due diligence process
Review of technical and other not publicly available information
1. Brazilian Nickel disclosure
GR
OU
P OV
ERV
IEW S
TR
AT
EG
IC R
EP
OR
T G
OV
ERN
AN
CE FIN
AN
CIA
L STATEM
ENTS O
THER IN
FOR
MATIO
N17ANGLO PACIFIC GROUP PLC ANNUAL REPORT & ACCOUNTS 2017
APG_AR17_28.03.18_FRONT_ARTWORK
BACKGROUNDRisk is integral to every aspect of the Group’s business model and how it executes on its strategy. We ensure that our investors understand our business model and how an investment in Anglo Pacific is different to investing in an operating company, albeit we address operating risk closely through our due diligence procedures. The Board is responsible for identifying, understanding and managing these risks. The Audit Committee is then tasked with overseeing how risk is being managed on a regular basis.
RISK APPETITE AND VIABILIT YThe Company is once again voluntarily complying with provision C2.2 of the 2014 Combined Code, which requires a statement on viability to be made in this report, including the determination and consideration of stress tested “severe but plausible” scenarios. This analysis was performed for a three-year period, consistent with the Group’s medium-term planning horizon and the term of its borrowing facility.
The viability statement, and underlying supporting papers, are intended to intertwine risk disclosure and going concern into a more meaningful discussion about the financial impact of principal risks. Risk can never be fully eliminated, but can be mitigated to a level which the Directors are prepared to accept as necessary to execute the Group’s strategy.
Although the ultimate success of Anglo Pacific will depend on its ability to continue to add value enhancing royalties and streams to its portfolio, the focus of the viability statement is on the existing business of the Group and the ability of the current royalty portfolio to generate sufficient cash to meet the Group’s outgoings,
including the dividend. Under our “severe but plausible” case, this results in the Group drawing down on its borrowing facilities as income reduces. The Directors’ risk appetite is therefore capped with reference to an acceptable and supportable level of borrowings relative to the Group’s income profile over the next three years on a “severe but plausible” basis.
INTER ACTION WITH STR ATEGYRisk is often perceived purely as a negative and associated with loss or prevention. In fact, for Anglo Pacific, the acceptance of a certain level of risk is part and parcel of its business model and is necessary in order to generate investment returns and can often present opportunities for growth. It is the point at which the Board determines to accept a higher or lower appetite for risk that is important in the context of the Group’s risk framework i.e. the Board should anticipate or acknowledge that an event has occurred which has altered the previously held position on risk.
We have seen this recently at Anglo Pacific, when the Board relaxed its investment criteria at the beginning of 2017 to include non-producing royalties. This was a function of the impact that the sudden recovery in commodity prices at the end of 2016 had on the Group’s cash position which enabled the Board to determine that it was prepared to accept more risk when investing modest amounts of surplus cash into royalties which have the potential to deliver superior returns over a longer time horizon – whilst still sticking to strict investment criteria (as outlined on page 14). Key to this was the view of the Board that the outlook for commodity prices was favourable, particularly in the commodities from which the Group currently derives most of its income.
The Board also re-examined country risk, in light of any developments observed over the course of the last 12 months. It was decided that there are some countries, or regions, which have made considerable progress of late and which the Group could now consider investing in. This included certain countries in South America, Eastern Europe and Africa, although it is unlikely that the Group will compound risk by investing in non-income producing royalties in such jurisdictions.
The Group’s risk framework is designed to identify instances such as these when the risk environment changes and there could be an impact on the Group’s business model or strategy, in addition to providing the basis for continuous and robust monitoring and management of risk.
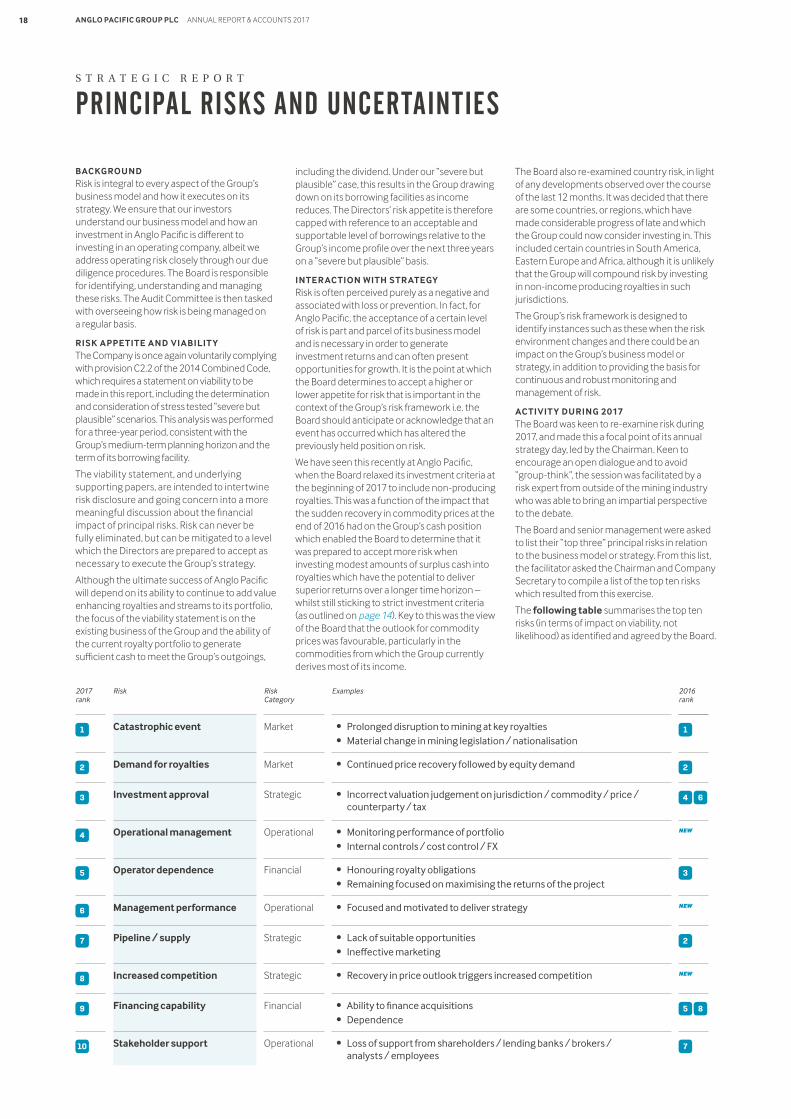
ACTIVIT Y DURING 2017The Board was keen to re-examine risk during 2017, and made this a focal point of its annual strategy day, led by the Chairman. Keen to encourage an open dialogue and to avoid “group-think”, the session was facilitated by a risk expert from outside of the mining industry who was able to bring an impartial perspective to the debate.
The Board and senior management were asked to list their “top three” principal risks in relation to the business model or strategy. From this list, the facilitator asked the Chairman and Company Secretary to compile a list of the top ten risks which resulted from this exercise.
The following table summarises the top ten risks (in terms of impact on viability, not likelihood) as identified and agreed by the Board.
S T R A T E G I C R E P O R T
PRINCIPAL RISKS AND UNCERTAINTIES
ExamplesRisk Category
2017 rank
2016 rank
Risk
Catastrophic event
Demand for royalties
Investment approval
Operational management
Operator dependence
Management performance
Pipeline / supply
Increased competition
Financing capability
Stakeholder support
• Prolonged disruption to mining at key royalties • Material change in mining legislation / nationalisation
• Continued price recovery followed by equity demand
• Incorrect valuation judgement on jurisdiction / commodity / price / counterparty / tax
• Monitoring performance of portfolio • Internal controls / cost control / FX
• Honouring royalty obligations • Remaining focused on maximising the returns of the project
• Focused and motivated to deliver strategy
• Lack of suitable opportunities • Ineffective marketing
• Recovery in price outlook triggers increased competition
• Ability to finance acquisitions • Dependence
• Loss of support from shareholders / lending banks / brokers / analysts / employees
Market
Market
Strategic
Operational
Financial
Operational
Strategic
Strategic
Financial
Operational
1 1
2
3
2
4
5
7
6
8
2
3
4
5
6
7
8
9
10
NEW
NEW
NEW
APG_AR17_28.03.18_FRONT_ARTWORK
18 ANGLO PACIFIC GROUP PLC ANNUAL REPORT & ACCOUNTS 2017
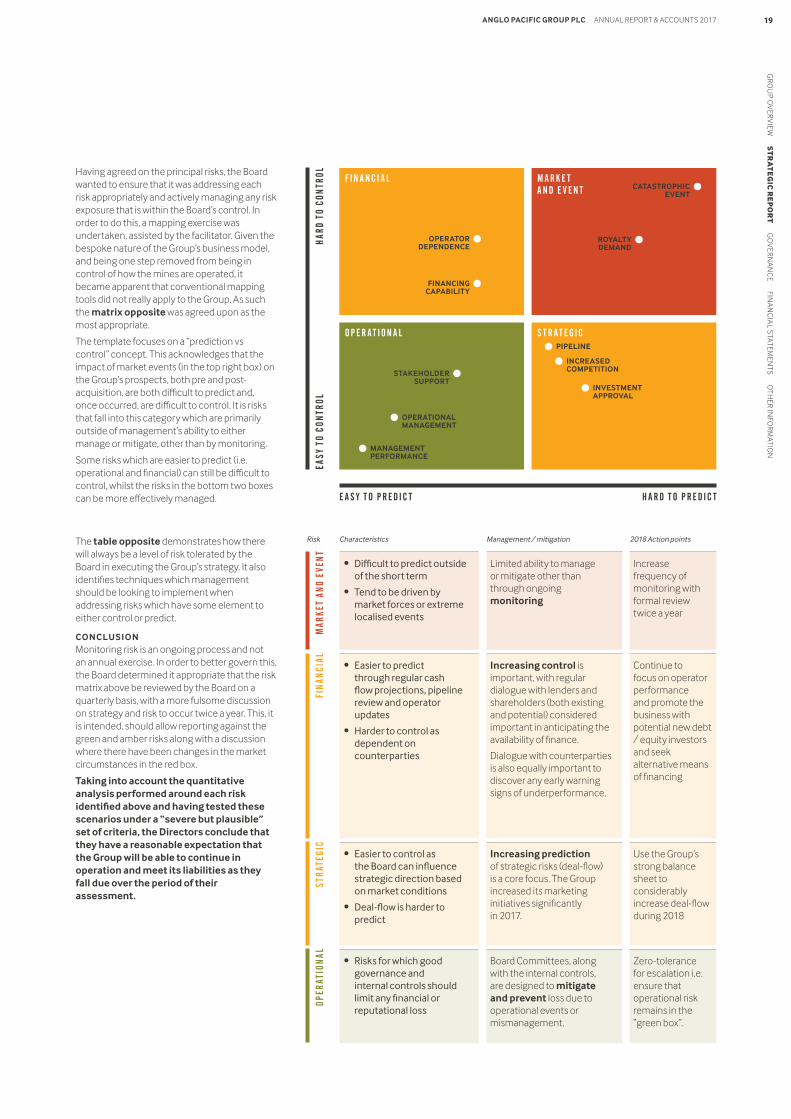
Having agreed on the principal risks, the Board wanted to ensure that it was addressing each risk appropriately and actively managing any risk exposure that is within the Board’s control. In order to do this, a mapping exercise was undertaken, assisted by the facilitator. Given the bespoke nature of the Group’s business model, and being one step removed from being in control of how the mines are operated, it became apparent that conventional mapping tools did not really apply to the Group. As such the matrix opposite was agreed upon as the most appropriate.
The template focuses on a “prediction vs control” concept. This acknowledges that the impact of market events (in the top right box) on the Group’s prospects, both pre and post-acquisition, are both difficult to predict and, once occurred, are difficult to control. It is risks that fall into this category which are primarily outside of management’s ability to either manage or mitigate, other than by monitoring.
Some risks which are easier to predict (i.e. operational and financial) can still be difficult to control, whilst the risks in the bottom two boxes can be more effectively managed.
The table opposite demonstrates how there will always be a level of risk tolerated by the Board in executing the Group’s strategy. It also identifies techniques which management should be looking to implement when addressing risks which have some element to either control or predict.
CONCLUSIONMonitoring risk is an ongoing process and not an annual exercise. In order to better govern this, the Board determined it appropriate that the risk matrix above be reviewed by the Board on a quarterly basis, with a more fulsome discussion on strategy and risk to occur twice a year. This, it is intended, should allow reporting against the green and amber risks along with a discussion where there have been changes in the market circumstances in the red box.
Taking into account the quantitative analysis performed around each risk identified above and having tested these scenarios under a “severe but plausible” set of criteria, the Directors conclude that they have a reasonable expectation that the Group will be able to continue in operation and meet its liabilities as they fall due over the period of their assessment.
Characteristics Management / mitigation 2018 Action points
• Difficult to predict outside of the short term
• Tend to be driven by market forces or extreme localised events
Limited ability to manage or mitigate other than through ongoing monitoring
Increase frequency of monitoring with formal review twice a year
• Easier to predict through regular cash flow projections, pipeline review and operator updates
• Harder to control as dependent on counterparties
Increasing control is important, with regular dialogue with lenders and shareholders (both existing and potential) considered important in anticipating the availability of finance.
Dialogue with counterparties is also equally important to discover any early warning signs of underperformance.
Continue to focus on operator performance and promote the business with potential new debt / equity investors and seek alternative means of financing
• Easier to control as the Board can influence strategic direction based on market conditions
• Deal-flow is harder to predict
Increasing prediction of strategic risks (deal-flow) is a core focus. The Group increased its marketing initiatives significantly in 2017.
Use the Group’s strong balance sheet to considerably increase deal-flow during 2018
• Risks for which good governance and internal controls should limit any financial or reputational loss
Board Committees, along with the internal controls, are designed to mitigate and prevent loss due to operational events or mismanagement.
Zero-tolerance for escalation i.e. ensure that operational risk remains in the “green box”.
Risk
MAR
KET
AND
EVEN
TFI
NAN
CIAL
STRA
TEGI
COP
ERAT
ION
AL
F I N A N C I A L
O P E R A T I O N A L
M A R K E T A N D E V E N T
S T R A T E G I CEA
SY T
O CO
NTR
OL
HARD
TO
CON
TROL
E A S Y T O P R E D I C T H A R D T O P R E D I C T
OPERATOR DEPENDENCE
CATASTROPHIC EVENT
ROYALTY DEMAND
STAKEHOLDER SUPPORT
OPERATIONAL MANAGEMENT
PIPELINE
INCREASED COMPETITION
INVESTMENT APPROVAL
MANAGEMENT PERFORMANCE
FINANCING CAPABILITY
APG_AR17_28.03.18_FRONT_ARTWORK
GR
OU
P OV
ERV
IEW S
TR
AT
EG
IC R
EP
OR
T G
OV
ERN
AN
CE FIN
AN
CIA
L STATEM
ENTS O
THER IN
FOR
MATIO
N19ANGLO PACIFIC GROUP PLC ANNUAL REPORT & ACCOUNTS 2017
S T R A T E G I C R E P O R T
PRINCIPAL RISKS AND UNCERTAINTIEScontinued
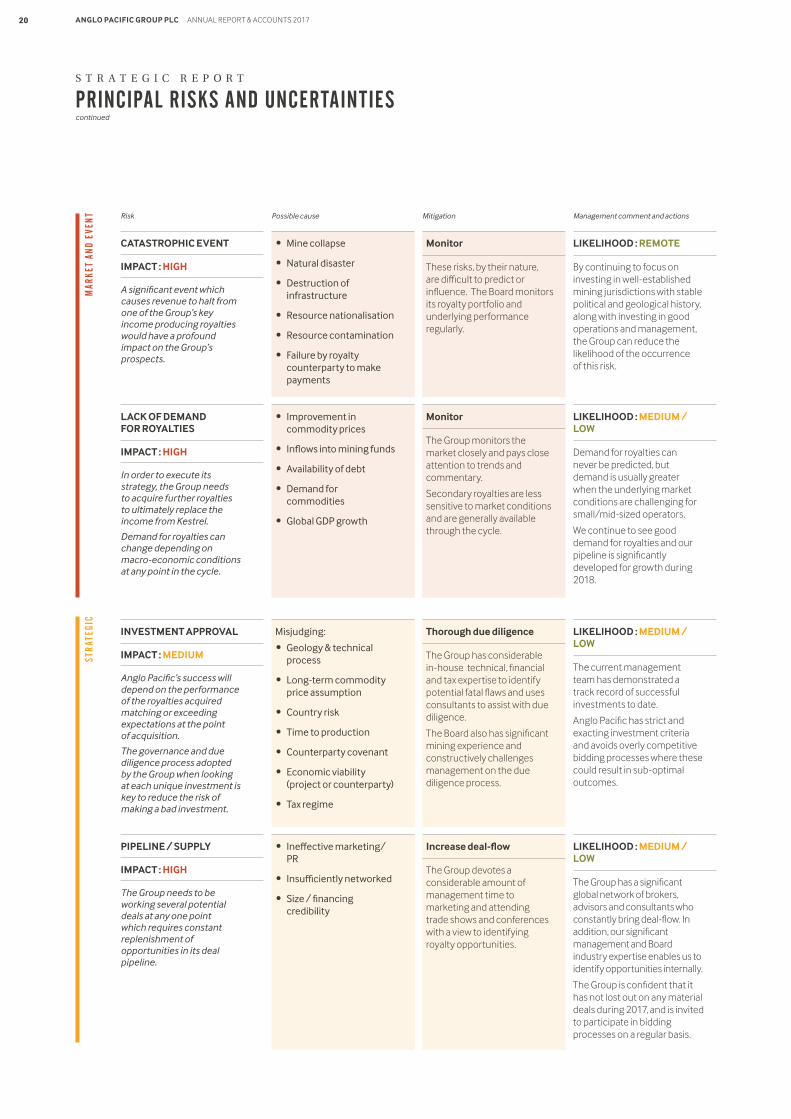
Risk Possible cause Mitigation Management comment and actions
CATASTROPHIC EVENT
IMPACT : HIGH
A significant event which causes revenue to halt from one of the Group’s key income producing royalties would have a profound impact on the Group’s prospects.
LACK OF DEMAND FOR ROYALTIES
IMPACT : HIGH
In order to execute its strategy, the Group needs to acquire further royalties to ultimately replace the income from Kestrel.
Demand for royalties can change depending on macro-economic conditions at any point in the cycle.
• Mine collapse
• Natural disaster
• Destruction of infrastructure
• Resource nationalisation
• Resource contamination
• Failure by royalty counterparty to make payments
• Improvement in commodity prices
• Inflows into mining funds
• Availability of debt
• Demand for commodities
• Global GDP growth
Monitor
These risks, by their nature, are difficult to predict or influence. The Board monitors its royalty portfolio and underlying performance regularly.
Monitor
The Group monitors the market closely and pays close attention to trends and commentary.
Secondary royalties are less sensitive to market conditions and are generally available through the cycle.
LIKELIHOOD : REMOTE
By continuing to focus on investing in well-established mining jurisdictions with stable political and geological history, along with investing in good operations and management, the Group can reduce the likelihood of the occurrence of this risk.
LIKELIHOOD : MEDIUM / LOW
Demand for royalties can never be predicted, but demand is usually greater when the underlying market conditions are challenging for small/mid-sized operators.
We continue to see good demand for royalties and our pipeline is significantly developed for growth during 2018.
INVESTMENT APPROVAL
IMPACT : MEDIUM
Anglo Pacific’s success will depend on the performance of the royalties acquired matching or exceeding expectations at the point of acquisition.
The governance and due diligence process adopted by the Group when looking at each unique investment is key to reduce the risk of making a bad investment.
Misjudging:
• Geology & technical process
• Long-term commodity price assumption
• Country risk
• Time to production
• Counterparty covenant
• Economic viability (project or counterparty)
• Tax regime
Thorough due diligence
The Group has considerable in-house technical, financial and tax expertise to identify potential fatal flaws and uses consultants to assist with due diligence.
The Board also has significant mining experience and constructively challenges management on the due diligence process.
LIKELIHOOD : MEDIUM / LOW
The current management team has demonstrated a track record of successful investments to date.
Anglo Pacific has strict and exacting investment criteria and avoids overly competitive bidding processes where these could result in sub-optimal outcomes.
PIPELINE / SUPPLY
IMPACT : HIGH
The Group needs to be working several potential deals at any one point which requires constant replenishment of opportunities in its deal pipeline.
• Ineffective marketing/PR
• Insufficiently networked
• Size / financing credibility
Increase deal-flow
The Group devotes a considerable amount of management time to marketing and attending trade shows and conferences with a view to identifying royalty opportunities.
LIKELIHOOD : MEDIUM / LOW
The Group has a significant global network of brokers, advisors and consultants who constantly bring deal-flow. In addition, our significant management and Board industry expertise enables us to identify opportunities internally.
The Group is confident that it has not lost out on any material deals during 2017, and is invited to participate in bidding processes on a regular basis.
MAR
KET
AND
EVEN
TST
RATE
GIC
APG_AR17_28.03.18_FRONT_ARTWORK
20 ANGLO PACIFIC GROUP PLC ANNUAL REPORT & ACCOUNTS 2017
Risk Possible cause Mitigation Management comment and actions
Risk Possible cause Mitigation Management comment
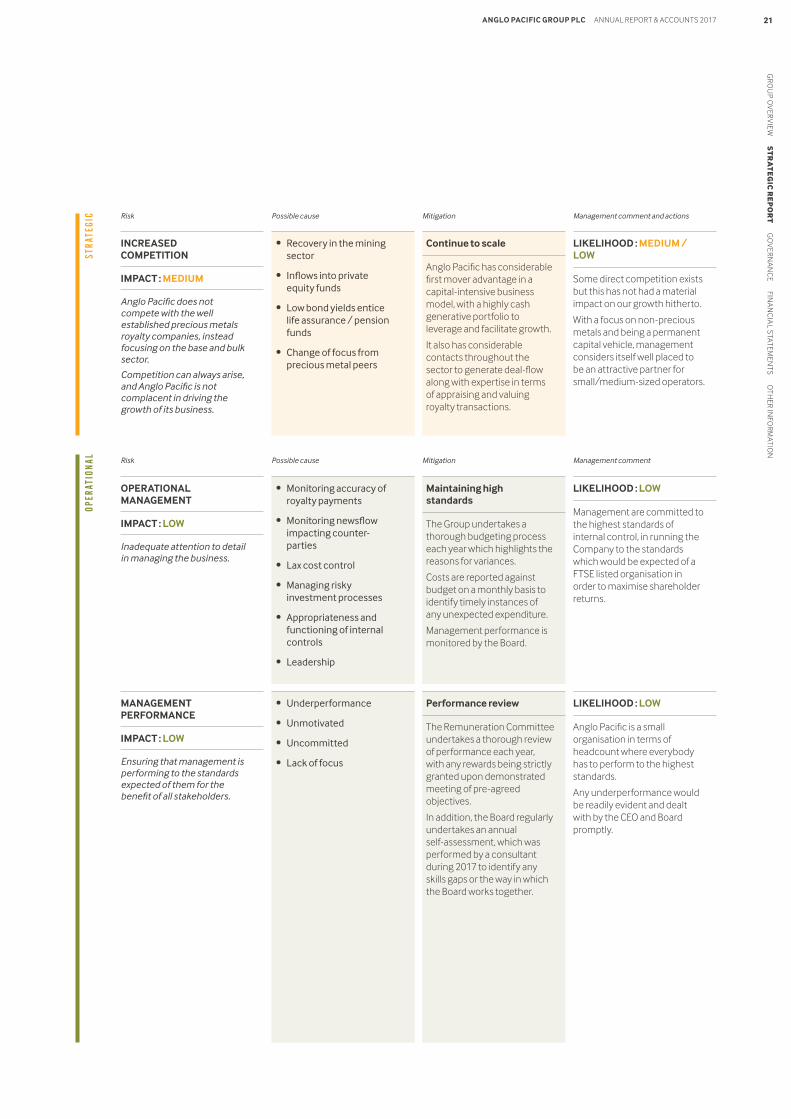
INCREASED COMPETITION
IMPACT : MEDIUM
Anglo Pacific does not compete with the well established precious metals royalty companies, instead focusing on the base and bulk sector.
Competition can always arise, and Anglo Pacific is not complacent in driving the growth of its business.
• Recovery in the mining sector
• Inflows into private equity funds
• Low bond yields entice life assurance / pension funds
• Change of focus from precious metal peers
Continue to scale
Anglo Pacific has considerable first mover advantage in a capital-intensive business model, with a highly cash generative portfolio to leverage and facilitate growth.
It also has considerable contacts throughout the sector to generate deal-flow along with expertise in terms of appraising and valuing royalty transactions.
LIKELIHOOD : MEDIUM / LOW
Some direct competition exists but this has not had a material impact on our growth hitherto.
With a focus on non-precious metals and being a permanent capital vehicle, management considers itself well placed to be an attractive partner for small/medium-sized operators.
STRA
TEGI
COP
ERAT
ION
AL
MANAGEMENT PERFORMANCE
IMPACT : LOW
Ensuring that management is performing to the standards expected of them for the benefit of all stakeholders.
• Underperformance
• Unmotivated
• Uncommitted
• Lack of focus
Performance review
The Remuneration Committee undertakes a thorough review of performance each year, with any rewards being strictly granted upon demonstrated meeting of pre-agreed objectives.
In addition, the Board regularly undertakes an annual self-assessment, which was performed by a consultant during 2017 to identify any skills gaps or the way in which the Board works together.
LIKELIHOOD : LOW
Anglo Pacific is a small organisation in terms of headcount where everybody has to perform to the highest standards.
Any underperformance would be readily evident and dealt with by the CEO and Board promptly.
OPERATIONAL MANAGEMENT
IMPACT : LOW
Inadequate attention to detail in managing the business.
• Monitoring accuracy of royalty payments
• Monitoring newsflow impacting counter-parties
• Lax cost control
• Managing risky investment processes
• Appropriateness and functioning of internal controls
• Leadership
Maintaining high standards
The Group undertakes a thorough budgeting process each year which highlights the reasons for variances.
Costs are reported against budget on a monthly basis to identify timely instances of any unexpected expenditure.
Management performance is monitored by the Board.
LIKELIHOOD : LOW
Management are committed to the highest standards of internal control, in running the Company to the standards which would be expected of a FTSE listed organisation in order to maximise shareholder returns.
APG_AR17_28.03.18_FRONT_ARTWORK
GR
OU
P OV
ERV
IEW S
TR
AT
EG
IC R
EP
OR
T G
OV
ERN
AN
CE FIN
AN
CIA
L STATEM
ENTS O
THER IN
FOR
MATIO
N21ANGLO PACIFIC GROUP PLC ANNUAL REPORT & ACCOUNTS 2017
S T R A T E G I C R E P O R T
PRINCIPAL RISKS AND UNCERTAINTIEScontinued
OPER
ATIO
NAL
FIN
ANCI
AL
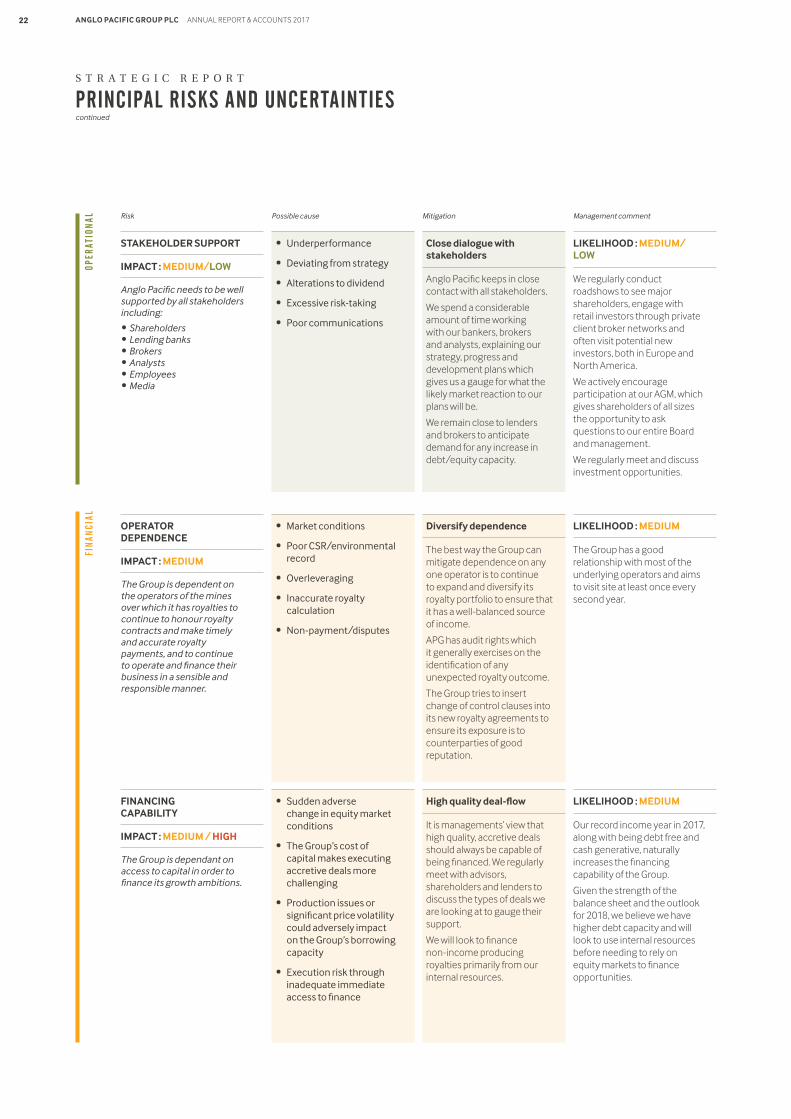
OPERATOR DEPENDENCE
IMPACT : MEDIUM
The Group is dependent on the operators of the mines over which it has royalties to continue to honour royalty contracts and make timely and accurate royalty payments, and to continue to operate and finance their business in a sensible and responsible manner.
• Market conditions
• Poor CSR/environmental record
• Overleveraging
• Inaccurate royalty calculation
• Non-payment/disputes
Diversify dependence
The best way the Group can mitigate dependence on any one operator is to continue to expand and diversify its royalty portfolio to ensure that it has a well-balanced source of income.
APG has audit rights which it generally exercises on the identification of any unexpected royalty outcome.
The Group tries to insert change of control clauses into its new royalty agreements to ensure its exposure is to counterparties of good reputation.
LIKELIHOOD : MEDIUM
The Group has a good relationship with most of the underlying operators and aims to visit site at least once every second year.
FINANCING CAPABILITY
IMPACT : MEDIUM / HIGH
The Group is dependant on access to capital in order to finance its growth ambitions.
• Sudden adverse change in equity market conditions
• The Group’s cost of capital makes executing accretive deals more challenging
• Production issues or significant price volatility could adversely impact on the Group’s borrowing capacity
• Execution risk through inadequate immediate access to finance
High quality deal-flow
It is managements’ view that high quality, accretive deals should always be capable of being financed. We regularly meet with advisors, shareholders and lenders to discuss the types of deals we are looking at to gauge their support.
We will look to finance non-income producing royalties primarily from our internal resources.
LIKELIHOOD : MEDIUM
Our record income year in 2017, along with being debt free and cash generative, naturally increases the financing capability of the Group.
Given the strength of the balance sheet and the outlook for 2018, we believe we have higher debt capacity and will look to use internal resources before needing to rely on equity markets to finance opportunities.
Risk Possible cause Mitigation Management comment
STAKEHOLDER SUPPORT
IMPACT : MEDIUM/LOW
Anglo Pacific needs to be well supported by all stakeholders including:
• Shareholders • Lending banks • Brokers • Analysts • Employees • Media
• Underperformance
• Deviating from strategy
• Alterations to dividend
• Excessive risk-taking
• Poor communications
Close dialogue with stakeholders
Anglo Pacific keeps in close contact with all stakeholders.
We spend a considerable amount of time working with our bankers, brokers and analysts, explaining our strategy, progress and development plans which gives us a gauge for what the likely market reaction to our plans will be.
We remain close to lenders and brokers to anticipate demand for any increase in debt/equity capacity.
LIKELIHOOD : MEDIUM/LOW
We regularly conduct roadshows to see major shareholders, engage with retail investors through private client broker networks and often visit potential new investors, both in Europe and North America.
We actively encourage participation at our AGM, which gives shareholders of all sizes the opportunity to ask questions to our entire Board and management.
We regularly meet and discuss investment opportunities.
APG_AR17_28.03.18_FRONT_ARTWORK
22 ANGLO PACIFIC GROUP PLC ANNUAL REPORT & ACCOUNTS 2017
FIN
ANCI
AL
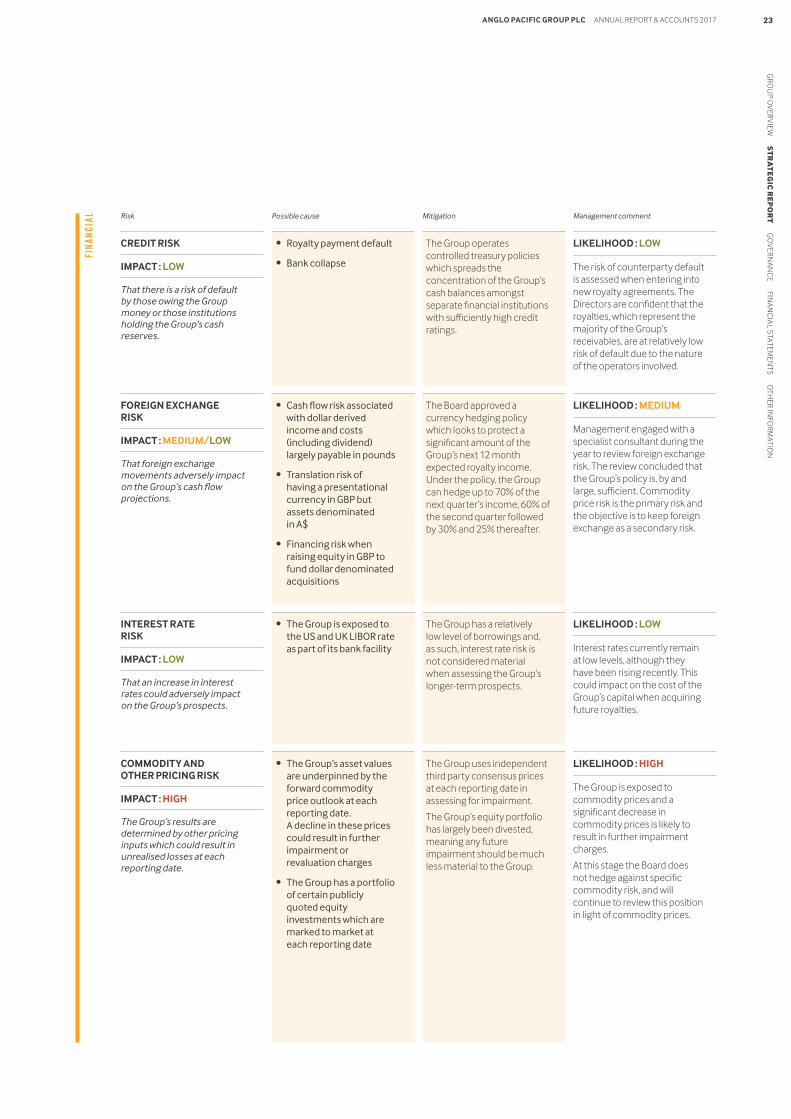
CREDIT RISK
IMPACT : LOW
That there is a risk of default by those owing the Group money or those institutions holding the Group’s cash reserves.
FOREIGN EXCHANGE RISK
IMPACT : MEDIUM/LOW
That foreign exchange movements adversely impact on the Group’s cash flow projections.
INTEREST RATE RISK
IMPACT : LOW
That an increase in interest rates could adversely impact on the Group’s prospects.
COMMODITY AND OTHER PRICING RISK
IMPACT : HIGH
The Group’s results are determined by other pricing inputs which could result in unrealised losses at each reporting date.
• Royalty payment default
• Bank collapse
• Cash flow risk associated with dollar derived income and costs (including dividend) largely payable in pounds
• Translation risk of having a presentational currency in GBP but assets denominated in A$
• Financing risk when raising equity in GBP to fund dollar denominated acquisitions
• The Group is exposed to the US and UK LIBOR rate as part of its bank facility
• The Group’s asset values are underpinned by the forward commodity price outlook at each reporting date. A decline in these prices could result in further impairment or revaluation charges
• The Group has a portfolio of certain publicly quoted equity investments which are marked to market at each reporting date
The Group operates controlled treasury policies which spreads the concentration of the Group’s cash balances amongst separate financial institutions with sufficiently high credit ratings.
The Board approved a currency hedging policy which looks to protect a significant amount of the Group’s next 12 month expected royalty income. Under the policy, the Group can hedge up to 70% of the next quarter’s income, 60% of the second quarter followed by 30% and 25% thereafter.
The Group has a relatively low level of borrowings and, as such, interest rate risk is not considered material when assessing the Group’s longer-term prospects.
The Group uses independent third party consensus prices at each reporting date in assessing for impairment.
The Group’s equity portfolio has largely been divested, meaning any future impairment should be much less material to the Group.
LIKELIHOOD : LOW
The risk of counterparty default is assessed when entering into new royalty agreements. The Directors are confident that the royalties, which represent the majority of the Group’s receivables, are at relatively low risk of default due to the nature of the operators involved.
LIKELIHOOD : MEDIUM
Management engaged with a specialist consultant during the year to review foreign exchange risk. The review concluded that the Group’s policy is, by and large, sufficient. Commodity price risk is the primary risk and the objective is to keep foreign exchange as a secondary risk.
LIKELIHOOD : LOW
Interest rates currently remain at low levels, although they have been rising recently. This could impact on the cost of the Group’s capital when acquiring future royalties.
LIKELIHOOD : HIGH
The Group is exposed to commodity prices and a significant decrease in commodity prices is likely to result in further impairment charges.
At this stage the Board does not hedge against specific commodity risk, and will continue to review this position in light of commodity prices.
Risk Possible cause Mitigation Management comment
APG_AR17_28.03.18_FRONT_ARTWORK
GR
OU
P OV
ERV
IEW S
TR
AT
EG
IC R
EP
OR
T G
OV
ERN
AN
CE FIN
AN
CIA
L STATEM
ENTS O
THER IN
FOR
MATIO
N23ANGLO PACIFIC GROUP PLC ANNUAL REPORT & ACCOUNTS 2017
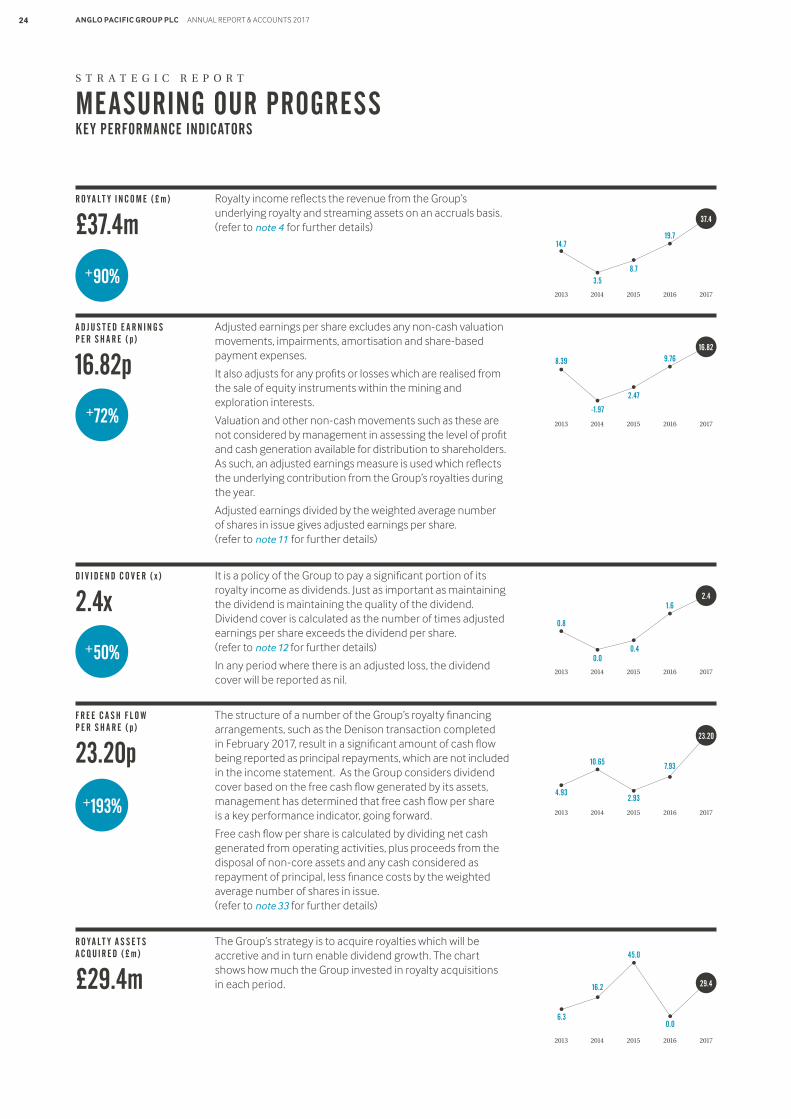
+193%
+50%
+90%
+72%
R O Y A L T Y A S S E T S A C Q U I R E D ( £ m )
£29.4m
S T R A T E G I C R E P O R T
MEASURING OUR PROGRESSKEY PERFORMANCE INDICATORS
A D J U S T E D E A R N I N G S P E R S H A R E ( p )
16.82p
R O Y A L T Y I N C O M E ( £ m )
£37.4m
D I V I D E N D C O V E R ( x )
2.4x
F R E E C A S H F L O W P E R S H A R E ( p )
23.20p
It is a policy of the Group to pay a significant portion of its royalty income as dividends. Just as important as maintaining the dividend is maintaining the quality of the dividend. Dividend cover is calculated as the number of times adjusted earnings per share exceeds the dividend per share. (refer to note 12 for further details)
In any period where there is an adjusted loss, the dividend cover will be reported as nil.
The structure of a number of the Group’s royalty financing arrangements, such as the Denison transaction completed in February 2017, result in a significant amount of cash flow being reported as principal repayments, which are not included in the income statement. As the Group considers dividend cover based on the free cash flow generated by its assets, management has determined that free cash flow per share is a key performance indicator, going forward.
Free cash flow per share is calculated by dividing net cash generated from operating activities, plus proceeds from the disposal of non-core assets and any cash considered as repayment of principal, less finance costs by the weighted average number of shares in issue. (refer to note 33 for further details)
The Group’s strategy is to acquire royalties which will be accretive and in turn enable dividend growth. The chart shows how much the Group invested in royalty acquisitions in each period.
Royalty income reflects the revenue from the Group’s underlying royalty and streaming assets on an accruals basis. (refer to note 4 for further details)
Adjusted earnings per share excludes any non-cash valuation movements, impairments, amortisation and share-based payment expenses.
It also adjusts for any profits or losses which are realised from the sale of equity instruments within the mining and exploration interests.
Valuation and other non-cash movements such as these are not considered by management in assessing the level of profit and cash generation available for distribution to shareholders. As such, an adjusted earnings measure is used which reflects the underlying contribution from the Group’s royalties during the year.
Adjusted earnings divided by the weighted average number of shares in issue gives adjusted earnings per share. (refer to note 11 for further details)
8.73.5
14.719.7
37.4
20172016201520142013
-1.97
8.39
2.47
9.7616.82
20172016201520142013
1.6
0.40.0
0.8
2.4
20172016201520142013
0.0
45.0
16.2
6.3
29.4
20172016201520142013
7.93
2.93
10.65
4.93
23.20
20172016201520142013
APG_AR17_28.03.18_FRONT_ARTWORK
24 ANGLO PACIFIC GROUP PLC ANNUAL REPORT & ACCOUNTS 2017
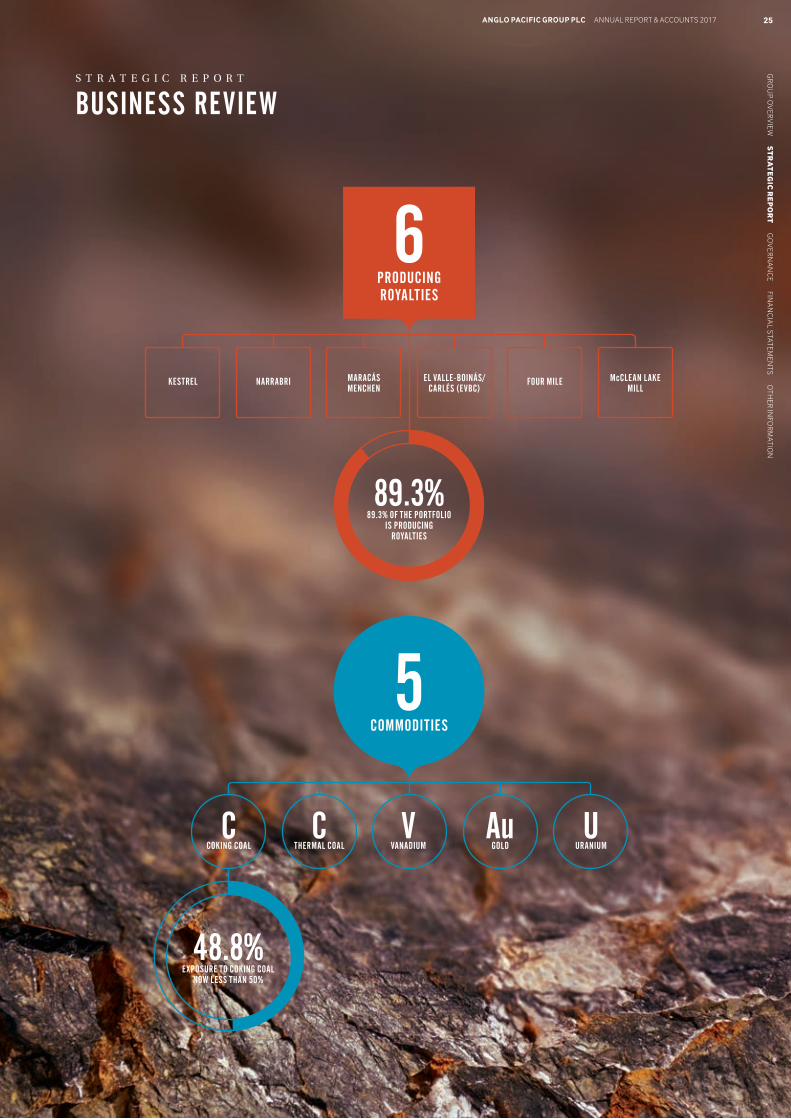
S T R A T E G I C R E P O R T
BUSINESS REVIEW
48.8% EXPOSURE TO COKING COAL
NOW LESS THAN 50%
U URANIUM
Au GOLD
VVANADIUM
C THERMAL COAL
C COKING COAL
5 COMMODITIES
6 PRODUCING ROYALTIES
KESTREL NARRABRI MARACÁS MENCHEN
EL VALLE-BOINÁS/CARLÉS (EVBC)
FOUR MILE McCLEAN LAKE MILL
89.3% 89.3% OF THE PORTFOLIO
IS PRODUCING ROYALTIES
GR
OU
P OV
ERV
IEW S
TR
AT
EG
IC R
EP
OR
T G
OV
ERN
AN
CE FIN
AN
CIA
L STATEM
ENTS O
THER IN
FOR
MATIO
N25ANGLO PACIFIC GROUP PLC ANNUAL REPORT & ACCOUNTS 2017
APG_AR17_28.03.18_FRONT_ARTWORK
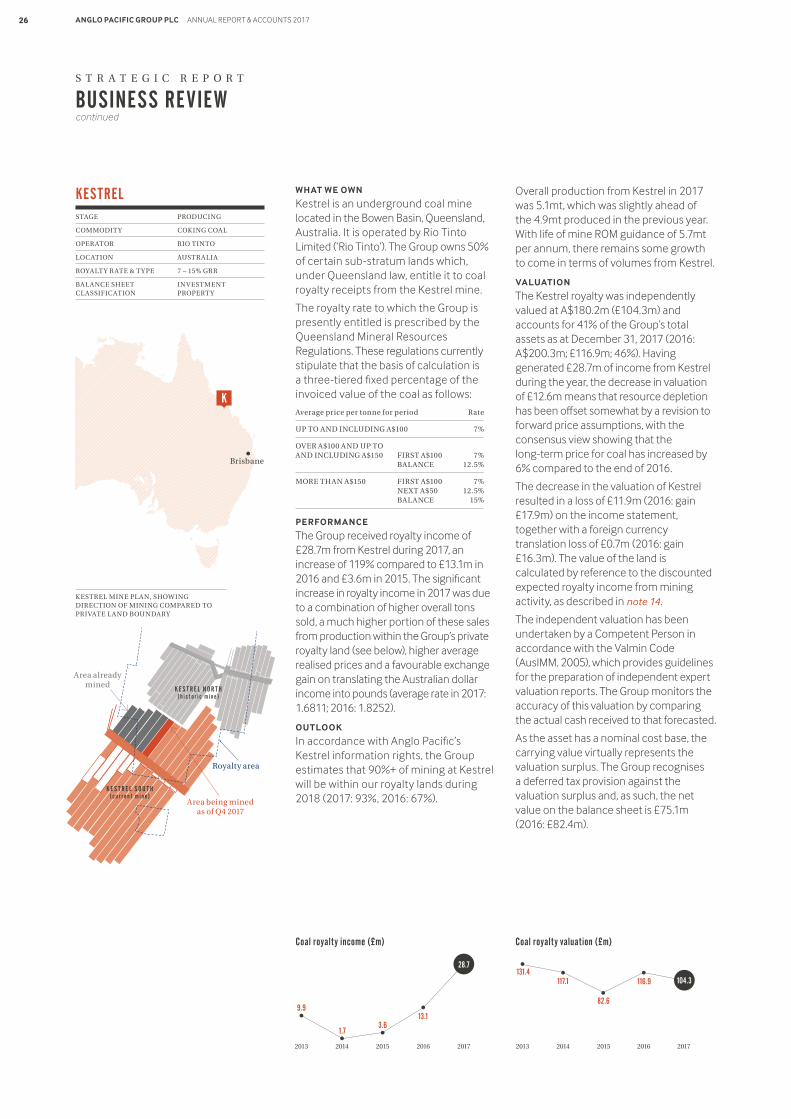
WHAT WE OWN
Kestrel is an underground coal mine located in the Bowen Basin, Queensland, Australia. It is operated by Rio Tinto Limited (‘Rio Tinto’). The Group owns 50% of certain sub-stratum lands which, under Queensland law, entitle it to coal royalty receipts from the Kestrel mine.
The royalty rate to which the Group is presently entitled is prescribed by the Queensland Mineral Resources Regulations. These regulations currently stipulate that the basis of calculation is a three-tiered fixed percentage of the invoiced value of the coal as follows:
Average price per tonne for period Rate
UP TO AND INCLUDING A$100 7%
OVER A$100 AND UP TO AND INCLUDING A$150 FIRST A$100 7% BALANCE 12.5%
MORE THAN A$150 FIRST A$100 7% NEXT A$50 12.5% BALANCE 15%
PERFORMANCE
The Group received royalty income of £28.7m from Kestrel during 2017, an increase of 119% compared to £13.1m in 2016 and £3.6m in 2015. The significant increase in royalty income in 2017 was due to a combination of higher overall tons sold, a much higher portion of these sales from production within the Group’s private royalty land (see below), higher average realised prices and a favourable exchange gain on translating the Australian dollar income into pounds (average rate in 2017: 1.6811; 2016: 1.8252).
OUTLOOK
In accordance with Anglo Pacific’s Kestrel information rights, the Group estimates that 90%+ of mining at Kestrel will be within our royalty lands during 2018 (2017: 93%, 2016: 67%).
Overall production from Kestrel in 2017 was 5.1mt, which was slightly ahead of the 4.9mt produced in the previous year. With life of mine ROM guidance of 5.7mt per annum, there remains some growth to come in terms of volumes from Kestrel.
VALUATION
The Kestrel royalty was independently valued at A$180.2m (£104.3m) and accounts for 41% of the Group’s total assets as at December 31, 2017 (2016: A$200.3m; £116.9m; 46%). Having generated £28.7m of income from Kestrel during the year, the decrease in valuation of £12.6m means that resource depletion has been offset somewhat by a revision to forward price assumptions, with the consensus view showing that the long-term price for coal has increased by 6% compared to the end of 2016.
The decrease in the valuation of Kestrel resulted in a loss of £11.9m (2016: gain £17.9m) on the income statement, together with a foreign currency translation loss of £0.7m (2016: gain £16.3m). The value of the land is calculated by reference to the discounted expected royalty income from mining activity, as described in note 14.
The independent valuation has been undertaken by a Competent Person in accordance with the Valmin Code (AusIMM, 2005), which provides guidelines for the preparation of independent expert valuation reports. The Group monitors the accuracy of this valuation by comparing the actual cash received to that forecasted.
As the asset has a nominal cost base, the carrying value virtually represents the valuation surplus. The Group recognises a deferred tax provision against the valuation surplus and, as such, the net value on the balance sheet is £75.1m (2016: £82.4m).
KESTRELSTAGE PRODUCING
COMMODITY COKING COAL
OPER ATOR RIO TINTO
LOCATION AUSTR ALIA
ROYALTY R ATE & TY PE 7 – 15% GRR
BAL ANCE SHEET INV ESTMENT CL ASSIFICATION PROPERTY
KESTREL MINE PL AN, SHOWING DIRECTION OF MINING COMPARED TO PRIVATE L AND BOUNDARY
Royalty area
K E S T R E L S O U T H( c u r r e n t m i n e )
K E S T R E L N O R T H( h i s t o r i c m i n e )
Area being mined as of Q4 2017
Area already mined
Brisbane
K
S T R A T E G I C R E P O R T
BUSINESS REVIEWcontinued
Coal royalty income (£m)
3.613.1
1.7
9.9
2016 2017201520142013
28.7
Coal royalty valuation (£m)
82.6
116.9117.1131.4
2016 2017201520142013
104.3
APG_AR17_28.03.18_FRONT_ARTWORK
26 ANGLO PACIFIC GROUP PLC ANNUAL REPORT & ACCOUNTS 2017
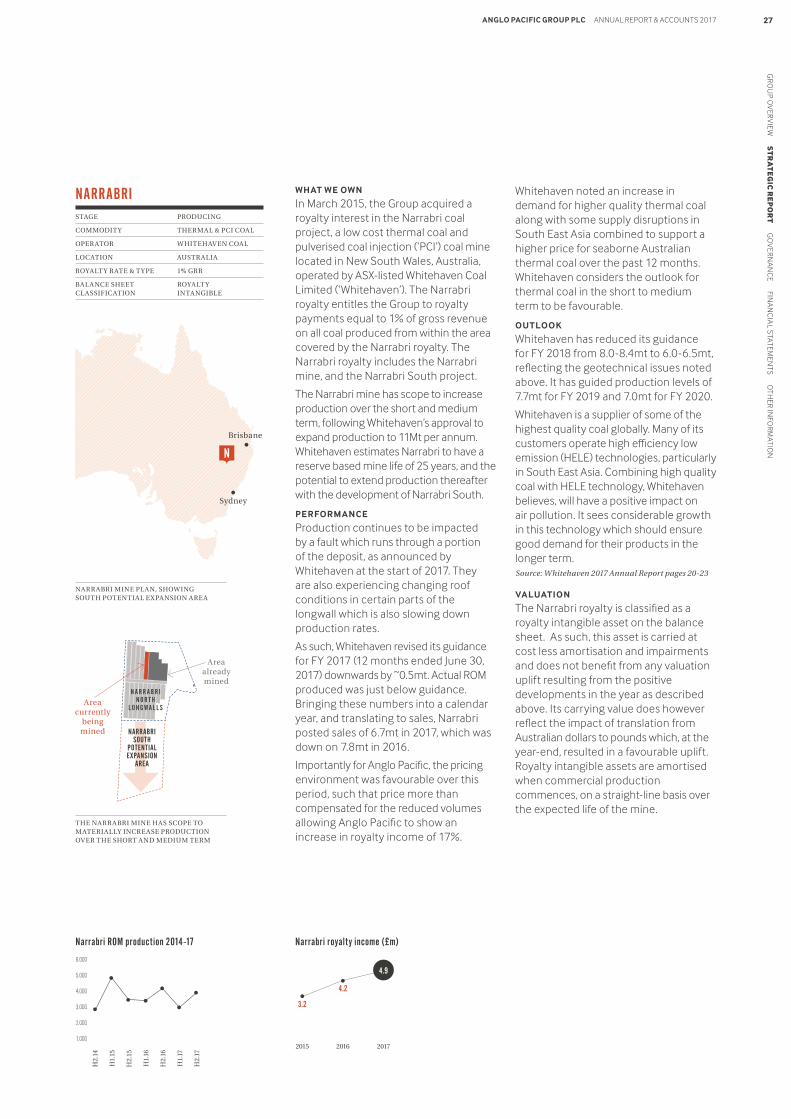
THE NARR ABRI MINE HAS SCOPE TO MATERIALLY INCREASE PRODUCTION OV ER THE SHORT AND MEDIUM TERM
WHAT WE OWN
In March 2015, the Group acquired a royalty interest in the Narrabri coal project, a low cost thermal coal and pulverised coal injection (‘PCI’) coal mine located in New South Wales, Australia, operated by ASX-listed Whitehaven Coal Limited (‘Whitehaven’). The Narrabri royalty entitles the Group to royalty payments equal to 1% of gross revenue on all coal produced from within the area covered by the Narrabri royalty. The Narrabri royalty includes the Narrabri mine, and the Narrabri South project.
The Narrabri mine has scope to increase production over the short and medium term, following Whitehaven’s approval to expand production to 11Mt per annum. Whitehaven estimates Narrabri to have a reserve based mine life of 25 years, and the potential to extend production thereafter with the development of Narrabri South.
PERFORMANCE
Production continues to be impacted by a fault which runs through a portion of the deposit, as announced by Whitehaven at the start of 2017. They are also experiencing changing roof conditions in certain parts of the longwall which is also slowing down production rates.
As such, Whitehaven revised its guidance for FY 2017 (12 months ended June 30, 2017) downwards by ~0.5mt. Actual ROM produced was just below guidance. Bringing these numbers into a calendar year, and translating to sales, Narrabri posted sales of 6.7mt in 2017, which was down on 7.8mt in 2016.
Importantly for Anglo Pacific, the pricing environment was favourable over this period, such that price more than compensated for the reduced volumes allowing Anglo Pacific to show an increase in royalty income of 17%.
Whitehaven noted an increase in demand for higher quality thermal coal along with some supply disruptions in South East Asia combined to support a higher price for seaborne Australian thermal coal over the past 12 months. Whitehaven considers the outlook for thermal coal in the short to medium term to be favourable.
OUTLOOK
Whitehaven has reduced its guidance for FY 2018 from 8.0-8.4mt to 6.0-6.5mt, reflecting the geotechnical issues noted above. It has guided production levels of 7.7mt for FY 2019 and 7.0mt for FY 2020.
Whitehaven is a supplier of some of the highest quality coal globally. Many of its customers operate high efficiency low emission (HELE) technologies, particularly in South East Asia. Combining high quality coal with HELE technology, Whitehaven believes, will have a positive impact on air pollution. It sees considerable growth in this technology which should ensure good demand for their products in the longer term.Source: Whitehaven 2017 Annual Report pages 20-23
VALUATION
The Narrabri royalty is classified as a royalty intangible asset on the balance sheet. As such, this asset is carried at cost less amortisation and impairments and does not benefit from any valuation uplift resulting from the positive developments in the year as described above. Its carrying value does however reflect the impact of translation from Australian dollars to pounds which, at the year-end, resulted in a favourable uplift. Royalty intangible assets are amortised when commercial production commences, on a straight-line basis over the expected life of the mine.
NARRABRISTAGE PRODUCING
COMMODITY THERMAL & PCI COAL
OPER ATOR WHITEHAV EN COAL
LOCATION AUSTR ALIA
ROYALTY R ATE & TY PE 1% GRR
BAL ANCE SHEET ROYALTY CL ASSIFICATION INTANGIBLE
Brisbane
Sydney
NARR ABRI MINE PL AN, SHOWING SOUTH POTENTIAL EXPANSION AREA
N
Area already mined
Area currently
being mined
N A R R A B R I N O R T H
L O N G W A L L S
NARRABRI SOUTH
POTENTIAL EXPANSION
AREA
Narrabri royalty income (£m)
4.2
3.2
201720162015
4.9
Narrabri ROM production 2014-17
H2.
14
H1.
15
H2.
15
H1.
16
H2.
16
H1.
17
H2.
17
6,000
5,000
4,000
3,000
2,000
1,000
APG_AR17_28.03.18_FRONT_ARTWORK
GR
OU
P OV
ERV
IEW S
TR
AT
EG
IC R
EP
OR
T G
OV
ERN
AN
CE FIN
AN
CIA
L STATEM
ENTS O
THER IN
FOR
MATIO
N27ANGLO PACIFIC GROUP PLC ANNUAL REPORT & ACCOUNTS 2017
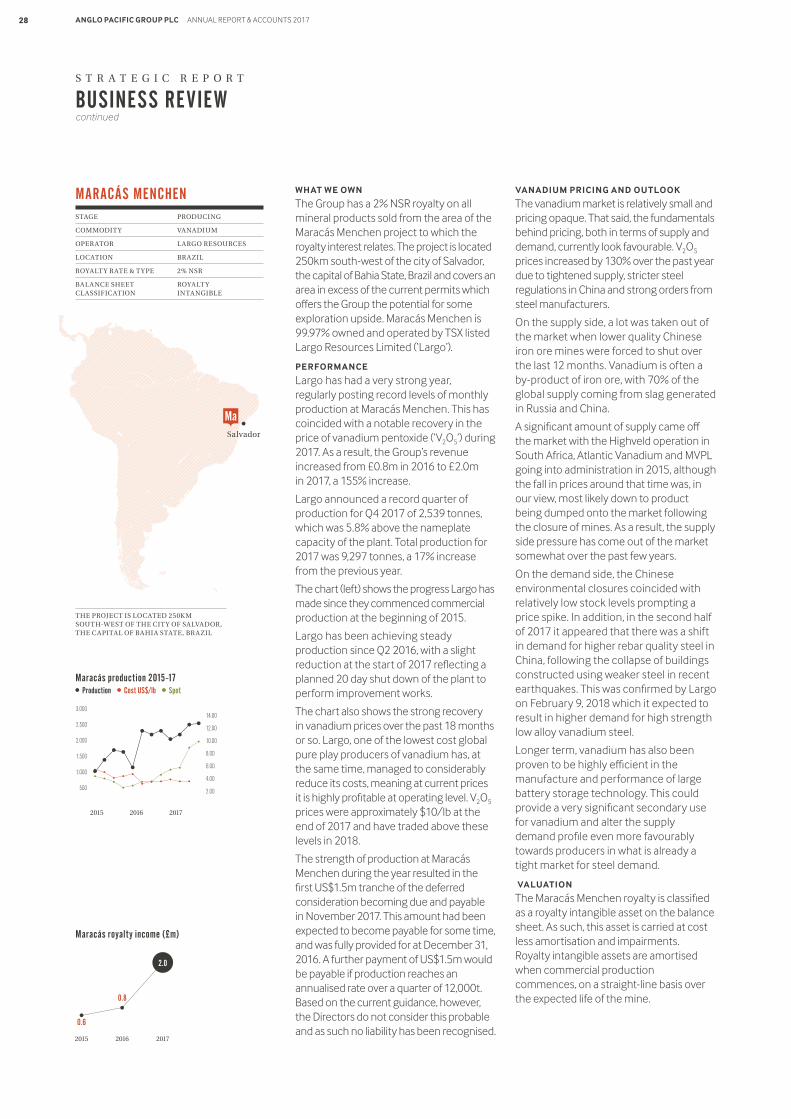
S T R A T E G I C R E P O R T
BUSINESS REVIEWcontinued
WHAT WE OWN
The Group has a 2% NSR royalty on all mineral products sold from the area of the Maracás Menchen project to which the royalty interest relates. The project is located 250km south-west of the city of Salvador, the capital of Bahia State, Brazil and covers an area in excess of the current permits which offers the Group the potential for some exploration upside. Maracás Menchen is 99.97% owned and operated by TSX listed Largo Resources Limited (‘Largo’).
PERFORMANCE
Largo has had a very strong year, regularly posting record levels of monthly production at Maracás Menchen. This has coincided with a notable recovery in the price of vanadium pentoxide (‘V2O5’) during 2017. As a result, the Group’s revenue increased from £0.8m in 2016 to £2.0m in 2017, a 155% increase.
Largo announced a record quarter of production for Q4 2017 of 2,539 tonnes, which was 5.8% above the nameplate capacity of the plant. Total production for 2017 was 9,297 tonnes, a 17% increase from the previous year.
The chart (left) shows the progress Largo has made since they commenced commercial production at the beginning of 2015.
Largo has been achieving steady production since Q2 2016, with a slight reduction at the start of 2017 reflecting a planned 20 day shut down of the plant to perform improvement works.
The chart also shows the strong recovery in vanadium prices over the past 18 months or so. Largo, one of the lowest cost global pure play producers of vanadium has, at the same time, managed to considerably reduce its costs, meaning at current prices it is highly profitable at operating level. V2O5 prices were approximately $10/lb at the end of 2017 and have traded above these levels in 2018.
The strength of production at Maracás Menchen during the year resulted in the first US$1.5m tranche of the deferred consideration becoming due and payable in November 2017. This amount had been expected to become payable for some time, and was fully provided for at December 31, 2016. A further payment of US$1.5m would be payable if production reaches an annualised rate over a quarter of 12,000t. Based on the current guidance, however, the Directors do not consider this probable and as such no liability has been recognised.
VANADIUM PRICING AND OUTLOOK
The vanadium market is relatively small and pricing opaque. That said, the fundamentals behind pricing, both in terms of supply and demand, currently look favourable. V2O5 prices increased by 130% over the past year due to tightened supply, stricter steel regulations in China and strong orders from steel manufacturers.
On the supply side, a lot was taken out of the market when lower quality Chinese iron ore mines were forced to shut over the last 12 months. Vanadium is often a by-product of iron ore, with 70% of the global supply coming from slag generated in Russia and China.
A significant amount of supply came off the market with the Highveld operation in South Africa, Atlantic Vanadium and MVPL going into administration in 2015, although the fall in prices around that time was, in our view, most likely down to product being dumped onto the market following the closure of mines. As a result, the supply side pressure has come out of the market somewhat over the past few years.
On the demand side, the Chinese environmental closures coincided with relatively low stock levels prompting a price spike. In addition, in the second half of 2017 it appeared that there was a shift in demand for higher rebar quality steel in China, following the collapse of buildings constructed using weaker steel in recent earthquakes. This was confirmed by Largo on February 9, 2018 which it expected to result in higher demand for high strength low alloy vanadium steel.
Longer term, vanadium has also been proven to be highly efficient in the manufacture and performance of large battery storage technology. This could provide a very significant secondary use for vanadium and alter the supply demand profile even more favourably towards producers in what is already a tight market for steel demand.
VALUATION
The Maracás Menchen royalty is classified as a royalty intangible asset on the balance sheet. As such, this asset is carried at cost less amortisation and impairments. Royalty intangible assets are amortised when commercial production commences, on a straight-line basis over the expected life of the mine.
MARACÁS MENCHENSTAGE PRODUCING
COMMODITY VANADIUM
OPER ATOR L ARGO RESOURCES
LOCATION BR A ZIL
ROYALTY R ATE & TY PE 2% NSR
BAL ANCE SHEET ROYALTY CL ASSIFICATION INTANGIBLE
Salvador
THE PROJECT IS LOCATED 250KM SOUTH-WEST OF THE CITY OF SALVADOR, THE CAPITAL OF BAHIA STATE, BR A ZIL
Ma
0.8
0.6
201720162015
2.0
Maracás royalty income (£m)
Maracás production 2015-17 Production Cost US$/lb Spot
2015 2016 2017
3,00014.00
12.00
10.00
8.00
6.00
4.00
2.00
2,500
2,000
1,500
1,000
500
APG_AR17_28.03.18_FRONT_ARTWORK
28 ANGLO PACIFIC GROUP PLC ANNUAL REPORT & ACCOUNTS 2017
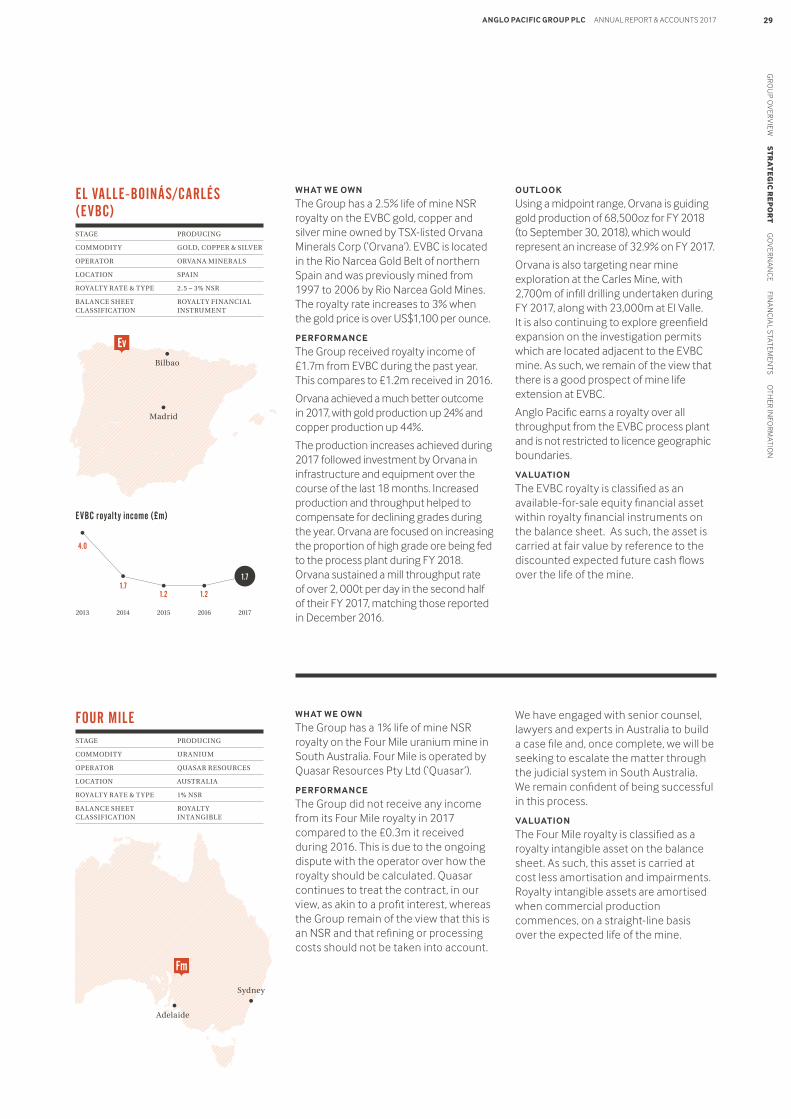
WHAT WE OWN
The Group has a 2.5% life of mine NSR royalty on the EVBC gold, copper and silver mine owned by TSX-listed Orvana Minerals Corp (‘Orvana’). EVBC is located in the Rio Narcea Gold Belt of northern Spain and was previously mined from 1997 to 2006 by Rio Narcea Gold Mines. The royalty rate increases to 3% when the gold price is over US$1,100 per ounce.
PERFORMANCE
The Group received royalty income of £1.7m from EVBC during the past year. This compares to £1.2m received in 2016.
Orvana achieved a much better outcome in 2017, with gold production up 24% and copper production up 44%.
The production increases achieved during 2017 followed investment by Orvana in infrastructure and equipment over the course of the last 18 months. Increased production and throughput helped to compensate for declining grades during the year. Orvana are focused on increasing the proportion of high grade ore being fed to the process plant during FY 2018. Orvana sustained a mill throughput rate of over 2, 000t per day in the second half of their FY 2017, matching those reported in December 2016.
OUTLOOK
Using a midpoint range, Orvana is guiding gold production of 68,500oz for FY 2018 (to September 30, 2018), which would represent an increase of 32.9% on FY 2017.
Orvana is also targeting near mine exploration at the Carles Mine, with 2,700m of infill drilling undertaken during FY 2017, along with 23,000m at El Valle. It is also continuing to explore greenfield expansion on the investigation permits which are located adjacent to the EVBC mine. As such, we remain of the view that there is a good prospect of mine life extension at EVBC.
Anglo Pacific earns a royalty over all throughput from the EVBC process plant and is not restricted to licence geographic boundaries.
VALUATION
The EVBC royalty is classified as an available-for-sale equity financial asset within royalty financial instruments on the balance sheet. As such, the asset is carried at fair value by reference to the discounted expected future cash flows over the life of the mine.
WHAT WE OWN
The Group has a 1% life of mine NSR royalty on the Four Mile uranium mine in South Australia. Four Mile is operated by Quasar Resources Pty Ltd (‘Quasar’).
PERFORMANCE
The Group did not receive any income from its Four Mile royalty in 2017 compared to the £0.3m it received during 2016. This is due to the ongoing dispute with the operator over how the royalty should be calculated. Quasar continues to treat the contract, in our view, as akin to a profit interest, whereas the Group remain of the view that this is an NSR and that refining or processing costs should not be taken into account.
We have engaged with senior counsel, lawyers and experts in Australia to build a case file and, once complete, we will be seeking to escalate the matter through the judicial system in South Australia. We remain confident of being successful in this process.
VALUATION
The Four Mile royalty is classified as a royalty intangible asset on the balance sheet. As such, this asset is carried at cost less amortisation and impairments. Royalty intangible assets are amortised when commercial production commences, on a straight-line basis over the expected life of the mine.
EL VALLE-BOINÁS/CARLÉS (EVBC)STAGE PRODUCING
COMMODITY GOLD, COPPER & SILV ER
OPER ATOR ORVANA MINER ALS
LOCATION SPAIN
ROYALTY R ATE & TY PE 2.5 – 3% NSR
BAL ANCE SHEET ROYALTY FINANCIAL CL ASSIFICATION INSTRUMENT
FOUR MILESTAGE PRODUCING
COMMODITY UR ANIUM
OPER ATOR QUASAR RESOURCES
LOCATION AUSTR ALIA
ROYALTY R ATE & TY PE 1% NSR
BAL ANCE SHEET ROYALTY CL ASSIFICATION INTANGIBLE
Madrid
Bilbao
Ev
Adelaide
Sydney
Fm
EVBC royalty income (£m)
1.2 1.21.7
4.0
2016 2017201520142013
1.7
APG_AR17_28.03.18_FRONT_ARTWORK
GR
OU
P OV
ERV
IEW S
TR
AT
EG
IC R
EP
OR
T G
OV
ERN
AN
CE FIN
AN
CIA
L STATEM
ENTS O
THER IN
FOR
MATIO
N29ANGLO PACIFIC GROUP PLC ANNUAL REPORT & ACCOUNTS 2017
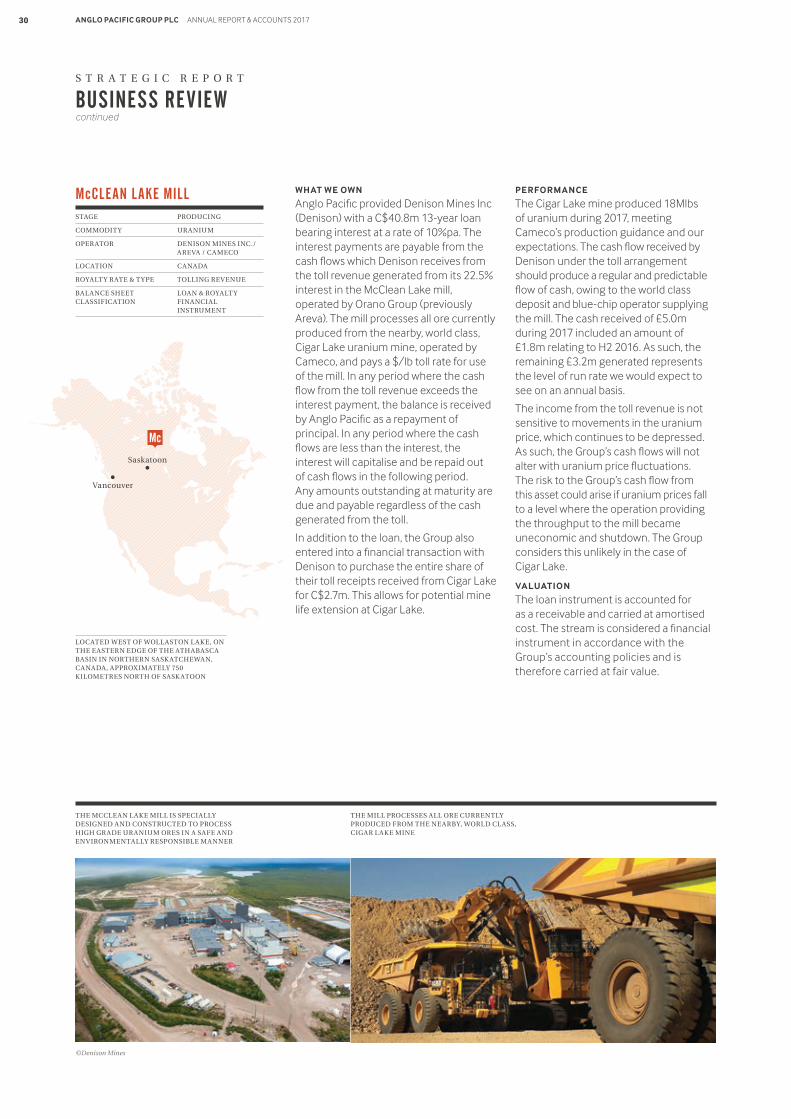
WHAT WE OWN
Anglo Pacific provided Denison Mines Inc (Denison) with a C$40.8m 13-year loan bearing interest at a rate of 10%pa. The interest payments are payable from the cash flows which Denison receives from the toll revenue generated from its 22.5% interest in the McClean Lake mill, operated by Orano Group (previously Areva). The mill processes all ore currently produced from the nearby, world class, Cigar Lake uranium mine, operated by Cameco, and pays a $/lb toll rate for use of the mill. In any period where the cash flow from the toll revenue exceeds the interest payment, the balance is received by Anglo Pacific as a repayment of principal. In any period where the cash flows are less than the interest, the interest will capitalise and be repaid out of cash flows in the following period. Any amounts outstanding at maturity are due and payable regardless of the cash generated from the toll.
In addition to the loan, the Group also entered into a financial transaction with Denison to purchase the entire share of their toll receipts received from Cigar Lake for C$2.7m. This allows for potential mine life extension at Cigar Lake.
PERFORMANCE
The Cigar Lake mine produced 18Mlbs of uranium during 2017, meeting Cameco’s production guidance and our expectations. The cash flow received by Denison under the toll arrangement should produce a regular and predictable flow of cash, owing to the world class deposit and blue-chip operator supplying the mill. The cash received of £5.0m during 2017 included an amount of £1.8m relating to H2 2016. As such, the remaining £3.2m generated represents the level of run rate we would expect to see on an annual basis.
The income from the toll revenue is not sensitive to movements in the uranium price, which continues to be depressed. As such, the Group’s cash flows will not alter with uranium price fluctuations. The risk to the Group’s cash flow from this asset could arise if uranium prices fall to a level where the operation providing the throughput to the mill became uneconomic and shutdown. The Group considers this unlikely in the case of Cigar Lake.
VALUATION
The loan instrument is accounted for as a receivable and carried at amortised cost. The stream is considered a financial instrument in accordance with the Group’s accounting policies and is therefore carried at fair value.
S T R A T E G I C R E P O R T
BUSINESS REVIEWcontinued
McCLEAN LAKE MILLSTAGE PRODUCING
COMMODITY UR ANIUM
OPER ATOR DENISON MINES INC./ AREVA / CAMECO
LOCATION CANADA
ROYALTY R ATE & TY PE TOLLING REV ENUE
BAL ANCE SHEET LOAN & ROYALTY CL ASSIFICATION FINANCIAL INSTRUMENT
THE MCCLEAN L AKE MILL IS SPECIALLY DESIGNED AND CONSTRUCTED TO PROCESS HIGH GR ADE UR ANIUM ORES IN A SAFE AND ENV IRONMENTALLY RESPONSIBLE MANNER
THE MILL PROCESSES ALL ORE CURRENTLY PRODUCED FROM THE NEARBY, WORLD CL ASS, CIGAR L AKE MINE
©Denison Mines
LOCATED WEST OF WOLL ASTON L AKE, ON THE EASTERN EDGE OF THE ATHABASCA BASIN IN NORTHERN SASK ATCHEWAN, CANADA, APPROXIMATELY 750 KILOMETRES NORTH OF SASK ATOON
Vancouver
Saskatoon
Mc
APG_AR17_28.03.18_FRONT_ARTWORK
30 ANGLO PACIFIC GROUP PLC ANNUAL REPORT & ACCOUNTS 2017
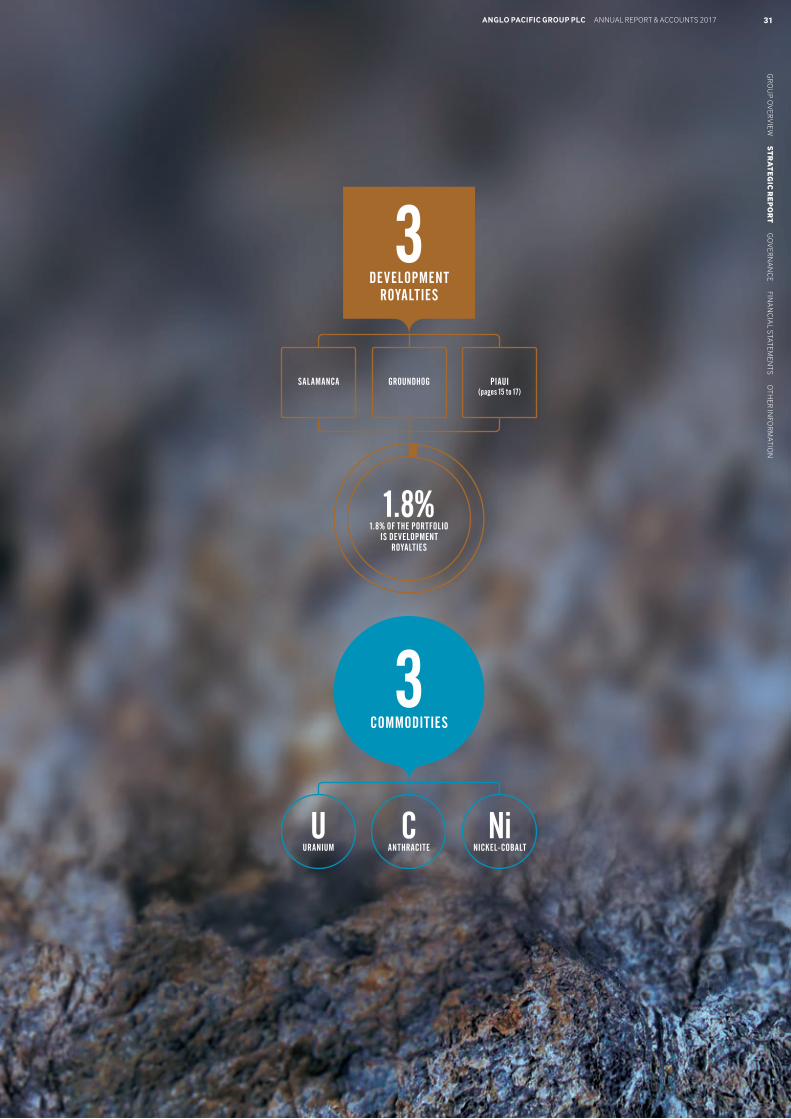
U URANIUM
Ni NICKEL-COBALT
C ANTHRACITE
3 DEVELOPMENT
ROYALTIES
1.8% 1.8% OF THE PORTFOLIO
IS DEVELOPMENT ROYALTIES
3 COMMODITIES
GROUNDHOGSALAMANCA PIAUI(pages 15 to 17)
GR
OU
P OV
ERV
IEW S
TR
AT
EG
IC R
EP
OR
T G
OV
ERN
AN
CE FIN
AN
CIA
L STATEM
ENTS O
THER IN
FOR
MATIO
N31ANGLO PACIFIC GROUP PLC ANNUAL REPORT & ACCOUNTS 2017
APG_AR17_28.03.18_FRONT_ARTWORK
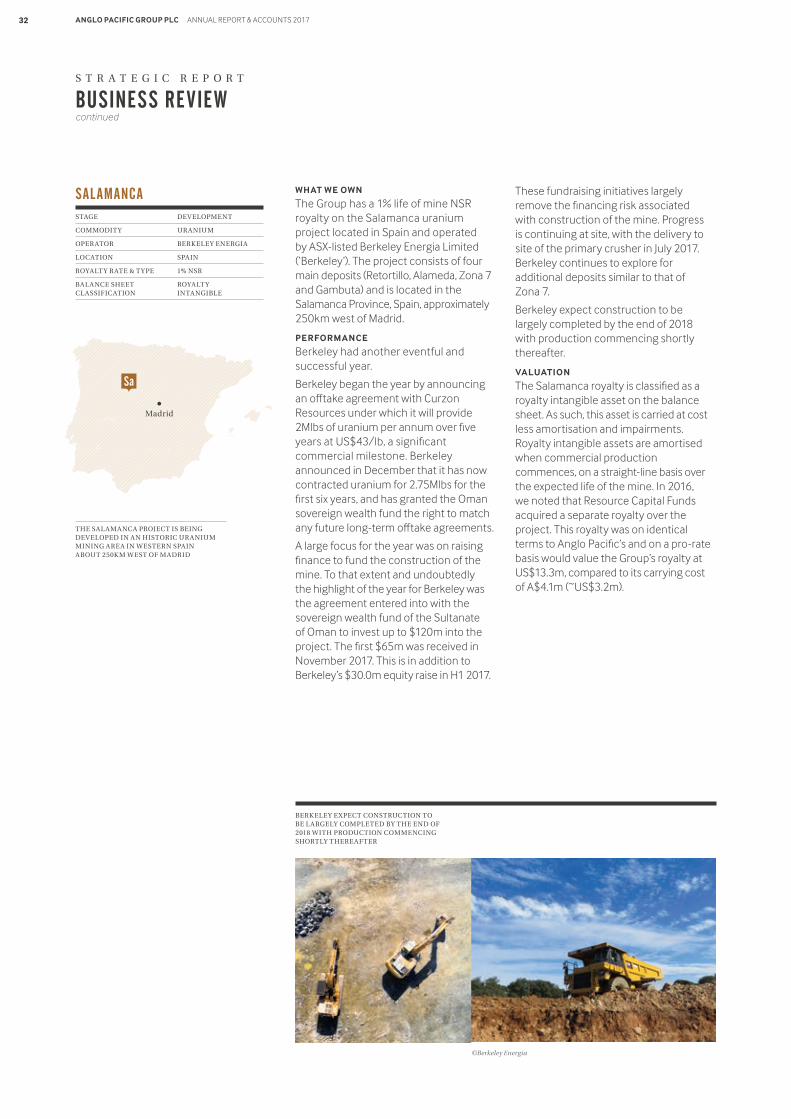
BERKELEY EXPECT CONSTRUCTION TO BE L ARGELY COMPLETED BY THE END OF 2018 WITH PRODUCTION COMMENCING SHORTLY THEREAFTER
WHAT WE OWN
The Group has a 1% life of mine NSR royalty on the Salamanca uranium project located in Spain and operated by ASX-listed Berkeley Energia Limited (‘Berkeley’). The project consists of four main deposits (Retortillo, Alameda, Zona 7 and Gambuta) and is located in the Salamanca Province, Spain, approximately 250km west of Madrid.
PERFORMANCE
Berkeley had another eventful and successful year.
Berkeley began the year by announcing an offtake agreement with Curzon Resources under which it will provide 2Mlbs of uranium per annum over five years at US$43/lb, a significant commercial milestone. Berkeley announced in December that it has now contracted uranium for 2.75Mlbs for the first six years, and has granted the Oman sovereign wealth fund the right to match any future long-term offtake agreements.
A large focus for the year was on raising finance to fund the construction of the mine. To that extent and undoubtedly the highlight of the year for Berkeley was the agreement entered into with the sovereign wealth fund of the Sultanate of Oman to invest up to $120m into the project. The first $65m was received in November 2017. This is in addition to Berkeley’s $30.0m equity raise in H1 2017.
These fundraising initiatives largely remove the financing risk associated with construction of the mine. Progress is continuing at site, with the delivery to site of the primary crusher in July 2017. Berkeley continues to explore for additional deposits similar to that of Zona 7.
Berkeley expect construction to be largely completed by the end of 2018 with production commencing shortly thereafter.
VALUATION
The Salamanca royalty is classified as a royalty intangible asset on the balance sheet. As such, this asset is carried at cost less amortisation and impairments. Royalty intangible assets are amortised when commercial production commences, on a straight-line basis over the expected life of the mine. In 2016, we noted that Resource Capital Funds acquired a separate royalty over the project. This royalty was on identical terms to Anglo Pacific’s and on a pro-rate basis would value the Group’s royalty at US$13.3m, compared to its carrying cost of A$4.1m (~US$3.2m).
SALAMANCASTAGE DEV ELOPMENT
COMMODITY UR ANIUM
OPER ATOR BERKELEY ENERGIA
LOCATION SPAIN
ROYALTY R ATE & TY PE 1% NSR
BAL ANCE SHEET ROYALTY CL ASSIFICATION INTANGIBLE
THE SAL AMANCA PROJECT IS BEING DEV ELOPED IN AN HISTORIC UR ANIUM MINING AREA IN WESTERN SPAIN ABOUT 250KM WEST OF MADRID
Madrid
©Berkeley Energia
Sa
S T R A T E G I C R E P O R T
BUSINESS REVIEWcontinued
APG_AR17_28.03.18_FRONT_ARTWORK
32 ANGLO PACIFIC GROUP PLC ANNUAL REPORT & ACCOUNTS 2017
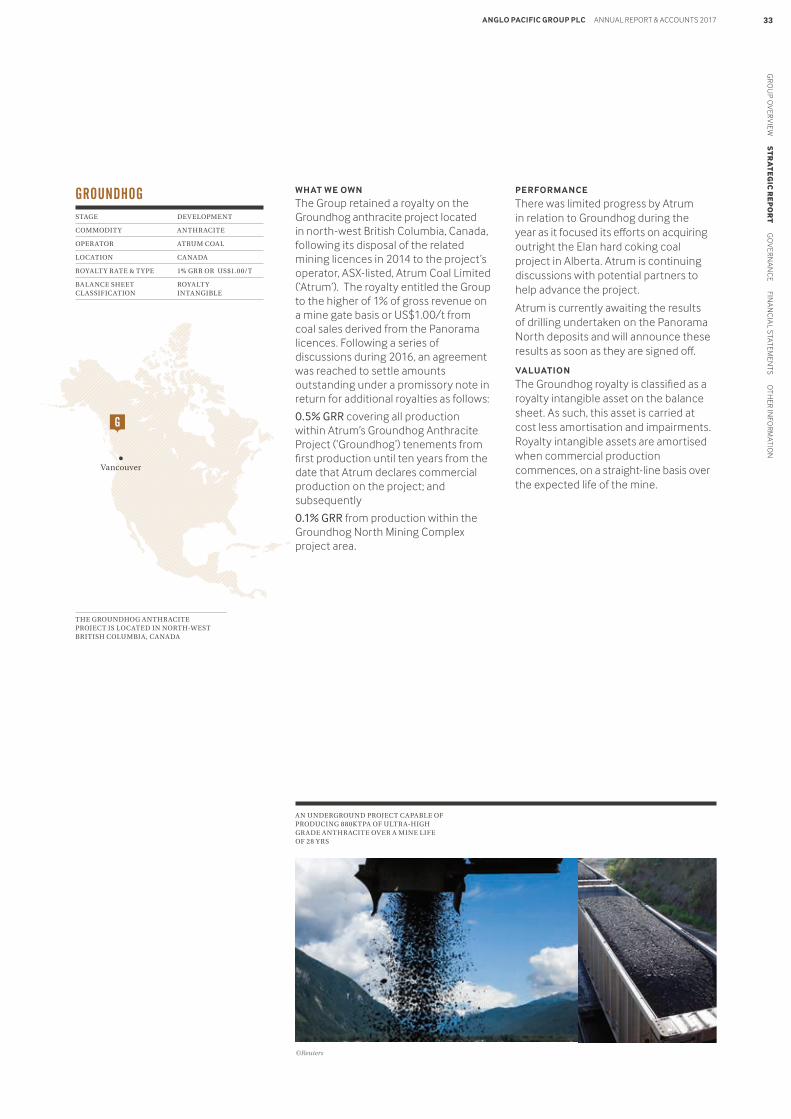
THE GROUNDHOG ANTHR ACITE PROJECT IS LOCATED IN NORTH-WEST BRITISH COLUMBIA, CANADA
AN UNDERGROUND PROJECT CAPABLE OF PRODUCING 880KTPA OF ULTR A-HIGH GR ADE ANTHR ACITE OV ER A MINE LIFE OF 28 Y RS
WHAT WE OWN
The Group retained a royalty on the Groundhog anthracite project located in north-west British Columbia, Canada, following its disposal of the related mining licences in 2014 to the project’s operator, ASX-listed, Atrum Coal Limited (‘Atrum’). The royalty entitled the Group to the higher of 1% of gross revenue on a mine gate basis or US$1.00/t from coal sales derived from the Panorama licences. Following a series of discussions during 2016, an agreement was reached to settle amounts outstanding under a promissory note in return for additional royalties as follows:
0.5% GRR covering all production within Atrum’s Groundhog Anthracite Project (‘Groundhog’) tenements from first production until ten years from the date that Atrum declares commercial production on the project; and subsequently
0.1% GRR from production within the Groundhog North Mining Complex project area.
PERFORMANCE
There was limited progress by Atrum in relation to Groundhog during the year as it focused its efforts on acquiring outright the Elan hard coking coal project in Alberta. Atrum is continuing discussions with potential partners to help advance the project.
Atrum is currently awaiting the results of drilling undertaken on the Panorama North deposits and will announce these results as soon as they are signed off.
VALUATION
The Groundhog royalty is classified as a royalty intangible asset on the balance sheet. As such, this asset is carried at cost less amortisation and impairments. Royalty intangible assets are amortised when commercial production commences, on a straight-line basis over the expected life of the mine.
GROUNDHOGSTAGE DEV ELOPMENT
COMMODITY ANTHR ACITE
OPER ATOR ATRUM COAL
LOCATION CANADA
ROYALTY R ATE & TY PE 1% GRR OR US$1.00/T
BAL ANCE SHEET ROYALTY CL ASSIFICATION INTANGIBLE
©Reuters
Vancouver
G
APG_AR17_28.03.18_FRONT_ARTWORK
GR
OU
P OV
ERV
IEW S
TR
AT
EG
IC R
EP
OR
T G
OV
ERN
AN
CE FIN
AN
CIA
L STATEM
ENTS O
THER IN
FOR
MATIO
N33ANGLO PACIFIC GROUP PLC ANNUAL REPORT & ACCOUNTS 2017
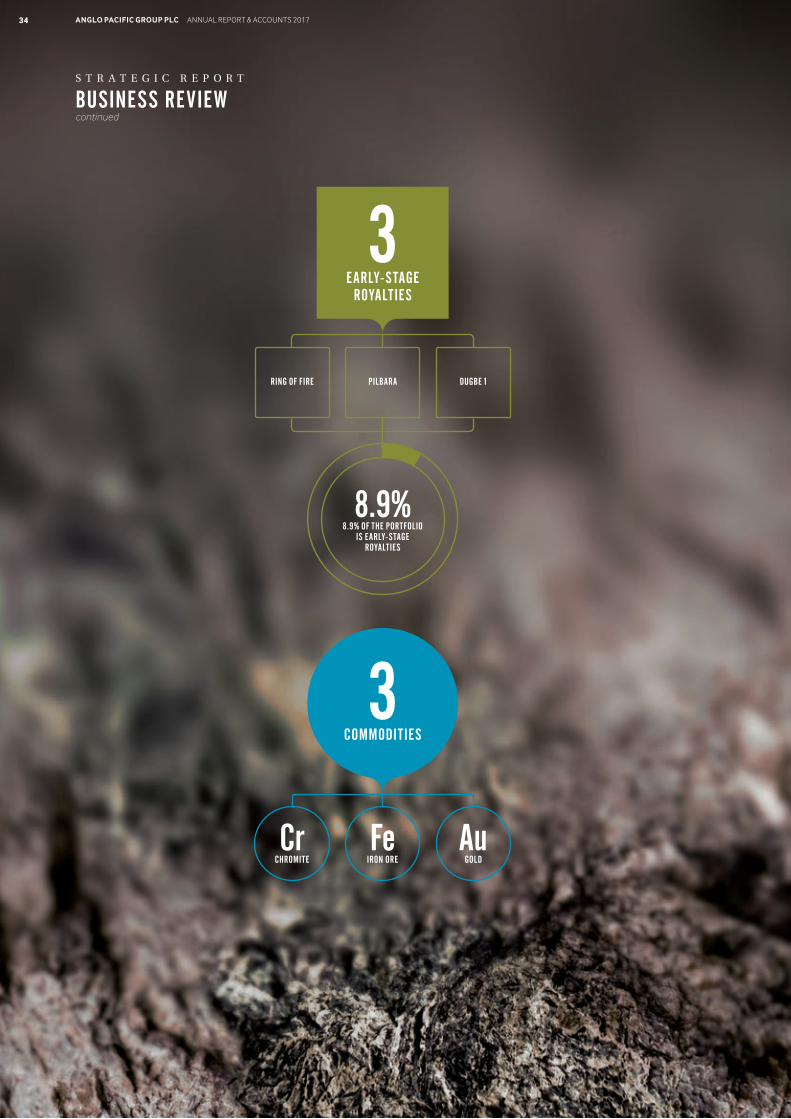
RING OF FIRE
8.9% 8.9% OF THE PORTFOLIO
IS EARLY-STAGE ROYALTIES
PILBARA DUGBE 1
3 EARLY-STAGE
ROYALTIES
Cr CHROMITE
Au GOLD
Fe IRON ORE
3 COMMODITIES
S T R A T E G I C R E P O R T
BUSINESS REVIEWcontinued
34 ANGLO PACIFIC GROUP PLC ANNUAL REPORT & ACCOUNTS 2017
APG_AR17_28.03.18_FRONT_ARTWORK
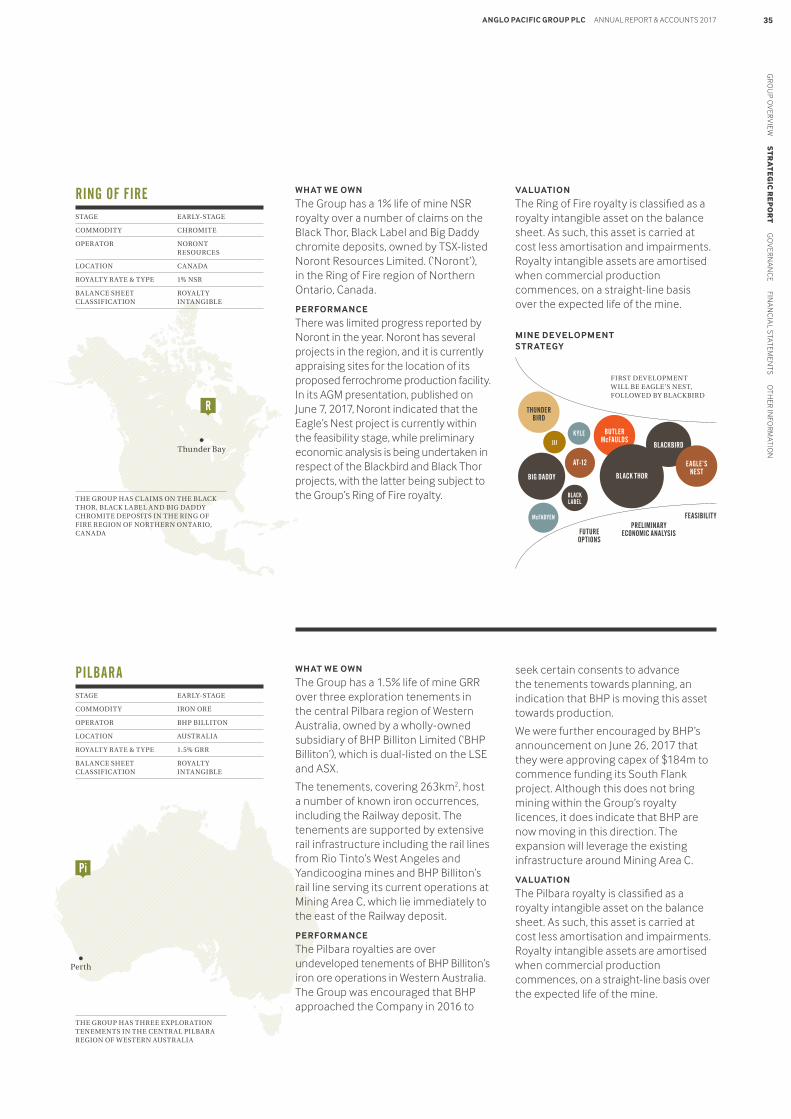
WHAT WE OWN
The Group has a 1% life of mine NSR royalty over a number of claims on the Black Thor, Black Label and Big Daddy chromite deposits, owned by TSX-listed Noront Resources Limited. (‘Noront’), in the Ring of Fire region of Northern Ontario, Canada.
PERFORMANCE
There was limited progress reported by Noront in the year. Noront has several projects in the region, and it is currently appraising sites for the location of its proposed ferrochrome production facility. In its AGM presentation, published on June 7, 2017, Noront indicated that the Eagle’s Nest project is currently within the feasibility stage, while preliminary economic analysis is being undertaken in respect of the Blackbird and Black Thor projects, with the latter being subject to the Group’s Ring of Fire royalty.
VALUATION
The Ring of Fire royalty is classified as a royalty intangible asset on the balance sheet. As such, this asset is carried at cost less amortisation and impairments. Royalty intangible assets are amortised when commercial production commences, on a straight-line basis over the expected life of the mine.
Perth
Pi
THE GROUP HAS THREE EXPLOR ATION TENEMENTS IN THE CENTR AL PILBAR A REGION OF WESTERN AUSTR ALIA
Thunder Bay
R
RING OF FIRESTAGE EARLY-STAGE
COMMODITY CHROMITE
OPER ATOR NORONT RESOURCES
LOCATION CANADA
ROYALTY R ATE & TY PE 1% NSR
BAL ANCE SHEET ROYALTY CL ASSIFICATION INTANGIBLE
WHAT WE OWN
The Group has a 1.5% life of mine GRR over three exploration tenements in the central Pilbara region of Western Australia, owned by a wholly-owned subsidiary of BHP Billiton Limited (‘BHP Billiton’), which is dual-listed on the LSE and ASX.
The tenements, covering 263km2, host a number of known iron occurrences, including the Railway deposit. The tenements are supported by extensive rail infrastructure including the rail lines from Rio Tinto’s West Angeles and Yandicoogina mines and BHP Billiton’s rail line serving its current operations at Mining Area C, which lie immediately to the east of the Railway deposit.
PERFORMANCE
The Pilbara royalties are over undeveloped tenements of BHP Billiton’s iron ore operations in Western Australia. The Group was encouraged that BHP approached the Company in 2016 to
seek certain consents to advance the tenements towards planning, an indication that BHP is moving this asset towards production.
We were further encouraged by BHP’s announcement on June 26, 2017 that they were approving capex of $184m to commence funding its South Flank project. Although this does not bring mining within the Group’s royalty licences, it does indicate that BHP are now moving in this direction. The expansion will leverage the existing infrastructure around Mining Area C.
VALUATION
The Pilbara royalty is classified as a royalty intangible asset on the balance sheet. As such, this asset is carried at cost less amortisation and impairments. Royalty intangible assets are amortised when commercial production commences, on a straight-line basis over the expected life of the mine.
PILBARASTAGE EARLY-STAGE
COMMODITY IRON ORE
OPER ATOR BHP BILLITON
LOCATION AUSTR ALIA
ROYALTY R ATE & TY PE 1.5% GRR
BAL ANCE SHEET ROYALTY CL ASSIFICATION INTANGIBLE
THE GROUP HAS CL AIMS ON THE BL ACK THOR, BL ACK L ABEL AND BIG DADDY CHROMITE DEPOSITS IN THE RING OF FIRE REGION OF NORTHERN ONTARIO, CANADA
FIRST DEV ELOPMENT WILL BE EAGLE’S NEST, FOLLOWED BY BL ACKBIRD
FUTURE OPTIONS
PRELIMINARY ECONOMIC ANALYSIS
FEASIBILITY
MINE DEVELOPMENT STR ATEGY
BUTLER McFAULDS
THUNDERBIRD
AT-12
KYLE
McFADYEN
JJJ
BLACK LABEL
BLACK THOR
BLACKBIRD
BIG DADDY
EAGLE’S NEST
APG_AR17_28.03.18_FRONT_ARTWORK
GR
OU
P OV
ERV
IEW S
TR
AT
EG
IC R
EP
OR
T G
OV
ERN
AN
CE FIN
AN
CIA
L STATEM
ENTS O
THER IN
FOR
MATIO
N35ANGLO PACIFIC GROUP PLC ANNUAL REPORT & ACCOUNTS 2017
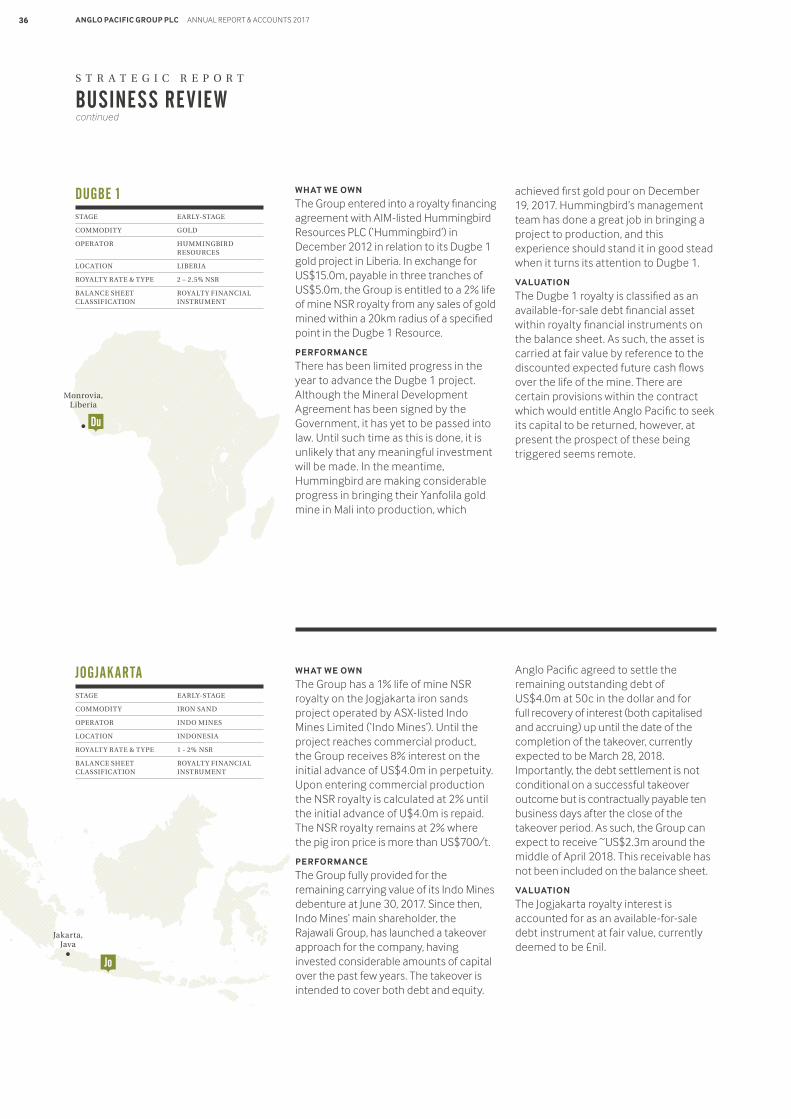
S T R A T E G I C R E P O R T
BUSINESS REVIEWcontinued
WHAT WE OWN
The Group entered into a royalty financing agreement with AIM-listed Hummingbird Resources PLC (‘Hummingbird’) in December 2012 in relation to its Dugbe 1 gold project in Liberia. In exchange for US$15.0m, payable in three tranches of US$5.0m, the Group is entitled to a 2% life of mine NSR royalty from any sales of gold mined within a 20km radius of a specified point in the Dugbe 1 Resource.
PERFORMANCE
There has been limited progress in the year to advance the Dugbe 1 project. Although the Mineral Development Agreement has been signed by the Government, it has yet to be passed into law. Until such time as this is done, it is unlikely that any meaningful investment will be made. In the meantime, Hummingbird are making considerable progress in bringing their Yanfolila gold mine in Mali into production, which
achieved first gold pour on December 19, 2017. Hummingbird’s management team has done a great job in bringing a project to production, and this experience should stand it in good stead when it turns its attention to Dugbe 1.
VALUATION
The Dugbe 1 royalty is classified as an available-for-sale debt financial asset within royalty financial instruments on the balance sheet. As such, the asset is carried at fair value by reference to the discounted expected future cash flows over the life of the mine. There are certain provisions within the contract which would entitle Anglo Pacific to seek its capital to be returned, however, at present the prospect of these being triggered seems remote.
DUGBE 1STAGE EARLY-STAGE
COMMODITY GOLD
OPER ATOR HUMMINGBIRD RESOURCES
LOCATION LIBERIA
ROYALTY R ATE & TY PE 2 – 2.5% NSR
BAL ANCE SHEET ROYALTY FINANCIAL CL ASSIFICATION INSTRUMENT
Monrovia, Liberia
Du
WHAT WE OWN
The Group has a 1% life of mine NSR royalty on the Jogjakarta iron sands project operated by ASX-listed Indo Mines Limited (‘Indo Mines’). Until the project reaches commercial product, the Group receives 8% interest on the initial advance of US$4.0m in perpetuity. Upon entering commercial production the NSR royalty is calculated at 2% until the initial advance of U$4.0m is repaid. The NSR royalty remains at 2% where the pig iron price is more than US$700/t.
PERFORMANCE
The Group fully provided for the remaining carrying value of its Indo Mines debenture at June 30, 2017. Since then, Indo Mines’ main shareholder, the Rajawali Group, has launched a takeover approach for the company, having invested considerable amounts of capital over the past few years. The takeover is intended to cover both debt and equity.
Anglo Pacific agreed to settle the remaining outstanding debt of US$4.0m at 50c in the dollar and for full recovery of interest (both capitalised and accruing) up until the date of the completion of the takeover, currently expected to be March 28, 2018. Importantly, the debt settlement is not conditional on a successful takeover outcome but is contractually payable ten business days after the close of the takeover period. As such, the Group can expect to receive ~US$2.3m around the middle of April 2018. This receivable has not been included on the balance sheet.
VALUATION
The Jogjakarta royalty interest is accounted for as an available-for-sale debt instrument at fair value, currently deemed to be £nil.
JOGJAKARTASTAGE EARLY-STAGE
COMMODITY IRON SAND
OPER ATOR INDO MINES
LOCATION INDONESIA
ROYALTY R ATE & TY PE 1 - 2% NSR
BAL ANCE SHEET ROYALTY FINANCIAL CL ASSIFICATION INSTRUMENT
Jakarta, Java
Jo
APG_AR17_28.03.18_FRONT_ARTWORK
36 ANGLO PACIFIC GROUP PLC ANNUAL REPORT & ACCOUNTS 2017
FINANCIAL REVIEW
2017 was another year of significant growth for Anglo Pacific. Royalty income increased by 90% to a record £37.4m, the third year of posting a significant increase in revenue. The increase in the current year was due to a combination of increased commodity prices across the portfolio along with a significant increase in mining within the Group’s private royalty land at Kestrel compared to 2016.
This record level of royalty revenue led to significant cash being generated during 2017 which, when including the £5.0m receipts from the Denison financing arrangement and £2.4m from non-core assets, resulted in free cash flow of £41.5m (2016: £13.4m). This cash was used to invest £16.4m into the portfolio, pay £15.9m to shareholders as dividends and repay our borrowings in full.
There is some organic growth expected from the portfolio during 2018, but this is not expected to result in a material increase in revenue as has been the case in the past three years. As such, the focus for 2018 is to leverage our unencumbered balance sheet and strong cash flow to add further royalties to our portfolio.
2018 will also see the introduction of IFRS9, which will have an impact on how our results are presented. Income from EVBC will no longer be shown as royalty income on the face of the Income Statement. Instead, the royalty will appear as a debt like asset with the cash being split between a deemed effective interest and principal element. Its revaluation at each reporting date, previously recognised in other comprehensive income, will now be recognised in the income statement, along with any deferred tax. Had this been adopted in 2017, reported royalty income would have been £1.7m lower. It is for this reason, along with the completion of the Denison financing arrangement in February 2017, that we introduced a cash based key performance indicator in 2016, which is designed to show the cash generated by the portfolio and against which the dividend cover can be assessed. The full impact of IFRS9 is discussed in note 3.1.2.
INCOME STATEMENT
Overall, the Group reported a profit after tax for the year of £10.5m compared to £26.4m in 2016. This resulted in basic earnings per share of 5.88p compared to 15.60p in the prior year.
Our Income Statement includes a number of valuation items which account for significant volatility and, in our view, does not present the true underlying performance during the year. The largest variance is in relation to the valuation of Kestrel, an investment property. This showed a surplus of £17.9m in 2016 only to reverse to a deficit of £11.9m in 2017, a swing of £29.8m. Also included is the fair value movement on our royalty assets which are accounted for as IAS 39 debt instruments. In the current period, the £6.3m deficit includes the full provision for the Jogjakarta debenture and a £3.3m fair value charge against the Group’s Dugbe 1 royalty. There were no impairment charges in relation to the Group’s royalty intangible assets in the period. These valuation movements also result in a corresponding but opposite deferred tax adjustment.
2017 £'000
2016 £'000
Royalty income 37,382 90% 19,705
Operating expenses – excluding share based payments (4,716) 42% (3,327)
Finance costs (795) (27%) (1,086)
Finance income 1,198 (49%) 2,347
Other (losses)/income (42) 309
Tax (2,934) 102% (1,454)
Adjusted earnings 30,093 82% 16,494
Weighted average number of shares ('000) 178,895 169,016
16.82p 72% 9.76p
Adjusted earnings increased by 72% during the year to £30.1m from £16.5m in 2016. This increase is primarily attributable to the 90% increase in royalty income, despite receiving no income from the Four Mile royalty as the dispute continues. This has been offset somewhat by a 42% increase in overheads to £4.7m due to higher staff costs and a greater investment by the Company in pursuing growth.
Elsewhere, finance income includes the £1.9m portion of the £5.0m Denison cash flows treated as interest. This also includes the impact of foreign exchange on the Group’s monetary assets, which had a much higher impact in 2016 post the result of the EU referendum and associated impact on the value of the pound. The pound has been much more stable during 2017. Finance costs are lower, reflecting lower financing activities during the year. The tax charge doubled in the period to reflect a higher level of profit in the Group and higher withholding tax on royalties. In addition, 2016 benefitted from tax recoveries.
Overall, adjusted earnings per share were 16.8p in 2017, a 72% increase on the 9.76p earned in 2016. This results in dividend cover of 2.4x in 2017 compared to 1.6x in 2016.
ROYALT Y INCOME
2017 £'000
2016 £'000
2015 £'000
Kestrel 28,746 119% 13,134 263% 3,614
Narrabri 4,946 17% 4,243 32% 3,217
EVBC 1,689 38% 1,223 -2% 1,246
Maracás Menchen 2,001 153% 791 31% 606
Four Mile – 314 –
Royalty income 37,382 90% 19,705 127% 8,683
APG_AR17_04.04.18_MIDDLE_AMENDS
37ANGLO PACIFIC GROUP PLC ANNUAL REPORT & ACCOUNTS 2017G
RO
UP O
VER
VIE
W S
TR
AT
EG
IC R
EP
OR
T G
OV
ERN
AN
CE FIN
AN
CIA
L STATEM
ENTS O
THER
INFO
RM
ATION
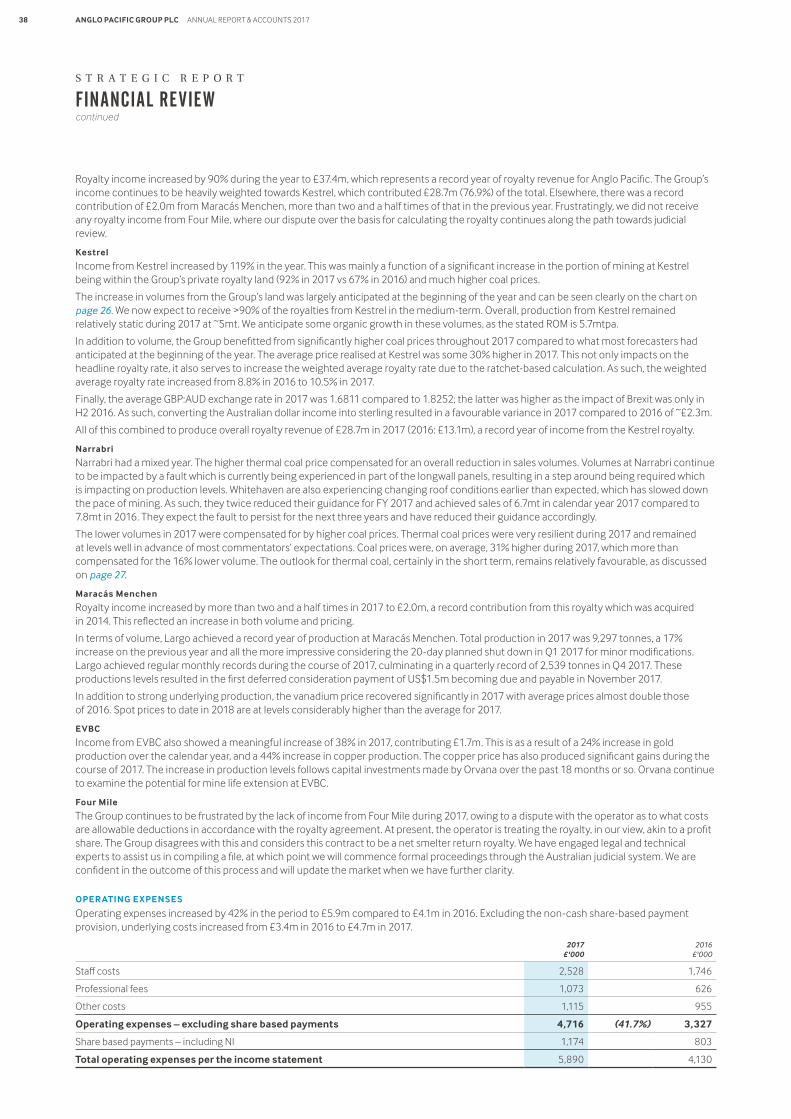
FINANCIAL REVIEWcontinued
Royalty income increased by 90% during the year to £37.4m, which represents a record year of royalty revenue for Anglo Pacific. The Group’s income continues to be heavily weighted towards Kestrel, which contributed £28.7m (76.9%) of the total. Elsewhere, there was a record contribution of £2.0m from Maracás Menchen, more than two and a half times of that in the previous year. Frustratingly, we did not receive any royalty income from Four Mile, where our dispute over the basis for calculating the royalty continues along the path towards judicial review.
Kestrel
Income from Kestrel increased by 119% in the year. This was mainly a function of a significant increase in the portion of mining at Kestrel being within the Group’s private royalty land (92% in 2017 vs 67% in 2016) and much higher coal prices.
The increase in volumes from the Group’s land was largely anticipated at the beginning of the year and can be seen clearly on the chart on page 26. We now expect to receive >90% of the royalties from Kestrel in the medium-term. Overall, production from Kestrel remained relatively static during 2017 at ~5mt. We anticipate some organic growth in these volumes, as the stated ROM is 5.7mtpa.
In addition to volume, the Group benefitted from significantly higher coal prices throughout 2017 compared to what most forecasters had anticipated at the beginning of the year. The average price realised at Kestrel was some 30% higher in 2017. This not only impacts on the headline royalty rate, it also serves to increase the weighted average royalty rate due to the ratchet-based calculation. As such, the weighted average royalty rate increased from 8.8% in 2016 to 10.5% in 2017.
Finally, the average GBP:AUD exchange rate in 2017 was 1.6811 compared to 1.8252; the latter was higher as the impact of Brexit was only in H2 2016. As such, converting the Australian dollar income into sterling resulted in a favourable variance in 2017 compared to 2016 of ~£2.3m.
All of this combined to produce overall royalty revenue of £28.7m in 2017 (2016: £13.1m), a record year of income from the Kestrel royalty.
Narrabri
Narrabri had a mixed year. The higher thermal coal price compensated for an overall reduction in sales volumes. Volumes at Narrabri continue to be impacted by a fault which is currently being experienced in part of the longwall panels, resulting in a step around being required which is impacting on production levels. Whitehaven are also experiencing changing roof conditions earlier than expected, which has slowed down the pace of mining. As such, they twice reduced their guidance for FY 2017 and achieved sales of 6.7mt in calendar year 2017 compared to 7.8mt in 2016. They expect the fault to persist for the next three years and have reduced their guidance accordingly.
The lower volumes in 2017 were compensated for by higher coal prices. Thermal coal prices were very resilient during 2017 and remained at levels well in advance of most commentators’ expectations. Coal prices were, on average, 31% higher during 2017, which more than compensated for the 16% lower volume. The outlook for thermal coal, certainly in the short term, remains relatively favourable, as discussed on page 27.
Maracás Menchen
Royalty income increased by more than two and a half times in 2017 to £2.0m, a record contribution from this royalty which was acquired in 2014. This reflected an increase in both volume and pricing.
In terms of volume, Largo achieved a record year of production at Maracás Menchen. Total production in 2017 was 9,297 tonnes, a 17% increase on the previous year and all the more impressive considering the 20-day planned shut down in Q1 2017 for minor modifications. Largo achieved regular monthly records during the course of 2017, culminating in a quarterly record of 2,539 tonnes in Q4 2017. These productions levels resulted in the first deferred consideration payment of US$1.5m becoming due and payable in November 2017.
In addition to strong underlying production, the vanadium price recovered significantly in 2017 with average prices almost double those of 2016. Spot prices to date in 2018 are at levels considerably higher than the average for 2017.
EVBC
Income from EVBC also showed a meaningful increase of 38% in 2017, contributing £1.7m. This is as a result of a 24% increase in gold production over the calendar year, and a 44% increase in copper production. The copper price has also produced significant gains during the course of 2017. The increase in production levels follows capital investments made by Orvana over the past 18 months or so. Orvana continue to examine the potential for mine life extension at EVBC.
Four Mile
The Group continues to be frustrated by the lack of income from Four Mile during 2017, owing to a dispute with the operator as to what costs are allowable deductions in accordance with the royalty agreement. At present, the operator is treating the royalty, in our view, akin to a profit share. The Group disagrees with this and considers this contract to be a net smelter return royalty. We have engaged legal and technical experts to assist us in compiling a file, at which point we will commence formal proceedings through the Australian judicial system. We are confident in the outcome of this process and will update the market when we have further clarity.
OPER ATING EXPENSES
Operating expenses increased by 42% in the period to £5.9m compared to £4.1m in 2016. Excluding the non-cash share-based payment provision, underlying costs increased from £3.4m in 2016 to £4.7m in 2017.
2017 £'000
2016 £'000
Staff costs 2,528 1,746
Professional fees 1,073 626
Other costs 1,115 955
Operating expenses – excluding share based payments 4,716 (41.7%) 3,327
Share based payments – including NI 1,174 803
Total operating expenses per the income statement 5,890 4,130
S T R A T E G I C R E P O R T
APG_AR17_04.04.18_MIDDLE_AMENDS
38 ANGLO PACIFIC GROUP PLC ANNUAL REPORT & ACCOUNTS 2017
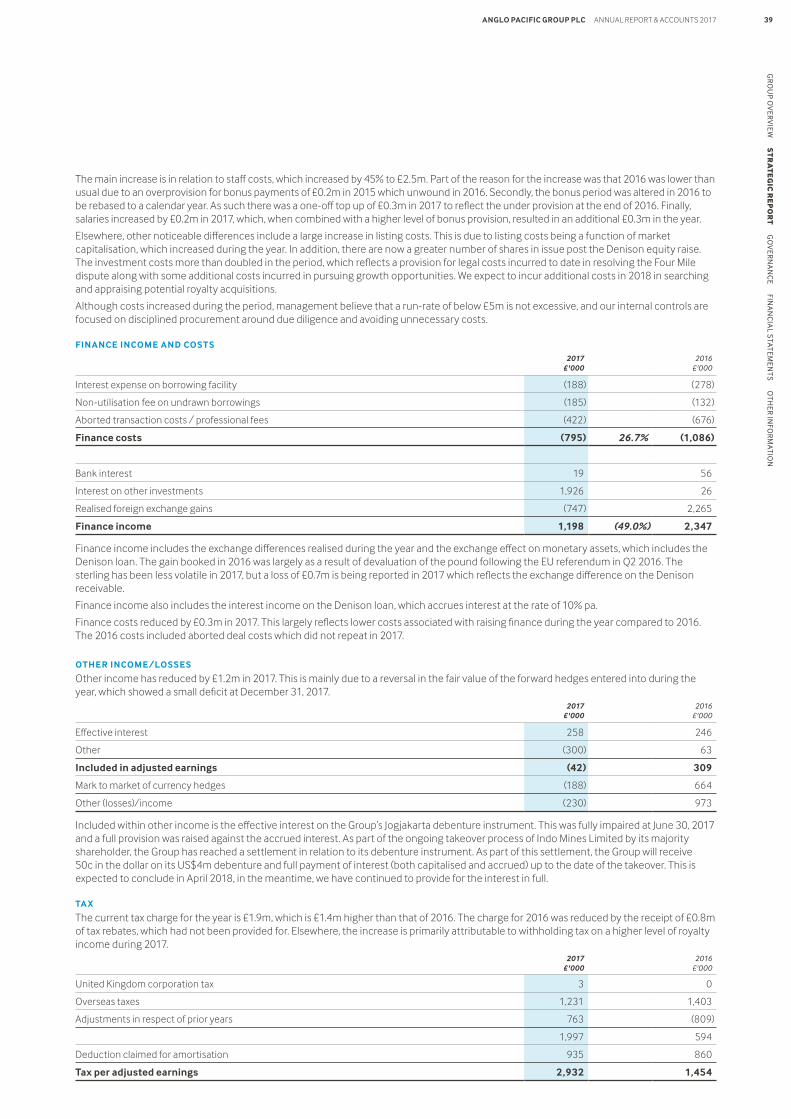
The main increase is in relation to staff costs, which increased by 45% to £2.5m. Part of the reason for the increase was that 2016 was lower than usual due to an overprovision for bonus payments of £0.2m in 2015 which unwound in 2016. Secondly, the bonus period was altered in 2016 to be rebased to a calendar year. As such there was a one-off top up of £0.3m in 2017 to reflect the under provision at the end of 2016. Finally, salaries increased by £0.2m in 2017, which, when combined with a higher level of bonus provision, resulted in an additional £0.3m in the year.
Elsewhere, other noticeable differences include a large increase in listing costs. This is due to listing costs being a function of market capitalisation, which increased during the year. In addition, there are now a greater number of shares in issue post the Denison equity raise. The investment costs more than doubled in the period, which reflects a provision for legal costs incurred to date in resolving the Four Mile dispute along with some additional costs incurred in pursuing growth opportunities. We expect to incur additional costs in 2018 in searching and appraising potential royalty acquisitions.
Although costs increased during the period, management believe that a run-rate of below £5m is not excessive, and our internal controls are focused on disciplined procurement around due diligence and avoiding unnecessary costs.
FINANCE INCOME AND COSTS2017
£'0002016
£'000
Interest expense on borrowing facility (188) (278)
Non-utilisation fee on undrawn borrowings (185) (132)
Aborted transaction costs / professional fees (422) (676)
Finance costs (795) 26.7% (1,086)
Bank interest 19 56
Interest on other investments 1,926 26
Realised foreign exchange gains (747) 2,265
Finance income 1,198 (49.0%) 2,347
Finance income includes the exchange differences realised during the year and the exchange effect on monetary assets, which includes the Denison loan. The gain booked in 2016 was largely as a result of devaluation of the pound following the EU referendum in Q2 2016. The sterling has been less volatile in 2017, but a loss of £0.7m is being reported in 2017 which reflects the exchange difference on the Denison receivable.
Finance income also includes the interest income on the Denison loan, which accrues interest at the rate of 10% pa.
Finance costs reduced by £0.3m in 2017. This largely reflects lower costs associated with raising finance during the year compared to 2016. The 2016 costs included aborted deal costs which did not repeat in 2017.
OTHER INCOME/LOSSES
Other income has reduced by £1.2m in 2017. This is mainly due to a reversal in the fair value of the forward hedges entered into during the year, which showed a small deficit at December 31, 2017.
2017 £'000
2016 £'000
Effective interest 258 246
Other (300) 63
Included in adjusted earnings (42) 309
Mark to market of currency hedges (188) 664
Other (losses)/income (230) 973
Included within other income is the effective interest on the Group’s Jogjakarta debenture instrument. This was fully impaired at June 30, 2017 and a full provision was raised against the accrued interest. As part of the ongoing takeover process of Indo Mines Limited by its majority shareholder, the Group has reached a settlement in relation to its debenture instrument. As part of this settlement, the Group will receive 50c in the dollar on its US$4m debenture and full payment of interest (both capitalised and accrued) up to the date of the takeover. This is expected to conclude in April 2018, in the meantime, we have continued to provide for the interest in full.
TA X
The current tax charge for the year is £1.9m, which is £1.4m higher than that of 2016. The charge for 2016 was reduced by the receipt of £0.8m of tax rebates, which had not been provided for. Elsewhere, the increase is primarily attributable to withholding tax on a higher level of royalty income during 2017.
2017 £'000
2016 £'000
United Kingdom corporation tax 3 0
Overseas taxes 1,231 1,403
Adjustments in respect of prior years 763 (809)
1,997 594
Deduction claimed for amortisation 935 860
Tax per adjusted earnings 2,932 1,454
APG_AR17_04.04.18_MIDDLE_AMENDS
39ANGLO PACIFIC GROUP PLC ANNUAL REPORT & ACCOUNTS 2017G
RO
UP O
VER
VIE
W S
TR
AT
EG
IC R
EP
OR
T G
OV
ERN
AN
CE FIN
AN
CIA
L STATEM
ENTS O
THER
INFO
RM
ATION
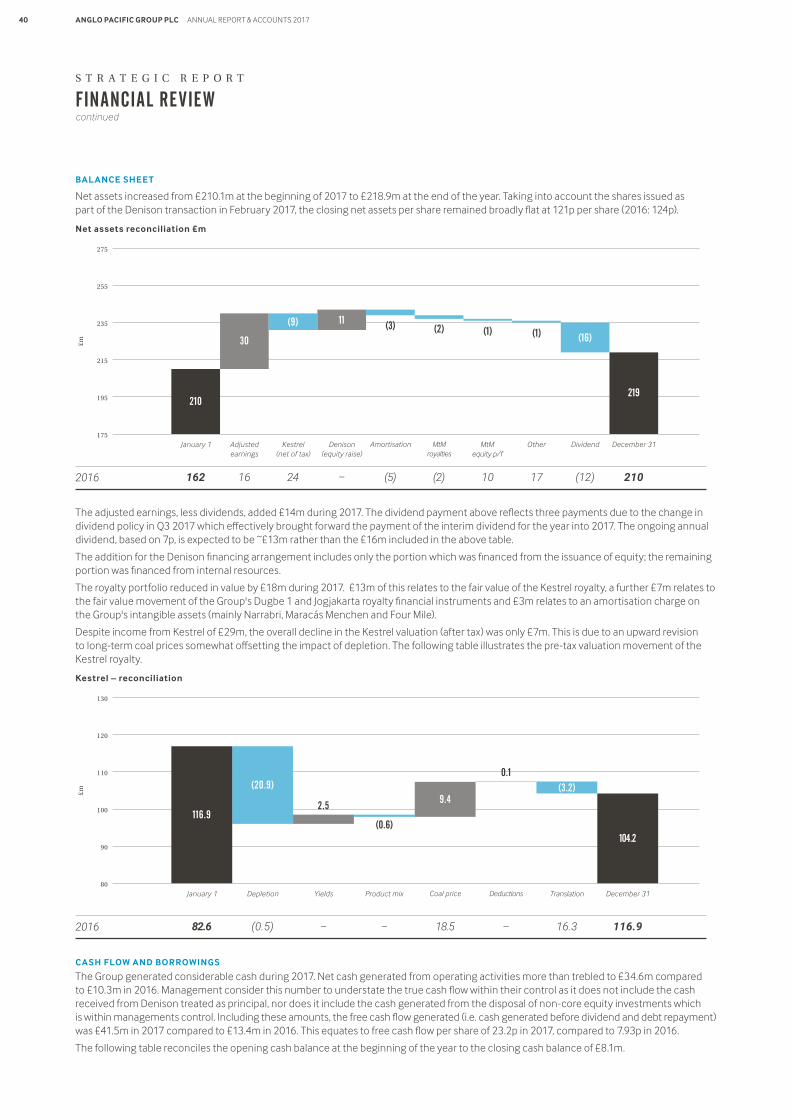
BAL ANCE SHEET
Net assets increased from £210.1m at the beginning of 2017 to £218.9m at the end of the year. Taking into account the shares issued as part of the Denison transaction in February 2017, the closing net assets per share remained broadly flat at 121p per share (2016: 124p).
Net assets reconciliation £m
The adjusted earnings, less dividends, added £14m during 2017. The dividend payment above reflects three payments due to the change in dividend policy in Q3 2017 which effectively brought forward the payment of the interim dividend for the year into 2017. The ongoing annual dividend, based on 7p, is expected to be ~£13m rather than the £16m included in the above table.
The addition for the Denison financing arrangement includes only the portion which was financed from the issuance of equity; the remaining portion was financed from internal resources.
The royalty portfolio reduced in value by £18m during 2017. £13m of this relates to the fair value of the Kestrel royalty, a further £7m relates to the fair value movement of the Group's Dugbe 1 and Jogjakarta royalty financial instruments and £3m relates to an amortisation charge on the Group's intangible assets (mainly Narrabri, Maracás Menchen and Four Mile).
Despite income from Kestrel of £29m, the overall decline in the Kestrel valuation (after tax) was only £7m. This is due to an upward revision to long-term coal prices somewhat offsetting the impact of depletion. The following table illustrates the pre-tax valuation movement of the Kestrel royalty.
Kestrel – reconciliation
CASH FLOW AND BORROWINGS
The Group generated considerable cash during 2017. Net cash generated from operating activities more than trebled to £34.6m compared to £10.3m in 2016. Management consider this number to understate the true cash flow within their control as it does not include the cash received from Denison treated as principal, nor does it include the cash generated from the disposal of non-core equity investments which is within managements control. Including these amounts, the free cash flow generated (i.e. cash generated before dividend and debt repayment) was £41.5m in 2017 compared to £13.4m in 2016. This equates to free cash flow per share of 23.2p in 2017, compared to 7.93p in 2016.
The following table reconciles the opening cash balance at the beginning of the year to the closing cash balance of £8.1m.
255
235
215
195
£m
275
175
January 1 Kestrel(net of tax)
Adjustedearnings
Denison(equity raise)
Amortisation MtMroyalties
MtMequity p/f
Other Dividend December 31
210
30
(9) 11 (3) (2) (1) (1) (16)
219
2016 16162 24 (5)– (2) 10 (12)17 210
120
110
100
90
£m
130
80
January 1 YieldsDepletion Product mix Coal price Deductions Translation December 31
116.9
(20.9)
2.5
(0.6)
9.4
0.1(3.2)
104.2
2016 82.6 (0.5) – – 18.5 – 16.3 116.9
FINANCIAL REVIEWcontinued
S T R A T E G I C R E P O R T
APG_AR17_04.04.18_MIDDLE_AMENDS
40 ANGLO PACIFIC GROUP PLC ANNUAL REPORT & ACCOUNTS 2017
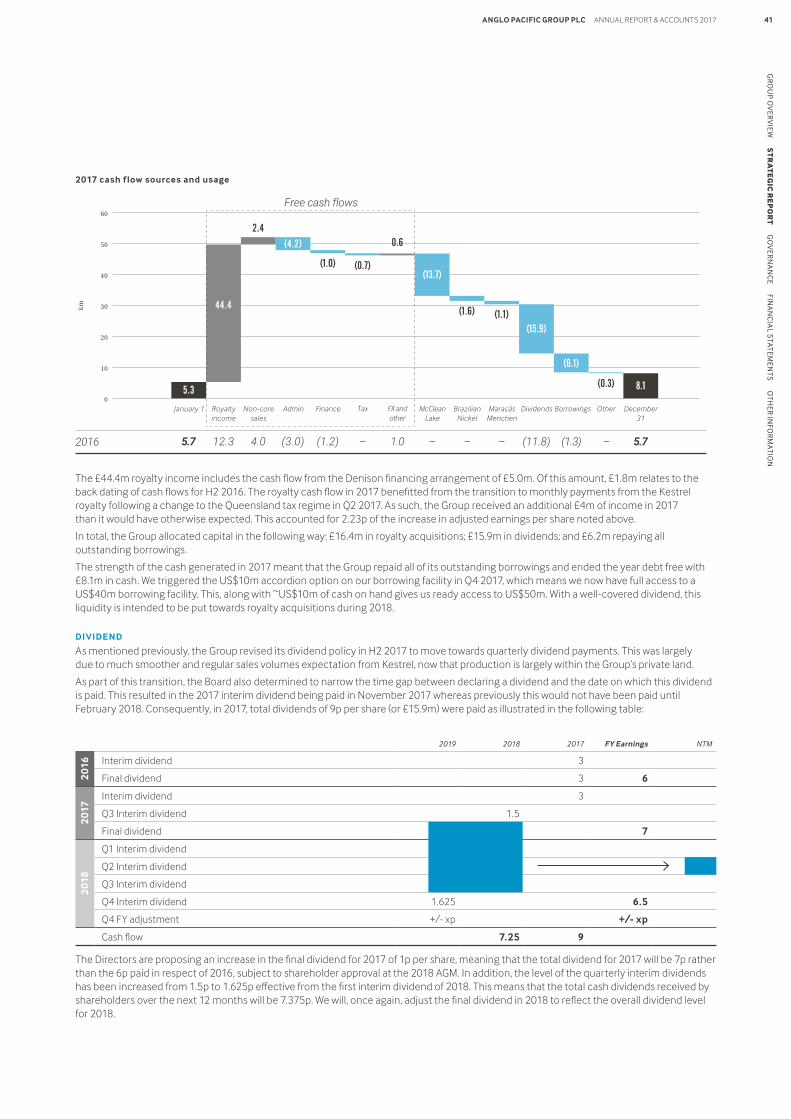
2017 cash f low sources and usage
The £44.4m royalty income includes the cash flow from the Denison financing arrangement of £5.0m. Of this amount, £1.8m relates to the back dating of cash flows for H2 2016. The royalty cash flow in 2017 benefitted from the transition to monthly payments from the Kestrel royalty following a change to the Queensland tax regime in Q2 2017. As such, the Group received an additional £4m of income in 2017 than it would have otherwise expected. This accounted for 2.23p of the increase in adjusted earnings per share noted above.
In total, the Group allocated capital in the following way: £16.4m in royalty acquisitions; £15.9m in dividends; and £6.2m repaying all outstanding borrowings.
The strength of the cash generated in 2017 meant that the Group repaid all of its outstanding borrowings and ended the year debt free with £8.1m in cash. We triggered the US$10m accordion option on our borrowing facility in Q4 2017, which means we now have full access to a US$40m borrowing facility. This, along with ~US$10m of cash on hand gives us ready access to US$50m. With a well-covered dividend, this liquidity is intended to be put towards royalty acquisitions during 2018.
DIVIDEND
As mentioned previously, the Group revised its dividend policy in H2 2017 to move towards quarterly dividend payments. This was largely due to much smoother and regular sales volumes expectation from Kestrel, now that production is largely within the Group’s private land.
As part of this transition, the Board also determined to narrow the time gap between declaring a dividend and the date on which this dividend is paid. This resulted in the 2017 interim dividend being paid in November 2017 whereas previously this would not have been paid until February 2018. Consequently, in 2017, total dividends of 9p per share (or £15.9m) were paid as illustrated in the following table:
2019 2018 2017 FY Earnings NTM
2016 Interim dividend 3
Final dividend 3 6
2017
Interim dividend 3
Q3 Interim dividend 1.5
Final dividend 2.5 7
2018
Q1 Interim dividend 1.625
Q2 Interim dividend 1.625 7.375
Q3 Interim dividend 1.625
Q4 Interim dividend 1.625 6.5
Q4 FY adjustment +/- xp +/- xp
Cash flow 7.25 9
The Directors are proposing an increase in the final dividend for 2017 of 1p per share, meaning that the total dividend for 2017 will be 7p rather than the 6p paid in respect of 2016, subject to shareholder approval at the 2018 AGM. In addition, the level of the quarterly interim dividends has been increased from 1.5p to 1.625p effective from the first interim dividend of 2018. This means that the total cash dividends received by shareholders over the next 12 months will be 7.375p. We will, once again, adjust the final dividend in 2018 to reflect the overall dividend level for 2018.
50
40
30
10
20
£m
60
0
January 1 Non-coresales
Royaltyincome
FinanceAdmin Tax FX andother
McCleanLake
BrazilianNickel
MaracásMenchen
Dividends Borrowings Other December31
5.3
44.4
2.4(4.2)
(1.0) (0.7)
0.6
(13.7)
(1.1)(15.9)
(1.6)
(6.1)
8.1
2016
Free cash flows
5.7 12.3 4.0 (3.0) (1.2) – 1.0 – – – (1.3)
(0.3)
–(11.8) 5.7
APG_AR17_04.04.18_MIDDLE_AMENDS
41ANGLO PACIFIC GROUP PLC ANNUAL REPORT & ACCOUNTS 2017G
RO
UP O
VER
VIE
W S
TR
AT
EG
IC R
EP
OR
T G
OV
ERN
AN
CE FIN
AN
CIA
L STATEM
ENTS O
THER
INFO
RM
ATION
CORPORATE SOCIAL RESPONSIBILIT Y
Following the completion of due diligence, if management proposes to proceed with a transaction in excess of a threshold amount, it must first seek Board approval. Below this threshold amount, management has discretion to proceed with an investment but must report the transaction to the Board in order to refresh its executive authority before being able to proceed with another investment.
The due diligence process will vary in each case as Anglo Pacific deems necessary or appropriate in the circumstances, all applied on a risk-adjusted basis. For instance, the purchase of newly created royalties or streams, requiring the negotiation of a binding agreement with the operator of a project, will typically permit more comprehensive due diligence than the acquisition of existing royalties where Anglo Pacific is acquiring royalty interests, often within a royalty portfolio on an as-is, where-is basis, from a third party rather than the operator. In such cases, Anglo Pacific must rely on the limited information provided by the third party as well as any publicly available information with respect to the operator and the project. The due diligence process will also vary based on the jurisdiction, type of mineral, and whether the project is an exploration, development or producing project, among other things.
INTEGRIT Y
Anglo Pacific is committed to maintaining the highest standards of integrity in all areas of its business and to maintaining its reputation for fair dealing. The Group does not offer, give or receive bribes or inducements whether directly or through a third party. The Group has policies and procedures in place to ensure that all Directors, officers, employees, consultants, advisors, business partners, and anyone else who may be acting on its behalf, are aware of their responsibilities in this area. The Group actively promotes a transparent approach to all of its business dealings and expects employees to adopt a zero-tolerance attitude to corruption. Employees are encouraged to report any potential or apparent misconduct in accordance with the Group’s internal whistle-blowing policy and any employee that refuses to pay bribes, or raises any issues honestly, and in good faith, will be supported by the Group.
The Group chooses business partners and counterparties carefully, based on merit and reputation, and only works with persons of known integrity, who it believes will act consistently with its own standards. The Group does not make facilitation payments. Where business is conducted in countries with laws that are less restrictive than the Group’s policies and procedures, it will seek to follow its own policies and procedures, promoting its standard of integrity wherever possible.
Anglo Pacific Group PLC is committed to responsible mining extraction in all aspects of its investments including with respect to environmental, social and governance issues.Anglo Pacific’s core business is investing in the business of others and Anglo Pacific does not directly operate any of its assets and hence does not control or influence the operations of any of the properties over which it has an interest. The projects on which the Company has royalties and streams are owned and operated by independent mining companies which are typically publicly listed.
We are nevertheless committed to responsible mining extraction and seek to address environmental, social and governance issues through a combination of the following:
• Our policies which guide investment decisions
• Our due diligence process for new investments
• Our contractual rights in our royalty and stream agreements
• Monitoring investments for their adherence to adequate standards
The approach taken by Anglo Pacific has generated value for shareholders and has allowed Anglo Pacific to acquire royalties and streams on projects operated by some of the best operators in the industry. Anglo Pacific is committed to considering potential partnerships with its operators to support appropriate environmental and social initiatives in the communities associated with its producing assets.
In terms of Anglo Pacific’s own environmental impact, the Company’s carbon footprint is very small. Anglo Pacific operates solely within one office environment with a small workforce. The Company has 10 employees located at its head office in London.
DUE DILIGENCE PROCESS IN NEW ACQUISITIONS
When conducting due diligence, environmental, social and governance issues are considered as these are critical to the long-term success of a project and the industry generally, which in turn, is key to Anglo Pacific’s success. Anglo Pacific will typically assess the following as part of its due diligence:
• community initiatives and engagement with indigenous peoples
• safety records
• whether the operator is committed to the principles of the International Council on Mining & Metals or other relevant standards
• water management and reduction plans
• other environmental programmes and initiatives put in place by the operator including carbon reduction and biodiversity protection
• operating plans and closure plans
• workplace standards, protections and policies
S T R A T E G I C R E P O R T
APG_AR17_04.04.18_MIDDLE_AMENDS
42 ANGLO PACIFIC GROUP PLC ANNUAL REPORT & ACCOUNTS 2017
ENVIRONMENT
Anglo Pacific is committed to an environmental policy of collaborating fully with statutory authorities, local communities and other interested parties in order to limit any potential adverse impacts of its activities on the natural and human environments associated with its operations. The nature of the Group’s royalty investments is such that it does not operate any of the properties underlying its royalty portfolio and, consequently, it does not always have the ability to influence the manner in which the operations are carried out. Nevertheless, a responsible approach to a project’s environmental impact and its sustainability management is essential to the success of the project over its life.
As part of the Group’s investment decision process, careful consideration is given to the environmental aspects of any potential asset purchase during the due diligence phase. In particular, the Group typically engages with consultants who have the requisite expertise to ensure that it can consider and, if necessary, mitigate any risks in this regard to a properly maintainable level. In 2017, as part of the Brazilian Nickel agreement, Anglo Pacific engaged an independent consultant to conduct an environmental review relating to the project. No breaches were identified as part of this process. The Group expects employees to address environmental and sustainability responsibilities within the framework of normal operating procedures and to look to minimise waste as much as economically practicable. The Audit Committee is responsible for periodically reviewing the Group’s environmental practices and for monitoring their effectiveness.
SOCIAL AND COMMUNIT Y ISSUES
Anglo Pacific acknowledges that, whilst its activities have little direct contact with communities, it can positively influence the social practices and policies of companies it conducts business with. Positive social and community relationships are essential to profitable and successful mining activities. The Group endeavours to ensure that companies it works with have appropriate procedures in place to facilitate this. More specifically, Anglo Pacific’s investment decision process for potential asset purchases involves due diligence relating to the full range of CSR issues, including the social and community aspects of the project. As part of its Brazilian Nickel agreement, Anglo Pacific reviewed the social and community factors associated with the Piauí Project. No issues were identified as part of this process.
DIVERSIT Y
The Group’s employees are instrumental to its success, and it respects and values the individuality and diversity that every employee brings to the business. As at December 31, 2017, 50% of the Group’s employees were female as the Group had 10 employees, five of whom were female. In terms of the Company’s Board of Directors, there were six Directors, five of whom were male and one of whom was female. Prior to any appointment to the Board, the Nomination Committee gives due regard to diversity and gender with a view to appointing the best placed individual for the role.
The Group recognises that it has more to do in encouraging and supporting diversity and hopes to be able to identify and develop talent at all levels in the organisation as the Group continues to grow. More information on the Nomination Committee’s approach to diversity can be found on page 48.
HUMAN RIGHTS
The debate on the role of business and human rights has gained increasing prominence in recent years. Anglo Pacific welcomes this focus as respect for human rights is implicit across the Group’s employment practices. Further, a commitment to human rights is an important part of any successful organisation. As part of the Group’s investment decision process, if necessary, consultants with the requisite expertise are engaged to assist in identifying and mitigating any such risks.
HEALTH AND SAFET Y
The health and safety of the Group’s employees is of fundamental importance and is a responsibility it takes seriously. The Group’s small size allows the day-to-day responsibility to remain at Board level, being monitored by the Chief Executive Officer. The Group has both a health and safety policy and office risk assessments in place, which are reviewed on an annual basis. Furthermore, a commitment to health and safety is a fundamental component of any mining project, and, as part of the Group’s investment decision process, consultants with the requisite expertise are engaged to assist in identifying and mitigating any such risks.
GREENHOUSE GAS EMISSIONS
The UK Government requires that UK listed companies should report their global levels of greenhouse gas emissions in their Annual Report. Anglo Pacific is a relatively small organisation, with 10 employees, which means that any emission sources within its operational and financial control, such as business travel, purchase of electricity, heat or cooling by the Group, are not material in their impact. As the management and operation of the underlying mines generating the Group’s royalty and stream income is outside its control, it is unable to report on these emissions.
The information on pages 08 to 43 represents the Group’s Strategic Report and has been approved by the board.
J.A. TregerChief Executive OfficerMarch 27, 2018
APG_AR17_04.04.18_MIDDLE_AMENDS
43ANGLO PACIFIC GROUP PLC ANNUAL REPORT & ACCOUNTS 2017G
RO
UP O
VER
VIE
W S
TR
AT
EG
IC R
EP
OR
T G
OV
ERN
AN
CE FIN
AN
CIA
L STATEM
ENTS O
THER
INFO
RM
ATION
CORPORATE GOVERNANCE REPORT
Our approach towards corporate governance
As a standard listed company on the London Stock Exchange, the Company is required to comply with the minimum regulatory requirements imposed by the EU that apply to all securities admitted to trading on EU regulated markets. Accordingly, the Company is subject to the relevant Listing Rules, the Disclosure and Transparency Rules of the UK Corporate Governance Code and the Prospectus Rules. However, it is not required to comply with the super-equivalent provisions of the Listing Rules which apply to companies with a premium listing.
The Company is, however, complying on a voluntary basis with related party requirements that are substantially equivalent to those set out in Chapter 11 of the Listing Rules.
The Board remains committed to high standards of corporate governance and considers all Non-Executive Directors to be independent.
Board and Committee structure
The Board is collectively responsible for approving the Group’s long-term objectives and strategy and for reviewing performance against them. The Board is also responsible for the general oversight of the Group’s operations and management.
At the conclusion of the 2017 AGM in May 2017, Patrick Meier assumed the role of Non-Executive Chairman from Mike Blyth and is responsible for the leadership and effectiveness of the Board. The time commitment expected of the Non-Executive Chairman is around six days per month. Mr. Meier’s other commitments are shown on page 45, none of which is considered to be significant.
The day-to-day management of the Group is delegated to the Chief Executive Officer (‘CEO’), save for certain matters reserved for consideration by the Board. The Chairman and CEO have distinct roles which have been defined in writing and agreed by the Board. The CEO is supported by the Chief Financial Officer & Company Secretary and the Head of Investments who meet as an Executive Committee. The Executive Committee is no longer a formal Board Committee because it is not currently comprised of a majority of Executive Directors.
Other responsibilities are devolved to the Nomination, Remuneration and Audit Committees; their members are all Non-Executive Directors and their work is described more fully below. The terms of reference of each Committee, and the matters reserved to the Board, are available on the Group’s website.
David Archer is Anglo Pacific’s Senior Independent Director (‘SID’). The role of the SID is to be available to shareholders to discuss any concerns they may have about the running of Anglo Pacific where the normal channels of communication are not appropriate. The SID is not required to seek meetings with shareholders, however is available to do so if required in order to understand shareholder concerns and take them to the Board for discussion. The SID is also required to lead discussions at meetings of Non-Executive Directors without the Chairman present at least annually to appraise the chairman’s performance and on such other occasions as are deemed appropriate.
APG_AR17_04.04.18_MIDDLE_AMENDS
44 ANGLO PACIFIC GROUP PLC ANNUAL REPORT & ACCOUNTS 2017
G O V E R N A N C E
THE BOARD
CHAIRMAN
N.P.H. Meier
68, was appointed Non-Executive Director in April 2015 and assumed the role of Non-Executive Chairman at the conclusion of the 2017 AGM in May 2017. Mr. Meier has over 30 years of experience in investment banking with specialist knowledge of the mining sector. He has an MA in Natural Sciences from Cambridge University. Most recently Mr. Meier headed up the investment banking activities for RBC Capital Markets in Europe and Asia and drove a major expansion of RBC’s European presence. Prior to this role, he headed up RBC’s activities in the Metals and Mining sector in Europe, Africa and Asia for many years, and continues to enjoy strong relationships within the sector. Mr. Meier also served as a Director on the Board of RBC’s main operating subsidiary in Europe. In addition to his role at Anglo Pacific Mr. Meier acts as a Senior Adviser to Bacchus Capital Advisers, an advisory boutique and in various other advisory roles from time to time.
Committee Chair: Nomination Committee
CHIEF EXECUTIVE OFFICER
J. A . Treger
55, joined the Group as Chief Executive Officer and Executive Director on October 21, 2013. He has an MBA from Harvard Business School and a BA from Harvard University. He began his career working for Lord Rothschild as an in-house corporate financier, managing a portfolio of public and private equity investments before co-founding Active Value Advisors Ltd. to invest in undervalued, predominantly UK-listed companies, where he advised on more than US$900.0m of funds over a 12-year period. He currently serves as Non-Executive Chairman of Audley Capital Advisors LLP, an investment advisory firm, which he co-founded in 2005, which specialises in managing value-orientated, special situations investment strategies through hedge fund and co-investment vehicles, with a principal focus on the natural resources sector. Mr. Treger holds external Non-Executive Directorships with Mantos Copper S.A., EBT Digital Communications Retail Group, Broadwell Capital and Ilari Exploration OY for which he earned fees during the year. These directorships do not affect Mr. Treger’s ability to perform his role as CEO of the Company, as they form part of his 10% time commitment outside Anglo Pacific.
SENIOR INDEPENDENT DIRECTOR
D.S. Archer
61, was appointed Non-Executive Director in October 2014. He is also the Group’s Senior Independent Director. He has over 34 years’ international resources industry experience in the Americas, Asia, Australia and the Middle East. He is the Chief Executive Officer of AIM-listed Savannah Resources PLC, which owns majority stakes in a mineral sands project in Mozambique and a copper project in Oman. He was previously the Managing Director of ASX-listed company Hillgrove Resources Limited, where he was responsible for growing the company into a significant, dividend paying, mineral explorer and copper producer with assets in Australia and Indonesia. Mr. Archer was the founder and Deputy Chairman of Savage Resources Limited, a coal, copper and zinc producer, and the founder and Executive Chairman of PowerTel Limited. He is also a barrister (non-practising) of the Supreme Court of New South Wales.
Committee member: Remuneration Committee, Nomination Committee
NON-EXECUTIVE DIRECTORS
W.M. Blyth
67, was appointed Director in March 2013 and became Non- Executive Chairman on April 1, 2014 until stepping down from this role at the conclusion of the 2017 AGM in May 2017. He has a BSc from St Andrews University and is a Chartered Accountant. He was, until his retirement in 2011, a partner for 30 years in RSM (previously Baker Tilly), specialising in providing audit and related services to AIM and full list clients. During his career he held a number of senior management positions with the firm, including a period on its National Executive Committee. In addition to his directorship of Anglo Pacific, Mr. Blyth is a board member of Wheatley Housing Group; and director of Haldane Property Company Ltd and Glasgow & Suburban Property Company Ltd. Mr. Blyth also acts as trustee for a number of small charities.
Committee Chair: Audit Committee, Remuneration Committee
Committee member: Nomination Committee
R.C. Rhodes
46, was appointed Non-Executive Director in May 2014. She has an MA in Economics from the University of Cambridge and is a member of the Institute of Chartered Accountants in England and Wales, having qualified with Coopers and Lybrand in London in 1997. She has over 15 years of experience in the mining industry, including with Anglo American PLC (until August 2008) and London Mining PLC (until November 2013) and is now CFO of Alufer Mining Limited. Ms. Rhodes also serves on the boards of Alufer Mining Services Limited and Bel Air Mining SA, and has played a leading role in listing companies on LSE, AIM and JSE, in raising significant project and corporate finance and in negotiating mining licences and fiscal platforms. Due to her ever increasing executive responsibilities, Ms Rhodes has decided not to put herself forward for re-election at the 2018 AGM.
Committee member: Audit Committee, Nomination Committee
R.H. Stan
64, was appointed Non-Executive Director in February 2014. He has over 34 years of experience in the mining industry. He has held several senior positions with Fording Coal Limited, Westar Mining Ltd, and TECK Corporation before becoming a founding shareholder and director of publicly quoted Grande Cache Coal Corporation (GCC), an Alberta-based metallurgical coal mining company, in 2000. At GCC, he served as President, CEO and Director from 2001 to 2012, when the company was sold for US$1.0b to Winsway Coking Coal and Marubeni Corp, an Asian-backed strategic investor consortium. He has served as Chairman of the Coal Association of Canada Board of Directors and has acted as a board member of the International Energy Agency’s Coal Industry Advisory Board. He currently serves on the board of several private companies, including Quantex Resources Limited, Lighthouse Resources Inc and Spruce Bluff Resources Limited, and formerly served on the board of publicly-listed Whetstone Minerals Limited.
Committee member: Audit Committee, Nomination Committee, Remuneration Committee
APG_AR17_04.04.18_MIDDLE_AMENDS
45ANGLO PACIFIC GROUP PLC ANNUAL REPORT & ACCOUNTS 2017G
RO
UP O
VER
VIE
W S
TRATEG
IC R
EPO
RT G
OV
ER
NA
NC
E FIN
AN
CIA
L STATEM
ENTS O
THER
INFO
RM
ATION
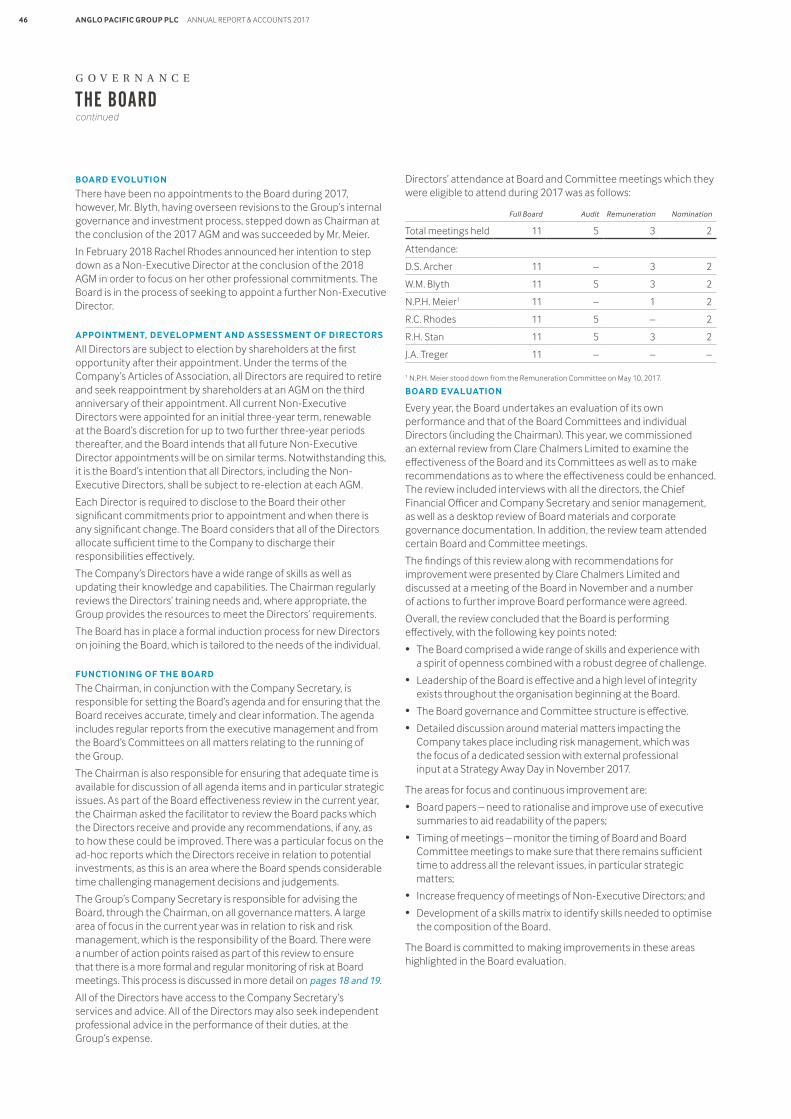
THE BOARDcontinued
BOARD EVOLUTION
There have been no appointments to the Board during 2017, however, Mr. Blyth, having overseen revisions to the Group’s internal governance and investment process, stepped down as Chairman at the conclusion of the 2017 AGM and was succeeded by Mr. Meier.
In February 2018 Rachel Rhodes announced her intention to step down as a Non-Executive Director at the conclusion of the 2018 AGM in order to focus on her other professional commitments. The Board is in the process of seeking to appoint a further Non-Executive Director.
APPOINTMENT, DEVELOPMENT AND ASSESSMENT OF DIRECTORS
All Directors are subject to election by shareholders at the first opportunity after their appointment. Under the terms of the Company’s Articles of Association, all Directors are required to retire and seek reappointment by shareholders at an AGM on the third anniversary of their appointment. All current Non-Executive Directors were appointed for an initial three-year term, renewable at the Board’s discretion for up to two further three-year periods thereafter, and the Board intends that all future Non-Executive Director appointments will be on similar terms. Notwithstanding this, it is the Board’s intention that all Directors, including the Non-Executive Directors, shall be subject to re-election at each AGM.
Each Director is required to disclose to the Board their other significant commitments prior to appointment and when there is any significant change. The Board considers that all of the Directors allocate sufficient time to the Company to discharge their responsibilities effectively.
The Company’s Directors have a wide range of skills as well as updating their knowledge and capabilities. The Chairman regularly reviews the Directors’ training needs and, where appropriate, the Group provides the resources to meet the Directors’ requirements.
The Board has in place a formal induction process for new Directors on joining the Board, which is tailored to the needs of the individual.
FUNCTIONING OF THE BOARD
The Chairman, in conjunction with the Company Secretary, is responsible for setting the Board’s agenda and for ensuring that the Board receives accurate, timely and clear information. The agenda includes regular reports from the executive management and from the Board’s Committees on all matters relating to the running of the Group.
The Chairman is also responsible for ensuring that adequate time is available for discussion of all agenda items and in particular strategic issues. As part of the Board effectiveness review in the current year, the Chairman asked the facilitator to review the Board packs which the Directors receive and provide any recommendations, if any, as to how these could be improved. There was a particular focus on the ad-hoc reports which the Directors receive in relation to potential investments, as this is an area where the Board spends considerable time challenging management decisions and judgements.
The Group’s Company Secretary is responsible for advising the Board, through the Chairman, on all governance matters. A large area of focus in the current year was in relation to risk and risk management, which is the responsibility of the Board. There were a number of action points raised as part of this review to ensure that there is a more formal and regular monitoring of risk at Board meetings. This process is discussed in more detail on pages 18 and 19.
All of the Directors have access to the Company Secretary’s services and advice. All of the Directors may also seek independent professional advice in the performance of their duties, at the Group’s expense.
Directors’ attendance at Board and Committee meetings which they were eligible to attend during 2017 was as follows:
Full Board Audit Remuneration Nomination
Total meetings held 11 5 3 2
Attendance:
D.S. Archer 11 – 3 2
W.M. Blyth 11 5 3 2
N.P.H. Meier1 11 – 1 2
R.C. Rhodes 11 5 – 2
R.H. Stan 11 5 3 2
J.A. Treger 11 – – –
1 N.P.H. Meier stood down from the Remuneration Committee on May 10, 2017.
BOARD EVALUATION
Every year, the Board undertakes an evaluation of its own performance and that of the Board Committees and individual Directors (including the Chairman). This year, we commissioned an external review from Clare Chalmers Limited to examine the effectiveness of the Board and its Committees as well as to make recommendations as to where the effectiveness could be enhanced. The review included interviews with all the directors, the Chief Financial Officer and Company Secretary and senior management, as well as a desktop review of Board materials and corporate governance documentation. In addition, the review team attended certain Board and Committee meetings.
The findings of this review along with recommendations for improvement were presented by Clare Chalmers Limited and discussed at a meeting of the Board in November and a number of actions to further improve Board performance were agreed.
Overall, the review concluded that the Board is performing effectively, with the following key points noted:
• The Board comprised a wide range of skills and experience with a spirit of openness combined with a robust degree of challenge.
• Leadership of the Board is effective and a high level of integrity exists throughout the organisation beginning at the Board.
• The Board governance and Committee structure is effective.
• Detailed discussion around material matters impacting the Company takes place including risk management, which was the focus of a dedicated session with external professional input at a Strategy Away Day in November 2017.
The areas for focus and continuous improvement are:
• Board papers – need to rationalise and improve use of executive summaries to aid readability of the papers;
• Timing of meetings – monitor the timing of Board and Board Committee meetings to make sure that there remains sufficient time to address all the relevant issues, in particular strategic matters;
• Increase frequency of meetings of Non-Executive Directors; and
• Development of a skills matrix to identify skills needed to optimise the composition of the Board.
The Board is committed to making improvements in these areas highlighted in the Board evaluation.
APG_AR17_04.04.18_MIDDLE_AMENDS
46 ANGLO PACIFIC GROUP PLC ANNUAL REPORT & ACCOUNTS 2017
G O V E R N A N C E
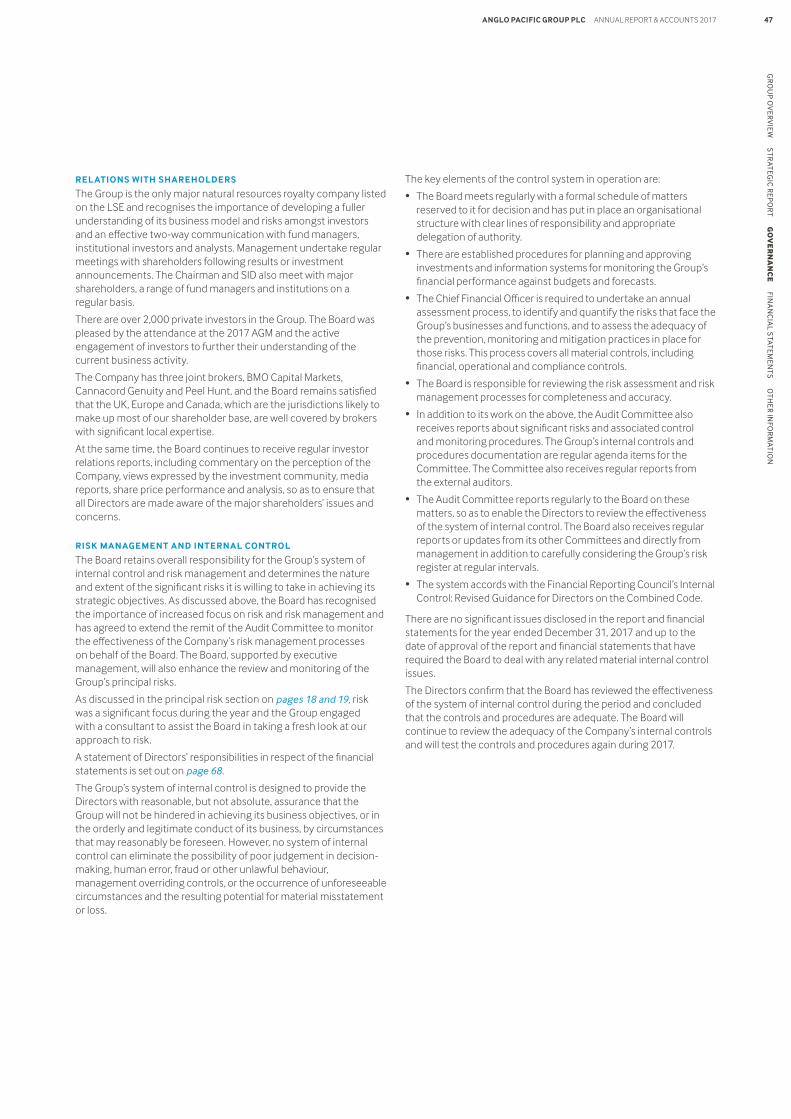
The key elements of the control system in operation are:
• The Board meets regularly with a formal schedule of matters reserved to it for decision and has put in place an organisational structure with clear lines of responsibility and appropriate delegation of authority.
• There are established procedures for planning and approving investments and information systems for monitoring the Group’s financial performance against budgets and forecasts.
• The Chief Financial Officer is required to undertake an annual assessment process, to identify and quantify the risks that face the Group’s businesses and functions, and to assess the adequacy of the prevention, monitoring and mitigation practices in place for those risks. This process covers all material controls, including financial, operational and compliance controls.
• The Board is responsible for reviewing the risk assessment and risk management processes for completeness and accuracy.
• In addition to its work on the above, the Audit Committee also receives reports about significant risks and associated control and monitoring procedures. The Group’s internal controls and procedures documentation are regular agenda items for the Committee. The Committee also receives regular reports from the external auditors.
• The Audit Committee reports regularly to the Board on these matters, so as to enable the Directors to review the effectiveness of the system of internal control. The Board also receives regular reports or updates from its other Committees and directly from management in addition to carefully considering the Group’s risk register at regular intervals.
• The system accords with the Financial Reporting Council’s Internal Control: Revised Guidance for Directors on the Combined Code.
There are no significant issues disclosed in the report and financial statements for the year ended December 31, 2017 and up to the date of approval of the report and financial statements that have required the Board to deal with any related material internal control issues.
The Directors confirm that the Board has reviewed the effectiveness of the system of internal control during the period and concluded that the controls and procedures are adequate. The Board will continue to review the adequacy of the Company’s internal controls and will test the controls and procedures again during 2017.
REL ATIONS WITH SHAREHOLDERS
The Group is the only major natural resources royalty company listed on the LSE and recognises the importance of developing a fuller understanding of its business model and risks amongst investors and an effective two-way communication with fund managers, institutional investors and analysts. Management undertake regular meetings with shareholders following results or investment announcements. The Chairman and SID also meet with major shareholders, a range of fund managers and institutions on a regular basis.
There are over 2,000 private investors in the Group. The Board was pleased by the attendance at the 2017 AGM and the active engagement of investors to further their understanding of the current business activity.
The Company has three joint brokers, BMO Capital Markets, Cannacord Genuity and Peel Hunt, and the Board remains satisfied that the UK, Europe and Canada, which are the jurisdictions likely to make up most of our shareholder base, are well covered by brokers with significant local expertise.
At the same time, the Board continues to receive regular investor relations reports, including commentary on the perception of the Company, views expressed by the investment community, media reports, share price performance and analysis, so as to ensure that all Directors are made aware of the major shareholders’ issues and concerns.
RISK MANAGEMENT AND INTERNAL CONTROL
The Board retains overall responsibility for the Group’s system of internal control and risk management and determines the nature and extent of the significant risks it is willing to take in achieving its strategic objectives. As discussed above, the Board has recognised the importance of increased focus on risk and risk management and has agreed to extend the remit of the Audit Committee to monitor the effectiveness of the Company’s risk management processes on behalf of the Board. The Board, supported by executive management, will also enhance the review and monitoring of the Group’s principal risks.
As discussed in the principal risk section on pages 18 and 19, risk was a significant focus during the year and the Group engaged with a consultant to assist the Board in taking a fresh look at our approach to risk.
A statement of Directors’ responsibilities in respect of the financial statements is set out on page 68.
The Group’s system of internal control is designed to provide the Directors with reasonable, but not absolute, assurance that the Group will not be hindered in achieving its business objectives, or in the orderly and legitimate conduct of its business, by circumstances that may reasonably be foreseen. However, no system of internal control can eliminate the possibility of poor judgement in decision-making, human error, fraud or other unlawful behaviour, management overriding controls, or the occurrence of unforeseeable circumstances and the resulting potential for material misstatement or loss.
APG_AR17_04.04.18_MIDDLE_AMENDS
47ANGLO PACIFIC GROUP PLC ANNUAL REPORT & ACCOUNTS 2017G
RO
UP O
VER
VIE
W S
TRATEG
IC R
EPO
RT G
OV
ER
NA
NC
E FIN
AN
CIA
L STATEM
ENTS O
THER
INFO
RM
ATION
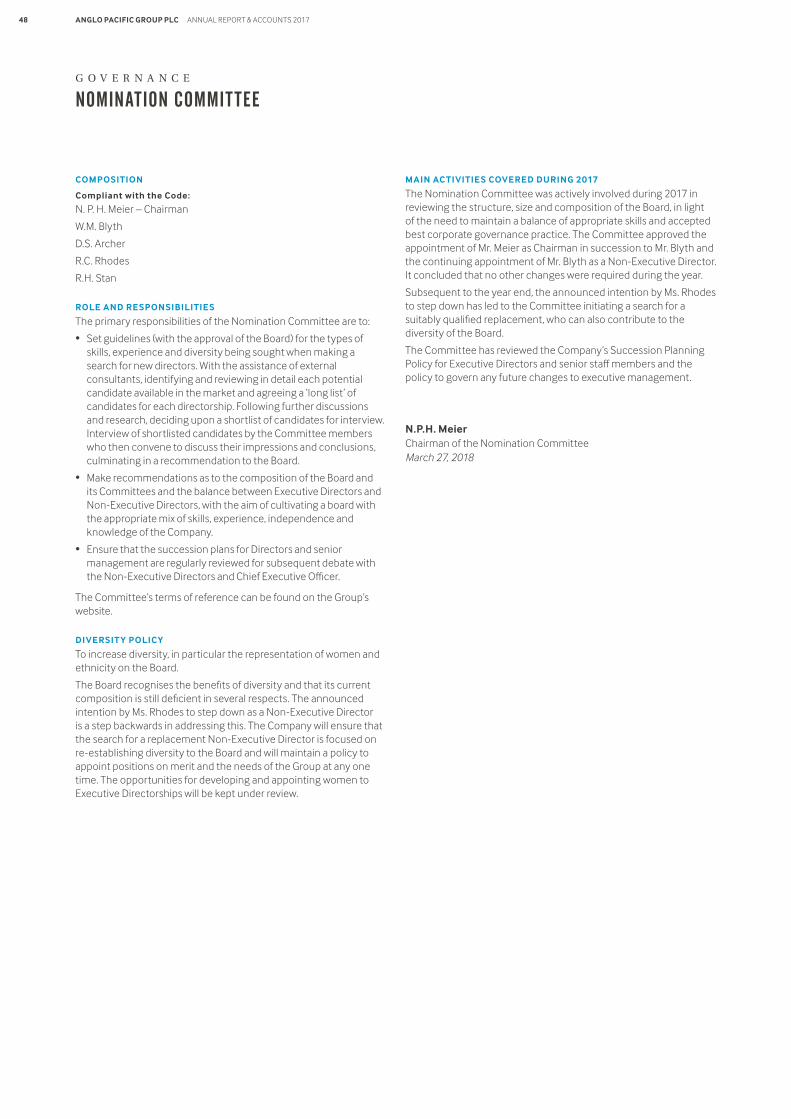
NOMINATION COMMITTEE
MAIN ACTIVITIES COVERED DURING 2017
The Nomination Committee was actively involved during 2017 in reviewing the structure, size and composition of the Board, in light of the need to maintain a balance of appropriate skills and accepted best corporate governance practice. The Committee approved the appointment of Mr. Meier as Chairman in succession to Mr. Blyth and the continuing appointment of Mr. Blyth as a Non-Executive Director. It concluded that no other changes were required during the year.
Subsequent to the year end, the announced intention by Ms. Rhodes to step down has led to the Committee initiating a search for a suitably qualified replacement, who can also contribute to the diversity of the Board.
The Committee has reviewed the Company’s Succession Planning Policy for Executive Directors and senior staff members and the policy to govern any future changes to executive management.
N.P.H. Meier Chairman of the Nomination CommitteeMarch 27, 2018
COMPOSITION
Compliant with the Code:
N. P. H. Meier – Chairman
W.M. Blyth
D.S. Archer
R.C. Rhodes
R.H. Stan
ROLE AND RESPONSIBILITIES
The primary responsibilities of the Nomination Committee are to:
• Set guidelines (with the approval of the Board) for the types of skills, experience and diversity being sought when making a search for new directors. With the assistance of external consultants, identifying and reviewing in detail each potential candidate available in the market and agreeing a ‘long list’ of candidates for each directorship. Following further discussions and research, deciding upon a shortlist of candidates for interview. Interview of shortlisted candidates by the Committee members who then convene to discuss their impressions and conclusions, culminating in a recommendation to the Board.
• Make recommendations as to the composition of the Board and its Committees and the balance between Executive Directors and Non-Executive Directors, with the aim of cultivating a board with the appropriate mix of skills, experience, independence and knowledge of the Company.
• Ensure that the succession plans for Directors and senior management are regularly reviewed for subsequent debate with the Non-Executive Directors and Chief Executive Officer.
The Committee’s terms of reference can be found on the Group’s website.
DIVERSIT Y POLICY
To increase diversity, in particular the representation of women and ethnicity on the Board.
The Board recognises the benefits of diversity and that its current composition is still deficient in several respects. The announced intention by Ms. Rhodes to step down as a Non-Executive Director is a step backwards in addressing this. The Company will ensure that the search for a replacement Non-Executive Director is focused on re-establishing diversity to the Board and will maintain a policy to appoint positions on merit and the needs of the Group at any one time. The opportunities for developing and appointing women to Executive Directorships will be kept under review.
APG_AR17_04.04.18_MIDDLE_AMENDS
48 ANGLO PACIFIC GROUP PLC ANNUAL REPORT & ACCOUNTS 2017
G O V E R N A N C E
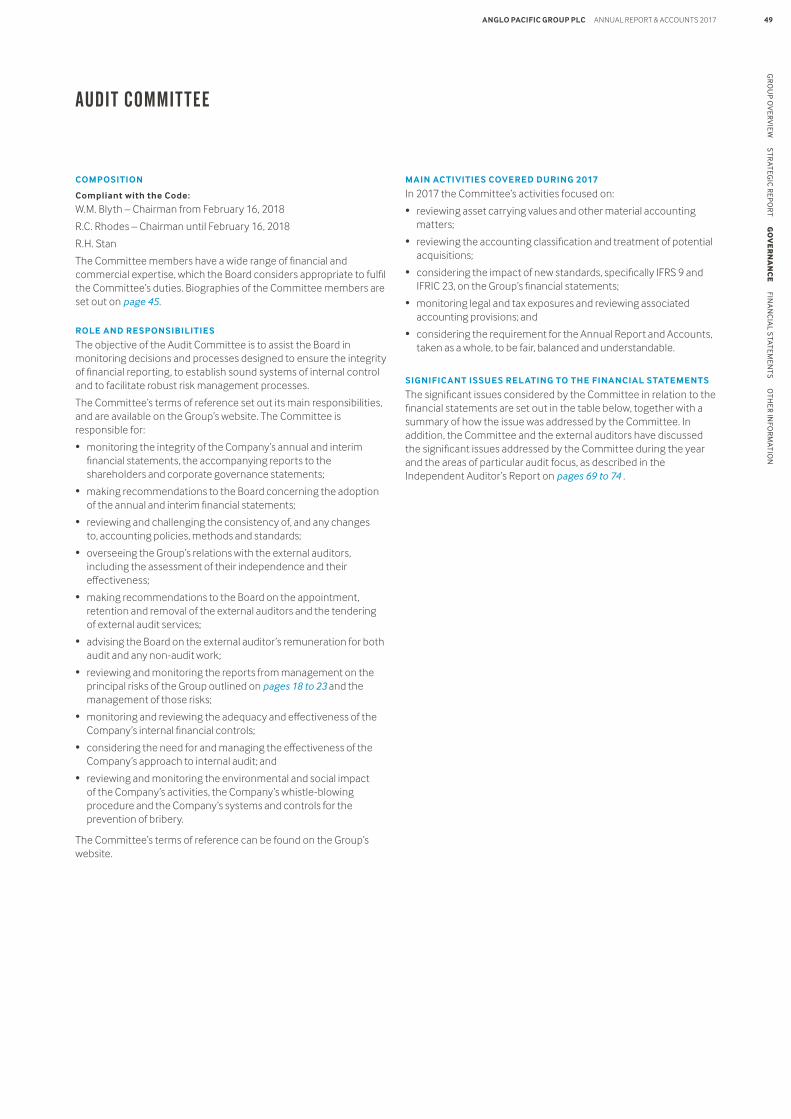
AUDIT COMMITTEE
MAIN ACTIVITIES COVERED DURING 2017
In 2017 the Committee’s activities focused on:
• reviewing asset carrying values and other material accounting matters;
• reviewing the accounting classification and treatment of potential acquisitions;
• considering the impact of new standards, specifically IFRS 9 and IFRIC 23, on the Group’s financial statements;
• monitoring legal and tax exposures and reviewing associated accounting provisions; and
• considering the requirement for the Annual Report and Accounts, taken as a whole, to be fair, balanced and understandable.
SIGNIFICANT ISSUES REL ATING TO THE FINANCIAL STATEMENTS
The significant issues considered by the Committee in relation to the financial statements are set out in the table below, together with a summary of how the issue was addressed by the Committee. In addition, the Committee and the external auditors have discussed the significant issues addressed by the Committee during the year and the areas of particular audit focus, as described in the Independent Auditor’s Report on pages 69 to 74 .
COMPOSITION
Compliant with the Code:
W.M. Blyth – Chairman from February 16, 2018
R.C. Rhodes – Chairman until February 16, 2018
R.H. Stan
The Committee members have a wide range of financial and commercial expertise, which the Board considers appropriate to fulfil the Committee’s duties. Biographies of the Committee members are set out on page 45.
ROLE AND RESPONSIBILITIES
The objective of the Audit Committee is to assist the Board in monitoring decisions and processes designed to ensure the integrity of financial reporting, to establish sound systems of internal control and to facilitate robust risk management processes.
The Committee’s terms of reference set out its main responsibilities, and are available on the Group’s website. The Committee is responsible for:
• monitoring the integrity of the Company’s annual and interim financial statements, the accompanying reports to the shareholders and corporate governance statements;
• making recommendations to the Board concerning the adoption of the annual and interim financial statements;
• reviewing and challenging the consistency of, and any changes to, accounting policies, methods and standards;
• overseeing the Group’s relations with the external auditors, including the assessment of their independence and their effectiveness;
• making recommendations to the Board on the appointment, retention and removal of the external auditors and the tendering of external audit services;
• advising the Board on the external auditor’s remuneration for both audit and any non-audit work;
• reviewing and monitoring the reports from management on the principal risks of the Group outlined on pages 18 to 23 and the management of those risks;
• monitoring and reviewing the adequacy and effectiveness of the Company’s internal financial controls;
• considering the need for and managing the effectiveness of the Company’s approach to internal audit; and
• reviewing and monitoring the environmental and social impact of the Company’s activities, the Company’s whistle-blowing procedure and the Company’s systems and controls for the prevention of bribery.
The Committee’s terms of reference can be found on the Group’s website.
APG_AR17_04.04.18_MIDDLE_AMENDS
49ANGLO PACIFIC GROUP PLC ANNUAL REPORT & ACCOUNTS 2017G
RO
UP O
VER
VIE
W S
TRATEG
IC R
EPO
RT G
OV
ER
NA
NC
E FIN
AN
CIA
L STATEM
ENTS O
THER
INFO
RM
ATION
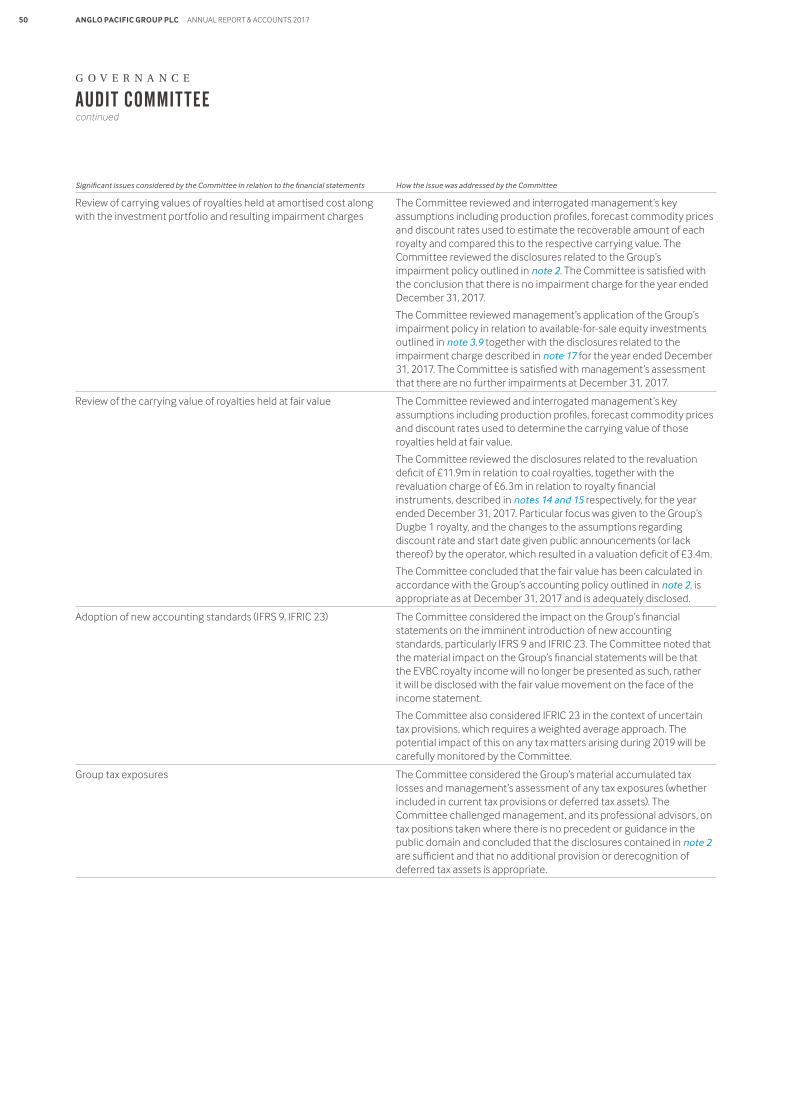
AUDIT COMMITTEEcontinued
Significant issues considered by the Committee in relation to the financial statements How the issue was addressed by the Committee
Review of carrying values of royalties held at amortised cost along with the investment portfolio and resulting impairment charges
The Committee reviewed and interrogated management’s key assumptions including production profiles, forecast commodity prices and discount rates used to estimate the recoverable amount of each royalty and compared this to the respective carrying value. The Committee reviewed the disclosures related to the Group’s impairment policy outlined in note 2. The Committee is satisfied with the conclusion that there is no impairment charge for the year ended December 31, 2017.
The Committee reviewed management’s application of the Group’s impairment policy in relation to available-for-sale equity investments outlined in note 3.9 together with the disclosures related to the impairment charge described in note 17 for the year ended December 31, 2017. The Committee is satisfied with management’s assessment that there are no further impairments at December 31, 2017.
Review of the carrying value of royalties held at fair value The Committee reviewed and interrogated management’s key assumptions including production profiles, forecast commodity prices and discount rates used to determine the carrying value of those royalties held at fair value.
The Committee reviewed the disclosures related to the revaluation deficit of £11.9m in relation to coal royalties, together with the revaluation charge of £6.3m in relation to royalty financial instruments, described in notes 14 and 15 respectively, for the year ended December 31, 2017. Particular focus was given to the Group’s Dugbe 1 royalty, and the changes to the assumptions regarding discount rate and start date given public announcements (or lack thereof) by the operator, which resulted in a valuation deficit of £3.4m.
The Committee concluded that the fair value has been calculated in accordance with the Group’s accounting policy outlined in note 2, is appropriate as at December 31, 2017 and is adequately disclosed.
Adoption of new accounting standards (IFRS 9, IFRIC 23) The Committee considered the impact on the Group’s financial statements on the imminent introduction of new accounting standards, particularly IFRS 9 and IFRIC 23. The Committee noted that the material impact on the Group’s financial statements will be that the EVBC royalty income will no longer be presented as such, rather it will be disclosed with the fair value movement on the face of the income statement.
The Committee also considered IFRIC 23 in the context of uncertain tax provisions, which requires a weighted average approach. The potential impact of this on any tax matters arising during 2019 will be carefully monitored by the Committee.
Group tax exposures The Committee considered the Group’s material accumulated tax losses and management’s assessment of any tax exposures (whether included in current tax provisions or deferred tax assets). The Committee challenged management, and its professional advisors, on tax positions taken where there is no precedent or guidance in the public domain and concluded that the disclosures contained in note 2 are sufficient and that no additional provision or derecognition of deferred tax assets is appropriate.
APG_AR17_04.04.18_MIDDLE_AMENDS
50 ANGLO PACIFIC GROUP PLC ANNUAL REPORT & ACCOUNTS 2017
G O V E R N A N C E
There are no significant issues disclosed in the report and financial statements for the year ended December 31, 2017 and up to the date of approval of the report and financial statements that have required the Board to deal with any related material internal control issues.
The Directors confirm that there have been no significant changes to the system of internal controls, nor have there been any significant breaches reported during the year. As a result the Board has concluded that the controls and procedures are adequate.
The Committee also considers, on an annual basis, whether an internal audit function is required. Its present view is that one is not yet justified given the compact size of the Group and the Directors’ involvement with individual transactions.
EX TERNAL AUDIT
To safeguard the objectivity and independence of the external audit process, it remains the Committee’s policy to review and approve all fees related to non-audit services. The policy prohibits the auditors from providing certain services such as accounting or valuation services. Details of the auditors’ remuneration are disclosed in note 5b.
The Committee will continue to review its activities in light of any regulatory developments going forward.
The Committee has satisfied itself that the external auditors’ independence was not impaired.
The Committee held meetings with the external auditors without the presence of management on three occasions and the Chairman of the Committee held regular meetings with the lead audit engagement partner during the year.
The Committee’s assessment of the external auditors’ performance and independence underpins its recommendation to the Board to propose to shareholders the re-appointment of Deloitte LLP as auditors until the conclusion of the AGM in 2018. Resolutions to authorise the Board to re-appoint and determine the remuneration of Deloitte LLP will be proposed at the AGM on May 10, 2018.
W.M. BlythChairman of the Audit CommitteeMarch 27, 2018
FAIR, BAL ANCED AND UNDERSTANDABLE
A key requirement of the Group’s Annual Report and Accounts is that it be fair, balanced and understandable. The Audit Committee and the Board are satisfied that the Annual Report and Accounts meet this requirement as appropriate weight has been given to both positive and negative developments in the year.
In justifying this statement, the Audit Committee has considered the robust process which operates in creating the Annual Report and Accounts, including:
• the thorough process of review, evaluation and verification by senior management, which considered and drew on best practice for the creation of the Annual Report and Accounts;
• a meeting of the Audit Committee held to review and consider the draft Annual Report and Accounts in advance of the final sign-off; and
• final sign-off provided by the Board.
INTERNAL CONTROL AND RISK MANAGEMENT
The Committee is responsible for the oversight of internal control and risk management systems across the Group.
In carrying out its role, the Committee reviews the following:
• Regular updates of key internal control matters in respect of the Group financial reporting processes, such as financial reporting systems and controls.
• Procedures developed by management to identify and evaluate key business, financial and operational risks, and the effectiveness of the responses being implemented to mitigate the potential impacts.
• Policies and procedures in place to detect, monitor and investigate activity in respect of anti-fraud, bribery and corruption, such as the Group whistle-blowing facilities.
The key elements of the control system in operation are:
• The Board meets regularly with a formal schedule of matters reserved to it for decision and has put in place an organisational structure with clear lines of responsibility and appropriate delegation of authority.
• There are established procedures for planning and approving investments and information systems for monitoring the Group’s financial performance against budgets and forecasts.
• The Chief Financial Officer is required to undertake an annual assessment process to identify and quantify the risks that face the Group’s businesses and functions, and to assess the adequacy of the prevention, monitoring and mitigation practices in place for those risks. This process covers all material controls, including financial, operational and compliance controls. The process undertaken during the year is discussed in more detail within the Principal Risks and Uncertainties section on pages 18 to 23. The Audit Committee is responsible for reviewing the risk assessment process for completeness and accuracy.
• In addition to its work on the above, the Audit Committee also receives regular reports about significant risks and associated control and monitoring procedures. The Group’s risk register and internal controls and procedures documentation are regular agenda items for the Committee. The Committee also receives regular reports from the external auditors.
• The Audit Committee reports to the Board on these matters, so as to enable the Directors to review the effectiveness of the system of internal control. The Board also receives reports from its other Committees and directly from management.
• The system accords with the Financial Reporting Council’s Internal Control: Revised Guidance for Directors on the Combined Code.
APG_AR17_04.04.18_MIDDLE_AMENDS
51ANGLO PACIFIC GROUP PLC ANNUAL REPORT & ACCOUNTS 2017G
RO
UP O
VER
VIE
W S
TRATEG
IC R
EPO
RT G
OV
ER
NA
NC
E FIN
AN
CIA
L STATEM
ENTS O
THER
INFO
RM
ATION
REMUNERATION COMMITTEE
MAIN ACTIVITIES COVERED DURING 2017
The Remuneration Committee’s activities focused on:
• designing the CEO’s 2017 bonus framework and the associated performance scorecard criteria;
• providing guidance to the CEO on salaries and bonuses to be awarded to his direct reports and approving salaries and bonuses paid; and
• reviewing the levels of Company pension contributions and other benefits.
COMPOSITION
Compliant with the Code:
W.M. Blyth – Chairman from May 10, 2017
D.S. Archer – Chairman until May 10, 2017
N.P.H. Meier – stood down from the Remuneration Committee on May 10, 2017
R.H. Stan
ROLE AND RESPONSIBILITIES
The primary responsibilities of the Remuneration Committee are to:
• establish and develop the Group’s general policy on executive and senior management remuneration;
• determine specific remuneration packages for the Chairman and Executive Directors; and
• design the Company’s share incentive schemes.
The Remuneration Committee’s terms of reference can be found on the Group’s website.
EX TERNAL ADVISORS
The Remuneration Committee has access to the advice of independent remuneration consultants when required. During 2017, the Remuneration Committee received advice from New Bridge Street (‘NBS’). NBS was first appointed by the Remuneration Committee on January 20, 2014. NBS is a signatory to the Remuneration Consultants’ Code of Conduct and has no other connection with the Company. The Remuneration Committee is satisfied that the advice that it receives from NBS is objective and independent. Total fees paid to NBS in respect of its services were £31,494.
APG_AR17_04.04.18_MIDDLE_AMENDS
52 ANGLO PACIFIC GROUP PLC ANNUAL REPORT & ACCOUNTS 2017
G O V E R N A N C E
Dear Shareholder,
Our remuneration report is, as last year, in two parts: a statement of the Company’s policy on Directors’ remuneration, and an Annual Remuneration Report which describes how the policy was implemented during 2017. There have been no changes to the policy in the current year and, as such, the format for the forthcoming AGM vote will be advisory rather than of formal approval.
This report is set against a background of continued strong Company performance during 2017, which generated total shareholder returns (‘TSR’) of 24.7% in the period. The main focus for the Committee this year was in relation to the setting of bonus matrices, Director fees and salary benchmarking. The salary of the Chief Executive Officer (‘CEO’) was comprehensively benchmarked at the end of 2017. The Committee concluded that a 5% increase to the basic salary of the CEO was appropriate at this stage and will continue to conduct this exercise on a regular basis in order to ensure that the Company is paying market rates that attract and retain key personnel.
The Company contributes to money purchase pension arrangements on behalf of staff on a matched basis subject to an overall cap. This cap has been increased for 2018 to 11% (2017: 10%) for the CEO and 7% (2017: 5%) for all other staff. In addition, the Company has introduced a private health insurance scheme on behalf of all staff.
The fees for the Chairman and the Non-Executive Directors were re-assessed at the beginning of 2017 and will remain unchanged. They will be reviewed again with effect from January 1, 2019.
In terms of short-term incentives, the CEO and the CEO’s direct senior reports have individually crafted bonus objectives which were agreed for the 2017 financial year. The bonus award criteria relate to a series of agreed corporate and personal performance targets which are scored out of a total of 100 points. The criteria have been amended from those of 2016 both in recognition of the changed circumstances of the Company and to introduce more precision to the link between the real ‘stretch-performance’ targets and favourable outcomes for the Company. This score is then applied to a maximum bonus calculated as a percentage of total salary as outlined on page 60.
The CEO was awarded a bonus of £256,680 under the bonus criteria matrix or 71.3% of the total potential award.
The Value Creation Plan ('VCP') is a major plank in our overall remuneration strategy and is a long-term incentive plan which provides awards of shares (in the form of nil cost share options) at the end of five years to the CEO and to senior executives for increases in TSR at rates above 7% per annum. The VCP is designed to support the Company’s growth strategy by providing incentives aligned with shareholder interests. The changes made to the VCP at the 2016 AGM extended the term of the plan such that there are still four years remaining before management’s performance will be assessed against TSR. The Committee continues to believe this is an effective plan to incentivise its participants and to encourage the retention of key employees by giving them an opportunity to share in the growth of the Company over the long term. The 2016 awards which were also approved at the 2016 AGM were granted in the year, following the end of a closed period. Further details can be found in the Remuneration Policy part of this report.
The Unapproved Share Option Plan (‘USOP’) approved by shareholders at the 2016 AGM was established to provide the Group additional scope to incentivise employees, particularly those who do not participate in the VCP, over and above the limit of the Company Share Ownership Plan. The first grant of awards under the USOP occurred during the year and did not include any participation by the Executive or Non-Executive Directors. Further details can be found in note 28.
The main objectives for the Remuneration Committee in 2018 will be to:
• Review and further tailor the senior executive bonus criteria for the 2018 financial year; and
• Maintain an ongoing review of and determine the most appropriate balance between, salary and bonus for the senior executive.
More detail is provided in the body of the Remuneration Report and the Remuneration Committee trusts you will endorse the resolution to approve this report at the forthcoming AGM.
Yours sincerely
W.M BlythChairman of the Remuneration Committee March 27, 2018
DIRECTORS’ REMUNERATION REPORT
APG_AR17_04.04.18_MIDDLE_AMENDS
53ANGLO PACIFIC GROUP PLC ANNUAL REPORT & ACCOUNTS 2017G
RO
UP O
VER
VIE
W S
TRATEG
IC R
EPO
RT G
OV
ER
NA
NC
E FIN
AN
CIA
L STATEM
ENTS O
THER
INFO
RM
ATION
The remuneration report is in two parts.
The first part constitutes the ‘Remuneration Policy Report’ and sets out the remuneration strategy that the Company has applied following its approval by shareholders at the 2016 AGM. The approved policy can be found in the Report and Accounts for the year ended 31 December 2015 which can accessed via the Group’s website www.anglopacificgroup.com. The Policy is set out below for information only; the VCP Principal Terms and Conditions section has been updated to provide an overview of the key features of the plan. Other minor changes to the text of the Policy have been made, to reflect the fact that it has previously been approved by shareholders. It is structured in the following sections:
A. Strategic overview and policy drivers;
B. How the views of shareholders and employees have been taken into account;
C. The remuneration policy for Executive Directors;
D. Annual bonus – Choice of performance measures and approach to target-setting;
E. VCP – Principal Terms and Conditions and Reward Scenarios;
F. Reward scenarios;
G. Determinations to be made by and discretions available to the Committee;
H. Differences in remuneration policy for Executive Directors compared to other employees;
I. Approach towards appointment of new Executive Directors;
J. Service contracts and payments for loss of office;
K. Non-Executive Directors; and
L. Legacy arrangements
The second part, the Annual Remuneration Report for 2017, details the remuneration paid to Directors during 2017 with a comparison to the previous year. It will be put to an advisory shareholder vote at the 2018 AGM. It is structured as follows:
A. Single figure total remuneration
B. Annual bonus for the year ended December 31, 2017
C. Vesting of long-term incentive awards
D. Directors’ shareholding and share interests
E. Total pension entitlements
F. Loss of office payments
G. Percentage increase in the remuneration of the CEO
H. Total shareholder return
I. Total remuneration for the CEO over time
J. Relative importance of spend on pay
K. External directorships
L. 2018 salary review
M. Fees for the Chairman and Non-Executive Directors
N. Performance targets for the annual bonus and VCP awards granted in 2014 and beyond
O. Statement of shareholder voting
The information in sections A to G and I to M has been audited; the remaining sections are unaudited.
REMUNER ATION POLICY REPORT
A . Strategic overview and policy drivers
The foundations for our remuneration strategy were first enumerated in the 2013 Annual Report and Accounts, and largely continue to apply today. The strategy was, historically, based on the following Company specific elements, which continue to form the backdrop to the overall remuneration strategy:
• Long investment horizons; often there can be an interval of between two and 10 years before a royalty comes on stream and the royalty may continue to flow for 20 years or more. As business development is now focused on royalty acquisitions, incentives are heavily weighted towards longer-term performance.
• No comparable peer group, certainly in the UK, for the purposes of benchmarking Director performance. As a result, our incentive plans have been based on absolute performance rather than performance relative to other companies. A relative measure in relation to the VCP whereby the rewards for the holders of 2016 awards (granted in 2017) will only be earned should the Company’s share price performance match or exceed the performance of the FTSE 350 All Mining Index.
• A relatively high ratio between its market capitalisation (£276m at December 31, 2017) and the number of its employees (11, as at December 31, 2017, of whom one is an Executive Director). The investment team is relatively small and much of the Company’s royalty know-how rests with them. The risk to the business of losing these and other key employees is correspondingly significant, and we have traditionally regarded retention as an important objective of our remuneration strategy.
B. How the views of shareholders and employees have been taken into account
The Remuneration Committee has a policy of active engagement with shareholders on remuneration matters. The Remuneration Committee also considers shareholder feedback received in relation to the AGM each year. Details of votes cast for and against the resolution to approve last year’s remuneration report are provided in the Annual Remuneration Report. This feedback, plus any additional feedback received during any meetings from time to time, is then considered as part of the Company’s annual review of remuneration policy.
Non-Board employees are consulted individually on the executive remuneration policy to the extent that it impacts upon the structure and level of their own pay and bonuses.
DIRECTORS’ REMUNERATION REPORTcontinued
APG_AR17_04.04.18_MIDDLE_AMENDS
54 ANGLO PACIFIC GROUP PLC ANNUAL REPORT & ACCOUNTS 2017
G O V E R N A N C E
C. The remuneration policy for Executive Directors
The policy approved by shareholders at the 2016 AGM covers the three years 2016-2019 and was effective from May 10, 2016. The VCP, which was initially approved at the 2014 AGM and amended following shareholder approval at the 2016 AGM, remains in place. The Committee’s specific policy for each element of remuneration is as follows:
Element, purpose and link to strategy Operation Maximum
Salary
To recruit, retain and reward executives of a suitable calibre for the roles and duties required
Salaries are set with reference to individual performance, experience and responsibilities to reflect the market rate for the individual and their role, determined with reference to remuneration levels in companies of similar size and complexity, taking into account pay levels within the Company in general.
Salaries are reviewed annually. Increases for Executive Directors will normally be in line with those for the general workforce except where there is a change of role or responsibilities or in other exceptional circumstances.
There is no prescribed maximum annual increase.
Pension and benefits
To provide market competitive benefits
A Company contribution to a money purchase pension scheme, or a cash allowance in lieu of pension at the request of the individual. In addition to a death in service policy which the Company subscribes to, a private medical insurance scheme has now been introduced for all staff.
Executive Directors are entitled to 30 days’ leave.
Pension: 11% (2017: 10%) of salary.
Death in service policy: five times salary.
Annual bonus
To encourage and reward delivery of the Company’s operational objectives
The annual bonus will be paid wholly in cash with no deferred component, but with a provision for clawback.
Bonus payments are determined based on the achievement of a combination of corporate and personal performance targets. Both are expected to form a substantial part of the scorecard.
Corporate performance targets are agreed by the Board at the beginning of the year.
Personal performance targets are agreed with the Chairman and the Committee.
The Committee will use a balanced scorecard approach to assess performance against targets at the end of the year.
The targets are discussed more fully in section D overleaf.
The maximum annual bonus opportunity is 100% of salary.
Long-term incentives
To encourage and reward delivery of the Company’s strategic objectives and provide alignment with shareholders through the use of shares and incentivise retention of key personnel
The LTIP takes the form of a Value Creation Plan (VCP) with a performance period to June 16, 2021.
Awards that were granted in 2014 were amended in 2016 with a performance period of seven years to June 16, 2021 and are subject to the following performance condition:
• Minimum growth in TSR of 7% per annum, with growth measured over the seven-year period
2016 awards (granted in 2017) have a performance period to June 16, 2021 and will be subject to two TSR performance conditions:
• Minimum growth in TSR of 7% per annum, with growth measured from a premium to the market capitalisation based on the net asset value per share as at December 31, 2015.
• A relative measure of TSR which requires median performance compared to a comparator group
For participants with 2014 and 2016 awards, the 2016 awards will accrue at a lower level once the 2014 awards reach the threshold growth of 7% per annum.
The detailed design is discussed in section E overleaf.
The maximum number of shares that can be awarded under the option grants equates to 7.5% of the Company’s issued share capital as at the end of the measurement period.
In 2016, the Committee allocated the pool as follows (and granted to participants in 2017):
CEO 20.0%
Non-Board senior managers 4.0%
Unallocated reserve: 13.1%
In 2014, the Committee allocated the pool as follows:
CEO 56.0%
Non-Board senior managers 6.9%
The potential rewards achievable by Executive Directors under the remuneration policy are illustrated at section F. The policy in respect of any future Director appointments is discussed at section I below.
D. Annual bonus – Choice of performance measures and approach to target setting
Annual bonuses are based on a scorecard of performance during the calendar year. The scorecard sets challenging targets for triggering bonus, and for rewarding outperformance on a sliding scale. The scorecard will be split between corporate objectives and personal objectives, both of which are expected to form a substantial part of the scorecard.
APG_AR17_04.04.18_MIDDLE_AMENDS
55ANGLO PACIFIC GROUP PLC ANNUAL REPORT & ACCOUNTS 2017G
RO
UP O
VER
VIE
W S
TRATEG
IC R
EPO
RT G
OV
ER
NA
NC
E FIN
AN
CIA
L STATEM
ENTS O
THER
INFO
RM
ATION
The corporate objectives are agreed by the Board at the beginning of each year, together with an assessment of the potential for outperformance and the risk of shortfall. This covers such areas as business performance, finance, relationships and reputation. This constitutes the criteria for triggering a bonus and for assessing the levels of challenge and outperformance that would warrant higher levels of bonus. The CEO’s personal objectives for the year are agreed at the beginning of the year by the Chairman of the Board in conjunction with the Committee. The personal objectives focus on the required contribution of the individual Executive Director to the achievement of the Company’s objectives for the year, but also on important but less measurable aspects such as leadership, building personal and team relationships, and the extent to which they personally have ‘gone the extra mile’.
The CEO’s performance against corporate and personal objectives is assessed by the Chairman and the Committee at the beginning of the following year, and bonus is awarded on the basis of the agreed criteria.
E . LTIP – Principal terms and conditions and reward scenarios
The LTIP takes the form of a Value Creation Plan (VCP). The key features of the VCP are as follows:
Key features:
• Eligibility – All employees are eligible to participate in the VCP, although participation has been limited to the Executive Directors together with other non-Board members of the senior management team at the discretion of the Committee acting in consultation with the CEO.
• Alignment with Shareholders – No value accrues under the VCP to its participants unless growth in the Company’s TSR over the performance period is at least equal to 7% growth per annum.
• Reward pool cap – The maximum number of shares to be awarded under the VCP option grants will not be capable of exceeding such number equating to 7.5% of the Company’s issued share capital as at the end of the measurement period. This provides an effective cap of total growth in TSR above 300%.
Two sets of awards have been made under the VCP:
• 2014 awards, which were modified in 2016; and
• 2016 awards, which used the units from the unallocated pool and were granted in 2017.
Both the modification of the 2014 awards and the new 2016 awards were approved by shareholders at the 2016 AGM.
2014 Awards 2016 Awards
Performance period
Seven-year performance period, ending on June 16, 2021. Performance is measured from the net asset value as at December 31, 2015 to June 16, 2021.
Allocation of the pool*
CEO: 56%
Non-Board Senior Managers: 6.9%
Total Allocated: 62.9%
CEO: 20%
Non-Board Senior Managers: 4.0%
Total Allocated: 24.0%
Operation Subject to threshold growth of 7% per annum, participants become entitled to receive nil or nominal cost options over ordinary shares in the capital of the Company, subject to the cap.
The number of options is set by reference to a share of a pool value equal to 10% of the growth in the Company’s TSR over the seven-year period or, if less, 50% of the growth in the Company’s TSR over the seven-year period in excess of the threshold growth.
This will mean that, if the total growth in TSR over the seven-year period is:
• below approximately 61%, no value accrues;
• between approximately 61% and 76%, the value that accrues is equal to 50% of the growth in the Company’s TSR over the seven-year period in excess of the threshold growth; and
• between 76% and the 300% effective cap, the value that accrues is equal to 10% of the growth in the Company’s TSR over a seven-year period.
This pool value is adjusted to reflect the percentage of the pool allocated to these awards (62.9% of the total).
Subject to a threshold growth of 7% per annum over £161.3m, participants become entitled to receive nil or nominal cost options over ordinary shares in the capital of the Company, subject to the cap. £161.3m was the net asset value at December 31, 2015 and a premium of approximately 61% to the market capitalisation on the same date.
The number of options is set by reference to a share of a pool value equal to 10% of the growth in the Company’s TSR over the five-year period. There is no “catch-up” once the threshold growth is achieved.
This means that if the total growth in TSR is:
• below approximately 40%, no value accrues;
• above approximately 40%, the value that accrues is equal to 10% of the growth in the Company’s TSR over 94.9p per share over the performance period.
This pool value is adjusted to reflect the percentage of the pool allocated to these awards (37.1% of the total, when including the unallocated reserve).
In addition, a relative measure of TSR ensures it is at least equal to the movement in the index of the FTSE 350 Mining Index. In the event that the increase in TSR does not equal or exceed the aforementioned index, no value will accrue to the new awards.
Pay-outs to the CEO and other participants who have 2014 awards will accrue at a lower level based on the outcome of the awards currently allocated. Once the share price reaches the threshold at which value accrues under the 2014 awards, value accrues on only half of the units under the 2017 awards held by the CEO and any non-Board members of the senior management team who have an existing award.
DIRECTORS’ REMUNERATION REPORTcontinued
APG_AR17_04.04.18_MIDDLE_AMENDS
56 ANGLO PACIFIC GROUP PLC ANNUAL REPORT & ACCOUNTS 2017
G O V E R N A N C E
Vesting Options to which participants become entitled at the end of the relevant performance period ending on June 16, 2021 will become exercisable as follows:
• One-third immediately;
• One-third after 12 months;
• One-third after 24 months
Maximum value
The maximum value that can accrue for the full award pool (which includes both the 2014 and the 2017 awards) is capped at 7.5% of the Company’s issued share capital as at the end of the measurement period.
* Unallocated reserve: 13.1%
Illustrative returns
The following table illustrates the potential return for the CEO and other participants and shareholders for various levels of growth in TSR over the performance period to June 16, 2021:
Benefit assuming total growth in TSR (from an illustrative starting market capitalisation plus capital inflows of £262.1m) over a seven-year period of:
Allocation of pool 50% 76%* 100% 150%**
CEO – 2014 award 56% £0.0m £10.6m £13.9m £20.8m
CEO – 2016 award 20% £2.3m £3.2m £3.8m £5.0m
CEO Total 76% £2.3m £13.8m £17.7m £25.8m
Others – 2014 award 6.9% £0.0m £1.3m £1.7m £2.6m
Others – 2016 award 4% £0.5m £0.7m £0.9m £1.3m
Unallocated 13.1% £1.5m £2.3m £3m £4.4m
Overall Total 100% £4.27m £18.07m £23.24m £34.14m
Shareholders £119.73m £170.91m £224.76m £337.86m
*Approximately 76% growth in TSR over the seven-year period results in a total pool equal to 9.3% of the growth. This reflects a pool equal to 10% for the original awards and a pool for the new awards which reflects the reduction in the value that accrues for participants with original awards once the threshold growth of 7% per annum is met.
**At the effective cap of total growth in TSR of 300% over the period, the benefit to shareholders would be £677.20m and total participant awards would be £66.80m, of which the CEO would receive £41.7m under the 2014 award and £8.7m under the 2016 award.
TSR performance must match or exceed the performance of the FTSE 350 All Mining Index for new awards to payout. Awards in the table are calculated from the respective starting market capitalisations (Illustrative starting market capitalisation of £248.0m for original awards and £161.3m for new awards (based on the net asset value as at December 31, 2015)).
F. Reward scenarios
The Company’s policy results in a significant portion of remuneration received by the CEO being dependent on Company performance. The chart below illustrates how the total pay opportunity for the CEO varies under three different performance scenarios: below target (fixed pay only), on-target and maximum. This chart is indicative as share price movement and dividend accrual have been excluded. All assumptions made are noted below the chart.
Below target and on-target do not include any VCP vesting and simply allow for salary and pension for the below target level with a bonus award included at the on-target level. The maximum level includes the fair value of the VCP assuming outperformance of the FTSE 350 Mining Index is achieved. To aid comparability with standard LTIP structures, the chart reflects the total pay opportunity if the VCP (both the 2014 awards and the 2016 awards) is included on an annualised basis.
£0 £200,000 £400,000 £600,000 £800,000 £1,000,000 1200000 1400000 1600000
100%
69%
44%
£396,000
£576,000
£897,835
31%
40% 16%
BelowTarget
On-Target
Maximum
Fixed Pay Annual Bonus LTIP
APG_AR17_04.04.18_MIDDLE_AMENDS
57ANGLO PACIFIC GROUP PLC ANNUAL REPORT & ACCOUNTS 2017G
RO
UP O
VER
VIE
W S
TRATEG
IC R
EPO
RT G
OV
ER
NA
NC
E FIN
AN
CIA
L STATEM
ENTS O
THER
INFO
RM
ATION
Assumptions:
• Below Target = fixed pay only (salary + benefits + pension);
• On-target = fixed pay, 50% vesting of the annual bonus and 0% of the VCP awards (i.e. the value that accrues for threshold performance);
• Maximum (2014 and 2016 VCP awards included on an annualised basis) = fixed pay and 100% vesting of the annual bonus and annualised 2014 and 2016 VCP awards, granted in 2017. The annualised value reflects a seven-year performance period of the 2014 award and five-year performance period of the 2016 award;
• Salary levels (on which other elements of the package are calculated) are based on those which apply from January 1, 2018. Salary for the CEO is 90% of his full time equivalent salary. The CEO does not receive any taxable benefits; and
• The fair value of the VCP has been calculated using a stochastic model as at the date of grant (or in the case of the 2014 awards, the date of modification). The model projects the share price of Anglo Pacific using the historical volatility of the Company (whilst past behaviour is not always a good indicator of movements in the future, it is difficult to determine a more accurate method). For each simulation the resulting share price and thus payout is determined. The fair value is the average of 100,000 possible simulations.
G. Determinations to be made by and discretions available to the Committee
The Committee operates the Group’s variable incentive plans according to their respective rules and in accordance with HMRC rules where relevant. To ensure the efficient administration of these plans, the Committee will be required to make determinations and apply certain operational discretions. These include the following:
• selecting the participants in the plans on an annual basis;
• determining the timing of grants of awards and/or payment;
• adjusting basic salaries for changes in time commitment (within the full-time equivalent levels set out in this policy);
• determining the quantum of awards and/or payments (within the limits set out in the policy table above);
• determining the extent of vesting based on the assessment of performance;
• making the appropriate adjustments required in certain circumstances (e.g. change of control, variation of share capital including rights issues and corporate restructuring events, and special dividends);
• determining ‘good leaver’ status for incentive plan purposes and applying the appropriate treatment; and
• undertaking the annual review of weighting of performance measures, and setting targets for the annual bonus plan from year-to-year.
If an event occurs which results in the annual bonus plan or long-term incentive performance conditions and/or targets being deemed no longer appropriate (e.g. a material acquisition or divestment), the Committee will have the ability to adjust appropriately the measures and/or targets and alter weightings, provided that the revised conditions or targets are not materially less difficult to satisfy.
H. Differences in remuneration policy for Executive Directors compared to other employees
The Committee aims to ensure, over time, a proper differential between the level of the remuneration of Executive Directors and other employees, but also appropriate differences in the structure of remuneration to reflect different levels of responsibility and planning horizons of employees across the Company.
The remuneration framework of non-Board employees was reviewed during 2017 and will continue to be reviewed going forward. There are currently three main differences to the remuneration framework:
• the Committee will continue to reserve access to the VCP to the most senior executives who have the greatest potential to influence the Company’s long-term performance; and
• the Executive Directors will receive any annual bonus wholly in cash because of the large potential shareholding offered by the VCP; but
• in order to encourage employees without access (or with less access) to the VCP to build up a shareholding in the Company, consideration will be given to either including a share component in any annual bonuses awarded to non-Board employees and continuing to offer them options pursuant to the CSOP or the USOP, or a combination of the two.
I . Approach to appointment of new Executive Directors
The remuneration package for a new Executive Director would be set in accordance with the terms of the Company’s approved remuneration policy in force at the time of appointment. Currently, for an Executive Director, this would include a potential annual bonus of no more than 100%. There is also provision within the VCP arrangements for the Committee to dilute the pool by an additional 10% for new appointees.
The salary for a new Executive Director may be set below the normal market rate, with phased increases following an initial probationary period and over the first few years as the executive gains experience in their new role. The Committee may offer new appointees additional cash and/or share-based elements when it considers these to be in the best interests of the Company and its shareholders, including the use of awards made under 9.4.2 of the Listing Rules. Such payments would take account of remuneration relinquished when leaving the former employer and would reflect (as far as practicable) the nature and time horizons attaching to that remuneration and the impact of any performance conditions. Shareholders will be informed of any such payments at the time of appointment.
For an internal Executive Director appointment, any variable pay element awarded in respect of the prior role will be allowed to pay out according to its terms, adjusted as relevant to take into account the appointment. In addition, any other ongoing remuneration obligations existing prior to appointment may continue, provided that they are put to shareholders for approval at the earliest opportunity.
For external Executive Director appointments, the Committee may agree that the Company will meet certain relocation expenses as appropriate.
For the appointment of a new Chairman or Non-Executive Director, the fee arrangement would be set in accordance with the approved remuneration policy in force at that time.
DIRECTORS’ REMUNERATION REPORTcontinued
APG_AR17_04.04.18_MIDDLE_AMENDS
58 ANGLO PACIFIC GROUP PLC ANNUAL REPORT & ACCOUNTS 2017
G O V E R N A N C E

J . Service contracts and payments for loss of off ice
The Committee, together with the Nomination Committee, reviews the contractual terms for new Executive Directors to ensure that these reflect best practice.
The current Executive Director’s service contract is for an indefinite term and contains a notice period of six months, which is in line with the Company’s continuing policy that service contracts should not have a notice period of more than one year.
The service contracts contain provision for early termination. A Director’s service contract may be terminated without notice and without any further payment or compensation, except for sums accrued up to the date of termination, on the occurrence of certain events such as gross misconduct. If the employing company terminates the employment of an Executive Director in other circumstances, compensation is limited to salary due for any unexpired notice period and any amount assessed by the Committee as representing the value of other contractual benefits (including pension) which would have been received during the period. Payments in lieu of notice are not pensionable. The service contract of Mr. Treger provides for a six-month notice period and an additional termination payment equivalent to six months’ basic salary. In the event of a change of control of the Company there is no enhancement to contractual terms. The service contract of the Executive Director is available for inspection at the Company’s registered office.
In summary, the contractual provisions for Executive Directors are as follows:
Provision Detailed terms
Notice period One year or less.
Termination payment Basic salary plus benefits (including pension), paid monthly and subject to mitigation.
In addition, any statutory entitlements or sums to settle or compromise claims in connection with the termination would be paid as necessary.
Additional termination payment to bring the total payment to the equivalent of 12 months’ basic salary.
Remuneration entitlements A pro-rata bonus may also become payable for the period of active service along with vesting for outstanding share awards (in certain circumstances – see below).
In all cases performance targets would apply.
Change of control There are no enhanced terms in relation to a change of control.
Any share-based entitlements granted to an Executive Director under the VCP will be determined based on the plan rules. The default treatment is that any outstanding unvested awards lapse on cessation of employment. However, in certain prescribed circumstances, such as death, disability, retirement or other circumstances at the discretion of the Committee (taking into account the individual’s performance and the reasons for their departure) ‘good leaver’ status can be applied. For good leavers, the unvested awards remain subject to performance conditions (measured over the original time period) and are reduced pro-rata in size to reflect the proportion of the performance period actually served. The Committee has the discretion to disapply time pro-rating if it considers it appropriate to do so. In determining whether an executive should be treated as a good leaver or not, the Committee will take into account the performance of the individual and the reasons for their departure.
K. Non-Executive Directors
The Company aims to attract and retain a high-calibre Non-Executive Chairman and Non-Executive Directors by offering a market competitive fee level.
The Committee’s specific policy is as follows:
Element, purpose and link to strategy Operation Maximum
Board fees
Attract, retain and fairly reward high calibre individuals
Fees are currently paid in cash. Non-Executive Directors are not eligible to participate in the Company’s annual performance related incentive schemes, share option schemes or pension scheme.
The Chairman is paid a single fee for all his responsibilities. The Non-Executive Directors are paid a basic fee. Additional fees are paid to Chairmen and members of the main Board Committees and to the SID to reflect their extra responsibilities.
Fees are reviewed by the Board taking into account individual responsibilities, factors such as Committee Chairmanships, time commitment, other pay increases being made to employees in the Company, and fees payable for the equivalent role in comparable companies.
Normally fees are reviewed biennially and fee increases are generally effective from annual re-election after the AGM.
The Board may adjust the fees for an individual Non-Executive Director during the intervening period if there is a significant change in their responsibilities and/or time commitments.
Current fee levels are set out in the Annual Report on Remuneration.
Overall fee limit will be within the £600,000 limit set out in the Company’s Articles of Association.
Mr. Meier, Mr. Archer, Mr. Blyth, Ms. Rhodes and Mr. Stan were appointed for an initial three-year term, renewable at the Board’s discretion for up to two further three-year periods thereafter and the Board intends that all future Non-Executive Directors’ appointments will be on similar terms. None of the letters of appointment have provisions that relate to a change of control of the Company.
APG_AR17_04.04.18_MIDDLE_AMENDS
59ANGLO PACIFIC GROUP PLC ANNUAL REPORT & ACCOUNTS 2017G
RO
UP O
VER
VIE
W S
TRATEG
IC R
EPO
RT G
OV
ER
NA
NC
E FIN
AN
CIA
L STATEM
ENTS O
THER
INFO
RM
ATION
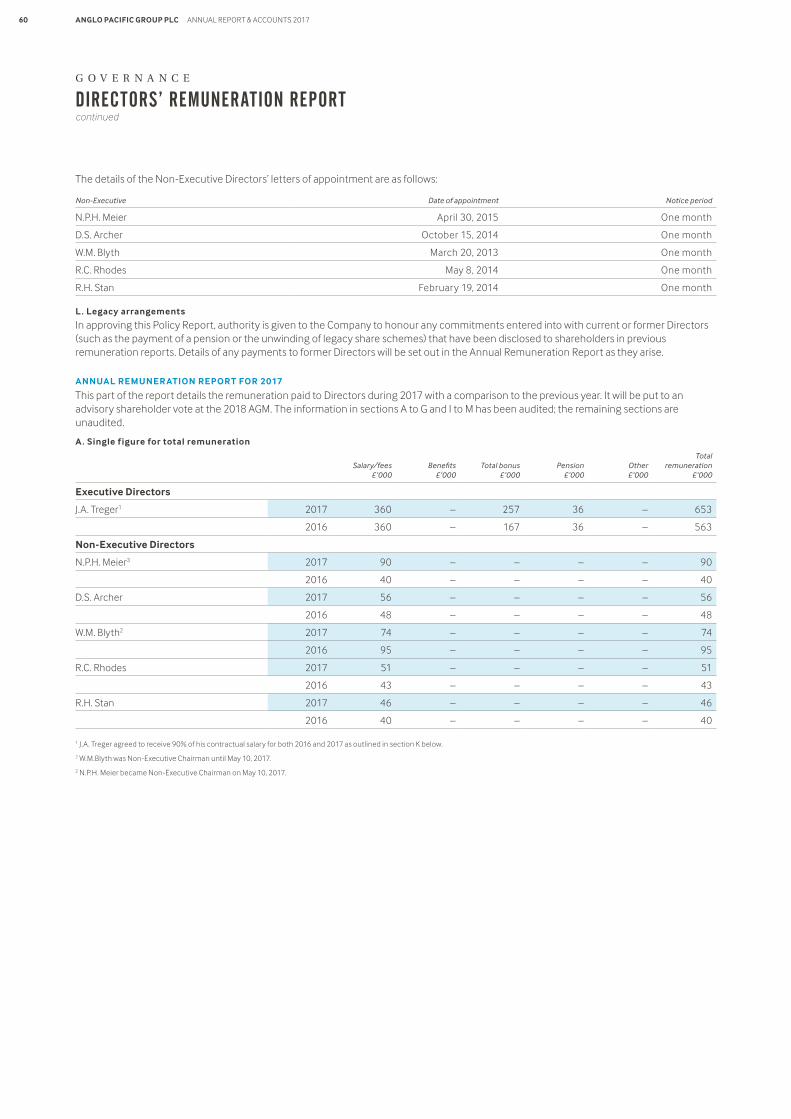
The details of the Non-Executive Directors’ letters of appointment are as follows:
Non-Executive Date of appointment Notice period
N.P.H. Meier April 30, 2015 One month
D.S. Archer October 15, 2014 One month
W.M. Blyth March 20, 2013 One month
R.C. Rhodes May 8, 2014 One month
R.H. Stan February 19, 2014 One month
L . Legacy arrangements
In approving this Policy Report, authority is given to the Company to honour any commitments entered into with current or former Directors (such as the payment of a pension or the unwinding of legacy share schemes) that have been disclosed to shareholders in previous remuneration reports. Details of any payments to former Directors will be set out in the Annual Remuneration Report as they arise.
ANNUAL REMUNER ATION REPORT FOR 2017
This part of the report details the remuneration paid to Directors during 2017 with a comparison to the previous year. It will be put to an advisory shareholder vote at the 2018 AGM. The information in sections A to G and I to M has been audited; the remaining sections are unaudited.
A . Single f igure for total remuneration
Salary/fees £’000
Benefits £’000
Total bonus £’000
Pension £’000
Other £’000
Total remuneration
£’000
Executive Directors
J.A. Treger1 2017 360 – 257 36 – 653
2016 360 – 167 36 – 563
Non-Executive Directors
N.P.H. Meier3 2017 90 – – – – 90
2016 40 – – – – 40
D.S. Archer 2017 56 – – – – 56
2016 48 – – – – 48
W.M. Blyth2 2017 74 – – – – 74
2016 95 – – – – 95
R.C. Rhodes 2017 51 – – – – 51
2016 43 – – – – 43
R.H. Stan 2017 46 – – – – 46
2016 40 – – – – 40
1 J.A. Treger agreed to receive 90% of his contractual salary for both 2016 and 2017 as outlined in section K below.
2 W.M.Blyth was Non-Executive Chairman until May 10, 2017.
2 N.P.H. Meier became Non-Executive Chairman on May 10, 2017.
DIRECTORS’ REMUNERATION REPORTcontinued
APG_AR17_04.04.18_MIDDLE_AMENDS
60 ANGLO PACIFIC GROUP PLC ANNUAL REPORT & ACCOUNTS 2017
G O V E R N A N C E
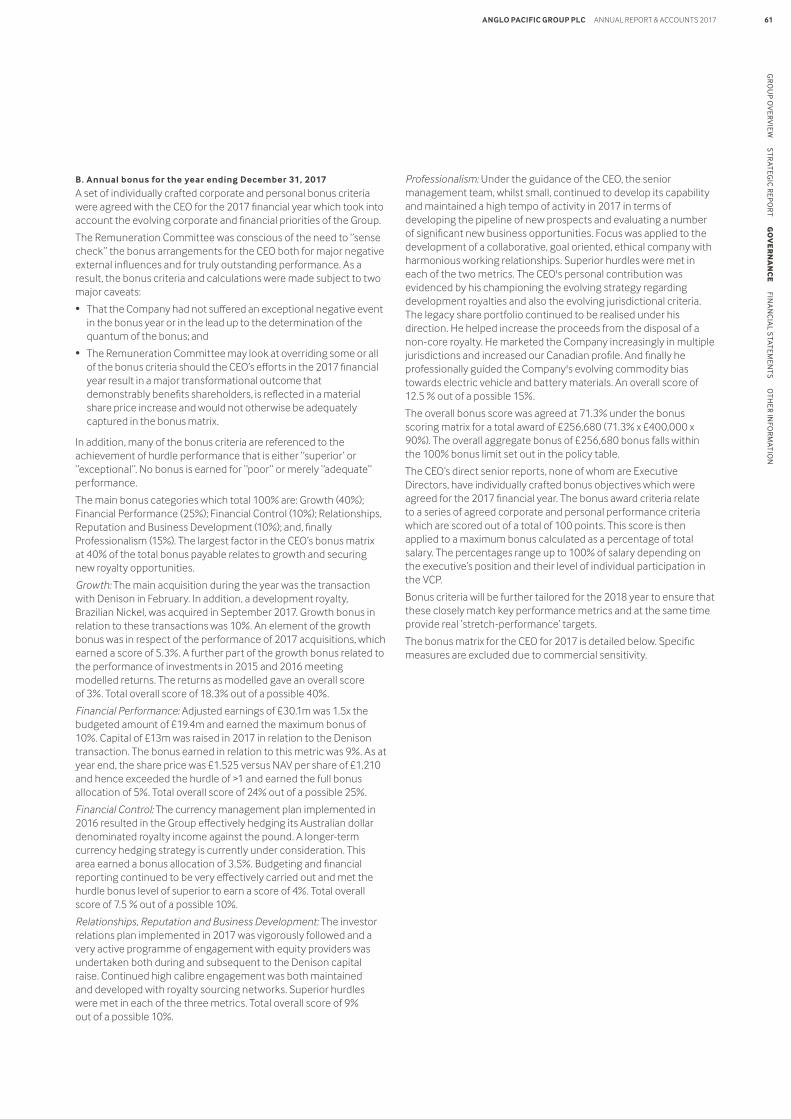
B. Annual bonus for the year ending December 31, 2017
A set of individually crafted corporate and personal bonus criteria were agreed with the CEO for the 2017 financial year which took into account the evolving corporate and financial priorities of the Group.
The Remuneration Committee was conscious of the need to ‘ ’sense check’’ the bonus arrangements for the CEO both for major negative external influences and for truly outstanding performance. As a result, the bonus criteria and calculations were made subject to two major caveats:
• That the Company had not suffered an exceptional negative event in the bonus year or in the lead up to the determination of the quantum of the bonus; and
• The Remuneration Committee may look at overriding some or all of the bonus criteria should the CEO’s efforts in the 2017 financial year result in a major transformational outcome that demonstrably benefits shareholders, is reflected in a material share price increase and would not otherwise be adequately captured in the bonus matrix.
In addition, many of the bonus criteria are referenced to the achievement of hurdle performance that is either ‘ ’superior’ or ‘ ’exceptional’’. No bonus is earned for ‘ ’poor’’ or merely ‘ ’adequate’’ performance.
The main bonus categories which total 100% are: Growth (40%); Financial Performance (25%); Financial Control (10%); Relationships, Reputation and Business Development (10%); and, finally Professionalism (15%). The largest factor in the CEO’s bonus matrix at 40% of the total bonus payable relates to growth and securing new royalty opportunities.
Growth: The main acquisition during the year was the transaction with Denison in February. In addition, a development royalty, Brazilian Nickel, was acquired in September 2017. Growth bonus in relation to these transactions was 10%. An element of the growth bonus was in respect of the performance of 2017 acquisitions, which earned a score of 5.3%. A further part of the growth bonus related to the performance of investments in 2015 and 2016 meeting modelled returns. The returns as modelled gave an overall score of 3%. Total overall score of 18.3% out of a possible 40%.
Financial Performance: Adjusted earnings of £30.1m was 1.5x the budgeted amount of £19.4m and earned the maximum bonus of 10%. Capital of £13m was raised in 2017 in relation to the Denison transaction. The bonus earned in relation to this metric was 9%. As at year end, the share price was £1.525 versus NAV per share of £1.210 and hence exceeded the hurdle of >1 and earned the full bonus allocation of 5%. Total overall score of 24% out of a possible 25%.
Financial Control: The currency management plan implemented in 2016 resulted in the Group effectively hedging its Australian dollar denominated royalty income against the pound. A longer-term currency hedging strategy is currently under consideration. This area earned a bonus allocation of 3.5%. Budgeting and financial reporting continued to be very effectively carried out and met the hurdle bonus level of superior to earn a score of 4%. Total overall score of 7.5 % out of a possible 10%.
Relationships, Reputation and Business Development: The investor relations plan implemented in 2017 was vigorously followed and a very active programme of engagement with equity providers was undertaken both during and subsequent to the Denison capital raise. Continued high calibre engagement was both maintained and developed with royalty sourcing networks. Superior hurdles were met in each of the three metrics. Total overall score of 9% out of a possible 10%.
Professionalism: Under the guidance of the CEO, the senior management team, whilst small, continued to develop its capability and maintained a high tempo of activity in 2017 in terms of developing the pipeline of new prospects and evaluating a number of significant new business opportunities. Focus was applied to the development of a collaborative, goal oriented, ethical company with harmonious working relationships. Superior hurdles were met in each of the two metrics. The CEO's personal contribution was evidenced by his championing the evolving strategy regarding development royalties and also the evolving jurisdictional criteria. The legacy share portfolio continued to be realised under his direction. He helped increase the proceeds from the disposal of a non-core royalty. He marketed the Company increasingly in multiple jurisdictions and increased our Canadian profile. And finally he professionally guided the Company's evolving commodity bias towards electric vehicle and battery materials. An overall score of 12.5 % out of a possible 15%.
The overall bonus score was agreed at 71.3% under the bonus scoring matrix for a total award of £256,680 (71.3% x £400,000 x 90%). The overall aggregate bonus of £256,680 bonus falls within the 100% bonus limit set out in the policy table.
The CEO’s direct senior reports, none of whom are Executive Directors, have individually crafted bonus objectives which were agreed for the 2017 financial year. The bonus award criteria relate to a series of agreed corporate and personal performance criteria which are scored out of a total of 100 points. This score is then applied to a maximum bonus calculated as a percentage of total salary. The percentages range up to 100% of salary depending on the executive’s position and their level of individual participation in the VCP.
Bonus criteria will be further tailored for the 2018 year to ensure that these closely match key performance metrics and at the same time provide real ‘stretch-performance’ targets.
The bonus matrix for the CEO for 2017 is detailed below. Specific measures are excluded due to commercial sensitivity.
APG_AR17_04.04.18_MIDDLE_AMENDS
61ANGLO PACIFIC GROUP PLC ANNUAL REPORT & ACCOUNTS 2017G
RO
UP O
VER
VIE
W S
TRATEG
IC R
EPO
RT G
OV
ER
NA
NC
E FIN
AN
CIA
L STATEM
ENTS O
THER
INFO
RM
ATION
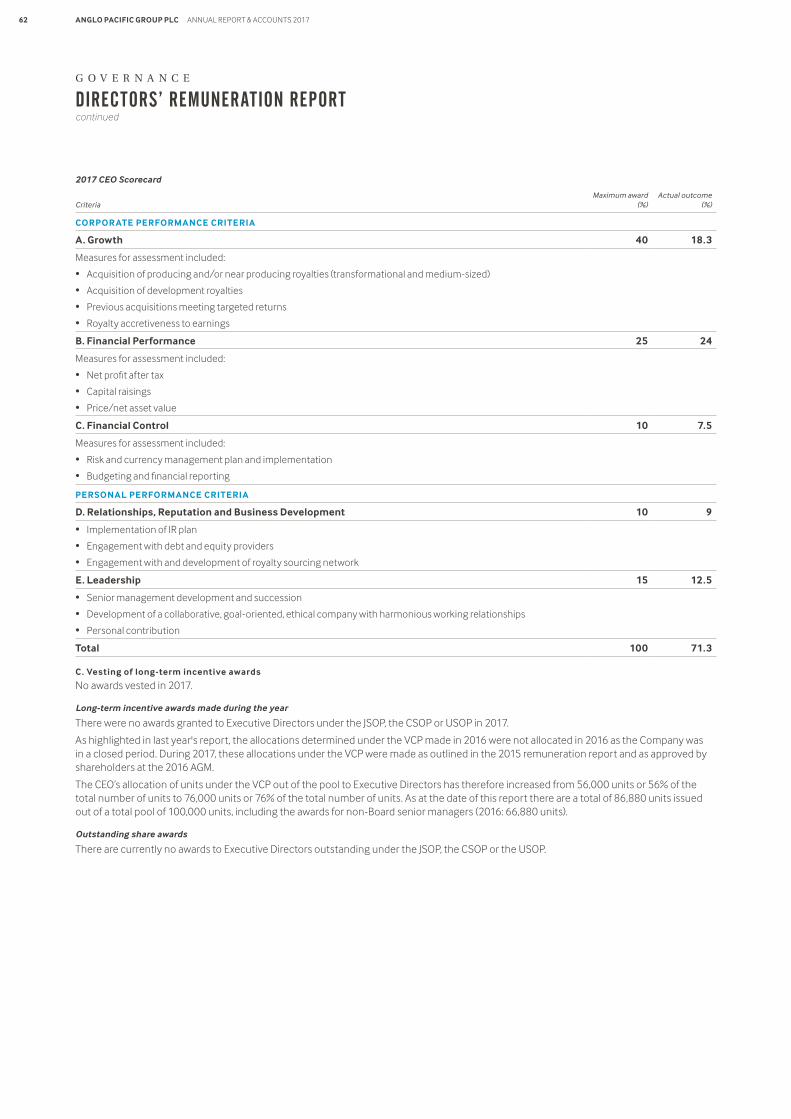
2017 CEO Scorecard
CriteriaMaximum award
(%)Actual outcome
(%)
CORPOR ATE PERFORMANCE CRITERIA
A. Growth 40 18.3
Measures for assessment included:
• Acquisition of producing and/or near producing royalties (transformational and medium-sized)
• Acquisition of development royalties
• Previous acquisitions meeting targeted returns
• Royalty accretiveness to earnings
B. Financial Performance 25 24
Measures for assessment included:
• Net profit after tax
• Capital raisings
• Price/net asset value
C. Financial Control 10 7.5
Measures for assessment included:
• Risk and currency management plan and implementation
• Budgeting and financial reporting
PERSONAL PERFORMANCE CRITERIA
D. Relationships, Reputation and Business Development 10 9
• Implementation of IR plan
• Engagement with debt and equity providers
• Engagement with and development of royalty sourcing network
E. Leadership 15 12.5
• Senior management development and succession
• Development of a collaborative, goal-oriented, ethical company with harmonious working relationships
• Personal contribution
Total 100 71.3
C. Vesting of long-term incentive awards
No awards vested in 2017.
Long-term incentive awards made during the year
There were no awards granted to Executive Directors under the JSOP, the CSOP or USOP in 2017.
As highlighted in last year's report, the allocations determined under the VCP made in 2016 were not allocated in 2016 as the Company was in a closed period. During 2017, these allocations under the VCP were made as outlined in the 2015 remuneration report and as approved by shareholders at the 2016 AGM.
The CEO’s allocation of units under the VCP out of the pool to Executive Directors has therefore increased from 56,000 units or 56% of the total number of units to 76,000 units or 76% of the total number of units. As at the date of this report there are a total of 86,880 units issued out of a total pool of 100,000 units, including the awards for non-Board senior managers (2016: 66,880 units).
Outstanding share awards
There are currently no awards to Executive Directors outstanding under the JSOP, the CSOP or the USOP.
DIRECTORS’ REMUNERATION REPORTcontinued
APG_AR17_04.04.18_MIDDLE_AMENDS
62 ANGLO PACIFIC GROUP PLC ANNUAL REPORT & ACCOUNTS 2017
G O V E R N A N C E
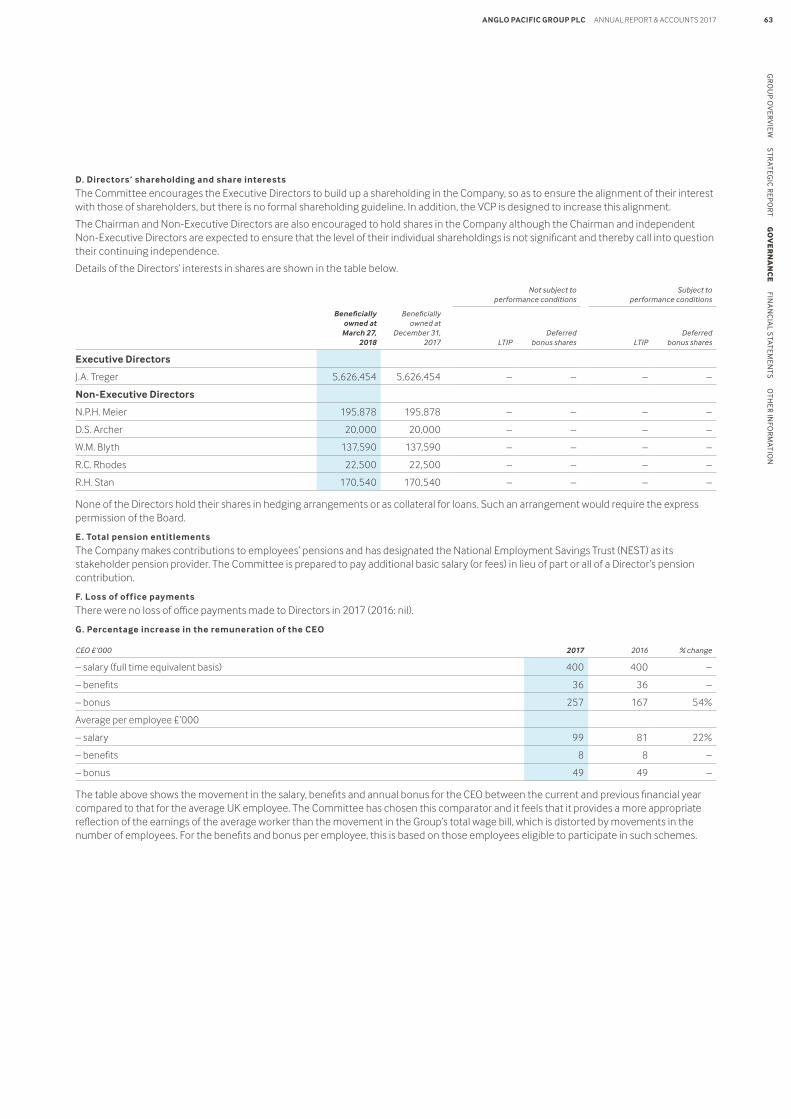
D. Directors’ shareholding and share interests
The Committee encourages the Executive Directors to build up a shareholding in the Company, so as to ensure the alignment of their interest with those of shareholders, but there is no formal shareholding guideline. In addition, the VCP is designed to increase this alignment.
The Chairman and Non-Executive Directors are also encouraged to hold shares in the Company although the Chairman and independent Non-Executive Directors are expected to ensure that the level of their individual shareholdings is not significant and thereby call into question their continuing independence.
Details of the Directors’ interests in shares are shown in the table below.
Not subject to performance conditions
Subject to performance conditions
Beneficially owned at
March 27, 2018
Beneficially owned at
December 31, 2017 LTIP
Deferred bonus shares LTIP
Deferred bonus shares
Executive Directors
J.A. Treger 5,626,454 5,626,454 – – – –
Non-Executive Directors
N.P.H. Meier 195,878 195,878 – – – –
D.S. Archer 20,000 20,000 – – – –
W.M. Blyth 137,590 137,590 – – – –
R.C. Rhodes 22,500 22,500 – – – –
R.H. Stan 170,540 170,540 – – – –
None of the Directors hold their shares in hedging arrangements or as collateral for loans. Such an arrangement would require the express permission of the Board.
E . Total pension entitlements
The Company makes contributions to employees’ pensions and has designated the National Employment Savings Trust (NEST) as its stakeholder pension provider. The Committee is prepared to pay additional basic salary (or fees) in lieu of part or all of a Director’s pension contribution.
F. Loss of off ice payments
There were no loss of office payments made to Directors in 2017 (2016: nil).
G. Percentage increase in the remuneration of the CEO
CEO £’000 2017 2016 % change
– salary (full time equivalent basis) 400 400 –
– benefits 36 36 –
– bonus 257 167 54%
Average per employee £’000
– salary 99 81 22%
– benefits 8 8 –
– bonus 49 49 –
The table above shows the movement in the salary, benefits and annual bonus for the CEO between the current and previous financial year compared to that for the average UK employee. The Committee has chosen this comparator and it feels that it provides a more appropriate reflection of the earnings of the average worker than the movement in the Group’s total wage bill, which is distorted by movements in the number of employees. For the benefits and bonus per employee, this is based on those employees eligible to participate in such schemes.
APG_AR17_04.04.18_MIDDLE_AMENDS
63ANGLO PACIFIC GROUP PLC ANNUAL REPORT & ACCOUNTS 2017G
RO
UP O
VER
VIE
W S
TRATEG
IC R
EPO
RT G
OV
ER
NA
NC
E FIN
AN
CIA
L STATEM
ENTS O
THER
INFO
RM
ATION
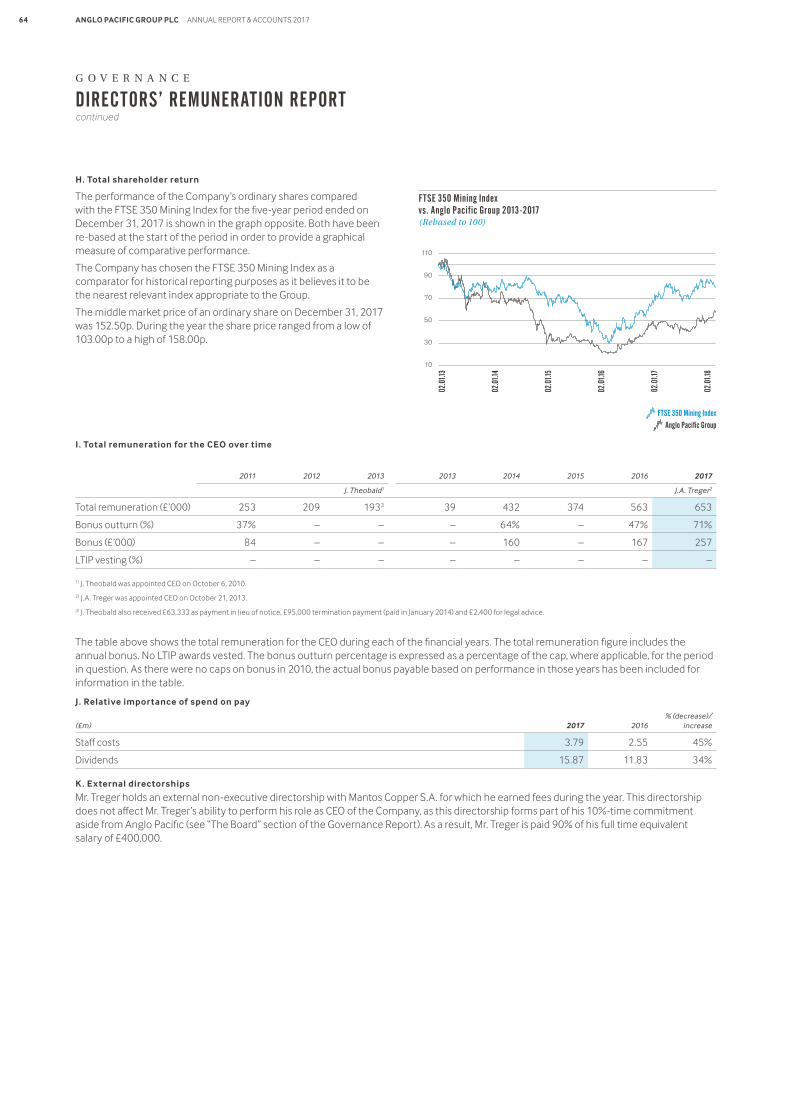
H. Total shareholder return
The performance of the Company’s ordinary shares compared with the FTSE 350 Mining Index for the five-year period ended on December 31, 2017 is shown in the graph opposite. Both have been re-based at the start of the period in order to provide a graphical measure of comparative performance.
The Company has chosen the FTSE 350 Mining Index as a comparator for historical reporting purposes as it believes it to be the nearest relevant index appropriate to the Group.
The middle market price of an ordinary share on December 31, 2017 was 152.50p. During the year the share price ranged from a low of 103.00p to a high of 158.00p.
I . Total remuneration for the CEO over time
2011 2012 2013 2013 2014 2015 2016 2017
J. Theobald1 J.A. Treger2
Total remuneration (£’000) 253 209 1933 39 432 374 563 653
Bonus outturn (%) 37% – – – 64% – 47% 71%
Bonus (£’000) 84 – – – 160 – 167 257
LTIP vesting (%) – – – – – – – –
1) J. Theobald was appointed CEO on October 6, 2010.
2) J.A. Treger was appointed CEO on October 21, 2013.
3) J. Theobald also received £63,333 as payment in lieu of notice, £95,000 termination payment (paid in January 2014) and £2,400 for legal advice.
The table above shows the total remuneration for the CEO during each of the financial years. The total remuneration figure includes the annual bonus. No LTIP awards vested. The bonus outturn percentage is expressed as a percentage of the cap, where applicable, for the period in question. As there were no caps on bonus in 2010, the actual bonus payable based on performance in those years has been included for information in the table.
J . Relative importance of spend on pay
(£m) 2017 2016% (decrease)/
increase
Staff costs 3.79 2.55 45%
Dividends 15.87 11.83 34%
K. External directorships
Mr. Treger holds an external non-executive directorship with Mantos Copper S.A. for which he earned fees during the year. This directorship does not affect Mr. Treger’s ability to perform his role as CEO of the Company, as this directorship forms part of his 10%-time commitment aside from Anglo Pacific (see “The Board” section of the Governance Report). As a result, Mr. Treger is paid 90% of his full time equivalent salary of £400,000.
FTSE 350 Mining Index vs. Anglo Pacific Group 2013-2017(Rebased to 100)
FTSE 350 Mining Index
Anglo Pacific Group
02.0
1.13
02.0
1.14
02.0
1.15
02.0
1.16
02.0
1.17
02.0
1.18
110
90
70
50
30
10
DIRECTORS’ REMUNERATION REPORTcontinued
APG_AR17_04.04.18_MIDDLE_AMENDS
64 ANGLO PACIFIC GROUP PLC ANNUAL REPORT & ACCOUNTS 2017
G O V E R N A N C E
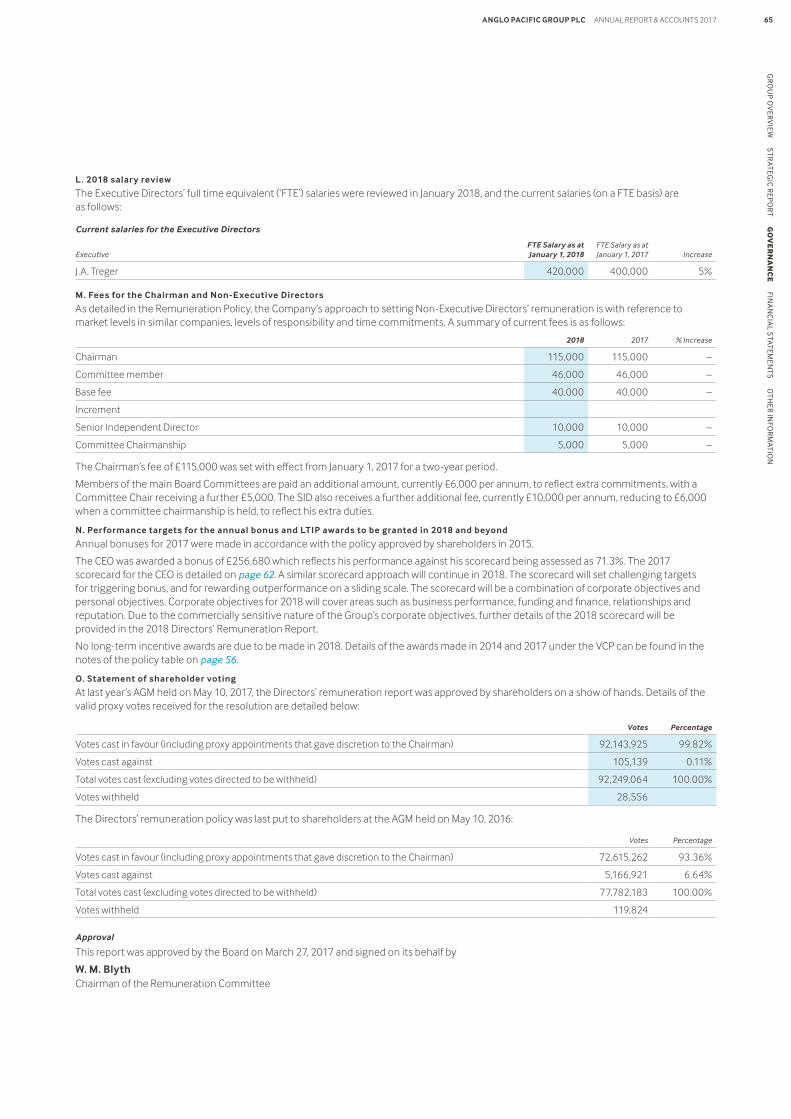
L . 2018 salary review
The Executive Directors’ full time equivalent (‘FTE’) salaries were reviewed in January 2018, and the current salaries (on a FTE basis) are as follows:
Current salaries for the Executive Directors
ExecutiveFTE Salary as at January 1, 2018
FTE Salary as at January 1, 2017 Increase
J.A. Treger 420,000 400,000 5%
M. Fees for the Chairman and Non-Executive Directors
As detailed in the Remuneration Policy, the Company’s approach to setting Non-Executive Directors’ remuneration is with reference to market levels in similar companies, levels of responsibility and time commitments. A summary of current fees is as follows:
2018 2017 % Increase
Chairman 115,000 115,000 –
Committee member 46,000 46,000 –
Base fee 40,000 40,000 –
Increment
Senior Independent Director 10,000 10,000 –
Committee Chairmanship 5,000 5,000 –
The Chairman’s fee of £115,000 was set with effect from January 1, 2017 for a two-year period.
Members of the main Board Committees are paid an additional amount, currently £6,000 per annum, to reflect extra commitments, with a Committee Chair receiving a further £5,000. The SID also receives a further additional fee, currently £10,000 per annum, reducing to £6,000 when a committee chairmanship is held, to reflect his extra duties.
N. Performance targets for the annual bonus and LTIP awards to be granted in 2018 and beyond
Annual bonuses for 2017 were made in accordance with the policy approved by shareholders in 2015.
The CEO was awarded a bonus of £256,680 which reflects his performance against his scorecard being assessed as 71.3%. The 2017 scorecard for the CEO is detailed on page 62. A similar scorecard approach will continue in 2018. The scorecard will set challenging targets for triggering bonus, and for rewarding outperformance on a sliding scale. The scorecard will be a combination of corporate objectives and personal objectives. Corporate objectives for 2018 will cover areas such as business performance, funding and finance, relationships and reputation. Due to the commercially sensitive nature of the Group’s corporate objectives, further details of the 2018 scorecard will be provided in the 2018 Directors’ Remuneration Report.
No long-term incentive awards are due to be made in 2018. Details of the awards made in 2014 and 2017 under the VCP can be found in the notes of the policy table on page 56.
O. Statement of shareholder voting
At last year’s AGM held on May 10, 2017, the Directors’ remuneration report was approved by shareholders on a show of hands. Details of the valid proxy votes received for the resolution are detailed below:
Votes Percentage
Votes cast in favour (including proxy appointments that gave discretion to the Chairman) 92,143,925 99.82%
Votes cast against 105,139 0.11%
Total votes cast (excluding votes directed to be withheld) 92,249,064 100.00%
Votes withheld 28,556
The Directors’ remuneration policy was last put to shareholders at the AGM held on May 10, 2016:
Votes Percentage
Votes cast in favour (including proxy appointments that gave discretion to the Chairman) 72,615,262 93.36%
Votes cast against 5,166,921 6.64%
Total votes cast (excluding votes directed to be withheld) 77,782,183 100.00%
Votes withheld 119,824
Approval
This report was approved by the Board on March 27, 2017 and signed on its behalf by
W. M. BlythChairman of the Remuneration Committee
APG_AR17_04.04.18_MIDDLE_AMENDS
65ANGLO PACIFIC GROUP PLC ANNUAL REPORT & ACCOUNTS 2017G
RO
UP O
VER
VIE
W S
TRATEG
IC R
EPO
RT G
OV
ER
NA
NC
E FIN
AN
CIA
L STATEM
ENTS O
THER
INFO
RM
ATION
DIRECTORS’ REPORT
The Directors present their report and audited consolidated financial statements for the year ended December 31, 2017.
PRINCIPAL ACTIVITIES
The Group’s principal royalty activities are set out in the Strategic Report on pages 25 and 36.
GOING CONCERN
The financial position of the Group and its cash flows are set out on pages 77 and 80. The directors have considered the principal risks of the company which are set out on pages 18 and 23, and considered key sensitivities which could impact on the level of available borrowings. As at December 31, 2017, the Group had cash and cash equivalents of £8.1m as set out in note 22 and subject to continued covenant compliance, has access to £29.6m through its undrawn secured US40.0m revolving credit facility.
The Directors have considered the Group’s cash flow forecasts for the period to the end of March 2019. The Board is satisfied that the Group’s forecasts and projections, taking into account reasonably possible changes in trading performance and other uncertainties, together with the Group’s cash position and access to the undrawn revolving credit facility, show that the Group will be able to operate within the level of its current facilities for the foreseeable future. For this reason the Group continues to adopt the going concern basis in preparing its financial statements.
RESULTS AND DIVIDENDS
The consolidated income statement is set out on page 75 of the financial statements.
The Group reported a profit after tax of £10.5m (2016: £26.4m).
Total dividends for 2017 will amount to 7.00p per share (2016: 6.00p per share), combining the recommended final dividend of 2.50p per share for the year ended December 31, 2017 with the interim dividends of 3.00p per share paid on November 15, 2017 and 1.50p per share paid on February 15, 2018. The final dividend for the year ended December 31, 2017, is subject to shareholder approval at the 2018 AGM. The Board proposes to pay the final dividend on May 31, 2018 to shareholders on the Company’s share register at the close of business on May 18, 2018. The shares will be quoted ex-dividend on the London and Toronto Stock Exchanges on May 17, 2018.
OUTLOOK
The outlook for and likely future developments of the Group are described within the Chairman’s Statement on pages 06 and 07, together with the Chief Executive Officer’s Statement on pages 08 and 09, and the Group’s Strategic Report on pages 08 to 43.
DIRECTORS
The names of the Directors in office on the date of approval of these financial statements, together with their biographical details and other information, are shown on page 45.
All Directors will stand for election or re-election at the 2018 AGM, with the exception of R.C. Rhodes who announced her intention to step down from the Board following the 2018 AGM.
A table of Directors’ attendance at Board and Committee meetings during 2017 is on page 46.
DIRECTORS’ DISCLOSURES
With regard to the appointment and replacement of Directors, the Company is governed by its Articles of Association, the Companies Act 2006 and related legislation. At the next AGM, all of the Company’s Directors will be offering themselves for election or re-election.
The Directors may exercise all the powers of the Company subject to applicable legislation and regulation and the Articles of Association of the Company. The Company’s Articles of Association may be amended by special resolution of the shareholders. At the 2017 AGM, held on May 10, 2017, the Directors were given the power to issue new shares up to an aggregate nominal amount of £1,206,013. This power will expire at the earlier of the conclusion of the 2018 AGM or June 30, 2018. Further, the Directors were given the power to make market purchases of ordinary shares up to a maximum number of 18,090,203. This power will expire at the earlier of the conclusion of the 2018 AGM or June 30, 2018.
At the AGM held on May 10, 2017, the Directors were given the power to allot equity shares or sell treasury shares for cash other than pro-rata to existing shareholders. This power was limited to 5% of the Company’s issued ordinary share capital (other than in connection with a rights or other similar issue) and will expire at the earlier of the conclusion of the 2018 AGM or June 30, 2018.
The Group maintains insurance for its Directors and officers against certain liabilities in relation to the Group. The Group has entered into qualifying third party indemnity arrangements for the benefit of all its Directors in a form and scope which comply with the requirements of the Companies Act 2006.
CAPITAL STRUCTURE
The structure of the Company’s ordinary share capital at March 21, 2018 was as follows:
Issued No.Nominal value
per share Total% of
total capital
Ordinary shares 180,902,034 0.02 3,618,041 100%
CHANGE OF CONTROL
There are a number of agreements that terminate upon a change of control of the Company such as certain commercial contracts and the revolving credit facility. None of these are considered significant in terms of the business as a whole. There is no change of control provision in any of the Directors’ contracts.
RIGHTS AND OBLIGATIONS
Dividends
The £0.02 ordinary shares carry the right to dividends determined at the discretion of the Board.
Voting rights
The £0.02 ordinary shares carry the right to one vote per share.
Restrictions on transfer of holdings
There are no specific restrictions on the size of a holding nor on the transfer of the Company’s shares, which are both governed by the general provisions of the Articles of Association of the Company and prevailing legislation. There are no known agreements between holders of the Company’s shares that may result in restrictions on the transfer of shares or voting rights.
Special control rights
The Company’s ordinary shares are subject to transfer restrictions and forced transfer provisions that are intended to prevent, among other things, the assets of the Company from being deemed to be ‘plan assets’ under US Employment Retirement Income Security Act of 1974 (ERISA). For more information refer to the important notices section.
Employee share schemes
Details of employee share schemes are set out on page 56 below and in note 28 to the financial statements.
APG_AR17_04.04.18_MIDDLE_AMENDS
66 ANGLO PACIFIC GROUP PLC ANNUAL REPORT & ACCOUNTS 2017
G O V E R N A N C E
Treasury
The Company holds 925,933 £0.02 ordinary shares in treasury for the purposes of settling the Group’s share-based compensation plans, as described in note 27.
Warrants
On May 22, 2014, the Company resolved to create 500,000 warrants, to be issued pursuant to a warrant instrument dated June 10, 2014. These warrants entitle the warrant holders to subscribe in cash for ordinary shares at the subscription price of £2.50 per ordinary share (subject to any adjustment events in accordance with the warrant instrument). The rights to subscribe for ordinary shares conferred by the warrants may only be exercised within five years from the date of the grant of the warrants and in accordance with the warrant instrument.
On January 18, 2017, the Company resolved to create 294,695 warrants, to be issued pursuant to a warrant instrument dated February 10, 2017, with Investec Bank PLC as part of the refinancing of the Group’s revolving credit facility (refer to note 24). These warrants entitle the warrant holders to subscribe in cash for ordinary shares at the subscription price of £1.58 per ordinary share (subject to any adjustment events in accordance with the warrant instrument). The rights to subscribe for ordinary shares conferred by the warrants may only be exercised within three years from the date of the grant of the warrants and in accordance with the warrant instrument.
Allotment of ordinary shares
On February 6, 2017, the Company issued 10,960,000 new Ordinary Shares at a price of 125p per share amounting to an aggregate nominal value of £219,200 and aggregate consideration of £13,700,000 as part of a firm placing announced on February 1, 2017. The issue price was fixed on February 1, 2017 and represented a discount of approximately 5.1% to the closing middle market price on the London Stock Exchange of 131.75p per share on January 31, 2017. The net proceeds were used to provide the majority of funding for the Denison financing and streaming agreements, further details of which are set out in note 27 to the financial statements.
As a result of the preceding issuance, the Company has issued 10,960,000 new Ordinary Shares other than as part of a pre-emptive offer in the 12 months preceding the date of this Annual Report and Accounts, representing approximately 6% of the Company’s share capital as at the date of this Annual Report. The Company has issued a further 39,468,814 new Ordinary Shares other than as part of a pre-emptive offer in the three years preceding the date of this Annual Report and Accounts, representing an aggregate of approximately 22% of the Company’s share capital as at the date of this Annual Report.
SUBSTANTIAL SHAREHOLDINGS
The Company has been notified, aside from the interests of the Directors, of the following interests of 3% or more in the share capital of the Company at March 21, 2018.
Ordinary Shares of 2p each Representing
Liontrust Investment Partners LLP 17,952,410 9.92%
Aberforth Partners LLP 17,044,444 9.42%
Schroders PLC 12,210,712 6.75%
Canacoord Genuity Group Inc 11,077,308 6.12%
Miton Group PLC 9,287,252 5.13%
Ransome’s Dock Limited 7,489,360 4.14%
AXA Investment Managers UK (Framlington) 5,494,332 3.04%
See page 63 for a list of Directors’ interests in shares.
STATEMENT AS TO DISCLOSURE OF INFORMATION TO AUDITORS
The Directors who were in office on the date of approval of these financial statements have confirmed that, as far as they are aware, there is no relevant audit information of which the auditors are unaware. Each of the Directors has confirmed that they have taken all the steps that they ought to have taken as Directors in order to make themselves aware of any relevant audit information and to establish that it has been communicated to the auditors.
OTHER STATUTORY AND REGUL ATORY INFORMATION
Information in relation to the Group’s payment policy can be found in note 26 and a statement on Going Concern is provided in note 3.1.1.
AUDITORS
Deloitte LLP have expressed willingness to continue in office. In accordance with section 489(4) of the Companies Act 2006 a resolution to appoint auditors will be proposed at the 2018 AGM.
DESIGNATED FOREIGN ISSUER STATUS
The Company continues to be listed on the TSX and to be a ‘reporting issuer’ in the Province of Ontario, Canada. The Company also continues to be a ‘designated foreign issuer’, as defined in National Instrument 71-102 – Continuous Disclosure and Other Exemptions Relating to Foreign Issuers of the Canadian Securities Administrators. As such, the Company is not subject to the same ongoing reporting requirements as most other reporting issuers in Canada. Generally, the Company will be in compliance with Canadian ongoing reporting requirements if it complies with the UK Financial Conduct Authority in its capacity as the competent authority for the purposes of Part VI of the Financial Services and Markets Act 2000 (United Kingdom), as amended from time to time, and the applicable laws of England and Wales (the ‘UK Rules’) and files on its SEDAR profile at www.sedar.com any documents required to be filed or furnished pursuant to the UK Rules.
By Order of the Board
K. FlynnCompany SecretaryMarch 27, 2018
Registered office1 Savile RowLondonW1S 3JR
APG_AR17_04.04.18_MIDDLE_AMENDS
67ANGLO PACIFIC GROUP PLC ANNUAL REPORT & ACCOUNTS 2017G
RO
UP O
VER
VIE
W S
TRATEG
IC R
EPO
RT G
OV
ER
NA
NC
E FIN
AN
CIA
L STATEM
ENTS O
THER
INFO
RM
ATION
STATEMENT OF DIRECTORS’ RESPONSIBILITIES
The Directors are responsible for preparing the Annual Report and Accounts, the Directors’ Remuneration Report and the financial statements in accordance with applicable law and regulations.
Company law requires the Directors to prepare financial statements for each financial year. Under that law the Directors have elected to prepare the Group and parent Company financial statements in accordance with International Financial Reporting Standards (‘IFRSs’) as adopted by the European Union (‘EU’). Under company law the Directors must not approve the financial statements unless they are satisfied that they give a true and fair view of the state of affairs of the Group and the Company and of the profit or loss of the Group and the Company for that period. In preparing these financial statements, International Accounting Standard 1 requires that Directors:
• properly select and apply accounting policies;
• present information, including accounting policies, in a manner that provides relevant, reliable, comparable and understandable information;
• provide additional disclosures when compliance with the specific requirements in IFRSs are insufficient to enable users to understand the impact of particular transactions, other events and conditions on the entity’s financial position and financial performance; and
• make an assessment of the Group’s ability to continue as a going concern.
The Directors are responsible for keeping adequate accounting records that are sufficient to show and explain the Company’s transactions and disclose with reasonable accuracy at any time the financial position of the Company and the Group and enable them to ensure that the financial statements and the Directors’ Remuneration Report comply with the Companies Act 2006 (United Kingdom) and, as regards the Group financial statements, Article 4 of the IAS Regulation. They are also responsible for safeguarding the assets of the Company and the Group and hence for taking reasonable steps for the prevention and detection of fraud and other irregularities.
The Directors who were in office at the date of this statement confirm that:
• so far as they are each aware there is no relevant audit information of which the Company’s auditors are unaware; and
• the Directors have taken all steps that they ought to have taken to make themselves aware of any relevant audit information and to establish that the auditors are aware of that information.
DIRECTORS’ STATEMENT PURSUANT TO THE DISCLOSURE AND
TR ANSPARENCY RULES
We confirm that to the best of our knowledge:
• the financial statements, prepared in accordance with IFRSs as adopted by the EU, give a true and fair view of the assets, liabilities, financial position and profit or loss of the Company and the undertakings included in the consolidation taken as a whole;
• the Strategic Report includes a fair review of the development and performance of the business and the position of the Company and the undertakings included in the consolidation taken as a whole, together with a description of the principal risks and uncertainties that they face; and
• the Annual Report and financial statements, taken as a whole, are fair, balanced and understandable and provide the information necessary for shareholders to assess the Company’s performance, business model and strategy.
The Directors are responsible for the maintenance and integrity of the corporate and financial information included on the Group’s website, www.anglopacificgroup.com. Legislation in the United Kingdom governing the preparation and dissemination of financial statements may differ from legislation in other jurisdictions.
The Directors consider that the Annual Report and Accounts, taken as a whole, is fair, balanced and understandable and provides the information necessary for shareholders to assess the Company’s performance, business model and strategy.
By Order of the Board
N.P.H. MeierChairmanMarch 27, 2018
APG_AR17_04.04.18_MIDDLE_AMENDS
68 ANGLO PACIFIC GROUP PLC ANNUAL REPORT & ACCOUNTS 2017
G O V E R N A N C E
INDEPENDENT AUDITOR’S REPORT TO THE MEMBERS OF ANGLO PACIFIC GROUP PLC
OPINION
In our opinion:
• the financial statements give a true and fair view of the state of the Group’s and of the Parent Company’s affairs as at 31 December 2017 and of the Group’s profit for the year then ended;
• the Group financial statements have been properly prepared in accordance with International Financial Reporting Standards (IFRSs) as adopted by the European Union;
• the Parent Company financial statements have been properly prepared in accordance with IFRSs as adopted by the European Union and as applied in accordance with the provisions of the Companies Act 2006; and
• the financial statements have been prepared in accordance with the requirements of the Companies Act 2006 and, as regards the Group financial statements, Article 4 of the IAS Regulation.
We have audited the financial statements of Anglo Pacific Group plc (the ‘Parent Company’) and its subsidiaries (the ‘Group’) which comprise:
• the consolidated income statement;
• the consolidated statement of comprehensive income;
• the consolidated balance sheet and Company balance sheet;
• the consolidated and Company statement of changes in equity;
• the consolidated and Parent Company statements of cash flows; and
• the related notes 1 to 35.
The financial reporting framework that has been applied in their preparation is applicable law and IFRSs as adopted by the European Union and, as regards the Parent Company financial statements, as applied in accordance with the provisions of the Companies Act 2006.
BASIS FOR OPINION
We conducted our audit in accordance with International Standards on Auditing (UK) (ISAs (UK)) and applicable law. Our responsibilities under those standards are further described in the auditor’s responsibilities for the audit of the financial statements section of our report.
We are independent of the Group and the Parent Company in accordance with the ethical requirements that are relevant to our audit of the financial statements in the UK, including the FRC’s Ethical Standard as applied to listed public interest entities, and we have fulfilled our other ethical responsibilities in accordance with these requirements. We confirm that the non-audit services prohibited by the FRC’s Ethical Standard were not provided to the Group or the Parent Company.
We believe that the audit evidence we have obtained is sufficient and appropriate to provide a basis for our opinion.
SUMMARY OF OUR AUDIT APPROACH
Key audit matters
The key audit matters that we identified in the current year were:
• Valuation of the Kestrel royalties
• Impairment assessment of the royalties intangibles portfolio
• Accounting for the Denison transaction
• Accounting for deferred and current tax
Within this report, any new key audit matters are identified with and any key audit matters which are the same as the prior year are identified with .
Materiality The materiality that we used for the Group financial statements was £4.3m which was determined on the basis of 2% on net assets.
Scoping Consistent with how the Group is managed we consider the Group to be one component. Consequently all assets, liabilities, income and expenses are subject to a full scope audit.
Significant changes in our approach
We have not included the Dugbe valuation as a key audit matter for 2017. In 2016 the royalty was converted from being held at cost on the balance sheet to fair value which meant there was the potential for a significant change in carrying value. Having audited the fair value methodology and sources of assumptions during 2016, the potential for a material misstatement this year is considered significantly lower.
We have included a new key audit matter for the accounting for the Denison transaction because of the complexity of the accounting and the valuation of the loan and streaming royalty that was measured in February 2017.
We have included a new key audit matter in respect of the uncertainty around the tax treatment of the intercompany loan between two subsidiary entities.
APG_AR17_04.04.18_MIDDLE_AMENDS
69ANGLO PACIFIC GROUP PLC ANNUAL REPORT & ACCOUNTS 2017G
RO
UP O
VER
VIE
W S
TRATEG
IC R
EPO
RT G
OV
ERN
AN
CE F
INA
NC
IAL S
TAT
EM
EN
TS
OTH
ER IN
FOR
MATIO
N
F I N A N C I A L S T A T E M E N T S
CONCLUSIONS REL ATING TO GOING CONCERN, PRINCIPAL RISKS AND VIABILIT Y STATEMENT
Going concern
We have reviewed the directors’ statement in note 3.1.1 to the financial statements about whether they considered it appropriate to adopt the going concern basis of accounting in preparing them and their identification of any material uncertainties to the Group’s and Company’s ability to continue to do so over a period of at least 12 months from the date of approval of the financial statements.
We are required to state whether we have anything material to add or draw attention to in relation to that statement required by Listing Rule 9.8.6R(3) and report if the statement is materially inconsistent with our knowledge obtained in the audit.
We confirm that we have nothing material to report, add or draw attention to in respect of these matters.
Principal risks and viability statement
Based solely on reading the directors’ statements and considering whether they were consistent with the knowledge we obtained in the course of the audit, including the knowledge obtained in the evaluation of the directors’ assessment of the Group’s and the Company’s ability to continue as a going concern, we are required to state whether we have anything material to add or draw attention to in relation to:
• the disclosures on pages 18-23 that describe the principal risks and explain how they are being managed or mitigated;
• the directors' confirmation on page 18 that they have carried out a robust assessment of the principal risks facing the Group, including those that would threaten its business model, future performance, solvency or liquidity; or
• the directors’ explanation on page 18 as to how they have assessed the prospects of the Group, over what period they have done so and why they consider that period to be appropriate, and their statement as to whether they have a reasonable expectation that the Group will be able to continue in operation and meet its liabilities as they fall due over the period of their assessment, including any related disclosures drawing attention to any necessary qualifications or assumptions.
We are also required to report whether the directors’ statement relating to the prospects of the Group required by Listing Rule 9.8.6R(3) is materially inconsistent with our knowledge obtained in the audit.
We confirm that we have nothing material to report, add or draw attention to in respect of these matters.
KEY AUDIT MAT TERS
Key audit matters are those matters that, in our professional judgement, were of most significance in our audit of the financial statements of the current period and include the most significant assessed risks of material misstatement (whether or not due to fraud) that we identified. These matters included those which had the greatest effect on: the overall audit strategy; the allocation of resources in the audit; and directing the efforts of the engagement team.
These matters were addressed in the context of our audit of the financial statements as a whole, and in forming our opinion thereon, and we do not provide a separate opinion on these matters.
VALUATION OF THE KESTREL ROYALT Y
Key audit matter description
Royalties arrangements held at fair value have a value of £115.0m as at 31 December 2017 (2016: £130.4m). The Kestrel royalty comprises £104.3m (2016: £116.9m) of the total and management engaged an independent valuation specialist to perform an independent valuation of the royalty asset. The valuation of the Kestrel royalty is subjective and contains significant levels of judgement in relation to the discount rate used, the forecast commodity prices and the expected production profile. In addition, the heightened coal price volatility during the year has widened the range of analyst forecasts and increased the subjectivity in the valuation.
Due to the high level of judgements involved, we have determined that there was a potential for fraud through possible manipulation of this balance.
The price and discount rate assumptions are set out in note 14 along with the related sensitivity analysis. The Group discloses this risk as a critical accounting judgement in note 2.
Refer to the Audit Committee report where this matter is considered by the Audit Committee as a significant issue, “Review of the carrying value of royalties held at fair value” on page 50.
How the scope of our audit responded to the key audit matter
We obtained the valuation model used by management’s independent specialist to determine the fair value of the Kestrel royalty. We challenged the assumptions adopted by management̀ s independent specialist by comparison to recent third party forecast commodity price data, reference to third party documentation and the relevant reserves and resources reports. To challenge the discount rates we prepared independent discount rates and compared those to the rates adopted by management.
We evaluated the independence, objectivity and competence of management’s independent specialist. We challenged the valuation assumptions adopted in line with the above methodology by directly reviewing their reporting and speaking directly with the specialist. In doing so we assessed the extent to which management may have influenced the key assumptions in the valuation model to address the risk of any possible management bias.
INDEPENDENT AUDITOR’S REPORT TO THE MEMBERS OF ANGLO PACIFIC GROUP PLCcontinued
APG_AR17_04.04.18_MIDDLE_AMENDS
70 ANGLO PACIFIC GROUP PLC ANNUAL REPORT & ACCOUNTS 2017
F I N A N C I A L S T A T E M E N T S
Key observations
We concur that the fair value of the Kestrel royalty is within an acceptable range.
IMPAIRMENT ASSESSMENT OF THE ROYALT Y INTANGIBLES PORTFOLIO
Key audit matter description
Royalty arrangements held as intangibles have a gross carrying amount of £115.8m at 31 December 2017 (2016: £115.7m) and a net carrying amount of £77.4m (2016: 80.0m). As a consequence of the volatility in current commodity prices, the assessment of whether impairment/reversal indicators exist and estimating the recoverable amount of royalty arrangements accounted for as intangible assets where necessary require management to adopt key judgements in relation to the discount rates used, the forecast commodity prices, the expected production profiles and where relevant the probability of production commencing.
Impairment indicators were identified for Four Mile and Pilbara with carrying amounts of £1.5m (2016: £1.7m) and £11.2m (2016: £11.3m) respectively. Indicators of impairment reversal were also identified for Ring of Fire which has a carrying amount of £3.7m (2016: £3.8m).
No impairment or impairment reversal was recognised for 2017. In 2016 an impairment of £2.1m was recognised at Amapá (see note 16). The Group discloses this risk as a critical accounting judgement in note 2.
Refer to the Audit Committee report where this matter is considered by the Audit Committee as part of the significant issue, “Review of the carrying values of royalties held at amortised cost along with the investment portfolio and resulting impairment charges” on page 50.
How the scope of our audit responded to the key audit matter
We challenged management’s assessment as to whether indicators of impairment exist for specific royalty arrangements through evaluation of changes in production and pricing forecasts and a review of publically available information. Where such indicators were identified, we obtained copies of the valuation models and challenged the assumptions adopted by management by comparison to third party forecast commodity price data, reference to third party documentation and the relevant reserves and resources reports.
To challenge the discount rates we prepared independent discount rates and compared those to the rates adopted by management.
We reviewed and challenged management’s assessment of whether projects still in the development phase would reach commercial production through an independent assessment based on third party data available from asset operators.
Where there were indicators of impairment reversal for royalty assets we evaluated whether it was appropriate to reverse previous impairments.
Key observations
We concur with management’s impairment assessment, in respect of the intangible assets where indicators of impairment were identified, we found that the assumptions used were within a reasonable range and had been determined and applied on a consistent basis across the Group.
ACCOUNTING FOR THE DENISON TR ANSACTION
Key audit matter description
During 2017 the Group entered into two new contracts, known together as “the Denison Financing Agreement”. As at 31 December 2017 management has accounted for the transaction as two separate financial instruments as follows:
1. A £21.3m 13-year secured loan held as a financial liability at amortised cost. The asset was designated as a loan measured at amortised cost due to
• the mandatory repayment term;
• the intention of management to hold the asset in order to collect the interest payments and principal repayments associated with the contract; and
• the instrument being unquoted in an active market.
See note 20 for further details;
2. A £1.9 million available-for-sale debt financial instrument relating to an entitlement to a percentage of the future McClean Lake Mill revenue earned by Denison, excluding that revenue earned in relation to the first 215mlbs of throughput. The contract meets the definition of an available-for-sale debt as
• it provides a contractual right to receive cash;
• it has no maturity date; and
• the cash flows are not fixed and determinable.
See note 15 for further details.
The Group discloses this risk as a critical accounting judgement in note 2.
Refer to the Audit Committee report where this matter is considered by the Audit Committee as a significant issue, “Review of the carrying values of royalties held at amortised cost along with the investment portfolio and resulting impairment charges” and “Review of the carrying value of royalties held at fair value” on page 50.
APG_AR17_04.04.18_MIDDLE_AMENDS
71ANGLO PACIFIC GROUP PLC ANNUAL REPORT & ACCOUNTS 2017G
RO
UP O
VER
VIE
W S
TRATEG
IC R
EPO
RT G
OV
ERN
AN
CE F
INA
NC
IAL S
TAT
EM
EN
TS
OTH
ER IN
FOR
MATIO
N
How the scope of our audit responded to the key audit matter
We challenged management’s assessment as to whether this transaction is appropriately accounted for as two separate financial instruments through our consideration of the key terms in the contracts. We have reviewed the contracts and assessed whether the two instruments are separate due to different contractual rights to cash and ability to sell separately the royalty from the loan or vice versa.
We have reviewed the contracts and assessed whether the appropriate accounting treatment was applied to the financial instruments under IAS39.
We have engaged our valuation specialists in order to challenge whether the fair value of the loan on day one is appropriate through recalculation of loan’s initial value.
We obtained the available-for-sale debt valuation model and challenged the key assumptions adopted by management in relation to this model by comparison to third party forecast commodity price data, reference to third party documentation and the relevant reserves and resources reports.
To challenge the discount rates for the available-for-sale debt and effective interest rate for the loan we prepared independent rates and compared those to the rates adopted by management.
Key observations
We concur that the accounting treatment and valuation of the transactions appear reasonable.
ACCOUNTING FOR DEFERRED AND CURRENT TA X
Key audit matter description
The Group undertook a restructuring of certain loss making entities during the year. The Group obtained advice from professional advisors in respect of these transactions. The tax treatment in relation to the restructure is uncertain given the lack of precedence and guidance from the tax authorities. In the event this aspect was successfully challenged by the tax authorities, possibly through litigation, this would result in a reduction in the deferred tax asset of £3.3m and the recognition of current tax liability of £3.6m as at December 31, 2017 with a £6.9 million corresponding income statement tax charge for 2017.
Management disclosed this as an uncertain tax position in note 10 to the financial statements. The Group discloses this risk as a critical accounting judgement in note 2.
Refer to the Audit Committee report where this matter is considered by the Audit Committee as part of the significant issue, “Group tax exposures” on page 50.
How the scope of our audit responded to the key audit matter
We reviewed the papers prepared by management’s independent tax expert.
We utilised our specialists to review management’s tax advice and position papers and consider the appropriateness of the position for the purposes of the audit; this involved reviewing the tax legislation and case law applied to determine if the tax treatment was reasonable.
We held a meeting with management to discuss our concern that there is no clear precedence or guidance on this matter and, as such, this results in an uncertain tax position.
We recalculated management’s analysis of the accounting impact detailed above if the non-taxable treatment was successfully challenged by the tax authorities in order to assess whether it is reasonable.
Key observations
Given the uncertainty related to the tax accounting treatment, we concurred with management’s conclusion to disclose this as an uncertain tax position.
OUR APPLICATION OF MATERIALIT Y
We define materiality as the magnitude of misstatement in the financial statements that makes it probable that the economic decisions of a reasonably knowledgeable person would be changed or influenced. We use materiality both in planning the scope of our audit work and in evaluating the results of our work.
Based on our professional judgement, we determined materiality for the financial statements as a whole as follows:
Group financial statements Parent Company financial statements
Materiality £4.3m (2016: £4.0m) £2.7 (2016: £2.5m)
Basis for determining materiality 2% of net assets (2016: 2%) 2% of net assets (2016: 2%)
Rationale for the benchmark applied
Net assets was considered a more stable base than profits due to the effect of unrealised fair value gains/losses in each financial year.
The long-term value for shareholders is also in the asset base as the Group generates its wealth through royalties acquired. Considering that these are often bought in the development phase of an asset's life a significant portion of the Company’s value at this moment is not reflected in the income statement.
Net assets was considered a more stable base than profits due to the effect of unrealised fair value gains/losses in each financial year.
The long-term value for shareholders is also in the asset base as the Company generates its wealth through royalties acquired. Considering that these are often bought in the development phase of an asset's life a significant portion of the Company’s value at this moment is not reflected in the income statement.
INDEPENDENT AUDITOR’S REPORT TO THE MEMBERS OF ANGLO PACIFIC GROUP PLCcontinued
APG_AR17_04.04.18_MIDDLE_AMENDS
72 ANGLO PACIFIC GROUP PLC ANNUAL REPORT & ACCOUNTS 2017
F I N A N C I A L S T A T E M E N T S
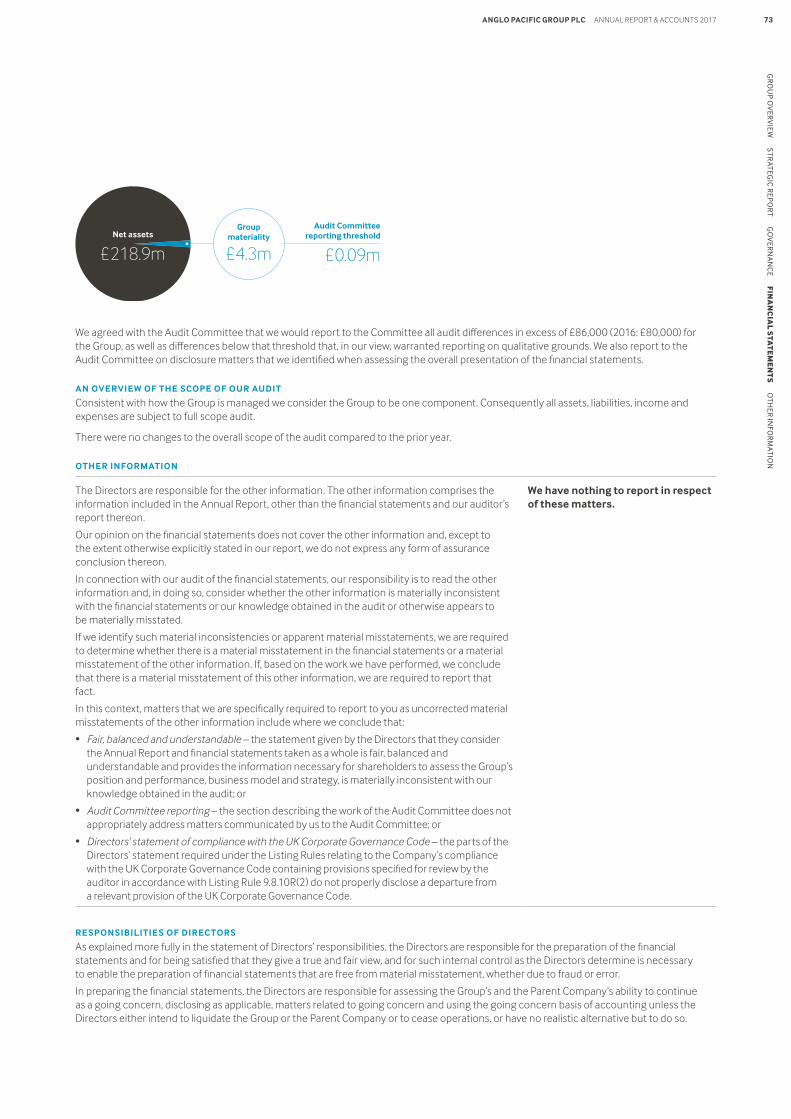
We agreed with the Audit Committee that we would report to the Committee all audit differences in excess of £86,000 (2016: £80,000) for the Group, as well as differences below that threshold that, in our view, warranted reporting on qualitative grounds. We also report to the Audit Committee on disclosure matters that we identified when assessing the overall presentation of the financial statements.
AN OVERVIEW OF THE SCOPE OF OUR AUDIT
Consistent with how the Group is managed we consider the Group to be one component. Consequently all assets, liabilities, income and expenses are subject to full scope audit.
There were no changes to the overall scope of the audit compared to the prior year.
OTHER INFORMATION
The Directors are responsible for the other information. The other information comprises the information included in the Annual Report, other than the financial statements and our auditor’s report thereon.
Our opinion on the financial statements does not cover the other information and, except to the extent otherwise explicitly stated in our report, we do not express any form of assurance conclusion thereon.
In connection with our audit of the financial statements, our responsibility is to read the other information and, in doing so, consider whether the other information is materially inconsistent with the financial statements or our knowledge obtained in the audit or otherwise appears to be materially misstated.
If we identify such material inconsistencies or apparent material misstatements, we are required to determine whether there is a material misstatement in the financial statements or a material misstatement of the other information. If, based on the work we have performed, we conclude that there is a material misstatement of this other information, we are required to report that fact.
In this context, matters that we are specifically required to report to you as uncorrected material misstatements of the other information include where we conclude that:
• Fair, balanced and understandable – the statement given by the Directors that they consider the Annual Report and financial statements taken as a whole is fair, balanced and understandable and provides the information necessary for shareholders to assess the Group’s position and performance, business model and strategy, is materially inconsistent with our knowledge obtained in the audit; or
• Audit Committee reporting – the section describing the work of the Audit Committee does not appropriately address matters communicated by us to the Audit Committee; or
• Directors’ statement of compliance with the UK Corporate Governance Code – the parts of the Directors’ statement required under the Listing Rules relating to the Company’s compliance with the UK Corporate Governance Code containing provisions specified for review by the auditor in accordance with Listing Rule 9.8.10R(2) do not properly disclose a departure from a relevant provision of the UK Corporate Governance Code.
We have nothing to report in respect of these matters.
RESPONSIBILITIES OF DIRECTORS
As explained more fully in the statement of Directors’ responsibilities, the Directors are responsible for the preparation of the financial statements and for being satisfied that they give a true and fair view, and for such internal control as the Directors determine is necessary to enable the preparation of financial statements that are free from material misstatement, whether due to fraud or error.
In preparing the financial statements, the Directors are responsible for assessing the Group’s and the Parent Company’s ability to continue as a going concern, disclosing as applicable, matters related to going concern and using the going concern basis of accounting unless the Directors either intend to liquidate the Group or the Parent Company or to cease operations, or have no realistic alternative but to do so.
Net assets
£218.9m
Group materiality
£4.3m
Audit Committee reporting threshold
£0.09m
APG_AR17_04.04.18_MIDDLE_AMENDS
73ANGLO PACIFIC GROUP PLC ANNUAL REPORT & ACCOUNTS 2017G
RO
UP O
VER
VIE
W S
TRATEG
IC R
EPO
RT G
OV
ERN
AN
CE F
INA
NC
IAL S
TAT
EM
EN
TS
OTH
ER IN
FOR
MATIO
N
AUDITOR ’S RESPONSIBILITIES FOR THE AUDIT OF THE FINANCIAL STATEMENTS
Our objectives are to obtain reasonable assurance about whether the financial statements as a whole are free from material misstatement, whether due to fraud or error, and to issue an auditor’s report that includes our opinion. Reasonable assurance is a high level of assurance, but is not a guarantee that an audit conducted in accordance with ISAs (UK) will always detect a material misstatement when it exists. Misstatements can arise from fraud or error and are considered material if, individually or in the aggregate, they could reasonably be expected to influence the economic decisions of users taken on the basis of these financial statements.
A further description of our responsibilities for the audit of the financial statements is located on the Financial Reporting Council’s website at: www.frc.org.uk/auditorsresponsibilities. This description forms part of our auditor’s report.
USE OF OUR REPORT
This report is made solely to the Company’s members, as a body, in accordance with Chapter 3 of Part 16 of the Companies Act 2006. Our audit work has been undertaken so that we might state to the Company’s members those matters we are required to state to them in an auditor’s report and for no other purpose. To the fullest extent permitted by law, we do not accept or assume responsibility to anyone other than the Company and the Company’s members as a body, for our audit work, for this report, or for the opinions we have formed.
REPORT ON OTHER LEGAL AND REGUL ATORY REQUIREMENTS
Opinions on other matters prescribed by the Companies Act 2006
In our opinion the part of the Directors’ Remuneration Report to be audited has been properly prepared in accordance with the Companies Act 2006.
In our opinion, based on the work undertaken in the course of the audit:
• the information given in the Strategic Report and the Directors’ Report for the financial year for which the financial statements are prepared is consistent with the financial statements; and
• the Strategic Report and the Directors’ Report have been prepared in accordance with applicable legal requirements.
In the light of the knowledge and understanding of the Group and the Parent Company and their environment obtained in the course of the audit, we have not identified any material misstatements in the Strategic Report or the Directors’ Report.
MAT TERS ON WHICH WE ARE REQUIRED TO REPORT BY EXCEPTION
Adequacy of explanations received and accounting records
Under the Companies Act 2006 we are required to report to you if, in our opinion:
• we have not received all the information and explanations we require for our audit; or
• adequate accounting records have not been kept by the Parent Company, or returns adequate for our audit have not been received from branches not visited by us; or
• the Parent Company financial statements are not in agreement with the accounting records and returns.
We have nothing to report in respect of these matters.
Directors’ remuneration
Under the Companies Act 2006 we are also required to report if in our opinion certain disclosures of Directors’ remuneration have not been made or the part of the Directors’ Remuneration Report to be audited is not in agreement with the accounting records and returns.
We have nothing to report in respect of these matters.
OTHER MAT TERS
Auditor tenure
Following the recommendation of the Audit Committee, we were appointed by shareholders at the AGM on June 11, 2014 to audit the financial statements for the year ending December 31, 2014 and subsequent financial periods. The period of total uninterrupted engagement including previous renewals and reappointments of the firm is four years, covering the years ending December 31, 2014 to December 31, 2017.
Consistency of the audit report with the additional report to the Audit Committee
Our audit opinion is consistent with the additional report to the Audit Committee we are required to provide in accordance with ISAs (UK).
Christopher Thomas ACA (Senior statutory auditor)for and on behalf of Deloitte LLPStatutory AuditorLondon, United Kingdom27 March 2018
INDEPENDENT AUDITOR’S REPORT TO THE MEMBERS OF ANGLO PACIFIC GROUP PLCcontinued
APG_AR17_04.04.18_MIDDLE_AMENDS
74 ANGLO PACIFIC GROUP PLC ANNUAL REPORT & ACCOUNTS 2017
F I N A N C I A L S T A T E M E N T S
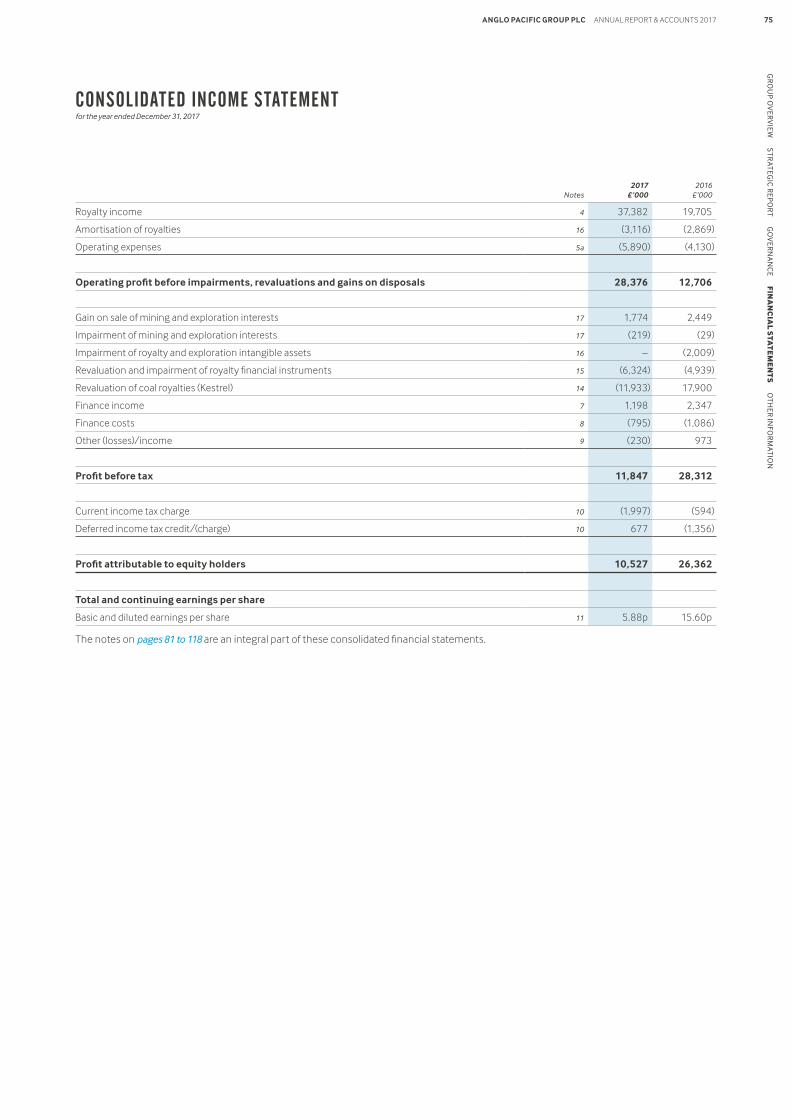
Notes2017
£’0002016
£’000
Royalty income 4 37,382 19,705
Amortisation of royalties 16 (3,116) (2,869)
Operating expenses 5a (5,890) (4,130)
Operating profit before impairments, revaluations and gains on disposals 28,376 12,706
Gain on sale of mining and exploration interests 17 1,774 2,449
Impairment of mining and exploration interests 17 (219) (29)
Impairment of royalty and exploration intangible assets 16 – (2,009)
Revaluation and impairment of royalty financial instruments 15 (6,324) (4,939)
Revaluation of coal royalties (Kestrel) 14 (11,933) 17,900
Finance income 7 1,198 2,347
Finance costs 8 (795) (1,086)
Other (losses)/income 9 (230) 973
Profit before tax 11,847 28,312
Current income tax charge 10 (1,997) (594)
Deferred income tax credit/(charge) 10 677 (1,356)
Profit attributable to equity holders 10,527 26,362
Total and continuing earnings per share
Basic and diluted earnings per share 11 5.88p 15.60p
The notes on pages 81 to 118 are an integral part of these consolidated financial statements.
APG_AR17_28.03.18_BACK_ARTWORK
ANGLO PACIFIC GROUP PLC ANNUAL REPORT & ACCOUNTS 2017 75G
RO
UP O
VER
VIE
W S
TRATEG
IC R
EPO
RT G
OV
ERN
AN
CE F
INA
NC
IAL S
TAT
EM
EN
TS
OTH
ER IN
FOR
MATIO
N
CONSOLIDATED INCOME STATEMENTfor the year ended December 31, 2017
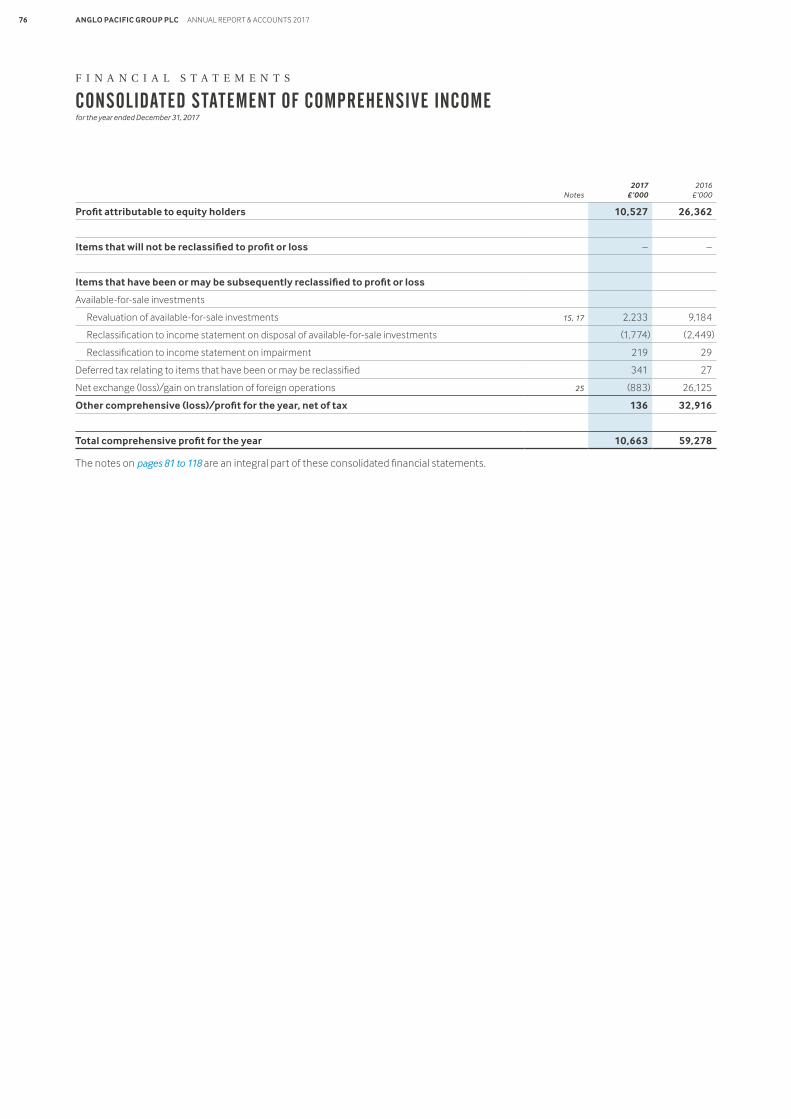
Notes2017
£’0002016
£’000
Profit attributable to equity holders 10,527 26,362
Items that will not be reclassified to profit or loss – –
Items that have been or may be subsequently reclassified to profit or loss
Available-for-sale investments
Revaluation of available-for-sale investments 15, 17 2,233 9,184
Reclassification to income statement on disposal of available-for-sale investments (1,774) (2,449)
Reclassification to income statement on impairment 219 29
Deferred tax relating to items that have been or may be reclassified 341 27
Net exchange (loss)/gain on translation of foreign operations 25 (883) 26,125
Other comprehensive (loss)/profit for the year, net of tax 136 32,916
Total comprehensive profit for the year 10,663 59,278
The notes on pages 81 to 118 are an integral part of these consolidated financial statements.
F I N A N C I A L S T A T E M E N T S
APG_AR17_28.03.18_BACK_ARTWORK
ANGLO PACIFIC GROUP PLC ANNUAL REPORT & ACCOUNTS 201776
CONSOLIDATED STATEMENT OF COMPREHENSIVE INCOME for the year ended December 31, 2017
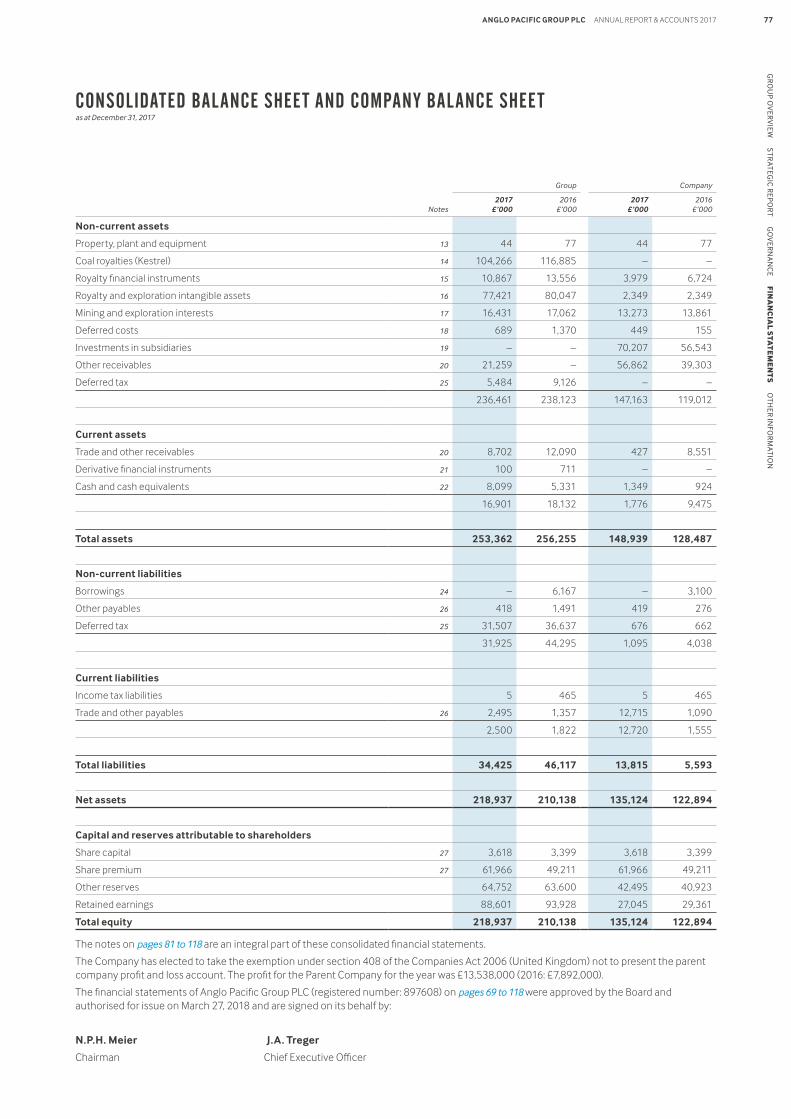
Group Company
Notes2017
£’0002016
£’0002017
£’0002016
£’000
Non-current assets
Property, plant and equipment 13 44 77 44 77
Coal royalties (Kestrel) 14 104,266 116,885 – –
Royalty financial instruments 15 10,867 13,556 3,979 6,724
Royalty and exploration intangible assets 16 77,421 80,047 2,349 2,349
Mining and exploration interests 17 16,431 17,062 13,273 13,861
Deferred costs 18 689 1,370 449 155
Investments in subsidiaries 19 – – 70,207 56,543
Other receivables 20 21,259 – 56,862 39,303
Deferred tax 25 5,484 9,126 – –
236,461 238,123 147,163 119,012
Current assets
Trade and other receivables 20 8,702 12,090 427 8,551
Derivative financial instruments 21 100 711 – –
Cash and cash equivalents 22 8,099 5,331 1,349 924
16,901 18,132 1,776 9,475
Total assets 253,362 256,255 148,939 128,487
Non-current liabilities
Borrowings 24 – 6,167 – 3,100
Other payables 26 418 1,491 419 276
Deferred tax 25 31,507 36,637 676 662
31,925 44,295 1,095 4,038
Current liabilities
Income tax liabilities 5 465 5 465
Trade and other payables 26 2,495 1,357 12,715 1,090
2,500 1,822 12,720 1,555
Total liabilities 34,425 46,117 13,815 5,593
Net assets 218,937 210,138 135,124 122,894
Capital and reserves attributable to shareholders
Share capital 27 3,618 3,399 3,618 3,399
Share premium 27 61,966 49,211 61,966 49,211
Other reserves 64,752 63,600 42,495 40,923
Retained earnings 88,601 93,928 27,045 29,361
Total equity 218,937 210,138 135,124 122,894
The notes on pages 81 to 118 are an integral part of these consolidated financial statements.
The Company has elected to take the exemption under section 408 of the Companies Act 2006 (United Kingdom) not to present the parent company profit and loss account. The profit for the Parent Company for the year was £13,538,000 (2016: £7,892,000).
The financial statements of Anglo Pacific Group PLC (registered number: 897608) on pages 69 to 118 were approved by the Board and authorised for issue on March 27, 2018 and are signed on its behalf by:
N.P.H. Meier J.A. Treger
Chairman Chief Executive Officer
APG_AR17_28.03.18_BACK_ARTWORK
ANGLO PACIFIC GROUP PLC ANNUAL REPORT & ACCOUNTS 2017 77G
RO
UP O
VER
VIE
W S
TRATEG
IC R
EPO
RT G
OV
ERN
AN
CE F
INA
NC
IAL S
TAT
EM
EN
TS
OTH
ER IN
FOR
MATIO
N
CONSOLIDATED BALANCE SHEET AND COMPANY BALANCE SHEET as at December 31, 2017
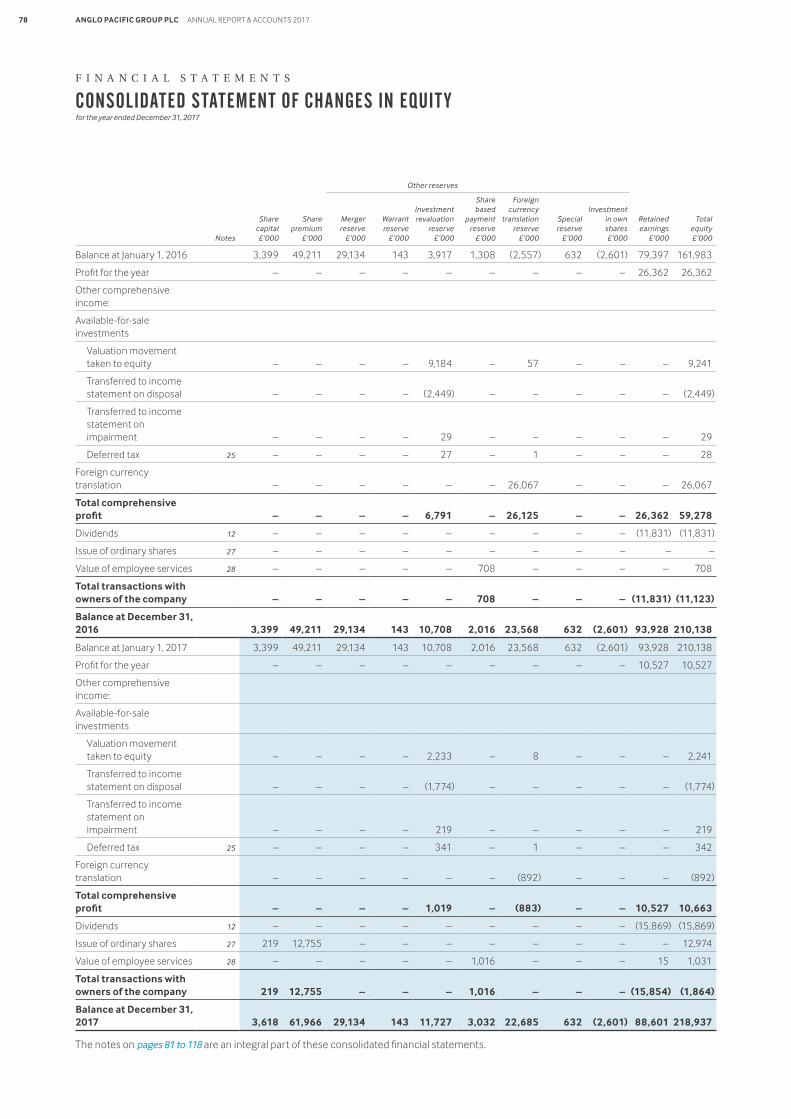
Other reserves
Notes
Share capital £’000
Share premium
£’000
Merger reserve
£’000
Warrant reserve
£’000
Investment revaluation
reserve £’000
Share based
payment reserve
£’000
Foreign currency
translation reserve
£’000
Special reserve
£’000
Investment in own shares £’000
Retained earnings
£’000
Total equity £’000
Balance at January 1, 2016 3,399 49,211 29,134 143 3,917 1,308 (2,557) 632 (2,601) 79,397 161,983
Profit for the year – – – – – – – – – 26,362 26,362
Other comprehensive income:
Available-for-sale investments
Valuation movement taken to equity – – – – 9,184 – 57 – – – 9,241
Transferred to income statement on disposal – – – – (2,449) – – – – – (2,449)
Transferred to income statement on impairment – – – – 29 – – – – – 29
Deferred tax 25 – – – – 27 – 1 – – – 28
Foreign currency translation – – – – – – 26,067 – – – 26,067
Total comprehensive profit – – – – 6,791 – 26,125 – – 26,362 59,278
Dividends 12 – – – – – – – – – (11,831) (11,831)
Issue of ordinary shares 27 – – – – – – – – – – –
Value of employee services 28 – – – – – 708 – – – – 708
Total transactions with owners of the company – – – – – 708 – – – (11,831) (11,123)
Balance at December 31, 2016 3,399 49,211 29,134 143 10,708 2,016 23,568 632 (2,601) 93,928 210,138
Balance at January 1, 2017 3,399 49,211 29,134 143 10,708 2,016 23,568 632 (2,601) 93,928 210,138
Profit for the year – – – – – – – – – 10,527 10,527
Other comprehensive income:
Available-for-sale investments
Valuation movement taken to equity – – – – 2,233 – 8 – – – 2,241
Transferred to income statement on disposal – – – – (1,774) – – – – – (1,774)
Transferred to income statement on impairment – – – – 219 – – – – – 219
Deferred tax 25 – – – – 341 – 1 – – – 342
Foreign currency translation – – – – – – (892) – – – (892)
Total comprehensive profit – – – – 1,019 – (883) – – 10,527 10,663
Dividends 12 – – – – – – – – – (15,869) (15,869)
Issue of ordinary shares 27 219 12,755 – – – – – – – – 12,974
Value of employee services 28 – – – – – 1,016 – – – 15 1,031
Total transactions with owners of the company 219 12,755 – – – 1,016 – – – (15,854) (1,864)
Balance at December 31, 2017 3,618 61,966 29,134 143 11,727 3,032 22,685 632 (2,601) 88,601 218,937
The notes on pages 81 to 118 are an integral part of these consolidated financial statements.
F I N A N C I A L S T A T E M E N T S
APG_AR17_28.03.18_BACK_ARTWORK
ANGLO PACIFIC GROUP PLC ANNUAL REPORT & ACCOUNTS 201778
CONSOLIDATED STATEMENT OF CHANGES IN EQUIT Yfor the year ended December 31, 2017
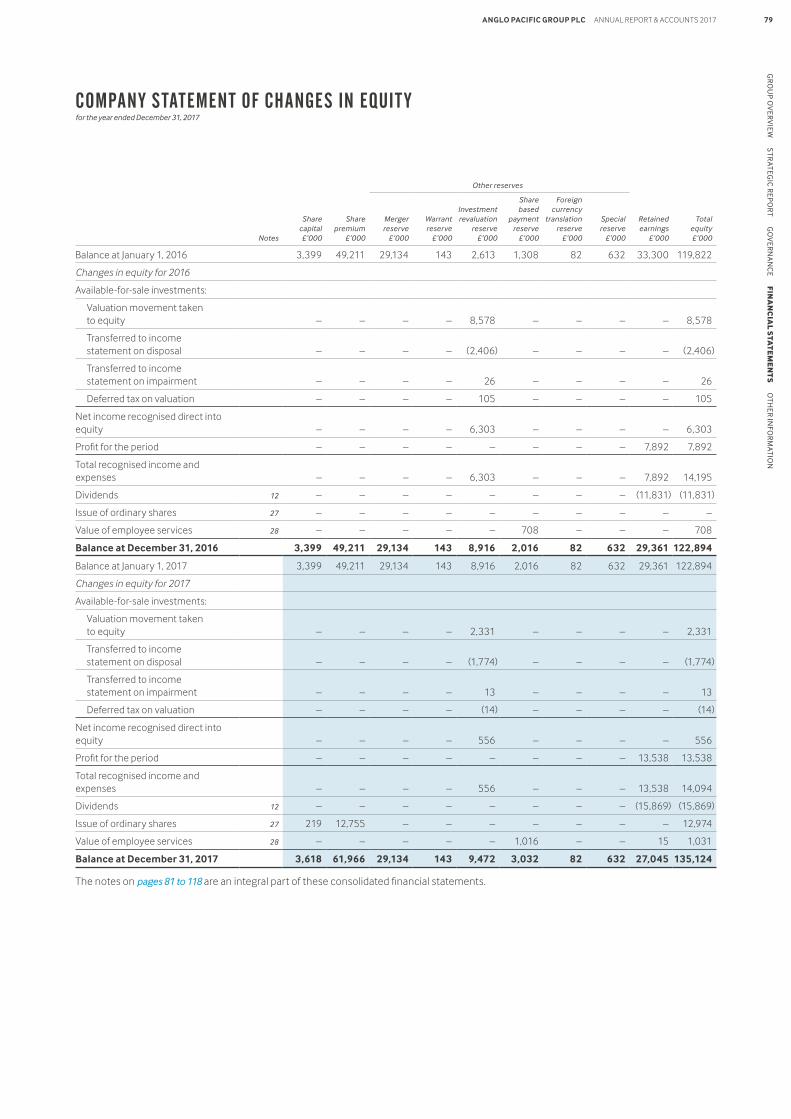
Other reserves
Notes
Share capital £’000
Share premium
£’000
Merger reserve
£’000
Warrant reserve
£’000
Investment revaluation
reserve £’000
Share based
payment reserve
£’000
Foreign currency
translation reserve
£’000
Special reserve
£’000
Retained earnings
£’000
Total equity £’000
Balance at January 1, 2016 3,399 49,211 29,134 143 2,613 1,308 82 632 33,300 119,822
Changes in equity for 2016
Available-for-sale investments:
Valuation movement taken to equity – – – – 8,578 – – – – 8,578
Transferred to income statement on disposal – – – – (2,406) – – – – (2,406)
Transferred to income statement on impairment – – – – 26 – – – – 26
Deferred tax on valuation – – – – 105 – – – – 105
Net income recognised direct into equity – – – – 6,303 – – – – 6,303
Profit for the period – – – – – – – – 7,892 7,892
Total recognised income and expenses – – – – 6,303 – – – 7,892 14,195
Dividends 12 – – – – – – – – (11,831) (11,831)
Issue of ordinary shares 27 – – – – – – – – – –
Value of employee services 28 – – – – – 708 – – – 708
Balance at December 31, 2016 3,399 49,211 29,134 143 8,916 2,016 82 632 29,361 122,894
Balance at January 1, 2017 3,399 49,211 29,134 143 8,916 2,016 82 632 29,361 122,894
Changes in equity for 2017
Available-for-sale investments:
Valuation movement taken to equity – – – – 2,331 – – – – 2,331
Transferred to income statement on disposal – – – – (1,774) – – – – (1,774)
Transferred to income statement on impairment – – – – 13 – – – – 13
Deferred tax on valuation – – – – (14) – – – – (14)
Net income recognised direct into equity – – – – 556 – – – – 556
Profit for the period – – – – – – – – 13,538 13,538
Total recognised income and expenses – – – – 556 – – – 13,538 14,094
Dividends 12 – – – – – – – – (15,869) (15,869)
Issue of ordinary shares 27 219 12,755 – – – – – – – 12,974
Value of employee services 28 – – – – – 1,016 – – 15 1,031
Balance at December 31, 2017 3,618 61,966 29,134 143 9,472 3,032 82 632 27,045 135,124
The notes on pages 81 to 118 are an integral part of these consolidated financial statements.
APG_AR17_28.03.18_BACK_ARTWORK
ANGLO PACIFIC GROUP PLC ANNUAL REPORT & ACCOUNTS 2017 79G
RO
UP O
VER
VIE
W S
TRATEG
IC R
EPO
RT G
OV
ERN
AN
CE F
INA
NC
IAL S
TAT
EM
EN
TS
OTH
ER IN
FOR
MATIO
N
COMPANY STATEMENT OF CHANGES IN EQUIT Yfor the year ended December 31, 2017
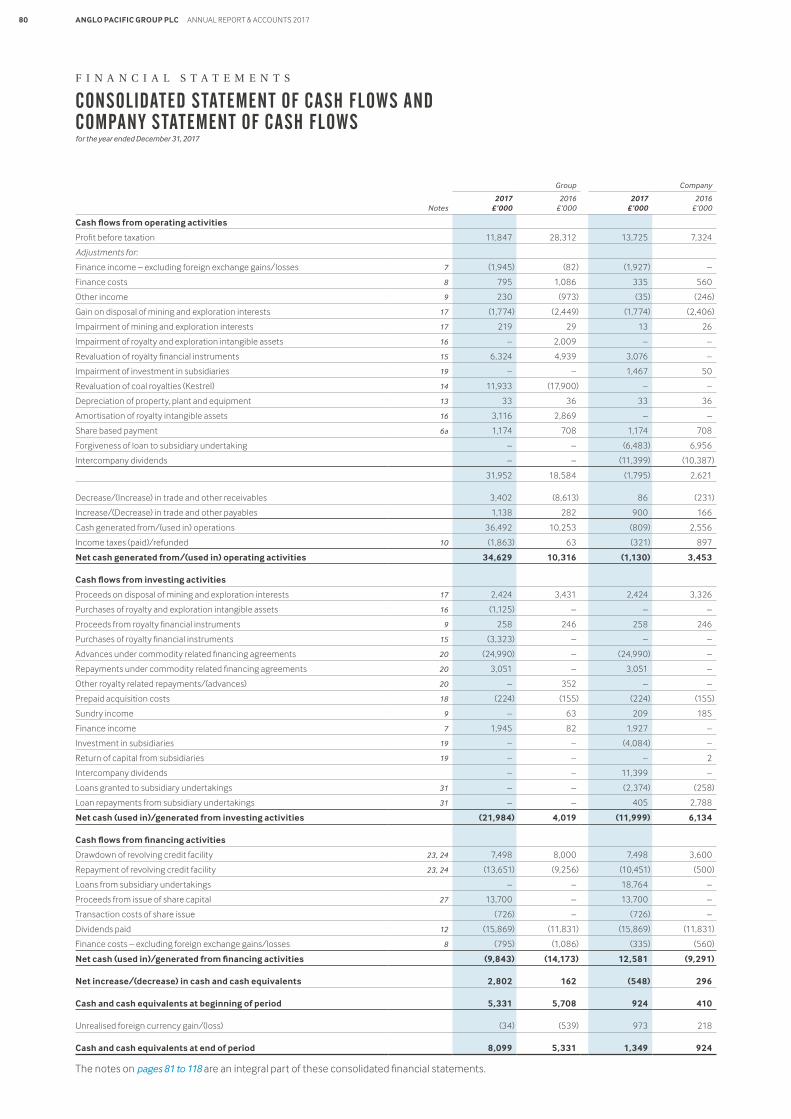
Group Company
Notes2017
£’0002016
£’0002017
£’0002016
£’000
Cash flows from operating activities
Profit before taxation 11,847 28,312 13,725 7,324
Adjustments for:
Finance income – excluding foreign exchange gains/losses 7 (1,945) (82) (1,927) –
Finance costs 8 795 1,086 335 560
Other income 9 230 (973) (35) (246)
Gain on disposal of mining and exploration interests 17 (1,774) (2,449) (1,774) (2,406)
Impairment of mining and exploration interests 17 219 29 13 26
Impairment of royalty and exploration intangible assets 16 – 2,009 – –
Revaluation of royalty financial instruments 15 6,324 4,939 3,076 –
Impairment of investment in subsidiaries 19 – – 1,467 50
Revaluation of coal royalties (Kestrel) 14 11,933 (17,900) – –
Depreciation of property, plant and equipment 13 33 36 33 36
Amortisation of royalty intangible assets 16 3,116 2,869 – –
Share based payment 6a 1,174 708 1,174 708
Forgiveness of loan to subsidiary undertaking – – (6,483) 6,956
Intercompany dividends – – (11,399) (10,387)
31,952 18,584 (1,795) 2,621
Decrease/(Increase) in trade and other receivables 3,402 (8,613) 86 (231)
Increase/(Decrease) in trade and other payables 1,138 282 900 166
Cash generated from/(used in) operations 36,492 10,253 (809) 2,556
Income taxes (paid)/refunded 10 (1,863) 63 (321) 897
Net cash generated from/(used in) operating activities 34,629 10,316 (1,130) 3,453
Cash flows from investing activities
Proceeds on disposal of mining and exploration interests 17 2,424 3,431 2,424 3,326
Purchases of royalty and exploration intangible assets 16 (1,125) – – –
Proceeds from royalty financial instruments 9 258 246 258 246
Purchases of royalty financial instruments 15 (3,323) – – –
Advances under commodity related financing agreements 20 (24,990) – (24,990) –
Repayments under commodity related financing agreements 20 3,051 – 3,051 –
Other royalty related repayments/(advances) 20 – 352 – –
Prepaid acquisition costs 18 (224) (155) (224) (155)
Sundry income 9 – 63 209 185
Finance income 7 1,945 82 1,927 –
Investment in subsidiaries 19 – – (4,084) –
Return of capital from subsidiaries 19 – – – 2
Intercompany dividends – – 11,399 –
Loans granted to subsidiary undertakings 31 – – (2,374) (258)
Loan repayments from subsidiary undertakings 31 – – 405 2,788
Net cash (used in)/generated from investing activities (21,984) 4,019 (11,999) 6,134
Cash flows from financing activities
Drawdown of revolving credit facility 23, 24 7,498 8,000 7,498 3,600
Repayment of revolving credit facility 23, 24 (13,651) (9,256) (10,451) (500)
Loans from subsidiary undertakings – – 18,764 –
Proceeds from issue of share capital 27 13,700 – 13,700 –
Transaction costs of share issue (726) – (726) –
Dividends paid 12 (15,869) (11,831) (15,869) (11,831)
Finance costs – excluding foreign exchange gains/losses 8 (795) (1,086) (335) (560)
Net cash (used in)/generated from financing activities (9,843) (14,173) 12,581 (9,291)
Net increase/(decrease) in cash and cash equivalents 2,802 162 (548) 296
Cash and cash equivalents at beginning of period 5,331 5,708 924 410
Unrealised foreign currency gain/(loss) (34) (539) 973 218
Cash and cash equivalents at end of period 8,099 5,331 1,349 924
The notes on pages 81 to 118 are an integral part of these consolidated financial statements.
F I N A N C I A L S T A T E M E N T S
APG_AR17_28.03.18_BACK_ARTWORK
ANGLO PACIFIC GROUP PLC ANNUAL REPORT & ACCOUNTS 201780
CONSOLIDATED STATEMENT OF CASH FLOWS AND COMPANY STATEMENT OF CASH FLOWSfor the year ended December 31, 2017
1 GENER AL INFORMATION
Anglo Pacific Group PLC (the ‘Company’) and its subsidiaries (together, the ‘Group’) secure natural resources royalties and streams by creating new royalties directly with operators or by acquiring existing royalties. The Group has royalties and investments in mining and exploration interests primarily in Australia, North and South America and Europe, with a diversified exposure to commodities represented by coal, vanadium, uranium, gold and iron ore.
The Company is a public limited company, which is listed on the London Stock Exchange and Toronto Stock Exchange and incorporated and domiciled in the United Kingdom. The address of its registered office is 1 Savile Row, London, W1S 3JR, United Kingdom (registered number: 897608).
2 CRITICAL ACCOUNTING JUDGEMENTS AND KEY SOURCES OF ESTIMATION UNCERTAINT Y
In the application of the Group’s accounting policies, the Directors are required to make judgements and estimates that can have a significant impact on the financial statements. Estimates and judgements are regularly evaluated and are based on historical experience and other factors, including expectations of future events that are believed to be reasonable under the circumstances. The most critical accounting judgement relates to the classification of royalty arrangements and the key sources of estimation uncertainty relate to the calculation of the fair value of certain royalty arrangements and the key assumption used when assessing impairment of property, plant and equipment and intangible assets. The use of inaccurate or unreasonable assumptions in assessments made for any of these estimates could result in a significant impact on the financial results.
Critical accounting judgements
Classification of royalty arrangements: initial recognition and subsequent measurement
The Directors must decide whether the Group’s royalty arrangements should be classified as:
• Intangible Assets in accordance with IAS 38 ‘Intangible assets’;
• Financial Assets in accordance with IAS 32 ‘Financial Instruments: Presentation’ and IAS 39 ‘Financial Instruments: Recognition and Measurement’; or
• Investment properties in accordance with IAS 40 ‘Investment Property’.
The Directors use the following selection criteria to identify the characteristics which determine which accounting standard to apply to each royalty arrangement:
Type 1 – Intangible assets (“vanilla” royalties): Royalties, in their simplest form, are classified as intangible assets by the Group. The Group considers the substance of a simple vanilla royalty to be economically similar to holding a direct interest in the underlying mineral asset. Existence risk (the commodity physically existing in the quantity demonstrated), production risk (that the operator can achieve production and operate a commercially viable project), timing risk (commencement and quantity produced, determined by the operator) and price risk (returns vary depending on the future commodity price, driven by future supply and demand) are all risks which the Group participates in on a similar basis to an owner of the underlying mineral licence. Furthermore, in a vanilla royalty, there is only a right to receive cash to the extent there is production and there are no interest payments, minimum payment obligations or means to enforce production or guarantee repayment. These are accounted for as intangible assets under IAS 38.
Type 2 – Financial assets (royalties with additional financial protection): In certain circumstances where the ‘vanilla’ risk is considered too high, but the Group still fundamentally believes in the quality or potential of the underlying resource, the Group will look to introduce additional protective measures. This has typically taken the form of performance milestone penalties (usually resulting in the receipt of cash or cash equivalent), minimum payment terms and interest provisions or mechanisms to convert the initial outlay into the equity instruments of the operator in the event of project deferral. Once an operation is in production, these mechanisms generally fall away such that the royalty will display identical characteristics and risk profile to the vanilla royalties; however, it is the contractual right to enforce the receipt of cash through to production which results in these royalties being treated as financial assets in accordance with IAS 32 and IAS 39.
Type 3 – Investment property: Royalties which are derived from the ownership of sub-stratum land are accounted for as investment properties under IAS 40, even though the substance of their commercial terms is identical to vanilla royalties. The Group does not expect to obtain royalties in this manner going forward, as it is unusual for sub-stratum minerals not to be the property of the state.
APG_AR17_28.03.18_BACK_ARTWORK
ANGLO PACIFIC GROUP PLC ANNUAL REPORT & ACCOUNTS 2017 81G
RO
UP O
VER
VIE
W S
TRATEG
IC R
EPO
RT G
OV
ERN
AN
CE F
INA
NC
IAL S
TAT
EM
EN
TS
OTH
ER IN
FOR
MATIO
N
NOTES TO THE CONSOLIDATED FINANCIAL STATEMENTSfor the year ended December 31, 2017
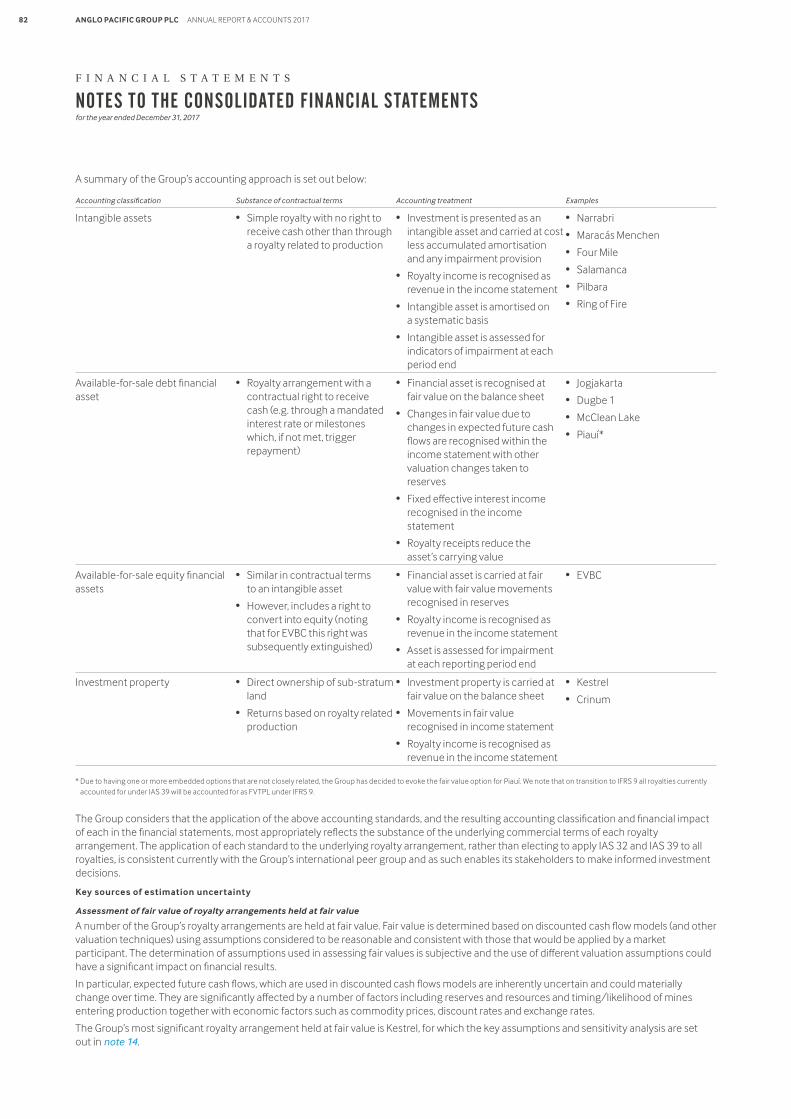
A summary of the Group’s accounting approach is set out below:
Accounting classification Substance of contractual terms Accounting treatment Examples
Intangible assets • Simple royalty with no right to receive cash other than through a royalty related to production
• Investment is presented as an intangible asset and carried at cost less accumulated amortisation and any impairment provision
• Royalty income is recognised as revenue in the income statement
• Intangible asset is amortised on a systematic basis
• Intangible asset is assessed for indicators of impairment at each period end
• Narrabri
• Maracás Menchen
• Four Mile
• Salamanca
• Pilbara
• Ring of Fire
Available-for-sale debt financial asset
• Royalty arrangement with a contractual right to receive cash (e.g. through a mandated interest rate or milestones which, if not met, trigger repayment)
• Financial asset is recognised at fair value on the balance sheet
• Changes in fair value due to changes in expected future cash flows are recognised within the income statement with other valuation changes taken to reserves
• Fixed effective interest income recognised in the income statement
• Royalty receipts reduce the asset’s carrying value
• Jogjakarta
• Dugbe 1
• McClean Lake
• Piauí*
Available-for-sale equity financial assets
• Similar in contractual terms to an intangible asset
• However, includes a right to convert into equity (noting that for EVBC this right was subsequently extinguished)
• Financial asset is carried at fair value with fair value movements recognised in reserves
• Royalty income is recognised as revenue in the income statement
• Asset is assessed for impairment at each reporting period end
• EVBC
Investment property • Direct ownership of sub-stratum land
• Returns based on royalty related production
• Investment property is carried at fair value on the balance sheet
• Movements in fair value recognised in income statement
• Royalty income is recognised as revenue in the income statement
• Kestrel
• Crinum
* Due to having one or more embedded options that are not closely related, the Group has decided to evoke the fair value option for Piauí. We note that on transition to IFRS 9 all royalties currently accounted for under IAS 39 will be accounted for as FVTPL under IFRS 9.
The Group considers that the application of the above accounting standards, and the resulting accounting classification and financial impact of each in the financial statements, most appropriately reflects the substance of the underlying commercial terms of each royalty arrangement. The application of each standard to the underlying royalty arrangement, rather than electing to apply IAS 32 and IAS 39 to all royalties, is consistent currently with the Group’s international peer group and as such enables its stakeholders to make informed investment decisions.
Key sources of estimation uncertainty
Assessment of fair value of royalty arrangements held at fair value
A number of the Group’s royalty arrangements are held at fair value. Fair value is determined based on discounted cash flow models (and other valuation techniques) using assumptions considered to be reasonable and consistent with those that would be applied by a market participant. The determination of assumptions used in assessing fair values is subjective and the use of different valuation assumptions could have a significant impact on financial results.
In particular, expected future cash flows, which are used in discounted cash flows models are inherently uncertain and could materially change over time. They are significantly affected by a number of factors including reserves and resources and timing/likelihood of mines entering production together with economic factors such as commodity prices, discount rates and exchange rates.
The Group’s most significant royalty arrangement held at fair value is Kestrel, for which the key assumptions and sensitivity analysis are set out in note 14.
F I N A N C I A L S T A T E M E N T S
APG_AR17_28.03.18_BACK_ARTWORK
ANGLO PACIFIC GROUP PLC ANNUAL REPORT & ACCOUNTS 201782
NOTES TO THE CONSOLIDATED FINANCIAL STATEMENTSfor the year ended December 31, 2017
Impairment review of intangible assets
Intangible assets are assessed for indicators of impairment at each reporting date with the assessment considering variables such as the production profiles, production commissioning dates where applicable, forecast commodity prices and guidance from the mine operators.
Where indicators are identified, the starting point for the impairment review will be to measure the expected future cash flows expected from the royalty arrangement should the project continue/come into production. A pre-tax nominal discount rate of between 6.50% and 18.00% is applied to the future cash flows. The discount rate of each royalty arrangement is derived using a capital asset pricing model specific to the underlying project, making reference to the risk free rate of return expected on an investment with the same time horizon as the expected mine life, together with the country risk associated with the location of the operation. Changes in discount rate are most sensitive to changes in the risk free rate and the expected mine life.
The outcome of this net present value calculation is then risk weighted to reflect management’s current assessment of the overall likelihood and timing of each project coming into production and royalty income arising. This assessment is impacted by news flow relating to the underlying operation in the period, in conjunction with management’s assessment of the economic viability of the project based on commodity price projections.
Uncertain tax provisions
The Group has incurred significant losses and impairment charges over the last four years. These losses have resulted, in some instances, in capital restructuring involving related Group entities, for which the Group obtained advice from professional advisors. This advice involved the interpretation of certain tax legislation for which there is no clear precedent or guidance. Absent clear guidance from relevant tax authorities there is the possibility that those tax authorities could interpret the legislation in a different way from the Group, which could result in a material reduction in the deferred tax asset and the recognition of a material current tax provision at December 31, 2017. These amounts are estimated at £3.3m and £3.6m respectively. See note 10 for further details.
3 SIGNIFICANT ACCOUNTING POLICIES
The principal accounting policies applied in the preparation of these consolidated financial statements are set out below. These policies have been consistently applied to all the years presented unless otherwise stated.
3.1 Basis of preparation
The financial statements have been prepared in accordance with International Financial Reporting Standards (IFRSs). The financial statements have also been prepared in accordance with IFRSs adopted by the European Union and therefore the Group financial statements comply with Article 4 of the EU IAS Regulation.
The financial statements have been prepared on the historical costs basis, as modified by the revaluation of coal royalties (investment property) and certain financial instruments.
The preparation of financial statements in conformity with IFRS requires the use of certain critical accounting estimates. It also requires management to exercise its judgement in the process of applying the Group’s accounting policies. The areas involving a higher degree of judgement or complexity, or areas where assumptions and estimates are significant to the consolidated financial statements are disclosed in note 2.
We highlight on the face of the income statement the following material balances which have been separated to assist users understand the performance of the Group:
• Gain/(Loss) on sale of mining and exploration interests (refer to note 17)
• Impairment of mining and exploration interests (refer to note 17)
• Impairment of royalty and exploration intangible assets (refer to note 16)
• Revaluation of royalty financial instruments (refer to note 15)
• Revaluation of coal royalties – Kestrel (refer to note 14)
3.1.1 Going concern
The financial position of the Group and its cash flows are set out on pages 77 and 80. The Directors have considered the principal risks of the Company which are set out on page 18 to 23 as well as access to funding as set out in our borrowings note 24 and considered key sensitivities which could impact on the level of available borrowings. As at December 31, 2017, the Group had cash and cash equivalents of £8.1m and subject to continued covenant compliance, has access to £29.6m through its undrawn secured US$40.0m revolving credit facility.
The Directors have considered the Group’s cash flow forecasts for the period to the end of March 2019. The Board is satisfied that the Group’s forecasts and projections, taking into account reasonably possible changes in trading performance and other uncertainties, together with the Group’s cash position and access to the undrawn revolving credit facility, show that the Group will be able to operate within the level of its current facilities for the foreseeable future. For this reason the Group continues to adopt the going basis in preparing its financial statements.
3.1.2 Changes in accounting policies and disclosures
(a) Amendments to IFRSs that are mandatorily effective for the current year
In the current year, the Group has applied a number of amendments to IFRSs issued by the International Accounting Standards Board (IASB) that are mandatorily effective for an accounting period that begins on or after January 1, 2017:
• Annual Improvements to IFRSs 2014-2016 cycle: IFRS 12 Disclosure of Interests in Other Entities
• Amendments to IAS 7 Statement of Cash Flows: Disclosure Initiative
• Amendments to IAS 12 Income Taxes: Recognition of Deferred Tax Assets for Unrealised Losses
APG_AR17_28.03.18_BACK_ARTWORK
ANGLO PACIFIC GROUP PLC ANNUAL REPORT & ACCOUNTS 2017 83G
RO
UP O
VER
VIE
W S
TRATEG
IC R
EPO
RT G
OV
ERN
AN
CE F
INA
NC
IAL S
TAT
EM
EN
TS
OTH
ER IN
FOR
MATIO
N
The adoption of these amendments has not had a significant impact on the accounting policies, methods of computation or presentation applied by the Group.
The Group has not early adopted any other amendment, standard or interpretation that has been issued but is not yet effective. It is expected that where applicable, these standards and amendments will be adopted on each respective effective date.
(b) New and revised IFRSs in issue but not yet effective
At the date of authorisation of these financial statements, the Group has not applied the following new and revised IFRSs that have been issued but are not yet effective and in some cases had not yet been adopted by the EU:
IFRS 15 Revenue from Contracts with Customers
The Group’s royalty income is derived from three sources: assets accounted for as investment property (Kestrel) under IAS 40, assets at fair value (EVBC) accounted for under IAS 39 and assets accounted for as intangibles (Narrabri, Maracás Menchen and Four Mile) under IAS 38.
The royalty income derived from investment properties will continue to be accounted for in accordance with IAS 40, while the royalty income derived from assets at fair value will be accounted for under IFRS 9 following its adoption. The royalty income derived from assets classified as intangibles will be accounted for in accordance with IFRS 15, which the Directors do not believe will have a material impact on the recognition and disclosure of revenue.
IFRS 9 Financial Instruments
The impact of adopting IFRS 9 on the Group’s results for the year ended December 31, 2017 would have been as follows:
Classification and measurement
The measurement and accounting treatment of the Group’s financial assets impacted by the application of IFRS 9 are outlined in the table below:
Assets IFRS 9 Classification IFRS 9 Accounting Treatment
Royalty Financial Instruments
• McClean Lake
• Dugbe 1
• Piauí
• EVBC
• Jogjakarta
Fair value through profit or loss (‘FVTPL’)
Held at fair value on the balance sheet, with fair value movements taken through the income statement.
Royalty income is not recognised as revenue in the income statement and instead reduces the fair value of the asset.
Other non-current receivables
• McClean Lake
Amortised cost Carried at amortised cost less impairment on the balance sheet, interest is recognised in the income statement at the effective interest rate for the asset.
Mining and exploration interests Fair value through other comprehensive income (‘FVOCI’)
Held at fair value on the balance sheet, with fair value movements taken through other comprehensive income and not recycled to the income statement on disposal.
Dividends recognised as income in the income statement.
There would have been no impact on the Group’s net assets at January 1, 2017 or December 31, 2017. The Group’s results for the year would have reduced from the reported profit after tax of £11,203,000 to £8,222,000 as a result of the following:
• (£1,774,000) – gain on disposal of mining and exploration interest, no longer recycled and recognised in the income statement;
• (£1,689,000) – royalty income received from EVBC, now recognised in the fair value movement; and
• £482,000 – revaluation of EVBC now recognised in the income statement (net of deferred tax).
Impairment
IFRS 9 introduces an ‘expected credit loss’ model for the assessment of impairment of financial assets held at amortised costs. The Group has not undertaken a detailed assessment of expected credit loss applicable to the Group’s other non-current receivable arising from the Denison transaction, however, it is not expected to have a material impact on the Group’s results. The Group’s royalty financial instrument in relation to the Jogjakarta royalty was fully impaired during 2017 and therefore no further losses would arise from expected credit loss.
IFRS 9 and IFRS 15 became effective for the Group from January 1, 2018. As the effects of applying these standards are considered immaterial to the Group, the Group has elected not to restate prior period on adoption of the new standards in 2018.
F I N A N C I A L S T A T E M E N T S
APG_AR17_28.03.18_BACK_ARTWORK
ANGLO PACIFIC GROUP PLC ANNUAL REPORT & ACCOUNTS 201784
NOTES TO THE CONSOLIDATED FINANCIAL STATEMENTSfor the year ended December 31, 2017
IFRS 16 Leases
IFRS 16 was published in January 2016 and will be effective for the Group from January 1, 2019, replacing IAS 17 Leases.
The principal impact of IFRS 16 will be to change the accounting treatment by lessees of leases currently classified as operating leases. Lease agreements will give rise to the recognition by the lessee of an asset, representing the right to use the leased item, and a related liability for future lease payments. Lease costs will be recognised in the income statement in the form of depreciation of the right-of-use asset over the lease term, and finance charges representing the unwinding of the discount on the lease liability.
As the Group’s operating leases relate primarily to office space and office equipment, the adoption of IFRS 16 is not expected to result in a material increase in lease liabilities or a corresponding increase in property, plant and equipment right-of-use assets. Information on the Group’s operating lease commitments is disclosed in note 30.
Other issued standards and amendments that are not yet effective are not expected to have a significant impact on the financial statements.
3.2 Consolidation
Subsidiaries
The financial statements incorporate a consolidation of the financial statements of the Company and entities controlled by the Company (its subsidiaries). Control is achieved when the Company has the power over the investee, is exposed, or has rights, to variable returns from its involvement with the investee and has the ability to affect those returns through its power over the investee.
The existence and effect of potential voting rights that are currently exercisable or convertible are considered when assessing whether the Group controls another entity. Subsidiaries are fully consolidated from the date on which control is transferred to the Group. They are de-consolidated from the date that control ceases.
Investments in subsidiaries are accounted for in the parent company at cost less impairment. Cost is adjusted to reflect changes in consideration arising from contingent consideration amendments.
Inter-company transactions, balances and unrealised gains on transactions between Group companies are eliminated on consolidation. Unrealised losses are also eliminated. Accounting policies of subsidiaries have been changed where necessary to ensure consistency with the policies adopted by the Group.
3.3 Foreign currencies
(a) Functional and presentation currency
Items included in the financial statements of each of the Group’s entities are measured using the currency of the primary economic environment in which the entity operates (‘the functional currency’). The consolidated financial statements are presented in pounds sterling, which is the Company’s functional and the Group’s presentation currency.
(b) Transactions and balances
Foreign currency transactions are translated into the functional currency of the respective Group entity, using the exchange rates prevailing at the dates of the transactions or valuation where items are re-measured. Foreign exchange gains and losses resulting from the settlement of such transactions and from the translation at year end exchange rates of monetary assets and liabilities denominated in foreign currencies are recognised in the income statement. Non-monetary assets and liabilities measured at historical cost are translated using the exchange rates at the date of the transaction (and not retranslated). Non-monetary assets and liabilities measured at fair value are translated using the exchange rates at the date when fair value was determined.
(c) Group companies
The results and financial position of all the Group entities that have a functional currency different from the presentation currency are translated into the presentation currency as follows:
(i) assets and liabilities for each balance sheet presented are translated at the closing rate at the date of that balance sheet;
(ii) income and expenses for each income statement are translated at average exchange rates; and
(iii) all resulting exchange differences are charged/credited to other comprehensive income and recognised in the currency translation reserve in equity.
Exchange differences on foreign currency balances with foreign operations for which settlement is neither planned nor likely to occur in the foreseeable future, and therefore form part of the Group’s net investment in these foreign operations, are recognised in other comprehensive income and accumulated in the foreign currency translation reserve in equity. If a foreign operation is partially disposed of or sold, exchange differences that were recorded in equity are reclassified in the income statement as part of the gain or loss on sale.
APG_AR17_28.03.18_BACK_ARTWORK
ANGLO PACIFIC GROUP PLC ANNUAL REPORT & ACCOUNTS 2017 85G
RO
UP O
VER
VIE
W S
TRATEG
IC R
EPO
RT G
OV
ERN
AN
CE F
INA
NC
IAL S
TAT
EM
EN
TS
OTH
ER IN
FOR
MATIO
N
3.4 Property, plant and equipment
Property, plant and equipment is stated at cost, less accumulated depreciation and accumulated impairment losses. The cost of property, plant and equipment comprises its purchase price and any costs directly attributable to bringing the asset to the location and condition necessary for it to be capable of operating in the manner intended by management. Once a mining project has been established as commercially viable, expenditure other than that on land, buildings, plant and equipment is capitalised as a producing asset within ‘Other Assets’ together with any amount transferred from ‘Exploration and Evaluation Costs’ (note 3.6(b)).
Property, plant and equipment is depreciated over its useful life, or, where applicable, over the remaining life of the mine if shorter once it is operating in the manner intended by management. The major categories of property, plant and equipment are depreciated on a units of production and/or straight-line basis as follows:
Equipment and fixtures 4 to 10 years
Other Assets:
Producing assets Units of production (over reserves)
Coal tenures Units of production (over reserves)
The gain or loss arising on the disposal or retirement of an asset is determined as the difference between the sales proceeds and the carrying amount of the asset and is recognised in profit or loss.
3.5 Coal royalties (investment property)
Royalty arrangements which are derived from the ownership of sub-stratum lands are accounted for as investment properties in accordance with IAS 40. Investment property is held to earn a return in the form of royalty entitlements arising from mining activity and is initially measured at cost including any transaction costs. Investment property is subsequently measured at fair value at each reporting date with any valuation movements recognised in the income statement. Fair value is determined by a suitably qualified independent external consultant based on the discounted future royalty income expected to accrue to the Group.
3.6 Intangible assets
(a) Royalty arrangements
Royalty arrangements which are identified and classified as intangible assets are initially measured at cost, including any transaction costs.
Upon commencement of production at the underlying mining operation intangible assets are amortised on a straight-line basis over the life of the mine. Amortisation rates are adjusted on a prospective basis for all changes to estimates of the life of mine.
(b) Exploration and evaluation costs
Exploration expenditure relates to the initial search for deposits with economic potential. Evaluation expenditure arises from a detailed assessment of deposits or other projects that have been identified as having economic potential.
Expenditure on exploration and evaluation activities is capitalised when there is a high degree of confidence in the project’s viability and hence it is probable that future economic benefits will flow to the Group. If this is no longer the case, an impairment loss is recognised in the income statement. Amortisation of capitalised exploration and evaluation costs does not commence until the underlying project commences commercial production.
3.7 Impairment of property, plant and equipment and intangible assets
At each reporting date, the Group reviews the carrying amounts of its property, plant and equipment and intangible assets to determine whether there is any indication that those assets are impaired. If such an indication is identified, the recoverable amount of the asset is estimated in order to determine the extent of any impairment.
The recoverable amount is the higher of fair value (less costs of disposal) and value in use. In assessing value in use, the estimated cash flows are discounted to their present value using a pre-tax discount rate that has been adjusted to reflect the risks specific to that asset. If the recoverable amount of the asset is estimated to be less than its carrying value, the carrying amount of the asset is reduced to its recoverable amount. An impairment loss is also recognised in the income statement.
Should an impairment loss subsequently reverse, the carrying amount of the asset is increased to the revised estimate of its recoverable amount, but so that the increased carrying amount does not exceed the carrying amount that would have been determined had no impairment been recognised. A reversal of an impairment loss is also recognised in the income statement.
3.8 Financial instruments
Financial assets and financial liabilities are recognised on the Group’s balance sheet when the Group has become a party to the contractual provisions of the instrument.
(a) Cash and cash equivalents
Cash and cash equivalents comprise cash on hand and demand deposits, together with other short-term, highly liquid investments that are readily convertible into known amounts of cash and which are subject to an insignificant risk of changes in value.
(b) Loans and receivables
Loans and receivables are non-derivative financial assets with fixed or determinable payments that are not quoted in an active market. On initial recognition loans and receivables are stated at their fair value. After initial recognition these are measured at amortised cost using the effective interest method, less provision for impairment. Discounting is omitted where the effect of discounting is immaterial. The Group’s trade and other receivables fall into this category of financial instruments.
F I N A N C I A L S T A T E M E N T S
APG_AR17_28.03.18_BACK_ARTWORK
ANGLO PACIFIC GROUP PLC ANNUAL REPORT & ACCOUNTS 201786
NOTES TO THE CONSOLIDATED FINANCIAL STATEMENTSfor the year ended December 31, 2017
(c) Derivative financial instruments
The Group will selectively enter into foreign exchange forward contracts to manage its exposure to foreign exchange risk associated with its Australian dollar denominated royalty income, when considered necessary. Further details of derivative financial instruments are disclosed in note 21.
Derivatives are initially recognised at fair value at the date a derivative contract is entered into and are subsequently remeasured to their fair value at each balance sheet date. The resulting gain or loss is recognised in profit or loss immediately.
A derivative with a positive fair value is recognised as a financial asset whereas a derivative with a negative fair value is recognised as a financial liability. A derivative is presented as a non-current asset or a non-current liability if the remaining maturity of the instrument is more than 12 months and it is not expected to be realised or settled within 12 months. Other derivatives are presented as current assets or current liabilities.
(d) Mining and exploration interests
Mining and exploration interests are recognised and derecognised on a trade date where a purchase or sale of an investment is under a contract whose terms require delivery of the investment within the time frame established by the market concerned, and are initially measured at fair value, including transaction costs.
Mining and exploration interests are classified upon initial recognition as available-for-sale financial assets.
Interests classified as available-for-sale are measured at subsequent reporting dates at their fair value. For available-for-sale investments, unrealised gains and losses arising from changes in fair value are recognised directly in other comprehensive income and accumulated in the investment revaluation reserve, until the security is either disposed of or is determined to be impaired, at which time the cumulative gain or loss previously recognised in other comprehensive income is included in profit or loss for the period. Unquoted investments are measured at cost where fair value cannot be reliably determined. When a market price can be established these investments are revalued to fair value accordingly.
(e) Royalty instruments
Royalty instruments are recognised or derecognised on completion date where a purchase or sale of the royalty is under a contract, and are initially measured at fair value, including transaction costs.
Royalty instruments are classified as either debt or equity instruments depending on the nature of the individual agreement.
Debt
Assets classified as debt instruments are carried on the balance sheet at fair value. Upon initial recognition an effective interest rate is computed based on the estimated future cash flows. Expected future cash flows are determined based on non-observable market data such as commodity price forecasts and estimated production schedules. Valuation movements caused by changes in expected future cash flows, which could be caused by changes in resource estimates or commodity price assumptions, are recognised in the Income Statement along with the effective interest, if material, with other valuation changes taken to other comprehensive income. Amounts are required to be recognised whether received in cash or not.
Equity
Similar to debt instruments, equity instruments are carried at fair value at each reporting date, based on the estimated future cash flows from the underlying operation. All valuation movements are recognised in other comprehensive income, except to the extent where valuation is below cost and is considered ‘significant’ or ‘prolonged’ in accordance with IAS 39 and the policy outlined in note 3.9. In this case, the valuation difference is recycled through the Income Statement.
(f ) Financial liabilities and equity instruments
Financial liabilities and equity instruments are classified according to the substance of the contractual arrangements entered into. An equity instrument is any contract that evidences a residual interest in the assets of the Group after deducting all of its liabilities.
(g) Trade payables
Trade payables are not interest bearing and are stated at their fair value on initial recognition. After initial recognition these are measured at amortised cost using the effective interest method.
(h) Borrowings
Interest bearing bank facilities are initially recognised at fair value, net of directly attributable transaction costs. Transaction costs are recognised in the income statement on a straight-line basis over the term of the facility.
(i) Equity instruments
Equity instruments issued by the Company are recorded as the proceeds received, net of direct issue costs.
3.9 Impairment of f inancial assets (including receivables)
A financial asset not measured at fair value through profit or loss is assessed at each reporting date to determine whether there is any objective evidence that it is impaired. A financial asset is impaired if objective evidence indicates that a loss event has occurred after the initial recognition of the asset.
APG_AR17_28.03.18_BACK_ARTWORK
ANGLO PACIFIC GROUP PLC ANNUAL REPORT & ACCOUNTS 2017 87G
RO
UP O
VER
VIE
W S
TRATEG
IC R
EPO
RT G
OV
ERN
AN
CE F
INA
NC
IAL S
TAT
EM
EN
TS
OTH
ER IN
FOR
MATIO
N
An impairment loss in respect of a financial asset measured at amortised cost is calculated as the difference between its carrying amount and the present value of the estimated cash flows discounted at the asset’s original effective interest rate. Losses are recognised in the income statement. When a subsequent event causes the amount of impairment loss to decrease, the decrease in impairment loss is reversed through the income statement.
Impairment losses relating to available-for-sale equity investments are recognised when the decline in fair value is considered significant or prolonged, which are defined as follows:
• Prolonged: a period of greater than 18 months that the interest’s fair value is below cost; or
• Significant: a decline in fair value of greater than 25% relative to an individual asset’s original acquisition cost, or its rebased cost post impairment.
These impairment losses are recognised by transferring the cumulative loss that has been recognised in the statement of comprehensive income to the income statement. The loss recognised in the income statement is the difference between the acquisition cost or rebased cost and the current fair value. Once the Group has recognised an impairment loss on an available-for-sale equity investment, it cannot recognise a reversal through the income statement.
Impairment losses on debt instruments classified as available-for-sale are reversed only if in a subsequent period, the fair value of that debt instrument increases and the increase can be objectively related to an event occurring after the impairment loss was recognised. The amount of such reversal is recognised through the income statement.
3.10 Taxation
The tax expense represents the sum of the tax currently payable and deferred tax.
Current tax
The tax currently payable is based on taxable profit for the year. Taxable profit differs from net profit as reported in the income statement because it excludes items of income or expense that are taxable or deductible in other years and it further excludes items that are never taxable or deductible. The Group’s liability for current tax is calculated by using tax rates and laws that have been enacted or substantively enacted by the reporting date.
Deferred tax
Deferred tax is the tax expected to be payable or recoverable on differences between the carrying amount of assets and liabilities in the financial statements and the corresponding tax bases used in the computation of taxable profit, and is accounted for using the balance sheet liability method. Deferred tax liabilities are generally recognised for all taxable temporary differences and deferred tax assets are recognised to the extent that it is probable that taxable profits will be available against which deductible temporary differences can be utilised. Such assets and liabilities are not recognised if the temporary difference arises from the initial recognition of goodwill or from the initial recognition (other than in a business combination) of other assets and liabilities in a transaction that affects neither the taxable profit nor the accounting profit.
Deferred tax liabilities are recognised for taxable temporary differences arising on investments in subsidiaries and associates, and interests in joint ventures, except where the Group is able to control the reversal of the temporary difference and it is probable that the temporary difference will not reverse in the foreseeable future. Deferred tax assets arising from deductible temporary differences associated with such investments and interests are only recognised to the extent that it is probable that there will be sufficient taxable profits against which to utilise the benefits of the temporary differences and they are expected to reverse in the foreseeable future.
The carrying amount of deferred tax assets is reviewed at each balance sheet date and reduced to the extent that it is no longer probable that sufficient taxable profits will be available to allow all or part of the asset to be recovered.
Deferred tax is calculated at the tax rates that are expected to apply to the period when the liability is settled or the asset is realised based on tax laws and rates that have been enacted or substantively enacted at the balance sheet date.
The measurement of deferred tax liabilities and assets reflects the tax consequences that would follow from the manner in which the Group expects, at the end of the reporting period, to recover or settle the carrying amount of its assets and liabilities.
Deferred tax assets and liabilities are offset when there is a legally enforceable right to set off current tax assets against current tax liabilities and when they relate to income taxes levied by the same taxation authority and the Group intends to settle its current tax assets and liabilities on a net basis.
Current and deferred tax for the year
Current and deferred tax are recognised in profit or loss, except when they related to items that are recognised in other comprehensive income or directly in equity, in which case, the current and deferred tax are also recognised in other comprehensive income or directly in equity respectively. Where current tax or deferred tax arises from the initial accounting for a business combination, the tax effect is included in the accounting for the business combination.
F I N A N C I A L S T A T E M E N T S
APG_AR17_28.03.18_BACK_ARTWORK
ANGLO PACIFIC GROUP PLC ANNUAL REPORT & ACCOUNTS 201788
NOTES TO THE CONSOLIDATED FINANCIAL STATEMENTSfor the year ended December 31, 2017
3.11 Share based payments
The Group operates a number of equity-settled, share-based compensation plans, under which the entity receives services from employees as consideration for equity instruments (options and jointly-owned shares) of the Company.
The fair value of the employee services received in exchange for the grant of the options is recognised as an expense. The total amount to be expensed is determined by reference to the fair value of the options granted:
• including any market performance conditions;
• excluding the impact of any service and non-market performance vesting conditions; and
• including the impact of any non-vesting conditions.
Non-market vesting conditions are included in assumptions about the number of options and jointly-owned shares that are expected to vest. The total expense is recognised over the vesting period, which is the period over which all of the specified vesting conditions are to be satisfied. At the end of each reporting period, the entity revises its estimates of the number of options and jointly-owned shares that are expected to vest based on the non-market vesting conditions. It recognises the impact of the revision to original estimates, if any, in the income statement, with a corresponding adjustment to equity.
When options are exercised, the Company issues new shares. The proceeds received net of any directly attributable transaction costs are credited to share capital and share premium when the options are exercised.
3.12 Reserves
Equity comprises the following:
• ‘Share capital’ represents the nominal value of equity shares in issue.
• ‘Share premium’ represents the excess over nominal value of the fair value of consideration received for equity shares, net of issuance costs.
Other reserves
• ‘Merger reserve’ is created when more than 90% of the shares in a subsidiary are acquired and the consideration includes the issue of new shares by the Company.
• ‘Warrant reserve’ The warrant reserve was created in June 2014 in connection with the issue of share warrants as part consideration of the Maracás royalty.
• ’Investment revaluation reserve‘ represents gains and losses due to the revaluation of the investments in mining and exploration interests and royalty instruments from the opening carrying values, including the effects of deferred tax and foreign currency changes.
• ‘Share based payment reserve’ represents equity-settled share-based employee remuneration until such share options are exercised.
• ‘Foreign currency reserve’ represents the differences arising from translation of investments in overseas subsidiaries.
• ‘Special reserve’ represents the level of profit attributable to the Group for the period ended June 30, 2002 which was created as part of a capital reduction performed in 2002.
• ‘Investment in own shares’ represents the shares held by the Anglo Pacific Group Employee Benefit Trust for awards made under the Joint Share Ownership Plan (‘JSOP’) (note 27 and note 28).
• ‘Retained earnings’ represents retained profits.
Of these reserves £88,601,000 are considered distributable as at December 31, 2017 (December 31, 2016: £93,928,000).
3.13 Revenue recognition
The revenue of the Group comprises mainly royalty income. It is measured at the fair value of the consideration received or receivable after deducting discounts, value added tax and other sales tax. The royalty income becomes receivable on extraction and sale of the relevant minerals, and once able to be reliably measured, the revenue is recognised.
Interest income is accrued on a time basis, by reference to the carrying value and at the effective interest rate applicable, which is the rate that exactly discounts estimated future cash receipts through the expected life of the financial asset to that asset’s net carrying amount.
Dividend income from investments is recognised when the shareholders’ rights to receive payment have been established.
3.14 Leases
Rentals payable under operating leases are charged to income on a straight-line basis over the term of the lease except where another more systematic basis is more representative of the time pattern in which economic benefits from the lease asset are consumed.
In the event that lease incentives are received to enter into operating leases, such incentives are recognised as a liability. The aggregate benefit of incentives is recognised as a reduction of rental expense on a straight-line basis over the lease, except where another systematic basis is more representative of the time pattern in which economic benefits from the leased asset are consumed.
3.15 Dividend distribution
Dividend distribution to the Company’s shareholders is recognised as a liability in the Group’s financial statements in the period in which the dividends are approved by the Company’s shareholders or, in the case of the interim dividend, when it is paid to the shareholders.
3.16 Alternative Performance Measures
The financial statements include certain Alternative Performance Measures (APMs) which include adjusted earnings per share, dividend cover and free cash flow per share. These APMs are defined in the table of contents and explained in the Strategic Report on page 24, and are reconciled to GAAP measures in the notes 11, 12 and 33 respectively.
APG_AR17_28.03.18_BACK_ARTWORK
ANGLO PACIFIC GROUP PLC ANNUAL REPORT & ACCOUNTS 2017 89G
RO
UP O
VER
VIE
W S
TRATEG
IC R
EPO
RT G
OV
ERN
AN
CE F
INA
NC
IAL S
TAT
EM
EN
TS
OTH
ER IN
FOR
MATIO
N
4 SEGMENT INFORMATION
The Group’s chief operating decision maker is considered to be the Executive Committee. The Executive Committee evaluates the financial performance of the Group based on a portfolio view of its individual royalty arrangements. Royalty income and its associated impact on operating profit is the key focus of the Executive Committee. The income from royalties is presented based on the jurisdiction in which the income is deemed to be sourced as follows:
Australia: Kestrel, Narrabri, Four Mile, Pilbara, Mount Ida
Americas: McClean Lake, Maracás Menchen, Ring of Fire, Piauí, Amapá and Tucano
Europe: EVBC, Salamanca, Bulqiza
Other: Jogjakarta, Dugbe I, and includes the Group’s mining and exploration interests
The following is an analysis of the Group’s results by reportable segment. The key segment result presented to the Executive Committee for making strategic decisions and allocation of resources is operating profit as analysed below.
The segment information for the year ended December 31, 2017 is as follows (noting that total segment operating profit corresponds to operating profit before impairments, revaluations and gains/losses on disposals which is reconciled to Profit/(Loss) before tax on the face of the consolidated income statement):
Australia Royalties
£’000
Americas Royalties
£’000
Europe Royalties
£’000
All other segments
£’000
Total
£’000
Royalty related income 33,692 2,001 1,689 – 37,382
Amortisation of royalties (2,623) (493) – – (3,116)
Operating expenses (2,987) – – (2,903) (5,890)
Total segment operating profit/(loss) 28,082 1,508 1,689 (2,903) 28,376
Total segment assets 168,823 43,122 6,328 35,089 253,362
Total assets include:
Additions to non-current assets (other than financial instruments and deferred tax assets) – – – – –
Total segment liabilities 30,539 – 676 2,732 33,947
The segment information for the year ended December 31, 2016 is as follows:
Australia Royalty
£’000
Americas Royalty
£’000
Europe Royalty
£’000
All other segments
£’000Total
£’000
Royalty related income 17,691 791 1,223 – 19,705
Amortisation of royalties (2,416) (453) – – (2,869)
Operating expenses (1,652) – – (2,478) (4,130)
Total segment operating profit/(loss) 13,623 338 1,223 (2,478) 12,706
Total segment assets 187,879 19,106 12,314 36,956 256,255
Total assets include:
Additions to non-current assets (other than financial instruments and deferred tax assets) – – – – –
Total segment liabilities 35,799 1,215 662 8,441 46,117
The amounts provided to the Executive Committee with respect to total segment assets are measured in a manner consistent with that of the financial statements. These assets are allocated based on the operations of the segment and the physical location of the asset.
The amounts provided to the Executive Committee with respect to total segment liabilities are measured in a manner consistent with that of the financial statements. These liabilities are allocated based on the operations of the segment.
The royalty related income in Australia of £33,692,000 (2016: £17,691,000) includes the Kestrel and Narrabri royalties which generated £28,746,000 and £4,946,000 respectively (2016: Kestrel £13,134,000; Narrabri: £4,243,000). Individually the revenue generated by Kestrel and Narrabri royalties represents greater than 10% of the Group’s revenue in 2016 and 2017.
Impairments
There has been no impairment of the Group’s royalty intangible assets during the year ended December 31, 2017. The Group recognised an impairment charge of £2.0m in relation to the Amapá royalty, which is within the “Americas Royalties” segment during the year ended December 31, 2016. Refer to note 16 for further details on the Group’s impairments.
F I N A N C I A L S T A T E M E N T S
APG_AR17_28.03.18_BACK_ARTWORK
ANGLO PACIFIC GROUP PLC ANNUAL REPORT & ACCOUNTS 201790
NOTES TO THE CONSOLIDATED FINANCIAL STATEMENTSfor the year ended December 31, 2017
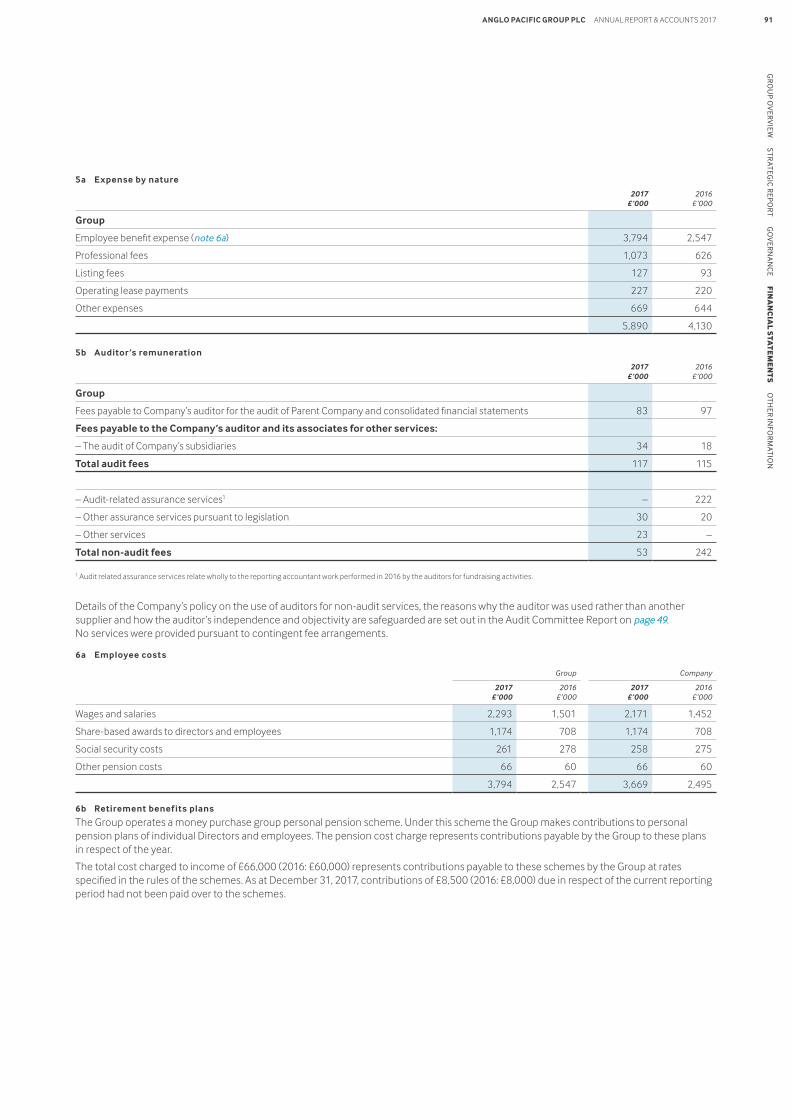
5a Expense by nature
2017 £’000
2016 £’000
Group
Employee benefit expense (note 6a) 3,794 2,547
Professional fees 1,073 626
Listing fees 127 93
Operating lease payments 227 220
Other expenses 669 644
5,890 4,130
5b Auditor ’s remuneration
2017 £’000
2016 £’000
Group
Fees payable to Company’s auditor for the audit of Parent Company and consolidated financial statements 83 97
Fees payable to the Company’s auditor and its associates for other services:
– The audit of Company’s subsidiaries 34 18
Total audit fees 117 115
– Audit-related assurance services1 – 222
– Other assurance services pursuant to legislation 30 20
– Other services 23 –
Total non-audit fees 53 242
1 Audit related assurance services relate wholly to the reporting accountant work performed in 2016 by the auditors for fundraising activities.
Details of the Company’s policy on the use of auditors for non-audit services, the reasons why the auditor was used rather than another supplier and how the auditor’s independence and objectivity are safeguarded are set out in the Audit Committee Report on page 49. No services were provided pursuant to contingent fee arrangements.
6a Employee costs
Group Company
2017 £’000
2016 £’000
2017 £’000
2016 £’000
Wages and salaries 2,293 1,501 2,171 1,452
Share-based awards to directors and employees 1,174 708 1,174 708
Social security costs 261 278 258 275
Other pension costs 66 60 66 60
3,794 2,547 3,669 2,495
6b Retirement benefits plans
The Group operates a money purchase group personal pension scheme. Under this scheme the Group makes contributions to personal pension plans of individual Directors and employees. The pension cost charge represents contributions payable by the Group to these plans in respect of the year.
The total cost charged to income of £66,000 (2016: £60,000) represents contributions payable to these schemes by the Group at rates specified in the rules of the schemes. As at December 31, 2017, contributions of £8,500 (2016: £8,000) due in respect of the current reporting period had not been paid over to the schemes.
APG_AR17_28.03.18_BACK_ARTWORK
ANGLO PACIFIC GROUP PLC ANNUAL REPORT & ACCOUNTS 2017 91G
RO
UP O
VER
VIE
W S
TRATEG
IC R
EPO
RT G
OV
ERN
AN
CE F
INA
NC
IAL S
TAT
EM
EN
TS
OTH
ER IN
FOR
MATIO
N
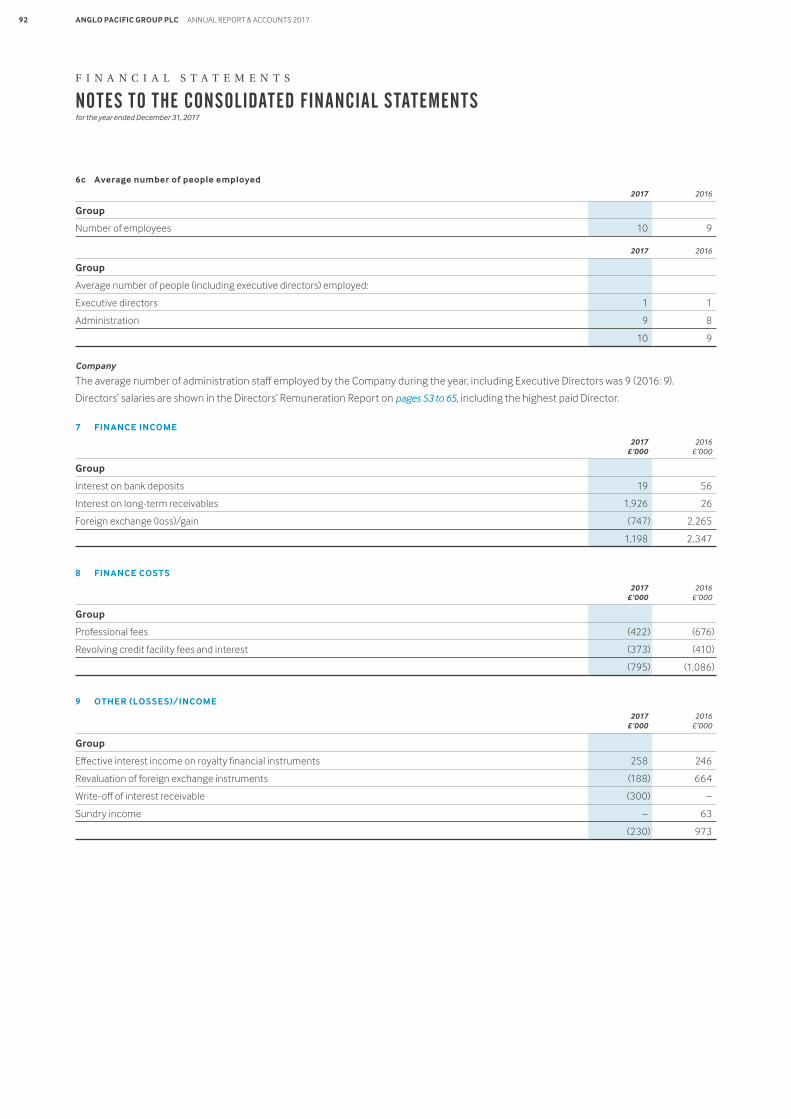
6c Average number of people employed
2017 2016
Group
Number of employees 10 9
2017 2016
Group
Average number of people (including executive directors) employed:
Executive directors 1 1
Administration 9 8
10 9
Company
The average number of administration staff employed by the Company during the year, including Executive Directors was 9 (2016: 9).
Directors’ salaries are shown in the Directors’ Remuneration Report on pages 53 to 65, including the highest paid Director.
7 FINANCE INCOME
2017 £’000
2016 £’000
Group
Interest on bank deposits 19 56
Interest on long-term receivables 1,926 26
Foreign exchange (loss)/gain (747) 2,265
1,198 2,347
8 FINANCE COSTS
2017 £’000
2016 £’000
Group
Professional fees (422) (676)
Revolving credit facility fees and interest (373) (410)
(795) (1,086)
9 OTHER (LOSSES)/INCOME
2017 £’000
2016 £’000
Group
Effective interest income on royalty financial instruments 258 246
Revaluation of foreign exchange instruments (188) 664
Write-off of interest receivable (300) –
Sundry income – 63
(230) 973
F I N A N C I A L S T A T E M E N T S
APG_AR17_28.03.18_BACK_ARTWORK
ANGLO PACIFIC GROUP PLC ANNUAL REPORT & ACCOUNTS 201792
NOTES TO THE CONSOLIDATED FINANCIAL STATEMENTSfor the year ended December 31, 2017
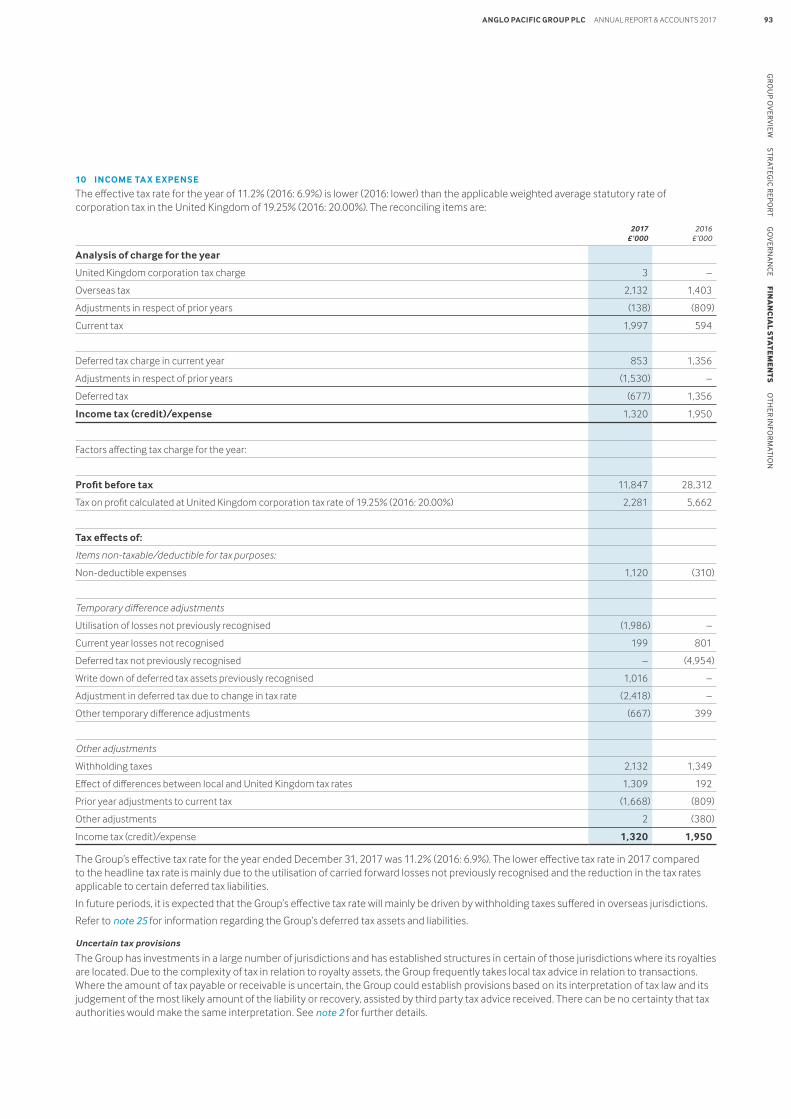
10 INCOME TA X EXPENSE
The effective tax rate for the year of 11.2% (2016: 6.9%) is lower (2016: lower) than the applicable weighted average statutory rate of corporation tax in the United Kingdom of 19.25% (2016: 20.00%). The reconciling items are:
2017 £’000
2016 £’000
Analysis of charge for the year
United Kingdom corporation tax charge 3 –
Overseas tax 2,132 1,403
Adjustments in respect of prior years (138) (809)
Current tax 1,997 594
Deferred tax charge in current year 853 1,356
Adjustments in respect of prior years (1,530) –
Deferred tax (677) 1,356
Income tax (credit)/expense 1,320 1,950
Factors affecting tax charge for the year:
Profit before tax 11,847 28,312
Tax on profit calculated at United Kingdom corporation tax rate of 19.25% (2016: 20.00%) 2,281 5,662
Tax effects of:
Items non-taxable/deductible for tax purposes:
Non-deductible expenses 1,120 (310)
Temporary difference adjustments
Utilisation of losses not previously recognised (1,986) –
Current year losses not recognised 199 801
Deferred tax not previously recognised – (4,954)
Write down of deferred tax assets previously recognised 1,016 –
Adjustment in deferred tax due to change in tax rate (2,418) –
Other temporary difference adjustments (667) 399
Other adjustments
Withholding taxes 2,132 1,349
Effect of differences between local and United Kingdom tax rates 1,309 192
Prior year adjustments to current tax (1,668) (809)
Other adjustments 2 (380)
Income tax (credit)/expense 1,320 1,950
The Group’s effective tax rate for the year ended December 31, 2017 was 11.2% (2016: 6.9%). The lower effective tax rate in 2017 compared to the headline tax rate is mainly due to the utilisation of carried forward losses not previously recognised and the reduction in the tax rates applicable to certain deferred tax liabilities.
In future periods, it is expected that the Group’s effective tax rate will mainly be driven by withholding taxes suffered in overseas jurisdictions.
Refer to note 25 for information regarding the Group’s deferred tax assets and liabilities.
Uncertain tax provisions
The Group has investments in a large number of jurisdictions and has established structures in certain of those jurisdictions where its royalties are located. Due to the complexity of tax in relation to royalty assets, the Group frequently takes local tax advice in relation to transactions. Where the amount of tax payable or receivable is uncertain, the Group could establish provisions based on its interpretation of tax law and its judgement of the most likely amount of the liability or recovery, assisted by third party tax advice received. There can be no certainty that tax authorities would make the same interpretation. See note 2 for further details.
APG_AR17_28.03.18_BACK_ARTWORK
ANGLO PACIFIC GROUP PLC ANNUAL REPORT & ACCOUNTS 2017 93G
RO
UP O
VER
VIE
W S
TRATEG
IC R
EPO
RT G
OV
ERN
AN
CE F
INA
NC
IAL S
TAT
EM
EN
TS
OTH
ER IN
FOR
MATIO
N
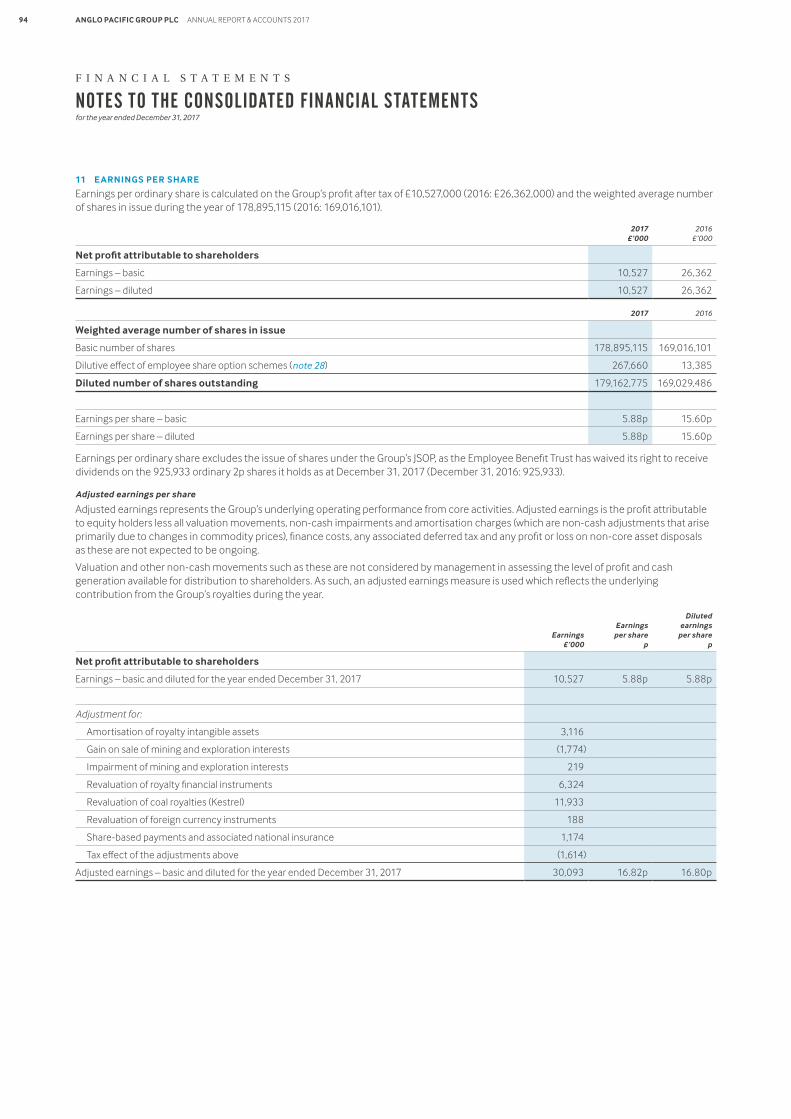
11 EARNINGS PER SHARE
Earnings per ordinary share is calculated on the Group’s profit after tax of £10,527,000 (2016: £26,362,000) and the weighted average number of shares in issue during the year of 178,895,115 (2016: 169,016,101).
2017 £’000
2016 £’000
Net profit attributable to shareholders
Earnings – basic 10,527 26,362
Earnings – diluted 10,527 26,362
2017 2016
Weighted average number of shares in issue
Basic number of shares 178,895,115 169,016,101
Dilutive effect of employee share option schemes (note 28) 267,660 13,385
Diluted number of shares outstanding 179,162,775 169,029,486
Earnings per share – basic 5.88p 15.60p
Earnings per share – diluted 5.88p 15.60p
Earnings per ordinary share excludes the issue of shares under the Group’s JSOP, as the Employee Benefit Trust has waived its right to receive dividends on the 925,933 ordinary 2p shares it holds as at December 31, 2017 (December 31, 2016: 925,933).
Adjusted earnings per share
Adjusted earnings represents the Group’s underlying operating performance from core activities. Adjusted earnings is the profit attributable to equity holders less all valuation movements, non-cash impairments and amortisation charges (which are non-cash adjustments that arise primarily due to changes in commodity prices), finance costs, any associated deferred tax and any profit or loss on non-core asset disposals as these are not expected to be ongoing.
Valuation and other non-cash movements such as these are not considered by management in assessing the level of profit and cash generation available for distribution to shareholders. As such, an adjusted earnings measure is used which reflects the underlying contribution from the Group’s royalties during the year.
Earnings £’000
Earnings per share
p
Diluted earnings
per share p
Net profit attributable to shareholders
Earnings – basic and diluted for the year ended December 31, 2017 10,527 5.88p 5.88p
Adjustment for:
Amortisation of royalty intangible assets 3,116
Gain on sale of mining and exploration interests (1,774)
Impairment of mining and exploration interests 219
Revaluation of royalty financial instruments 6,324
Revaluation of coal royalties (Kestrel) 11,933
Revaluation of foreign currency instruments 188
Share-based payments and associated national insurance 1,174
Tax effect of the adjustments above (1,614)
Adjusted earnings – basic and diluted for the year ended December 31, 2017 30,093 16.82p 16.80p
F I N A N C I A L S T A T E M E N T S
APG_AR17_28.03.18_BACK_ARTWORK
ANGLO PACIFIC GROUP PLC ANNUAL REPORT & ACCOUNTS 201794
NOTES TO THE CONSOLIDATED FINANCIAL STATEMENTSfor the year ended December 31, 2017
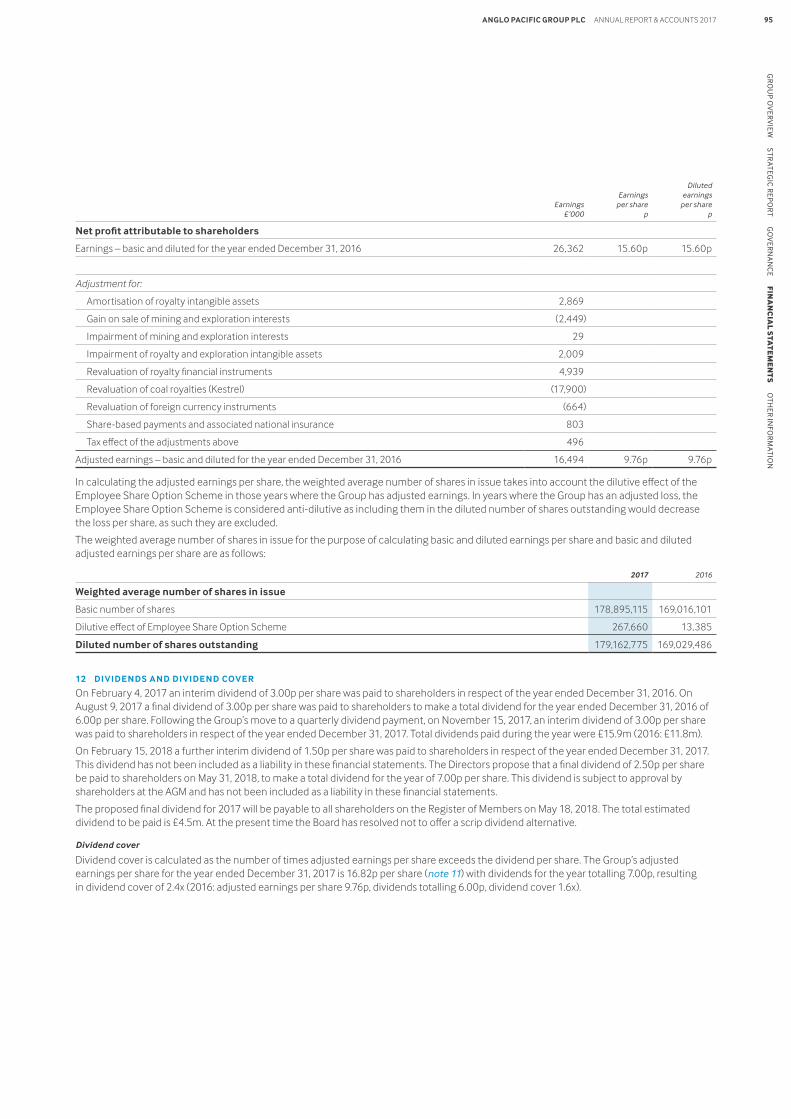
Earnings £’000
Earnings per share
p
Diluted earnings
per share p
Net profit attributable to shareholders
Earnings – basic and diluted for the year ended December 31, 2016 26,362 15.60p 15.60p
Adjustment for:
Amortisation of royalty intangible assets 2,869
Gain on sale of mining and exploration interests (2,449)
Impairment of mining and exploration interests 29
Impairment of royalty and exploration intangible assets 2,009
Revaluation of royalty financial instruments 4,939
Revaluation of coal royalties (Kestrel) (17,900)
Revaluation of foreign currency instruments (664)
Share-based payments and associated national insurance 803
Tax effect of the adjustments above 496
Adjusted earnings – basic and diluted for the year ended December 31, 2016 16,494 9.76p 9.76p
In calculating the adjusted earnings per share, the weighted average number of shares in issue takes into account the dilutive effect of the Employee Share Option Scheme in those years where the Group has adjusted earnings. In years where the Group has an adjusted loss, the Employee Share Option Scheme is considered anti-dilutive as including them in the diluted number of shares outstanding would decrease the loss per share, as such they are excluded.
The weighted average number of shares in issue for the purpose of calculating basic and diluted earnings per share and basic and diluted adjusted earnings per share are as follows:
2017 2016
Weighted average number of shares in issue
Basic number of shares 178,895,115 169,016,101
Dilutive effect of Employee Share Option Scheme 267,660 13,385
Diluted number of shares outstanding 179,162,775 169,029,486
12 DIVIDENDS AND DIVIDEND COVER
On February 4, 2017 an interim dividend of 3.00p per share was paid to shareholders in respect of the year ended December 31, 2016. On August 9, 2017 a final dividend of 3.00p per share was paid to shareholders to make a total dividend for the year ended December 31, 2016 of 6.00p per share. Following the Group’s move to a quarterly dividend payment, on November 15, 2017, an interim dividend of 3.00p per share was paid to shareholders in respect of the year ended December 31, 2017. Total dividends paid during the year were £15.9m (2016: £11.8m).
On February 15, 2018 a further interim dividend of 1.50p per share was paid to shareholders in respect of the year ended December 31, 2017. This dividend has not been included as a liability in these financial statements. The Directors propose that a final dividend of 2.50p per share be paid to shareholders on May 31, 2018, to make a total dividend for the year of 7.00p per share. This dividend is subject to approval by shareholders at the AGM and has not been included as a liability in these financial statements.
The proposed final dividend for 2017 will be payable to all shareholders on the Register of Members on May 18, 2018. The total estimated dividend to be paid is £4.5m. At the present time the Board has resolved not to offer a scrip dividend alternative.
Dividend cover
Dividend cover is calculated as the number of times adjusted earnings per share exceeds the dividend per share. The Group’s adjusted earnings per share for the year ended December 31, 2017 is 16.82p per share (note 11) with dividends for the year totalling 7.00p, resulting in dividend cover of 2.4x (2016: adjusted earnings per share 9.76p, dividends totalling 6.00p, dividend cover 1.6x).
APG_AR17_28.03.18_BACK_ARTWORK
ANGLO PACIFIC GROUP PLC ANNUAL REPORT & ACCOUNTS 2017 95G
RO
UP O
VER
VIE
W S
TRATEG
IC R
EPO
RT G
OV
ERN
AN
CE F
INA
NC
IAL S
TAT
EM
EN
TS
OTH
ER IN
FOR
MATIO
N
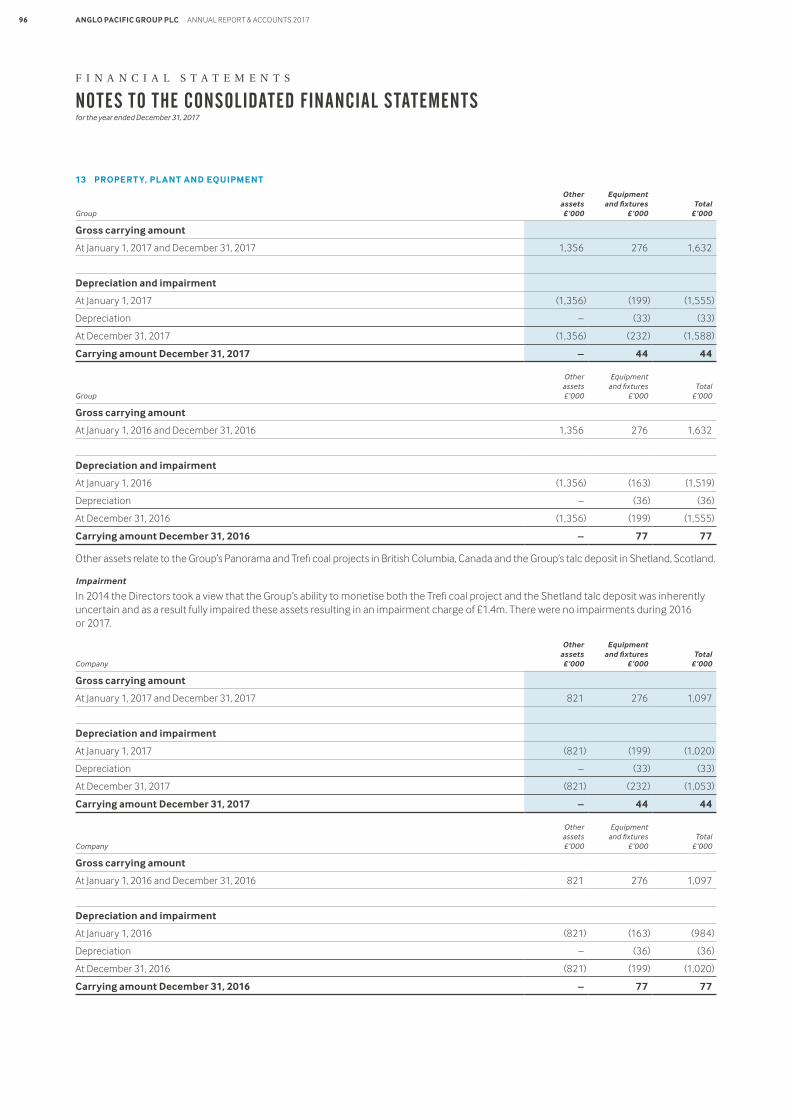
13 PROPERT Y, PL ANT AND EQUIPMENT
Group
Other assets £’000
Equipment and fixtures
£’000Total
£’000
Gross carrying amount
At January 1, 2017 and December 31, 2017 1,356 276 1,632
Depreciation and impairment
At January 1, 2017 (1,356) (199) (1,555)
Depreciation – (33) (33)
At December 31, 2017 (1,356) (232) (1,588)
Carrying amount December 31, 2017 – 44 44
Group
Other assets £’000
Equipment and fixtures
£’000Total
£’000
Gross carrying amount
At January 1, 2016 and December 31, 2016 1,356 276 1,632
Depreciation and impairment
At January 1, 2016 (1,356) (163) (1,519)
Depreciation – (36) (36)
At December 31, 2016 (1,356) (199) (1,555)
Carrying amount December 31, 2016 – 77 77
Other assets relate to the Group’s Panorama and Trefi coal projects in British Columbia, Canada and the Group’s talc deposit in Shetland, Scotland.
Impairment
In 2014 the Directors took a view that the Group’s ability to monetise both the Trefi coal project and the Shetland talc deposit was inherently uncertain and as a result fully impaired these assets resulting in an impairment charge of £1.4m. There were no impairments during 2016 or 2017.
Company
Other assets £’000
Equipment and fixtures
£’000Total
£’000
Gross carrying amount
At January 1, 2017 and December 31, 2017 821 276 1,097
Depreciation and impairment
At January 1, 2017 (821) (199) (1,020)
Depreciation – (33) (33)
At December 31, 2017 (821) (232) (1,053)
Carrying amount December 31, 2017 – 44 44
Company
Other assets £’000
Equipment and fixtures
£’000Total
£’000
Gross carrying amount
At January 1, 2016 and December 31, 2016 821 276 1,097
Depreciation and impairment
At January 1, 2016 (821) (163) (984)
Depreciation – (36) (36)
At December 31, 2016 (821) (199) (1,020)
Carrying amount December 31, 2016 – 77 77
F I N A N C I A L S T A T E M E N T S
APG_AR17_28.03.18_BACK_ARTWORK
ANGLO PACIFIC GROUP PLC ANNUAL REPORT & ACCOUNTS 201796
NOTES TO THE CONSOLIDATED FINANCIAL STATEMENTSfor the year ended December 31, 2017
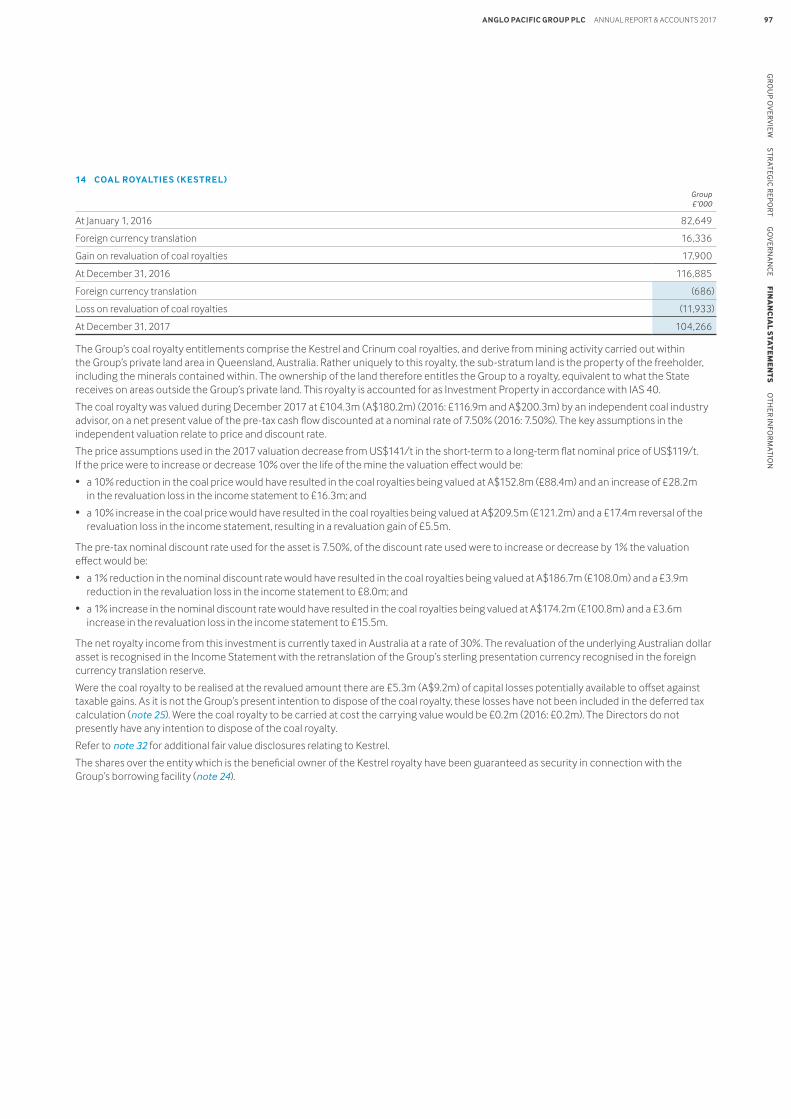
14 COAL ROYALTIES (KESTREL )
Group £’000
At January 1, 2016 82,649
Foreign currency translation 16,336
Gain on revaluation of coal royalties 17,900
At December 31, 2016 116,885
Foreign currency translation (686)
Loss on revaluation of coal royalties (11,933)
At December 31, 2017 104,266
The Group’s coal royalty entitlements comprise the Kestrel and Crinum coal royalties, and derive from mining activity carried out within the Group’s private land area in Queensland, Australia. Rather uniquely to this royalty, the sub-stratum land is the property of the freeholder, including the minerals contained within. The ownership of the land therefore entitles the Group to a royalty, equivalent to what the State receives on areas outside the Group’s private land. This royalty is accounted for as Investment Property in accordance with IAS 40.
The coal royalty was valued during December 2017 at £104.3m (A$180.2m) (2016: £116.9m and A$200.3m) by an independent coal industry advisor, on a net present value of the pre-tax cash flow discounted at a nominal rate of 7.50% (2016: 7.50%). The key assumptions in the independent valuation relate to price and discount rate.
The price assumptions used in the 2017 valuation decrease from US$141/t in the short-term to a long-term flat nominal price of US$119/t. If the price were to increase or decrease 10% over the life of the mine the valuation effect would be:
• a 10% reduction in the coal price would have resulted in the coal royalties being valued at A$152.8m (£88.4m) and an increase of £28.2m in the revaluation loss in the income statement to £16.3m; and
• a 10% increase in the coal price would have resulted in the coal royalties being valued at A$209.5m (£121.2m) and a £17.4m reversal of the revaluation loss in the income statement, resulting in a revaluation gain of £5.5m.
The pre-tax nominal discount rate used for the asset is 7.50%, of the discount rate used were to increase or decrease by 1% the valuation effect would be:
• a 1% reduction in the nominal discount rate would have resulted in the coal royalties being valued at A$186.7m (£108.0m) and a £3.9m reduction in the revaluation loss in the income statement to £8.0m; and
• a 1% increase in the nominal discount rate would have resulted in the coal royalties being valued at A$174.2m (£100.8m) and a £3.6m increase in the revaluation loss in the income statement to £15.5m.
The net royalty income from this investment is currently taxed in Australia at a rate of 30%. The revaluation of the underlying Australian dollar asset is recognised in the Income Statement with the retranslation of the Group’s sterling presentation currency recognised in the foreign currency translation reserve.
Were the coal royalty to be realised at the revalued amount there are £5.3m (A$9.2m) of capital losses potentially available to offset against taxable gains. As it is not the Group’s present intention to dispose of the coal royalty, these losses have not been included in the deferred tax calculation (note 25). Were the coal royalty to be carried at cost the carrying value would be £0.2m (2016: £0.2m). The Directors do not presently have any intention to dispose of the coal royalty.
Refer to note 32 for additional fair value disclosures relating to Kestrel.
The shares over the entity which is the beneficial owner of the Kestrel royalty have been guaranteed as security in connection with the Group’s borrowing facility (note 24).
APG_AR17_28.03.18_BACK_ARTWORK
ANGLO PACIFIC GROUP PLC ANNUAL REPORT & ACCOUNTS 2017 97G
RO
UP O
VER
VIE
W S
TRATEG
IC R
EPO
RT G
OV
ERN
AN
CE F
INA
NC
IAL S
TAT
EM
EN
TS
OTH
ER IN
FOR
MATIO
N
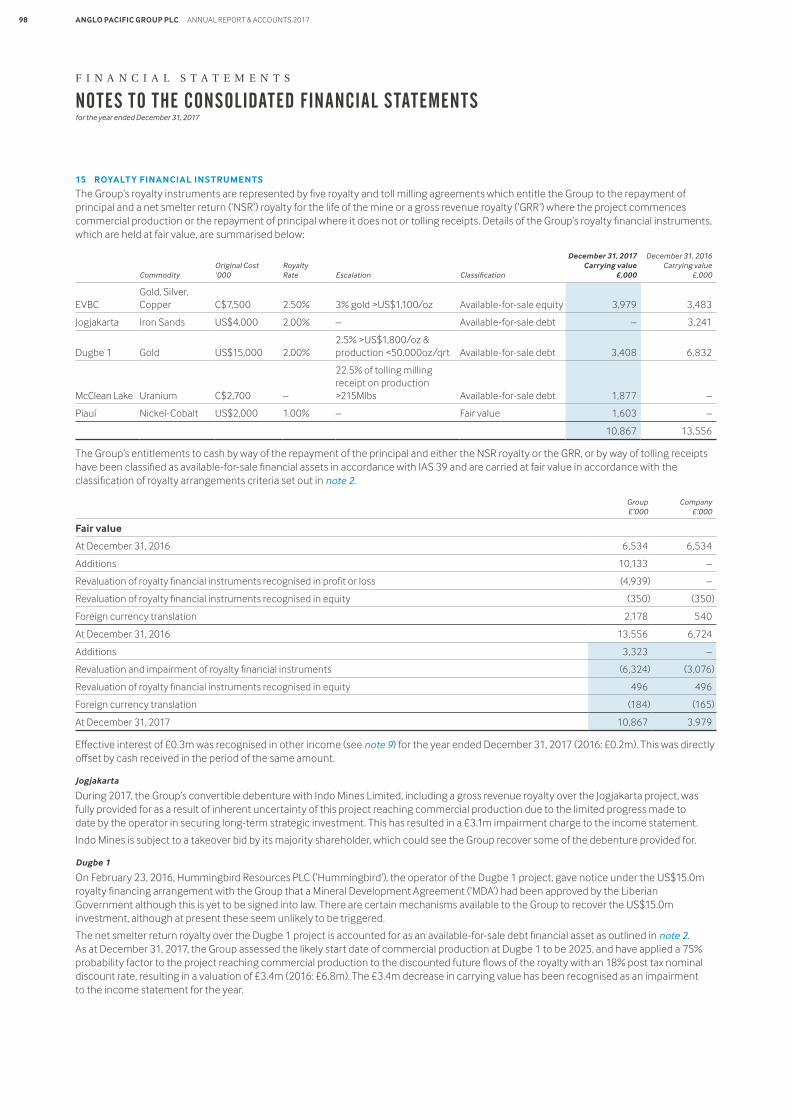
15 ROYALT Y FINANCIAL INSTRUMENTS
The Group’s royalty instruments are represented by five royalty and toll milling agreements which entitle the Group to the repayment of principal and a net smelter return (‘NSR’) royalty for the life of the mine or a gross revenue royalty (‘GRR’) where the project commences commercial production or the repayment of principal where it does not or tolling receipts. Details of the Group’s royalty financial instruments, which are held at fair value, are summarised below:
CommodityOriginal Cost ‘000
Royalty Rate Escalation Classification
December 31, 2017 Carrying value
£,000
December 31, 2016 Carrying value
£,000
EVBCGold, Silver, Copper C$7,500 2.50% 3% gold >US$1,100/oz Available-for-sale equity 3,979 3,483
Jogjakarta Iron Sands US$4,000 2.00% – Available-for-sale debt – 3,241
Dugbe 1 Gold US$15,000 2.00%2.5% >US$1,800/oz & production <50,000oz/qrt Available-for-sale debt 3,408 6,832
McClean Lake Uranium C$2,700 –
22.5% of tolling milling receipt on production >215Mlbs Available-for-sale debt 1,877 –
Piauí Nickel-Cobalt US$2,000 1.00% – Fair value 1,603 –
10,867 13,556
The Group’s entitlements to cash by way of the repayment of the principal and either the NSR royalty or the GRR, or by way of tolling receipts have been classified as available-for-sale financial assets in accordance with IAS 39 and are carried at fair value in accordance with the classification of royalty arrangements criteria set out in note 2.
Group £’000
Company £’000
Fair value
At December 31, 2016 6,534 6,534
Additions 10,133 –
Revaluation of royalty financial instruments recognised in profit or loss (4,939) –
Revaluation of royalty financial instruments recognised in equity (350) (350)
Foreign currency translation 2,178 540
At December 31, 2016 13,556 6,724
Additions 3,323 –
Revaluation and impairment of royalty financial instruments (6,324) (3,076)
Revaluation of royalty financial instruments recognised in equity 496 496
Foreign currency translation (184) (165)
At December 31, 2017 10,867 3,979
Effective interest of £0.3m was recognised in other income (see note 9) for the year ended December 31, 2017 (2016: £0.2m). This was directly offset by cash received in the period of the same amount.
Jogjakarta
During 2017, the Group’s convertible debenture with Indo Mines Limited, including a gross revenue royalty over the Jogjakarta project, was fully provided for as a result of inherent uncertainty of this project reaching commercial production due to the limited progress made to date by the operator in securing long-term strategic investment. This has resulted in a £3.1m impairment charge to the income statement.
Indo Mines is subject to a takeover bid by its majority shareholder, which could see the Group recover some of the debenture provided for.
Dugbe 1
On February 23, 2016, Hummingbird Resources PLC (‘Hummingbird’), the operator of the Dugbe 1 project, gave notice under the US$15.0m royalty financing arrangement with the Group that a Mineral Development Agreement (‘MDA’) had been approved by the Liberian Government although this is yet to be signed into law. There are certain mechanisms available to the Group to recover the US$15.0m investment, although at present these seem unlikely to be triggered.
The net smelter return royalty over the Dugbe 1 project is accounted for as an available-for-sale debt financial asset as outlined in note 2. As at December 31, 2017, the Group assessed the likely start date of commercial production at Dugbe 1 to be 2025, and have applied a 75% probability factor to the project reaching commercial production to the discounted future flows of the royalty with an 18% post tax nominal discount rate, resulting in a valuation of £3.4m (2016: £6.8m). The £3.4m decrease in carrying value has been recognised as an impairment to the income statement for the year.
F I N A N C I A L S T A T E M E N T S
APG_AR17_28.03.18_BACK_ARTWORK
ANGLO PACIFIC GROUP PLC ANNUAL REPORT & ACCOUNTS 201798
NOTES TO THE CONSOLIDATED FINANCIAL STATEMENTSfor the year ended December 31, 2017
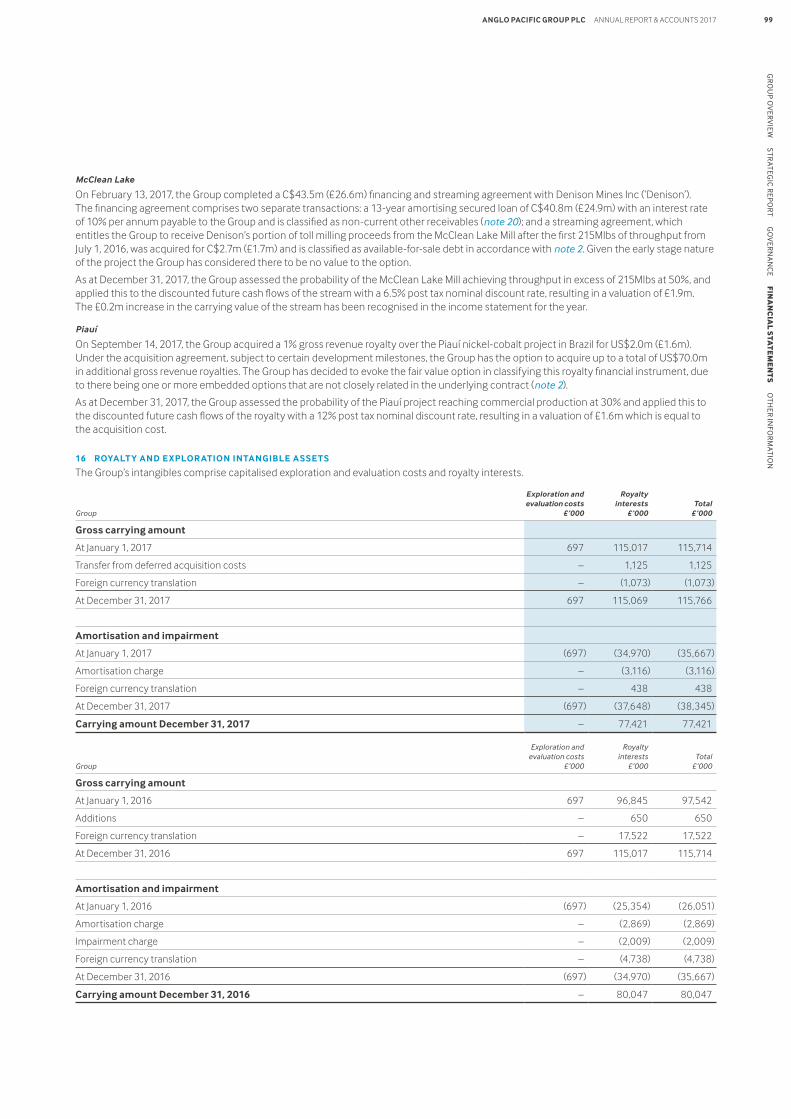
McClean Lake
On February 13, 2017, the Group completed a C$43.5m (£26.6m) financing and streaming agreement with Denison Mines Inc (‘Denison’). The financing agreement comprises two separate transactions: a 13-year amortising secured loan of C$40.8m (£24.9m) with an interest rate of 10% per annum payable to the Group and is classified as non-current other receivables (note 20); and a streaming agreement, which entitles the Group to receive Denison’s portion of toll milling proceeds from the McClean Lake Mill after the first 215Mlbs of throughput from July 1, 2016, was acquired for C$2.7m (£1.7m) and is classified as available-for-sale debt in accordance with note 2. Given the early stage nature of the project the Group has considered there to be no value to the option.
As at December 31, 2017, the Group assessed the probability of the McClean Lake Mill achieving throughput in excess of 215Mlbs at 50%, and applied this to the discounted future cash flows of the stream with a 6.5% post tax nominal discount rate, resulting in a valuation of £1.9m. The £0.2m increase in the carrying value of the stream has been recognised in the income statement for the year.
Piauí
On September 14, 2017, the Group acquired a 1% gross revenue royalty over the Piauí nickel-cobalt project in Brazil for US$2.0m (£1.6m). Under the acquisition agreement, subject to certain development milestones, the Group has the option to acquire up to a total of US$70.0m in additional gross revenue royalties. The Group has decided to evoke the fair value option in classifying this royalty financial instrument, due to there being one or more embedded options that are not closely related in the underlying contract (note 2).
As at December 31, 2017, the Group assessed the probability of the Piauí project reaching commercial production at 30% and applied this to the discounted future cash flows of the royalty with a 12% post tax nominal discount rate, resulting in a valuation of £1.6m which is equal to the acquisition cost.
16 ROYALT Y AND EXPLOR ATION INTANGIBLE ASSETS
The Group’s intangibles comprise capitalised exploration and evaluation costs and royalty interests.
Group
Exploration and evaluation costs
£’000
Royalty interests
£’000Total
£’000
Gross carrying amount
At January 1, 2017 697 115,017 115,714
Transfer from deferred acquisition costs – 1,125 1,125
Foreign currency translation – (1,073) (1,073)
At December 31, 2017 697 115,069 115,766
Amortisation and impairment
At January 1, 2017 (697) (34,970) (35,667)
Amortisation charge – (3,116) (3,116)
Foreign currency translation – 438 438
At December 31, 2017 (697) (37,648) (38,345)
Carrying amount December 31, 2017 – 77,421 77,421
Group
Exploration and evaluation costs
£’000
Royalty interests
£’000Total
£’000
Gross carrying amount
At January 1, 2016 697 96,845 97,542
Additions – 650 650
Foreign currency translation – 17,522 17,522
At December 31, 2016 697 115,017 115,714
Amortisation and impairment
At January 1, 2016 (697) (25,354) (26,051)
Amortisation charge – (2,869) (2,869)
Impairment charge – (2,009) (2,009)
Foreign currency translation – (4,738) (4,738)
At December 31, 2016 (697) (34,970) (35,667)
Carrying amount December 31, 2016 – 80,047 80,047
APG_AR17_28.03.18_BACK_ARTWORK
ANGLO PACIFIC GROUP PLC ANNUAL REPORT & ACCOUNTS 2017 99G
RO
UP O
VER
VIE
W S
TRATEG
IC R
EPO
RT G
OV
ERN
AN
CE F
INA
NC
IAL S
TAT
EM
EN
TS
OTH
ER IN
FOR
MATIO
N
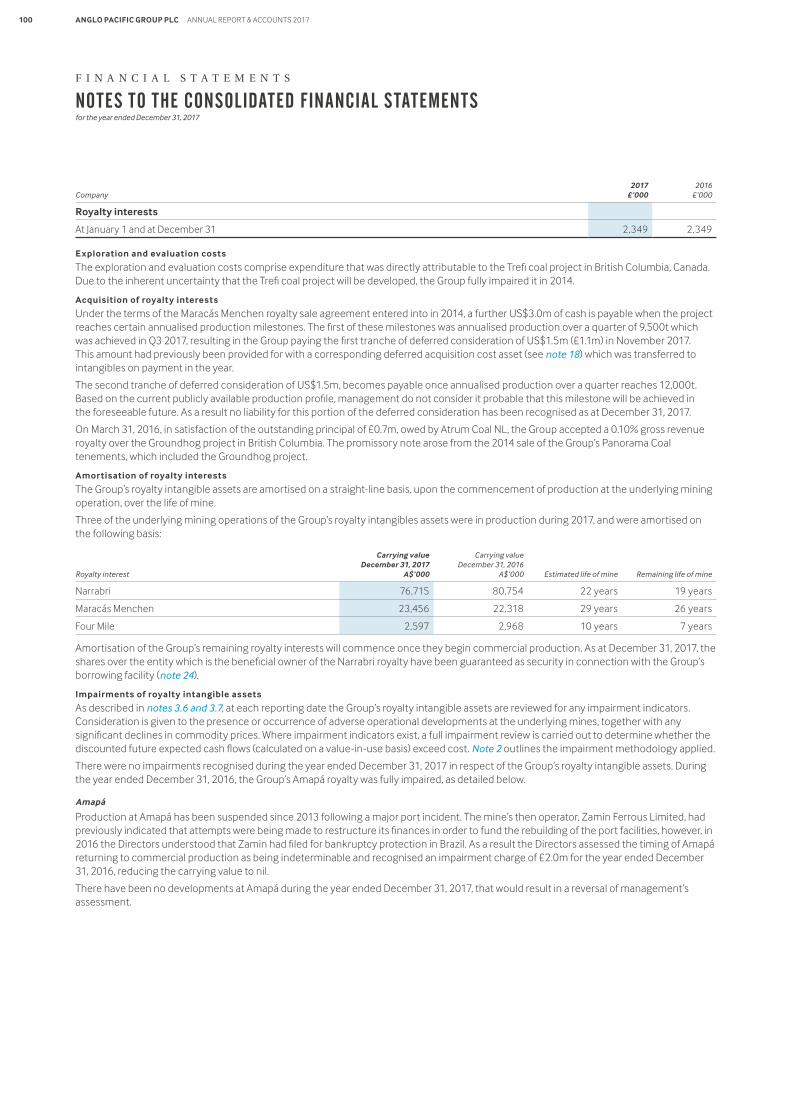
Company2017
£’0002016
£’000
Royalty interests
At January 1 and at December 31 2,349 2,349
Exploration and evaluation costs
The exploration and evaluation costs comprise expenditure that was directly attributable to the Trefi coal project in British Columbia, Canada. Due to the inherent uncertainty that the Trefi coal project will be developed, the Group fully impaired it in 2014.
Acquisition of royalty interests
Under the terms of the Maracás Menchen royalty sale agreement entered into in 2014, a further US$3.0m of cash is payable when the project reaches certain annualised production milestones. The first of these milestones was annualised production over a quarter of 9,500t which was achieved in Q3 2017, resulting in the Group paying the first tranche of deferred consideration of US$1.5m (£1.1m) in November 2017. This amount had previously been provided for with a corresponding deferred acquisition cost asset (see note 18) which was transferred to intangibles on payment in the year.
The second tranche of deferred consideration of US$1.5m, becomes payable once annualised production over a quarter reaches 12,000t. Based on the current publicly available production profile, management do not consider it probable that this milestone will be achieved in the foreseeable future. As a result no liability for this portion of the deferred consideration has been recognised as at December 31, 2017.
On March 31, 2016, in satisfaction of the outstanding principal of £0.7m, owed by Atrum Coal NL, the Group accepted a 0.10% gross revenue royalty over the Groundhog project in British Columbia. The promissory note arose from the 2014 sale of the Group’s Panorama Coal tenements, which included the Groundhog project.
Amortisation of royalty interests
The Group’s royalty intangible assets are amortised on a straight-line basis, upon the commencement of production at the underlying mining operation, over the life of mine.
Three of the underlying mining operations of the Group’s royalty intangibles assets were in production during 2017, and were amortised on the following basis:
Royalty interest
Carrying value December 31, 2017
A$’000
Carrying value December 31, 2016
A$’000 Estimated life of mine Remaining life of mine
Narrabri 76,715 80,754 22 years 19 years
Maracás Menchen 23,456 22,318 29 years 26 years
Four Mile 2,597 2,968 10 years 7 years
Amortisation of the Group’s remaining royalty interests will commence once they begin commercial production. As at December 31, 2017, the shares over the entity which is the beneficial owner of the Narrabri royalty have been guaranteed as security in connection with the Group’s borrowing facility (note 24).
Impairments of royalty intangible assets
As described in notes 3.6 and 3.7, at each reporting date the Group’s royalty intangible assets are reviewed for any impairment indicators. Consideration is given to the presence or occurrence of adverse operational developments at the underlying mines, together with any significant declines in commodity prices. Where impairment indicators exist, a full impairment review is carried out to determine whether the discounted future expected cash flows (calculated on a value-in-use basis) exceed cost. Note 2 outlines the impairment methodology applied.
There were no impairments recognised during the year ended December 31, 2017 in respect of the Group’s royalty intangible assets. During the year ended December 31, 2016, the Group’s Amapá royalty was fully impaired, as detailed below.
Amapá
Production at Amapá has been suspended since 2013 following a major port incident. The mine’s then operator, Zamin Ferrous Limited, had previously indicated that attempts were being made to restructure its finances in order to fund the rebuilding of the port facilities, however, in 2016 the Directors understood that Zamin had filed for bankruptcy protection in Brazil. As a result the Directors assessed the timing of Amapá returning to commercial production as being indeterminable and recognised an impairment charge of £2.0m for the year ended December 31, 2016, reducing the carrying value to nil.
There have been no developments at Amapá during the year ended December 31, 2017, that would result in a reversal of management’s assessment.
F I N A N C I A L S T A T E M E N T S
APG_AR17_28.03.18_BACK_ARTWORK
ANGLO PACIFIC GROUP PLC ANNUAL REPORT & ACCOUNTS 2017100
NOTES TO THE CONSOLIDATED FINANCIAL STATEMENTSfor the year ended December 31, 2017
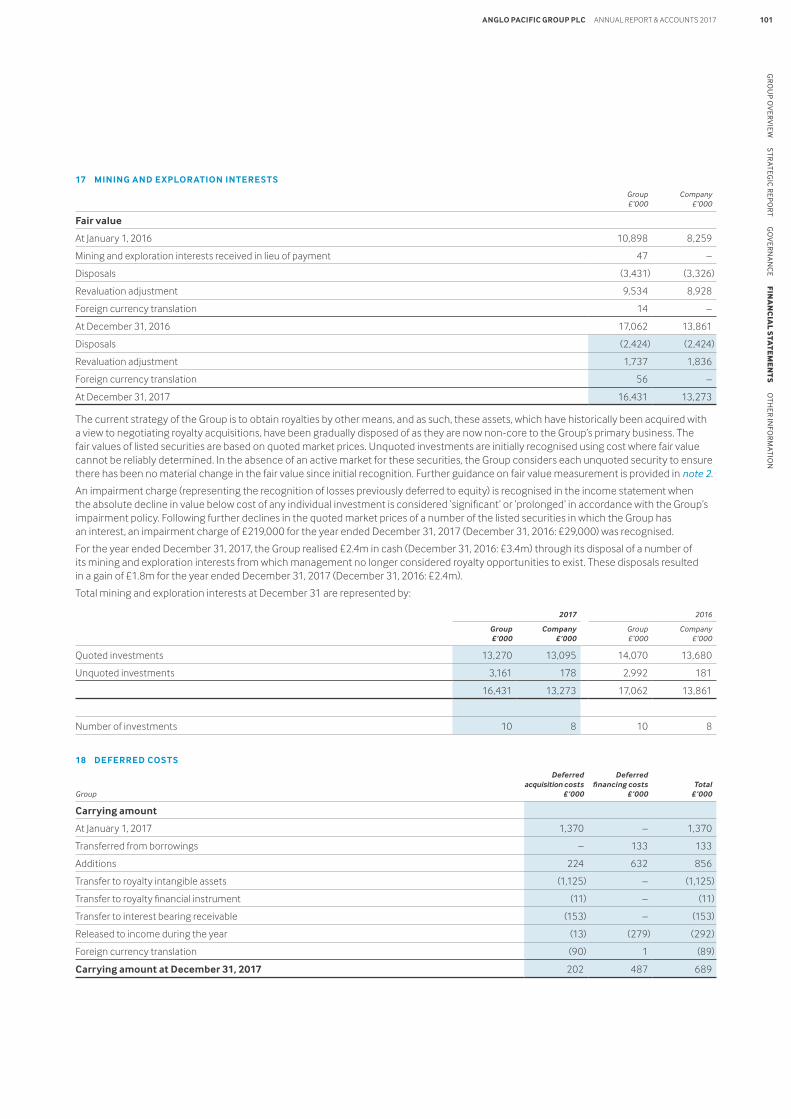
17 MINING AND EXPLOR ATION INTERESTS
Group £’000
Company £’000
Fair value
At January 1, 2016 10,898 8,259
Mining and exploration interests received in lieu of payment 47 –
Disposals (3,431) (3,326)
Revaluation adjustment 9,534 8,928
Foreign currency translation 14 –
At December 31, 2016 17,062 13,861
Disposals (2,424) (2,424)
Revaluation adjustment 1,737 1,836
Foreign currency translation 56 –
At December 31, 2017 16,431 13,273
The current strategy of the Group is to obtain royalties by other means, and as such, these assets, which have historically been acquired with a view to negotiating royalty acquisitions, have been gradually disposed of as they are now non-core to the Group’s primary business. The fair values of listed securities are based on quoted market prices. Unquoted investments are initially recognised using cost where fair value cannot be reliably determined. In the absence of an active market for these securities, the Group considers each unquoted security to ensure there has been no material change in the fair value since initial recognition. Further guidance on fair value measurement is provided in note 2.
An impairment charge (representing the recognition of losses previously deferred to equity) is recognised in the income statement when the absolute decline in value below cost of any individual investment is considered ‘significant’ or ‘prolonged’ in accordance with the Group’s impairment policy. Following further declines in the quoted market prices of a number of the listed securities in which the Group has an interest, an impairment charge of £219,000 for the year ended December 31, 2017 (December 31, 2016: £29,000) was recognised.
For the year ended December 31, 2017, the Group realised £2.4m in cash (December 31, 2016: £3.4m) through its disposal of a number of its mining and exploration interests from which management no longer considered royalty opportunities to exist. These disposals resulted in a gain of £1.8m for the year ended December 31, 2017 (December 31, 2016: £2.4m).
Total mining and exploration interests at December 31 are represented by:
2017 2016
Group £’000
Company £’000
Group £’000
Company £’000
Quoted investments 13,270 13,095 14,070 13,680
Unquoted investments 3,161 178 2,992 181
16,431 13,273 17,062 13,861
Number of investments 10 8 10 8
18 DEFERRED COSTS
Group
Deferred acquisition costs
£’000
Deferred financing costs
£’000Total
£’000
Carrying amount
At January 1, 2017 1,370 – 1,370
Transferred from borrowings – 133 133
Additions 224 632 856
Transfer to royalty intangible assets (1,125) – (1,125)
Transfer to royalty financial instrument (11) – (11)
Transfer to interest bearing receivable (153) – (153)
Released to income during the year (13) (279) (292)
Foreign currency translation (90) 1 (89)
Carrying amount at December 31, 2017 202 487 689
APG_AR17_28.03.18_BACK_ARTWORK
ANGLO PACIFIC GROUP PLC ANNUAL REPORT & ACCOUNTS 2017 101G
RO
UP O
VER
VIE
W S
TRATEG
IC R
EPO
RT G
OV
ERN
AN
CE F
INA
NC
IAL S
TAT
EM
EN
TS
OTH
ER IN
FOR
MATIO
N
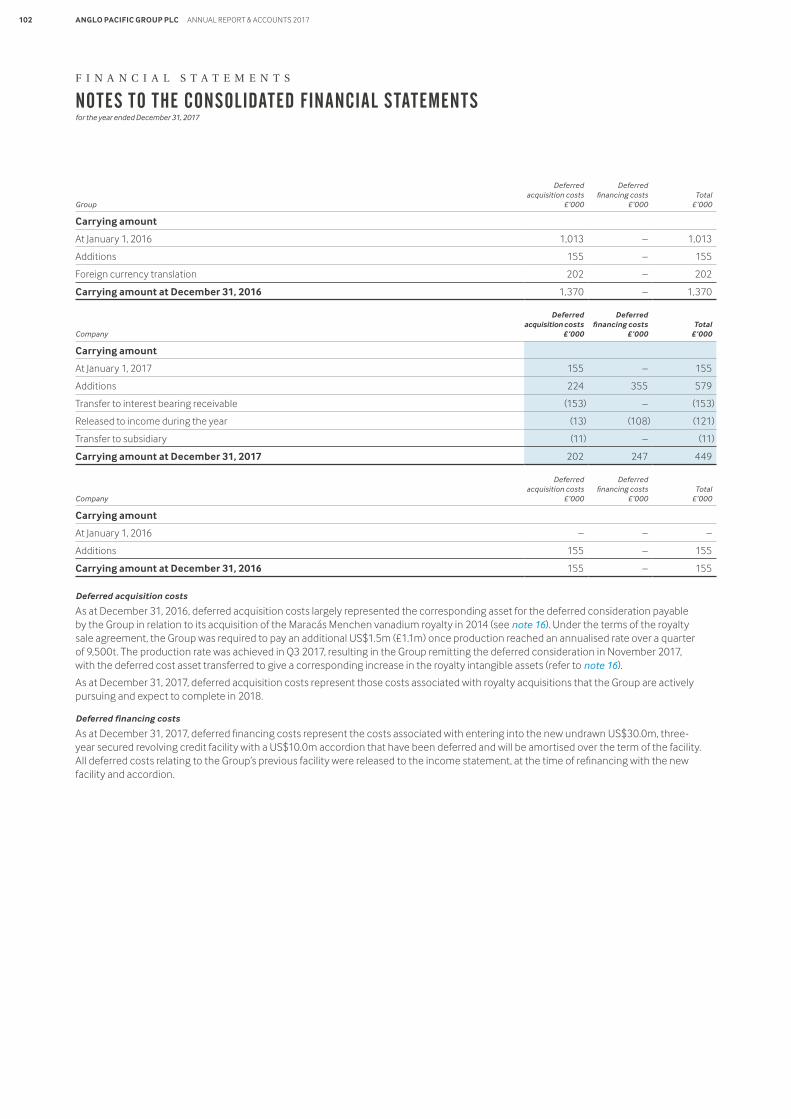
Group
Deferred acquisition costs
£’000
Deferred financing costs
£’000Total
£’000
Carrying amount
At January 1, 2016 1,013 – 1,013
Additions 155 – 155
Foreign currency translation 202 – 202
Carrying amount at December 31, 2016 1,370 – 1,370
Company
Deferred acquisition costs
£’000
Deferred financing costs
£’000Total
£’000
Carrying amount
At January 1, 2017 155 – 155
Additions 224 355 579
Transfer to interest bearing receivable (153) – (153)
Released to income during the year (13) (108) (121)
Transfer to subsidiary (11) – (11)
Carrying amount at December 31, 2017 202 247 449
Company
Deferred acquisition costs
£’000
Deferred financing costs
£’000Total
£’000
Carrying amount
At January 1, 2016 – – –
Additions 155 – 155
Carrying amount at December 31, 2016 155 – 155
Deferred acquisition costs
As at December 31, 2016, deferred acquisition costs largely represented the corresponding asset for the deferred consideration payable by the Group in relation to its acquisition of the Maracás Menchen vanadium royalty in 2014 (see note 16). Under the terms of the royalty sale agreement, the Group was required to pay an additional US$1.5m (£1.1m) once production reached an annualised rate over a quarter of 9,500t. The production rate was achieved in Q3 2017, resulting in the Group remitting the deferred consideration in November 2017, with the deferred cost asset transferred to give a corresponding increase in the royalty intangible assets (refer to note 16).
As at December 31, 2017, deferred acquisition costs represent those costs associated with royalty acquisitions that the Group are actively pursuing and expect to complete in 2018.
Deferred financing costs
As at December 31, 2017, deferred financing costs represent the costs associated with entering into the new undrawn US$30.0m, three-year secured revolving credit facility with a US$10.0m accordion that have been deferred and will be amortised over the term of the facility. All deferred costs relating to the Group’s previous facility were released to the income statement, at the time of refinancing with the new facility and accordion.
F I N A N C I A L S T A T E M E N T S
APG_AR17_28.03.18_BACK_ARTWORK
ANGLO PACIFIC GROUP PLC ANNUAL REPORT & ACCOUNTS 2017102
NOTES TO THE CONSOLIDATED FINANCIAL STATEMENTSfor the year ended December 31, 2017
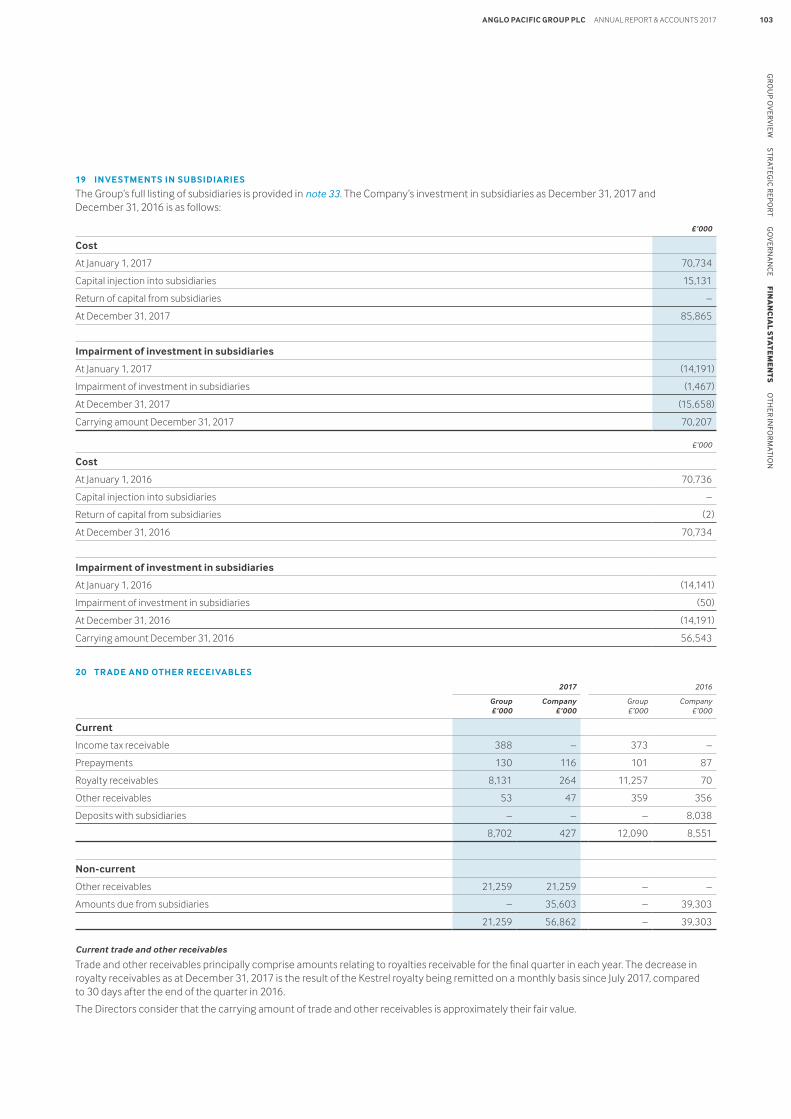
19 INVESTMENTS IN SUBSIDIARIES
The Group’s full listing of subsidiaries is provided in note 33. The Company’s investment in subsidiaries as December 31, 2017 and December 31, 2016 is as follows:
£’000
Cost
At January 1, 2017 70,734
Capital injection into subsidiaries 15,131
Return of capital from subsidiaries –
At December 31, 2017 85,865
Impairment of investment in subsidiaries
At January 1, 2017 (14,191)
Impairment of investment in subsidiaries (1,467)
At December 31, 2017 (15,658)
Carrying amount December 31, 2017 70,207
£’000
Cost
At January 1, 2016 70,736
Capital injection into subsidiaries –
Return of capital from subsidiaries (2)
At December 31, 2016 70,734
Impairment of investment in subsidiaries
At January 1, 2016 (14,141)
Impairment of investment in subsidiaries (50)
At December 31, 2016 (14,191)
Carrying amount December 31, 2016 56,543
20 TR ADE AND OTHER RECEIVABLES
2017 2016
Group £’000
Company £’000
Group £’000
Company £’000
Current
Income tax receivable 388 – 373 –
Prepayments 130 116 101 87
Royalty receivables 8,131 264 11,257 70
Other receivables 53 47 359 356
Deposits with subsidiaries – – – 8,038
8,702 427 12,090 8,551
Non-current
Other receivables 21,259 21,259 – –
Amounts due from subsidiaries – 35,603 – 39,303
21,259 56,862 – 39,303
Current trade and other receivables
Trade and other receivables principally comprise amounts relating to royalties receivable for the final quarter in each year. The decrease in royalty receivables as at December 31, 2017 is the result of the Kestrel royalty being remitted on a monthly basis since July 2017, compared to 30 days after the end of the quarter in 2016.
The Directors consider that the carrying amount of trade and other receivables is approximately their fair value.
APG_AR17_28.03.18_BACK_ARTWORK
ANGLO PACIFIC GROUP PLC ANNUAL REPORT & ACCOUNTS 2017 103G
RO
UP O
VER
VIE
W S
TRATEG
IC R
EPO
RT G
OV
ERN
AN
CE F
INA
NC
IAL S
TAT
EM
EN
TS
OTH
ER IN
FOR
MATIO
N
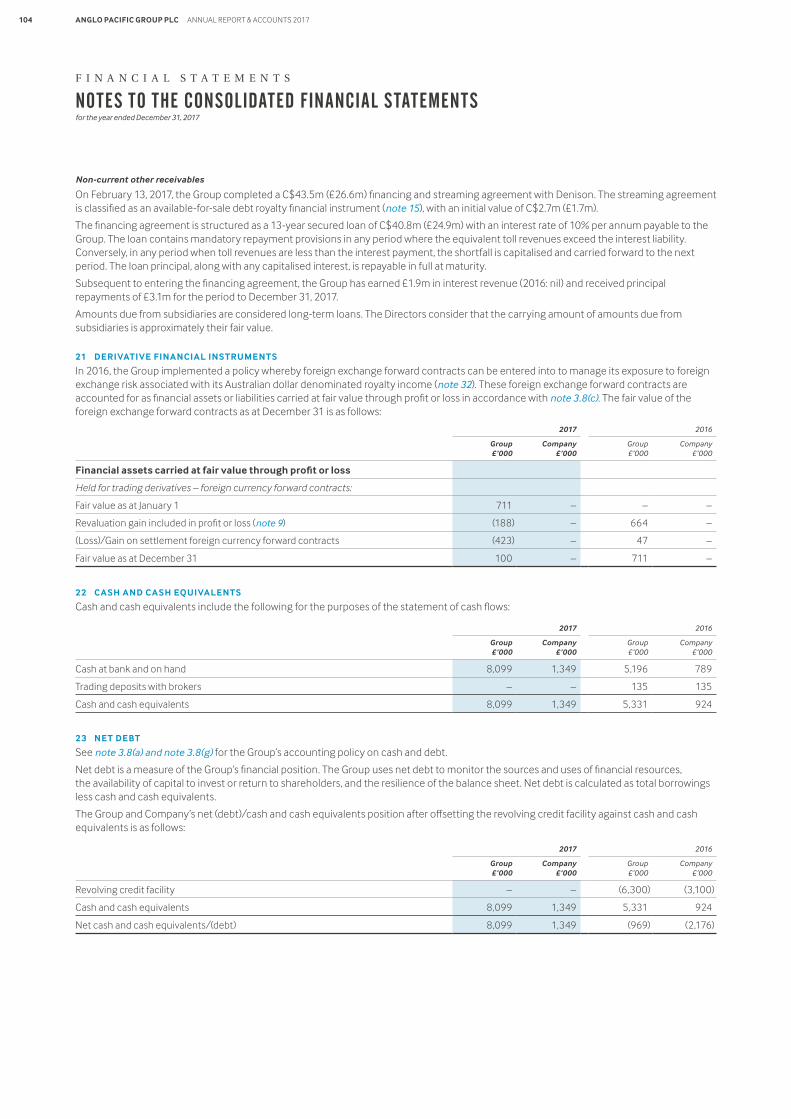
Non-current other receivables
On February 13, 2017, the Group completed a C$43.5m (£26.6m) financing and streaming agreement with Denison. The streaming agreement is classified as an available-for-sale debt royalty financial instrument (note 15), with an initial value of C$2.7m (£1.7m).
The financing agreement is structured as a 13-year secured loan of C$40.8m (£24.9m) with an interest rate of 10% per annum payable to the Group. The loan contains mandatory repayment provisions in any period where the equivalent toll revenues exceed the interest liability. Conversely, in any period when toll revenues are less than the interest payment, the shortfall is capitalised and carried forward to the next period. The loan principal, along with any capitalised interest, is repayable in full at maturity.
Subsequent to entering the financing agreement, the Group has earned £1.9m in interest revenue (2016: nil) and received principal repayments of £3.1m for the period to December 31, 2017.
Amounts due from subsidiaries are considered long-term loans. The Directors consider that the carrying amount of amounts due from subsidiaries is approximately their fair value.
21 DERIVATIVE FINANCIAL INSTRUMENTS
In 2016, the Group implemented a policy whereby foreign exchange forward contracts can be entered into to manage its exposure to foreign exchange risk associated with its Australian dollar denominated royalty income (note 32). These foreign exchange forward contracts are accounted for as financial assets or liabilities carried at fair value through profit or loss in accordance with note 3.8(c). The fair value of the foreign exchange forward contracts as at December 31 is as follows:
2017 2016
Group £’000
Company £’000
Group £’000
Company £’000
Financial assets carried at fair value through profit or loss
Held for trading derivatives – foreign currency forward contracts:
Fair value as at January 1 711 – – –
Revaluation gain included in profit or loss (note 9) (188) – 664 –
(Loss)/Gain on settlement foreign currency forward contracts (423) – 47 –
Fair value as at December 31 100 – 711 –
22 CASH AND CASH EQUIVALENTS
Cash and cash equivalents include the following for the purposes of the statement of cash flows:
2017 2016
Group £’000
Company £’000
Group £’000
Company £’000
Cash at bank and on hand 8,099 1,349 5,196 789
Trading deposits with brokers – – 135 135
Cash and cash equivalents 8,099 1,349 5,331 924
23 NET DEBT
See note 3.8(a) and note 3.8(g) for the Group’s accounting policy on cash and debt.
Net debt is a measure of the Group’s financial position. The Group uses net debt to monitor the sources and uses of financial resources, the availability of capital to invest or return to shareholders, and the resilience of the balance sheet. Net debt is calculated as total borrowings less cash and cash equivalents.
The Group and Company’s net (debt)/cash and cash equivalents position after offsetting the revolving credit facility against cash and cash equivalents is as follows:
2017 2016
Group £’000
Company £’000
Group £’000
Company £’000
Revolving credit facility – – (6,300) (3,100)
Cash and cash equivalents 8,099 1,349 5,331 924
Net cash and cash equivalents/(debt) 8,099 1,349 (969) (2,176)
F I N A N C I A L S T A T E M E N T S
APG_AR17_28.03.18_BACK_ARTWORK
ANGLO PACIFIC GROUP PLC ANNUAL REPORT & ACCOUNTS 2017104
NOTES TO THE CONSOLIDATED FINANCIAL STATEMENTSfor the year ended December 31, 2017
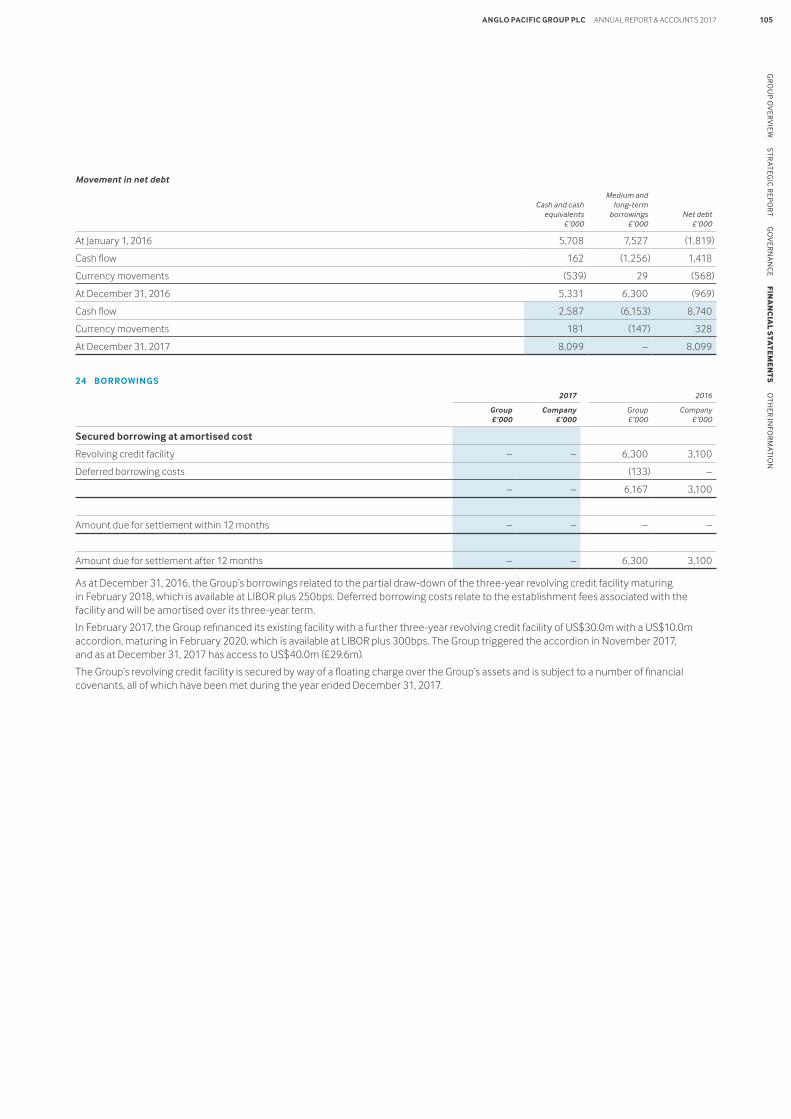
Movement in net debt
Cash and cash equivalents
£’000
Medium and long-term
borrowings £’000
Net debt £’000
At January 1, 2016 5,708 7,527 (1,819)
Cash flow 162 (1,256) 1,418
Currency movements (539) 29 (568)
At December 31, 2016 5,331 6,300 (969)
Cash flow 2,587 (6,153) 8,740
Currency movements 181 (147) 328
At December 31, 2017 8,099 – 8,099
24 BORROWINGS
2017 2016
Group £’000
Company £’000
Group £’000
Company £’000
Secured borrowing at amortised cost
Revolving credit facility – – 6,300 3,100
Deferred borrowing costs (133) –
– – 6,167 3,100
Amount due for settlement within 12 months – – – –
Amount due for settlement after 12 months – – 6,300 3,100
As at December 31, 2016, the Group’s borrowings related to the partial draw-down of the three-year revolving credit facility maturing in February 2018, which is available at LIBOR plus 250bps. Deferred borrowing costs relate to the establishment fees associated with the facility and will be amortised over its three-year term.
In February 2017, the Group refinanced its existing facility with a further three-year revolving credit facility of US$30.0m with a US$10.0m accordion, maturing in February 2020, which is available at LIBOR plus 300bps. The Group triggered the accordion in November 2017, and as at December 31, 2017 has access to US$40.0m (£29.6m).
The Group’s revolving credit facility is secured by way of a floating charge over the Group’s assets and is subject to a number of financial covenants, all of which have been met during the year ended December 31, 2017.
APG_AR17_28.03.18_BACK_ARTWORK
ANGLO PACIFIC GROUP PLC ANNUAL REPORT & ACCOUNTS 2017 105G
RO
UP O
VER
VIE
W S
TRATEG
IC R
EPO
RT G
OV
ERN
AN
CE F
INA
NC
IAL S
TAT
EM
EN
TS
OTH
ER IN
FOR
MATIO
N
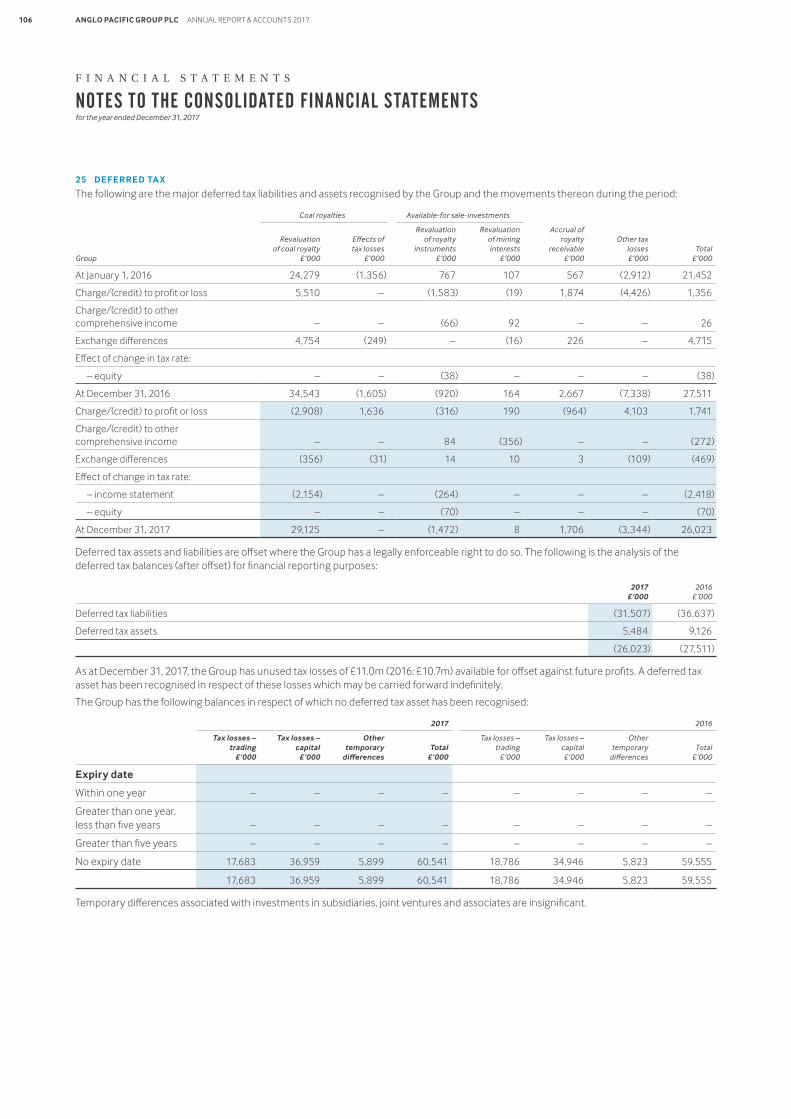
25 DEFERRED TA X
The following are the major deferred tax liabilities and assets recognised by the Group and the movements thereon during the period:
Coal royalties Available-for sale-investments
Group
Revaluation of coal royalty
£’000
Effects of tax losses
£’000
Revaluation of royalty
instruments £’000
Revaluation of mining interests
£’000
Accrual of royalty
receivable £’000
Other tax losses £’000
Total £’000
At January 1, 2016 24,279 (1,356) 767 107 567 (2,912) 21,452
Charge/(credit) to profit or loss 5,510 – (1,583) (19) 1,874 (4,426) 1,356
Charge/(credit) to other comprehensive income – – (66) 92 – – 26
Exchange differences 4,754 (249) – (16) 226 – 4,715
Effect of change in tax rate:
– equity – – (38) – – – (38)
At December 31, 2016 34,543 (1,605) (920) 164 2,667 (7,338) 27,511
Charge/(credit) to profit or loss (2,908) 1,636 (316) 190 (964) 4,103 1,741
Charge/(credit) to other comprehensive income – – 84 (356) – – (272)
Exchange differences (356) (31) 14 10 3 (109) (469)
Effect of change in tax rate:
– income statement (2,154) – (264) – – – (2,418)
– equity – – (70) – – – (70)
At December 31, 2017 29,125 – (1,472) 8 1,706 (3,344) 26,023
Deferred tax assets and liabilities are offset where the Group has a legally enforceable right to do so. The following is the analysis of the deferred tax balances (after offset) for financial reporting purposes:
2017 £’000
2016 £’000
Deferred tax liabilities (31,507) (36,637)
Deferred tax assets 5,484 9,126
(26,023) (27,511)
As at December 31, 2017, the Group has unused tax losses of £11.0m (2016: £10.7m) available for offset against future profits. A deferred tax asset has been recognised in respect of these losses which may be carried forward indefinitely.
The Group has the following balances in respect of which no deferred tax asset has been recognised:
2017 2016
Tax losses – trading
£’000
Tax losses – capital
£’000
Other temporary
differencesTotal
£’000
Tax losses – trading
£’000
Tax losses – capital £’000
Other temporary
differencesTotal
£’000
Expiry date
Within one year – – – – – – – –
Greater than one year, less than five years – – – – – – – –
Greater than five years – – – – – – – –
No expiry date 17,683 36,959 5,899 60,541 18,786 34,946 5,823 59,555
17,683 36,959 5,899 60,541 18,786 34,946 5,823 59,555
Temporary differences associated with investments in subsidiaries, joint ventures and associates are insignificant.
F I N A N C I A L S T A T E M E N T S
APG_AR17_28.03.18_BACK_ARTWORK
ANGLO PACIFIC GROUP PLC ANNUAL REPORT & ACCOUNTS 2017106
NOTES TO THE CONSOLIDATED FINANCIAL STATEMENTSfor the year ended December 31, 2017
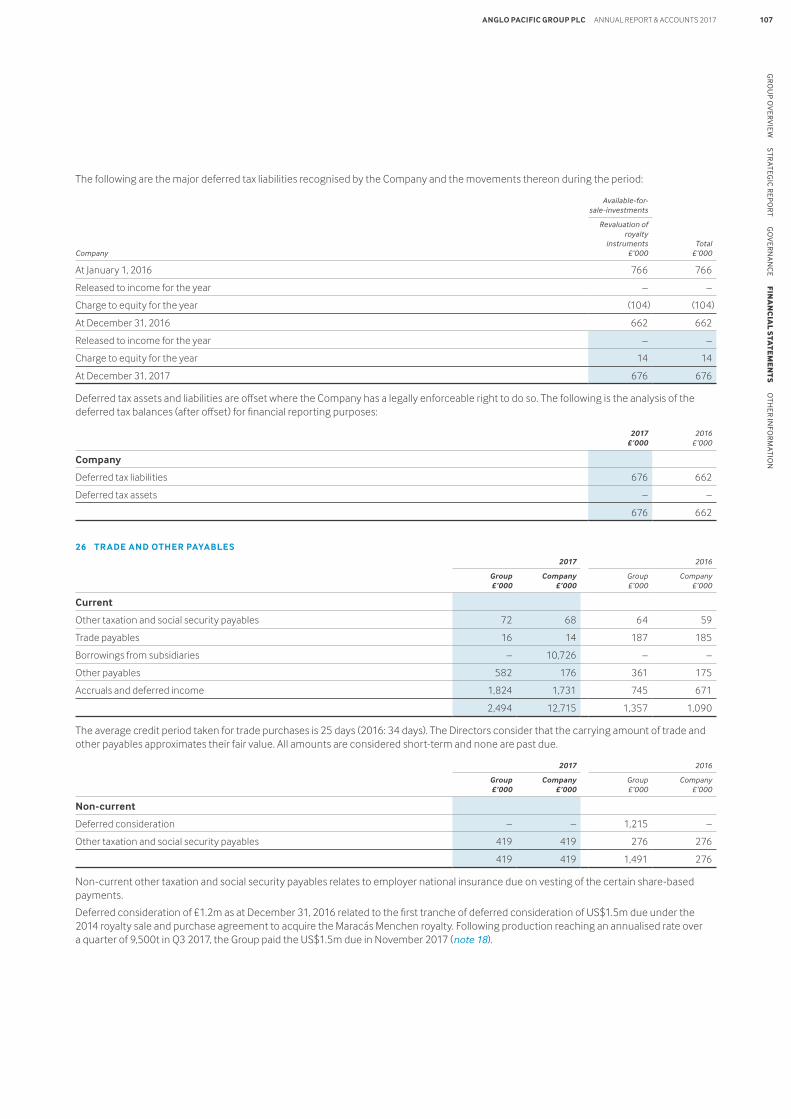
The following are the major deferred tax liabilities recognised by the Company and the movements thereon during the period:
Available-for-sale-investments
Company
Revaluation of royalty
instruments £’000
Total £’000
At January 1, 2016 766 766
Released to income for the year – –
Charge to equity for the year (104) (104)
At December 31, 2016 662 662
Released to income for the year – –
Charge to equity for the year 14 14
At December 31, 2017 676 676
Deferred tax assets and liabilities are offset where the Company has a legally enforceable right to do so. The following is the analysis of the deferred tax balances (after offset) for financial reporting purposes:
2017 £’000
2016 £’000
Company
Deferred tax liabilities 676 662
Deferred tax assets – –
676 662
26 TR ADE AND OTHER PAYABLES
2017 2016
Group £’000
Company £’000
Group £’000
Company £’000
Current
Other taxation and social security payables 72 68 64 59
Trade payables 16 14 187 185
Borrowings from subsidiaries – 10,726 – –
Other payables 582 176 361 175
Accruals and deferred income 1,824 1,731 745 671
2,494 12,715 1,357 1,090
The average credit period taken for trade purchases is 25 days (2016: 34 days). The Directors consider that the carrying amount of trade and other payables approximates their fair value. All amounts are considered short-term and none are past due.
2017 2016
Group £’000
Company £’000
Group £’000
Company £’000
Non-current
Deferred consideration – – 1,215 –
Other taxation and social security payables 419 419 276 276
419 419 1,491 276
Non-current other taxation and social security payables relates to employer national insurance due on vesting of the certain share-based payments.
Deferred consideration of £1.2m as at December 31, 2016 related to the first tranche of deferred consideration of US$1.5m due under the 2014 royalty sale and purchase agreement to acquire the Maracás Menchen royalty. Following production reaching an annualised rate over a quarter of 9,500t in Q3 2017, the Group paid the US$1.5m due in November 2017 (note 18).
APG_AR17_28.03.18_BACK_ARTWORK
ANGLO PACIFIC GROUP PLC ANNUAL REPORT & ACCOUNTS 2017 107G
RO
UP O
VER
VIE
W S
TRATEG
IC R
EPO
RT G
OV
ERN
AN
CE F
INA
NC
IAL S
TAT
EM
EN
TS
OTH
ER IN
FOR
MATIO
N
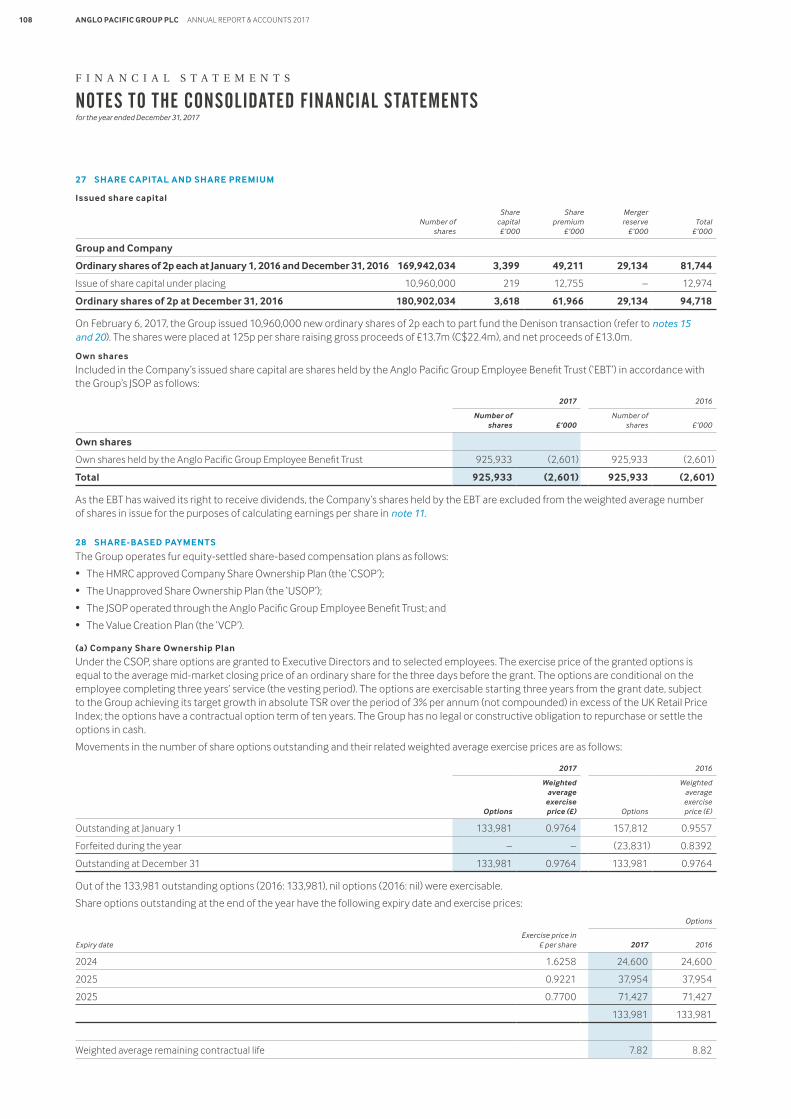
27 SHARE CAPITAL AND SHARE PREMIUM
Issued share capital
Number of shares
Share capital £’000
Share premium
£’000
Merger reserve
£’000Total
£’000
Group and Company
Ordinary shares of 2p each at January 1, 2016 and December 31, 2016 169,942,034 3,399 49,211 29,134 81,744
Issue of share capital under placing 10,960,000 219 12,755 – 12,974
Ordinary shares of 2p at December 31, 2016 180,902,034 3,618 61,966 29,134 94,718
On February 6, 2017, the Group issued 10,960,000 new ordinary shares of 2p each to part fund the Denison transaction (refer to notes 15 and 20). The shares were placed at 125p per share raising gross proceeds of £13.7m (C$22.4m), and net proceeds of £13.0m.
Own shares
Included in the Company’s issued share capital are shares held by the Anglo Pacific Group Employee Benefit Trust (‘EBT’) in accordance with the Group’s JSOP as follows:
2017 2016
Number of shares £’000
Number of shares £’000
Own shares
Own shares held by the Anglo Pacific Group Employee Benefit Trust 925,933 (2,601) 925,933 (2,601)
Total 925,933 (2,601) 925,933 (2,601)
As the EBT has waived its right to receive dividends, the Company’s shares held by the EBT are excluded from the weighted average number of shares in issue for the purposes of calculating earnings per share in note 11.
28 SHARE-BASED PAYMENTS
The Group operates fur equity-settled share-based compensation plans as follows:
• The HMRC approved Company Share Ownership Plan (the ‘CSOP’);
• The Unapproved Share Ownership Plan (the ‘USOP’);
• The JSOP operated through the Anglo Pacific Group Employee Benefit Trust; and
• The Value Creation Plan (the ‘VCP’).
(a) Company Share Ownership Plan
Under the CSOP, share options are granted to Executive Directors and to selected employees. The exercise price of the granted options is equal to the average mid-market closing price of an ordinary share for the three days before the grant. The options are conditional on the employee completing three years’ service (the vesting period). The options are exercisable starting three years from the grant date, subject to the Group achieving its target growth in absolute TSR over the period of 3% per annum (not compounded) in excess of the UK Retail Price Index; the options have a contractual option term of ten years. The Group has no legal or constructive obligation to repurchase or settle the options in cash.
Movements in the number of share options outstanding and their related weighted average exercise prices are as follows:
2017 2016
Options
Weighted average
exercise price (£) Options
Weighted average exercise price (£)
Outstanding at January 1 133,981 0.9764 157,812 0.9557
Forfeited during the year – – (23,831) 0.8392
Outstanding at December 31 133,981 0.9764 133,981 0.9764
Out of the 133,981 outstanding options (2016: 133,981), nil options (2016: nil) were exercisable.
Share options outstanding at the end of the year have the following expiry date and exercise prices:
Options
Expiry dateExercise price in
£ per share 2017 2016
2024 1.6258 24,600 24,600
2025 0.9221 37,954 37,954
2025 0.7700 71,427 71,427
133,981 133,981
Weighted average remaining contractual life 7.82 8.82
F I N A N C I A L S T A T E M E N T S
APG_AR17_28.03.18_BACK_ARTWORK
ANGLO PACIFIC GROUP PLC ANNUAL REPORT & ACCOUNTS 2017108
NOTES TO THE CONSOLIDATED FINANCIAL STATEMENTSfor the year ended December 31, 2017
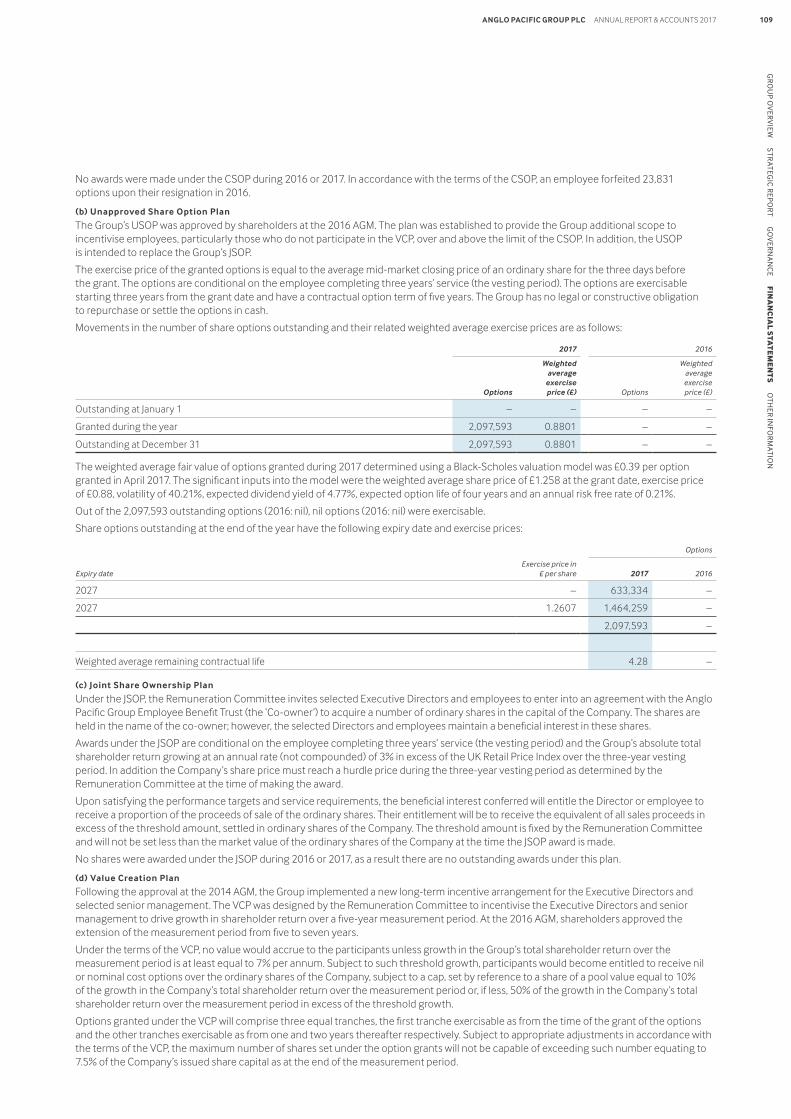
No awards were made under the CSOP during 2016 or 2017. In accordance with the terms of the CSOP, an employee forfeited 23,831 options upon their resignation in 2016.
(b) Unapproved Share Option Plan
The Group’s USOP was approved by shareholders at the 2016 AGM. The plan was established to provide the Group additional scope to incentivise employees, particularly those who do not participate in the VCP, over and above the limit of the CSOP. In addition, the USOP is intended to replace the Group’s JSOP.
The exercise price of the granted options is equal to the average mid-market closing price of an ordinary share for the three days before the grant. The options are conditional on the employee completing three years’ service (the vesting period). The options are exercisable starting three years from the grant date and have a contractual option term of five years. The Group has no legal or constructive obligation to repurchase or settle the options in cash.
Movements in the number of share options outstanding and their related weighted average exercise prices are as follows:
2017 2016
Options
Weighted average
exercise price (£) Options
Weighted average exercise price (£)
Outstanding at January 1 – – – –
Granted during the year 2,097,593 0.8801 – –
Outstanding at December 31 2,097,593 0.8801 – –
The weighted average fair value of options granted during 2017 determined using a Black-Scholes valuation model was £0.39 per option granted in April 2017. The significant inputs into the model were the weighted average share price of £1.258 at the grant date, exercise price of £0.88, volatility of 40.21%, expected dividend yield of 4.77%, expected option life of four years and an annual risk free rate of 0.21%.
Out of the 2,097,593 outstanding options (2016: nil), nil options (2016: nil) were exercisable.
Share options outstanding at the end of the year have the following expiry date and exercise prices:
Options
Expiry dateExercise price in
£ per share 2017 2016
2027 – 633,334 –
2027 1.2607 1,464,259 –
2,097,593 –
Weighted average remaining contractual life 4.28 –
(c) Joint Share Ownership Plan
Under the JSOP, the Remuneration Committee invites selected Executive Directors and employees to enter into an agreement with the Anglo Pacific Group Employee Benefit Trust (the ‘Co-owner’) to acquire a number of ordinary shares in the capital of the Company. The shares are held in the name of the co-owner; however, the selected Directors and employees maintain a beneficial interest in these shares.
Awards under the JSOP are conditional on the employee completing three years’ service (the vesting period) and the Group’s absolute total shareholder return growing at an annual rate (not compounded) of 3% in excess of the UK Retail Price Index over the three-year vesting period. In addition the Company’s share price must reach a hurdle price during the three-year vesting period as determined by the Remuneration Committee at the time of making the award.
Upon satisfying the performance targets and service requirements, the beneficial interest conferred will entitle the Director or employee to receive a proportion of the proceeds of sale of the ordinary shares. Their entitlement will be to receive the equivalent of all sales proceeds in excess of the threshold amount, settled in ordinary shares of the Company. The threshold amount is fixed by the Remuneration Committee and will not be set less than the market value of the ordinary shares of the Company at the time the JSOP award is made.
No shares were awarded under the JSOP during 2016 or 2017, as a result there are no outstanding awards under this plan.
(d) Value Creation Plan
Following the approval at the 2014 AGM, the Group implemented a new long-term incentive arrangement for the Executive Directors and selected senior management. The VCP was designed by the Remuneration Committee to incentivise the Executive Directors and senior management to drive growth in shareholder return over a five-year measurement period. At the 2016 AGM, shareholders approved the extension of the measurement period from five to seven years.
Under the terms of the VCP, no value would accrue to the participants unless growth in the Group’s total shareholder return over the measurement period is at least equal to 7% per annum. Subject to such threshold growth, participants would become entitled to receive nil or nominal cost options over the ordinary shares of the Company, subject to a cap, set by reference to a share of a pool value equal to 10% of the growth in the Company’s total shareholder return over the measurement period or, if less, 50% of the growth in the Company’s total shareholder return over the measurement period in excess of the threshold growth.
Options granted under the VCP will comprise three equal tranches, the first tranche exercisable as from the time of the grant of the options and the other tranches exercisable as from one and two years thereafter respectively. Subject to appropriate adjustments in accordance with the terms of the VCP, the maximum number of shares set under the option grants will not be capable of exceeding such number equating to 7.5% of the Company’s issued share capital as at the end of the measurement period.
APG_AR17_28.03.18_BACK_ARTWORK
ANGLO PACIFIC GROUP PLC ANNUAL REPORT & ACCOUNTS 2017 109G
RO
UP O
VER
VIE
W S
TRATEG
IC R
EPO
RT G
OV
ERN
AN
CE F
INA
NC
IAL S
TAT
EM
EN
TS
OTH
ER IN
FOR
MATIO
N
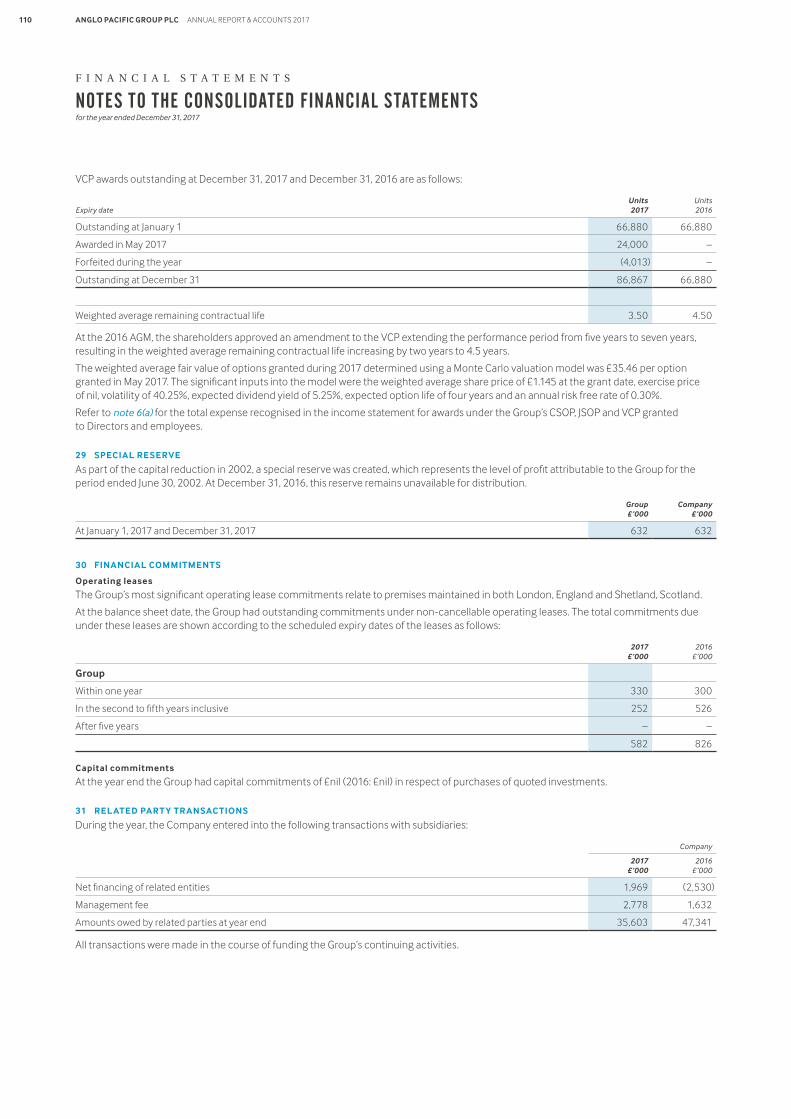
VCP awards outstanding at December 31, 2017 and December 31, 2016 are as follows:
Expiry dateUnits 2017
Units 2016
Outstanding at January 1 66,880 66,880
Awarded in May 2017 24,000 –
Forfeited during the year (4,013) –
Outstanding at December 31 86,867 66,880
Weighted average remaining contractual life 3.50 4.50
At the 2016 AGM, the shareholders approved an amendment to the VCP extending the performance period from five years to seven years, resulting in the weighted average remaining contractual life increasing by two years to 4.5 years.
The weighted average fair value of options granted during 2017 determined using a Monte Carlo valuation model was £35.46 per option granted in May 2017. The significant inputs into the model were the weighted average share price of £1.145 at the grant date, exercise price of nil, volatility of 40.25%, expected dividend yield of 5.25%, expected option life of four years and an annual risk free rate of 0.30%.
Refer to note 6(a) for the total expense recognised in the income statement for awards under the Group’s CSOP, JSOP and VCP granted to Directors and employees.
29 SPECIAL RESERVE
As part of the capital reduction in 2002, a special reserve was created, which represents the level of profit attributable to the Group for the period ended June 30, 2002. At December 31, 2016, this reserve remains unavailable for distribution.
Group £’000
Company £’000
At January 1, 2017 and December 31, 2017 632 632
30 FINANCIAL COMMITMENTS
Operating leases
The Group’s most significant operating lease commitments relate to premises maintained in both London, England and Shetland, Scotland.
At the balance sheet date, the Group had outstanding commitments under non-cancellable operating leases. The total commitments due under these leases are shown according to the scheduled expiry dates of the leases as follows:
2017 £’000
2016 £’000
Group
Within one year 330 300
In the second to fifth years inclusive 252 526
After five years – –
582 826
Capital commitments
At the year end the Group had capital commitments of £nil (2016: £nil) in respect of purchases of quoted investments.
31 REL ATED PART Y TR ANSACTIONS
During the year, the Company entered into the following transactions with subsidiaries:
Company
2017 £’000
2016 £’000
Net financing of related entities 1,969 (2,530)
Management fee 2,778 1,632
Amounts owed by related parties at year end 35,603 47,341
All transactions were made in the course of funding the Group’s continuing activities.
F I N A N C I A L S T A T E M E N T S
APG_AR17_28.03.18_BACK_ARTWORK
ANGLO PACIFIC GROUP PLC ANNUAL REPORT & ACCOUNTS 2017110
NOTES TO THE CONSOLIDATED FINANCIAL STATEMENTSfor the year ended December 31, 2017
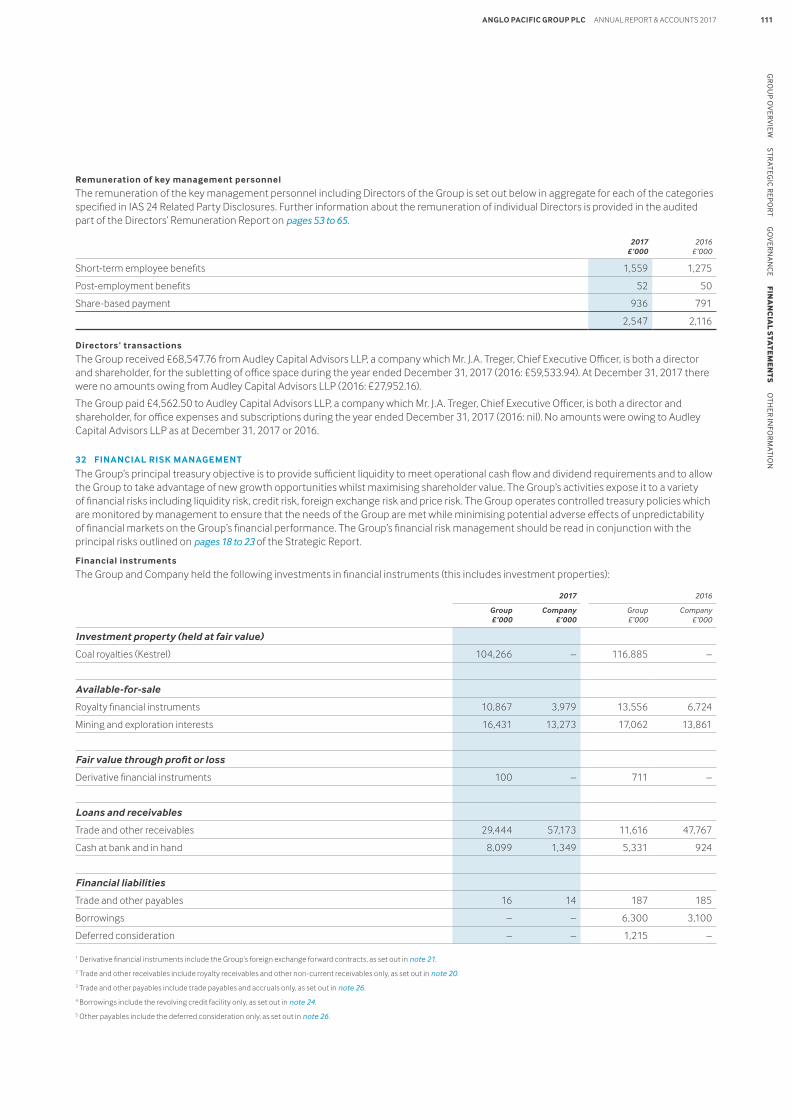
Remuneration of key management personnel
The remuneration of the key management personnel including Directors of the Group is set out below in aggregate for each of the categories specified in IAS 24 Related Party Disclosures. Further information about the remuneration of individual Directors is provided in the audited part of the Directors’ Remuneration Report on pages 53 to 65.
2017 £’000
2016 £’000
Short-term employee benefits 1,559 1,275
Post-employment benefits 52 50
Share-based payment 936 791
2,547 2,116
Directors’ transactions
The Group received £68,547.76 from Audley Capital Advisors LLP, a company which Mr. J.A. Treger, Chief Executive Officer, is both a director and shareholder, for the subletting of office space during the year ended December 31, 2017 (2016: £59,533.94). At December 31, 2017 there were no amounts owing from Audley Capital Advisors LLP (2016: £27,952.16).
The Group paid £4,562.50 to Audley Capital Advisors LLP, a company which Mr. J.A. Treger, Chief Executive Officer, is both a director and shareholder, for office expenses and subscriptions during the year ended December 31, 2017 (2016: nil). No amounts were owing to Audley Capital Advisors LLP as at December 31, 2017 or 2016.
32 FINANCIAL RISK MANAGEMENT
The Group’s principal treasury objective is to provide sufficient liquidity to meet operational cash flow and dividend requirements and to allow the Group to take advantage of new growth opportunities whilst maximising shareholder value. The Group’s activities expose it to a variety of financial risks including liquidity risk, credit risk, foreign exchange risk and price risk. The Group operates controlled treasury policies which are monitored by management to ensure that the needs of the Group are met while minimising potential adverse effects of unpredictability of financial markets on the Group’s financial performance. The Group’s financial risk management should be read in conjunction with the principal risks outlined on pages 18 to 23 of the Strategic Report.
Financial instruments
The Group and Company held the following investments in financial instruments (this includes investment properties):
2017 2016
Group £’000
Company £’000
Group £’000
Company £’000
Investment property (held at fair value)
Coal royalties (Kestrel) 104,266 – 116,885 –
Available-for-sale
Royalty financial instruments 10,867 3,979 13,556 6,724
Mining and exploration interests 16,431 13,273 17,062 13,861
Fair value through profit or loss
Derivative financial instruments 100 – 711 –
Loans and receivables
Trade and other receivables 29,444 57,173 11,616 47,767
Cash at bank and in hand 8,099 1,349 5,331 924
Financial liabilities
Trade and other payables 16 14 187 185
Borrowings – – 6,300 3,100
Deferred consideration – – 1,215 –
1 Derivative financial instruments include the Group’s foreign exchange forward contracts, as set out in note 21.
2 Trade and other receivables include royalty receivables and other non-current receivables only, as set out in note 20.
3 Trade and other payables include trade payables and accruals only, as set out in note 26.
4 Borrowings include the revolving credit facility only, as set out in note 24.
5 Other payables include the deferred consideration only, as set out in note 26.
APG_AR17_28.03.18_BACK_ARTWORK
ANGLO PACIFIC GROUP PLC ANNUAL REPORT & ACCOUNTS 2017 111G
RO
UP O
VER
VIE
W S
TRATEG
IC R
EPO
RT G
OV
ERN
AN
CE F
INA
NC
IAL S
TAT
EM
EN
TS
OTH
ER IN
FOR
MATIO
N
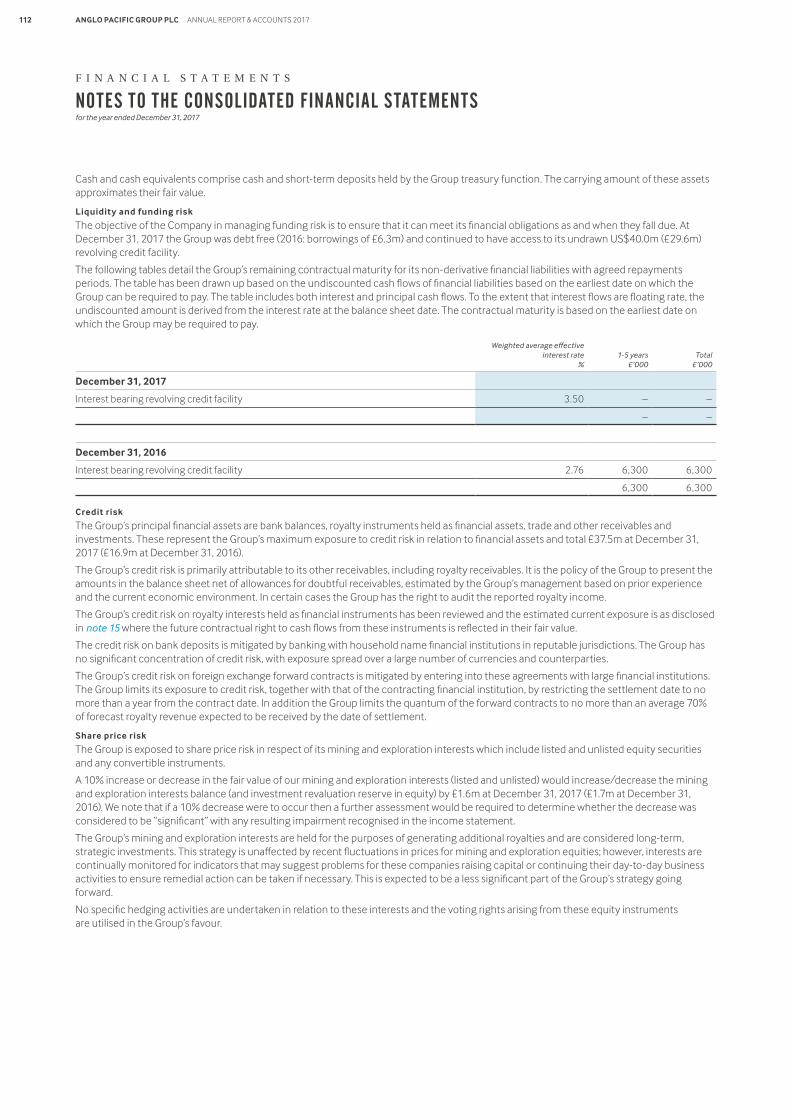
Cash and cash equivalents comprise cash and short-term deposits held by the Group treasury function. The carrying amount of these assets approximates their fair value.
Liquidity and funding risk
The objective of the Company in managing funding risk is to ensure that it can meet its financial obligations as and when they fall due. At December 31, 2017 the Group was debt free (2016: borrowings of £6.3m) and continued to have access to its undrawn US$40.0m (£29.6m) revolving credit facility.
The following tables detail the Group’s remaining contractual maturity for its non-derivative financial liabilities with agreed repayments periods. The table has been drawn up based on the undiscounted cash flows of financial liabilities based on the earliest date on which the Group can be required to pay. The table includes both interest and principal cash flows. To the extent that interest flows are floating rate, the undiscounted amount is derived from the interest rate at the balance sheet date. The contractual maturity is based on the earliest date on which the Group may be required to pay.
Weighted average effective interest rate
%1-5 years
£’000Total
£’000
December 31, 2017
Interest bearing revolving credit facility 3.50 – –
– –
December 31, 2016
Interest bearing revolving credit facility 2.76 6,300 6,300
6,300 6,300
Credit risk
The Group’s principal financial assets are bank balances, royalty instruments held as financial assets, trade and other receivables and investments. These represent the Group’s maximum exposure to credit risk in relation to financial assets and total £37.5m at December 31, 2017 (£16.9m at December 31, 2016).
The Group’s credit risk is primarily attributable to its other receivables, including royalty receivables. It is the policy of the Group to present the amounts in the balance sheet net of allowances for doubtful receivables, estimated by the Group’s management based on prior experience and the current economic environment. In certain cases the Group has the right to audit the reported royalty income.
The Group’s credit risk on royalty interests held as financial instruments has been reviewed and the estimated current exposure is as disclosed in note 15 where the future contractual right to cash flows from these instruments is reflected in their fair value.
The credit risk on bank deposits is mitigated by banking with household name financial institutions in reputable jurisdictions. The Group has no significant concentration of credit risk, with exposure spread over a large number of currencies and counterparties.
The Group’s credit risk on foreign exchange forward contracts is mitigated by entering into these agreements with large financial institutions. The Group limits its exposure to credit risk, together with that of the contracting financial institution, by restricting the settlement date to no more than a year from the contract date. In addition the Group limits the quantum of the forward contracts to no more than an average 70% of forecast royalty revenue expected to be received by the date of settlement.
Share price risk
The Group is exposed to share price risk in respect of its mining and exploration interests which include listed and unlisted equity securities and any convertible instruments.
A 10% increase or decrease in the fair value of our mining and exploration interests (listed and unlisted) would increase/decrease the mining and exploration interests balance (and investment revaluation reserve in equity) by £1.6m at December 31, 2017 (£1.7m at December 31, 2016). We note that if a 10% decrease were to occur then a further assessment would be required to determine whether the decrease was considered to be “significant” with any resulting impairment recognised in the income statement.
The Group’s mining and exploration interests are held for the purposes of generating additional royalties and are considered long-term, strategic investments. This strategy is unaffected by recent fluctuations in prices for mining and exploration equities; however, interests are continually monitored for indicators that may suggest problems for these companies raising capital or continuing their day-to-day business activities to ensure remedial action can be taken if necessary. This is expected to be a less significant part of the Group’s strategy going forward.
No specific hedging activities are undertaken in relation to these interests and the voting rights arising from these equity instruments are utilised in the Group’s favour.
F I N A N C I A L S T A T E M E N T S
APG_AR17_28.03.18_BACK_ARTWORK
ANGLO PACIFIC GROUP PLC ANNUAL REPORT & ACCOUNTS 2017112
NOTES TO THE CONSOLIDATED FINANCIAL STATEMENTSfor the year ended December 31, 2017
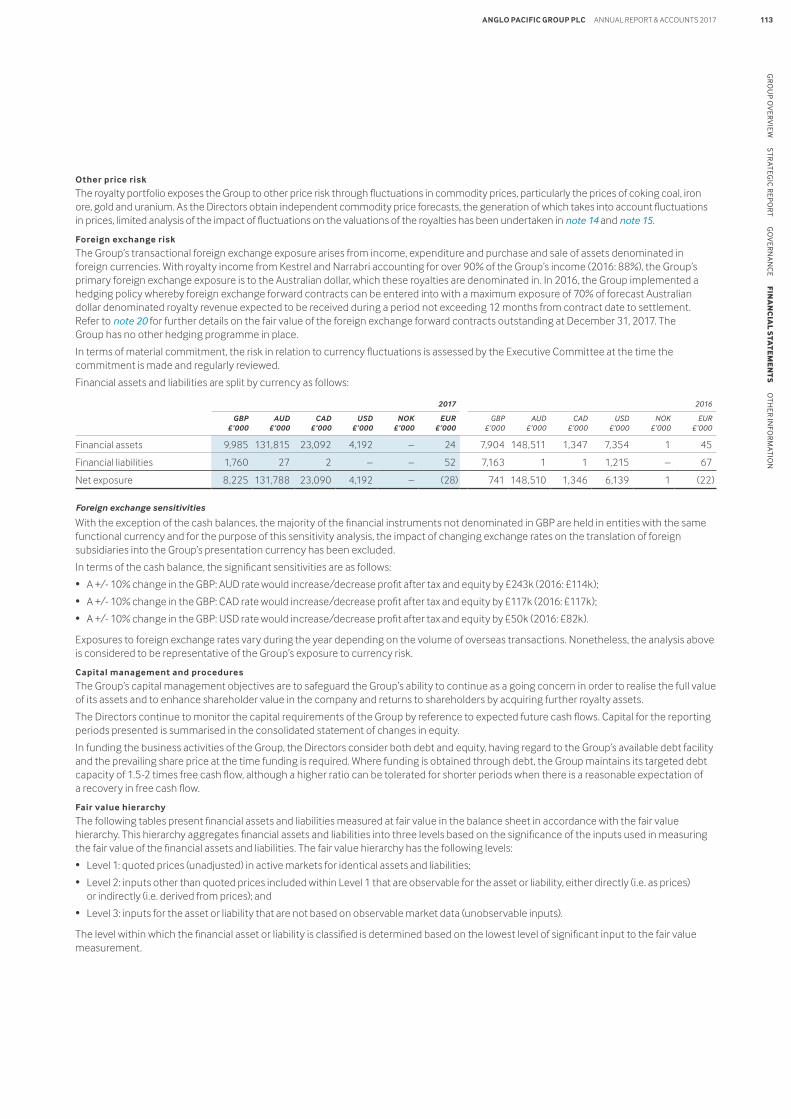
Other price risk
The royalty portfolio exposes the Group to other price risk through fluctuations in commodity prices, particularly the prices of coking coal, iron ore, gold and uranium. As the Directors obtain independent commodity price forecasts, the generation of which takes into account fluctuations in prices, limited analysis of the impact of fluctuations on the valuations of the royalties has been undertaken in note 14 and note 15.
Foreign exchange risk
The Group’s transactional foreign exchange exposure arises from income, expenditure and purchase and sale of assets denominated in foreign currencies. With royalty income from Kestrel and Narrabri accounting for over 90% of the Group’s income (2016: 88%), the Group’s primary foreign exchange exposure is to the Australian dollar, which these royalties are denominated in. In 2016, the Group implemented a hedging policy whereby foreign exchange forward contracts can be entered into with a maximum exposure of 70% of forecast Australian dollar denominated royalty revenue expected to be received during a period not exceeding 12 months from contract date to settlement. Refer to note 20 for further details on the fair value of the foreign exchange forward contracts outstanding at December 31, 2017. The Group has no other hedging programme in place.
In terms of material commitment, the risk in relation to currency fluctuations is assessed by the Executive Committee at the time the commitment is made and regularly reviewed.
Financial assets and liabilities are split by currency as follows:
2017 2016
GBP £’000
AUD £’000
CAD £’000
USD £’000
NOK £’000
EUR £’000
GBP £’000
AUD £’000
CAD £’000
USD £’000
NOK £’000
EUR £’000
Financial assets 9,985 131,815 23,092 4,192 – 24 7,904 148,511 1,347 7,354 1 45
Financial liabilities 1,760 27 2 – – 52 7,163 1 1 1,215 – 67
Net exposure 8,225 131,788 23,090 4,192 – (28) 741 148,510 1,346 6,139 1 (22)
Foreign exchange sensitivities
With the exception of the cash balances, the majority of the financial instruments not denominated in GBP are held in entities with the same functional currency and for the purpose of this sensitivity analysis, the impact of changing exchange rates on the translation of foreign subsidiaries into the Group’s presentation currency has been excluded.
In terms of the cash balance, the significant sensitivities are as follows:
• A +/- 10% change in the GBP: AUD rate would increase/decrease profit after tax and equity by £243k (2016: £114k);
• A +/- 10% change in the GBP: CAD rate would increase/decrease profit after tax and equity by £117k (2016: £117k);
• A +/- 10% change in the GBP: USD rate would increase/decrease profit after tax and equity by £50k (2016: £82k).
Exposures to foreign exchange rates vary during the year depending on the volume of overseas transactions. Nonetheless, the analysis above is considered to be representative of the Group’s exposure to currency risk.
Capital management and procedures
The Group’s capital management objectives are to safeguard the Group’s ability to continue as a going concern in order to realise the full value of its assets and to enhance shareholder value in the company and returns to shareholders by acquiring further royalty assets.
The Directors continue to monitor the capital requirements of the Group by reference to expected future cash flows. Capital for the reporting periods presented is summarised in the consolidated statement of changes in equity.
In funding the business activities of the Group, the Directors consider both debt and equity, having regard to the Group’s available debt facility and the prevailing share price at the time funding is required. Where funding is obtained through debt, the Group maintains its targeted debt capacity of 1.5-2 times free cash flow, although a higher ratio can be tolerated for shorter periods when there is a reasonable expectation of a recovery in free cash flow.
Fair value hierarchy
The following tables present financial assets and liabilities measured at fair value in the balance sheet in accordance with the fair value hierarchy. This hierarchy aggregates financial assets and liabilities into three levels based on the significance of the inputs used in measuring the fair value of the financial assets and liabilities. The fair value hierarchy has the following levels:
• Level 1: quoted prices (unadjusted) in active markets for identical assets and liabilities;
• Level 2: inputs other than quoted prices included within Level 1 that are observable for the asset or liability, either directly (i.e. as prices) or indirectly (i.e. derived from prices); and
• Level 3: inputs for the asset or liability that are not based on observable market data (unobservable inputs).
The level within which the financial asset or liability is classified is determined based on the lowest level of significant input to the fair value measurement.
APG_AR17_28.03.18_BACK_ARTWORK
ANGLO PACIFIC GROUP PLC ANNUAL REPORT & ACCOUNTS 2017 113G
RO
UP O
VER
VIE
W S
TRATEG
IC R
EPO
RT G
OV
ERN
AN
CE F
INA
NC
IAL S
TAT
EM
EN
TS
OTH
ER IN
FOR
MATIO
N
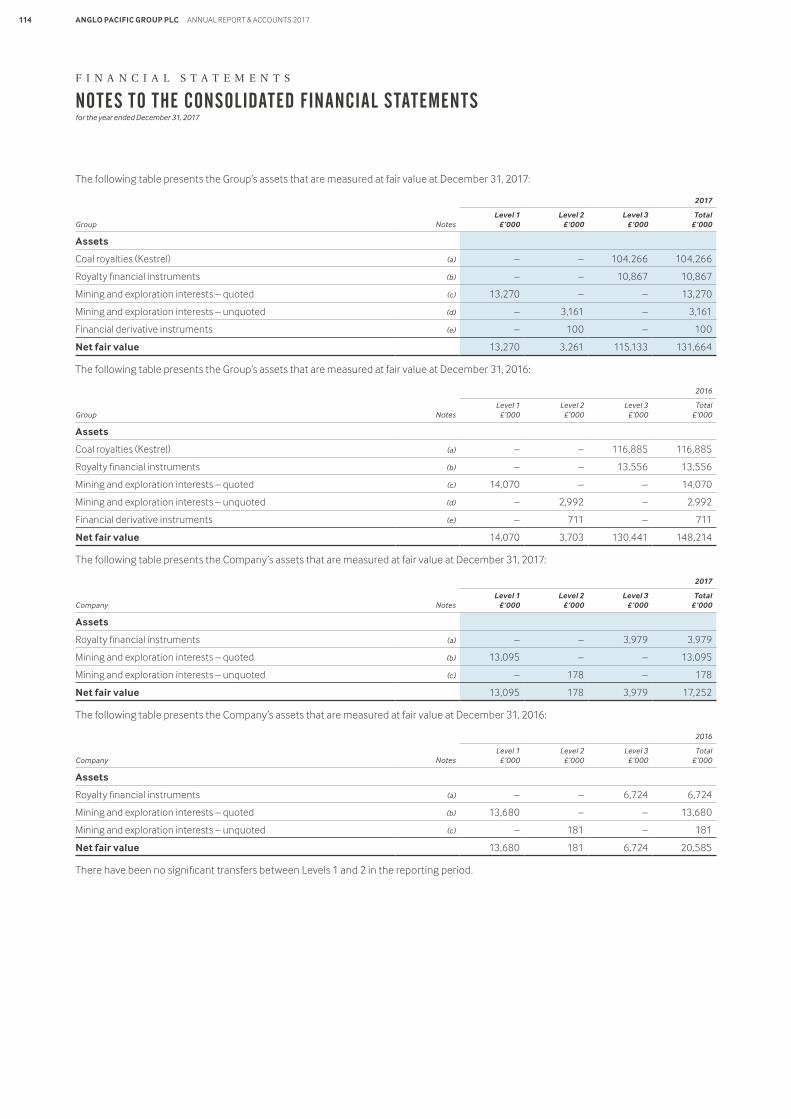
The following table presents the Group’s assets that are measured at fair value at December 31, 2017:
2017
Group NotesLevel 1
£’000Level 2
£’000Level 3
£’000Total
£’000
Assets
Coal royalties (Kestrel) (a) – – 104,266 104,266
Royalty financial instruments (b) – – 10,867 10,867
Mining and exploration interests – quoted (c) 13,270 – – 13,270
Mining and exploration interests – unquoted (d) – 3,161 – 3,161
Financial derivative instruments (e) – 100 – 100
Net fair value 13,270 3,261 115,133 131,664
The following table presents the Group’s assets that are measured at fair value at December 31, 2016:
2016
Group NotesLevel 1
£’000Level 2
£’000Level 3
£’000Total
£’000
Assets
Coal royalties (Kestrel) (a) – – 116,885 116,885
Royalty financial instruments (b) – – 13,556 13,556
Mining and exploration interests – quoted (c) 14,070 – – 14,070
Mining and exploration interests – unquoted (d) – 2,992 – 2,992
Financial derivative instruments (e) – 711 – 711
Net fair value 14,070 3,703 130,441 148,214
The following table presents the Company’s assets that are measured at fair value at December 31, 2017:
2017
Company NotesLevel 1
£’000Level 2
£’000Level 3
£’000Total
£’000
Assets
Royalty financial instruments (a) – – 3,979 3,979
Mining and exploration interests – quoted (b) 13,095 – – 13,095
Mining and exploration interests – unquoted (c) – 178 – 178
Net fair value 13,095 178 3,979 17,252
The following table presents the Company’s assets that are measured at fair value at December 31, 2016:
2016
Company NotesLevel 1
£’000Level 2
£’000Level 3
£’000Total
£’000
Assets
Royalty financial instruments (a) – – 6,724 6,724
Mining and exploration interests – quoted (b) 13,680 – – 13,680
Mining and exploration interests – unquoted (c) – 181 – 181
Net fair value 13,680 181 6,724 20,585
There have been no significant transfers between Levels 1 and 2 in the reporting period.
F I N A N C I A L S T A T E M E N T S
APG_AR17_28.03.18_BACK_ARTWORK
ANGLO PACIFIC GROUP PLC ANNUAL REPORT & ACCOUNTS 2017114
NOTES TO THE CONSOLIDATED FINANCIAL STATEMENTSfor the year ended December 31, 2017
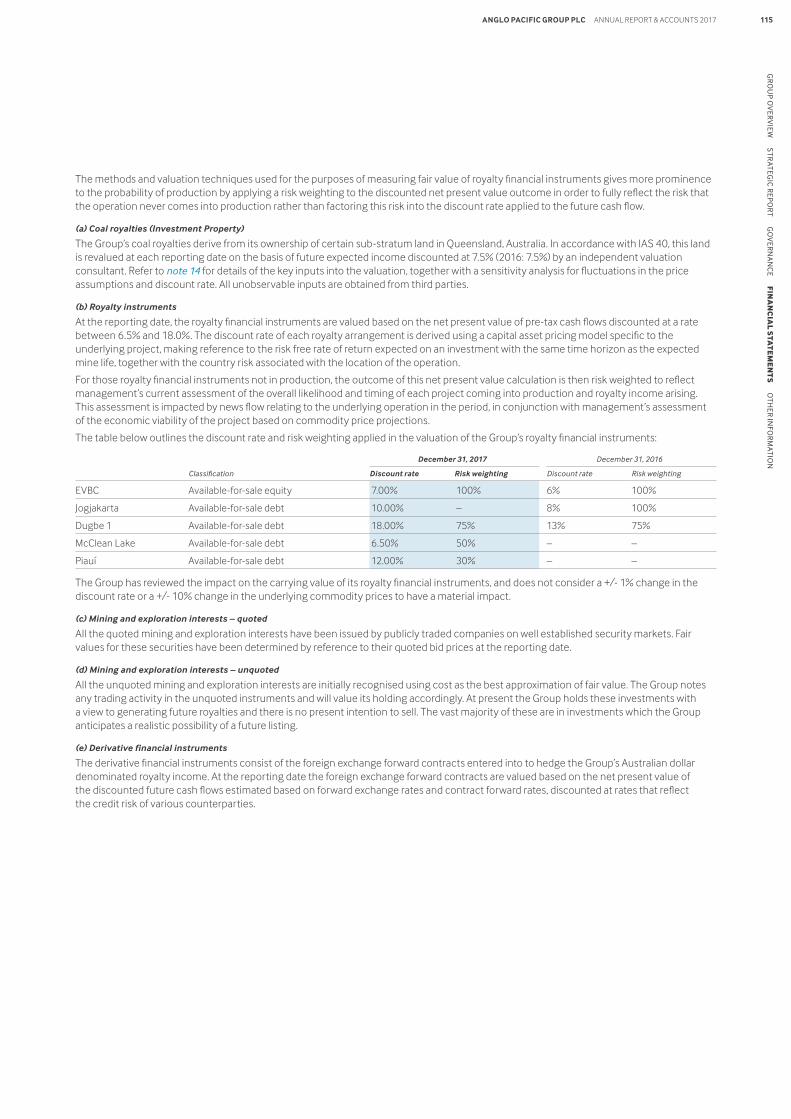
The methods and valuation techniques used for the purposes of measuring fair value of royalty financial instruments gives more prominence to the probability of production by applying a risk weighting to the discounted net present value outcome in order to fully reflect the risk that the operation never comes into production rather than factoring this risk into the discount rate applied to the future cash flow.
(a) Coal royalties (Investment Property)
The Group’s coal royalties derive from its ownership of certain sub-stratum land in Queensland, Australia. In accordance with IAS 40, this land is revalued at each reporting date on the basis of future expected income discounted at 7.5% (2016: 7.5%) by an independent valuation consultant. Refer to note 14 for details of the key inputs into the valuation, together with a sensitivity analysis for fluctuations in the price assumptions and discount rate. All unobservable inputs are obtained from third parties.
(b) Royalty instruments
At the reporting date, the royalty financial instruments are valued based on the net present value of pre-tax cash flows discounted at a rate between 6.5% and 18.0%. The discount rate of each royalty arrangement is derived using a capital asset pricing model specific to the underlying project, making reference to the risk free rate of return expected on an investment with the same time horizon as the expected mine life, together with the country risk associated with the location of the operation.
For those royalty financial instruments not in production, the outcome of this net present value calculation is then risk weighted to reflect management’s current assessment of the overall likelihood and timing of each project coming into production and royalty income arising. This assessment is impacted by news flow relating to the underlying operation in the period, in conjunction with management’s assessment of the economic viability of the project based on commodity price projections.
The table below outlines the discount rate and risk weighting applied in the valuation of the Group’s royalty financial instruments:
December 31, 2017 December 31, 2016
Classification Discount rate Risk weighting Discount rate Risk weighting
EVBC Available-for-sale equity 7.00% 100% 6% 100%
Jogjakarta Available-for-sale debt 10.00% – 8% 100%
Dugbe 1 Available-for-sale debt 18.00% 75% 13% 75%
McClean Lake Available-for-sale debt 6.50% 50% – –
Piauí Available-for-sale debt 12.00% 30% – –
The Group has reviewed the impact on the carrying value of its royalty financial instruments, and does not consider a +/- 1% change in the discount rate or a +/- 10% change in the underlying commodity prices to have a material impact.
(c) Mining and exploration interests – quoted
All the quoted mining and exploration interests have been issued by publicly traded companies on well established security markets. Fair values for these securities have been determined by reference to their quoted bid prices at the reporting date.
(d) Mining and exploration interests – unquoted
All the unquoted mining and exploration interests are initially recognised using cost as the best approximation of fair value. The Group notes any trading activity in the unquoted instruments and will value its holding accordingly. At present the Group holds these investments with a view to generating future royalties and there is no present intention to sell. The vast majority of these are in investments which the Group anticipates a realistic possibility of a future listing.
(e) Derivative financial instruments
The derivative financial instruments consist of the foreign exchange forward contracts entered into to hedge the Group’s Australian dollar denominated royalty income. At the reporting date the foreign exchange forward contracts are valued based on the net present value of the discounted future cash flows estimated based on forward exchange rates and contract forward rates, discounted at rates that reflect the credit risk of various counterparties.
APG_AR17_28.03.18_BACK_ARTWORK
ANGLO PACIFIC GROUP PLC ANNUAL REPORT & ACCOUNTS 2017 115G
RO
UP O
VER
VIE
W S
TRATEG
IC R
EPO
RT G
OV
ERN
AN
CE F
INA
NC
IAL S
TAT
EM
EN
TS
OTH
ER IN
FOR
MATIO
N
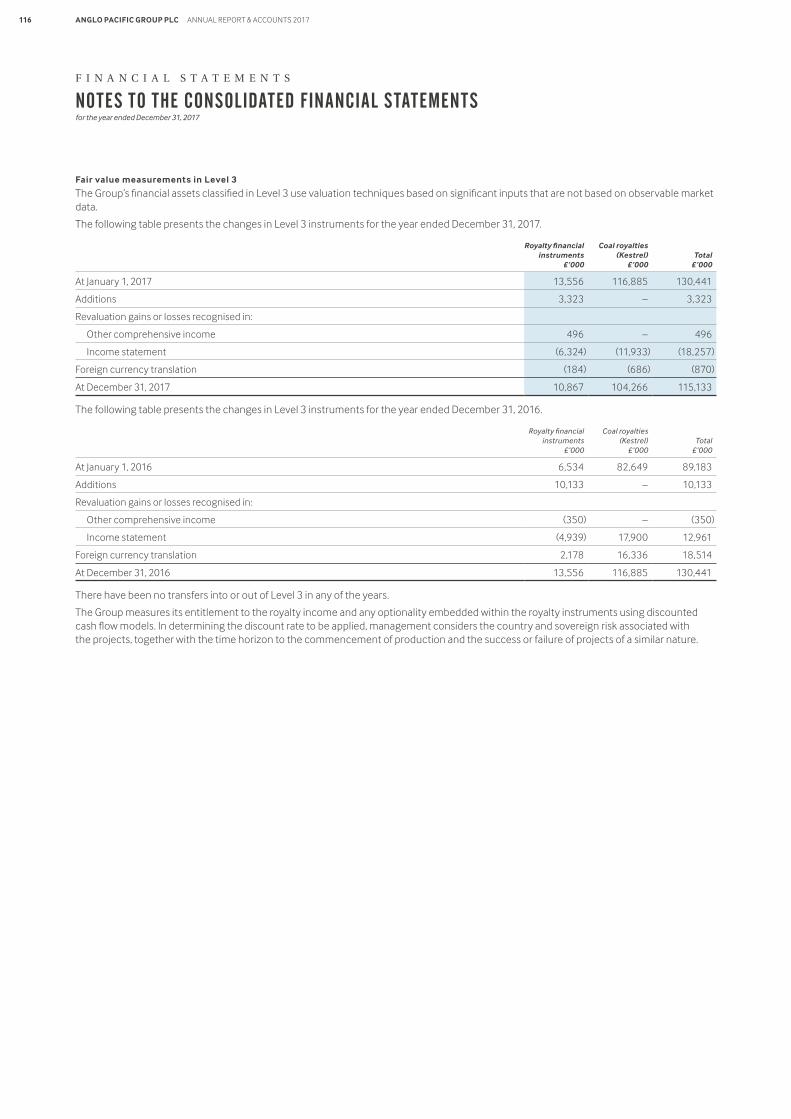
Fair value measurements in Level 3
The Group’s financial assets classified in Level 3 use valuation techniques based on significant inputs that are not based on observable market data.
The following table presents the changes in Level 3 instruments for the year ended December 31, 2017.
Royalty financial instruments
£’000
Coal royalties (Kestrel)
£’000Total
£’000
At January 1, 2017 13,556 116,885 130,441
Additions 3,323 – 3,323
Revaluation gains or losses recognised in:
Other comprehensive income 496 – 496
Income statement (6,324) (11,933) (18,257)
Foreign currency translation (184) (686) (870)
At December 31, 2017 10,867 104,266 115,133
The following table presents the changes in Level 3 instruments for the year ended December 31, 2016.
Royalty financial instruments
£’000
Coal royalties (Kestrel)
£’000Total
£’000
At January 1, 2016 6,534 82,649 89,183
Additions 10,133 – 10,133
Revaluation gains or losses recognised in:
Other comprehensive income (350) – (350)
Income statement (4,939) 17,900 12,961
Foreign currency translation 2,178 16,336 18,514
At December 31, 2016 13,556 116,885 130,441
There have been no transfers into or out of Level 3 in any of the years.
The Group measures its entitlement to the royalty income and any optionality embedded within the royalty instruments using discounted cash flow models. In determining the discount rate to be applied, management considers the country and sovereign risk associated with the projects, together with the time horizon to the commencement of production and the success or failure of projects of a similar nature.
F I N A N C I A L S T A T E M E N T S
APG_AR17_28.03.18_BACK_ARTWORK
ANGLO PACIFIC GROUP PLC ANNUAL REPORT & ACCOUNTS 2017116
NOTES TO THE CONSOLIDATED FINANCIAL STATEMENTSfor the year ended December 31, 2017
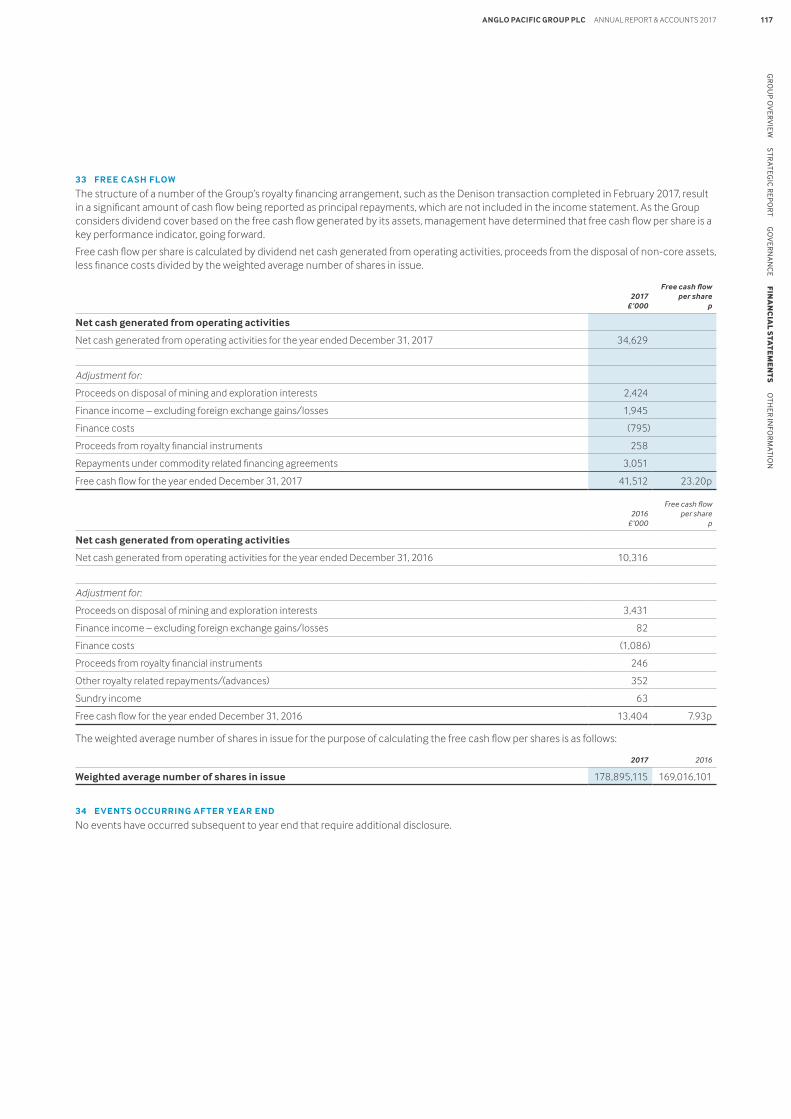
33 FREE CASH FLOW
The structure of a number of the Group’s royalty financing arrangement, such as the Denison transaction completed in February 2017, result in a significant amount of cash flow being reported as principal repayments, which are not included in the income statement. As the Group considers dividend cover based on the free cash flow generated by its assets, management have determined that free cash flow per share is a key performance indicator, going forward.
Free cash flow per share is calculated by dividend net cash generated from operating activities, proceeds from the disposal of non-core assets, less finance costs divided by the weighted average number of shares in issue.
2017 £’000
Free cash flow per share
p
Net cash generated from operating activities
Net cash generated from operating activities for the year ended December 31, 2017 34,629
Adjustment for:
Proceeds on disposal of mining and exploration interests 2,424
Finance income – excluding foreign exchange gains/losses 1,945
Finance costs (795)
Proceeds from royalty financial instruments 258
Repayments under commodity related financing agreements 3,051
Free cash flow for the year ended December 31, 2017 41,512 23.20p
2016 £’000
Free cash flow per share
p
Net cash generated from operating activities
Net cash generated from operating activities for the year ended December 31, 2016 10,316
Adjustment for:
Proceeds on disposal of mining and exploration interests 3,431
Finance income – excluding foreign exchange gains/losses 82
Finance costs (1,086)
Proceeds from royalty financial instruments 246
Other royalty related repayments/(advances) 352
Sundry income 63
Free cash flow for the year ended December 31, 2016 13,404 7.93p
The weighted average number of shares in issue for the purpose of calculating the free cash flow per shares is as follows:
2017 2016
Weighted average number of shares in issue 178,895,115 169,016,101
34 EVENTS OCCURRING AF TER YEAR END
No events have occurred subsequent to year end that require additional disclosure.
APG_AR17_28.03.18_BACK_ARTWORK
ANGLO PACIFIC GROUP PLC ANNUAL REPORT & ACCOUNTS 2017 117G
RO
UP O
VER
VIE
W S
TRATEG
IC R
EPO
RT G
OV
ERN
AN
CE F
INA
NC
IAL S
TAT
EM
EN
TS
OTH
ER IN
FOR
MATIO
N
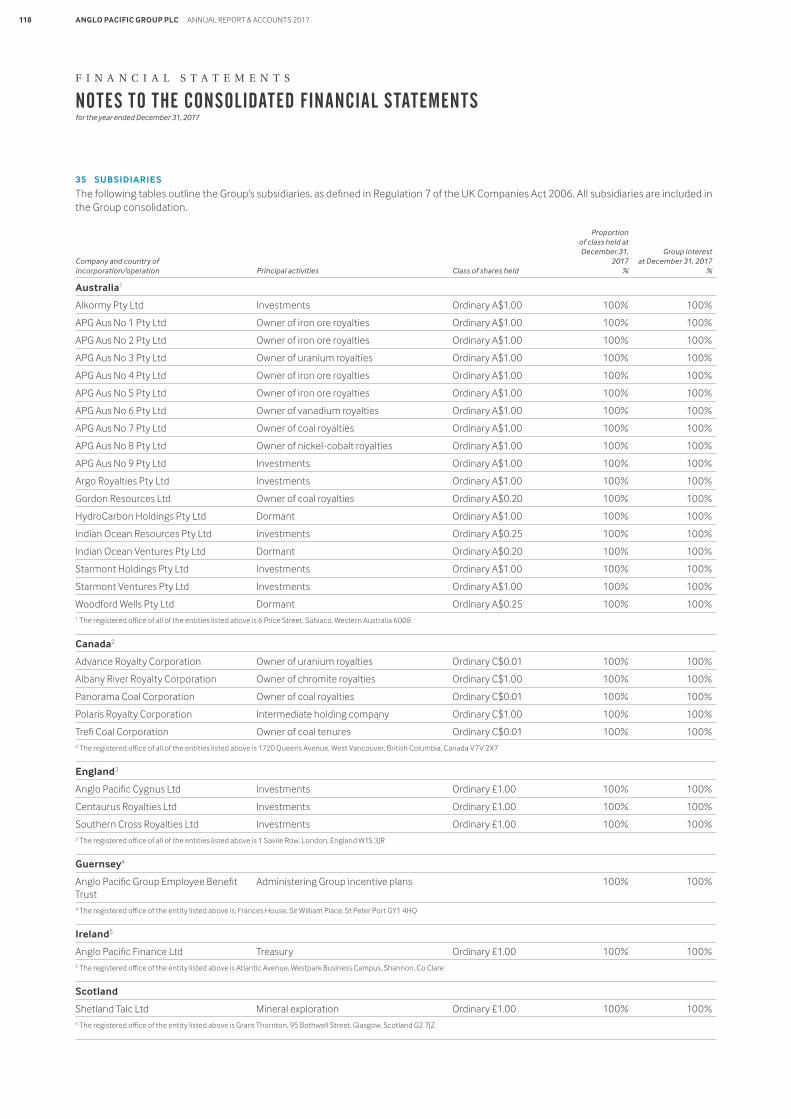
35 SUBSIDIARIES
The following tables outline the Group’s subsidiaries, as defined in Regulation 7 of the UK Companies Act 2006. All subsidiaries are included in the Group consolidation.
Company and country of incorporation/operation Principal activities Class of shares held
Proportion of class held at December 31,
2017 %
Group interest at December 31, 2017
%
Australia1
Alkormy Pty Ltd Investments Ordinary A$1.00 100% 100%
APG Aus No 1 Pty Ltd Owner of iron ore royalties Ordinary A$1.00 100% 100%
APG Aus No 2 Pty Ltd Owner of iron ore royalties Ordinary A$1.00 100% 100%
APG Aus No 3 Pty Ltd Owner of uranium royalties Ordinary A$1.00 100% 100%
APG Aus No 4 Pty Ltd Owner of iron ore royalties Ordinary A$1.00 100% 100%
APG Aus No 5 Pty Ltd Owner of iron ore royalties Ordinary A$1.00 100% 100%
APG Aus No 6 Pty Ltd Owner of vanadium royalties Ordinary A$1.00 100% 100%
APG Aus No 7 Pty Ltd Owner of coal royalties Ordinary A$1.00 100% 100%
APG Aus No 8 Pty Ltd Owner of nickel-cobalt royalties Ordinary A$1.00 100% 100%
APG Aus No 9 Pty Ltd Investments Ordinary A$1.00 100% 100%
Argo Royalties Pty Ltd Investments Ordinary A$1.00 100% 100%
Gordon Resources Ltd Owner of coal royalties Ordinary A$0.20 100% 100%
HydroCarbon Holdings Pty Ltd Dormant Ordinary A$1.00 100% 100%
Indian Ocean Resources Pty Ltd Investments Ordinary A$0.25 100% 100%
Indian Ocean Ventures Pty Ltd Dormant Ordinary A$0.20 100% 100%
Starmont Holdings Pty Ltd Investments Ordinary A$1.00 100% 100%
Starmont Ventures Pty Ltd Investments Ordinary A$1.00 100% 100%
Woodford Wells Pty Ltd Dormant Ordinary A$0.25 100% 100%1 The registered office of all of the entities listed above is 6 Price Street, Subiaco, Western Australia 6008
Canada2
Advance Royalty Corporation Owner of uranium royalties Ordinary C$0.01 100% 100%
Albany River Royalty Corporation Owner of chromite royalties Ordinary C$1.00 100% 100%
Panorama Coal Corporation Owner of coal royalties Ordinary C$0.01 100% 100%
Polaris Royalty Corporation Intermediate holding company Ordinary C$1.00 100% 100%
Trefi Coal Corporation Owner of coal tenures Ordinary C$0.01 100% 100%2 The registered office of all of the entities listed above is 1720 Queens Avenue, West Vancouver, British Columbia, Canada V7V 2X7
England3
Anglo Pacific Cygnus Ltd Investments Ordinary £1.00 100% 100%
Centaurus Royalties Ltd Investments Ordinary £1.00 100% 100%
Southern Cross Royalties Ltd Investments Ordinary £1.00 100% 100%3 The registered office of all of the entities listed above is 1 Savile Row, London, England W1S 3JR
Guernsey4
Anglo Pacific Group Employee Benefit Trust
Administering Group incentive plans 100% 100%
4 The registered office of the entity listed above is, Frances House, Sir William Place, St Peter Port GY1 4HQ
Ireland5
Anglo Pacific Finance Ltd Treasury Ordinary £1.00 100% 100%5 The registered office of the entity listed above is Atlantic Avenue, Westpark Business Campus, Shannon, Co Clare
Scotland
Shetland Talc Ltd Mineral exploration Ordinary £1.00 100% 100%6 The registered office of the entity listed above is Grant Thornton, 95 Bothwell Street, Glasgow, Scotland G2 7JZ
F I N A N C I A L S T A T E M E N T S
APG_AR17_28.03.18_BACK_ARTWORK
ANGLO PACIFIC GROUP PLC ANNUAL REPORT & ACCOUNTS 2017118
NOTES TO THE CONSOLIDATED FINANCIAL STATEMENTSfor the year ended December 31, 2017
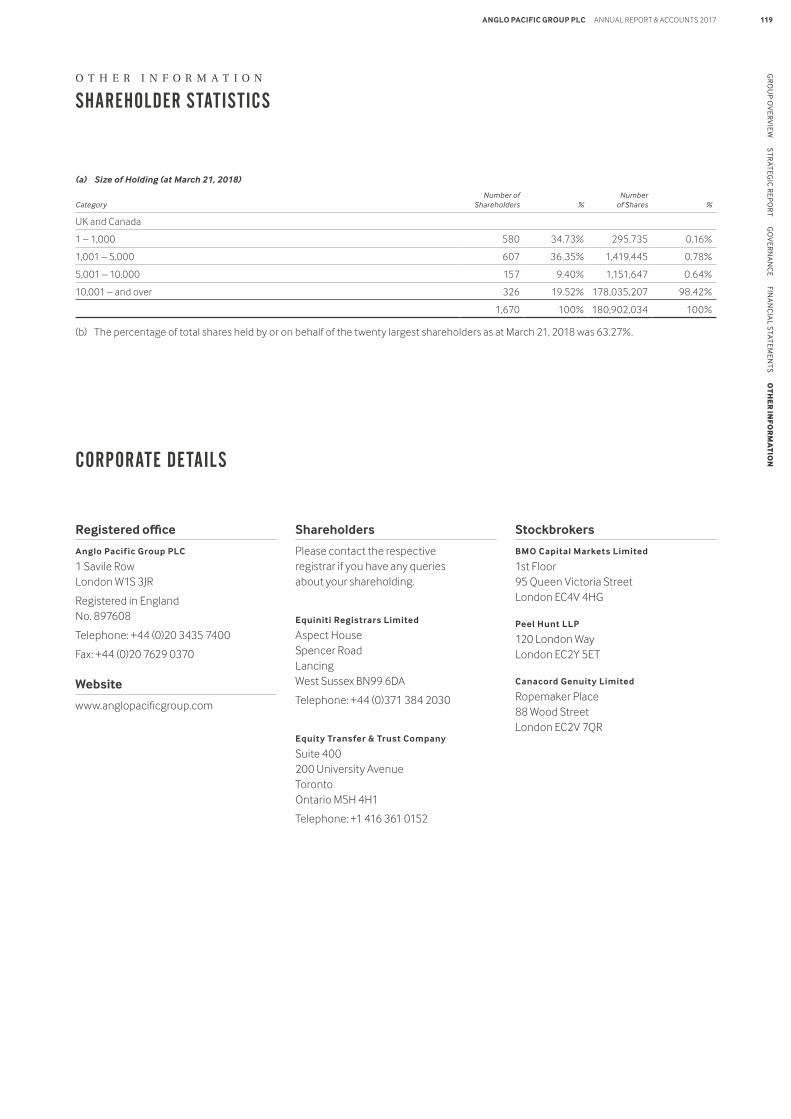
Registered office
Anglo Pacif ic Group PLC
1 Savile Row London W1S 3JR
Registered in England No. 897608
Telephone: +44 (0)20 3435 7400
Fax: +44 (0)20 7629 0370
Website
www.anglopacificgroup.com
Shareholders
Please contact the respective registrar if you have any queries about your shareholding.
Equiniti Registrars Limited
Aspect House Spencer Road Lancing West Sussex BN99 6DA
Telephone: +44 (0)371 384 2030
Equity Transfer & Trust Company
Suite 400 200 University Avenue Toronto Ontario M5H 4H1
Telephone: +1 416 361 0152
Stockbrokers
BMO Capital Markets Limited
1st Floor 95 Queen Victoria Street London EC4V 4HG
Peel Hunt LLP
120 London Way London EC2Y 5ET
Canacord Genuity Limited
Ropemaker Place 88 Wood Street London EC2V 7QR
(a) Size of Holding (at March 21, 2018)
CategoryNumber of
Shareholders %Number
of Shares %
UK and Canada
1 – 1,000 580 34.73% 295,735 0.16%
1,001 – 5,000 607 36.35% 1,419,445 0.78%
5,001 – 10,000 157 9.40% 1,151,647 0.64%
10,001 – and over 326 19.52% 178,035,207 98.42%
1,670 100% 180,902,034 100%
(b) The percentage of total shares held by or on behalf of the twenty largest shareholders as at March 21, 2018 was 63.27%.
CORPORATE DETAILS
APG_AR17_28.03.18_BACK_ARTWORK
ANGLO PACIFIC GROUP PLC ANNUAL REPORT & ACCOUNTS 2017 119G
RO
UP O
VER
VIE
W S
TRATEG
IC R
EPO
RT G
OV
ERN
AN
CE FIN
AN
CIA
L STATEM
ENTS O
TH
ER
INFO
RM
AT
ION
O T H E R I N F O R M A T I O N
SHAREHOLDER STATISTICS
Performance measuresThroughout the Strategic Report, we use a number of financial measures to assess our performance.
The measures are defined on inside front cover.
Third party informationAs a royalty holder, the Group often has limited, if any, access to non-public scientific and technical information in respect of the properties underlying its portfolio of royalties, or such information is subject to confidentiality provisions. As such, in preparing this Annual Report, the Group has relied upon the public disclosures of the owners and operators of the properties underlying its portfolio of royalties, as available at the date of this Annual Report.
References in this Annual Report to websites are made as inactive textual references and for informational purposes only. Information found at the relevant websites is not incorporated by reference into this Annual Report. The Group makes no representation as to the accuracy of any such information.
Cautionary statement on forward-looking statements and related information Certain statements in this Annual Report, other than statements of historical fact, are forward-looking statements based on certain assumptions and reflect the Group’s expectations and views of future events. Forward-looking statements (which include the phrase ‘forward-looking information’) are provided for the purposes of assisting readers in understanding the Group’s financial position and results of operations as at and for the periods ended on certain dates, and of presenting information about management’s current expectations and plans relating to the future. Readers are cautioned that such forward-looking statements may not be appropriate other than for purposes outlined in this Annual Report. These statements may include, without limitation, statements regarding the operations, business, financial condition, expected financial results, cash flow, requirement for and terms of additional financing, performance, prospects, opportunities, priorities, targets, goals, objectives, strategies, growth and outlook of the Group including the outlook for the markets and economies in which the Group operates, costs and timing of acquiring new royalties, mineral reserve and resources estimates, estimates of future production, production costs and revenue, future demand for and prices of precious and base metals and other commodities, for the current fiscal year and subsequent periods.
Forward-looking statements include statements that are predictive in nature, depend upon or refer to future events or conditions, or include words such as ‘expects’, ‘anticipates’, ‘plans’, ‘believes’, ‘estimates’, ‘seeks’, ‘intends’, ‘targets’, ‘projects’, ‘forecasts’, or negative versions thereof and other similar expressions, or future or conditional verbs such as ‘may’, ‘will’, ‘should’, ‘would’ and ‘could’. Forward-looking statements are based upon certain material factors that were applied in drawing a conclusion or
making a forecast or projection, including assumptions and analyses made by the Group in light of its experience and perception of historical trends, current conditions and expected future developments, as well as other factors that are believed to be appropriate in the circumstances. The material factors and assumptions upon which such forward-looking statements are based include: the stability of the global economy; the stability of local governments and legislative background; the relative stability of interest rates; the equity and debt markets continuing to provide access to capital; the continuing of ongoing operations of the properties underlying the Group’s portfolio of royalties by the owners or operators of such properties in a manner consistent with past practice; the accuracy of public statements and disclosures (including feasibility studies, estimates of reserve, resource, production, grades, mine life and cash cost) made by the owners or operators of such underlying properties; no material adverse change in the price of the commodities underlying the Group’s portfolio of royalties and investments; no material adverse change in foreign exchange exposure; no adverse development in respect of any significant property in which the Group holds a royalty or other interest, including but not limited to unusual or unexpected geological formations and natural disasters; successful completion of new development projects; planned expansions or additional projects being within the timelines anticipated and at anticipated production levels; and maintenance of mining title. Forward-looking statements are not guarantees of future performance and involve risks, uncertainties and assumptions, which could cause actual results to differ materially from those anticipated, estimated or intended in the forward-looking statements.
By its nature, this information is subject to inherent risks and uncertainties that may be general or specific and which give rise to the possibility that expectations, forecasts, predictions, projections or conclusions will not prove to be accurate; that assumptions may not be correct and that objectives, strategic goals and priorities will not be achieved. A variety of material factors, many of which are beyond the Group’s control, affect the operations, performance and results of the Group, its businesses and investments, and could cause actual results to differ materially from those suggested by any forward-looking information. Such risks and uncertainties include, but are not limited to current global financial conditions, royalty portfolio and associated risk, adverse development risk, financial viability and operational effectiveness of owners and operators of the relevant properties underlying the Group’s portfolio of royalties, royalties subject to other rights, and contractual terms not being honoured, together with those risks identified in the ‘Principal Risks and Uncertainties’ section herein. If any such risks actually occur, they could materially adversely affect the Group’s business, financial condition or results of operations. Readers are cautioned that the list of factors noted in the section herein entitled ‘Risk’ is not exhaustive of the factors that may affect the Group’s forward-looking
statements. Readers are also cautioned to consider these and other factors, uncertainties and potential events carefully and not to put undue reliance on forward-looking statements.
This Annual Report also contains forward-looking information contained and derived from publicly available information regarding properties and mining operations owned by third parties. The Group’s management relies upon this forward-looking information in its estimates, projections, plans and analysis. Although the forward-looking statements contained in this Annual Report are based upon what the Group believes are reasonable assumptions, there can be no assurance that actual results will be consistent with these forward-looking statements. The forward-looking statements made in this Annual Report relate only to events or information as of the date on which the statements are made and, except as specifically required by applicable laws, listing rules and other regulations, the Group undertakes no obligation to update or revise publicly any forward-looking statements, whether as a result of new information, future events or otherwise, after the date on which the statements are made or to reflect the occurrence of unanticipated events.
US Employment Retirement Income Security ActFiduciaries of (i) US employee benefit plans that are subject to Title I of the US Employment Retirement Income Security Act of 1974 (ERISA), (ii) individual retirement accounts, Keogh and other plans that are subject to Section 4975 of the US Internal Revenue Code of 1986, as amended (the Internal Revenue Code), and (iii) entities whose underlying assets are deemed to be ERISA ‘plan assets’ by reason of investments made in such entities by such employee benefit plans, individual retirement accounts, Keogh and other plans (collectively referred to as Benefit Plan Investors) should consider whether holding the Company’s ordinary shares will constitute a violation of their fiduciary obligations under ERISA or a prohibited transaction under ERISA or the Internal Revenue Code. Shareholders should be aware that the assets of the Company may be or become treated as ‘plan assets’ that are subject to ERISA fiduciary requirements and/or the prohibited transaction rules of ERISA and the Internal Revenue Code. The Company’s ordinary shares are subject to transfer restrictions and provisions that are intended to mitigate the risk of, among other things, the assets of the Company being deemed to be ‘plan assets’ under ERISA. Shareholders who believe these provisions may be applicable to them should review these restrictions which are set forth in the Company’s Articles of Association and should consult their own counsel regarding the potential implications of ERISA, the prohibited transaction provisions of the Internal Revenue Code or any similar law in the context of an investment in the Company and the investment of the Company’s assets.
APG_AR17_28.03.18_BACK_ARTWORK
ANGLO PACIFIC GROUP PLC ANNUAL REPORT & ACCOUNTS 2017120
O T H E R I N F O R M A T I O N
FORWARD-LOOKING STATEMENTS

APG_AR17_28.03.18_COVER_ARTWORK APG_AR17_28.03.18_COVER_ARTWORK
Printed in the UK by CPI Colour on Amadeus Primo Silk FSC® certified paper.Amadeus Primo Silk is certified FSC®, is made using ECF pulp, and manufactured according to ISO 9001 and ISO 14001.
Designed and produced by Boonewww.boone-studio.com
C O N T E N T S
01 GROUP OVERVIEW02 AngloPacificataglance03 Miningroyaltiesexplained04 Ourportfolio06 Chairman’sstatement
08 STR ATEGIC REPORT08 ChiefExecutiveOfficer’sstatement10 Marketoverview12 Ourbusinessmodel14 Ourstrategy16 Newroyaltyacquisition18 Principalrisksanduncertainties24 Keyperformanceindicators25 Businessreview37 Financialreview42 Corporatesocialresponsibility
44 GOVERNANCE44 Corporategovernancereport45 TheBoard48 NominationCommittee49 AuditCommittee52 RemunerationCommittee53 Directors’remunerationreport66 Directors’report68 StatementofDirectors’responsibilities
69 FINANCIAL STATEMENTS69 Independentauditor’sreport75 Consolidatedincomestatement76 Consolidatedstatementofcomprehensiveincome77 ConsolidatedandCompanybalancesheets78 Consolidatedstatementofchangesinequity79 Companystatementofchangesinequity80 Consolidatedstatementofcashflows
andCompanystatementofcashflows81 Notestotheconsolidatedfinancialstatements
119 OTHER INFORMATION119 Shareholderstatistics119 Corporatedetails120 Forward-lookingstatements
Throughout this report a number of financial measures are used to assess the Group’s performance. The measures are defined as follows:
Operating profit/(loss)Operatingprofit/(loss)representstheGroup’sunderlyingoperatingperformancefromitsroyaltyinterests.Operatingprofit/(loss)isroyaltyincome,lessamortisationofroyaltiesandoperatingexpenses,andexcludesimpairments,revaluations andgain/(loss)ondisposals.Operatingprofit/(loss)reconciles to‘operatingprofit/(loss)beforeimpairments,revaluations andgain/(losses)ondisposals’ontheincomestatement.
Adjusted earnings per shareAdjustedearningsrepresentstheGroup’sunderlyingoperatingperformancefromcoreactivities.Adjustedearningsistheprofit/(loss)attributabletoequityholderslessallvaluationmovements,andnon-cashimpairments,amortisationcharges,sharebasedpayments,financecosts,anyassociateddeferredtaxandanyprofitorlossonnon-coreassetdisposals.Adjustedearningsdividedbytheweightedaveragenumberofsharesinissuegivesadjustedearningspershare.Referto note 11to thefinancialstatementsforadjustedearnings/(loss)pershare.
Dividend coverDividendcoveriscalculatedasthenumberoftimesadjustedearningspershareexceedsthedividendpershare.Referto note 12 tothefinancialstatementsfordividendcover.
Free cash flow per shareFreecashflowpershareiscalculatedbydividingnetcashgeneratedfromoperatingactivities,plusproceedsfromthedisposalofnon-coreassetsandanycashconsideredasrepaymentofprincipal,lessfinancecosts,bytheweightedaveragenumberofsharesinissue.Refertonote 33 tothefinancialstatementsforfreecashflowpershare.
P E R F O R M A N C E M E A S U R E S
F OR MOR E I N F O V I S I T www.anglopacificgroup.com
APG17 | 27.03.18 | COVER – PROOF 5 APG17 | 27.03.18 | COVER – PROOF 5
THE GLOBAL NATURAL RESOURCES ROYALTY COMPANY
2017
AN
NU
AL
RE
PO
RT
& A
CC
OU
NT
S A
ng
lo P
acific G
rou
p P
LC
THE GLOBAL NATURAL RESOURCES ROYALTY COMPANY2 0 1 7 A N N U A L R E P O R T & A C C O U N T S
Anglo Pacific Group PLC
A N G L O P A C I F I C G R O U P P L C
1 Savile Row, London W1S 3JR United Kingdom
T +44 (0)20 3435 7400 F +44 (0)20 7629 0370
www.anglopacificgroup.com