Embed Size (px)
Citation preview

Increasing the Flow Capacity of Signalized Intersections with Pre-signals:Theory and Case Study
by
Yiguang Xuan
A dissertation submitted in partial satisfaction of therequirements for the degree of
Doctor of Philosophy
in
Engineering – Civil and Environmental Engineering
in the
GRADUATE DIVISION
of the
UNIVERSITY OF CALIFORNIA, BERKELEY
Committee in charge:
Professor Carlos F. Daganzo, Co-chairProfessor Michael J. Cassidy, Co-chair
Professor Robert B. Cervero
Fall 2011

Increasing the Flow Capacity of Signalized Intersections with Pre-signals: Theory and Case
Study
Copyright c© 2011
by
Yiguang Xuan

Abstract
Increasing the Flow Capacity of Signalized Intersections with Pre-signals: Theory and Case
Study
by
Yiguang Xuan
Doctor of Philosophy in Engineering – Civil and Environmental Engineering
University of California, Berkeley
Professor Carlos F. Daganzo, Co-chair
Professor Michael J. Cassidy, Co-chair
The dissertation proposes a new “tandem design” to reorganize traffic and increase the flowcapacity of signalized intersections. In the tandem design, a mid-block pre-signal is used tosort left-turning vehicles (LVs) and through-moving vehicles (TVs) in tandem, rather thanleaving them side by side, as in the conventional design. For intersections with separatethrough and left-turn phases, the tandem design outperforms the conventional one becausemore lanes can be used to discharge traffic during at least one of the intersection signalphases. We find that the tandem design can increase the intersection capacity by 10% to20% in its simplest form. We also study the length requirement of blocks to fully realize thecapacity benefit, and modifications of the tandem design to reduce this length requirement.We then conduct a case study at a signalized intersection in the city of Chengdu, China.The case study shows that the tandem design can effectively increase intersection capacity.Moreover, the case study shows that together with enforcement of the bus-lane restriction,both cars and buses can benefit.
Finally, we demonstrate how the idea of tandem sorting with pre-signals can be extended toincrease intersection capacity of multimodal traffic, using as an example the case of cars andbuses. This extension hinges on an assumption that the discharge times of different modesof transport is additive, and this assumption is confirmed with a natural experiment.
1

To Yan Yan,
more than words can describe.
i

Contents
Contents ii
List of Figures iv
List of Tables vi
Acknowledgments vii
1 Introduction 1
2 Literature Review 3
2.1 Intersection Capacity . . . . . . . . . . . . . . . . . . . . . . . . . . . . . . . 3
2.2 Pre-signal . . . . . . . . . . . . . . . . . . . . . . . . . . . . . . . . . . . . . 4
3 Concept 6
4 Analysis 9
4.1 Assumptions and Notations . . . . . . . . . . . . . . . . . . . . . . . . . . . 9
4.2 Capacity Analysis . . . . . . . . . . . . . . . . . . . . . . . . . . . . . . . . . 10
4.2.1 Deterministic capacity analysis . . . . . . . . . . . . . . . . . . . . . 10
4.2.2 Stochastic capacity analysis . . . . . . . . . . . . . . . . . . . . . . . 14
4.3 Spatial Analysis . . . . . . . . . . . . . . . . . . . . . . . . . . . . . . . . . . 20
4.3.1 Minimal length requirement . . . . . . . . . . . . . . . . . . . . . . . 20
4.3.2 Capacity with short blocks . . . . . . . . . . . . . . . . . . . . . . . . 21
4.3.3 Modified design: phase swap . . . . . . . . . . . . . . . . . . . . . . . 21
4.4 Discussion of Delay . . . . . . . . . . . . . . . . . . . . . . . . . . . . . . . . 26
ii

5 Operational Issues 27
5.1 Switching the Pre-signal On and Off . . . . . . . . . . . . . . . . . . . . . . 27
5.2 Compliance and Enforcement . . . . . . . . . . . . . . . . . . . . . . . . . . 28
5.3 Shared Lane at the Pre-signal . . . . . . . . . . . . . . . . . . . . . . . . . . 29
6 Case Study 31
6.1 Status Quo and Its Problems . . . . . . . . . . . . . . . . . . . . . . . . . . 31
6.2 Proposed Solution . . . . . . . . . . . . . . . . . . . . . . . . . . . . . . . . . 32
6.3 Estimated Benefit . . . . . . . . . . . . . . . . . . . . . . . . . . . . . . . . . 34
7 Serving Multimodal Traffic 39
7.1 Theory . . . . . . . . . . . . . . . . . . . . . . . . . . . . . . . . . . . . . . . 39
7.2 A Proposed Design . . . . . . . . . . . . . . . . . . . . . . . . . . . . . . . . 42
7.3 Natural Experiment . . . . . . . . . . . . . . . . . . . . . . . . . . . . . . . . 44
8 Conclusion and Future Work 49
8.1 Conclusion . . . . . . . . . . . . . . . . . . . . . . . . . . . . . . . . . . . . . 49
8.2 Future Work . . . . . . . . . . . . . . . . . . . . . . . . . . . . . . . . . . . . 50
Bibliography 51
iii

List of Figures
2.1 Unconventional intersection designs. . . . . . . . . . . . . . . . . . . . . . . . 4
2.2 Continuous flow intersection design. . . . . . . . . . . . . . . . . . . . . . . . 5
3.1 Typical geometric layout of a conventional intersection approach. . . . . . . 6
3.2 Geometric layout of an intersection approach with tandem sorting. . . . . . . 7
4.1 Typical geometric layouts of intersection approaches. . . . . . . . . . . . . . 12
4.2 Capacity increase with deterministic saturation headways, for the typical lay-outs in Figure 4.1. . . . . . . . . . . . . . . . . . . . . . . . . . . . . . . . . 13
4.3 Capacity loss due to stochastic saturation headways. . . . . . . . . . . . . . 17
4.4 Capacity increase with stochastic saturation headways, for the typical layoutsin Figure 4.1 and C/H = 48. . . . . . . . . . . . . . . . . . . . . . . . . . . . 18
4.5 Capacity increase with stochastic saturation headways and more than onetandem lane, for the typical layouts in Figure 4.1 and C/H = 48. . . . . . . 19
4.6 Evolution of traffic states in time and space for a tandem design with n =N = 2 under saturated demand. . . . . . . . . . . . . . . . . . . . . . . . . . 22
4.7 Time-space diagram of TVs (in dark color, with that of LVs in light graycolor) for a tandem design with n = N = 2 and limited block length. . . . . 23
4.8 Phase sequence of the intersection signal before and after the swap. . . . . . 24
4.9 Time-space diagram of LVs and TVs with n = N = 2 and a phase swap atthe intersection signal. . . . . . . . . . . . . . . . . . . . . . . . . . . . . . . 25
5.1 Shared lane at the pre-signal. . . . . . . . . . . . . . . . . . . . . . . . . . . 29
6.1 Current geometry of the approach of our case study. . . . . . . . . . . . . . . 32
6.2 Proposed geometry of the approach of our case study. . . . . . . . . . . . . . 33
6.3 Signal timing of the intersection signal. . . . . . . . . . . . . . . . . . . . . . 34
iv

6.4 A video snapshot of the site. . . . . . . . . . . . . . . . . . . . . . . . . . . . 35
6.5 A snapshot of the CORSIM simulation. . . . . . . . . . . . . . . . . . . . . . 36
7.1 Different sorting strategies (including do-nothing). . . . . . . . . . . . . . . . 40
7.2 Capacity constraints for different sorting strategies when G ≤ 1/2. . . . . . . 41
7.3 Modified tandem strategies. . . . . . . . . . . . . . . . . . . . . . . . . . . . 42
7.4 Geometry of the approach of our case study, status quo and proposal. . . . . 43
7.5 Comparison of the natural experiment result versus theoretical capacity con-straints. . . . . . . . . . . . . . . . . . . . . . . . . . . . . . . . . . . . . . . 46
v

List of Tables
6.1 Comparison among the status quo, bus lane enforcement alone, and bus laneenforcement as well as tandem sorting . . . . . . . . . . . . . . . . . . . . . 37
7.1 Field observations . . . . . . . . . . . . . . . . . . . . . . . . . . . . . . . . . 45
7.2 Comparison of capacity among the status quo, bus lane enforcement alone,bus lane enforcement as well as tandem sorting, and tandem sorting of bothcars and buses . . . . . . . . . . . . . . . . . . . . . . . . . . . . . . . . . . . 47
vi

Acknowledgments
I have a wonderful experience during the four plus years at Berkeley, and there are manypeople that I am really thankful to for this to be possible.
I want to thank my wife Yan Yan, for everything you have done.
I want to thank my parents for taking care of me with your best effort, and for your constantemotional support from the other side of the ocean.
I am grateful to my co-advisors, Professors Carlos Daganzo and Michael Cassidy, for yoursincere care of me. I learned a lot from you not only on how to think about problems andcarry out research, but also how to be a person and a scholar.
I want to thank Dr. Yuwei Li specially for your help on trying to pull off the field experimentin Chengdu, and for all the difficulties we went through together.
I would also like to acknowledge the faculty of the Institute of Transportation Studies forthe guidance during my research. I benefited immensely from the diversity and depth of thework that is going on here at Berkeley.
Last but not least, I want to thank my colleagues and friends. You have been my constantlearning sources, and I really cherish the time spent with you.
This work is jointly supported by the Volvo Center for Future Urban Transport at theUniversity of California, Berkeley, the University of California Transportation Center, andthe National Science Foundation.
vii

viii

Chapter 1
Introduction
This dissertation focuses on the problem of increasing the flow capacity (i.e., the maximalvehicle flow that can be sustained) of signalized intersections, and discusses how to do thiswith a mid-block pre-signal to more efficiently use the given road space.
Increasing the capacity of the current infrastructure is an important problem. This isbecause travel demand has grown at a faster rate than what the current infrastructure canprovide, resulting in increasing congestion. For example, it is reported that in 87 out of101 metropolitan areas in the US the demand grew 10% faster than capacity between theyears 1982 and 2009, and that the total cost of congestion has been on the rise: from $24billion in 1982, to $85 billion in 2000, and to $115 billion in 2009 (all in 2009 dollars) (TexasTransportation Institute, 2010). The congestion delay that occurs on streets (as opposed toon freeways) accounts for about 40% of the total. The problem is even worse in numerousdeveloping countries, which face rapid population growth, motorization, and increasing con-gestion. For example, urban traffic congestion frequently occupies the headlines in Chinaand how to get rid of it has become a national topic that is heatedly discussed. Increasingthe capacity of current infrastructure is also important because building new infrastruc-ture is expensive, and minor modifications that may increase the capacity of the currentinfrastructure are likely to be the most cost effective.
In the dissertation, we seek the maximal capacity that can be achieved by a signalizedintersection, and how to achieve this with a mid-block pre-signal. The pre-signal is a setof signal heads that are installed upstream of the intersection. With vehicles of differentmodes (e.g., car or bus) or different movements (left-turning or through-moving) segregatedinto different lanes, the pre-signal alternates giving green time to vehicles in different lanes,sorting them into select patterns that help increase the flow capacity of intersections. Thefocus of this dissertation is on the scale of a single signalized intersection. This is becausean individual intersection is the basic building block of a street network, and we need tounderstand the building blocks before we can have a good understanding of the system.
1

Study on the network-wide level will be left for future work. Further, the dissertation dealswith the maximal flow through a signalized intersection under oversaturated conditions, i.e.,when demand exceeds capacity and any increase in capacity would greatly reduce delay.
Admittedly, capacity-increasing strategies need to be applied cautiously in a real trans-portation system. Simply increasing the capacity of an intersection may make things worse,due to Braess’ Paradox (Braess, 1968; Braess et al. , 2005), or due to induced demand (Hansen& Huang, 1997; Litman, 2001). This dissertation only focuses on how to increase capacity,rather than on when and where to apply these strategies.
The rest of the dissertation is organized as follows. Chapter 2 presents an overviewof the existing strategies to increase intersection capacity, and of mid-block pre-signals.Chapter 3 describes a proposed “tandem sorting” concept, achieved with a mid-block pre-signal. Chapter 4 analyzes the capacity increase and spatial requirement of the proposedtandem design. Chapter 5 discusses operational issues, including the operation of the pre-signal and the compliance of drivers. Chapter 6 presents a case study from a signalizedintersection in the city of Chengdu, China, which demonstrates how the idea of tandemsorting with pre-signals can benefit both cars and buses. Chapter 7 demonstrates how thetandem sorting concept can be extended to multimodal traffic, and uses empirical evidenceto validate an important assumption in the formulation of capacity. Chapter 8 provides aconclusion and directions for future work.
2

Chapter 2
Literature Review
2.1 Intersection Capacity
It is well understood that intersection capacity can be greatly restricted by the intro-duction of an extra signal phase1 to serve left turns. To see why, imagine an intersectionthat prohibits left turns. Only two signal phases are needed to serve all traffic at this in-tersection: one phase for each of the two opposing directions. The entire width of eachapproach can be used during its green phase, so the discharge rate is as high as it can pos-sibly be. However, separate protected left-turn phases are needed if there is a significantproportion of left-turning traffic (Newell, 1989). Note that each intersection approach nowhas its own through phase and left-turn phase, and lane markings segregate left-turning andthrough-moving vehicles on different lanes. As a result, only part of the approach width isused during each phase. The introduction of protected left-turn phases therefore means thatintersection capacity is wasted.
The problem with left turns has been addressed by generic optimization methods devisedto determine the duration of the signal phases (Webster, 1958; Allsop, 1972), which werelater generalized to include the grouping of streams into phases (Improta & Cantarella, 1984;Gallivan & Heydecker, 1988; Silcock, 1997), and more recently to determine the number oflanes that should be made available to the streams (Wong & Wong, 2003). But still, onlypart of the approach width can be used during either the left-turn phase or the throughphase. So, there is a limit to what signal timing optimization can do for capacity.
In reality, more capacity can be achieved by banning left turns, or rerouting traffic to elim-inate them from the intersection vicinity. The jughandle intersections (in Figure 2.1(a)), the
1A signal phase is defined by the Manual on Uniform Traffic Control Devices (Federal Highway Adminis-tration, 2009) to be the right-of-way, yellow change, and red clearance intervals in a cycle that are assignedto an independent traffic movement or combination of traffic movements.
3

median U-turn intersections (in Figure 2.1(b)), and the super-street design (in Figure 2.1(c))are just some examples of the rerouting designs that have been used for this purpose (Univer-sity of Maryland ATTAP, 2006; Rodegerdts et al. , 2004). The rerouting strategies eliminatethe need for extra signal phases by rerouting either the left turns or the side street traffic.The strategies can be beneficial if the traffic to be rerouted has low demand. However,for a major-major intersection with heavy left turns, the strategies would not be practica-ble. Another disadvantage is that most rerouting designs involve construction and requiresubstantial space, which may not be available in an urban area.
(a) (b)
(c)
Figure 2.1. Unconventional intersection designs. (a) Jughandle intersection. (b) MedianU-turn intersection. (c) Super-street.
2.2 Pre-signal
Mid-block pre-signals have been widely used to promote priority for buses (Oakes et al. ,1994; Wu & Hounsell, 1998; Sirivadidurage et al. , 2007) by generating gaps in car traffic andenabling these modes to bypass car queues at intersections. They have also been proposed inthe case of bicycles (Kuijper, 1982; Heys & Vrefeveld, 1983; Salomons, 1985; Wheeler et al. ,1993; Wheeler, 1995), though the bicycle demand is usually too low to justify this (Wheeler,1995).
Pre-signals have also been used in an unconventional geometric design, called a continuous
4

flow intersection (CFI, as shown in Figure 2.2), to resolve the conflicts between the left-turning and opposing through-moving traffic at intersections (Al-Salman & Salter, 1974;Goldblatt et al. , 1994). With pre-signals, the left-turning traffic swaps position laterallywith its opposing through-moving traffic. As a result, there is no conflict between anytwo streams on the two opposing approaches, and only one signal phase is needed to servethem. However, CFI has several setbacks: (a) to convert a conventional intersection into aCFI, permanent re-striping (which cannot change with the time of day) is needed; (b) whendeployed on a four-way intersection, CFI has to involve at least two (opposing) approaches;(c) bus stops cannot be located on the far side of a CFI; (d) pedestrians must be negativelyaffected for CFI to achieve its full benefit; (e) numerous pavement markings are needed tochannel traffic, which can be confusing to drivers.
Figure 2.2. Continuous flow intersection design.
The above shows that no good solutions currently exist to increase the capacity of amajor-major intersection with heavy left turn traffic and constrained road space. The pos-sible solutions are to use CFI, whose setbacks have been discussed, or to convert the inter-section into a grade-separated intersection, which requires space, and expensive, irreversibleconstruction. However, there is an inexpensive space-efficient way to increase intersectioncapacity, which will be presented next.
5

Chapter 3
Concept
It is assumed that the intersections to be improved serve left-turning vehicles (LVs)and through-moving vehicles (TVs) with separate phases. The problem with this type ofintersection is that during either the through phase or the left-turn phase, only some ofthe lanes on an approach can discharge. For example, the conventional layout as shown inFigure 3.1 has three lanes in total. However, only part of the approach width can be usedto discharge traffic during the green time: only one lane for LVs during the left-turn phase,and only two lanes for TVs during the through phase. This is why the conventional designis inefficient.
Figure 3.1. Typical geometric layout of a conventional intersection approach. Note that theLV queue (gray rectangle) and the TV queue (white rectangle) are typically segregated sideby side. The rectangles represent the physical location of the queues.
Greater capacity could be achieved if all three lanes could discharge during both phases.This potential capacity increase can be realized with the help of a pre-signal (as illustratedin Figure 3.2(a)). The operation of a pre-signal design is described next, focusing on onlyone intersection approach and assuming that the same can be done to other approaches.
Refer to Figure 3.2(a). To fully use all lanes, vehicles are first presorted by movement (i.e.,
6

(a)
(b)
(c)
Figure 3.2. Geometric layout of an intersection approach with tandem sorting. (a) Fulltandem with 3 tandem lanes. (b) Partial tandem with 2 tandem lanes. (c) Partial tandemwith left turn pocket and 1 tandem lane. The LV queue (gray rectangle) and the TV queue(white rectangle) are segregated in tandem over some or all lanes. The rectangles representthe physical location of the queues.
7

left-turning or through-moving1) immediately upstream of the pre-signal. Vehicles presortthemselves at the pre-signal stop line just as they do when they approach conventionalintersection stop lines. Roadside signs are needed upstream of the pre-signal to providewarning and give drivers enough time to maneuver to their designated lane. The pre-signalthen alternates the allocation of green times to LVs and TVs. The vehicles, after passingthrough the pre-signal, follow a different lane designation on the section of road between thepre-signal and the intersection signal. This section of road is termed the “sorting area”. Inthe example illustrated in Figure 3.2(a), LVs receive green time at the pre-signal and enterthe sorting area first, followed by TVs. After they pass the pre-signal, both vehicle typesuse all lanes to queue up. The two queues are segregated in tandem, giving rise to the name“tandem sorting”. This tandem design is different from the conventional design, where theLV queue and the TV queue are segregated side by side. Note that with the tandem design,LVs and TVs discharge into the intersection during their designated signal phases using alllanes on the approach.
It should be obvious that the benefit of the tandem design comes from the fact thatmore lanes are used to discharge traffic during both phases, which is not possible in theconventional design. Note that a lane with LVs and TVs sorted in tandem is different froma conventional shared lane with LVs and TVs in random order. To distinguish the twosituations, the former will be called a “tandem lane”, and latter will be called a “sharedlane”. In Figure 3.2(a), LVs and TVs are sorted in tandem over all three lanes. Therefore,there are three tandem lanes, and this kind of tandem sorting with all lanes as tandem lanesis termed “full tandem”. If vehicles behave deterministically, it can be shown that sortingvehicles in a full tandem fashion can achieve the same capacity as if there are no left turns.It can also be shown that the resulting capacity is the maximal rate that can be achievedwith an at-grade intersection.
In reality, however, a full tandem design may not always be feasible. The number oftandem lanes will depend on the intersection geometry. For example, if there are only twolanes downstream for LVs, then a partial tandem design with two tandem lanes as shown inFigure 3.2(b) should be considered. Or, if there are only two lanes downstream for both LVsand TVs, a partial tandem design with one tandem lane as shown in Figure 3.2(c) shouldbe considered. The figure shows that the tandem concept can be quite flexible and tailoredfor specific sites. Since the full tandem design is just a special case of the partial tandem(with the number of tandem lanes equal the total number of lanes of the approach), the word“partial” shall be dropped. The number of tandem lanes is treated as a parameter, and isdetermined by various factors like the existing geometry and the target capacity.
1Right-turning vehicles are combined with through-moving vehicles for the rest of the study, as theycan generally discharge together. Thus, TVs refer to the combination of through-moving and right-turningvehicles.
8

Chapter 4
Analysis
The proposed tandem design is analyzed in detail in this chapter. The questions to beaddressed include how much capacity can be increased under the proposed concept (Sec-tion 4.2), and how much space is needed to achieve this gain (Section 4.3).
4.1 Assumptions and Notations
We focus on only one approach of a four-way signalized intersection. For demonstrationpurposes, the intersection signal is assumed to be pre-timed. The end of Section 4.2.1discusses the relaxation of this assumption. It is also assumed that the intersection signalhas two separate green phases for the approach: a protected left-turn phase and a throughphase. The order of the green phases does not matter, so the left-turn phase can be eitherleading or lagging. The assumption that the approach only has two green phases will berelaxed in Chapter 6. Additional assumptions as stated before are that LVs and TVs arepresorted by movement at the pre-signal and that there is no shared lane for LVs and TVsat the pre-signal. Section 5.3 discusses the relaxation of this last assumption.
A special unit system is adopted for this study to simplify notation. In this unit system,one unit of time equals the cycle length of the intersection signal, and one unit of vehicleflow equals the saturation flow per lane. In a conventional unit system, flow is representedby the product of the saturation flow per lane, the green duration, and the number of lanes.Therefore, in the dimensionless unit system, dimensionless flow can be represented by theproduct of dimensionless green time (or green ratio, the ratio of the green time and the cyclelength) and the number of lanes available to discharging vehicles. Now that all the variablesin this study are dimensionless, the word “dimensionless” will be omitted unless a distinctionneeds to be made between the conventional unit system and this new unit system.
9

The following notation is defined for the analysis of the flow capacity. Letters g, n, and qare used to denote duration of green time, number of lanes, and flow capacity, respectively.Lower case letters g, n are for those variables at the pre-signal, and capitalized letters G,N are for those at the intersection signal. The subscripts “L” and “T” denotes left-turningor through-moving; no subscript indicates the “total” of both movements combined. Thesuperscript “0” denotes the status quo or a conventional design; no superscript indicates thetandem design.
4.2 Capacity Analysis
The flow capacity related to a tandem design is discussed here. Although delay is moreintuitive to drivers (and will be briefly discussed in Section 4.4), capacity is the critical metricunder oversaturated conditions. In Section 4.2.1, it is assumed that drivers follow the trafficrules and behave deterministically, i.e., the saturation headway between vehicles is assumedconstant. Determinism simplifies formulation but provides an optimistic assessment of thetandem design. This assumption is then relaxed in Section 4.2.2 and the saturation headwaybetween vehicles is allowed to vary.
The benchmark for comparison in both the deterministic and stochastic analyses is thecapacity of a conventional pre-timed design, with two green phases (left-turn and through)for the approach, and with traffic served in side-by-side manner. Although in reality, vehicle-actuated signal control is often used instead of pre-timed control, the former can only re-duce delay on undersaturated approaches (Greenough & Kelman, 1999; Peck et al. , 1999;Sussman, 2000) by dynamically assigning green time to accommodate cyclic fluctuations.Vehicle-actuated signals can do little to increase the capacity of an approach (Newell, 1989;Lo & Chow, 2004). So, using a pre-timed design for a benchmark is justified.
4.2.1 Deterministic capacity analysis
In this section, capacity formulae are derived for both the conventional design and thetandem design, assuming that the saturation headway is a constant. The following parame-ters are given: the total green time available to the approach (G), the total number of lanes(n at the pre-signal and N at the intersection signal), and the left-turn ratio (l). The decisionvariables are the signal timing (G0
L, G0T at the intersection signal for the conventional design;
gL, gT at the pre-signal and GL, GT at the intersection signal for the tandem design) andlane designations (N0
L, N0T at the intersection signal for the conventional design; nL, nT at
the pre-signal and NL, NT at the intersection signal for the tandem design).
The capacity for the status quo, where LVs and TVs are segregated side by side, can
10

be formulated as the following mathematical programming (MP), and will be called theconventional MP (CMP)
(CMP ) maxG0
L,G0T ,N0
L,N0T
q0 (4.1a)
q0L = q0l, q0T = q0(1− l), (4.1b)
q0L = G0LN
0L, q
0T = G0
TN0T , (4.1c)
G0L +G0
T ≤ G, (4.1d)
N0L +N0
T ≤ N, (4.1e)
G0L, G
0T , N
0L, N
0T ≥ 0;N0
L, N0T are integers. (4.1f)
Equation 4.1a indicates that the goal of optimization is to maximize capacity; Equa-tion 4.1b splits the total capacity for LVs and TVs according to the left-turn ratio, which isdefined as the ratio of vehicles that turns left; Equation 4.1c defines the achieved flow in ourdimensionless unit system; Equations 4.1d and 4.1e define bounds on the decision variables(total green ratio G and total number of lanes N at the intersection signal); Equation 4.1fstates the non-negativity and integer constraints.
If the vehicles are sorted in tandem over NTL lanes, the capacity formulation shall becalled the tandem MP (TMP), which is as follows:
(TMP ) maxGL,GT ,gL,gT ,NL,NT ,nL,nT
q (4.2a)
qL = ql, qT = q(1− l), (4.2b)
qL = GLNL = gLnL, qT = GTNT = gTnT , (4.2c)
GL +GT ≤ G, gL + gT ≤ 1, (4.2d)
NL +NT ≤ N +NTL, nL + nT ≤ n, (4.2e)
GL, GT , gL, gT ≥ 0; 0 ≤ NL, NT ≤ N, 0 ≤ nL, nT ≤ n;NL, NT , nL, nT are integers. (4.2f)
The role of the above equations is similar to those in CMP, except that Equation 4.2cstipulates flow conservation at the pre-signal and the intersection signal; and Equations 4.2dand 4.2e have extra constraints due to the introduction of the pre-signal.
It may look like the capacity of the TMP is lower than that of the CMP due to theextra constraints. However, there are two reasons why this is not the case. The first reasonis that the extra constraints due to the pre-signal in Equations 4.2d and 4.2e are generallynot binding when G is around 0.5. The physical explanation for this is that the intersectionsignal only has about half the cycle to discharge traffic, while the pre-signal has the wholecycle to discharge the same amount of traffic, and thus is generally not the active bottleneck.The second reason is that a binding constraint, Equation 4.1e, of the CMP is relaxed in theTMP, via Equation 4.2e. The bound, N , on the sum of NL and NT in Equation 4.1e isincreased to N + NTL in Equation 4.2e. This allows the capacity to be greatly increased.
11

The physical explanation is that due to the pre-signal and tandem sorting, the number oflanes actively discharging the two streams (NL and/or NT ) increases. This is the directreason for the capacity increase.
The two MPs we have just defined are nonlinear integer programs. Fortunately,they are not hard to solve. If the integer decision variables regarding lane designations(N0
L, N0T , nL, nT , NL, NT ) are taken as given, the MPs turn out to be linear programs (LPs),
which can actually be solved analytically. Furthermore, typical values of n and N generallyonly allow for a few possible lane designations. The solutions to the MPs thus can be obtainedby enumerating and evaluating the analytic solutions of all possible lane configurations.
To identify the domain of application, the CMP and the TMP are solved for a fewtypical geometric layouts shown in Figure 4.1. This collection of approach geometries is notexhaustive, but includes the most common geometric layouts. Figure 4.2 shows the capacityincrease for these geometric layouts. The shading indicates the ratio of the capacity of thetandem design over the capacity of the conventional design.
(a) (b)
(c) (d)
Figure 4.1. Typical geometric layouts of intersection approaches. (a) n = N = 2. (b)n = 2, N = 3. (c) n = N = 3. (d) n = 3, N = 4.
The figure shows that the tandem design can increase intersection capacity for all possiblevalues of the green ratio and the left-turn ratio, if the intersection approach does not have aleft-turn bay (n = N). For the rest of the cases, capacity can still be increased significantly,by about 20% to 30% for the most common values of green ratio (G ≈ 0.5). Note that inall cases only one tandem lane is used, which can provide the least improvement. Highercapacities can be achieved by a tandem design with more tandem lanes.
For the analysis, it is implicitly assumed that vehicles will distribute themselves evenlyacross the lanes available to them. This assumption is normally reasonable, if the objective ofdrivers is to get through the intersection as quickly as possible, i.e., they will move forward asmuch as possible. However, this may not always be the case in reality, if drivers anticipatetheir next movement. For example, imagine there are two lanes for TVs at the currentintersection, and the majority of the TVs want to turn left at the next intersection. In this
12

(a) (b)
(c) (d)
Figure 4.2. Capacity increase with deterministic saturation headways, for the typical layoutsin Figure 4.1. The shading shows the ratio of the capacity of the tandem design over thecapacity of the conventional design. (a) n = N = 2 as in Figure 4.1(a), with one tandemlane. (b) n = 2, N = 3 as in Figure 4.1(b), with one tandem lane. (c) n = N = 3 as inFigure 4.1(c), with one tandem lane. (d) n = 3, N = 4 as in Figure 4.1(d), with one tandemlane.
13

case, TVs at the current intersection may not distribute themselves evenly across both lanes;the through lane on the left may be more crowded than the through lane on the right. Theanalysis of these situations involves assumptions of driver behavior, which is challenging tocharacterize. Therefore, we will stick to the assumption that vehicles are evenly distributedacross the lanes available to them, with the understanding that there can be complicationsto this assumption in reality.
We have also assumed that the intersection signal is pre-timed. This does not have to bethe case. The assumption is made only because in each cycle the durations of the pre-signalphases are decided by the durations of the intersection signal phases. But the pre-signalcan also be operated if the intersection signal is adaptive, as long as the durations of theintersection signal phases are determined at least one cycle ahead of their execution time.
4.2.2 Stochastic capacity analysis
The analysis above shows why tandem sorting is superior, but the analysis is optimisticin that it assumes that the saturation headway is deterministic. In reality, the number ofvehicles discharged in a given green time is not a constant number, even under saturationflow. Rather, the number is stochastic, dependent on driver behavior. This means thatif, for example, some LVs fail to be discharged during the left-turn phase with the tandemdesign in Figure 3.2(a), they will have to wait in the sorting area until the left-turn phase ofthe next cycle. As a result, the lane occupied by these residual LVs is temporarily blocked,and TVs can only be discharged using the other lanes during the through phase. Similarly,TVs can block LVs as well. Therefore, the existence of a residual queue due to stochasticsaturation headways can reduce capacity.
To mitigate the effect of these residual queues, one possible solution is to reduce thenumber of LVs and TVs into the sorting area each cycle, by reducing the green durationat the pre-signal, but not at the intersection. The reduction needs to be properly chosen:too large a reduction results in capacity loss when there is no residual queue; too small areduction results in frequent residual queues and capacity loss. The choice of the number ofLVs and TVs is the result of this tradeoff.
We argue that residual queues can be detected almost immediately with loop detectorslocated right upstream of the intersection stop line, or with a video camera. For example,during the through phase, stopped vehicles over the loop detectors in the tandem lanes mustbe residual LVs. The residual TVs can be detected similarly. Once a residual queue isdetected, we would adopt an alternative signal timing plan at the pre-signal, with shortergreen periods to avoid overcrowding in the sorting area. The normal pre-signal timing planwould only be restored after the residual queues have vanished.
If we also assume that drivers do not change lanes in the sorting area, lanes can be treated
14

independently for the purpose of analyzing flow. This means we can analyze the capacityof a single tandem lane and scale it properly for the intersection capacity. To facilitatediscussion, we temporarily switch to the conventional unit system from the dimensionlessone, i.e., the green time and flow capacity are no longer dimensionless. We use a prime toindicate green time and flow capacity in the conventional unit system. Let us assume thatHi is the saturation headway of the ith vehicle. The Hi’s are independently and normallydistributed with mean H and variance (γ′H)2. The parameter γ′ is the coefficient of variationof Hi. We also assume that the duration of the left-turn phase or the through phase at theintersection signal is
G′X = mXH (with X being either L or T ), (4.3)
which allows mX vehicles to be discharged in the deterministic case. If there are msX vehicles
to be discharged (the superscript ‘s’ stands for stochastic), the probability that a residualqueue occurs can be formulated by the following expression:
pX = Pr
ms
X∑i=1
Hi ≥ mXH
≈ Φ
(−mX −ms
X√ms
Xγ′
). (4.4)
where Φ(.) is the cumulative distribution function of the standard normal distribution. Thesaturation headways Hi’s are independently and identically distributed, thus the sum of theHi’s is approximately normally distributed by virtue of the central limit theorem.
We define two new dimensionless parameters kL and kT to be the decision variables,where kX (X being either L or T ) is the number of standard deviations between mX andms
X .kX , (mX −ms
X)/(√ms
Xγ′). (4.5)
If we assume that mX is given, both pX and msX can be expressed in terms of kX :
pX = Φ(−kX), (4.6a)
msX = mX −
kXγ′
2
(√(kXγ′)2 + 4mX − kXγ′
)≈ mX
(1− kXγ
′√mX
). (4.6b)
The approximation in Equation 4.6b is good because for common values of the parameters(e.g., kX = 3, γ′ = 0.2,mX = 5), 4mX � (kXγ
′)2.
Every time a residual queue occurs, a whole cycle is wasted on that blocked lane. Forexample, if a tandem lane is blocked by the residual LVs, no TV can discharge on the laneduring the through phase and the residual LVs clear only during the left-turn phase of thenext cycle, resulting in a waste of a whole cycle. The same is true if the residual queue iscomposed only of TVs. If both LVs and TVs fail to be discharged during their green phases,two cycles will be wasted, i.e., it would take three cycles to discharge the same amount of LVs
15

and TVs that would otherwise take just one cycle if there were no residual queue. Therefore,it takes 1 + pL + pT cycles on average to discharge ms
L LVs and msT TVs on a tandem lane.1
The new capacity accounting for stochastic saturation headways can now be expressedas follows.
qs′ =NLm
sL +NTm
sT
C(1 + pL + pT )
=NLmL(1− kLγ′/
√mL) +NTmT (1− kTγ′/
√mT )
C(1 + Φ(−kL) + Φ(−kT ))
=NLG
′L/H(1− kLγ′/
√G′L/H) +NTG
′T/H(1− kTγ′/
√G′T/H)
C(1 + Φ(−kL) + Φ(−kT )).
(4.7)
The coefficients 1− kXγ′/√G′X/H in the numerator are the ratio of the reduction in batch
size, msX/mX . The coefficient 1 + Φ(−kL) + Φ(−kT ) in the denominator accounts for the
lost cycles due to residual queues.
Recall that all the variables in Equation 4.7 are in the conventional unit system. Tomake the capacity comparable to the dimensionless ones in Section 4.2.1, we reorganizeEquation 4.7 with dimensionless variables. This is done by replacing G′X and qs′ with GXCand qs/H, respectively to obtain:
qs =NLGL(1− kLγ′
√H/C/
√GL) +NTGT (1− kTγ′
√H/C/
√GT )
1 + Φ(−kL) + Φ(−kT ). (4.8)
Furthermore, if we define γ = γ′√H/C to be the counterpart of γ′ in the dimensionless unit
system, then
qs =NLGL(1− kLγ/
√GL) +NTGT (1− kTγ/
√GT )
1 + Φ(−kL) + Φ(−kT ). (4.9)
As the objective function, Equation 4.9 is to be maximized with respect to kL and kT .This objective function is very complicated. Fortunately, we observe that the objectivefunction is insensitive to the values of kL and kT around the optimum.
Figure 4.3 illustrates the ratio of the capacity in the stochastic situation, qs, over thatunder the deterministic situation, q. We see that the ratio varies little around the optimum.Furthermore, the optimal values of kL and kT do not change much with respect to theparameters. For example, given H = 2.5 seconds, G = 0.5, γ′ = 0.2, with C ranging from30 seconds to 180 seconds, and l ranging from 0.1 to 0.9, the optimal kL and kT alwaysfall within the range from 1.5 to 2.5. If we just choose kL = kT = 2, the resulting qs isalways larger than 99% of the optimal qs. Therefore, instead of maximizing Equation 4.9with respect to kL and kT using complicated algorithms, we will just choose kL = kT = 2.
1The probability of one cycle is (1− pL)(1− pT ), that of two cycles is pL(1− pT ) + (1− pL)pT , and thatof three cycles is pLpT . Therefore, 1 + pL + pT cycles are needed on average.
16

Figure 4.3. Capacity loss due to stochastic saturation headways. The contours show theratio of the capacity under the stochastic situation (qs) over that under the deterministicsituation (q). The following parameters are used: G = 0.5, γ′ = 0.2, H = 2.5 seconds,C = 90 seconds, and l = 0.3. Note that the ratio is very insensitive to the decision variables(kL and kT ) around the optimum.
To make the story complete, the decision variables kL and kT need to be translated intosignal timing. Given that we know how to solve the TMP, and that the signal timing at theintersection signal does not change, we only need to reduce the duration of the pre-signalgreen phases from gX to gsX , defined as follows:
gsX = gX(1− kXγ/√GX). (4.10)
With this complication, the capacity achieved is lower than that predicted by the TMP,but still higher than the CMP for most situations. We can see this by comparing the capacitywith stochastic saturation headways, qs, with the capacity of the status quo, q0. Figure 4.4shows the same batch of figures as in Figure 4.2, accounting for stochastic saturation head-ways and assuming C/H = 48. For the most common values of G (around 0.5), there is acapacity increase of at least 10% compared with the status quo. This is realized with justone tandem lane. If the capacity increase is not sufficient, more tandem lanes can be used.Figure 4.5 shows the results of the capacity increase with more than one tandem lane, stillwith C/H = 48 and accounting for the effect of stochastic saturation headways. A capacityincrease on the scale of at least 20%-30% can be expected.
In reality, the traffic may comprise a mixture of vehicle classes, including cars, SUVs, andtrucks, whose operation characteristics like acceleration and deceleration could be different.
17

In this situation, H will represent the average headway, and the value of γ will be larger torepresent the heterogeneity of the traffic.
(a) (b)
(c) (d)
Figure 4.4. Capacity increase with stochastic saturation headways, for the typical layoutsin Figure 4.1 and C/H = 48. The shading shows the ratio of the capacity of the tandemdesign over the capacity of the conventional design. (a) n = N = 2, with one tandem lane.(b) n = 2, N = 3, with one tandem lane. (c) n = N = 3, with one tandem lane. (d)n = 3, N = 4, with one tandem lane.
4.3 Spatial Analysis
So far, we have assumed that the street block containing the approach is long enoughto accommodate the sorting area between the intersection signal and the pre-signal. Theassumption simplifies our analysis because then the two bottlenecks (one at the intersectionsignal and the other at the pre-signal) are independent and do not interact with each other.
18

(a) (b)
(c) (d)
(e) (f)
Figure 4.5. Capacity increase with stochastic saturation headways and more than one tandemlane, for the typical layouts in Figure 4.1 and C/H = 48. The shading shows the ratio of thecapacity of the tandem design over the capacity of the conventional design. (a) n = N = 2,with two tandem lanes. (b) n = 2, N = 3, with two tandem lanes. (c) n = N = 3, with twotandem lanes. (d) n = 3, N = 4, with two tandem lanes. (e) n = N = 3, with three tandemlanes. (f) n = 3, N = 4, with three tandem lanes.
19

In this section, we specify the minimal length requirement of the sorting area so that thecapacity analysis performed this far is applicable. We also discuss the impact that insufficientlength has on capacity and modifications of the timing strategy that reduce this lengthrequirement.
4.3.1 Minimal length requirement
The sorting area needs to be long enough to hold all the vehicles to be discharged from atandem lane in a cycle at jam density. To see this, we show in Figure 4.6 how the traffic statesevolve in space for a full tandem design with n = N = 2 and saturated demand. Traffic statesare shown on the fundamental diagram in Figure 4.6(a), with S and J indicating saturationstate (with the highest possible flow) and jammed state (with the highest possible density)respectively. The subscript 1 or 2 indicates the number of lanes involved for the traffic states.For example, S1 means vehicles discharge with saturation flow on one lane, and J2 meansvehicles are queued with jam density over two lanes. The states AL and AT are for thearriving LVs and TVs. The time-space diagrams in Figures 4.6(b) and 4.6(c) illustrate howthe LV and TV traffic evolve in space if the demand is just saturated. Note that in thesorting area (i.e., between the two horizontal dashed lines marking the locations of the pre-signal and the intersection signal), both LVs and TVs arrive in one lane, spread themselvesover the two lanes and form queues. TVs queue behind the LVs using both lanes, and thetwo streams are discharged in their corresponding intersection signal phases. Although it isassumed here that the intersection signal has a leading left-turn phase, the process is similarfor a lagging left-turn phase. Also note that the maximal queue length within the sortingarea (assuming the sorting area is long enough) is the queue length of all LVs and TVs tobe discharged from a tandem lane at jam density.
If we define Kj to be the jam density per lane, the minimal length of the sorting areacan be formulated as
D1 = D1L +D1T . (4.11)
The queue length of LVs in the sorting area, D1L, and that for TVs, D1T , are shown in Fig-ures 4.6(b) and 4.6(c). Their expression can be derived as follows from Equations 4.3, 4.7, 4.8,and 4.9:
D1X = msX/Kj, (4.12)
msX = GX(C/H)(1− kXγ/
√GX). (4.13)
with X being either L or T .
Besides the length of the sorting area, we might also be interested in the minimal distancebetween the pre-signal and the nearest upstream intersection, to determine whether thetandem design can fit into a street block. This minimal distance, D2, can be expressed as
20

(a)
(b)
(c)
Figure 4.6. Evolution of traffic states in time and space for a tandem design with n = N = 2under saturated demand. (a) Triangular fundamental diagram with different traffic states.(b) Time-space diagram of the LVs (with that for TVs in light gray color). (c) Time-spacediagram of the TVs (with that for LVs in light gray color).
21

follows:D2 = max{D2L, D2T}, (4.14)
where D2L is the maximal queue length of LVs upstream of the pre-signal, and D2T is themaximal queue length of TVs upstream of the pre-signal when both input flows are atsaturation. For uniform arrivals, D2L and D2T are shown in Figures 4.6(b) and 4.6(c). Somesimple traffic engineering can be applied to calculate them:
D2X = gsX(C/H)/Kj, (4.15)
with X being either L or T .
4.3.2 Capacity with short blocks
The capacity analysis in Section 4.2 deals with the situations when the block of interestis longer than D1 +D2. If this is not the case, pre-signals may still increase the intersectioncapacity, albeit to a lesser extent.
Different assumptions may be employed for the analysis of the capacity under this situ-ation. One simple assumption is that the length of the sorting area, the durations of signalphases (at both the pre-signal and the intersection signal) and the capacity achieved allreduce proportionally with the block length. Note that the assumption is conservative, andyields a lower bound for the capacity that can be achieved. This is because we have assumedthat the number of vehicles discharged per cycle is constrained by the number of vehiclesthat the sorting area can hold, which is true when the blocks are long. However, we seein Figure 4.7 that when blocks are short, the number of vehicles discharged per cycle (allvehicles discharged during GL and GT ) can be more than that the sorting area can hold (allvehicles discharged in GL and those using 2 lanes during the beginning of GT ). Therefore,when blocks are short, we can say that this assumption is conservative.
4.3.3 Modified design: phase swap
The length of the sorting area can be estimated by performing a back-of-the-envelopecalculation. It is based on Equations 4.11, 4.12, and 4.13. Assuming that the stochasticeffects are ignored (i.e., γ = 0, for an upper bound estimation), and adopting the followingparameters: jam density Kj ≈ 1/7 vehicle/meter, total green ratio G ≈ 0.5, average satura-tion headway H ≈ 2.5 seconds, the length of the sorting area D1 is estimated to be about 84meters per minute of cycle length. Note that the conventional design only requires a blocklength similar to D2, while the tandem design requires an additional length of D1. Therefore,it may be challenging to find blocks that is sufficiently long to implement the tandem design.Furthermore, modifications that reduce the block length requirement can make the tandemdesign much more feasible.
22

Figure 4.7. Time-space diagram of TVs (in dark color, with that of LVs in light gray color)for a tandem design with n = N = 2 and limited block length. Note that the numberof vehicles discharged per cycle (all vehicles discharged in GL and GT ) is more than thatthe sorting area can hold (all vehicles discharged in GL and those using 2 lanes during thebeginning of GT ).
In this section, we discuss one such modification which involves swapping phases of theintersection signal. In Figure 4.6(b) or 4.6(c), we see that the LV and TV queues are stackedon each other. Correspondingly, the length of the sorting area is the sum of the lengths ofthe LV and TV queues as in Equations 4.11. All these are because the left-turn phase isfollowed immediately by the through phase. However, the left-turn phase and the throughphase do not have to be back to back; see how the order of phases 2 and 3 can be swappedat an intersection signal in Figure 4.8. As a result, the LV and TV queues do not have to bestacked on each other, as shown in Figure 4.9(a), and the length requirement of the sortingarea, instead of Equation 4.11, can be reduced to
D1 = max{D1L, D1T}, (4.16)
where Equations 4.12 and 4.13 still hold. The reduction in the length of the sorting areadepends on the values of D1L and D1T , or similarly, the left-turn ratio l. When the left-turnratio is about 0.5, the reduction is greatest; i.e., by about 50%.
Note from Figure 4.9(a) that to separate the two queues in time, the durations of thered phases need to satisfy the following requirement: R1 ≥ gL − GL and R2 ≥ gT − GT . Ifthis is not the case, the two queues will be partially stacked on each other, and the length ofthe sorting area may be more than that predicted in Equation 4.16. Figure 4.9(b) illustratesthe situation when 0 < R2 < gT − GT . We see two queues: the first has all LVs and someTVs, and the second has only TVs. The length of the sorting area in this situation can beexpressed as:
D1 = max
{D1L +D1T
[1− R2
gT −GT
], D1T
}. (4.17)
23
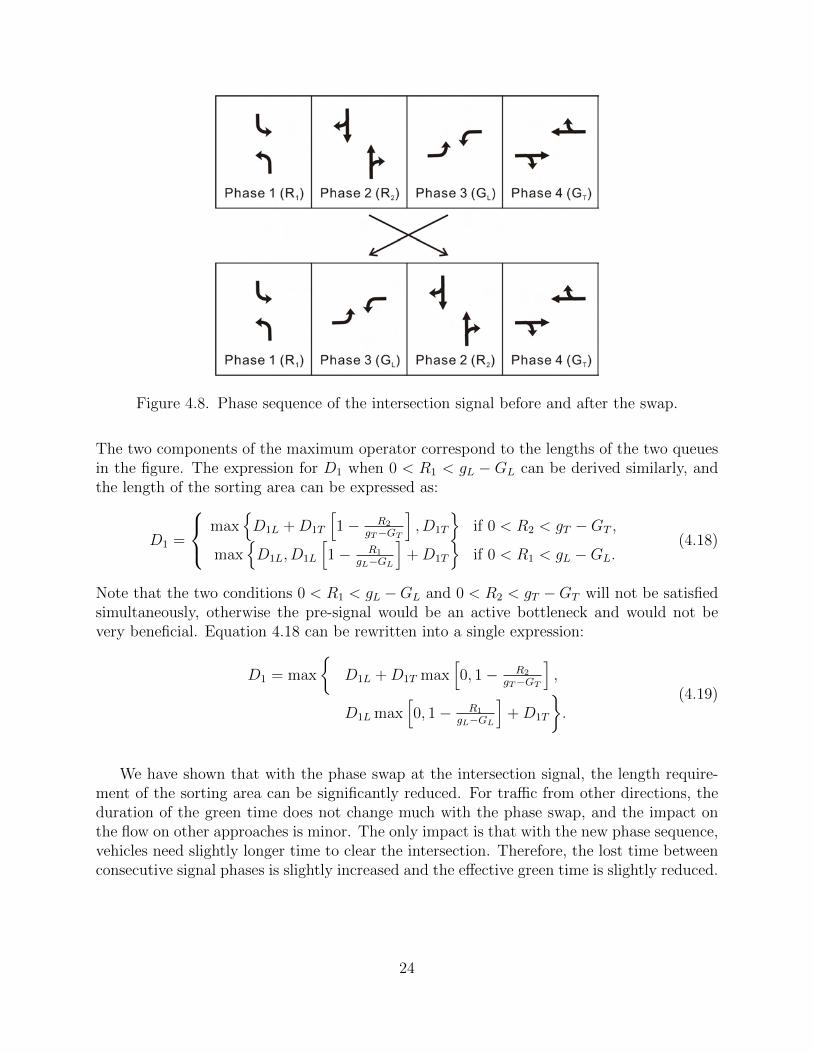
Figure 4.8. Phase sequence of the intersection signal before and after the swap.
The two components of the maximum operator correspond to the lengths of the two queuesin the figure. The expression for D1 when 0 < R1 < gL − GL can be derived similarly, andthe length of the sorting area can be expressed as:
D1 =
max{D1L +D1T
[1− R2
gT−GT
], D1T
}if 0 < R2 < gT −GT ,
max{D1L, D1L
[1− R1
gL−GL
]+D1T
}if 0 < R1 < gL −GL.
(4.18)
Note that the two conditions 0 < R1 < gL −GL and 0 < R2 < gT −GT will not be satisfiedsimultaneously, otherwise the pre-signal would be an active bottleneck and would not bevery beneficial. Equation 4.18 can be rewritten into a single expression:
D1 = max
{D1L +D1T max
[0, 1− R2
gT−GT
],
D1L max[0, 1− R1
gL−GL
]+D1T
}.
(4.19)
We have shown that with the phase swap at the intersection signal, the length require-ment of the sorting area can be significantly reduced. For traffic from other directions, theduration of the green time does not change much with the phase swap, and the impact onthe flow on other approaches is minor. The only impact is that with the new phase sequence,vehicles need slightly longer time to clear the intersection. Therefore, the lost time betweenconsecutive signal phases is slightly increased and the effective green time is slightly reduced.
24

(a)
(b)
Figure 4.9. Time-space diagram of LVs and TVs with n = N = 2 and a phase swap at theintersection signal. (a) The situation when the duration of phase 2 is longer than gT −GT .The LV and TV queues are not stacked on each other but separated in time. (b) Thesituation when the duration of phase 2 is shorter than gT −GT . The TV queue is partiallystacked on the LV queue.
25

4.4 Discussion of Delay
As stated in the introduction, the focus of the dissertation is on oversaturated intersec-tions. In this situation, increasing capacity can reduce the number of vehicles that waitfor multiple cycles to pass the intersection, as well as their delay. The same is true for thenumber of stops that vehicles make, which is an important contributor to emissions.
We have also performed some preliminary delay analysis when intersections are under-saturated. We find that it is possible to modify the tandem design so that at least onemovement (e.g. the TVs) can go through the intersection with no extra delay due to thepre-signal. However, the main benefit of the tandem design, i.e., increased capacity, is notvery helpful to this situation. Therefore, the delay analysis for the undersaturated situationis skipped.
In reality, no intersection would be oversaturated all the time, and undersaturated situ-ations need to be addressed. Fortunately, pre-signals can be turned off when traffic demandis undersaturated. This is discussed next in Section 5.1.
26

Chapter 5
Operational Issues
In this chapter, we discuss issues that are related to the implementation of the tandemdesign, e.g., switching pre-signals on/off to account for different traffic conditions, and issueswith driver compliance.
5.1 Switching the Pre-signal On and Off
As per our discussion in the last section, tandem design with a pre-signal is needed duringthe peak period when demand is overwhelming, but not so for undersaturated situations whendemand is low. Fortunately, the pre-signal can be simply turned off when it is not needed.As a result, the tandem design to be implemented in reality needs the functionality to switchthe pre-signal on or off depending on the traffic conditions.
Let us start with the undersaturated condition when the pre-signal is turned off. Astraffic demand increases, the queue length during each cycle will increase as well. Whenthe end of queue reaches the location of the pre-signal, i.e., when the sorting area is filled,not all vehicles can be discharged in one cycle. Therefore, extra capacity is needed and thepre-signal should be switched on. When switching on the pre-signal, there is a transitionperiod when the pre-signal should be set to all red until all vehicles in the sorting area arecleared, i.e., there is no residual queue in the sorting area. The existence of a residual queuecan be detected by either loop detectors located right upstream of the intersection stop line,or video cameras. After the sorting area is cleared, the pre-signal should adopt its normaltiming plan as designed.
The traffic demand can be monitored by inspecting the number of vehicles in the sortingarea per cycle. This can be done similarly with loop detectors or video cameras. Whendemand has dropped below the capacity of the conventional design, the pre-signal should be
27

switched off. No transition period is required in this situation, and vehicles will automaticallyfill the sorting area after the pre-signal is turned off.
5.2 Compliance and Enforcement
So far, we have implicitly assumed that drivers always comply with the new lane des-ignation imposed by the tandem design. While the validity of the assumption can only betested in the field, it is important to realize the consequences of noncompliance and whysome drivers do not comply.
Noncompliance to the lane designation can result in residual queues in the sorting area.For example, if a TV goes through the pre-signal using the lane designated to LVs (no matterthe reason), the TV will not turn left and may block the LVs behind it from turning left.This would produce a residual queue similarly to the situation described in Section 4.2.2,and intersection capacity could be significantly reduced. Therefore, noncompliance is veryundesirable.
Noncompliance can be discouraged through both enforcement and design. Enforcementcan be done with video cameras. Noncompliant drivers will use the lanes designated forLVs at the pre-signal and the lanes designated for TVs at the intersection signal, or theother way around. Therefore, if we track the lanes used by vehicles, noncompliance can bedetected. Noncompliance would likely reduce eventually if noncompliant drivers were to facelarge fines.
To address noncompliance from the design point of view, we need to understand whydrivers do not comply. Drivers may do this for at least three different reasons: the first isthat they are confused by the new design; the second is that they change their mind at thelast minute; the last is that they want to game the system to benefit themselves (e.g., toreduce their travel times). To address the first reason, signs can be added far upstream of thepre-signal to remind drivers of the new design and explain the lane designation. Hopefullygiven enough time, drivers will become accustomed to the tandem design and there will beless confusion. Not much can be done to address the second reason. Drivers that changetheir mind at the last minute have to comply and incur some inconvenience, which is trueeven with the conventional design. To address the third reason of noncompliance, we findthat it is possible to modify the tandem design so that the pre-signal and the intersectionsignal function as a first-in-first-out (FIFO) system for most drivers. Therefore, most driversdo not have much incentive to game the system. One such modification is briefly describedin the next section.
28

5.3 Shared Lane at the Pre-signal
The tandem design so far requires LVs and TVs to be presorted into different lanes atthe pre-signal. According to Equation 4.15, the queue length in a LV (or TV) lane upstreamof the pre-signal is proportional to the duration of the pre-signal LV (or TV) phase, or thedemand of LVs (or TVs). Therefore, the LV queue upstream of the pre-signal can be quiteshort if there are only a few LVs per cycle. When there are only two lanes at the pre-signalas in Figure 3.2(c), it is a waste of space to allocate a whole lane to LVs. This may alsoencourage noncompliance of TVs, if they see a very long TV queue and a very short LVqueue.
However, vehicles at the pre-signal do not necessarily have to be segregated by movementinto different lanes. As illustrated in Figure 5.1, a lane can be a shared lane (i.e., to holdboth LVs and TVs). Figure 5.1 illustrates how vehicles are supposed to move during thetwo pre-signal phases: a green phase for the left lane upstream of the pre-signal (upper partof the figure) and a green phase for the right lane upstream of the pre-signal (lower part ofthe figure). In the sorting area, LVs are allowed into the two lanes on the left during thefirst pre-signal phase, while TVs are only allowed in the rightmost lane. During the secondpre-signal phase, TVs may use the two lanes on the right in the sorting area. Note that withthe shared lane, there will be no noncompliance for the TVs at the pre-signal since they canuse either lane, as they see fit. Also note that for this modified design to work, the lanedesignation in the sorting area needs to change dynamically.
Figure 5.1. Shared lane at the pre-signal. The upper and lower parts of the figure illustratevehicle movements during the two pre-signal phases respectively.
Also note that the modified design in Figure 5.1 yields the same capacity as the designin Figure 3.2(c). After passing the pre-signal, hopefully drivers will distribute themselvesevenly across all lanes that are available to them, to reduce their travel time. Therefore,
29

modified designs with a shared lane at the pre-signal may greatly reduce the frequency ofnoncompliance, though the possibility of noncompliance can never be eliminated completely.
30
Chapter 6
Case Study
In this chapter, we present a case study at a signalized intersection in the city of Chengdu,China. The case study shows how the tandem design with a pre-signal can be used to benefitboth cars and buses on the site, despite many real-world complications.
6.1 Status Quo and Its Problems
The site of interest is the southbound approach at the intersection of the First-Ring Roadand Gaoshengqiao Road. The block is more than 400 meters long. The approach has threelanes and a 100-meter long left-turn pocket, as shown in Figure 6.1. There is also a sidestreet about 100 meters upstream of the intersection. Lane 3 is a dedicated bus lane, butthe current regulation also allows right-turning cars. Note that the lane designations for cartraffic are labeled according to the current behavior of drivers, not the current regulation.For example, through-moving cars frequently enter the bus lane (lane 3) in violation of theregulation. Thus, the lane designation for the bus lane in the figure includes through-movingcars. Another example is that lane 1 is actually designated for through-moving cars only,but in reality drivers behave as if lane 1 allows both left-turning and through-moving cars,as labeled in the figure.
Currently, the intersection signal is pre-timed, but this timing changes with the time ofthe day. The cycle length is more than 3 minutes during the peak hours, and total green timeavailable for the approach is about half the cycle length. The current capacity is about 1580vehicles/hour during the morning peak and 1140 vehicles/hour during the evening peak. Thefraction of left-turning cars on the intersection approach is very high, at about 57% in themorning peak and 37% in the evening peak, presumably because left turns go to the citycenter.
31

Figure 6.1. Current geometry of the approach of our case study.
There are two main problems at the present time. The first problem is that buses inthe dedicated lane experience severe delay. This extra delay has two sources. One is thethrough-moving car traffic that enters the bus lane against the regulation. The other sourceis the side street car traffic that must weave through the bus lane but gets stuck in the buslane due to congestion on the approach. The second problem is the severe congestion causedby heavy traffic demand that temporarily exceeds the intersection capacity available duringthe peak period. The queue very often backs up into the upstream intersection.
The fact that lane 1 becomes a de facto shared lane exacerbates the second problem. Theleft-turning drivers may feel compelled to use lane 1 because of: (a) the high left-turn ratio(between 37% and 57%) and (b) the limited green time (less than 1/6 of the cycle length forleft turns) and (c) the small left-turn pocket. But their behavior causes problems. Duringthe through phase, the first left-turning car in lane 1 will block the through-moving carsbehind it from discharging from this lane, and vice versa during the left-turn phase. If thismutual blocking phenomenon can be alleviated, the intersection capacity could be increased,and congestion would decline as a result.
6.2 Proposed Solution
We seek to solve these two problems to benefit both cars and buses. The first problemcan be solved by enforcing the bus lane regulation, as illustrated in Figure 6.2(a). Ourproposal includes (a) adding a physical barrier between lanes 2 and 3 to avoid incursion ofthrough-moving cars into the bus lane; and (b) detouring side street cars so that the buslane is immune from their disruptions. The proposed bus lane enforcement strategies wouldhopefully reduce delay of buses due to disruptions from car traffic. However, doing this alonewould likely reduce intersection capacity, increase congestion, and make the enforcement ofthe bus lane regulation more challenging. Cars would suffer a penalty.
Therefore, besides bus lane enforcement, we propose to use the tandem design with a
32

(a)
(b)
Figure 6.2. Proposed geometry of the approach of our case study. (a) Bus lane enforcementonly, including adding physical barrier between lanes 2 and 3, and detouring side streettraffic. (b) Bus lane enforcement as well as the tandem design for car traffic.
33

mid-block pre-signal to increase the intersection capacity. The pre-signal will only controlcar traffic coming from lanes 1 and 2. Vehicles need to be presorted at the pre-signal stopline, with LVs in lane 1 and TVs in lane 2. Roadside signs are needed upstream of thepre-signal to provide warning and give drivers enough time to maneuver to their designatedlane. The lane designation in the sorting area for a tandem sorting strategy with one tandemlane is shown in Figure 6.2(b). If two tandem lanes are needed, lane 2 can be designated toallow for both LVs and TVs in the sorting area.
There is another complication with regard to the use of the tandem design describedin Chapter 3. In the present case, the intersection signal does not have only two greenphases for the approach, but rather three green phases: after the through phase and beforethe left-turn phase, there is an extra phase serving both TVs and LVs (red light for theopposite approach). The design is depicted by the first three phases in Figure 6.3, where theintersection approach of interest goes in the direction from left to right. This kind of designis justified by the asymmetry of traffic demand on the subject approach and its opposingapproach. The pre-signal phases can be designed accordingly: instead of two green phases(one for the LVs and the other for the TVs), the pre-signal will also have three green phases,with an extra phase serving both the LVs and the TVs.
Figure 6.3. Signal timing of the intersection signal. The intersection approach of interest goesin the direction from left to right. The second phase from left is the source of complication.
6.3 Estimated Benefit
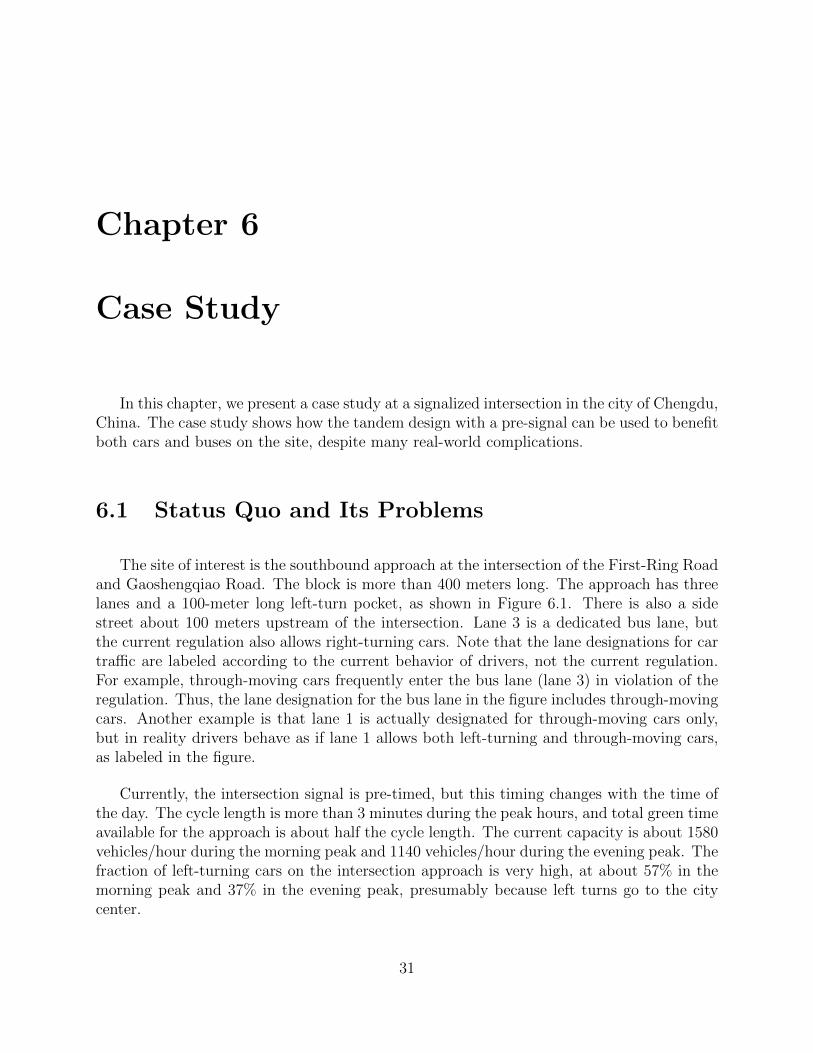
We videotaped the intersection approach of interest to obtain a benchmark for compar-ison. A video snapshot is shown in Figure 6.4. The video, as well as microsimulation, wasused to test the potential benefit of the bus lane enforcement in combination with the tandemdesign.
The bus delays for the status quo and for the status quo with bus lane enforcement alonewere both empirically calculated from the video. We first searched off-peak periods of thevideo to identify buses that were not delayed on the approach. The amounts of time thesebuses spent on the approach were averaged to obtain the free flow travel time of buses. Thedelay of each bus for the status quo was obtained by subtracting the travel time of each busfrom the free flow time. The delay comes from both the intersection signal and disruptionsfrom car traffic. With the proposed bus lane enforcement, we assume that the disruptions
34
Figure 6.4. A video snapshot of the site. The intersection is located on the upper left cornerof the image. Traffic on the intersection approach of interest moves from the lower rightcorner to the upper left corner.
would be gone and only buses and right-turning cars would remain in the bus lane. Thedeparture time of each vehicle can then be determined as is standard in queuing theory bytaking the maximum of two components. The first component is the saturation headway ofthat vehicle (2.3 seconds for cars and 3.9 seconds for buses, both empirically obtained) plusthe departure time of the previous vehicle. The second component is the departure timewith no delay, i.e., the time that vehicle shows up in the video plus free flow travel time.The differences between the calculated departure times for all the buses and the free flowtravel time are the bus delays with bus lane enforcement.
The capacity of the status quo was obtained from the video. The capacity with buslane enforcement alone and with both bus lane enforcement and the tandem design wereobtained through microsimulation. We used CORSIM (Federal Highway Administration,2007), and calibrated its parameters (free flow speed, saturation flow, intersection signaltiming, input flow, etc.) with measurements from the video. Interested readers may referto the link http://www.its.berkeley.edu/volvocenter/pre-signal/Tandem Design.html for asample simulation video. The simulation video includes the aforementioned mutual blockingphenomenon and phase swap, but for illustration purposes only adopts a 4-phase intersectionsignal timing. A snapshot of the video is shown in Figure 6.5.
Table 6.1 compares three scenarios: (a) status quo, (b) bus lane enforcement alone, and(c) bus lane enforcement plus the tandem design. Due to disruptions from car traffic, somebuses miss the green time and have to wait for the next cycle (with an extra red time ofabout 2 minutes). Delay is reduced by eliminating these disruptions. The table shows thatbus lane enforcement reduces the average delay per bus by 40% or more, and the standard
35

Figure 6.5. A snapshot of the CORSIM simulation. The upper part is for the situationwith bus lane enforcement only, and the lower part is for the proposed tandem design. Thevehicles are color coded by their movement: green (or light gray) for LVs, white for TVs.Note that for the status quo, LVs and TVs are randomly mixed in lane 1, resulting in themutual blocking phenomenon.
deviation of bus delay by 30% or more. Therefore, buses are delayed less and their on-timeperformance is improved. The residual bus delay is due to the intersection signal, since wedid not do signal preemption for buses (or bus signal priority).
Table 6.1 also shows the capacity of the three different scenarios. With bus lane enforce-ment alone, the intersection capacity would decline by about 10%. There are two reasons forthis reduction. The most obvious one is that through-moving cars cannot use the bus lane todischarge. Less obvious is that the mutual blocking phenomenon becomes more severe whenthe through-moving cars from lane 3 are pushed onto lanes 1 and 2. Fortunately, adoptingthe tandem design with one tandem lane can restore the capacity during the morning peak.And for the evening peak, the capacity can be increased by about 10% compared with thestatus quo.
Although bus lane enforcement alone can effectively reduce bus delay, the reduced capac-ity for car traffic would greatly increase congestion. The disparity would make the benefitto buses challenging to sustain, as drivers either voice their discontent to decision makers(more popular in developed countries), or simply violate the regulations (more popular indeveloping countries). Thus, the proposal with both bus lane enforcement and the tandemdesign would benefit both cars and buses, and its benefits are likely to be accepted withoutdiscontent.
To be complete, we should also address the strategy’s effect on right-turning cars andleft-turning buses. The right-turning cars (which account for only 5% of the car traffic) will
36

Table 6.1. Comparison among the status quo, bus lane enforcement alone, and bus laneenforcement as well as tandem sorting
Status quo(100% asbaseline)
Bus laneenforcementalone
Bus lane enforce-ment and tan-dem design (with1 tandem lane)
Bus delay(seconds/bus)
Morningpeak
111 (100%) 59 (53%)
Eveningpeak
110 (100%) 66 (60%)
Standarddeviation ofbus delay(seconds/bus)
Morningpeak
75 (100%) 46 (61%)
Eveningpeak
55 (100%) 39 (71%)
Capacity(vehicles/hour)
Morningpeak
1586 (100%) 1405 (89%) 1568 (99%)
Eveningpeak
1145 (100%) 1019 (89%) 1249 (109%)
37

not see much change except that they now have to stop in lane 2 at the pre-signal. Afterentering the sorting area, they shall use lane 3 to turn right.
There are some changes to how left-turning buses (which account for 10% to 20% of thebus traffic) would operate. Under the status quo, left-turning buses cannot easily changelanes from lane 3 to the left-turn pocket due to the congested approach. As a result, theygenerally have to leave the bus lane well upstream of the intersection to reach the left-turnpocket. This lane change maneuver becomes much easier with the pre-signal, since it createsgaps in car traffic. This is actually the original function of the pre-signal (Oakes et al. ,1994). Now left-turning buses can stay in the bus lane until reaching the pre-signal (they donot have to stop at the pre-signal), and then change lanes to the left-turn pocket.
38

Chapter 7
Serving Multimodal Traffic
So far, the discussion on tandem sorting with pre-signals has been limited to a singlemode, i.e., cars. The case study does involve buses, but the buses are segregated from cartraffic, and as a result the two modes can be analyzed separately. However, the tandemsorting concept with a pre-signal can also be used to sort two or more transport modes. Asimple theory on how to increase the capacity by sorting cars and buses is shown next.
7.1 Theory
The theory to be proposed is similar in spirit to Wu & Hounsell (1998). Let us assumethat buses travel on a dedicated lane on which right-turning cars are not allowed, and focusonly on the interaction between through-moving buses and right-turning cars. To drawinsights, simplified models are used to study possible ways to increase the capacity for thesetwo vehicle classes. More realistic situations will be considered in Section 7.2.
Left to their own devices, conflicts will arise between the right-turning cars and thethrough-moving buses, such that both vehicle classes cannot simultaneously discharge intothe intersection during a green time. This case is labeled in Figure 7.1 as “side-by-side op-eration with conflicts”. These conflicts can be resolved by using a pre-signal to reorganizethe two vehicle classes. The pre-signal alternates allocating green times to each class. Vehi-cles pass through the pre-signal and move to their assigned lanes in the sorting area. Twopossible sorting strategies are shown in Figure 7.1. Both resolve the conflicts between thetwo vehicle classes. In the first strategy, labeled “side-by-side operation with no conflicts”,the vehicle classes are laterally swapped in position within the sorting area. In the secondstrategy, the two classes are sorted in a tandem fashion, such that each class discharges intothe intersection in sequence.
39

Figure 7.1. Different sorting strategies (including do-nothing).
Now we determine the capacity of the three cases in Figure 7.1. Consistent with ourdiscussion in Section 4.2, we adopt a dimensionless unit system such that the cycle lengthof the intersection signal is the unit of time, and the saturation flow per lane for car trafficis the unit of flow. To convert car flow (in cars/hour) into its dimensionless counterpart, carflow is normalized by the saturation flow per lane for cars (in cars/hour/lane). Bus flow, onthe other hand, is normalized by the saturation flow per lane for buses (in buses/hour/lane).As before, the dimensionless capacity can be represented by the product of dimensionlessgreen time and the number of lanes available to discharge.
We assume that: (a) the approach has 2 lanes as in Figure 7.1, and the green ratio at theintersection signal, G, is given; (b) the lost time between the pre-signal phases is negligible;(c) the two vehicle classes in question are each characterized by their dimensionless demandqcr (right-turning cars) and qbt (through-moving buses). The capacity constraint for side-by-side operation with conflicts can then be expressed as
qbt + qcr ≤ G, (7.1)
because only one vehicle class can discharge at a time. The capacity constraints for side-by-side operation with no conflicts are
qbt ≤ G, qcr ≤ G, (7.2a)
qbt + qcr ≤ 1. (7.2b)
The first constraint pertains to the intersection signal, and the second to the pre-signal. The
40

capacity constraints for the tandem case are:
qbt + qcr ≤ 2G, (7.3a)
qbt + qcr ≤ 1. (7.3b)
Equation 7.3a assumes that both vehicle classes distributed themselves evenly across thetwo lanes, and the factor “2” on the right-hand side arises because both lanes can dischargesimultaneously during the whole green phase. Note as well from the summation on the left-hand side of Equation 7.3a that we are assuming that the time it takes to discharge a mixtureof vehicle classes (cars and buses here) equals the sum of the times that it would take todischarge the vehicle classes separately. This linear superposition assumption is verified inSection 7.3.
Figure 7.2 shows the capacity constraints derived above when G ≤ 1/2. In this situation,the capacity constraint at the pre-signal as shown in Equations 7.2b and 7.3b is never binding.This is because the total green time at the intersection signal is equal to or less than half of thecycle length, while the pre-signal can use the whole cycle to sort traffic. Side-by-side sortingwith no conflicts increases capacity, especially when the flows of buses and right-turning carsare similar. Tandem sorting increases capacity even more, especially in instances when theflows of buses and right-turning cars are unbalanced. This happens because the tandemscheme makes full use of all lanes, as long as there is sufficient demand. Though the 2-lanemodel is simplistic, it nonetheless illustrates the potential of tandem sorting strategy toincrease intersection capacity. Generalizations are easy to study using similar logic; e.g. asin Section 7.2.
Figure 7.2. Capacity constraints for different sorting strategies when G ≤ 1/2.
In real-world settings, complications can arise to diminish the effectiveness of the tandemstrategy. For example, conflicts may arise between the last few through-moving buses to
41

discharge in the right lane and the first few right-turning cars in the left lane. To remedythis type of problem, the tandem strategy can be modified so that only one lane is operatedin tandem. Two ways of implementing these idea are shown in Figure 7.3(a). The capacityconstraints for these modified strategies are easily derived and are displayed in Figure 7.3(b).Note that the bounds in this figure fall between those of the standard tandem strategy andthose of the side-by-side operation with no conflicts (see again Figure 7.2). The type ofmodification should be based on the relative demand for the two vehicle classes: example 1if there are more through-moving buses then right-turning cars, and example 2 otherwise.
(a) (b)
Figure 7.3. Modified tandem strategies. (a) Graphic illustrations; (b) capacity constraints.
7.2 A Proposed Design
We use the same site as in the case study of Chapter 6. The geometry of the approach isshown in the top half of Figure 7.4. It has three lanes: two for cars (lanes 1 and 2, plus a leftturn pocket) and one that is dedicated to buses (lane 3). The current regulation is that carsare only allowed to use the bus lane to turn right. However, bus demand is very low (about2 buses/minute) and the bus lane is underutilized even with the inclusion of right-turningcars, as proposed in Chapter 6, Figure 6.2(b). At the same time, demand for car traffic isvery heavy on the approach.
To increase capacity on the approach while still providing preferential treatment to buses,the pre-signal can also allow for through-moving cars on lane 3, as proposed in Xuan et al.(2010) for this site. In this proposed design, which is depicted on the bottom half of
Figure 7.4, the pre-signal displays two green phases: one for buses (only), the other for cars.
42

Figure 7.4. Geometry of the approach of our case study, status quo and proposal.
The lane markings differ from Figure 6.2(b) only in that through-moving cars are allowedto use lane 1 downstream of the pre-signal.
Design variables include: (a) the lane designations in the sorting area, (b) the durationof the pre-signal phases, (c) the offset between the pre-signal and the intersection signal, and(d) the physical length of the sorting area. These are described next.
(a) The lane designations in the sorting area allow through-moving cars in the bus lane, toavoid underutilizing that lane.
(b) The pre-signal phases should be long enough in duration to serve the bus demand (e.g.,allowing 10 seconds per bus). The pre-signal switches to the bus phase whenever abus arrives (which assumes that bus arrivals can be detected), to make sure buses arenever delayed by the pre-signal. The duration of the car phase should be capped suchthat all the cars and buses passing through the pre-signal during each cycle are able todischarge into the intersection without forming residual queues. The remaining timein the cycle, if any, is added to the bus phase duration.
(c) The offset between the pre-signal and the intersection signal is set to minimize the delayin the sorting area; i.e., so that the last car that discharges from the pre-signal duringits car phase can discharge into the intersection without delay.
(d) The length of the sorting area needs to be long enough to hold all the vehicles thatare to be discharged in one cycle, plus some buffer space for vehicle maneuvering. Forthe approach of interest, the length of the sorting area was calculated to be about 150
43

meters. A sorting area of this size easily fits within the block, which is more than 400meters long.
Since lane 1 is unaffected by the pre-signal, our capacity analysis can be confined to lanes2 and 3 (see again Figure 7.4). The derivations of the capacity constraints are similar tothose in Section 7.1, where distinct vehicle classes are characterized by their demand qct,qbt, qcr, qbr with the first subscript denoting mode (car or bus) and the second denotingmovement (through or right). Clearly, the capacity constraints for the status quo are
qct ≤ G, (lane 2) (7.4a)
qbt + qbr + qcr ≤ G. (lane 3) (7.4b)
Note that Equation 7.4b is not binding here because the bus lane is underutilized.
Consideration also shows that the capacity constraints with a pre-signal are
qbt + qbr + qcr ≤ G, (lane 3 is underutilized) (7.5a)
qct + (qbt + qbr + qcr) ≤ 2G, (lanes 2 and 3 at the intersection) (7.5b)
(qbt + qbr) + (qct + qcr) ≤ 1. (lanes 2 and 3 at the pre-signal) (7.5c)
Note that Equation 7.5b assumes linear superposition. Also note that in this case only thisequation is binding because the bus lane is underutilized (Equation 7.5a not binding) andbecause G ≈ 0.3 < 1/2 (Equation 7.5c not binding).
7.3 Natural Experiment
Contrary to the regulation, drivers of through-moving cars frequently avail themselvesof the bus lane, in apparent attempts to reduce their own delays. This behavior is evenencouraged by the traffic police that are stationed at the intersection, as it increases the useof the bus lane. The outcome of this behavior mimics what would occur in a more organizedway, if lanes were designated in the sorting area as per the proposed tandem strategy, but thepre-signal was replaced by a yield sign for cars. This configuration would produce capacityconstraints identical to those in Equation 7.5, if the assumption of linear superposition holds.We thus have a natural experiment to test this assumption and to verify the benefits of usinga pre-signal.
The approach was videotaped during the evening peak on June 11, 2009. Vehicle countsare furnished by mode and by movement for 10 signal cycles in Table 7.1. Note that through-moving cars in lane 3, the bus lane, are in violation of the regulation, but would be legalunder the proposed system.
44

Table 7.1. Field observations
SignalCycle #
SignalCycleStartingTime
Lane #ThroughBusCounts
RightBusCounts
ThroughCarCounts
RightBusCounts
EffectiveGreenTime (sec)
1 5:54pm2 0 0 18 0 43
3 3 1 4 7 38
2 5:59pm2 0 0 19 0 41
3 4 1 8 4 44
3 6:05pm2 0 0 19 0 49
3 4 2 2 4 43 *
4 6:13pm2 0 0 23 0 49
3 5 1 4 7 53
5 6:16pm2 0 0 21 0 47
3 5 0 6 1 33 *
6 6:28pm2 0 0 25 0 54
3 3 1 8 6 52
7 6:30pm2 0 0 24 0 51
3 4 1 5 7 50
8 6:33pm2 0 0 20 0 57
3 8 0 3 11 57
9 6:36pm2 0 0 18 0 42
3 2 1 5 5 42
10 6:39pm2 0 0 20 0 49
3 4 1 9 5 49
* Lane became vacant before the end of green time.
45

The saturation flows estimated from the data for cars (1550 cars/hour/lane) and for buses(920 buses/hour/lane) were used to convert bus flows to car equivalent flows: 1550/920 =1.7 (cars/bus). Of further interest, the intersection signal’s effective green times (thereafterEGTs) for the approach were different in each cycle. This is because traffic (including cross-traffic) commonly entered the intersection even after its green times had ended. To makecomparisons, vehicle counts in each estimated EGT were proportionally adjusted using thesignal’s nominal EGT of 50 seconds.
Outcomes from this natural experiment were favorable, as revealed in Figure 7.5. Itso-shaped data points are the adjusted counts per cycle for the combination of: buses andright-turning cars in lane 3, and through-moving cars in both lanes 2 and 3; i.e., the countsconstrained by binding Equation 7.5b. The x-shaped data points are the same counts aftersubtracting the through-moving cars in lane 3 (which are only legal with the pre-signal).These counts should be constrained by binding Equation 7.4a. The o’s and x’s that corre-spond to the same cycle are connected by the lightly-drawn vertical lines.
Figure 7.5. Comparison of the natural experiment result versus theoretical capacity con-straints.
Note that the x’s cluster closely around the horizontal dashed line segment in Figure 7.5(corresponding to Equation 7.4a), indicating that the theoretical capacity constraints in theabsence of a pre-signal are reasonable descriptions of real-world conditions.
46

Table 7.2. Comparison of capacity among the status quo, bus lane enforcement alone, buslane enforcement as well as tandem sorting, and tandem sorting of both cars and buses
Capacity(vehi-cles/hour)
Status quo(100% asbaseline)
Bus laneenforcementalone
Bus lane en-forcement andtandem design(with 1 tandemlane)
Tandemsorting ofboth carsand buses
Morningpeak
1586(100%)
1405 (89%) 1568 (99%)1708(108%)
Eveningpeak
1145(100%)
1019 (89%) 1249 (109%)1389(121%)
Further note how the o’s fall either near or below the slanted solid line in the figure(corresponding to equation Equation 7.5b). This demonstrates that the theoretical capacityconstraint Equation 7.5b is nearly reached by a real traffic stream despite the lack of suitablelaws and organization. The two outliers well below the slanted line (cycles 3 and 5) areexplained by some drivers’ reluctance to use the bus lane illegally. Videos clearly show thatlane 3 (the bus lane) was vacant toward the end of the green phase in those cycles despitean abundance of through-moving cars on lane 2. This suggests that the use of a pre-signalwould reduce the lane 3 vacancies, producing a more perfect fit and supporting the linearsuperposition assumption.
The amount of capacity increase resulting from this proposal depends on how underuti-lized the bus lane is. Figure 7.5 shows that only about 2/3 of the green time for the buslane (lane 3) is used in our natural experiment. That translates into an capacity increase ofabout 140 vehicles/hour. This capacity increase is in addition to what can be achieved inChapter 6, because it comes from the bus lane. Table 7.2 shows the capacity that can beachieved, if the proposed design in Chapter 6 also allow through-moving cars into the buslane through the pre-signal (termed “tandem sorting of both cars and buses” in the table).
Empirical evidence shows that with proper lane designations in the sorting area, thecapacity of a studied intersection could be significantly increased with the use of either amid-block yield sign or a pre-signal. The pre-signal would provide additional benefits overthe yield sign in at least two ways. First, signal control could bring safety benefits comparedwith yield signs, because the chance for drivers to run red lights might be smaller than thechance that drivers fail to yield. Second, when congestion is heavy, left-turning buses havedifficulty weaving through car traffic toward the approach’s left turn pocket.
Of further note, the traffic demand of distinct vehicle classes in this case study is relatively
47

stable, and thus justifies a fixed lane designation. If traffic demand were to be more volatile,dynamic lane designations could be considered.
48

Chapter 8
Conclusion and Future Work
8.1 Conclusion
The dissertation proposes a new “tandem design” to organize traffic and increase flowcapacity at signalized intersections. In the tandem design, a mid-block pre-signal is used tosort left-turning vehicles (LVs) and through-moving vehicles (TVs) in tandem, rather thanside by side in the conventional design. For intersections with separate through and left-turnphases, the tandem design outperforms a conventional system because more lanes can beused to discharge traffic during at least one of the phases.
The extra capacity that can be achieved by the tandem design is evaluated. If thesaturation headway is deterministic, the capacity can be as large as if there were no leftturns. Even when saturation headway is modeled stochastically, the tandem design canstill increase capacity by 10% to 20%, even if only one lane is rearranged in tandem. Thedissertation also examines the spatial requirements for the proposed design. It is found thatto fully realize the capacity benefit, the block length would have to be very long. However,modifications to the tandem design (e.g., swapping phases at the intersection signal) canreduce the length requirement and make the design more feasible. After discussing someoperational issues, a case study conducted at a signalized intersection in the city of Chengdu,China, is presented. The case study shows that the tandem design, together with bus laneenforcement, can be used to benefit both cars and buses.
The idea of tandem sorting with pre-signals is then used to increase the capacity ofintersections with multimodal traffic. One critical assumption of the capacity formulationis that the time it takes to discharge a mixture of vehicle classes equals the sum of thetimes that it would take to discharge the vehicle classes separately. A natural experimentis conducted to verify this assumption. The natural experiment confirms the validity of
49

the assumption and it also illustrates the effectiveness of tandem sorting with pre-signals toincrease intersection capacity.
8.2 Future Work
The ideas of using pre-signals to increase intersection capacity deserves further study.Possible directions for future research are:
(a) For any new design like the tandem design proposed in this dissertation, the most chal-lenging question is to confirm how drivers would react to it. The question is challengingbecause human drivers are too complicated to model. This issue is partially addressedin Sections 5.2 and 5.3, but the discussion is far from enough from an application pointof view. More analysis and field experiments are needed.
(b) The study in this dissertation is limited to a single signalized intersection. Althoughthis is a necessary first step, further study to extend the ideas to the network levelseems worthwhile.
(c) The dissertation only briefly illustrates how the idea of tandem sorting with pre-signalscan be applied to increase the capacity of intersections with cars and buses. However,the situation with cars and buses have not been thoroughly studied yet; e.g., it isunclear what is the best thing to do with cars and buses when intersections have twoseparate green phases. Furthermore, there are generally more modes of transport atintersections, like bicycles and pedestrians. The effect of pre-signals on these modesshould also be studied.
From the policy point of view, safety is usually the first priority with intersection de-sign/redesign. Therefore, some measure of safety of the proposed tandem design needs to bestudied before idea is tested in the field. The tandem design will induce more lane changesso that vehicles get sorted. But also, there will be less interaction between buses and cars.Whether there will be safety problems in this situation needs to be studied.
50

Bibliography
Al-Salman, H. S. T., & Salter, R. J. 1974. The Control of Right Turning Vehicles at SignalControlled Intersections. Traffic Engineering & Control, 15(15), 683–686.
Allsop, R. E. 1972. Estimating the Traffic Capacity of a Signalized Road Junction. Trans-portation Research, 6(3), 245–255.
Braess, D. 1968. ber ein Paradoxon aus der Verkehrsplanung. Unternehmensforschung, 12,258–268.
Braess, D., Nagurney, A., & Wakolbinger, T. 2005. On a paradox of traffic planning. Trans-portation Science, 39(4), 446–450.
Federal Highway Administration. 2007. Traffic Analysis Toolbox Volume IV: Guidelines forApplying CORSIM Microsimulation Modeling Software. Tech. rept. FHWA-HOP-07-079.Department of Transportation.
Federal Highway Administration. 2009. Manual on Uniform Traffic Control Devices. Tech.rept. June. Washington D.C.
Gallivan, S., & Heydecker, B. G. 1988. Optimising the Control Performance of Traffic Signalsat a Single Junction. Transportation Research Part B, 22(5), 357–370.
Goldblatt, Reuben, Mier, Francisco, & Friedman, Joel. 1994. Continuous Flow Intersection.Institute of Transportation Engineers Journal, 64(7), 35–42.
Greenough, J., & Kelman, L. 1999 (8-12 November). ITS technology meeting municipalneeds C the Toronto experience. In: 6th World Congress Conference on ITS.
Hansen, Mark, & Huang, Yuanlin. 1997. Road Supply and Traffic in California Urban Areas.Transportation Research Part A, 31(3), 205–218.
Heys, C. J. J. M., & Vrefeveld, G. 1983. Legal Framework for Cycle Facility: Waiting Lanefor Moped Riders and Cyclists (Juridisch kader voor fietsvoorziening: Opstelvak voor(brom)fietsers). Verkeerskunde, 34(4), 206–208.
Improta, G., & Cantarella, G. E. 1984. Control System Design for an Individual SignalizedJunction. Transportation Research Part B, 18(2), 147–167.
51

Kuijper, D. H. 1982. The OFOS - a Description of the ’Expanded Waiting Lane for Cyclists’(De OFOS - een beschouwing over de opgeblazen fietsopstelstrook). Verkeerskunde, 33(9),472–476.
Litman, Todd. 2001. Generated Traffic: Implications for Transport Planning. ITE Journal,71(4), 38–47.
Lo, Hong K., & Chow, Andy H. F. 2004. Control Strategies for Oversaturated Traffic.Journal of Transportation Engineering, 130(4), 466–478.
Newell, G. F. 1989. Theory of Highway Traffic Signals. Tech. rept. Research Report, Instituteof Transportation Studies, University of California, Berkeley, UCB-ITS-RR-89-7. U.C.Berkeley.
Oakes, J., ThellMann, A. M., & Kelly, I. T. 1994. Innovative Bus Priority Measures. Proceed-ings of Seminar J, Traffic Management and Road Safety, 22nd PTRC European TransportSummer Annual Meeting, 381, 301–312.
Peck, C., Blanco, J., & Lopez, J. 1999. Learning from the user – next steps for ITACA’sadaptive control. Traffic Technology International, Annual Review, 155–158.
Rodegerdts, Lee A., Nevers, Brandon, & Robinson, Bruce. 2004. Signalized Intersections:Informational Guide. Tech. rept. FHWA-HRT-04-091. FHWA.
Salomons, W. 1985. Evaluation of CPVC-model OFOS in Enschede (Evaluatie CPVC-ofosin Enschede). Verkeerskunde, 36(7), 323–325.
Silcock, J. P. 1997. Designing Signal-controlled Junctions for Group-based operation. Trans-portation Research Part A, 31(2), 157–173.
Sirivadidurage, Sansaka Pradeep Kumara, Hounsell, Nick, & Cherrett, Tom. 2007. Evalu-ating Bus Priority and Queue Relocation Techniques of Presignals. Pages Paper 07–0495of: Transportation Research Board Annual Meeting 2007.
Sussman, J. 2000. What have we learned about intelligent transportation systems. Tech. rept.FHWA-OP-01-006. FHWA.
Texas Transportation Institute. 2010. 2010 Urban Mobility Report. Tech. rept. The TexasA&M University.
University of Maryland ATTAP. 2006. Unconventional Arterial Intersection Design.
Webster, F. V. 1958. Traffic Signal Settings. Tech. rept. Road Research Lab Technical PaperNo. 39.
Wheeler, A. H. 1995. Advanced Stop-Lines for Cyclists - a Simplified Layout. TrafficEngineering & Control, 36(5), 283–289.
52

Wheeler, A. H., Leicester, M. A. A., & Underwood, G. 1993. Advanced Stop-Lines forCyclists. Traffic Engineering & Control, 34(2), 54–60. ID: 61.
Wong, C. K., & Wong, S. C. 2003. Lane-based Optimization of Signal Timings for IsolatedJunctions. Transportation Research Part B, 37(1), 63–84.
Wu, Jianping, & Hounsell, Nick. 1998. Bus Priority Using Pre-signals. TransportationResearch Part A, 32(8), 563–583.
Xuan, Yiguang, Li, Yuwei, Daganzo, Carlos F., & Cassidy, Michael J. 2010. Improving Flowsof Buses and Cars through an Intersection by Enforcing Bus-Only Lane and IncreasingCar Flow Capacity with Pre-signal. Tech. rept. Volvo Technical Report.
53