Embed Size (px)
Citation preview
TTrriippllee LLeefftt--TTuurrnn LLaanneess
AAtt SSiiggnnaalliizzeedd IInntteerrsseeccttiioonnss
Final Report
Prepared For The Florida Department of Transportation
By The University of Florida
Transportation Research Center And Florida International University
Lehman Center for Transportation Research
December 2002
Technical Report Documentation Page
1. Report No. 2. Government Accession No. 3. Recipient's Catalog No.
4. Title and Subtitle 5. Report Date
December 2002 6. Performing Organization Code
Triple Left Turn Lanes At Signalized Intersections
8. Performing Organization Report No.7. Author(s)
K. Courage, B Stephens, A. Gan , M. Willis 9. Performing Organization Name and Address 10. Work Unit No. (TRAIS)
11. Contract or Grant No.
University of Florida Department of Civil and Coastal Engineering 124 Yon Hall / P.O. Box 116580 Gainesville, FL 32611-6580
13. Type of Report and Period Covered12. Sponsoring Agency Name and Address
Final
14. Sponsoring Agency Code
Florida Department of Transportation Research Management Center 605 Suwannee Street, MS 30 Tallahassee, FL 32301-8064
15. Supplementary Notes
Prepared in cooperation with Florida International University and the Federal Highway Administration
16. Abstract The use of triple left turns is seen as a means to meet constantly increasing traffic demand at signalized intersections. Although triple left turns have been in use for a number of years and their operational benefits are documented, they are still considered a relatively new design alternative that many agencies are reluctant to approve. While some excellent guidelines appear in the literature, there are no universal standards that apply. The objectives of this project were to investigate the current usage of triple left turns from an operational, safety and modeling perspective and to develop guidelines for triple left-turn installations based on these findings. The project tasks included:
• Review of existing studies of, operational and safety studies, as well as guidelines used by other states for double and triple left turns.
• Conduct of operational analyses conducted to determine the capacity parameters of multiple left turn lanes. • Modeling of triple left turn lane operations with available intersection and arterial performance analysis software
products. • Assessment of the safety performance of triple left turns, identifying crash patterns with associated intersection features
and comparing the safety performance of triple and double left turn lane configurations • Development of recommended criteria for adding turn lanes and/or new construction that includes triple left turn lanes.
The results of these analyses suggested that triple left turns can produce substantial operational benefits, however an increase in crash rates was noted at some locations. It was also observed that existing traffic models do not treat triple left turns explicitly and can therefore only offer an approximation of their operation. The principal product of the study was a set of guidelines recommended for incorporation into the Florida Department of Transportation’s Traffic Engineering Manual.
17. Key Words 18. Distribution Statement
Triple left turn lanes, signalized intersections, intersection safety, intersection performance.
No restrictions. This document is available to the public through the National Technical Information Service, Springfield, VA, 22161
19 Security Classif. (of this report) 20.Security Classif. (of this page) 21.No. of Pages 22 Price
Unclassified Unclassified 175
Form DOTF 1700.7 (8-72) Reproduction of completed form authorized
Acknowledgements
The project described in this report was carried out for the Florida Department ofTransportation (FDOT) by the University of Florida Transportation Research Center incooperation with the Lehman Center for Transportation Research at Florida InternationalUniversity. The overall effort was coordinated By Prof. Ken Courage with significanttechnical support from Dr. Albert Gan, Mr. Burton Stephens and Dr. Morya Willis. TheFDOT technical coordinator was Liang Hsia, P.E. The research team acknowledges and appreciates the efforts of FDOT Districts 4 and 6 inproviding data on crash experience at several intersections in South Florida.
Disclaimer
The opinions, findings and conclusions presented in this report are those of the authors
and not necessarily those of the Florida Department of Transportation or any other government agency
Guidelines for Triple Left-Turn Lanes at Signalized Intersections
Table of Contents Page i
Table of Contents
1. Introduction............................................................................................................. 1-1
1.1 Need for Guidelines ................................................................................................ 1-1 1.2 Project Objectives ................................................................................................... 1-2 1.3 Report Organization................................................................................................ 1-2 1.4 Current Usage of Triple Left-Turn Lanes in Florida .............................................. 1-2
2. Background and Literature Review ........................................................................ 2-1 2.1 Signalized Junction Flow Considerations............................................................... 2-1 2.2 Studies of Traffic Operations.................................................................................. 2-2
2.2.1 Double Left Turns................................................................................................... 2-2 2.2.2 Triple Left-Turn Lanes ......................................................................................... 2-10
2.3 Studies of Safety Considerations .......................................................................... 2-14 2.3.1 Double Left Turns................................................................................................. 2-14 2.3.2 Triple Left Turns................................................................................................... 2-14
2.4 Survey of State Departments of Transportation.................................................... 2-16 2.4.1 Kansas ................................................................................................................... 2-17 2.4.2 Kentucky............................................................................................................... 2-17 2.4.3 Maryland............................................................................................................... 2-17 2.4.4 Minnesota.............................................................................................................. 2-17 2.4.5 Mississippi ............................................................................................................ 2-18 2.4.6 Nebraska ............................................................................................................... 2-18 2.4.7 New Mexico.......................................................................................................... 2-18 2.4.8 New York.............................................................................................................. 2-18 2.4.9 Oklahoma.............................................................................................................. 2-19 2.4.10 Oregon................................................................................................................ 2-20 2.4.11 North Carolina ................................................................................................... 2-20 2.4.12 North Dakota...................................................................................................... 2-21 2.4.13 Pennsylvania ...................................................................................................... 2-21 2.4.14 South Carolina ................................................................................................... 2-21 2.4.15 South Dakota...................................................................................................... 2-22 2.4.16 Washington State ............................................................................................... 2-23 2.4.17 Virginia .............................................................................................................. 2-23 2.4.18 Wyoming............................................................................................................ 2-23 2.4.19 Others................................................................................................................. 2-23 2.4.20 Summary ............................................................................................................ 2-23
2.5 Application of Traffic Models .............................................................................. 2-24 2.5.1 CORSIM ............................................................................................................... 2-24 2.5.2 HCS....................................................................................................................... 2-25 2.5.3 SIDRA................................................................................................................... 2-25 2.5.4 TRANSYT-7F....................................................................................................... 2-25
3. Traffic Operations Studies ...................................................................................... 3-1 3.1 Specific Suggestions for Changes and Clarifications ............................................. 3-4 3.2 Trucks Traversing Intersections.............................................................................. 3-6 3.3 Determining Safety of Trucks at Intersections ....................................................... 3-7
Guidelines for Triple Left-Turn Lanes at Signalized Intersections
Table of Contents Page ii
4. Modeling of Triple Left Turns................................................................................ 4-1 4.1 Unique Features of Triple Left Turns ..................................................................... 4-1
4.1.1 Lane Utilization ...................................................................................................... 4-1 4.1.2 Effect of Large Trucks ............................................................................................ 4-1 4.1.3 Effect of the Turning Radius................................................................................... 4-2 4.1.4 Effect of the Angle of Intersection.......................................................................... 4-2 4.1.5 Upstream Lane Distribution.................................................................................... 4-3 4.1.6 Downstream Lanes Effects ..................................................................................... 4-3
4.2 Candidate Models ................................................................................................... 4-3 4.3 Evaluation Framework............................................................................................ 4-5 4.4 CORSIM Input Data ............................................................................................... 4-9 4.5 Summary of Studies Without Downstream Blockage ............................................ 4-9
4.5.2 Effect of Turning Radius ...................................................................................... 4-11 4.5.3 Angle of Intersection............................................................................................. 4-12 4.5.4 Turning Volume Distribution by Lane ................................................................. 4-12
4.6 Downstream Lane Reductions .............................................................................. 4-13 4.6.1 Previous Modeling Approaches and Criteria........................................................ 4-13 4.6.2 Candidate Criteria ................................................................................................. 4-13 4.6.3 Maintenance of Capacity as a Criterion................................................................ 4-15 4.6.4 Avoidance of Spillback as a Criterion .................................................................. 4-15 4.6.5 Other Downstream Effects.................................................................................... 4-17
4.7 Use of TRANSYT-7F to Assess Downstream Effects ......................................... 4-17 4.8 Conclusions and Recommendations ..................................................................... 4-18
5. Safety Analysis ....................................................................................................... 5-1 5.1 Condition and Collision Diagrams for Individual Sites.......................................... 5-1
5.1.1 SR 7 (US 441) and NW 7th Avenue (SR 826 Off Ramp) ....................................... 5-2 5.1.2 SR 90 (SW 8th Street) and SW 4th Avenue ........................................................... 5-6 5.1.3 SR 969 (NW 72nd Avenue) and NW 12th Street ................................................. 5-11 5.1.4 SR 878 and SR 5 (US 1) ....................................................................................... 5-15 5.1.5 SR 826 and SR A1A (Collins Avenue)................................................................. 5-19 5.1.6 SR 5 (Biscayne Boulevard) and NE 2nd Street .................................................... 5-24 5.1.7 SR 5 (Biscayne Boulevard) and NE 4th Street ..................................................... 5-28 5.1.8 SR 5 (Biscayne Boulevard) and SE 1st Street ...................................................... 5-32 5.1.9 SR 821 (Turnpike) and SR 838 (Sunrise Boulevard) ........................................... 5-36 5.1.10 SR 816 (Oakland Park Boulevard) and NW 50th Avenue ................................ 5-41 5.1.11 SR 821 (Turnpike) and SR 870 (Commercial Boulevard)................................. 5-48
5.2 Crash Experience of Overall Triple Left-Turn Intersections................................ 5-54 5.3 Crash Experience of Grouped Triple Left-Turn Intersections.............................. 5-55 5.4 Comparison of "T" Double and Triple Left-Turn Movements and Intersections.5-58
5.4.1 Comparison Based on Average Intersection Crash Rates..................................... 5-59 5.4.2 Comparison Based on Average Percentages of Crashes Involving Left-Turn Traffic
............................................................................................................................ 5-59 5.5 Other Factors That May Influence Safety of Multiple Left Turn Lanes............... 5-61
6. Overall Assessment................................................................................................. 6-1 6.1 General Observations.............................................................................................. 6-1 6.2 Existing Design Guidelines and Issues for Double Left Turns............................... 6-2
Guidelines for Triple Left-Turn Lanes at Signalized Intersections
Table of Contents Page iii
6.3 Existing Design Guidelines for Triple Left Turns .................................................. 6-2 6.4 Traffic Model Applications..................................................................................... 6-3 6.5 Additional Analysis Needed ................................................................................... 6-4 6.6 Recommended Modifications to the Traffic Engineering Manual ......................... 6-5
REFERENCES ........................................................................................................................... R-1 APPENDIX A – Traffic Data Collection and Analysis Methodology ....................................... A-1 APPENDIX B – Crash Summary Tables for Double Left-Turn Intersections........................... B-1

Guidelines for Triple Left-Turn Lanes at Signalized Intersections
Table of Contents Page iv
List of Figures Figure 2-1. Temporal Pattern of Traffic Flows at Signalized Intersection. ................................. 2-1 Figure 2-2. Proposed Triple Left-Turn Improvement (Belluccia 1996) .................................... 2-15 Figure 3-1. Summary Information From Analysis of Multiple Left-Turn Lane Site .................. 3-2 Figure 3-2. Service by Lane at Archer Road and SW 16th Avenue in Gainesville...................... 3-5 Figure 3-3. Start Delays and Saturation Flow Rates for Archer Road and SW 16th Avenue in
Gainesville .............................................................................................................. 3-5 Figure 3-4. Headway Variability for Different Vehicle Mixes.................................................... 3-8 Figure 4-1. Illustration of the Turning Paths for Three WB-40s Attempting to Make a Left Turn
Simultaneously........................................................................................................ 4-2 Figure 4-2. Example of a Star Network Display from CORSIM Animated Graphics ................ 4-6 Figure 4-3. Link-node Structures for CORSIM and TRANSYT-7F Star Networks ................... 4-8 Figure 4-4. Schematic Representation of a Triple Left Turn with Downstream Lane Reduction. 4-
9 Figure 4-5. Illustration of Capacity Estimation with CORSIM................................................. 4-10 Figure 4-6. Effect of Heavy Vehicle Proportions on the Approach Capacity ........................... 4-11 Figure 4-7. Average Overall Delay to All Vehicles as a Function of Merging Section Length
(Shen 2001)........................................................................................................... 4-14 Figure 4-8. Merging Section Capacity with Two and Three Lanes of Competing Traffic ....... 4-16 Figure 4-9. Visual Illustration of Spillback from CORSIM’s Animated Graphics ................... 4-17 Figure 4-10. Example Spyglass Spreadsheet Graph Illustrating the “Link Full” Flag Status of
Downstream Link.................................................................................................. 4-18 Figure 5-1. SR 7 (US 441) and NW 7th Avenue (SR 826 Off-Ramp) ......................................... 5-2 Figure 5-2. Condition Diagram for SR 7 (US 441) at NW 7th Avenue (SR 826 Off Ramp)...... 5-3 Figure 5-3. Collision Diagram for SR 7 (US 441) at NW 7th Avenue (SR 826 Off Ramp) ....... 5-4 Figure 5-4. SR 90 (SW 8th Street) and SW 4th Avenue ............................................................. 5-6 Figure 5-5. Condition Diagram for SR 90 (SW 8th Street) at SW 4th Avenue........................... 5-7 Figure 5-6. Collision Diagram for SR 90 (SW 8th Street) at SW 4th Avenue ............................ 5-8 Figure 5-7. SR 969 and NW 12th Street .................................................................................... 5-11 Figure 5-8. Condition Diagram for SR 969 (NW 72nd Avenue) at NW 12th Street ................ 5-12 Figure 5-9. Collision Diagram for SR 969 (NW 72nd Avenue) at NW 12th Street.................. 5-13 Figure 5-10. SR 878 and SR 5 (US 1) ....................................................................................... 5-15 Figure 5-11. Condition Diagram for SR 878 at SR 5 (US 1)..................................................... 5-16 Figure 5-12. Collision Diagram for SR 878 at SR 5 (US 1) ...................................................... 5-17 Figure 5-13. SR 826 and SR A1A (Collins Avenue)................................................................. 5-19 Figure 5-14. Condition Diagram for SR 826 at SR A1A (Collins Avenue) .............................. 5-20 Figure 5-15. Collision Diagram for SR 826 at SR A1A (Collins Avenue) ............................... 5-21 Figure 5-16. SR 5 (Biscayne Boulevard) at NE 2nd Street ....................................................... 5-24 Figure 5-17. Condition Diagram for SR 5 (Biscayne Boulevard) at NE 2nd Street.................. 5-25 Figure 5-18. Collision Diagram for SR 5 (Biscayne Boulevard) at NE 2nd Street ................... 5-26 Figure 5-19. SR 5 (Biscayne Boulevard) and NE 4th Street ..................................................... 5-28 Figure 5-20. Condition Diagram for SR 5 (Biscayne Boulevard) at NE 4th Street................... 5-29 Figure 5-21. Collision Diagram for SR 5 (Biscayne Boulevard) at NE 4th Street.................... 5-30 Figure 5-22. SR 5 (Biscayne Boulevard) and SE 1st Street ...................................................... 5-32 Figure 5-23. Condition Diagram for SR 5 (Biscayne Boulevard) at SE 1st Street.................... 5-33

Guidelines for Triple Left-Turn Lanes at Signalized Intersections
Table of Contents Page v
Figure 5-24. Collision Diagram for SR 5 (Biscayne Boulevard) at SE 1st Street ..................... 5-34 Figure 5-25. SR 821 (Turnpike Ramp Terminal) and SR 838 (Sunrise Boulevard) ................. 5-36 Figure 5-26. Condition Diagram for SR 821 (Turnpike Ramp Terminal) at SR 838 (Sunrise
Boulevard)............................................................................................................. 5-37 Figure 5-27. Collision Diagram for SR 821 (Turnpike Ramp Terminal) at SR 838 (Sunrise
Boulevard)............................................................................................................. 5-38 Figure 5-28. SR 860 (Oakland Park Boulevard) and NW 50th Avenue.................................... 5-41 Figure 5-29. Condition Diagram for SR 860 (Oakland Park Boulevard) at NW 50th Avenue.5-42 Figure 5-30. Collision Diagram for SR 860 (Oakland Park Boulevard) at NW 50th Avenue .. 5-43 Figure 5-31. SR 821 (Turnpike Ramp Terminal) and SR 870 (Commercial Boulevard).......... 5-48 Figure 5-32. Condition Diagram for SR 821 (Turnpike Ramp Terminal) at SR 870 (Commercial
Boulevard)............................................................................................................. 5-49 Figure 5-33. Collision Diagram for SR 821 (Turnpike Ramp Terminal) at SR 870 (Commercial
Boulevard)............................................................................................................. 5-50 Figure A-1. Multiple Left-Turn Site Selection Form.................................................................. A-2 Figure A-2. Weatherproof Camera ............................................................................................. A-3 Figure A-3. Weatherproof Bullet Camera .................................................................................. A-3 Figure A-4. Signal Interconnection Requirements for Recording .............................................. A-4 Figure A-5. Setup of Recording Equipment ............................................................................... A-5 Figure A-6. Summary of ETS Events for Multiple Left-Turn Operations ................................. A-6 Figure A-7. Sample Output from the MULTS Program............................................................. A-8 Figure A-8. Data Flow Diagram of Methodology ...................................................................... A-9 Figure A-9. Camera View of the Intersection of SR 40 and A1A............................................ A-10
Guidelines for Triple Left-Turn Lanes at Signalized Intersections
Table of Contents Page vi
List of Tables Table 2-1. Comparisons of Average Starting Delays, Headways and Flow Rates...................... 2-3 Table 2-2. Turn Lane Saturation Flows ....................................................................................... 2-3 Table 2-3. Double Left-Turn Saturation Flow as Calculated from the 1965 HCM Procedure ... 2-4 Table 2-4. Vehicles per Hour of Green – Loaded Cycles Only................................................... 2-5 Table 2-5. Average Straight-Through and Double Left-Turn Saturation Flows from Three Four-
Lane Approaches as Reported by Assmus................................................................. 2-5 Table 2-6. Straight-Through and Left-Turn Saturation Flow and Relative Efficiency Factors as
Reported by Kuzman ................................................................................................. 2-6 Table 2-7. 95% Confidence Intervals for Average Saturation Flows (vphgpl) by City .............. 2-7 Table 2-8. Capacity of a Single Left-Turn Lane Intersection Simulated as a Double Left-Turn
Lane Intersection........................................................................................................ 2-8 Table 2-9. Summary of Approach Data....................................................................................... 2-9 Table 2-10. Observed Saturation Flow Rates (Vphpgl) at Triple Left Turns........................... 2-12 Table 2-11. Signal Timing Characteristics of Triple Left Turns ............................................... 2-12 Table 2-12. Suggested Guidelines for Study and Design of Triple Left-Turn Improvements .. 2-16 Table 3-1. Summary of South Florida Triple Left-Turn Lane Data ............................................ 3-3 Table 3-2. Combined Saturation Flow Rates for Florida Intersections with Triple Left-Turn
Lanes .......................................................................................................................... 3-4 Table 3-3. Analysis of Variance for Weighted Volumes by Lane and Time of Day for SW 16th
Avenue and Archer Road, Gainesville....................................................................... 3-6 Table 4-1. Comparison of Traffic Model Characteristics and Features....................................... 4-4 Table 4-2. CORSIM Input Record Types with Potential Influence on Triple Left-Turn
Operations ................................................................................................................ 4-10 Table 5-1. Crash Summery Table for SR 7 (US 441) at NW 7th Avenue (SR 826 Off Ramp) .. 5-5 Table 5-2. Crash Summary Table for SR 90 (SW 8th Street) at SW 4th Avenue ....................... 5-9 Table 5-3. Crash Summary Table for SR 969 (NW 72nd Avenue) at NW 12th Street............. 5-14 Table 5-4. Crash Summary Table for SR 878 at SR 5 (US 1) ................................................... 5-18 Table 5-5. Crash Summary Table for SR 826 at SR A1A (Collins Avenue) ............................ 5-22 Table 5-6. Crash Summary Table for SR 5 (Biscayne Boulevard) at NE 2nd Street ................ 5-27 Table 5-7. Crash Summary Table for SR 5(Biscayne Boulevard) at NE 4th Street .................. 5-31 Table 5-8. Crash Summary Table for SR 5 (Biscayne Boulevard) at SE 1st Street .................. 5-35 Table 5-9. Crash Summary Table for SR 821 (Turnpike Ramp Terminal) at SR 838 (Sunrise
Boulevard)................................................................................................................ 5-39 Table 5-10. Crash Summary Table for SR 860 (Oakland Park Blvd) at NW 50th Avenue ...... 5-44 Table 5-11. Crash Summary Table for SR 821 (Turnpike Ramp Terminal) at SR 870
(Commercial Boulevard) ......................................................................................... 5-51 Table 5-12. Summary of Overall Crashes at Triple Left Turn Intersections ............................. 5-55 Table 5-13. Overall Crashes by Crash Severity at Triple Left-Turn Intersections.................... 5-55 Table 5-14. Summary of the Intersections Grouped by Intersection Characteristics ................ 5-56 Table 5-15. Summary of Crashes by Crash Type for Each Group ............................................ 5-57 Table 5-16. Overall Crashes by Crash Severity at Triple Left-Turn Intersections.................... 5-58 Table 5-17. Statistical Comparison of Average Intersection Crash Rates................................. 5-59 Table 5-18. Statistical Comparison of Percent of Crashes Involving Left-Turn Traffic ........... 5-60 Table 5-19. Crash Rates for Triple Left Turn Lanes ................................................................. 5-61
Guidelines for Triple Left-Turn Lanes at Signalized Intersections
Table of Contents Page vii
Table B-1. Crash Summary Table for SR 814 (Atlantic Blvd.) at SR 849................................. B-1 Table B-2. Crash Summary Table for SR 814 (Atlantic Blvd.) at I-95 NB Off Ramp .............. B-3 Table B-3. Crash Summary Table for SR 816 (Oakland Park Blvd.) at I-95 SB Off Ramp ...... B-6 Table B-4. Crash Summary Table for SR 834 (Sample Road) at Turnpike Off Ramp ............ B-10 Table B-5. Crash Summary Table for SR 820 (Pines Blvd.) at Turnpike Off Ramp ............... B-12 Table B-6. Crash Summary Table for SR 838 (Sunrise Blvd.) at I-95 SB Off Ramp.............. B-14 Table B-7. Crash Summary Table for SR 842 (Broward Blvd.) at I-95 NB Off Ramp ........... B-17 Table B-8. Crash Summary Table for SR 860 (Miami Garden Dr.) at I-95 NB Off Ramp ..... B-19 Table B-9. Crash Summary Table for SR 870 (Commercial Blvd.) at I-95 NB Off Ramp ..... B-20 Table B-10. Crash Summary Table for SR 870 (Commercial Blvd.) at I-95 SB Off Ramp .... B-22 Table B-11. Crash Summary Table for SR 90 (SW 8 Street) at Turnpike NB Off Ramp........ B-24 Table B-12. Crash Summary Table for SR 976 (Bird Road) at Turnpike SB Off Ramp ......... B-26 Table B-13. Crash Summary Table for SR 990 (SW 104 Street) at SR 874 (Don Shula
Expressway)......................................................................................................... B-27
Guidelines for Triple Left-Turn Lanes at Signalized Intersections
Introduction Page 1-1
1. INTRODUCTION
1.1 Need for Guidelines Increasing traffic demand on urban streets has resulted in higher left-turn volumes. This makes left turns more difficult because of the greater levels of opposing traffic. In Florida, strict access control policies have continued to reduce the number of median openings and traversable medians. These policies have shifted mid-block left-turn traffic to already congested downstream intersections. The increasing left-turn demands and decreasing left-turn opportunities point out the need for higher left-turn capacities. The use of triple left turns at signalized intersections is seen as a means to meet this need. A triple left turn allows three lanes of vehicles to perform a left-turn maneuver simultaneously during a signal phase. It increases intersection capacity by allowing a greater discharge of turning vehicles over a shorter period of time, yielding additional green time to other traffic movement within the intersection. A study of five triple left-turn sites in California by Leonard (1994) recorded an overall saturation flow rate of 1,928 vehicles per hour of green per lane (vphgpl). After adjusting the factors for lane width, heavy vehicle and left-turns, Leonard estimated an ideal saturation flow rate of 2,180 passenger cars per hour of green per lane (pcphgpl). This is a value significantly higher than the ideal saturation flow rate of 1,900 pcphgpl of the Highway Capacity Manual (HCM). A more recent Institute of Transportation Engineers (ITE) study of 17 triple left-turn sites from around the country recorded an average saturation flow rate of 1,830, about 5% higher than observed for double-left turn lanes. In addition to increasing intersection capacity, triple left turns also provide other potential benefits. For example, the installation of a triple left turn will result in a shorter left-turn queue, thus reducing the probability of blockage of through traffic due to turn-bay overflow. A short left-turn queue may also reduce the probability of left-turn vehicles conflicting with driveway vehicles. And finally, where two intersections are closely spaced, a shorter left-turn queue also means a lower probability of left-turn traffic spilling back into the upstream intersection. Although triple left turns have been in use for a number of years and their operational benefits are documented, they are still considered a relatively new design alternative that many agencies are reluctant to approve. Very few guidelines for the installation of triple left turns exist, leaving traffic engineers to rely on personal experience and double left-turn criteria for the design of these facilities. In 1994, Ackeret developed the only known design guidelines for triple left turns based on data from triple left turns in Las Vegas, Nevada.1
1 Ackeret’s design guidelines are summarized in detail in Chapter 2 of this report.
Guidelines for Triple Left-Turn Lanes at Signalized Intersections
Introduction Page 1-2
1.2 Project Objectives The objectives of this project are twofold. First, to investigate the current usage of triple left turns from an operational, safety and modeling perspective. Secondly, to develop guidelines for triple left-turn installations based on these findings. The guidelines will address the design needs pertaining to the installation and design of geometric and traffic control devices of triple left turns.
1.3 Report Organization This first chapter provides an overview of the project, organization of the report and addresses the major issues to be considered when implementing the use of triple left turn lanes at interchanges and major arterial intersections. Chapter 2 presents a review of existing studies of flow considerations, operational and safety studies, as well as guidelines used by other states for double and triple left turns. Chapter 3 describes in detail the data collection and reduction procedures for operational analyses conducted in this study. Chapter 4 documents the modeling of triple left turn lane operations with available intersection and arterial performance analysis software products. Chapter 5 documents the assessment of the safety performance of triple left turns, identifying crash patterns with associated intersection features and comparing the safety performance of triple and double left turn lane configurations. Chapter 6 provides an overall assessment and recommended criteria for adding turn lanes and/or new construction that includes triple left turn lanes.
1.4 Current Usage of Triple Left-Turn Lanes in Florida At the initiation of this project, the State of Florida had a total of 12 known intersections installed with a triple left turns. All but one of these was located in Dade and Broward Counties. The other one is located in Alachua County in the city of Gainesville. Over the course of this project, five new triple left turns have been added, while an existing triple left turn was converted to a double left turn to make room for another traffic movement at the intersection. While Florida appears to be increasing the number intersections installed with a triple left turn, there are no current guidelines in existence. This study provides the basis for such guidelines and suggests criteria for adding left hand turning lanes where they are warranted.
Guidelines for Triple Left-Turn Lanes at Signalized Intersections
Background and Literature Review Page 2-1
2. BACKGROUND AND LITERATURE REVIEW This chapter summarizes existing literature and design guidelines for double and triple left turns. It is divided into five major sections. The first section provides definitions to help interpret the results of operational studies. The second and third sections summarize findings from existing operational and safety studies, respectively. The fourth section summarizes information provided by state transportation departments about existing design guidelines and practices on double and triple left turns. The fifth and final section covers the application of computer-based performance estimation models to triple left turn operations.
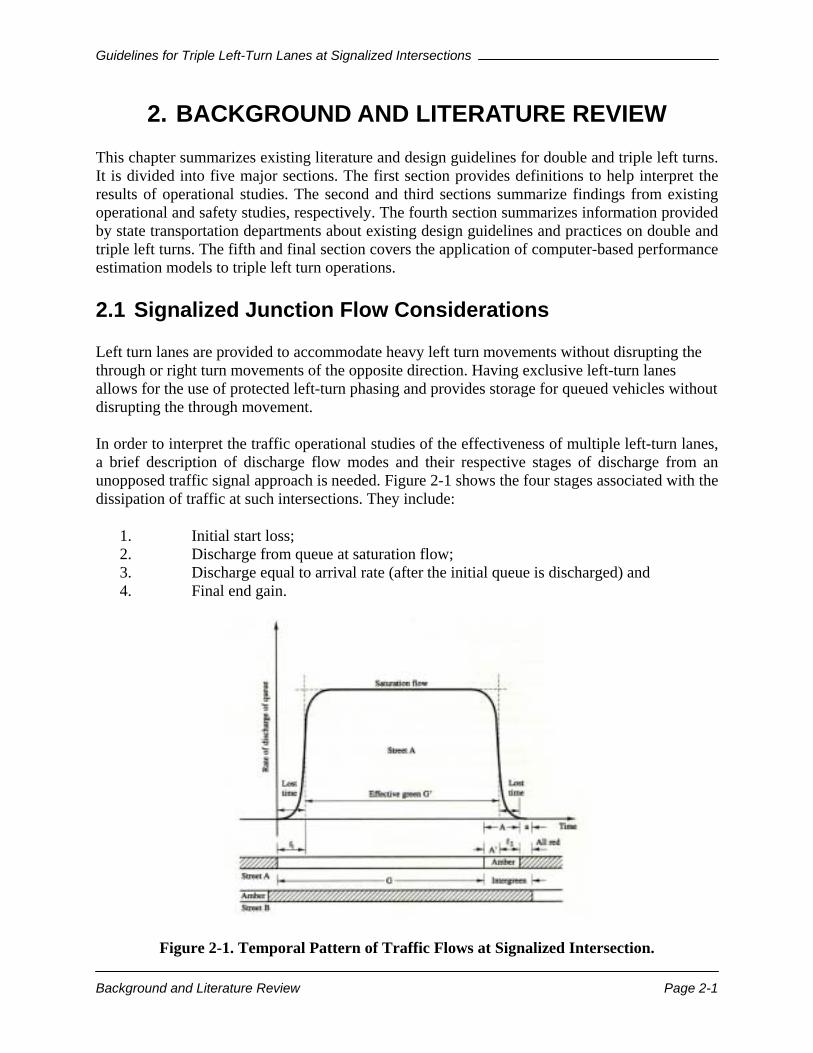
2.1 Signalized Junction Flow Considerations Left turn lanes are provided to accommodate heavy left turn movements without disrupting the through or right turn movements of the opposite direction. Having exclusive left-turn lanes allows for the use of protected left-turn phasing and provides storage for queued vehicles without disrupting the through movement. In order to interpret the traffic operational studies of the effectiveness of multiple left-turn lanes, a brief description of discharge flow modes and their respective stages of discharge from an unopposed traffic signal approach is needed. Figure 2-1 shows the four stages associated with the dissipation of traffic at such intersections. They include:
1. Initial start loss; 2. Discharge from queue at saturation flow; 3. Discharge equal to arrival rate (after the initial queue is discharged) and 4. Final end gain.
Figure 2-1. Temporal Pattern of Traffic Flows at Signalized Intersection.

Guidelines for Triple Left-Turn Lanes at Signalized Intersections
Background and Literature Review Page 2-2
The “Saturation Flow Rate” is calculated following the start loss (while the queue is present), vehicles discharge at maximum rate. The simple saturation flow rate = 3600 sec/average headway, after the 3rd discharged vehicle. Typical values are found to be about 1800 to 1900 for the types of intersections to be evaluated in this study, corresponding to time headways averaging 1.92 to 1.97 sec. More time is required for turns of long and heavy vehicle configurations.
Start loss and end gain are used to correct for the vehicle lags at the beginning of the green time and the continued movement of traffic after the signal turns to amber. The start loss (measured in seconds) is the equivalent loss in effective green time before approach discharges at saturation flow. Typically, saturation flow does not occur until the 3rd or 4th vehicle is discharged. Stability occurs in 2 to 3 seconds, but under certain conditions can take as much as 5 seconds or more. The end gain (also measured in seconds) is a gain in effective green arising from the fact that vehicles do not immediately stop. The end gain is usually 1 second longer than the start loss. The term “effective green” refers to the starting time a few seconds after the beginning of the displayed green when the first vehicle initiates movement until the amber signal light is illuminated.
2.2 Studies of Traffic Operations There have been a substantial number of operational studies of double left-turn lanes, but very few related to the operation of triple left-turn lanes. Studies of double left-turn operations are reviewed first, followed by the few available studies of triple left-turn lanes.
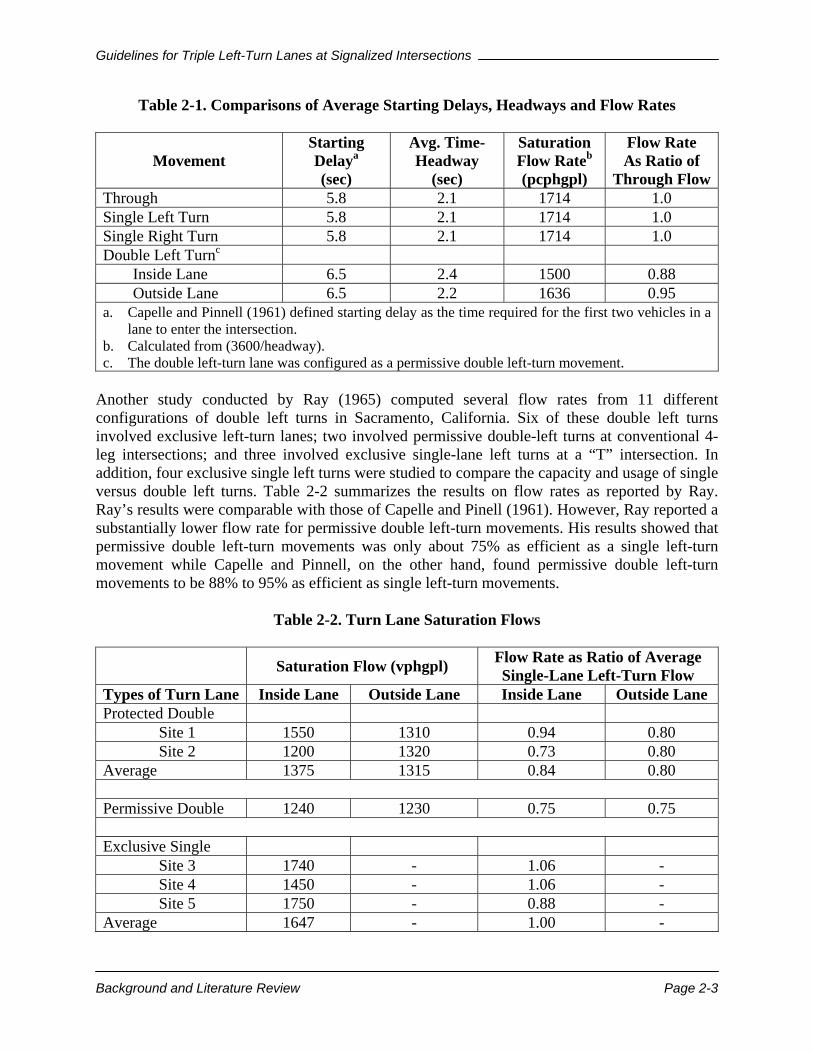
2.2.1 Double Left Turns Operational studies on double left-turns have focused on their efficiency in terms of saturation flow rates. One of the early studies by Capelle and Pinnell (1961) attempted to measure starting delays and departure headways of vehicles on six approaches of two signalized diamond interchanges on the Gulf Freeway in Houston, Texas. Table 2-1 presents a summary of the average starting delays, departure headways, and a comparison of the relative magnitudes of the flow rates corresponding to the reported departure headways. It was concluded from the table that there was no difference in the average capacity of straight-through and single-lane turning movements, and that the capacity of the inside and outside lane of the double left-turn movement was found to be only 88% and 95% of the capacity of straight-through, respectively. The difference in capacities was attributed to the tendency of the drivers in both lanes to stagger the position of their vehicles when making the left-turn movement.
Guidelines for Triple Left-Turn Lanes at Signalized Intersections
Background and Literature Review Page 2-3
Table 2-1. Comparisons of Average Starting Delays, Headways and Flow Rates
Movement
Starting Delaya
(sec)
Avg. Time- Headway
(sec)
Saturation Flow Rateb
(pcphgpl)
Flow Rate As Ratio of
Through FlowThrough 5.8 2.1 1714 1.0 Single Left Turn 5.8 2.1 1714 1.0 Single Right Turn 5.8 2.1 1714 1.0 Double Left Turnc
Inside Lane 6.5 2.4 1500 0.88 Outside Lane 6.5 2.2 1636 0.95
a. Capelle and Pinnell (1961) defined starting delay as the time required for the first two vehicles in a lane to enter the intersection.
b. Calculated from (3600/headway). c. The double left-turn lane was configured as a permissive double left-turn movement.
Another study conducted by Ray (1965) computed several flow rates from 11 different configurations of double left turns in Sacramento, California. Six of these double left turns involved exclusive left-turn lanes; two involved permissive double-left turns at conventional 4-leg intersections; and three involved exclusive single-lane left turns at a “T” intersection. In addition, four exclusive single left turns were studied to compare the capacity and usage of single versus double left turns. Table 2-2 summarizes the results on flow rates as reported by Ray. Ray’s results were comparable with those of Capelle and Pinell (1961). However, Ray reported a substantially lower flow rate for permissive double left-turn movements. His results showed that permissive double left-turn movements was only about 75% as efficient as a single left-turn movement while Capelle and Pinnell, on the other hand, found permissive double left-turn movements to be 88% to 95% as efficient as single left-turn movements.
Table 2-2. Turn Lane Saturation Flows
Saturation Flow (vphgpl) Flow Rate as Ratio of Average
Single-Lane Left-Turn Flow Types of Turn Lane Inside Lane Outside Lane Inside Lane Outside Lane Protected Double
Site 1 1550 1310 0.94 0.80 Site 2 1200 1320 0.73 0.80
Average 1375 1315 0.84 0.80
Permissive Double 1240 1230 0.75 0.75
Exclusive Single Site 3 1740 - 1.06 - Site 4 1450 - 1.06 - Site 5 1750 - 0.88 -
Average 1647 - 1.00 -

Guidelines for Triple Left-Turn Lanes at Signalized Intersections
Background and Literature Review Page 2-4
The 1965 Highway Capacity Manual developed a single general statement for the capacity of double left-turn movements. The 1965 HCM gives a maximum capacity of 1200 vphgpl (vehicles per hour of green time per lane) per ten feet of lane width for the case of separate turning lanes with separate signal control. For each additional turning lane, the additional lanes are assigned a service volume of 0.80 times that of the first lane. This efficiency factor is comparable to the 0.75 value reported by Ray. Saturation flow rates calculated from the procedures given in the 1965 HCM are summarized in Table 2-3. Table 2-3. Double Left-Turn Saturation Flow as Calculated from the 1965 HCM Procedure Saturation Flow (vphg)a
Lane Width Inside Lane Outside Lane Both Lanes 10 1200 960 2160 11 1320 1056 2376 12 1440 1152 2592
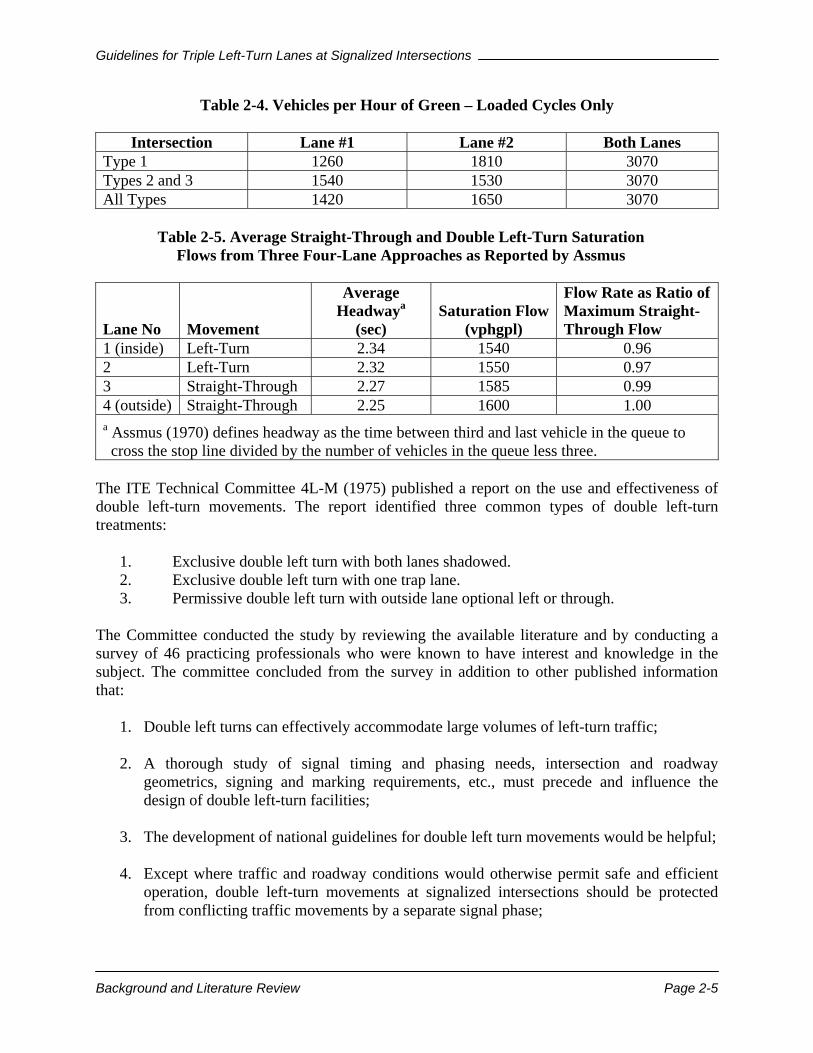
a Flow rates assume trucks constitute 5% of the turning volume Leisch (1967) presented a procedure for calculating the capacity of exclusive double left-turn lanes that was somewhat comparable to the method described by the 1965 HCM. The only exception was an additional correction made to account for the angle and lane width of the cross street. Leisch developed a series of nomographs to simplify the capacity analysis process. The calculation of the capacity of an exclusive double left-turn movement involves two basic steps. In the first step, the capacity of a single, exclusive turning lane with separate signal phasing is found by using the nomographs. For the case of exclusive double left-turn movements, the second lane is assigned a service volume 0.80 times that of the first lane. Thus, the capacity of a double left-turn movement is 1.8 times that of a single left-turn lane. In the second step, the capacity obtained in the first step is adjusted to account for the angle of turn and lane widths. Leisch found that the capacity of double left-turn movements was sensitive to the angle of the turn and the width of the receiving approach. Assmus (1970) conducted an operational study of seven intersections with double left-turn lanes. These intersections were grouped into three categories of similar geometry. Assmus adjusted the vehicle counts he observed by making one commercial vehicle equivalent to three passenger-car units. He also adjusted the starting delay and computed the adjusted average headway in seconds per vehicle. Assmus was able to determine the saturation flow in vehicles per hour of green for each of the intersection types. He further defines the intersection types as follows: (1) Type 1 installations are fully shadowed configurations and are used mainly to handle moderate turning volumes with a very short green phases, and (2) Types 2 and 3 are installations with only one left-turn trap lane with either an exclusive left or left-through shared lane. Both are used to handle very large turning volumes. From this study, Assmus concluded that the total saturation flow of both lanes is independent of the type of intersection. Table 2-4 shows the results of this study. Table 2-5 summarizes the average headways and corresponding saturation flows reported by Assmus for three four-lane approaches with Types 2 and 3 double left-turn movements.
Guidelines for Triple Left-Turn Lanes at Signalized Intersections
Background and Literature Review Page 2-5
Table 2-4. Vehicles per Hour of Green – Loaded Cycles Only
Intersection Lane #1 Lane #2 Both Lanes Type 1 1260 1810 3070 Types 2 and 3 1540 1530 3070 All Types 1420 1650 3070
Table 2-5. Average Straight-Through and Double Left-Turn Saturation
Flows from Three Four-Lane Approaches as Reported by Assmus
Lane No Movement
Average Headwaya
(sec) Saturation Flow
(vphgpl)
Flow Rate as Ratio of Maximum Straight-Through Flow
1 (inside) Left-Turn 2.34 1540 0.96 2 Left-Turn 2.32 1550 0.97 3 Straight-Through 2.27 1585 0.99 4 (outside) Straight-Through 2.25 1600 1.00 a Assmus (1970) defines headway as the time between third and last vehicle in the queue to cross the stop line divided by the number of vehicles in the queue less three.
The ITE Technical Committee 4L-M (1975) published a report on the use and effectiveness of double left-turn movements. The report identified three common types of double left-turn treatments:
1. Exclusive double left turn with both lanes shadowed. 2. Exclusive double left turn with one trap lane. 3. Permissive double left turn with outside lane optional left or through.
The Committee conducted the study by reviewing the available literature and by conducting a survey of 46 practicing professionals who were known to have interest and knowledge in the subject. The committee concluded from the survey in addition to other published information that:
1. Double left turns can effectively accommodate large volumes of left-turn traffic; 2. A thorough study of signal timing and phasing needs, intersection and roadway
geometrics, signing and marking requirements, etc., must precede and influence the design of double left-turn facilities;
3. The development of national guidelines for double left turn movements would be helpful; 4. Except where traffic and roadway conditions would otherwise permit safe and efficient
operation, double left-turn movements at signalized intersections should be protected from conflicting traffic movements by a separate signal phase;
Guidelines for Triple Left-Turn Lanes at Signalized Intersections
Background and Literature Review Page 2-6
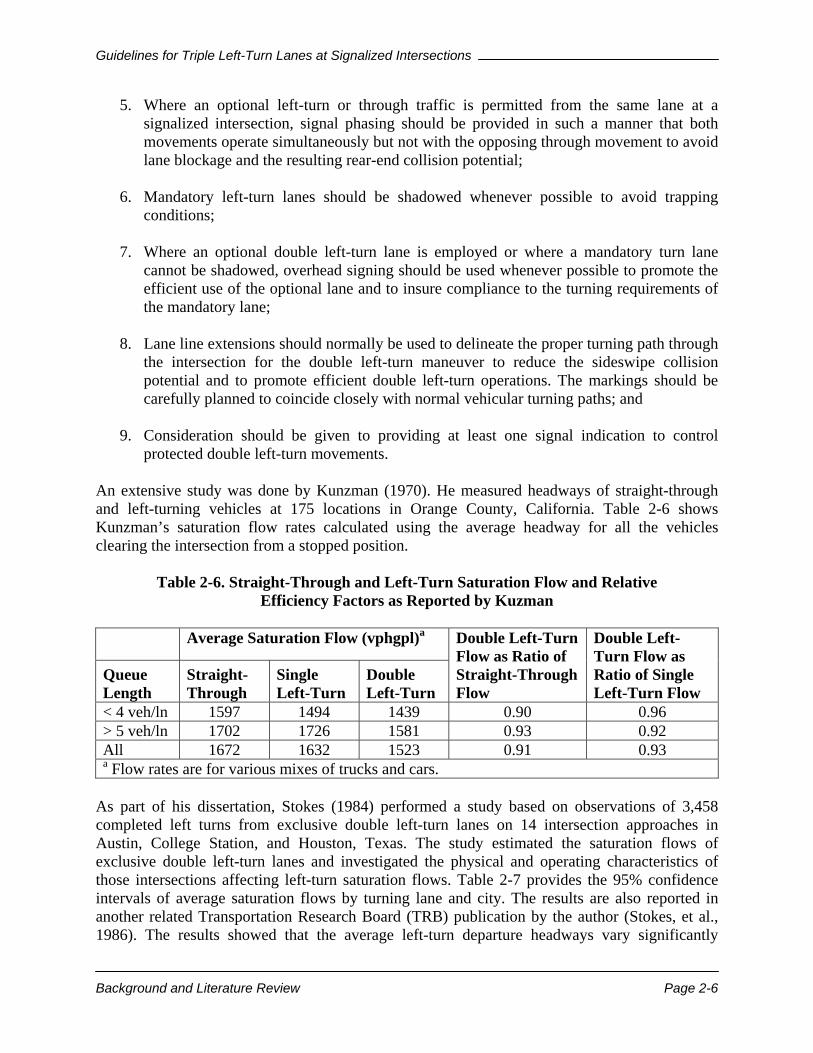
5. Where an optional left-turn or through traffic is permitted from the same lane at a signalized intersection, signal phasing should be provided in such a manner that both movements operate simultaneously but not with the opposing through movement to avoid lane blockage and the resulting rear-end collision potential;
6. Mandatory left-turn lanes should be shadowed whenever possible to avoid trapping conditions;
7. Where an optional double left-turn lane is employed or where a mandatory turn lane cannot be shadowed, overhead signing should be used whenever possible to promote the efficient use of the optional lane and to insure compliance to the turning requirements of the mandatory lane;
8. Lane line extensions should normally be used to delineate the proper turning path through the intersection for the double left-turn maneuver to reduce the sideswipe collision potential and to promote efficient double left-turn operations. The markings should be carefully planned to coincide closely with normal vehicular turning paths; and
9. Consideration should be given to providing at least one signal indication to control protected double left-turn movements.
An extensive study was done by Kunzman (1970). He measured headways of straight-through and left-turning vehicles at 175 locations in Orange County, California. Table 2-6 shows Kunzman’s saturation flow rates calculated using the average headway for all the vehicles clearing the intersection from a stopped position.
Table 2-6. Straight-Through and Left-Turn Saturation Flow and Relative Efficiency Factors as Reported by Kuzman
Average Saturation Flow (vphgpl)a
Queue Length
Straight- Through
Single Left-Turn
Double Left-Turn
Double Left-Turn Flow as Ratio of Straight-Through Flow
Double Left-Turn Flow as Ratio of Single Left-Turn Flow
< 4 veh/ln 1597 1494 1439 0.90 0.96 > 5 veh/ln 1702 1726 1581 0.93 0.92 All 1672 1632 1523 0.91 0.93 a Flow rates are for various mixes of trucks and cars.
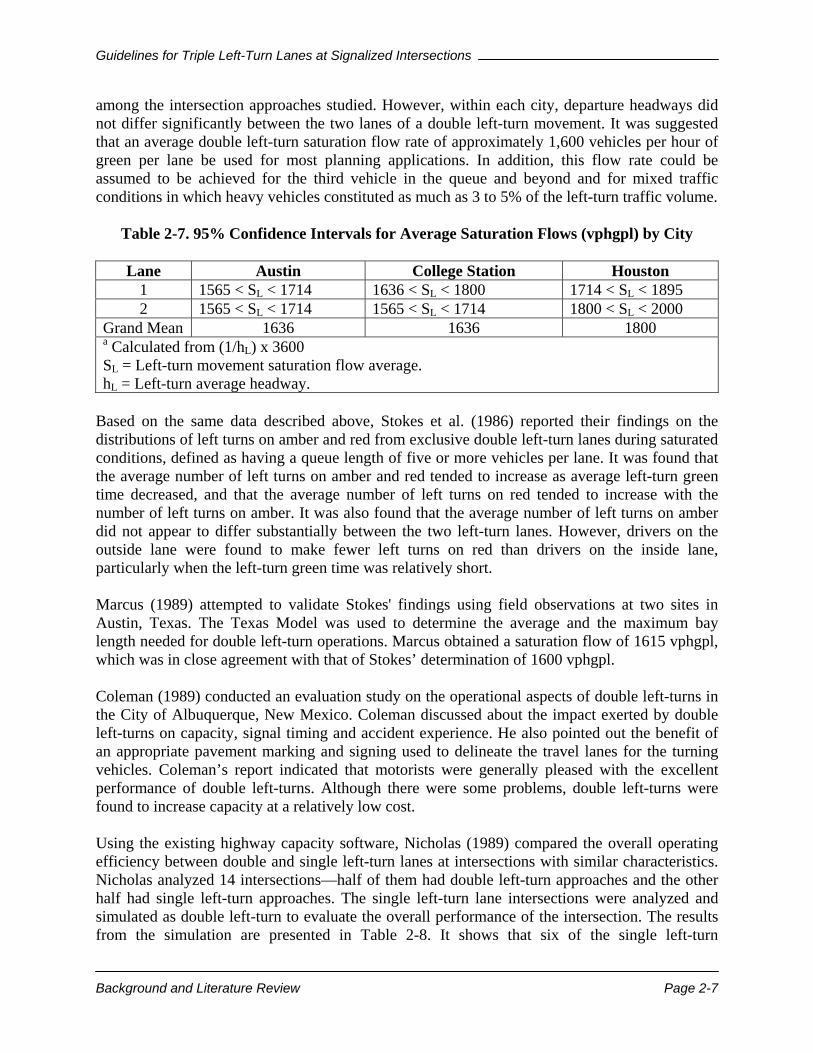
As part of his dissertation, Stokes (1984) performed a study based on observations of 3,458 completed left turns from exclusive double left-turn lanes on 14 intersection approaches in Austin, College Station, and Houston, Texas. The study estimated the saturation flows of exclusive double left-turn lanes and investigated the physical and operating characteristics of those intersections affecting left-turn saturation flows. Table 2-7 provides the 95% confidence intervals of average saturation flows by turning lane and city. The results are also reported in another related Transportation Research Board (TRB) publication by the author (Stokes, et al., 1986). The results showed that the average left-turn departure headways vary significantly
Guidelines for Triple Left-Turn Lanes at Signalized Intersections
Background and Literature Review Page 2-7
among the intersection approaches studied. However, within each city, departure headways did not differ significantly between the two lanes of a double left-turn movement. It was suggested that an average double left-turn saturation flow rate of approximately 1,600 vehicles per hour of green per lane be used for most planning applications. In addition, this flow rate could be assumed to be achieved for the third vehicle in the queue and beyond and for mixed traffic conditions in which heavy vehicles constituted as much as 3 to 5% of the left-turn traffic volume.
Table 2-7. 95% Confidence Intervals for Average Saturation Flows (vphgpl) by City
Lane Austin College Station Houston 1 1565 < SL < 1714 1636 < SL < 1800 1714 < SL < 1895 2 1565 < SL < 1714 1565 < SL < 1714 1800 < SL < 2000
Grand Mean 1636 1636 1800 a Calculated from (1/hL) x 3600 SL = Left-turn movement saturation flow average. hL = Left-turn average headway.
Based on the same data described above, Stokes et al. (1986) reported their findings on the distributions of left turns on amber and red from exclusive double left-turn lanes during saturated conditions, defined as having a queue length of five or more vehicles per lane. It was found that the average number of left turns on amber and red tended to increase as average left-turn green time decreased, and that the average number of left turns on red tended to increase with the number of left turns on amber. It was also found that the average number of left turns on amber did not appear to differ substantially between the two left-turn lanes. However, drivers on the outside lane were found to make fewer left turns on red than drivers on the inside lane, particularly when the left-turn green time was relatively short. Marcus (1989) attempted to validate Stokes' findings using field observations at two sites in Austin, Texas. The Texas Model was used to determine the average and the maximum bay length needed for double left-turn operations. Marcus obtained a saturation flow of 1615 vphgpl, which was in close agreement with that of Stokes’ determination of 1600 vphgpl. Coleman (1989) conducted an evaluation study on the operational aspects of double left-turns in the City of Albuquerque, New Mexico. Coleman discussed about the impact exerted by double left-turns on capacity, signal timing and accident experience. He also pointed out the benefit of an appropriate pavement marking and signing used to delineate the travel lanes for the turning vehicles. Coleman’s report indicated that motorists were generally pleased with the excellent performance of double left-turns. Although there were some problems, double left-turns were found to increase capacity at a relatively low cost. Using the existing highway capacity software, Nicholas (1989) compared the overall operating efficiency between double and single left-turn lanes at intersections with similar characteristics. Nicholas analyzed 14 intersections—half of them had double left-turn approaches and the other half had single left-turn approaches. The single left-turn lane intersections were analyzed and simulated as double left-turn to evaluate the overall performance of the intersection. The results from the simulation are presented in Table 2-8. It shows that six of the single left-turn

Guidelines for Triple Left-Turn Lanes at Signalized Intersections
Background and Literature Review Page 2-8
intersections experienced an amount of delay classified under a “failed” level of service. When these approaches were simulated as double left turns, four of the seven intersections improved to a functioning level of service. Under simulated double left-turns conditions, overall vehicular throughput was raised by 17.5%. Through his observations, Nicholas determined that the use of double left-turn lanes at intersections containing high volumes of left-turning traffic and opposing traffic was favorable.
Table 2-8. Capacity of a Single Left-Turn Lane Intersection Simulated as a Double Left-Turn Lane Intersection
Existing
Single Left Intersection
Total Delay
(sec/veh) v/c LOS
Double Left Simulation Total Delay v/c LOS
1 39.8 0.961 D 37.8 0.818 D 2 * 1.011 * 27.9 0.813 D 3 * 1.240 * * 1.092 * 4 * 1.148 * 39.5 0.988 D 5 * 1.159 * 56.8 1.150 E 6 * 1.857 * * 1.620 * 7 * 0.209 * 22.2* 0.878 D
* Intersection fails to operate at an acceptable level of service The ITE Technical Council Committee 5P-5 (1993) carried out a survey in which questionnaires were sent to a number of agencies and companies. Based on the data obtained by these sources, the Committee suggested that the HCM left-turn factor (fLT) of 0.92 may be relatively low; and a left-turn factor of 1.0 is more appropriate for at least some intersection geometries. The HCM left-turn saturation flow rate is 1656 vphgpl while the Committee data suggested a saturation flow rate on the order of 1950 vphgpl. It was also found that the distance between opposing left-turn flows was one of the most consistently related to fLT and saturation flow. Other variables that may affect saturation flows are as follows:
1. Length of the left-turn bay; 2. Radius of turn; 3. Type of lane; and 4. Short bays.
The Committee concluded that additional research was needed to expand the scope and to improve the scientific basis of its work. Kagolanu and Szplett (1994) performed a study to estimate the saturation headways and lane distribution of the inside and outside double left-turn lanes. A total of 2735 data points was collected. The results showed a statistically significant difference in the saturation headways of inside and outside left-turn lanes at 95% confidence level. The results also showed that the left-turn lane use was 46% for the inside lane and 54% for the outside lane.
Guidelines for Triple Left-Turn Lanes at Signalized Intersections
Background and Literature Review Page 2-9
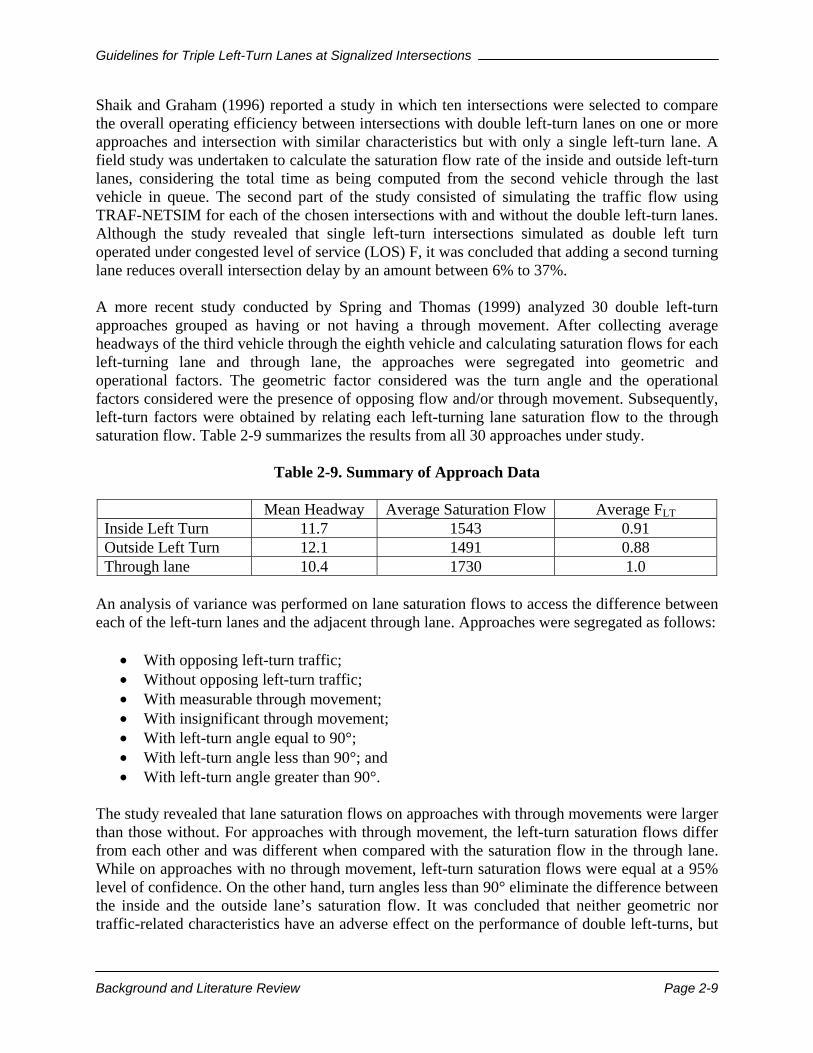
Shaik and Graham (1996) reported a study in which ten intersections were selected to compare the overall operating efficiency between intersections with double left-turn lanes on one or more approaches and intersection with similar characteristics but with only a single left-turn lane. A field study was undertaken to calculate the saturation flow rate of the inside and outside left-turn lanes, considering the total time as being computed from the second vehicle through the last vehicle in queue. The second part of the study consisted of simulating the traffic flow using TRAF-NETSIM for each of the chosen intersections with and without the double left-turn lanes. Although the study revealed that single left-turn intersections simulated as double left turn operated under congested level of service (LOS) F, it was concluded that adding a second turning lane reduces overall intersection delay by an amount between 6% to 37%. A more recent study conducted by Spring and Thomas (1999) analyzed 30 double left-turn approaches grouped as having or not having a through movement. After collecting average headways of the third vehicle through the eighth vehicle and calculating saturation flows for each left-turning lane and through lane, the approaches were segregated into geometric and operational factors. The geometric factor considered was the turn angle and the operational factors considered were the presence of opposing flow and/or through movement. Subsequently, left-turn factors were obtained by relating each left-turning lane saturation flow to the through saturation flow. Table 2-9 summarizes the results from all 30 approaches under study.
Table 2-9. Summary of Approach Data
Mean Headway Average Saturation Flow Average FLT Inside Left Turn 11.7 1543 0.91 Outside Left Turn 12.1 1491 0.88 Through lane 10.4 1730 1.0
An analysis of variance was performed on lane saturation flows to access the difference between each of the left-turn lanes and the adjacent through lane. Approaches were segregated as follows:
• With opposing left-turn traffic; • Without opposing left-turn traffic; • With measurable through movement; • With insignificant through movement; • With left-turn angle equal to 90°; • With left-turn angle less than 90°; and • With left-turn angle greater than 90°.
The study revealed that lane saturation flows on approaches with through movements were larger than those without. For approaches with through movement, the left-turn saturation flows differ from each other and was different when compared with the saturation flow in the through lane. While on approaches with no through movement, left-turn saturation flows were equal at a 95% level of confidence. On the other hand, turn angles less than 90° eliminate the difference between the inside and the outside lane’s saturation flow. It was concluded that neither geometric nor traffic-related characteristics have an adverse effect on the performance of double left-turns, but
Guidelines for Triple Left-Turn Lanes at Signalized Intersections
Background and Literature Review Page 2-10
rather the presence or absence of through and opposing traffic were key factors in their performance.
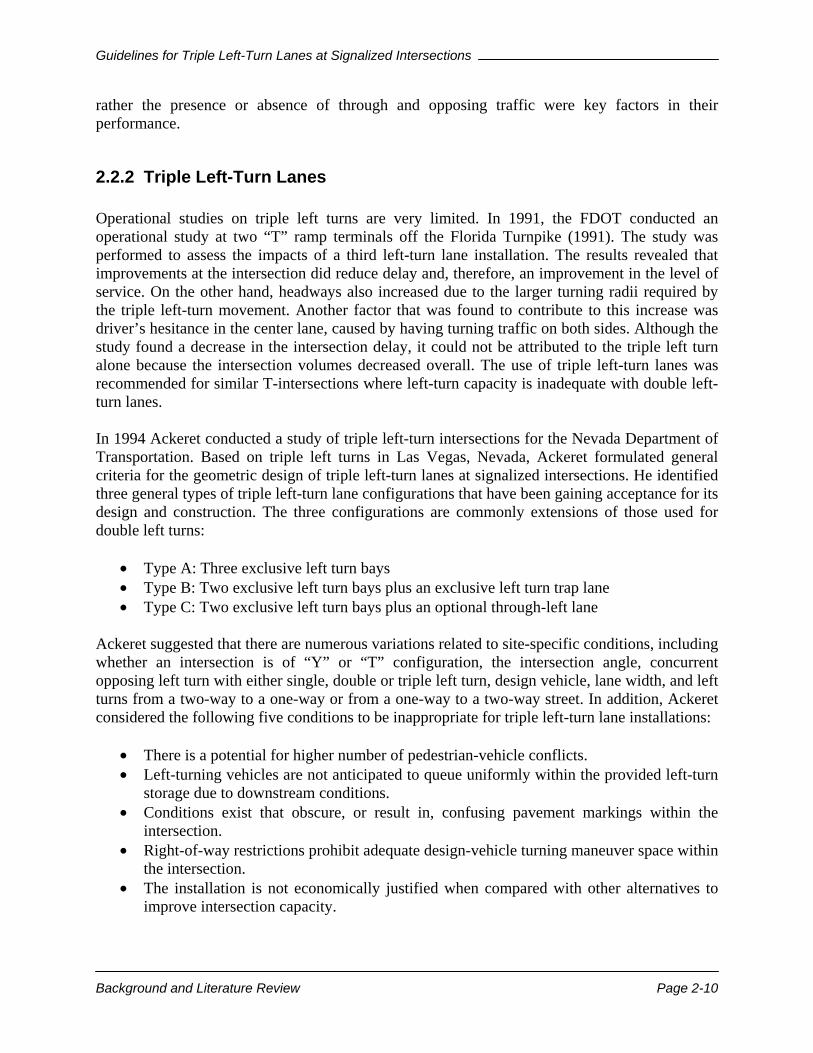
2.2.2 Triple Left-Turn Lanes Operational studies on triple left turns are very limited. In 1991, the FDOT conducted an operational study at two “T” ramp terminals off the Florida Turnpike (1991). The study was performed to assess the impacts of a third left-turn lane installation. The results revealed that improvements at the intersection did reduce delay and, therefore, an improvement in the level of service. On the other hand, headways also increased due to the larger turning radii required by the triple left-turn movement. Another factor that was found to contribute to this increase was driver’s hesitance in the center lane, caused by having turning traffic on both sides. Although the study found a decrease in the intersection delay, it could not be attributed to the triple left turn alone because the intersection volumes decreased overall. The use of triple left-turn lanes was recommended for similar T-intersections where left-turn capacity is inadequate with double left-turn lanes. In 1994 Ackeret conducted a study of triple left-turn intersections for the Nevada Department of Transportation. Based on triple left turns in Las Vegas, Nevada, Ackeret formulated general criteria for the geometric design of triple left-turn lanes at signalized intersections. He identified three general types of triple left-turn lane configurations that have been gaining acceptance for its design and construction. The three configurations are commonly extensions of those used for double left turns:
• Type A: Three exclusive left turn bays • Type B: Two exclusive left turn bays plus an exclusive left turn trap lane • Type C: Two exclusive left turn bays plus an optional through-left lane
Ackeret suggested that there are numerous variations related to site-specific conditions, including whether an intersection is of “Y” or “T” configuration, the intersection angle, concurrent opposing left turn with either single, double or triple left turn, design vehicle, lane width, and left turns from a two-way to a one-way or from a one-way to a two-way street. In addition, Ackeret considered the following five conditions to be inappropriate for triple left-turn lane installations:
• There is a potential for higher number of pedestrian-vehicle conflicts. • Left-turning vehicles are not anticipated to queue uniformly within the provided left-turn
storage due to downstream conditions. • Conditions exist that obscure, or result in, confusing pavement markings within the
intersection. • Right-of-way restrictions prohibit adequate design-vehicle turning maneuver space within
the intersection. • The installation is not economically justified when compared with other alternatives to
improve intersection capacity.
Guidelines for Triple Left-Turn Lanes at Signalized Intersections
Background and Literature Review Page 2-11
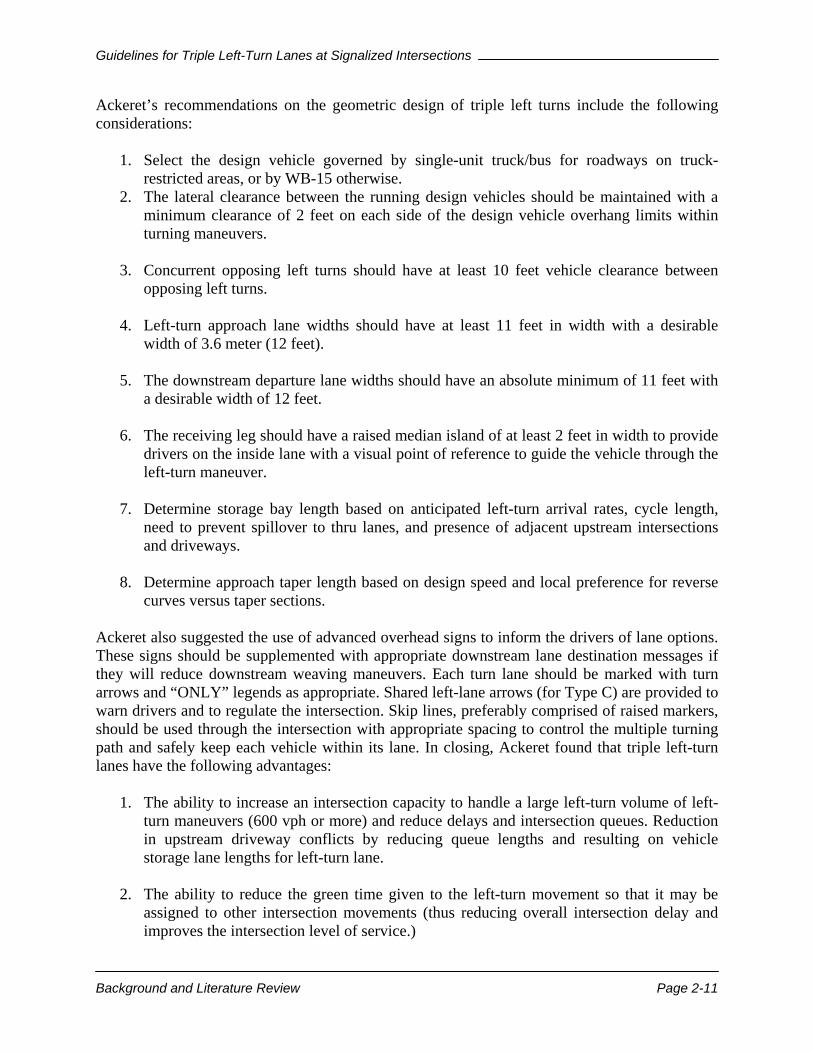
Ackeret’s recommendations on the geometric design of triple left turns include the following considerations:
1. Select the design vehicle governed by single-unit truck/bus for roadways on truck-restricted areas, or by WB-15 otherwise.
2. The lateral clearance between the running design vehicles should be maintained with a minimum clearance of 2 feet on each side of the design vehicle overhang limits within turning maneuvers.
3. Concurrent opposing left turns should have at least 10 feet vehicle clearance between
opposing left turns.
4. Left-turn approach lane widths should have at least 11 feet in width with a desirable width of 3.6 meter (12 feet).
5. The downstream departure lane widths should have an absolute minimum of 11 feet with
a desirable width of 12 feet.
6. The receiving leg should have a raised median island of at least 2 feet in width to provide drivers on the inside lane with a visual point of reference to guide the vehicle through the left-turn maneuver.
7. Determine storage bay length based on anticipated left-turn arrival rates, cycle length,
need to prevent spillover to thru lanes, and presence of adjacent upstream intersections and driveways.
8. Determine approach taper length based on design speed and local preference for reverse
curves versus taper sections. Ackeret also suggested the use of advanced overhead signs to inform the drivers of lane options. These signs should be supplemented with appropriate downstream lane destination messages if they will reduce downstream weaving maneuvers. Each turn lane should be marked with turn arrows and “ONLY” legends as appropriate. Shared left-lane arrows (for Type C) are provided to warn drivers and to regulate the intersection. Skip lines, preferably comprised of raised markers, should be used through the intersection with appropriate spacing to control the multiple turning path and safely keep each vehicle within its lane. In closing, Ackeret found that triple left-turn lanes have the following advantages:
1. The ability to increase an intersection capacity to handle a large left-turn volume of left-turn maneuvers (600 vph or more) and reduce delays and intersection queues. Reduction in upstream driveway conflicts by reducing queue lengths and resulting on vehicle storage lane lengths for left-turn lane.
2. The ability to reduce the green time given to the left-turn movement so that it may be
assigned to other intersection movements (thus reducing overall intersection delay and improves the intersection level of service.)

Guidelines for Triple Left-Turn Lanes at Signalized Intersections
Background and Literature Review Page 2-12
Ackeret concluded that additional research is necessary and further studies are strongly required to address safety concerns by comparing crashes between double and triple left-turn lane installations. Leonard (1994) conducted a study of five intersections with triple left turns in California. The objective was to document the associated operating characteristics such as flows of vehicles serviced by the turns, saturation flow rates, and various signal-timing characteristics. Manual saturation flow rates using electronic counter boards and queue discharge times for all vehicles by lane and by cycle were computed. Table 2-10 presents a summary of saturation flow rates computed at each site by lane and time of the day.
Table 2-10. Observed Saturation Flow Rates (Vphpgl) at Triple Left Turns
Sites Lane Time-of-Day Inner Middle Outer AM MD PM Total PCH/Dover 1938 1979 1894 1977 1908 - 1939 I5/LakeF 1888 1834 1913 - 1877 - 1877 PDV/LosAI 1954 1994 2005 - - 1989 1989 PCH/Jamb 1948 1954 1868 1992 1838 1888 1921 PCH/BaySi 2209 1655 1942 - - 1997 1997 All Sites 1946 1950 1891 1991 1856 1921 1928
Values computing using n-4 vehicles in queue (HCM suggested) The average saturation flow rate observed by this investigation was 1928 vphgpl. The ideal saturation flow rate assuming a 4% heavy truck volume was 2001 vphgpl using the HCM saturation flow rate adjustment procedure. Table 2-11 presents a summary of the signal timing characteristics of the sites. After processing the data it was found that the average flow for these triple left turns was 795 vehicles per hour (vph) although they received only an average of 19% of the total cycle time. The busy time, which represents that portion of the green time spend discharging queue, on average accounted for 57% of the cycle length. The study concluded by examining the influence of variables on the observed saturation flow rates using an analysis of variance. The results revealed no significant differences between saturation flow rates by site, among weekdays or by observer. Significant differences were observed among lanes (inner, middle, outer), the time of day, and by weekday versus weekend.
Table 2-11. Signal Timing Characteristics of Triple Left Turns
Site Name
Flow (vphgpl)
Sat Flow (vphgpl)
Green (sec)
Yellow (sec)
Cycle (sec)
Split (%)
Busy (%)
PCH/Dover 274 1939 21 3.3 100 21 65 I5/LakeF 382 1877 29 3.8 104 28 56 PDV/LosAI 298 1989 21 4.1 87 25 46 PCH/Jamb 253 1921 18 3.0 103 17 59 PCH/BaySi 188 1997 15 2.8 103 15 71 Totals 265 1928 19 3.2 101 18 57
Guidelines for Triple Left-Turn Lanes at Signalized Intersections
Background and Literature Review Page 2-13
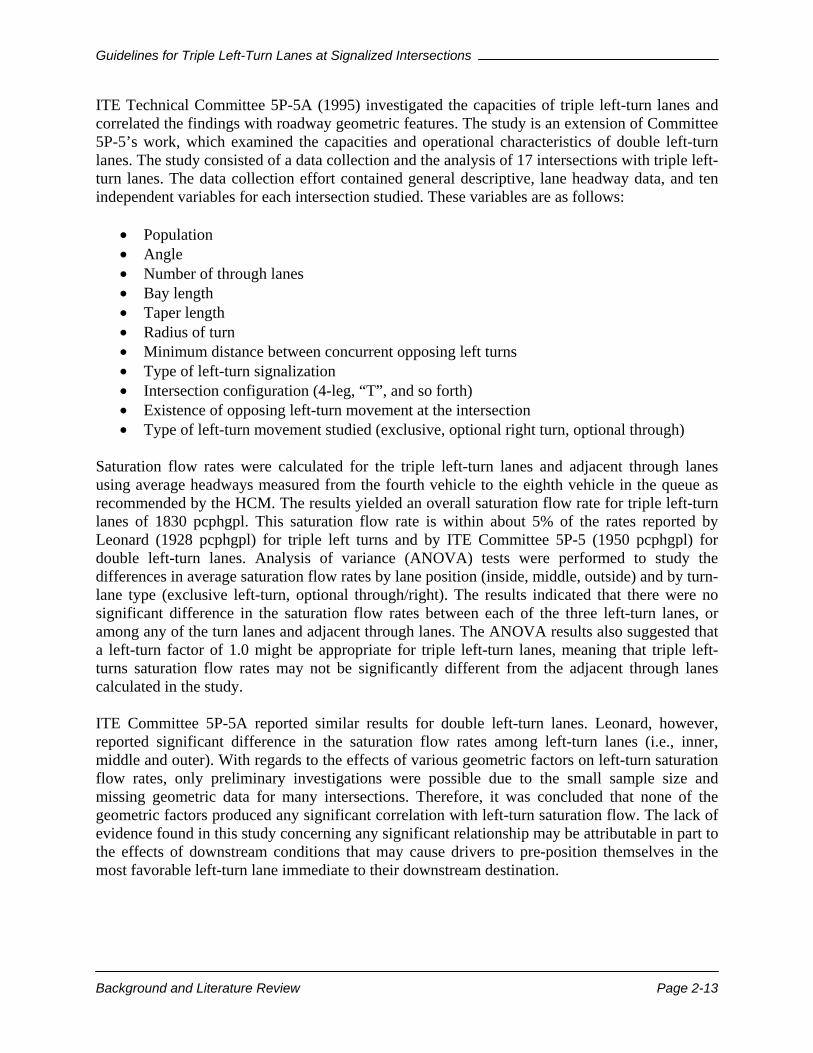
ITE Technical Committee 5P-5A (1995) investigated the capacities of triple left-turn lanes and correlated the findings with roadway geometric features. The study is an extension of Committee 5P-5’s work, which examined the capacities and operational characteristics of double left-turn lanes. The study consisted of a data collection and the analysis of 17 intersections with triple left-turn lanes. The data collection effort contained general descriptive, lane headway data, and ten independent variables for each intersection studied. These variables are as follows:
• Population • Angle • Number of through lanes • Bay length • Taper length • Radius of turn • Minimum distance between concurrent opposing left turns • Type of left-turn signalization • Intersection configuration (4-leg, “T”, and so forth) • Existence of opposing left-turn movement at the intersection • Type of left-turn movement studied (exclusive, optional right turn, optional through)
Saturation flow rates were calculated for the triple left-turn lanes and adjacent through lanes using average headways measured from the fourth vehicle to the eighth vehicle in the queue as recommended by the HCM. The results yielded an overall saturation flow rate for triple left-turn lanes of 1830 pcphgpl. This saturation flow rate is within about 5% of the rates reported by Leonard (1928 pcphgpl) for triple left turns and by ITE Committee 5P-5 (1950 pcphgpl) for double left-turn lanes. Analysis of variance (ANOVA) tests were performed to study the differences in average saturation flow rates by lane position (inside, middle, outside) and by turn-lane type (exclusive left-turn, optional through/right). The results indicated that there were no significant difference in the saturation flow rates between each of the three left-turn lanes, or among any of the turn lanes and adjacent through lanes. The ANOVA results also suggested that a left-turn factor of 1.0 might be appropriate for triple left-turn lanes, meaning that triple left-turns saturation flow rates may not be significantly different from the adjacent through lanes calculated in the study. ITE Committee 5P-5A reported similar results for double left-turn lanes. Leonard, however, reported significant difference in the saturation flow rates among left-turn lanes (i.e., inner, middle and outer). With regards to the effects of various geometric factors on left-turn saturation flow rates, only preliminary investigations were possible due to the small sample size and missing geometric data for many intersections. Therefore, it was concluded that none of the geometric factors produced any significant correlation with left-turn saturation flow. The lack of evidence found in this study concerning any significant relationship may be attributable in part to the effects of downstream conditions that may cause drivers to pre-position themselves in the most favorable left-turn lane immediate to their downstream destination.
Guidelines for Triple Left-Turn Lanes at Signalized Intersections
Background and Literature Review Page 2-14
2.3 Studies of Safety Considerations In general, crashes are concentrated at intersections. Those making left turning movements are particularly vulnerable.
2.3.1 Double Left Turns
A number of safety studies have been reported in the literature. ITE Technical Committee 4L-M conducted a survey in 1975 of 46 practicing professionals. Of the 29 individuals who provided a definite response, 13 indicated that the employment of double left turns had reduced crashes, while only one indicated an increase in the number of crashes and 15 indicated no significant difference in crashes.
Nicholas (1989) conducted a safety study involving seven single left-turn intersections and seven double left-turn intersections in Chicago, Illinois. It was found that double left-turn intersections experienced an average of 2.49 crashes per million entering vehicles (MEV), compared to 1.69 crashes per MEV for single left-turn intersections. For average crash rates based on movement, the study found that the double left-turn movements experienced 9.44 crashes per MEV, compared to 8.48 per MEV of the single left-turn movements.
Coleman (1989) reported that the City of Albuquerque experienced a reduced crash rate at most of the double left-turn intersections. He pointed out that the crashes people were most concerned about were sideswipe crashes between vehicles on the outside opposing turning lanes. However, no increase in such crashes was found.
The Traffic Signal Technical Committee of the Colorado/Wyoming Section of ITE (1995) conducted a study to determine if permissive double left-turn movements experience reasonable crash rates, as compared with protected-only double left turns and with single left turns. The results showed that crash rates were generally higher at permissive double left turns than at protected-only double left turns, although the difference was only less than one crash per million entering vehicles. The analysis also showed that double left-turn crash rates increased with the increase in the number of opposing approach lanes. However, no correlation was found between double left-turn crash rates with the opposing approach speed limits. In addition, double left-turn crash rates were found to vary significantly by city jurisdiction, even more so than by number of turn lanes and type of phasing.
2.3.2 Triple Left Turns Safety studies on triple left turns are very limited. Mitchell (1993) conducted a safety study involving six triple left turns. It was found that only one of the triple left turns contributed to more than 20% of the total intersection crashes. The main cause of the crashes on the triple left-turn lanes was attributed to violations by vehicles changing lanes to proceed straight rather than making the mandatory left-turn movement. Mitchell pointed out that advance signing and proper markings are important in advising drivers of the left-turn restrictions. He also emphasized that turning radii and pavement surface conditions must be adequate for the vehicle speeds.
Guidelines for Triple Left-Turn Lanes at Signalized Intersections
Background and Literature Review Page 2-15
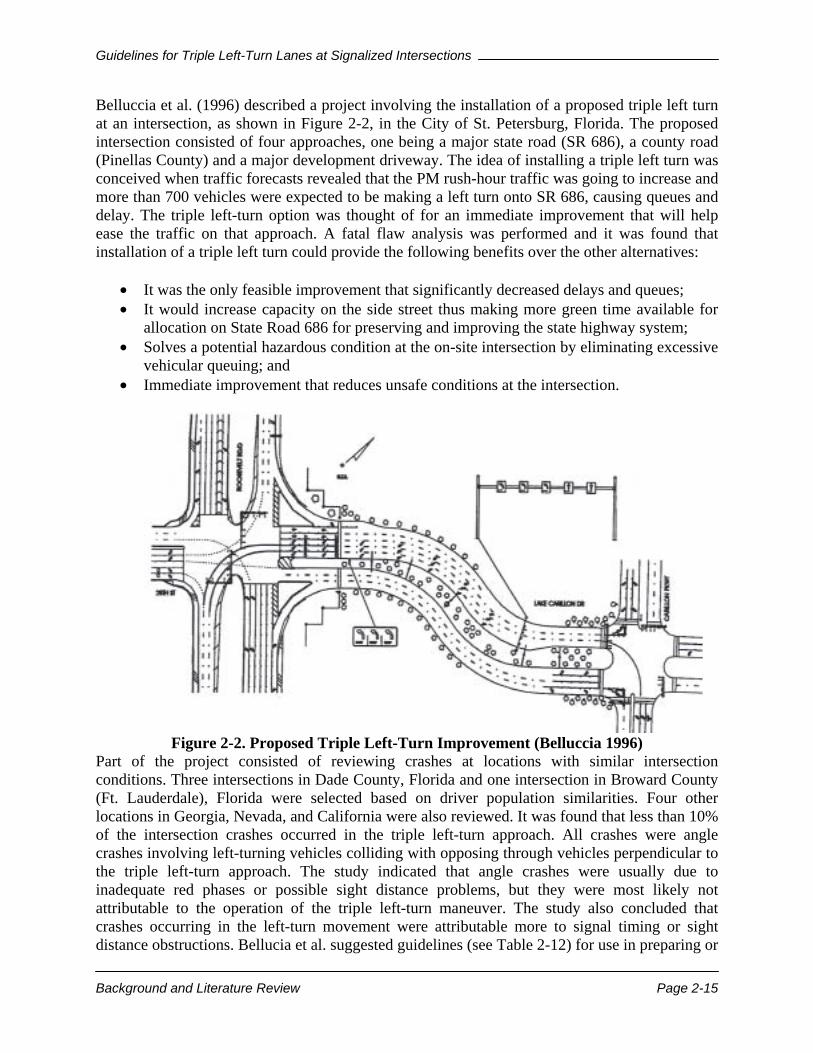
Belluccia et al. (1996) described a project involving the installation of a proposed triple left turn at an intersection, as shown in Figure 2-2, in the City of St. Petersburg, Florida. The proposed intersection consisted of four approaches, one being a major state road (SR 686), a county road (Pinellas County) and a major development driveway. The idea of installing a triple left turn was conceived when traffic forecasts revealed that the PM rush-hour traffic was going to increase and more than 700 vehicles were expected to be making a left turn onto SR 686, causing queues and delay. The triple left-turn option was thought of for an immediate improvement that will help ease the traffic on that approach. A fatal flaw analysis was performed and it was found that installation of a triple left turn could provide the following benefits over the other alternatives:
• It was the only feasible improvement that significantly decreased delays and queues; • It would increase capacity on the side street thus making more green time available for
allocation on State Road 686 for preserving and improving the state highway system; • Solves a potential hazardous condition at the on-site intersection by eliminating excessive
vehicular queuing; and • Immediate improvement that reduces unsafe conditions at the intersection.
Figure 2-2. Proposed Triple Left-Turn Improvement (Belluccia 1996)
Part of the project consisted of reviewing crashes at locations with similar intersection conditions. Three intersections in Dade County, Florida and one intersection in Broward County (Ft. Lauderdale), Florida were selected based on driver population similarities. Four other locations in Georgia, Nevada, and California were also reviewed. It was found that less than 10% of the intersection crashes occurred in the triple left-turn approach. All crashes were angle crashes involving left-turning vehicles colliding with opposing through vehicles perpendicular to the triple left-turn approach. The study indicated that angle crashes were usually due to inadequate red phases or possible sight distance problems, but they were most likely not attributable to the operation of the triple left-turn maneuver. The study also concluded that crashes occurring in the left-turn movement were attributable more to signal timing or sight distance obstructions. Bellucia et al. suggested guidelines (see Table 2-12) for use in preparing or
Guidelines for Triple Left-Turn Lanes at Signalized Intersections
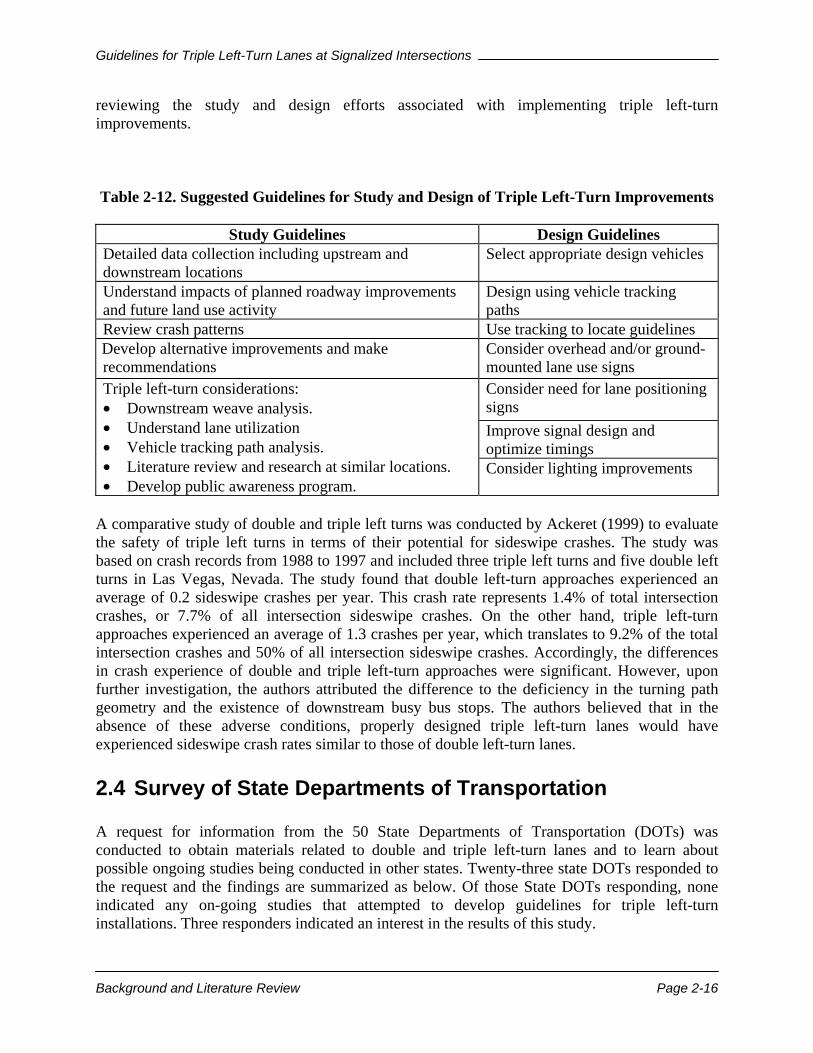
Background and Literature Review Page 2-16
reviewing the study and design efforts associated with implementing triple left-turn improvements. Table 2-12. Suggested Guidelines for Study and Design of Triple Left-Turn Improvements
Study Guidelines Design Guidelines
Detailed data collection including upstream and downstream locations
Select appropriate design vehicles
Understand impacts of planned roadway improvements and future land use activity
Design using vehicle tracking paths
Review crash patterns Use tracking to locate guidelines Develop alternative improvements and make recommendations
Consider overhead and/or ground-mounted lane use signs Consider need for lane positioning signs Improve signal design and optimize timings
Triple left-turn considerations: • Downstream weave analysis. • Understand lane utilization • Vehicle tracking path analysis. • Literature review and research at similar locations. • Develop public awareness program.
Consider lighting improvements
A comparative study of double and triple left turns was conducted by Ackeret (1999) to evaluate the safety of triple left turns in terms of their potential for sideswipe crashes. The study was based on crash records from 1988 to 1997 and included three triple left turns and five double left turns in Las Vegas, Nevada. The study found that double left-turn approaches experienced an average of 0.2 sideswipe crashes per year. This crash rate represents 1.4% of total intersection crashes, or 7.7% of all intersection sideswipe crashes. On the other hand, triple left-turn approaches experienced an average of 1.3 crashes per year, which translates to 9.2% of the total intersection crashes and 50% of all intersection sideswipe crashes. Accordingly, the differences in crash experience of double and triple left-turn approaches were significant. However, upon further investigation, the authors attributed the difference to the deficiency in the turning path geometry and the existence of downstream busy bus stops. The authors believed that in the absence of these adverse conditions, properly designed triple left-turn lanes would have experienced sideswipe crash rates similar to those of double left-turn lanes.
2.4 Survey of State Departments of Transportation A request for information from the 50 State Departments of Transportation (DOTs) was conducted to obtain materials related to double and triple left-turn lanes and to learn about possible ongoing studies being conducted in other states. Twenty-three state DOTs responded to the request and the findings are summarized as below. Of those State DOTs responding, none indicated any on-going studies that attempted to develop guidelines for triple left-turn installations. Three responders indicated an interest in the results of this study.
Guidelines for Triple Left-Turn Lanes at Signalized Intersections
Background and Literature Review Page 2-17
2.4.1 Kansas Kansas DOT reported that they were unaware of any intersections installed with triple left-turn lanes. For double left turns, a minimum of 300 left turns during the peak hour per the HCM is required for their installation. Its published Traffic Engineering Guidelines state that, for double left-turn lanes, the receiving width should be a minimum of 8 meters, and desirably 8.6 to 9 meters; that the width should be extended to at least 15 meters, preferably 30 meters, beyond the end of the design radius of the outer turn.
2.4.2 Kentucky Kentucky DOT reported that it has not developed guidelines for multiple left-turn lanes but it follows the HCM and the AASHTO Green Book to determine the number of turn lanes necessary and the minimum taper lengths required for speed reduction.
2.4.3 Maryland The State of Maryland reported that although it has both double and triple left-turn lanes, no formal guidelines have been established. The use of a triple left turn over a double left turn is mainly based on right-of-way availability and critical lane analysis, that it will use a triple left turn if the need is there and adequate room to construct it is available.
2.4.4 Minnesota Minnesota DOT reported the following design guidelines for double left turns that are based mainly on those of the NCHRP Report 279:
1. The throat width for turning traffic is the most important design element. Drivers are most comfortable with extra space between the turning queues of traffic. Because of the off tracking characteristics of vehicles and the relative difficulty of two abreast turns, an 11 m throat width is desirable for acceptance of two lanes of turning traffic. In very constrained situations, a 9 m throat width is an acceptable minimum.
2. The designers should check for possible conflicts involving left turns opposing double left turns. For proper design, use the swept path of semi-trailer and a 4.2 m strip placed alongside on the inside of the turn for a passenger vehicle. Hard copy templates and turning templates in the CAD cell library should be used to check the design.
3. Consideration should be given to providing pavement markings to separate the turn lanes. The Minnesota MUTCD recommends 0.6 m long dashed lines with 1.2 m gaps to channel turning radius. These channelization lines should be carefully laid out to reflect off-tracking and driving characteristics.

Guidelines for Triple Left-Turn Lanes at Signalized Intersections
Background and Literature Review Page 2-18
2.4.5 Mississippi Mississippi DOT reported that the state considers double left-turn lanes for left-turn volume greater than 300 vph and triple left-turn lanes for left-turn volume greater than 600 vph. It also reported two triple left turns that were proposed but not yet implemented at the time of the report.
2.4.6 Nebraska Nebraska DOT reported a planned first triple left turn to be installed on Millard Avenue in Omaha, Nebraska.
2.4.7 New Mexico New Mexico DOT reported that the state had just re-constructed the intersection of Cerrillos and Airport Road in Santa Fe, New Mexico with the geometric configuration needed for triple left turn for the east to north movement. The intersection was striped for double left turn but it was planned for re-striping in a few years to allow the installation of a triple left turn. The state also reported that a triple left turn was being designed for the 1-25 E. Frontage Rd./Paseo del Norte intersection in the Albuquerque District.
2.4.8 New York The New York DOT reported the following design guidelines for double left turns:
1. Double left turn lanes should be considered at signalized intersections with high left-turn demands or where a reduction in green time allocated to that left-turn movement can significantly benefit the intersection operation. While capacity analysis identifies the need for and impact of double left-turn lanes, left-turn demands over 300 vph and/or storage needs should trigger consideration of them. Fully protected signal phasing shall be provided for double left turns.
2. Provide adequate throat width on the approach receiving the double left turns to
compensate for off-tracking characteristics of turning vehicles and the relative difficulty of side-by-side left turns. A car and the design vehicle should be able to comfortably turn side-by-side. An 11-meter wide throat is desirable for double left turns with turning angles greater than 90o. Narrower throats can be provided for more favorable turning angles. A 9-meter throat width may be adequate for 90' turns. In constrained situations with favorable turning angles less than 90o, 8-meter throat widths may be acceptable. However, throat widths less than 9-meter should normally be avoided since they can

Guidelines for Triple Left-Turn Lanes at Signalized Intersections
Background and Literature Review Page 2-19
restrict turning traffic flow and reduce the operational benefit of double left-turn lanes. On the other hand, excessive pavement, which can mislead drivers, should also be avoided.
3. If practicable, the intersection should be designed to allow the double left turn to be
executed concurrently with the opposing left turn. This allows the flexibility in the signal phasing to serve the double left-turn movement concurrently with either the opposing left turns or the adjacent through movement. If the turning paths of the double left and the opposing left turn overlap, the left turns cannot be served concurrently.
4. Dotted lines, in accordance with the New York State MUTCD, are the appropriate
pavement markings used to separate the two-abreast turning lanes and especially opposing turning lanes. The dotted lines should reflect turning paths and have a gap of between 1.2 and 2.0 meters.
5. The design should prevent through traffic from accidentally entering and becoming
trapped in the double left-turn lanes. The turning lanes should be fully shadowed wherever possible.
2.4.9 Oklahoma Oklahoma DOT uses the following design guidelines for double left turns:
1. Warrant: Double left-turn lanes should be considered when:
a. There is insufficient space to provide the necessary length of a single turn lane because of restrictive site conditions (e.g., closely spaced intersections);
b. The necessary length of a single turn lane becomes prohibitive;
c. As a general rule, there are 300 or more left-turning vehicles in the design hour;
and/or
d. The necessary time for a protected left-turn phase for a single lane becomes unattainable to meet the level-of-service criteria.
2. Throat Width: Because of the off-tracking characteristics of turning vehicles, the normal
width of two travel lanes may be inadequate to properly receive two vehicles turning simultaneously. The throat width will be determined by the application of the turning templates for the design vehicles. The designer can expect that the receiving width for double left-turn lanes will be approximately 30-36 feet. For double right-turn lanes, a 36-feet throat width can be expected. When determining the available throat width, the designer can assume that a strengthened paved shoulder, if present at the receiving throat, can be used to accommodate double turns.
Guidelines for Triple Left-Turn Lanes at Signalized Intersections
Background and Literature Review Page 2-20
3. Pavement Marking: Pavement markings can effectively guide two lines of vehicles turning side-by-side. The Traffic Engineering Division will determine the selection and placement of any special pavement markings.
4. Opposing Left-Turn Traffic: If simultaneous, opposing double left turns will be allowed,
the designer should ensure that there is sufficient space for all turning movements. This is a factor at all signalized intersections, but double left-turn lanes with their side-by-side vehicles can cause special problems. If space is unavailable, it may be necessary to alter the signal phasing to allow the two directions of traffic to move through the intersection on separate phases. As a recommendation, 30 feet should be available between opposing flows of traffic.
5. Turning Templates: All intersection design elements for double left-turn lanes should be
checked by using the applicable turning templates. The designer should assume that the selected design vehicle will turn from the outside lane of the dual turn lane. Desirably, the inside vehicle should be a SU but, as a minimum, the other vehicle can be assumed to be a P vehicle turning side-by-side with the selected design vehicle. Ultimately, the final design and selected design vehicles will be determined on a case-by-case basis.
2.4.10 Oregon Oregon DOT considers a double left-turn lane once the left-turning volume reaches 300 vehicles per hour. The final decision is based on an engineering study to review any safety problems that might result. The study may include the following items:
1. The engineering study may include a capacity analysis. The analysis must clearly demonstrate an improved level of service with multiple turning movements and/or with other considerations not to lower the level of service.
2. Delay and backup of traffic in the approach under consideration will be a factor in the
engineering study to implement the multiple turn treatment. 3. The multiple-turn engineering study may involve turns from the local agency street or
roadway system at the approaches to the State Highway System. 4. The engineering study will consider truck or other wide turning path vehicles and
adequate multiple turning lane widths. 5. A part of every study will consider special striping or raised pavement markers to
delineate the multiple-turning movement and advance signing as required.
2.4.11 North Carolina North Carolina DOT reported that the following two intersections in the state were installed with a triple left turn:
Guidelines for Triple Left-Turn Lanes at Signalized Intersections
Background and Literature Review Page 2-21
1. US 401 (Skibo Road) and SR 1007 (All American Freeway) southbound exit ramp in the
City of Fayetteville, Cumberland County. This intersection is a three-leg intersection that is operating with triple left-turn lanes off of the exit ramp. A crash analysis performed at this intersection utilizing information over a three-year period indicated that the intersection was operating fairly well.
2. US 401 Bus. at US 401 Byp. (Country Club Drive) and Tokay Drive is a basic four-leg
intersection with triple eastbound left turn lanes. A crash analysis revealed a total of 35 crashes over a three-year period at the intersection, resulting in a total crash rate of 58.11 crashes per 100 million entering vehicles. Of the 35 crashes only a small portion was actually contributed by the triple left turn lanes.
2.4.12 North Dakota North Dakota DOT reported that the state did not experience any identifiable crash problems for the numerous double left turns constructed, that a design factor requires that the receiving lanes be wider than the approaching left-turn lanes.
2.4.13 Pennsylvania Pennsylvania DOT uses the Highway Capacity Software (HCS) or an optimization/simulation software to determine the need for a double left turn. It also reported that, in general, double left-turn lanes are considered if the length of a single turn lane would exceed 300 feet, or for left-turn volumes greater than 300 vehicles per hour. Protected/ prohibited left-turn phasing is the only type of signal operation used on approaches with double left-turn lanes.
2.4.14 South Carolina The South Carolina Department of Highways and Public Transportation Highway Design Manual covers the premise for providing a double left turn. Although the manual permits for a throat width of 30 feet on the receiving end with a taper of 150 feet, the minimum run out on the receiving end we provide for, is at least 300 feet, if not more. In the design of double left-turn lanes the following rules of thumb are used:
1. A double left turn is considered when the turning volume approaches 300 vph.
2. A capacity analysis of the intersection is conducted and the benefits of providing the double left turns is evaluated based on levels of service analysis using one of the following software packages: HCS, SYNCRHO, PASSER, TRANSYT.
3. In the geometric design of the left-turn lanes, the turning templates developed by ITE is used to lay the intersection out.
Guidelines for Triple Left-Turn Lanes at Signalized Intersections
Background and Literature Review Page 2-22
4. The minimum design vehicles are SU-30 in the inside lane and WB-50 or WB-60 in the outside lane, turning simultaneously without any lane encroachment.
5. On an interstate interchange, designing for two WB-60's side-by-side is encouraged.
6. On a four-leg intersection where the demand on the opposing side does not require a double left-turn lane, the intersection is designed to permit the left-turn movements to turn simultaneously to avoid split phasing the intersection, i.e., matching geometric design on opposing approaches where right of way permits.
7. As a rule a permissive/protected phase in the signal timing for double left-turn lanes is not allowed.
8. At locations where double left-turn lanes are provided a 4-foot buffer is desired between opposing traffic.
2.4.15 South Dakota South Dakota DOT does not have any written requirements of double left-turn lanes but the following rules have been followed:
1. A double left-turn is considered when left turns exceed 300 vph.
2. The minimum width for a double left-turn lane is 12 feet.
3. The lanes should be designed so that the vehicle can turn into its appropriate lane. The design vehicle to be used is according to DOT policies.
4. If a double left turn is opposed by a single left turn that can operate in the permissive
mode the lane should be offset to line up with the inside left-turn lane for the double left turn. This allows the driver to see approaching traffic.
5. On the traffic side double left turns are protected only movements and have a dash line (5
feet long spaced 15 feet apart) between the turning vehicle to guide the vehicle through the intersection and into the proper lane. Each of the turn lanes also has its traffic signal indication in line with the drivers view. The traffic signal uses arrow indications and not programmable heads.
6. Pavement markings for the storage and taper areas are similar to that of a single left.
Signing lane usage signs are used on the signal pole mast arm any other signing is per each installation.
Guidelines for Triple Left-Turn Lanes at Signalized Intersections
Background and Literature Review Page 2-23
2.4.16 Washington State Washington DOT does not have any specific design guidelines for double and triple left turns, that the double left turns currently exist in the state have been constructed on a case-by-case basis based on the AASHTO design guidelines. The state also reported a planned triple left turn.
2.4.17 Virginia Virginia DOT has installed triple left-turn lanes in the Northern Virginia area (Washington DC metro area). The use of double left-turn lanes is a very common practice and has proved to be an accepted means for improving intersection capacity. A minimum of 300 left turns during the peak hour is generally used as a rule of thumb for justifying a double left-turn lane. The storage needs are determined by a capacity analysis. Many of the double left turns are signed as U-turn and left-turn (inside left) and left-turn only (outside left).
2.4.18 Wyoming Wyoming DOT reported that the state has a limited number of double left turns and no triple left turns, that a double left turn is considered when an intersection experience high a left-turn volume and other remedial alternatives did not work. The state uses NCHRP Report 279 for the design of double left-turn lanes.
2.4.19 Others The following states responded to the request for information but indicated that their states did not have any intersections installed with a triple left turn: Alaska, Arkansas, Connecticut, Illinois, and Rhode Island. These states also did not provide any specific design information double left turns.
2.4.20 Summary Only a few states, including California, Minnesota, New York, Nevada, North Carolina and Texas, reported to have at least one triple left turn currently functioning. Several states, including Maryland, Mississippi, Nebraska, New Mexico, Oregon and Washington, were planning to install intersections with triple left-turn lanes. Most of the State DOTs surveyed did not have any studies on triple left-turn lanes, however, the use of double left turns was reported by almost all of the respondents. Most of the State DOTs reported that they use “in house” design guidelines based on the AASTHO standards for the design of double left-turn installations.
Guidelines for Triple Left-Turn Lanes at Signalized Intersections
Background and Literature Review Page 2-24
Up to date specific design guidelines for triple left turns were not reported by any state. However, states with double or triple left-turn lanes base their design on the following manuals:
• Highway Capacity Manual (TRB) • Guidelines for Urban Major Street Design (ITE) • Intersection Channelization Design Guide (NCHRP Report 279) • A Policy on the Geometric Design of Highways and Streets (AASHTO)
State DOTs from California, Connecticut, Minnesota, New York, Oklahoma, South Dakota, Virginia and Washington reported having “in house” design guidelines that are applied to the design of both double and triple left turns. Maryland and New York DOT base the installation of multiple left-turn lanes on major determining factors such as right of way, critical lane analysis, level of service and operational characteristics. North Carolina reported triple left turns that operated well. Although crashes increased over the last three years in one location, only a small portion of the crashes was caused by the triple left turns.
2.5 Application of Traffic Models Several general models have been developed for the analysis of traffic signal operation at intersections and on arterial streets. To this point, no model has been specifically formulated to deal with the unique characteristics of triple left turns. A brief description of the most common models will now be presented. All of these models are implemented in available software products
2.5.1 CORSIM The CORSIM (CORridor SIMulation) model is a microscopic traffic simulation program that may be used for the general analysis of traffic control networks and freeways. It is a stochastic simulation model developed by the Federal Highway Administration. It is composed of two sub-models, FRESIM and NETSIM. FRESIM (FREeway SIMulation) is the component used to simulate freeways and basic uninterrupted flow facilities, while NETSIM (NETwork SIMulation) is used to simulate networks composed of surface streets. CORSIM uses very complex algorithms to reproduce traffic flow realistically under a wide range of traffic conditions. CORSIM is also equipped with an output processor, TRAFVU. TRAFVU is a visualization software tool used to display the actual traffic operations in the animated simulation of the vehicles it has modeled.
Guidelines for Triple Left-Turn Lanes at Signalized Intersections
Background and Literature Review Page 2-25
2.5.2 HCS HCS (Highway Capacity Software) is a software product that implements the Highway Capacity Manual (HCM). The HCM is used in the design and analysis of all types of highway facilities. Of particular interest to this study is Chapter 16 of the HCM. It is dedicated to the analysis of signalized intersections. Chapter 16 provides guidelines and procedures for estimating the performance measures for each traffic movement at an intersection. The Florida DOT recognizes the HCM as the preferred method for estimating the level of service on all facilities.
2.5.3 SIDRA SIDRA (Signalized and Unsignalized Intersection Design and Research Aid) is a traffic software product developed by the ARRB Transport Research Ltd as a tool for the design and evaluation of signalized intersections, roundabouts, all way stop control and yield sign control. The program utilizes analytical traffic models to calculate capacity and performance measures, such as delay, queue length, stop rate, fuel consumption, etc. The features of SIDRA that are potentially useful to the analysis of triple left turns include the ability to perform a separate analysis for each approach lane, and to deal with “short lanes”, including turn bays and downstream lane reductions
2.5.4 TRANSYT-7F The TRANSYT-7F (TRAffic Network Study Tool version 7Fl) is a traffic flow analysis and signal timing program developed by the Federal Highway Administration (FHWA). The program optimizes coordinated traffic signal systems to increase traffic progression in an attempt to reduce the measures of effectiveness (MOE’s) such as delay, stops, and fuel consumption. It also has the capabilities to perform detailed operational studies. The delay estimates incorporated into the software are from the HCM. The traffic simulation model in TRANSYT-7F is a macroscopic model. This means that it considers platoons of traffic instead of looking at individual vehicles. However, TRANSYT-7F simulates traffic flow in small time increments so its evaluation of the traffic is more detailed than in other macroscopic simulation models. Recent versions of this model are able to deal with backup into an intersection from a downstream bottleneck.
Guidelines for Triple Left-Turn Lanes at Signalized Intersections
Traffic Operations Studies Page 3-1
3. TRAFFIC OPERATIONS STUDIES Traffic operations studies were conducted at a number of double and triple left-turn lane sites to determine whether substantial increases in flows were achieved after the construction of a third turn lane. Separate analyses were conducted of each lane to determine if there were any conspicuous patterns between lanes and sites. Service (average weighted volume per cycle with trucks treated as equivalent to two passenger cars) and maximum flows (weighted saturation flow rates) were computed by lane for each site using measured headway data. The procedures used to obtain these measurements are detailed in APPENDIX A – Traffic Data Collection and Analysis Methodology. The initial analyses included only double left turn lanes as illustrated in Figure 3-1. This analysis provided some baseline data for making subsequent comparisons of triple left-turn lanes and for developing profiles of the intersections. From the literature and our early experience, it became clear that there is considerable variation in the performance among sites with multiple left-turn lanes, between periods of the day, and even from one cycle to the next. Even so, there are some signatures including average headways for particular lanes and intersections. The effects of weather, trucks and other long wheelbase vehicles, pedestrian activity, etc. appear to have an affect on the service levels and maximum achievable flows, but the modest data collection efforts in this research were not sufficient to directly uncover these effects or the interaction of these variables with the features of the intersections. The literature suggests that a number of geometric features and other situational variables will affect traffic performance. These features are incorporated into the model of triple left-turn intersections. At this stage we merely characterized the intersections by lane, the number of cars, trailers, trucks, the number of vehicles that formed queues or were free flowing and then completed the saturation flow rates for each intersection and their associated statistics. Figure 3-1 illustrates this process. For this example, the mean combined saturation flow rate of 1723 is within the range of values obtained in other studies. The outside lane (Lane 2) appears to experience slightly higher performance, but overall, the differences between cycle-to-cycle variations for the combined lanes are substantial (Minimum SAT = 986 and Maximum SAT = 1463). To obtain more reliable estimates would require considerable more data collection at this site.

Guidelines for Triple Left-Turn Lanes at Signalized Intersections
Traffic Operations Studies Page 3-2
Location: A1A AND SR40, Ormond Beach, FL Reference: ORMO1 Configuration: T intersection with 2 left-turn lanes, no median strip, pedestrian crossings, business driveways close to turning lanes Number of Traffic Signal Cycles: 32 Date and Period of Data Collection: AM Peak Date of Analysis: 7/27/99
A. Traffic and Vehicle Characteristics B.
Lane
Number Cars
Number Trailers
NumberTrucks
Vehicles in Queues
Free Flowing Vehicles
Average Headway
1 207 2 1 164 46 2.24 2 160 2 0 127 35 2.04
C. Snapshot from Surveillance Video D. Saturation Flow Rate
Statistics (Combined Lanes)
E. Headways by Lane and Queue Position
0.000.501.001.502.002.503.00
1 3 5 7 9
Queue Position
Hea
dway
(Sec
)
Lane 1Lane 2
Figure 3-1. Summary Information From Analysis of Multiple Left-Turn Lane Site
Mean 1723.31Standard Error 56.55Median 1682.83Mode 2250.00Standard Deviation 309.73Kurtosis 0.59Skewness 0.21Range 1462.68Minimum 986.30Maximum 2448.98Count 30.00Confidence Level (95.0%) 115.65
Comments: Very few encroachments into adjacent lanes observed. Several vehicles made U-turns from lane 2.
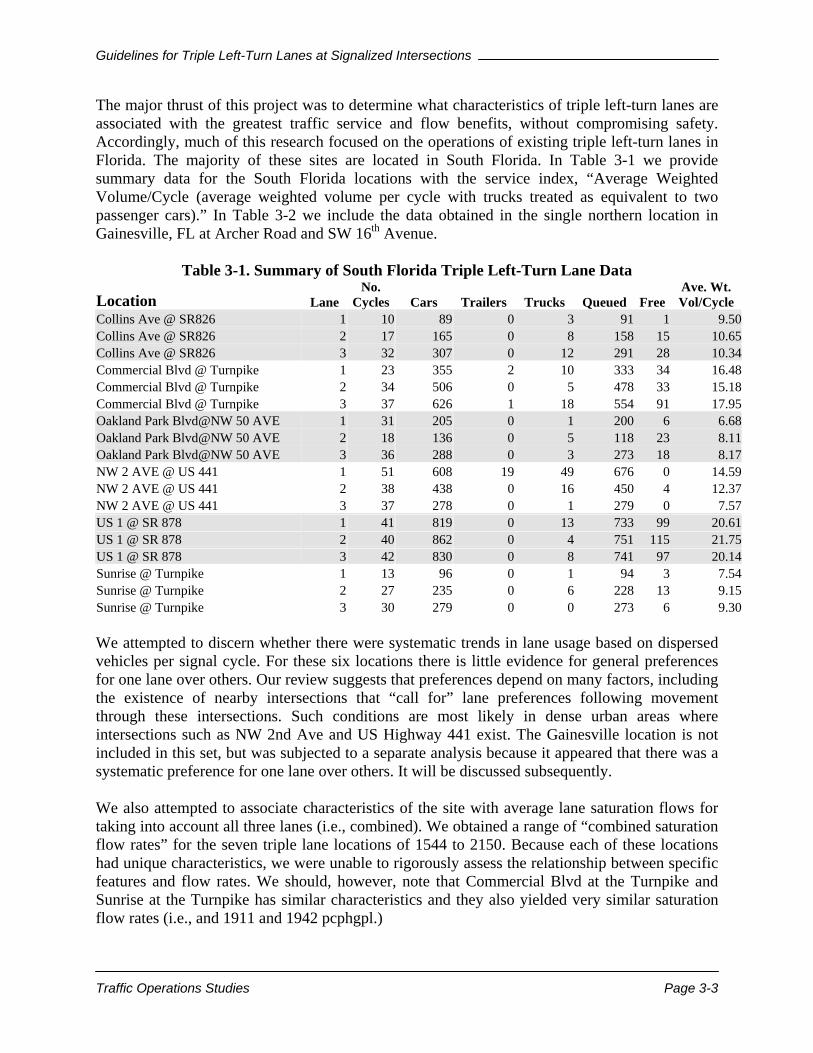
Guidelines for Triple Left-Turn Lanes at Signalized Intersections
Traffic Operations Studies Page 3-3
The major thrust of this project was to determine what characteristics of triple left-turn lanes are associated with the greatest traffic service and flow benefits, without compromising safety. Accordingly, much of this research focused on the operations of existing triple left-turn lanes in Florida. The majority of these sites are located in South Florida. In Table 3-1 we provide summary data for the South Florida locations with the service index, “Average Weighted Volume/Cycle (average weighted volume per cycle with trucks treated as equivalent to two passenger cars).” In Table 3-2 we include the data obtained in the single northern location in Gainesville, FL at Archer Road and SW 16th Avenue.
Table 3-1. Summary of South Florida Triple Left-Turn Lane Data
Location Lane No.
Cycles Cars Trailers Trucks Queued FreeAve. Wt. Vol/Cycle
Collins Ave @ SR826 1 10 89 0 3 91 1 9.50Collins Ave @ SR826 2 17 165 0 8 158 15 10.65Collins Ave @ SR826 3 32 307 0 12 291 28 10.34Commercial Blvd @ Turnpike 1 23 355 2 10 333 34 16.48Commercial Blvd @ Turnpike 2 34 506 0 5 478 33 15.18Commercial Blvd @ Turnpike 3 37 626 1 18 554 91 17.95Oakland Park Blvd@NW 50 AVE 1 31 205 0 1 200 6 6.68Oakland Park Blvd@NW 50 AVE 2 18 136 0 5 118 23 8.11Oakland Park Blvd@NW 50 AVE 3 36 288 0 3 273 18 8.17NW 2 AVE @ US 441 1 51 608 19 49 676 0 14.59NW 2 AVE @ US 441 2 38 438 0 16 450 4 12.37NW 2 AVE @ US 441 3 37 278 0 1 279 0 7.57US 1 @ SR 878 1 41 819 0 13 733 99 20.61US 1 @ SR 878 2 40 862 0 4 751 115 21.75US 1 @ SR 878 3 42 830 0 8 741 97 20.14Sunrise @ Turnpike 1 13 96 0 1 94 3 7.54Sunrise @ Turnpike 2 27 235 0 6 228 13 9.15Sunrise @ Turnpike 3 30 279 0 0 273 6 9.30 We attempted to discern whether there were systematic trends in lane usage based on dispersed vehicles per signal cycle. For these six locations there is little evidence for general preferences for one lane over others. Our review suggests that preferences depend on many factors, including the existence of nearby intersections that “call for” lane preferences following movement through these intersections. Such conditions are most likely in dense urban areas where intersections such as NW 2nd Ave and US Highway 441 exist. The Gainesville location is not included in this set, but was subjected to a separate analysis because it appeared that there was a systematic preference for one lane over others. It will be discussed subsequently. We also attempted to associate characteristics of the site with average lane saturation flows for taking into account all three lanes (i.e., combined). We obtained a range of “combined saturation flow rates” for the seven triple lane locations of 1544 to 2150. Because each of these locations had unique characteristics, we were unable to rigorously assess the relationship between specific features and flow rates. We should, however, note that Commercial Blvd at the Turnpike and Sunrise at the Turnpike has similar characteristics and they also yielded very similar saturation flow rates (i.e., and 1911 and 1942 pcphgpl.)
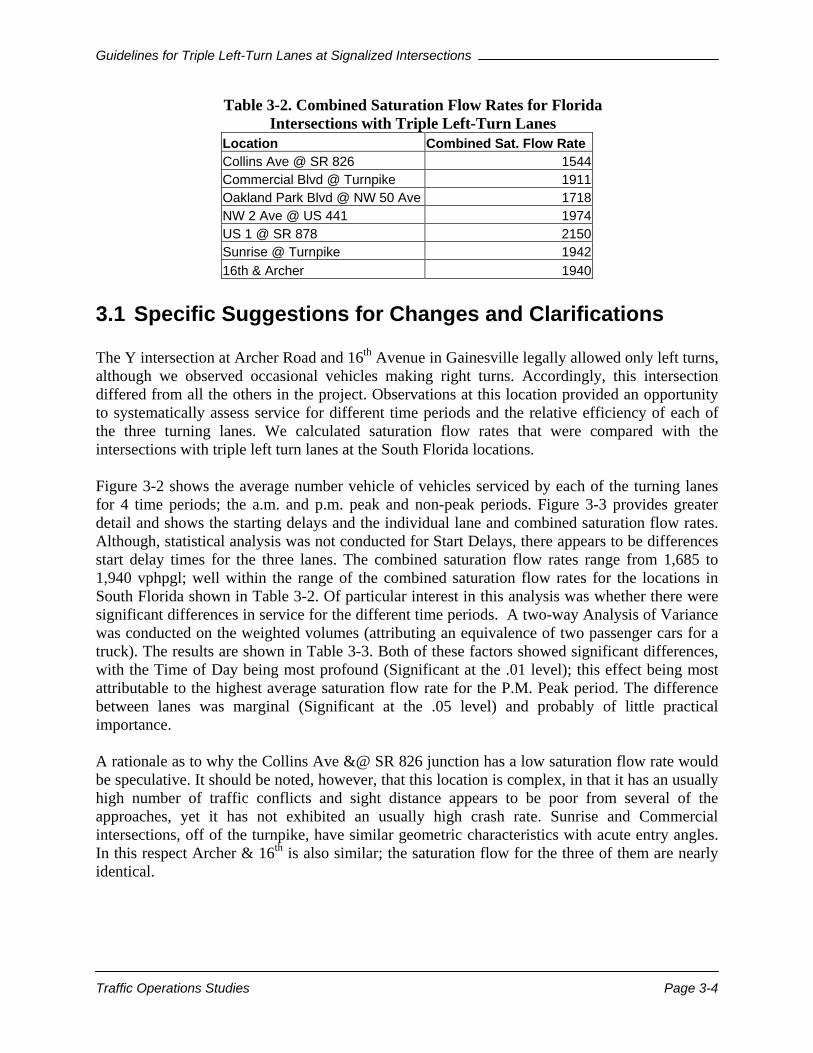
Guidelines for Triple Left-Turn Lanes at Signalized Intersections
Traffic Operations Studies Page 3-4
Table 3-2. Combined Saturation Flow Rates for Florida Intersections with Triple Left-Turn Lanes
Location Combined Sat. Flow Rate Collins Ave @ SR 826 1544 Commercial Blvd @ Turnpike 1911 Oakland Park Blvd @ NW 50 Ave 1718 NW 2 Ave @ US 441 1974 US 1 @ SR 878 2150 Sunrise @ Turnpike 1942 16th & Archer 1940
3.1 Specific Suggestions for Changes and Clarifications The Y intersection at Archer Road and 16th Avenue in Gainesville legally allowed only left turns, although we observed occasional vehicles making right turns. Accordingly, this intersection differed from all the others in the project. Observations at this location provided an opportunity to systematically assess service for different time periods and the relative efficiency of each of the three turning lanes. We calculated saturation flow rates that were compared with the intersections with triple left turn lanes at the South Florida locations. Figure 3-2 shows the average number vehicle of vehicles serviced by each of the turning lanes for 4 time periods; the a.m. and p.m. peak and non-peak periods. Figure 3-3 provides greater detail and shows the starting delays and the individual lane and combined saturation flow rates. Although, statistical analysis was not conducted for Start Delays, there appears to be differences start delay times for the three lanes. The combined saturation flow rates range from 1,685 to 1,940 vphpgl; well within the range of the combined saturation flow rates for the locations in South Florida shown in Table 3-2. Of particular interest in this analysis was whether there were significant differences in service for the different time periods. A two-way Analysis of Variance was conducted on the weighted volumes (attributing an equivalence of two passenger cars for a truck). The results are shown in Table 3-3. Both of these factors showed significant differences, with the Time of Day being most profound (Significant at the .01 level); this effect being most attributable to the highest average saturation flow rate for the P.M. Peak period. The difference between lanes was marginal (Significant at the .05 level) and probably of little practical importance. A rationale as to why the Collins Ave &@ SR 826 junction has a low saturation flow rate would be speculative. It should be noted, however, that this location is complex, in that it has an usually high number of traffic conflicts and sight distance appears to be poor from several of the approaches, yet it has not exhibited an usually high crash rate. Sunrise and Commercial intersections, off of the turnpike, have similar geometric characteristics with acute entry angles. In this respect Archer & 16th is also similar; the saturation flow for the three of them are nearly identical.
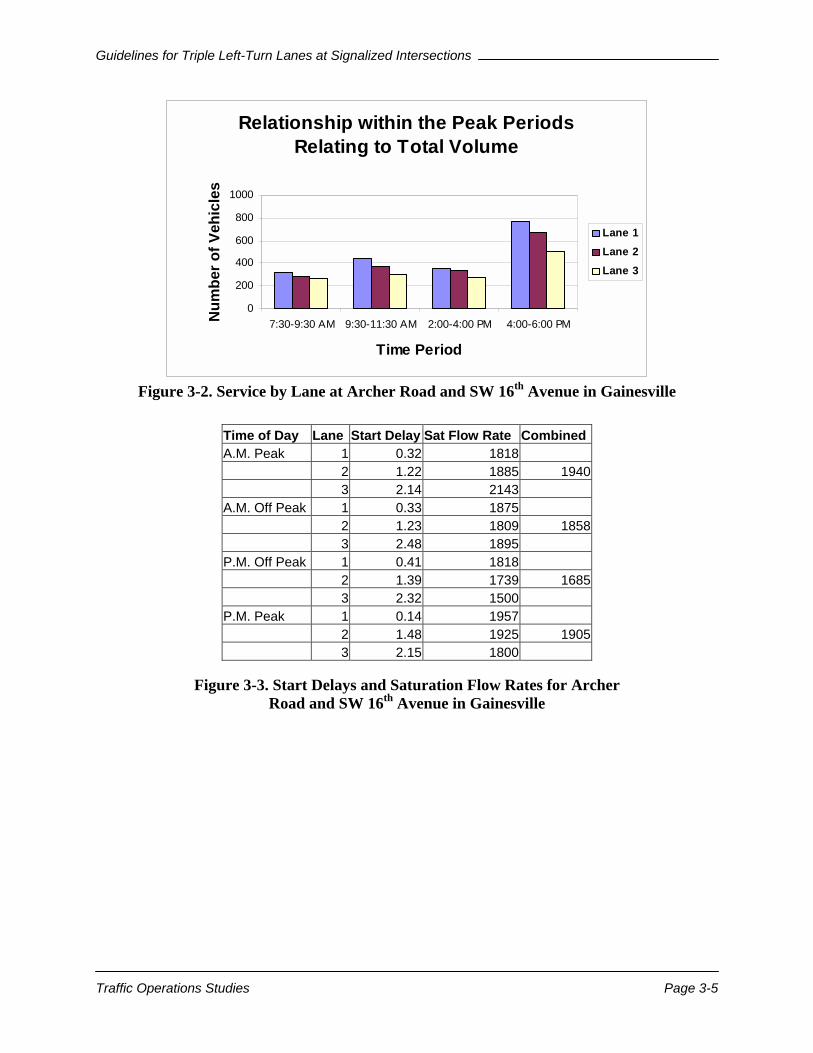
Guidelines for Triple Left-Turn Lanes at Signalized Intersections
Traffic Operations Studies Page 3-5
Relationship within the Peak Periods Relating to Total Volume
0
200
400
600
800
1000
7:30-9:30 AM 9:30-11:30 AM 2:00-4:00 PM 4:00-6:00 PM
Time Period
Num
ber o
f Veh
icle
sLane 1Lane 2Lane 3
Figure 3-2. Service by Lane at Archer Road and SW 16th Avenue in Gainesville
Figure 3-3. Start Delays and Saturation Flow Rates for Archer Road and SW 16th Avenue in Gainesville
Time of Day Lane Start Delay Sat Flow Rate Combined A.M. Peak 1 0.32 1818 2 1.22 1885 1940 3 2.14 2143 A.M. Off Peak 1 0.33 1875 2 1.23 1809 1858 3 2.48 1895 P.M. Off Peak 1 0.41 1818 2 1.39 1739 1685 3 2.32 1500 P.M. Peak 1 0.14 1957 2 1.48 1925 1905 3 2.15 1800
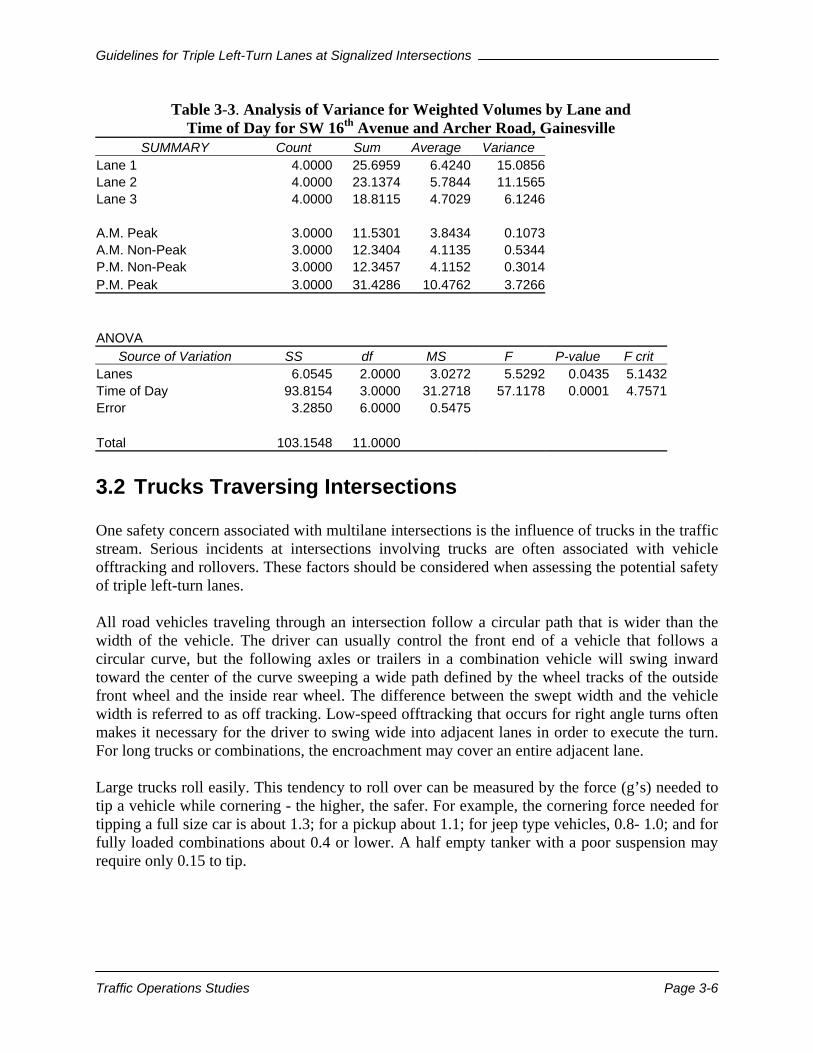
Guidelines for Triple Left-Turn Lanes at Signalized Intersections
Traffic Operations Studies Page 3-6
Table 3-3. Analysis of Variance for Weighted Volumes by Lane and Time of Day for SW 16th Avenue and Archer Road, Gainesville
SUMMARY Count Sum Average Variance Lane 1 4.0000 25.6959 6.4240 15.0856 Lane 2 4.0000 23.1374 5.7844 11.1565 Lane 3 4.0000 18.8115 4.7029 6.1246 A.M. Peak 3.0000 11.5301 3.8434 0.1073 A.M. Non-Peak 3.0000 12.3404 4.1135 0.5344 P.M. Non-Peak 3.0000 12.3457 4.1152 0.3014 P.M. Peak 3.0000 31.4286 10.4762 3.7266 ANOVA
Source of Variation SS df MS F P-value F crit Lanes 6.0545 2.0000 3.0272 5.5292 0.0435 5.1432Time of Day 93.8154 3.0000 31.2718 57.1178 0.0001 4.7571Error 3.2850 6.0000 0.5475 Total 103.1548 11.0000
3.2 Trucks Traversing Intersections One safety concern associated with multilane intersections is the influence of trucks in the traffic stream. Serious incidents at intersections involving trucks are often associated with vehicle offtracking and rollovers. These factors should be considered when assessing the potential safety of triple left-turn lanes. All road vehicles traveling through an intersection follow a circular path that is wider than the width of the vehicle. The driver can usually control the front end of a vehicle that follows a circular curve, but the following axles or trailers in a combination vehicle will swing inward toward the center of the curve sweeping a wide path defined by the wheel tracks of the outside front wheel and the inside rear wheel. The difference between the swept width and the vehicle width is referred to as off tracking. Low-speed offtracking that occurs for right angle turns often makes it necessary for the driver to swing wide into adjacent lanes in order to execute the turn. For long trucks or combinations, the encroachment may cover an entire adjacent lane. Large trucks roll easily. This tendency to roll over can be measured by the force (g’s) needed to tip a vehicle while cornering - the higher, the safer. For example, the cornering force needed for tipping a full size car is about 1.3; for a pickup about 1.1; for jeep type vehicles, 0.8- 1.0; and for fully loaded combinations about 0.4 or lower. A half empty tanker with a poor suspension may require only 0.15 to tip.
Guidelines for Triple Left-Turn Lanes at Signalized Intersections
Traffic Operations Studies Page 3-7
In general, the risk of involvement is substantially higher for combination trucks and than for single unit trucks regardless of the type of roadway they are operating on.2
3.3 Determining Safety of Trucks at Intersections To establish the impact of safety requires the use of substantial vehicle crash databases or the use of indirect indicators of increased crash risk derived from traffic operational data. The risk of a crash may involve a truck alone, a truck in conjunction with other vehicles, or a truck may introduce turbulence due to both offtracking and lower acceleration resulting in nearby non-trucks only being involved in loss of control. Unfortunately, most crash data records are incomplete when reporting the effects of truck incidents when they are not directly involved in collisions. Accordingly, unless there is a very powerful negative effect on safety associated with operation of triple left-turn lanes, crash data will not be sufficient to unearth an effect. When UF developed its work plan, the possibility of using crash surrogates was considered as a means of evaluating the safety of triple left-turn lanes. We believed we could use encroachments into adjacent lanes as one possible surrogate measure. From our review of our videotapes collected during the project, it now seems unlikely that we can use such encroachment data because: (1) there is limited field of view on some of these tapes, preventing us from determining whether there is encroachment into the nearest opposing lane during the transition from one roadway to another; (2) on some of the tapes, there is some lane changing within the intersection, but few of these events have been considered as hazardous situations; and (3) the coding with the Event Time Series (ETS) device makes it difficult to record all the headways, vehicle types, and subtle vehicle encroachments. We have considered another possible surrogate…the stability of headways when large vehicles are discharged into the traffic stream. A truck entering one of the queues in a double or triple left-turn lane is expected to disturb both its lane and adjacent lanes, although the disturbance may not significantly impact these lanes. Intersections with wide lanes and large radius of curvature or an intersection with acute angle with only left-turn lanes in roadway, such as SW 16th & Archer in Gainesville, Florida, will probably be relatively insensitive to such a “disturbance” except under high flow conditions. At the intersection of SW College Road (SR 200) and 17th Street in Ocala, Florida, passenger vehicle and truck traffic was recorded at the two 17th Street northbound left turn lanes as vehicles moved to go west onto College Road. As can be seen in Figure 3-4 the presence of trucks, compared to autos alone, in either or both turn lanes introduces a significant degree of increased variability in headways. As can be seen in this figure, trucks in Lane 1 had a greater effect. Such an effect has the potential for both reducing traffic flows and increases crashes. This argues for taking a closer look at headway variability for different locations, number of left-turn lanes, and the position of the trucks or trailers in the queues. Unfortunately, the acquisition and analysis of additional data of this type was beyond the scope of the project.
2 Miaou, S.; Hu, P.; Wright, T.; Davis, S.; and Rathi, A. "Development of the Relationship Between Truck Accidents and Geometric Design," Federal Highway Administration, August 1991.
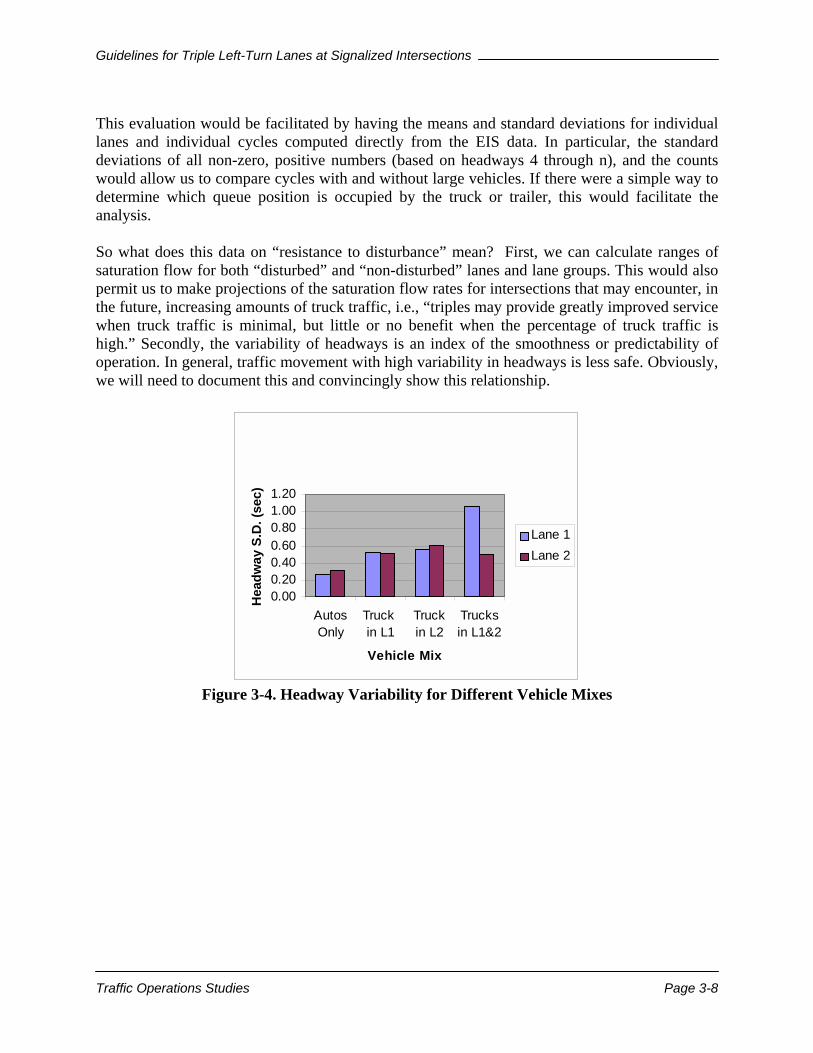
Guidelines for Triple Left-Turn Lanes at Signalized Intersections
Traffic Operations Studies Page 3-8
This evaluation would be facilitated by having the means and standard deviations for individual lanes and individual cycles computed directly from the EIS data. In particular, the standard deviations of all non-zero, positive numbers (based on headways 4 through n), and the counts would allow us to compare cycles with and without large vehicles. If there were a simple way to determine which queue position is occupied by the truck or trailer, this would facilitate the analysis. So what does this data on “resistance to disturbance” mean? First, we can calculate ranges of saturation flow for both “disturbed” and “non-disturbed” lanes and lane groups. This would also permit us to make projections of the saturation flow rates for intersections that may encounter, in the future, increasing amounts of truck traffic, i.e., “triples may provide greatly improved service when truck traffic is minimal, but little or no benefit when the percentage of truck traffic is high.” Secondly, the variability of headways is an index of the smoothness or predictability of operation. In general, traffic movement with high variability in headways is less safe. Obviously, we will need to document this and convincingly show this relationship.
Headway Variability for Different Vehicle Mixes
0.000.200.400.600.801.001.20
AutosOnly
Truck in L1
Truckin L2
Trucksin L1&2
Vehicle Mix
Hea
dway
S.D
. (se
c)
Lane 1Lane 2
Figure 3-4. Headway Variability for Different Vehicle Mixes
Guidelines for Triple Left-Turn Lanes at Signalized Intersections
Modeling of Triple Left Turns Page 4-1
4. MODELING OF TRIPLE LEFT TURNS As pointed out in Chapter 2, several software products have emerged from the development of models for the design and evaluation of traffic signal operation. All of the commonly used programs are capable of modeling triple left turns in the sense that they accept three lanes as an input value for any movement, including left turns. The question at this point is whether or not the models recognize the unique properties of triple left turns, as opposed to three lanes that happen to be turning left. The purpose of this chapter is to establish how realistically traffic models interpret a triple left turn and what changes can be incorporated to improve the programs’ treatment of this configuration.
4.1 Unique Features of Triple Left Turns
4.1.1 Lane Utilization In a triple lane left-turn movement, an important consideration is placed on how the lanes are utilized. The ideal case would be if all lanes were utilized equally. This would produce the highest capacity for the movement. However, this is not the case. Based on previous studies performed by Leonard (1994) and Jolicoeur (1999), the lane utilization of a triple lane left-turn movement is unique in the aspect that it cannot be obtained through the extension of any other facility. Although it resembles a dual lane left-turn movement with an additional lane, its behavior has been shown, in previous studies, to be quite different. The question that remains to be answered is whether or not the traffic models recognize a triple left turn to be a unique situation or do they try to model it as if it were a dual left turn.
4.1.2 Effect of Large Trucks Another important factor in a triple lane left-turn movement is the percentage of heavy vehicles in the traffic stream. Trucks or trailers such as the WB 40+ design vehicle are of particular concern. The higher the proportion of heavy vehicles, the lower the capacity of the movement. The capacity reduction is due to the heavy vehicle’s inability to 1) accelerate as quickly as a passenger car, and 2) maneuver as easily through the intersection due to its size. The slow progression of a heavy vehicle delays those vehicles behind it. The question is not whether high truck percentages lower the capacity of a triple left turn, but whether existing models treat this fact realistically.

Guidelines for Triple Left-Turn Lanes at Signalized Intersections
Modeling of Triple Left Turns Page 4-2
4.1.3 Effect of the Turning Radius The turning radius is another factor that warrants attention in the design of triple lanes. As evident in the study performed by Ackeret (1994), the smaller the radius, the lower the driver’s perception of safety in successfully traversing the intersection. This is particularly true of drivers in the middle lane that fear being sideswiped by the vehicles traveling alongside them. In fact, with most values of the turning radius, it is impossible for three heavy vehicles to simultaneously negotiate a turn. The overlapping paths of three turning trucks are illustrated in Figure 4-1.
Figure 4-1. Illustration of the Turning Paths for Three WB-40s Attempting to Make a Left Turn Simultaneously
To compensate for their insecurity while progressing through the turn, drivers tend to travel at much slower speeds. This, in turn, leads to lower volumes on the movement. In fact, if the turning radius is too small then certain sized heavy vehicles will not be able to travel the link. The trend suggests that as the turning radius decreases, so does the capacity. However, the question that remains to be answered is whether the traffic models recognize this trend.
4.1.4 Effect of the Angle of Intersection The angle of intersection of the two roadways is another important geometric consideration in a triple lane left-turn movement. The angle in question is formed by the link on which the triple lane left-turn movement is located and its downstream link where the traffic enters.
Guidelines for Triple Left-Turn Lanes at Signalized Intersections
Modeling of Triple Left Turns Page 4-3
The most common angle is 90 degrees, however, there are some cases where the geometry of the intersection does not allow for this. In such cases the resulting design might produce an angle less than 90 degrees. This angle would be referred to as a “sharp” or acute angle. The sharper this angle the more difficult it becomes for a driver to negotiate the turn. This, in turn, forces the driver to travel at lower speeds than would normally be found at right-angled intersections. The lower travel speed reduces the capacity. The question that remains is whether or not the traffic models recognize this trend.
4.1.5 Upstream Lane Distribution The upstream lane distribution is also an important factor. The distribution indicates the percentage of vehicles that occupy each lane. The ideal case (highest capacity) would be one in which the vehicles are equally dispersed among the three lanes. This would prevent large queues from building up in one lane while other lanes are not being utilized fully. It would also reduce the amount of upstream lane changing. Clearly, if all of the vehicles were in the lanes that they ultimately wanted to be in, then the number of lane changes would be zero. As the number of lane changes increases, the capacity of the movement decreases due to the perturbation resulting from each lane change. Again, the question that remains to be answered: Is this trend recognized in the traffic models?
4.1.6 Downstream Lanes Effects The downstream effects of a triple lane left-turn movement are one of the most important considerations in the design and analysis of the movement. The conditions downstream have the potential to override all of the other operational characteristics thus far. If the downstream link becomes over saturated, then the potential for spillback (i.e., vehicles entering a link exceeds the storage capacity) occurs. If the spillback is severe then a phenomenon known as gridlock may occur. Gridlock results from the mutual interference of two movements, each of which prevents the other from proceeding. The question that remains is how the traffic models will address occurrences of spillback and gridlock in simulation.
4.2 Candidate Models Four Traffic models that are commonly used for evaluating the operation of signalized intersections were described in Chapter 2:
• HCM/HCS • SIDRA • TRANSYT-7F • CORSIM
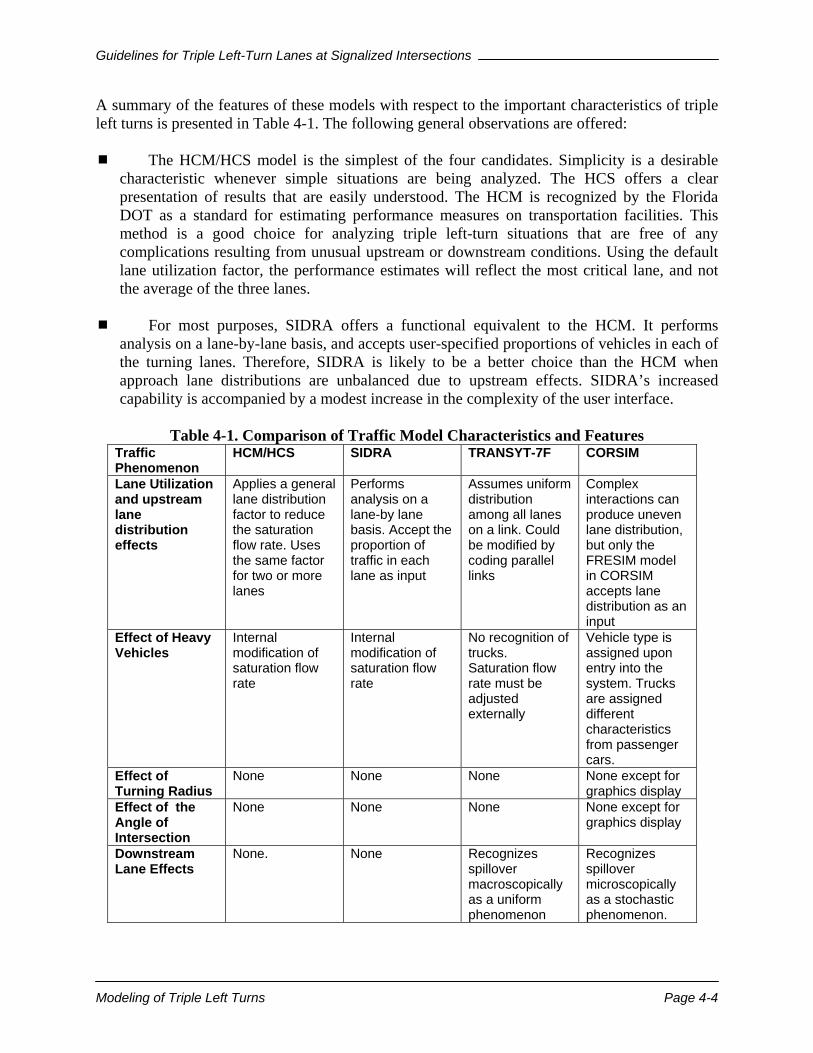
Guidelines for Triple Left-Turn Lanes at Signalized Intersections
Modeling of Triple Left Turns Page 4-4
A summary of the features of these models with respect to the important characteristics of triple left turns is presented in Table 4-1. The following general observations are offered: ! The HCM/HCS model is the simplest of the four candidates. Simplicity is a desirable
characteristic whenever simple situations are being analyzed. The HCS offers a clear presentation of results that are easily understood. The HCM is recognized by the Florida DOT as a standard for estimating performance measures on transportation facilities. This method is a good choice for analyzing triple left-turn situations that are free of any complications resulting from unusual upstream or downstream conditions. Using the default lane utilization factor, the performance estimates will reflect the most critical lane, and not the average of the three lanes.
! For most purposes, SIDRA offers a functional equivalent to the HCM. It performs analysis on a lane-by-lane basis, and accepts user-specified proportions of vehicles in each of the turning lanes. Therefore, SIDRA is likely to be a better choice than the HCM when approach lane distributions are unbalanced due to upstream effects. SIDRA’s increased capability is accompanied by a modest increase in the complexity of the user interface.
Table 4-1. Comparison of Traffic Model Characteristics and Features
Traffic Phenomenon
HCM/HCS SIDRA TRANSYT-7F CORSIM
Lane Utilization and upstream lane distribution effects
Applies a general lane distribution factor to reduce the saturation flow rate. Uses the same factor for two or more lanes
Performs analysis on a lane-by lane basis. Accept the proportion of traffic in each lane as input
Assumes uniform distribution among all lanes on a link. Could be modified by coding parallel links
Complex interactions can produce uneven lane distribution, but only the FRESIM model in CORSIM accepts lane distribution as an input
Effect of Heavy Vehicles
Internal modification of saturation flow rate
Internal modification of saturation flow rate
No recognition of trucks. Saturation flow rate must be adjusted externally
Vehicle type is assigned upon entry into the system. Trucks are assigned different characteristics from passenger cars.
Effect of Turning Radius
None None None None except for graphics display
Effect of the Angle of Intersection
None None None None except for graphics display
Downstream Lane Effects
None. None Recognizes spillover macroscopically as a uniform phenomenon
Recognizes spillover microscopically as a stochastic phenomenon.

Guidelines for Triple Left-Turn Lanes at Signalized Intersections
Modeling of Triple Left Turns Page 4-5
! Neither SIDRA nor the HCM recognize the effects of adjacent intersections, either upstream or downstream of the triple left-turn approach. Upstream intersections can cause unbalanced lane distributions, especially if a large proportion of the triple left-turn traffic enters the upstream segment as a turning movement from a single lane. Downstream signals can also create unbalanced lane distributions because of origin-destination patterns (e.g., if a large proportion of the triple left-turn traffic turns either right or left at a nearby downstream intersection).
! Upstream intersections can also produce heavily platooned arrivals that could affect the
operation of a triple left turn lane adversely. Both upstream and downstream signals could have adverse signal timing offset relationships that could produce problems that are not recognized by either of these single intersection programs.
! If the downstream link, which carries traffic away from the triple left turn, has fewer than
three lanes, then the operation requires a more detailed investigation than single intersection programs can provide. Under these conditions, the operational feasibility should be assessed with a multi-intersection model.
! While TRANSYT-7F and CORSIM have many features not found in the single intersection
models, neither program was designed to deal explicitly with triple left turns. ! Before any guidelines on the choice between TRANSYT-7F and CORSIM can be offered, it
is necessary to consider the workings of these two models in more detail, and to examine the results of some experiments that were performed in connection with this study.
4.3 Evaluation Framework There are four different scenarios that will be created to evaluate these two models:
1. a triple left turn facility with a downstream lane reduction;
2. a triple left turn facility with a downstream exclusive right-turn lane;
3. a triple left-turn facility with a downstream exclusive left-turn lane; and
4. a triple left-turn facility with a closely spaced downstream signal.
The analysis of the downstream lane reduction scenario will center on establishing minimum merging section lengths for various traffic conditions. The analysis of the other three scenarios will center on how traffic models handle the effects of spillback and gridlock on the upstream intersection. Keep in mind that the main purpose of this chapter is to establish how realistically traffic models interpret a triple left-turn facility and what changes can be incorporated to improve the programs’ simulation of such designs. The initial data coding was carried out using the Arterial Analysis Package, version 2K (AAP2K). This is a new Windows-based version of the AAP, which is still under development. The development phase has created the opportunity to introduce a special facility configuration
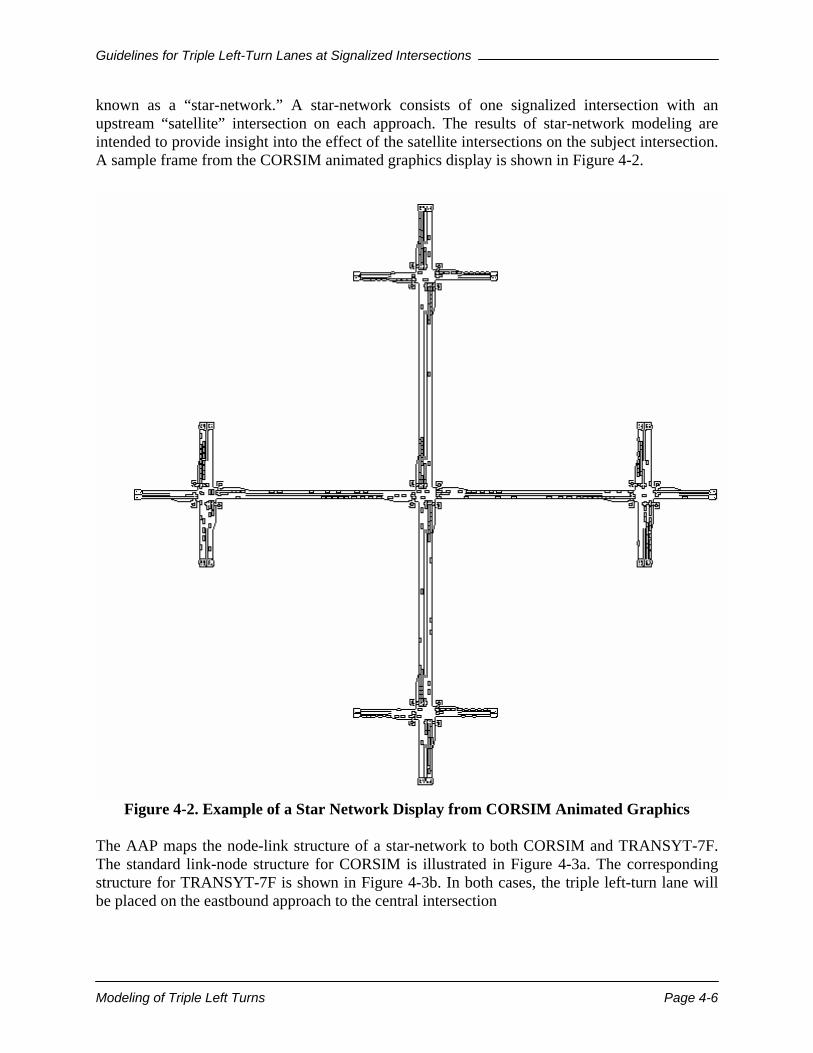
Guidelines for Triple Left-Turn Lanes at Signalized Intersections
Modeling of Triple Left Turns Page 4-6
known as a “star-network.” A star-network consists of one signalized intersection with an upstream “satellite” intersection on each approach. The results of star-network modeling are intended to provide insight into the effect of the satellite intersections on the subject intersection. A sample frame from the CORSIM animated graphics display is shown in Figure 4-2.
Figure 4-2. Example of a Star Network Display from CORSIM Animated Graphics The AAP maps the node-link structure of a star-network to both CORSIM and TRANSYT-7F. The standard link-node structure for CORSIM is illustrated in Figure 4-3a. The corresponding structure for TRANSYT-7F is shown in Figure 4-3b. In both cases, the triple left-turn lane will be placed on the eastbound approach to the central intersection
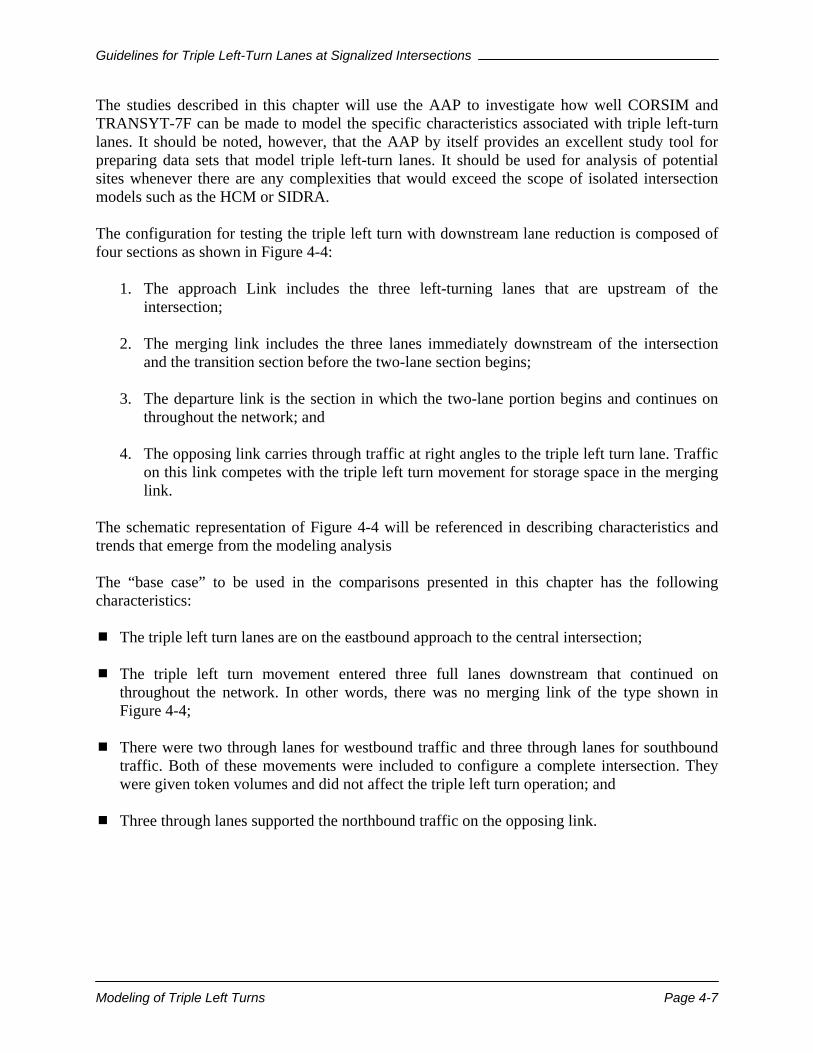
Guidelines for Triple Left-Turn Lanes at Signalized Intersections
Modeling of Triple Left Turns Page 4-7
The studies described in this chapter will use the AAP to investigate how well CORSIM and TRANSYT-7F can be made to model the specific characteristics associated with triple left-turn lanes. It should be noted, however, that the AAP by itself provides an excellent study tool for preparing data sets that model triple left-turn lanes. It should be used for analysis of potential sites whenever there are any complexities that would exceed the scope of isolated intersection models such as the HCM or SIDRA. The configuration for testing the triple left turn with downstream lane reduction is composed of four sections as shown in Figure 4-4:
1. The approach Link includes the three left-turning lanes that are upstream of the
intersection;
2. The merging link includes the three lanes immediately downstream of the intersection and the transition section before the two-lane section begins;
3. The departure link is the section in which the two-lane portion begins and continues on
throughout the network; and
4. The opposing link carries through traffic at right angles to the triple left turn lane. Traffic on this link competes with the triple left turn movement for storage space in the merging link.
The schematic representation of Figure 4-4 will be referenced in describing characteristics and trends that emerge from the modeling analysis The “base case” to be used in the comparisons presented in this chapter has the following characteristics: ! The triple left turn lanes are on the eastbound approach to the central intersection; ! The triple left turn movement entered three full lanes downstream that continued on
throughout the network. In other words, there was no merging link of the type shown in Figure 4-4;
! There were two through lanes for westbound traffic and three through lanes for southbound
traffic. Both of these movements were included to configure a complete intersection. They were given token volumes and did not affect the triple left turn operation; and
! Three through lanes supported the northbound traffic on the opposing link.
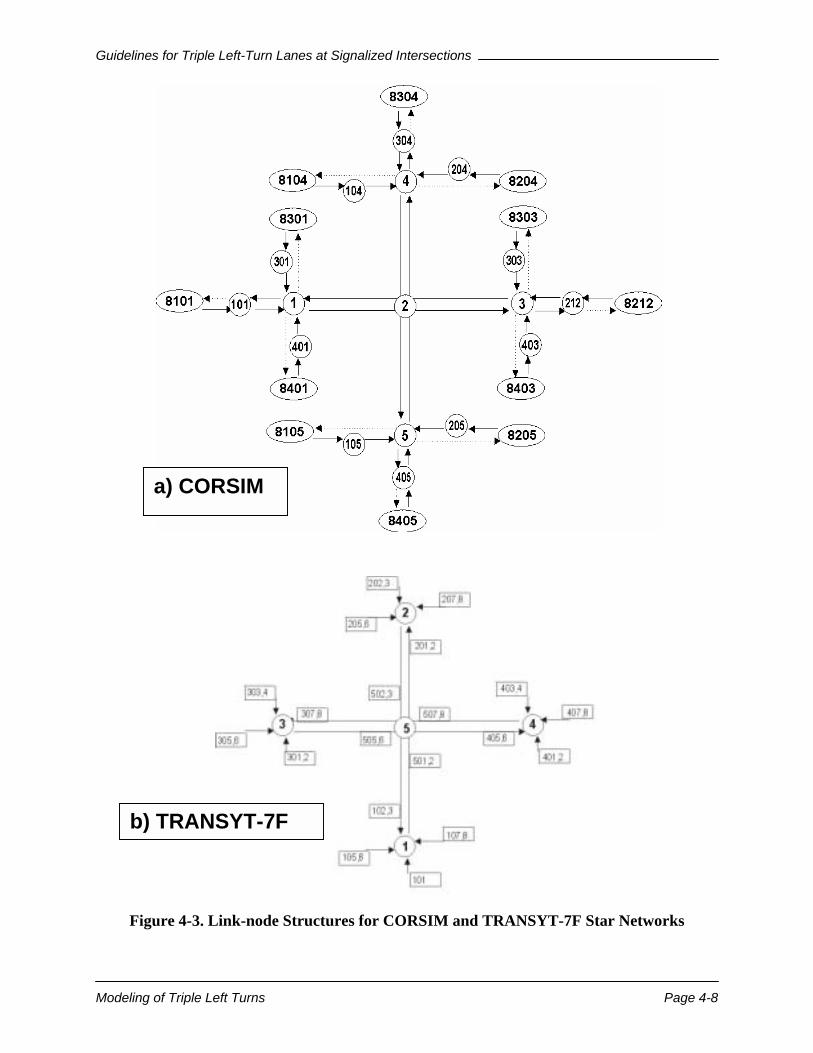
Guidelines for Triple Left-Turn Lanes at Signalized Intersections
Modeling of Triple Left Turns Page 4-8
Figure 4-3. Link-node Structures for CORSIM and TRANSYT-7F Star Networks
a) CORSIM
b) TRANSYT-7F
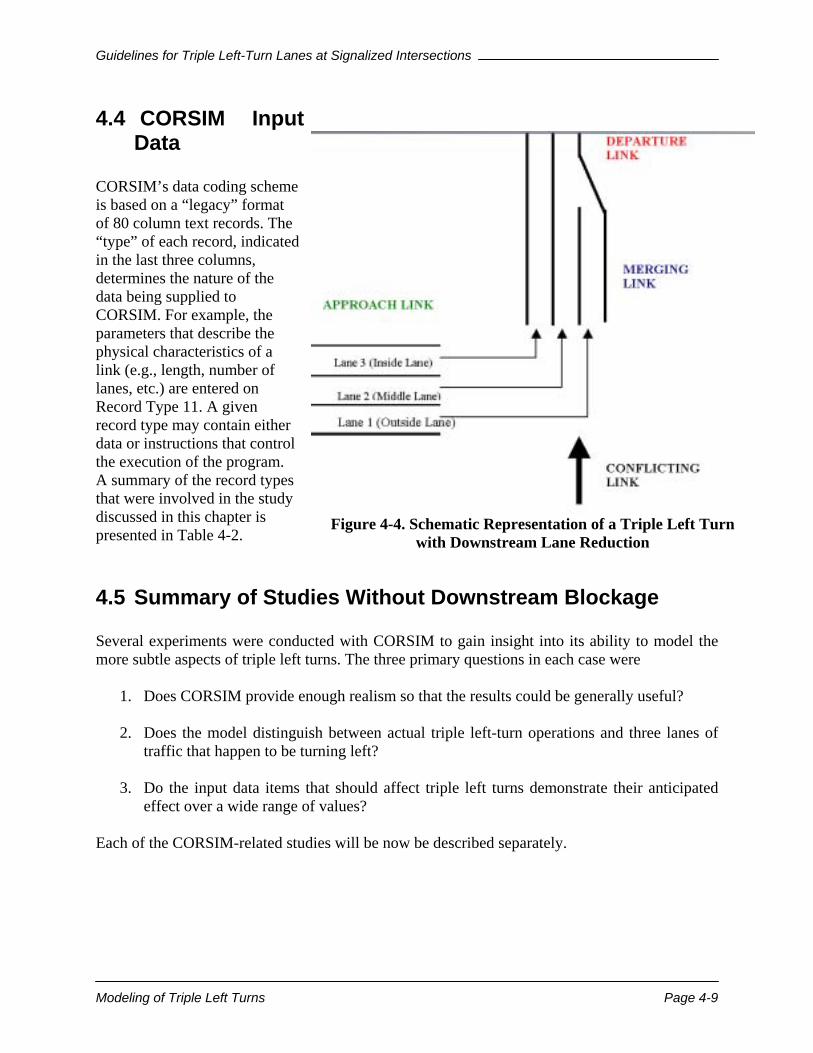
Guidelines for Triple Left-Turn Lanes at Signalized Intersections
Modeling of Triple Left Turns Page 4-9
4.4 CORSIM Input Data
CORSIM’s data coding scheme is based on a “legacy” format of 80 column text records. The “type” of each record, indicated in the last three columns, determines the nature of the data being supplied to CORSIM. For example, the parameters that describe the physical characteristics of a link (e.g., length, number of lanes, etc.) are entered on Record Type 11. A given record type may contain either data or instructions that control the execution of the program. A summary of the record types that were involved in the study discussed in this chapter is presented in Table 4-2.
Figure 4-4. Schematic Representation of a Triple Left Turn with Downstream Lane Reduction
4.5 Summary of Studies Without Downstream Blockage Several experiments were conducted with CORSIM to gain insight into its ability to model the more subtle aspects of triple left turns. The three primary questions in each case were
1. Does CORSIM provide enough realism so that the results could be generally useful?
2. Does the model distinguish between actual triple left-turn operations and three lanes of traffic that happen to be turning left?
3. Do the input data items that should affect triple left turns demonstrate their anticipated
effect over a wide range of values? Each of the CORSIM-related studies will be now be described separately.
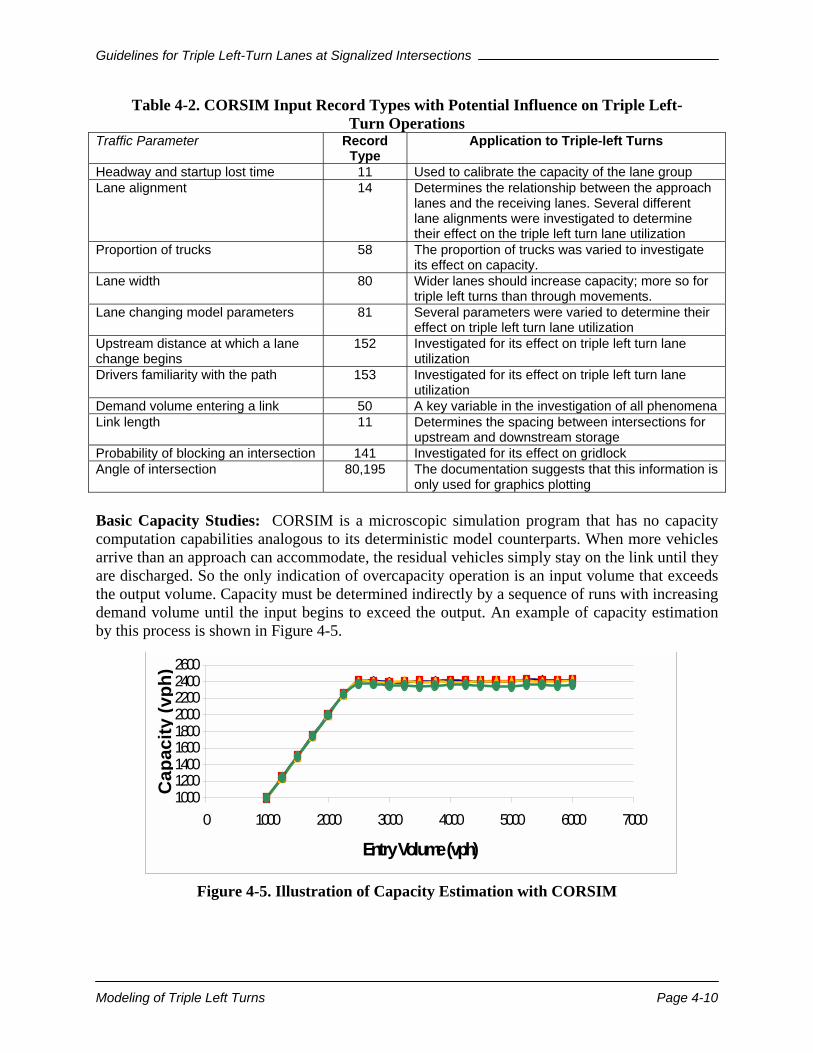
Guidelines for Triple Left-Turn Lanes at Signalized Intersections
Modeling of Triple Left Turns Page 4-10
Table 4-2. CORSIM Input Record Types with Potential Influence on Triple Left-Turn Operations
Basic Capacity Studies: CORSIM is a microscopic simulation program that has no capacity computation capabilities analogous to its deterministic model counterparts. When more vehicles arrive than an approach can accommodate, the residual vehicles simply stay on the link until they are discharged. So the only indication of overcapacity operation is an input volume that exceeds the output volume. Capacity must be determined indirectly by a sequence of runs with increasing demand volume until the input begins to exceed the output. An example of capacity estimation by this process is shown in Figure 4-5.
Figure 4-5. Illustration of Capacity Estimation with CORSIM
Traffic Parameter Record Type
Application to Triple-left Turns
Headway and startup lost time 11 Used to calibrate the capacity of the lane group Lane alignment 14 Determines the relationship between the approach
lanes and the receiving lanes. Several different lane alignments were investigated to determine their effect on the triple left turn lane utilization
Proportion of trucks 58 The proportion of trucks was varied to investigate its effect on capacity.
Lane width 80 Wider lanes should increase capacity; more so for triple left turns than through movements.
Lane changing model parameters 81 Several parameters were varied to determine their effect on triple left turn lane utilization
Upstream distance at which a lane change begins
152 Investigated for its effect on triple left turn lane utilization
Drivers familiarity with the path 153 Investigated for its effect on triple left turn lane utilization
Demand volume entering a link 50 A key variable in the investigation of all phenomena Link length 11 Determines the spacing between intersections for
upstream and downstream storage Probability of blocking an intersection 141 Investigated for its effect on gridlock Angle of intersection 80,195 The documentation suggests that this information is
only used for graphics plotting
100012001400160018002000220024002600
0 1000 2000 3000 4000 5000 6000 7000
Entry Volume (vph)
Cap
acity
(vph
)
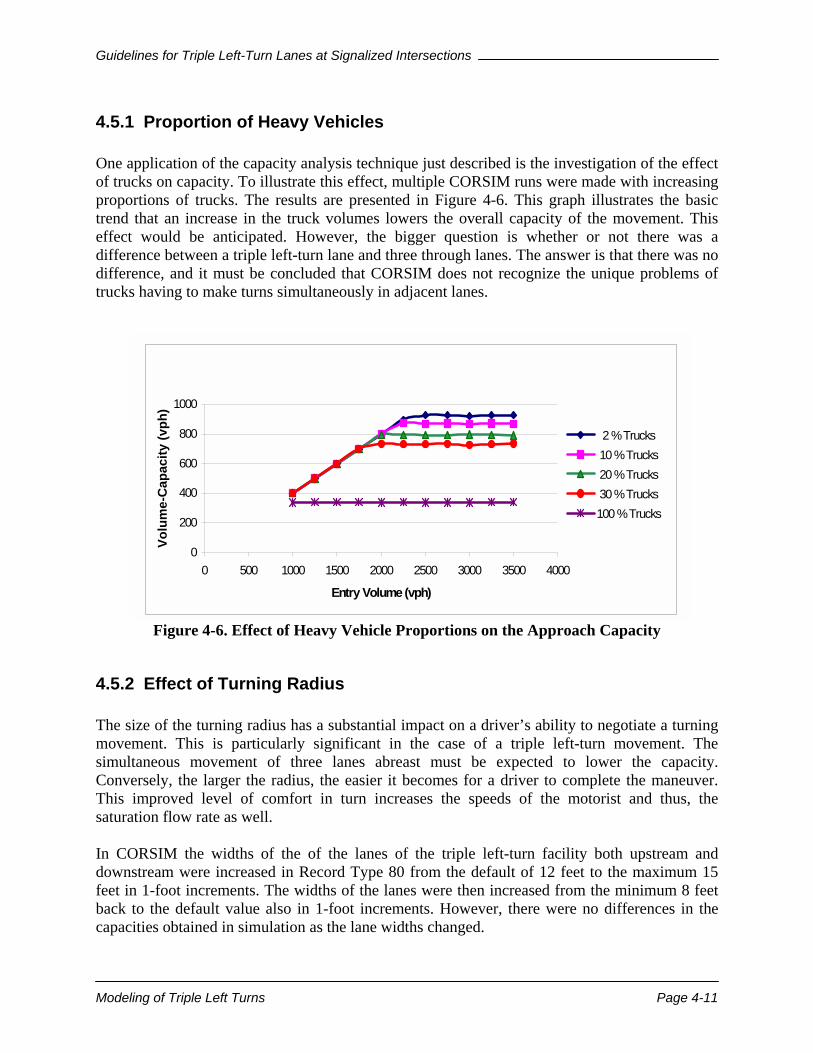
Guidelines for Triple Left-Turn Lanes at Signalized Intersections
Modeling of Triple Left Turns Page 4-11
4.5.1 Proportion of Heavy Vehicles One application of the capacity analysis technique just described is the investigation of the effect of trucks on capacity. To illustrate this effect, multiple CORSIM runs were made with increasing proportions of trucks. The results are presented in Figure 4-6. This graph illustrates the basic trend that an increase in the truck volumes lowers the overall capacity of the movement. This effect would be anticipated. However, the bigger question is whether or not there was a difference between a triple left-turn lane and three through lanes. The answer is that there was no difference, and it must be concluded that CORSIM does not recognize the unique problems of trucks having to make turns simultaneously in adjacent lanes.
Figure 4-6. Effect of Heavy Vehicle Proportions on the Approach Capacity
4.5.2 Effect of Turning Radius The size of the turning radius has a substantial impact on a driver’s ability to negotiate a turning movement. This is particularly significant in the case of a triple left-turn movement. The simultaneous movement of three lanes abreast must be expected to lower the capacity. Conversely, the larger the radius, the easier it becomes for a driver to complete the maneuver. This improved level of comfort in turn increases the speeds of the motorist and thus, the saturation flow rate as well. In CORSIM the widths of the of the lanes of the triple left-turn facility both upstream and downstream were increased in Record Type 80 from the default of 12 feet to the maximum 15 feet in 1-foot increments. The widths of the lanes were then increased from the minimum 8 feet back to the default value also in 1-foot increments. However, there were no differences in the capacities obtained in simulation as the lane widths changed.
Percentage of Trucks vs Volume-Capacity
0
200
400
600
800
1000
0 500 1000 1500 2000 2500 3000 3500 4000
Entry Volume (vph)
Volu
me-
Cap
acity
(vph
)
2 % Trucks 10 % Trucks 20 % Trucks 30 % Trucks100 % Trucks

Guidelines for Triple Left-Turn Lanes at Signalized Intersections
Modeling of Triple Left Turns Page 4-12
4.5.3 Angle of Intersection The angle of the intersection is another geometric design factor that significantly impacts the operation of a triple left-turn facility. The sharper the angle, the more difficult the maneuver becomes for the drivers. This results in lower capacities on the movement. In this analysis, the sharper angles used were acute angles, angles less than 90 degrees, ranging from 30 degrees to a maximum of 90 degrees in 5-degree increments. The angles were calculated by repositioning of downstream nodes in Record Type 195 while keeping the length of the downstream links constant for all angles. Obtuse angles, angles greater than 90 degrees, were also used in the analysis to provide a contrast to the previous case. The obtuse angles used, which ranged from 90 degrees to a maximum of 150 degrees in 5-degree increments, were calculated and obtained in a similar fashion. Continuing an emerging pattern, the results from both the acute and obtuse angles showed there to be no difference in the capacities obtained in simulation as the angles changed.
4.5.4 Turning Volume Distribution by Lane CORSIM handles all lane distributions internally through a combination of features that attempt 1) to get the vehicle into the proper lane as it enters the link, and 2) to cause it to change lanes if some advantage could be achieved. The freeway part of CORSIM (i.e., FRESIM) actually allows the lane distribution to be specified at the link entry point. However, the surface street portion (i.e., NETSIM) does not. As indicated in Table 4-2, CORSIM provides several input parameters on Record Types 14, 81, 152 and 153 that could be expected to influence the lane changing behavior. All of these inputs were tested in connection with this study and, without belaboring the point further, no significant effects were found. It was noted that, with the default parameters, the middle lane utilization was slightly higher than either the inside or outside lanes. This is contrary to the results of field studies, which indicate a higher utilization of the inside lane. It was possible to cause a slight shift of traffic between lanes, but other compensating effects eliminated any overall influence on the total capacity of triple left turn lanes. Based on the results of the study to this point, it would have to be concluded that CORSIM does not recognize the operational characteristics of triple left-turn lanes. There is also some question as to the effect of the input parameter adjustment on any aspect of the operation. All of the parameter adjustments discussed to this point are specific to CORSIM, and are too microscopic to be treated by TRANSYT. Most of the parameters would be expected to have some effect on the saturation flow rate, which is a user-specified input to TRANSYT. Therefore, no specific experiments were performed using TRANSYT on situations without downstream effects.
Guidelines for Triple Left-Turn Lanes at Signalized Intersections
Modeling of Triple Left Turns Page 4-13
4.6 Downstream Lane Reductions When traffic from three left-turn lanes must be accommodated in two lanes downstream, a tapered lane drop is required to allow the outside lane to merge into the through traffic. In this case, the length of the merge area becomes a major design concern. The primary research task for this problem is not the compilation of simulation runs, but trying to determine what to compile. There is no universal performance measure for the acceptability of a lane drop that can be obtained from a simulation model such as CORSIM.
4.6.1 Previous Modeling Approaches and Criteria In an earlier attempt to address this problem, Shen (2001) conducted CORSIM simulation studies for a triple left-turn configuration with a downstream merging section. An example of the results of those studies is presented in Figure 4-7. Shen’s guidelines for the minimum required merging section length were based on the overall average delay experienced by all of the vehicles involved in the merge. Other criteria will also be explored in the study described on this report.
4.6.2 Candidate Criteria The operation of the merging section is conceptually simple. Vehicles in the outside lane will store in the merge area until they get a clear opportunity to enter the traffic stream. It is clearly necessary to avoid a situation in which a queue of vehicles would be expected to extend beyond the entry point to the merge area, because such vehicles would block the intersection. So the existence of spillback at any at any point in the cycle would be a reasonable criterion for determining minimum merge area length. When spillback occurs, vehicles on one approach or another (not always the triple left-turn approach) will be unable to enter the intersection and a loss of capacity will result. So, another possible criterion for the minimum merge area length would be the maximization of capacity. This is a multidimensional problem with many parameters including: The number of lanes on the “opposing” approach, defined earlier as the approach to the right of the triple left turn, because traffic on this approach competes for capacity at the merge point with the triple left turn. Configurations with three lanes on the opposing approach pose a more critical situation than configurations with only two lanes;
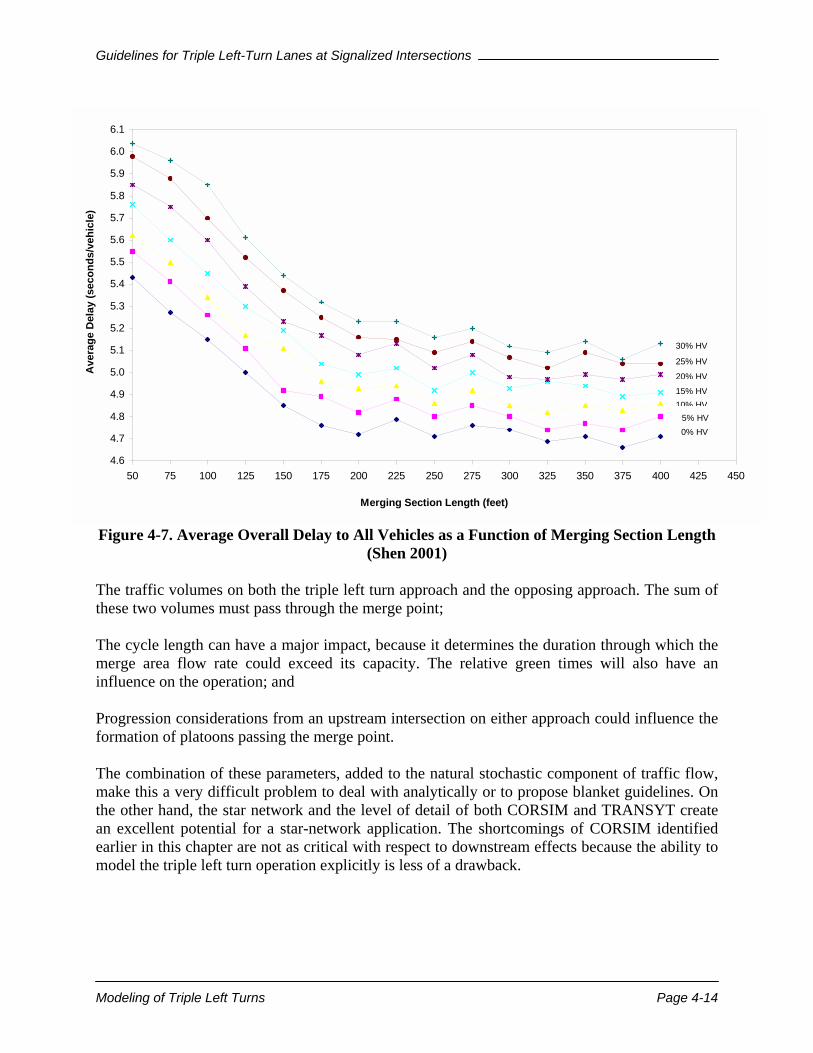
Guidelines for Triple Left-Turn Lanes at Signalized Intersections
Modeling of Triple Left Turns Page 4-14
Figure 4-7. Average Overall Delay to All Vehicles as a Function of Merging Section Length (Shen 2001)
The traffic volumes on both the triple left turn approach and the opposing approach. The sum of these two volumes must pass through the merge point; The cycle length can have a major impact, because it determines the duration through which the merge area flow rate could exceed its capacity. The relative green times will also have an influence on the operation; and Progression considerations from an upstream intersection on either approach could influence the formation of platoons passing the merge point. The combination of these parameters, added to the natural stochastic component of traffic flow, make this a very difficult problem to deal with analytically or to propose blanket guidelines. On the other hand, the star network and the level of detail of both CORSIM and TRANSYT create an excellent potential for a star-network application. The shortcomings of CORSIM identified earlier in this chapter are not as critical with respect to downstream effects because the ability to model the triple left turn operation explicitly is less of a drawback.
4.6
4.7
4.8
4.9
5.0
5.1
5.2
5.3
5.4
5.5
5.6
5.7
5.8
5.9
6.0
6.1
50 75 100 125 150 175 200 225 250 275 300 325 350 375 400 425 450
Merging Section Length (feet)
Ave
rage
Del
ay (s
econ
ds/v
ehic
le)
0% HV5% HV
10% HV15% HV
20% HV
25% HV
30% HV
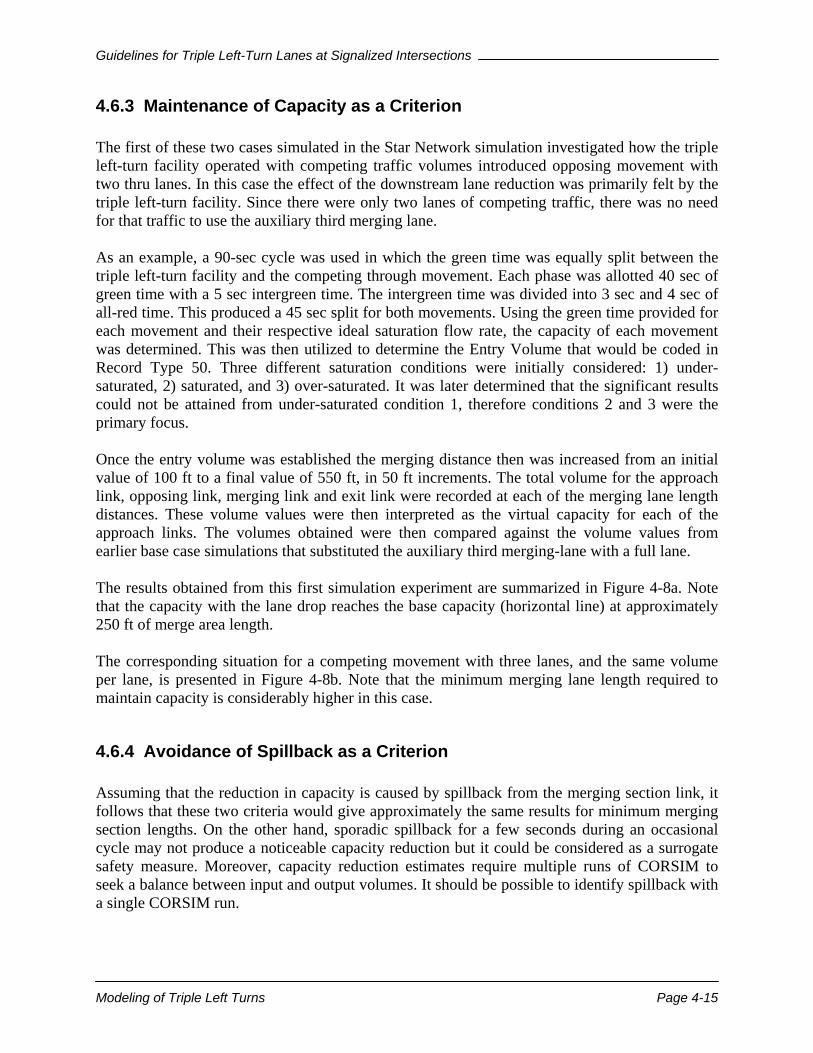
Guidelines for Triple Left-Turn Lanes at Signalized Intersections
Modeling of Triple Left Turns Page 4-15
4.6.3 Maintenance of Capacity as a Criterion The first of these two cases simulated in the Star Network simulation investigated how the triple left-turn facility operated with competing traffic volumes introduced opposing movement with two thru lanes. In this case the effect of the downstream lane reduction was primarily felt by the triple left-turn facility. Since there were only two lanes of competing traffic, there was no need for that traffic to use the auxiliary third merging lane. As an example, a 90-sec cycle was used in which the green time was equally split between the triple left-turn facility and the competing through movement. Each phase was allotted 40 sec of green time with a 5 sec intergreen time. The intergreen time was divided into 3 sec and 4 sec of all-red time. This produced a 45 sec split for both movements. Using the green time provided for each movement and their respective ideal saturation flow rate, the capacity of each movement was determined. This was then utilized to determine the Entry Volume that would be coded in Record Type 50. Three different saturation conditions were initially considered: 1) under- saturated, 2) saturated, and 3) over-saturated. It was later determined that the significant results could not be attained from under-saturated condition 1, therefore conditions 2 and 3 were the primary focus. Once the entry volume was established the merging distance then was increased from an initial value of 100 ft to a final value of 550 ft, in 50 ft increments. The total volume for the approach link, opposing link, merging link and exit link were recorded at each of the merging lane length distances. These volume values were then interpreted as the virtual capacity for each of the approach links. The volumes obtained were then compared against the volume values from earlier base case simulations that substituted the auxiliary third merging-lane with a full lane. The results obtained from this first simulation experiment are summarized in Figure 4-8a. Note that the capacity with the lane drop reaches the base capacity (horizontal line) at approximately 250 ft of merge area length. The corresponding situation for a competing movement with three lanes, and the same volume per lane, is presented in Figure 4-8b. Note that the minimum merging lane length required to maintain capacity is considerably higher in this case.
4.6.4 Avoidance of Spillback as a Criterion Assuming that the reduction in capacity is caused by spillback from the merging section link, it follows that these two criteria would give approximately the same results for minimum merging section lengths. On the other hand, sporadic spillback for a few seconds during an occasional cycle may not produce a noticeable capacity reduction but it could be considered as a surrogate safety measure. Moreover, capacity reduction estimates require multiple runs of CORSIM to seek a balance between input and output volumes. It should be possible to identify spillback with a single CORSIM run.

Guidelines for Triple Left-Turn Lanes at Signalized Intersections
Modeling of Triple Left Turns Page 4-16
The most reliable way to spot occasional spillback with CORSIM is to view the animated graphics display, which gives a second by second picture of queue formation and service. Spillback is illustrated in the example of the animated graphics presented in Figure 4-9.
Figure 4-8. Merging Section Capacity with Two and Three Lanes of Competing Traffic
Capacity of Merging Link vs. Merging Link Length
3000
3100
3200
3300
3400
3500
3600
0 50 100 150 200 250 300 350 400 450 500 550 600
Link Length (ft)
Cap
acity
(vph
)
Capacity of Merging Link vs. Merging Link Length
3000310032003300340035003600370038003900400041004200
0 50 100 150 200 250 300 350 400 450 500 550 600
Link Length (ft)
Cap
acity
(vph
)
a. Two Lane Competing Movement
b. Three Lane Competing Movement
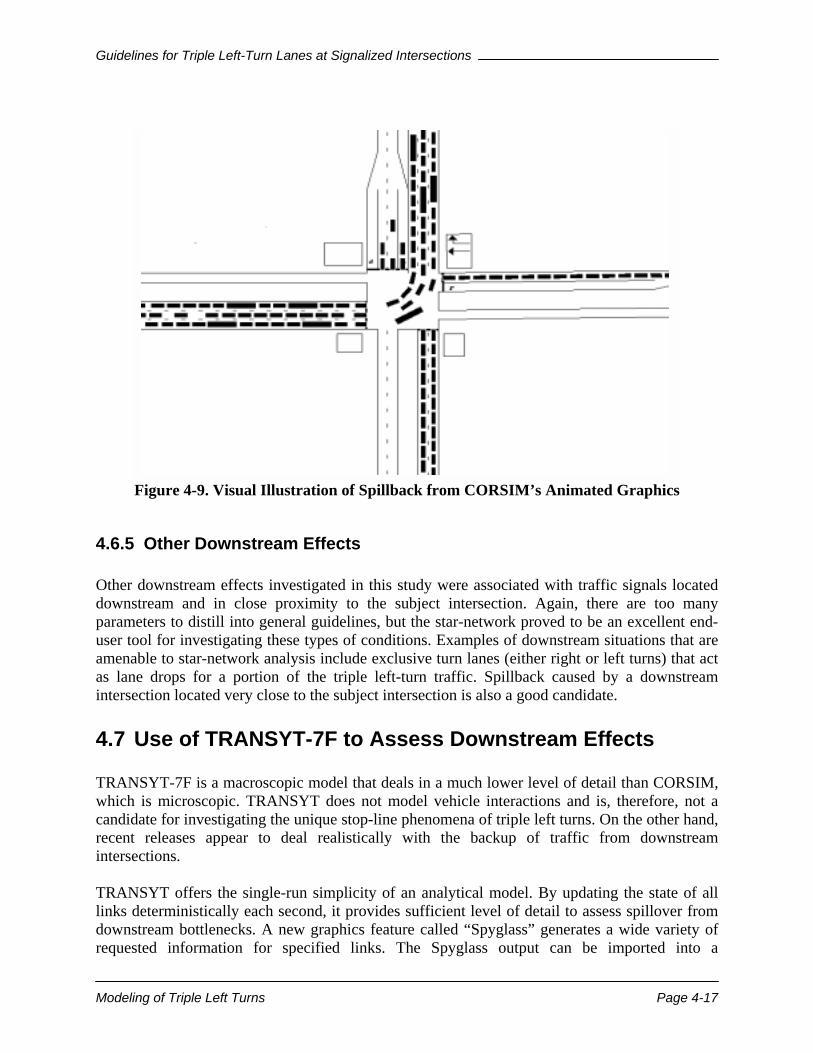
Guidelines for Triple Left-Turn Lanes at Signalized Intersections
Modeling of Triple Left Turns Page 4-17
Figure 4-9. Visual Illustration of Spillback from CORSIM’s Animated Graphics
4.6.5 Other Downstream Effects Other downstream effects investigated in this study were associated with traffic signals located downstream and in close proximity to the subject intersection. Again, there are too many parameters to distill into general guidelines, but the star-network proved to be an excellent end-user tool for investigating these types of conditions. Examples of downstream situations that are amenable to star-network analysis include exclusive turn lanes (either right or left turns) that act as lane drops for a portion of the triple left-turn traffic. Spillback caused by a downstream intersection located very close to the subject intersection is also a good candidate.
4.7 Use of TRANSYT-7F to Assess Downstream Effects TRANSYT-7F is a macroscopic model that deals in a much lower level of detail than CORSIM, which is microscopic. TRANSYT does not model vehicle interactions and is, therefore, not a candidate for investigating the unique stop-line phenomena of triple left turns. On the other hand, recent releases appear to deal realistically with the backup of traffic from downstream intersections. TRANSYT offers the single-run simplicity of an analytical model. By updating the state of all links deterministically each second, it provides sufficient level of detail to assess spillover from downstream bottlenecks. A new graphics feature called “Spyglass” generates a wide variety of requested information for specified links. The Spyglass output can be imported into a
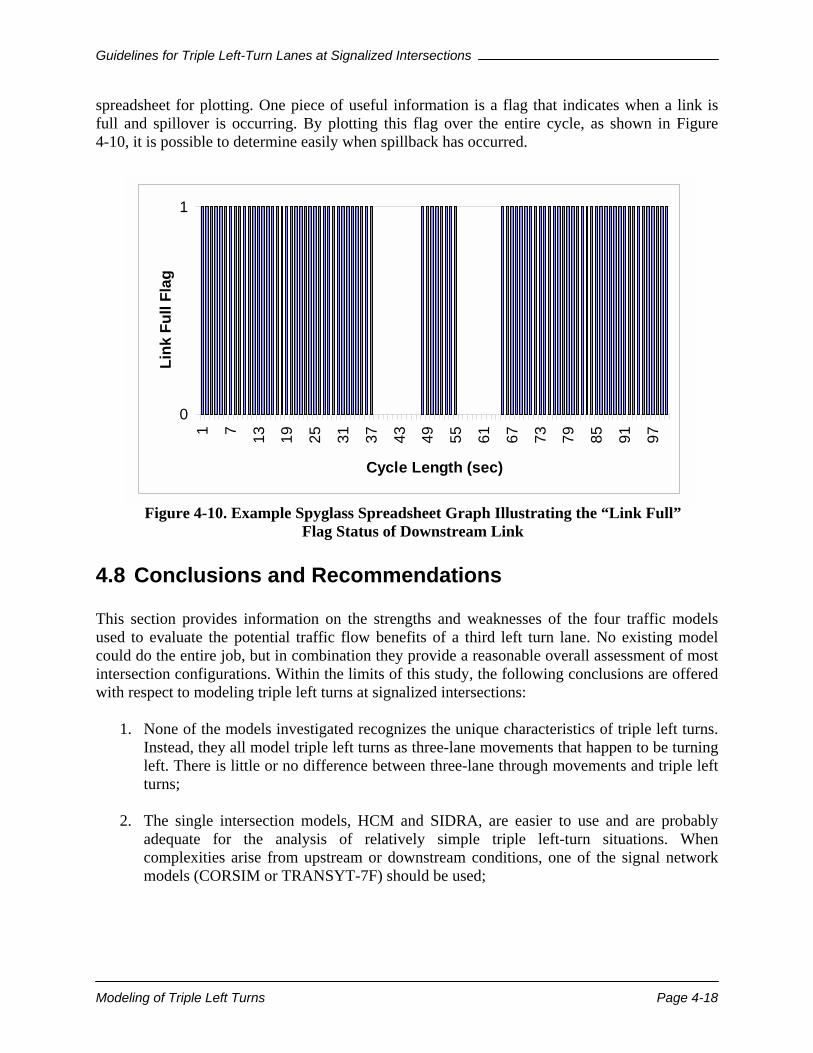
Guidelines for Triple Left-Turn Lanes at Signalized Intersections
Modeling of Triple Left Turns Page 4-18
spreadsheet for plotting. One piece of useful information is a flag that indicates when a link is full and spillover is occurring. By plotting this flag over the entire cycle, as shown in Figure 4-10, it is possible to determine easily when spillback has occurred.
Figure 4-10. Example Spyglass Spreadsheet Graph Illustrating the “Link Full” Flag Status of Downstream Link
4.8 Conclusions and Recommendations This section provides information on the strengths and weaknesses of the four traffic models used to evaluate the potential traffic flow benefits of a third left turn lane. No existing model could do the entire job, but in combination they provide a reasonable overall assessment of most intersection configurations. Within the limits of this study, the following conclusions are offered with respect to modeling triple left turns at signalized intersections:
1. None of the models investigated recognizes the unique characteristics of triple left turns. Instead, they all model triple left turns as three-lane movements that happen to be turning left. There is little or no difference between three-lane through movements and triple left turns;
2. The single intersection models, HCM and SIDRA, are easier to use and are probably
adequate for the analysis of relatively simple triple left-turn situations. When complexities arise from upstream or downstream conditions, one of the signal network models (CORSIM or TRANSYT-7F) should be used;
0
11 7 13 19 25 31 37 43 49 55 61 67 73 79 85 91 97
Cycle Length (sec)
Link
Ful
l Fla
g
Guidelines for Triple Left-Turn Lanes at Signalized Intersections
Modeling of Triple Left Turns Page 4-19
3. The network models appear to do a reasonable job of modeling spillback into the intersection from downstream bottlenecks, but they are not able to recognize problems associated with such phenomena as multiple trucks turning simultaneously;
4. Maintenance of capacity (i.e., avoiding capacity reductions) is a promising criterion for
determining the minimum merging section length when a triple left turn must enter a two-lane street. Avoidance of spillback may be a better criteria criterion, because of its increased sensitivity and potential as a safety surrogate. Both of these criteria require signalized intersection performance estimation software;
5. Both CORSIM and TRANSYT-7F are able to recognize spillover explicitly and to make
adjustments to the effective capacity of an approach to reflect the blockage caused by spillback;
6. CORSIM has several parameters in its input data structure that should be useful in
creating an operation that could represent triple left turns more realistically, but most of these items had no influence on the CORSIM performance estimations. This suggests that their effects are minimal, or that they are not implemented as per the CORSIM documentation; and
7. The star-network mapped into both CORSIM and TRANSYT-7F by the new version of
the Arterial Analysis Package is an effective tool for analyzing most intersections that have triple left turns with adjacent intersection effects.
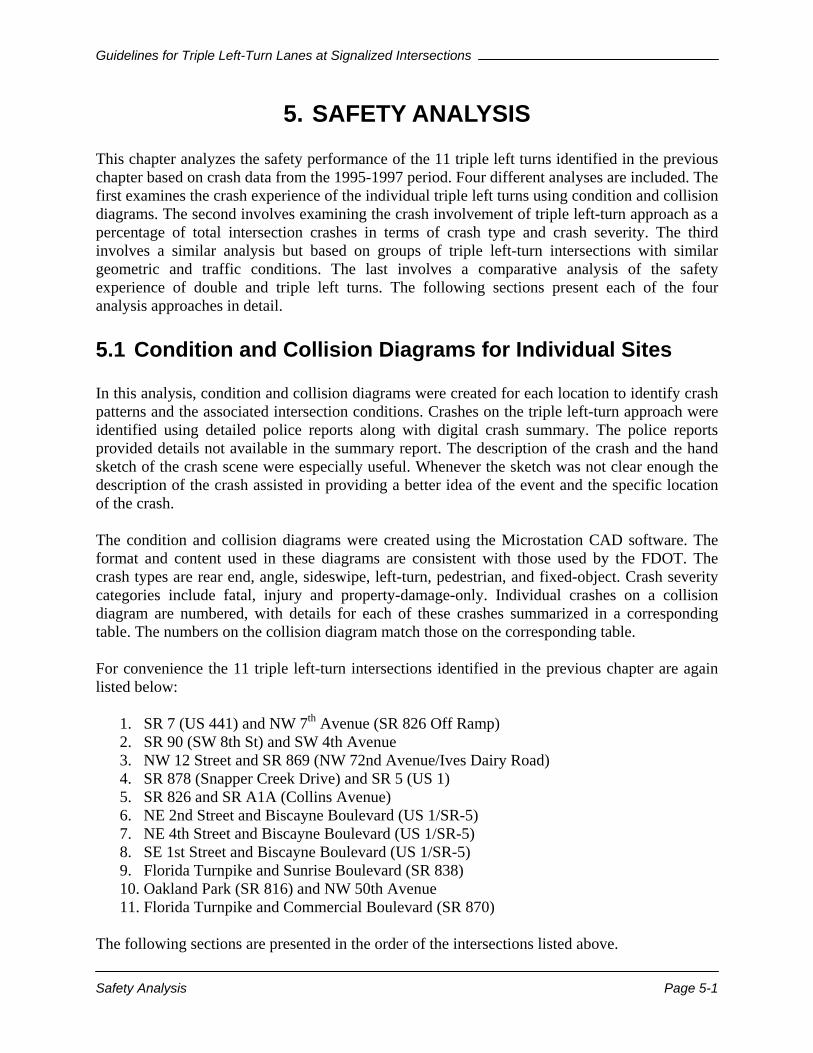
Guidelines for Triple Left-Turn Lanes at Signalized Intersections
Safety Analysis Page 5-1
5. SAFETY ANALYSIS This chapter analyzes the safety performance of the 11 triple left turns identified in the previous chapter based on crash data from the 1995-1997 period. Four different analyses are included. The first examines the crash experience of the individual triple left turns using condition and collision diagrams. The second involves examining the crash involvement of triple left-turn approach as a percentage of total intersection crashes in terms of crash type and crash severity. The third involves a similar analysis but based on groups of triple left-turn intersections with similar geometric and traffic conditions. The last involves a comparative analysis of the safety experience of double and triple left turns. The following sections present each of the four analysis approaches in detail.
5.1 Condition and Collision Diagrams for Individual Sites In this analysis, condition and collision diagrams were created for each location to identify crash patterns and the associated intersection conditions. Crashes on the triple left-turn approach were identified using detailed police reports along with digital crash summary. The police reports provided details not available in the summary report. The description of the crash and the hand sketch of the crash scene were especially useful. Whenever the sketch was not clear enough the description of the crash assisted in providing a better idea of the event and the specific location of the crash. The condition and collision diagrams were created using the Microstation CAD software. The format and content used in these diagrams are consistent with those used by the FDOT. The crash types are rear end, angle, sideswipe, left-turn, pedestrian, and fixed-object. Crash severity categories include fatal, injury and property-damage-only. Individual crashes on a collision diagram are numbered, with details for each of these crashes summarized in a corresponding table. The numbers on the collision diagram match those on the corresponding table. For convenience the 11 triple left-turn intersections identified in the previous chapter are again listed below:
1. SR 7 (US 441) and NW 7th Avenue (SR 826 Off Ramp) 2. SR 90 (SW 8th St) and SW 4th Avenue 3. NW 12 Street and SR 869 (NW 72nd Avenue/Ives Dairy Road) 4. SR 878 (Snapper Creek Drive) and SR 5 (US 1) 5. SR 826 and SR A1A (Collins Avenue) 6. NE 2nd Street and Biscayne Boulevard (US 1/SR-5) 7. NE 4th Street and Biscayne Boulevard (US 1/SR-5) 8. SE 1st Street and Biscayne Boulevard (US 1/SR-5) 9. Florida Turnpike and Sunrise Boulevard (SR 838) 10. Oakland Park (SR 816) and NW 50th Avenue 11. Florida Turnpike and Commercial Boulevard (SR 870)
The following sections are presented in the order of the intersections listed above.
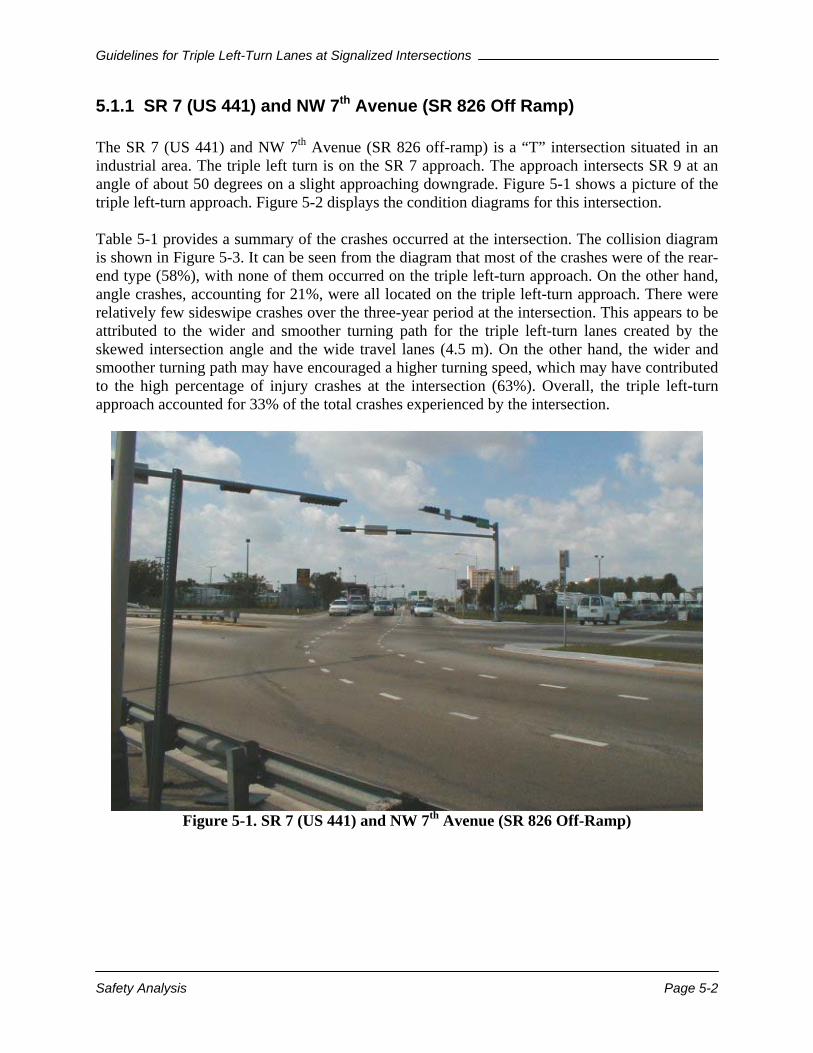
Guidelines for Triple Left-Turn Lanes at Signalized Intersections
Safety Analysis Page 5-2
5.1.1 SR 7 (US 441) and NW 7th Avenue (SR 826 Off Ramp) The SR 7 (US 441) and NW 7th Avenue (SR 826 off-ramp) is a “T” intersection situated in an industrial area. The triple left turn is on the SR 7 approach. The approach intersects SR 9 at an angle of about 50 degrees on a slight approaching downgrade. Figure 5-1 shows a picture of the triple left-turn approach. Figure 5-2 displays the condition diagrams for this intersection. Table 5-1 provides a summary of the crashes occurred at the intersection. The collision diagram is shown in Figure 5-3. It can be seen from the diagram that most of the crashes were of the rear-end type (58%), with none of them occurred on the triple left-turn approach. On the other hand, angle crashes, accounting for 21%, were all located on the triple left-turn approach. There were relatively few sideswipe crashes over the three-year period at the intersection. This appears to be attributed to the wider and smoother turning path for the triple left-turn lanes created by the skewed intersection angle and the wide travel lanes (4.5 m). On the other hand, the wider and smoother turning path may have encouraged a higher turning speed, which may have contributed to the high percentage of injury crashes at the intersection (63%). Overall, the triple left-turn approach accounted for 33% of the total crashes experienced by the intersection.
Figure 5-1. SR 7 (US 441) and NW 7th Avenue (SR 826 Off-Ramp)

Guidelines for Triple Left-Turn Lanes at Signalized Intersections
Safety Analysis Page 5-3
Figure 5-2. Condition Diagram for SR 7 (US 441) at NW 7th Avenue (SR 826 Off Ramp)
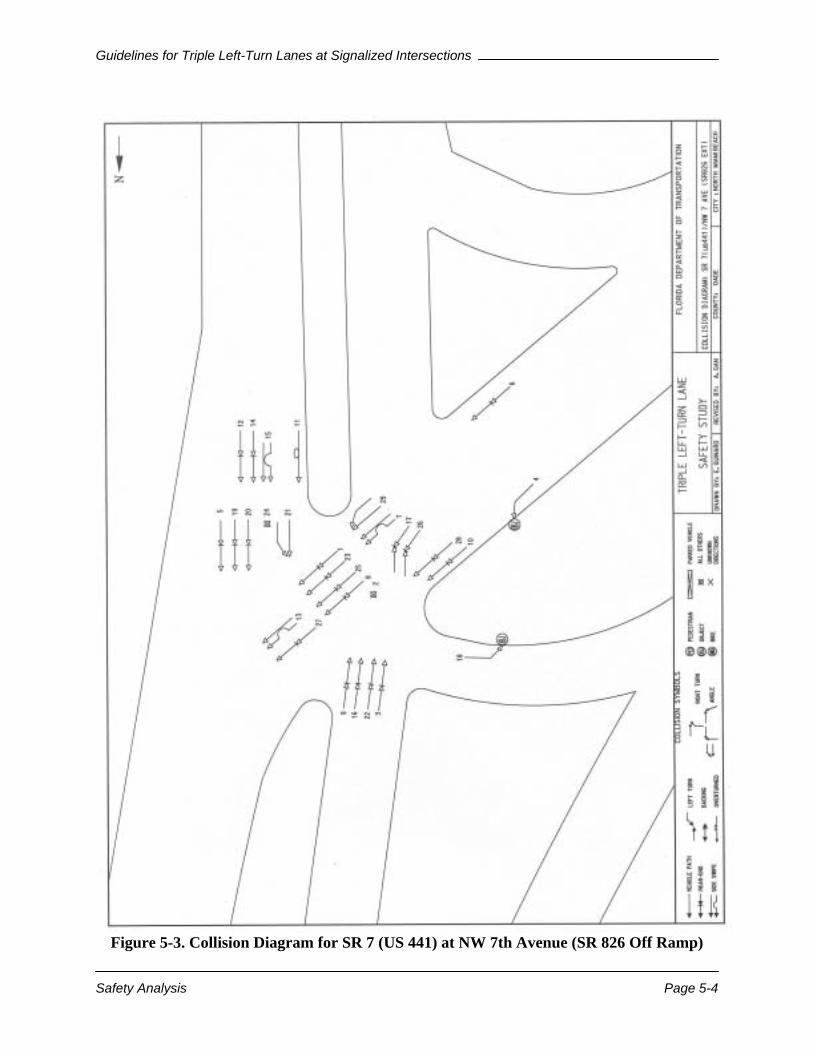
Guidelines for Triple Left-Turn Lanes at Signalized Intersections
Safety Analysis Page 5-4
Figure 5-3. Collision Diagram for SR 7 (US 441) at NW 7th Avenue (SR 826 Off Ramp)
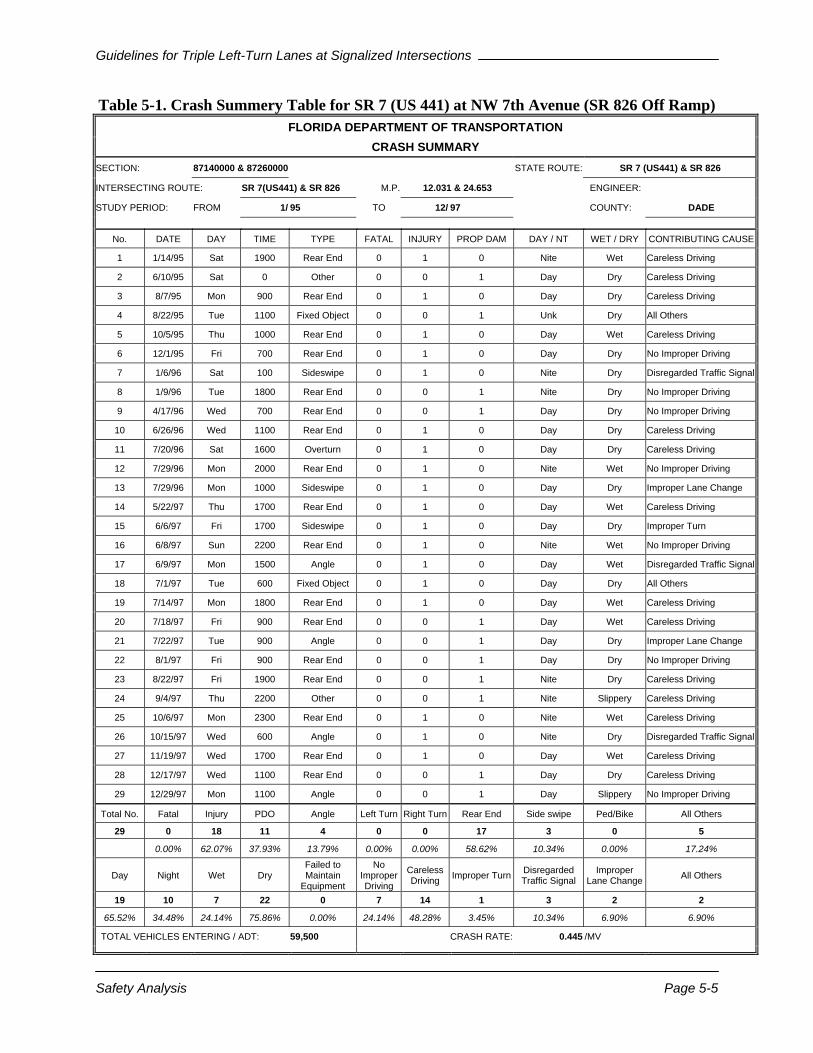
Guidelines for Triple Left-Turn Lanes at Signalized Intersections
Safety Analysis Page 5-5
Table 5-1. Crash Summery Table for SR 7 (US 441) at NW 7th Avenue (SR 826 Off Ramp) FLORIDA DEPARTMENT OF TRANSPORTATION
CRASH SUMMARY SECTION: 87140000 & 87260000 STATE ROUTE: SR 7 (US441) & SR 826
INTERSECTING ROUTE: SR 7(US441) & SR 826 M.P. 12.031 & 24.653 ENGINEER:
STUDY PERIOD: FROM 1/ 95 TO 12/ 97 COUNTY: DADE
No. DATE DAY TIME TYPE FATAL INJURY PROP DAM DAY / NT WET / DRY CONTRIBUTING CAUSE
1 1/14/95 Sat 1900 Rear End 0 1 0 Nite Wet Careless Driving
2 6/10/95 Sat 0 Other 0 0 1 Day Dry Careless Driving
3 8/7/95 Mon 900 Rear End 0 1 0 Day Dry Careless Driving
4 8/22/95 Tue 1100 Fixed Object 0 0 1 Unk Dry All Others
5 10/5/95 Thu 1000 Rear End 0 1 0 Day Wet Careless Driving
6 12/1/95 Fri 700 Rear End 0 1 0 Day Dry No Improper Driving
7 1/6/96 Sat 100 Sideswipe 0 1 0 Nite Dry Disregarded Traffic Signal
8 1/9/96 Tue 1800 Rear End 0 0 1 Nite Dry No Improper Driving
9 4/17/96 Wed 700 Rear End 0 0 1 Day Dry No Improper Driving
10 6/26/96 Wed 1100 Rear End 0 1 0 Day Dry Careless Driving
11 7/20/96 Sat 1600 Overturn 0 1 0 Day Dry Careless Driving
12 7/29/96 Mon 2000 Rear End 0 1 0 Nite Wet No Improper Driving
13 7/29/96 Mon 1000 Sideswipe 0 1 0 Day Dry Improper Lane Change
14 5/22/97 Thu 1700 Rear End 0 1 0 Day Wet Careless Driving
15 6/6/97 Fri 1700 Sideswipe 0 1 0 Day Dry Improper Turn
16 6/8/97 Sun 2200 Rear End 0 1 0 Nite Wet No Improper Driving
17 6/9/97 Mon 1500 Angle 0 1 0 Day Wet Disregarded Traffic Signal
18 7/1/97 Tue 600 Fixed Object 0 1 0 Day Dry All Others
19 7/14/97 Mon 1800 Rear End 0 1 0 Day Wet Careless Driving
20 7/18/97 Fri 900 Rear End 0 0 1 Day Wet Careless Driving
21 7/22/97 Tue 900 Angle 0 0 1 Day Dry Improper Lane Change
22 8/1/97 Fri 900 Rear End 0 0 1 Day Dry No Improper Driving
23 8/22/97 Fri 1900 Rear End 0 0 1 Nite Dry Careless Driving
24 9/4/97 Thu 2200 Other 0 0 1 Nite Slippery Careless Driving
25 10/6/97 Mon 2300 Rear End 0 1 0 Nite Wet Careless Driving
26 10/15/97 Wed 600 Angle 0 1 0 Nite Dry Disregarded Traffic Signal
27 11/19/97 Wed 1700 Rear End 0 1 0 Day Wet Careless Driving
28 12/17/97 Wed 1100 Rear End 0 0 1 Day Dry Careless Driving
29 12/29/97 Mon 1100 Angle 0 0 1 Day Slippery No Improper Driving
Total No. Fatal Injury PDO Angle Left Turn Right Turn Rear End Side swipe Ped/Bike All Others
29 0 18 11 4 0 0 17 3 0 5
0.00% 62.07% 37.93% 13.79% 0.00% 0.00% 58.62% 10.34% 0.00% 17.24%
Day Night Wet Dry Failed to Maintain
Equipment
No Improper Driving
Careless Driving Improper Turn Disregarded
Traffic Signal Improper
Lane Change All Others
19 10 7 22 0 7 14 1 3 2 2
65.52% 34.48% 24.14% 75.86% 0.00% 24.14% 48.28% 3.45% 10.34% 6.90% 6.90%
TOTAL VEHICLES ENTERING / ADT: 59,500 CRASH RATE: 0.445 /MV
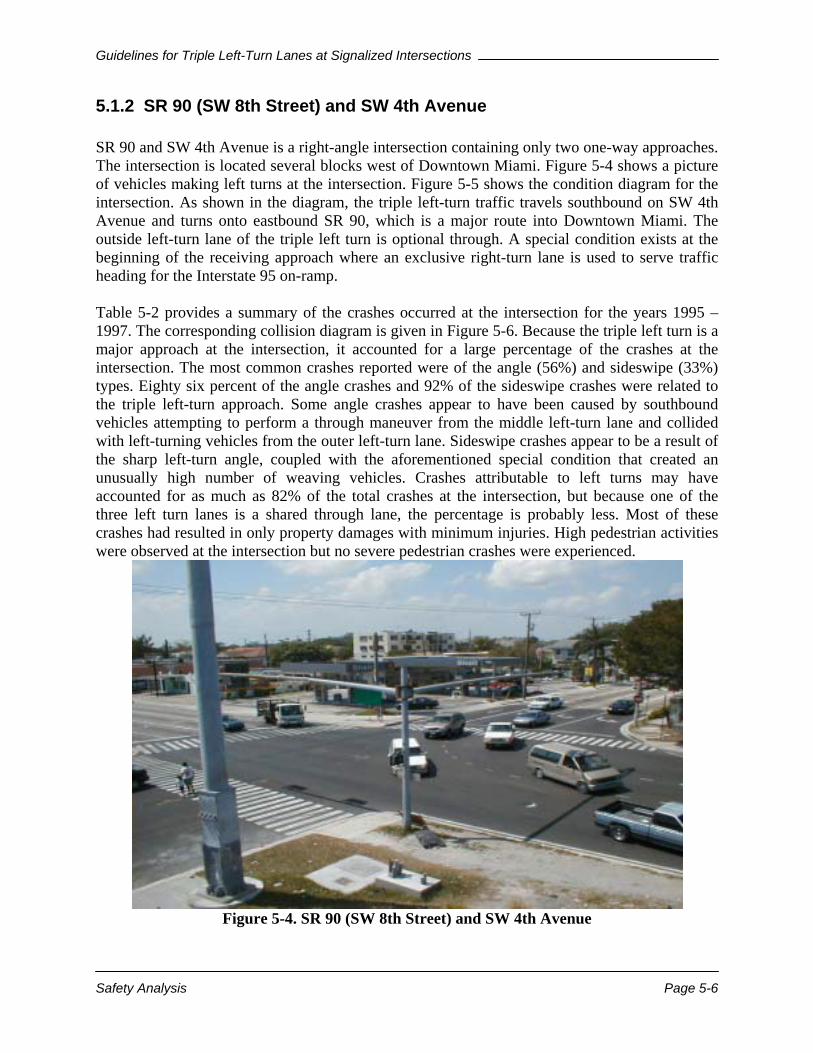
Guidelines for Triple Left-Turn Lanes at Signalized Intersections
Safety Analysis Page 5-6
5.1.2 SR 90 (SW 8th Street) and SW 4th Avenue SR 90 and SW 4th Avenue is a right-angle intersection containing only two one-way approaches. The intersection is located several blocks west of Downtown Miami. Figure 5-4 shows a picture of vehicles making left turns at the intersection. Figure 5-5 shows the condition diagram for the intersection. As shown in the diagram, the triple left-turn traffic travels southbound on SW 4th Avenue and turns onto eastbound SR 90, which is a major route into Downtown Miami. The outside left-turn lane of the triple left turn is optional through. A special condition exists at the beginning of the receiving approach where an exclusive right-turn lane is used to serve traffic heading for the Interstate 95 on-ramp. Table 5-2 provides a summary of the crashes occurred at the intersection for the years 1995 – 1997. The corresponding collision diagram is given in Figure 5-6. Because the triple left turn is a major approach at the intersection, it accounted for a large percentage of the crashes at the intersection. The most common crashes reported were of the angle (56%) and sideswipe (33%) types. Eighty six percent of the angle crashes and 92% of the sideswipe crashes were related to the triple left-turn approach. Some angle crashes appear to have been caused by southbound vehicles attempting to perform a through maneuver from the middle left-turn lane and collided with left-turning vehicles from the outer left-turn lane. Sideswipe crashes appear to be a result of the sharp left-turn angle, coupled with the aforementioned special condition that created an unusually high number of weaving vehicles. Crashes attributable to left turns may have accounted for as much as 82% of the total crashes at the intersection, but because one of the three left turn lanes is a shared through lane, the percentage is probably less. Most of these crashes had resulted in only property damages with minimum injuries. High pedestrian activities were observed at the intersection but no severe pedestrian crashes were experienced.
Figure 5-4. SR 90 (SW 8th Street) and SW 4th Avenue
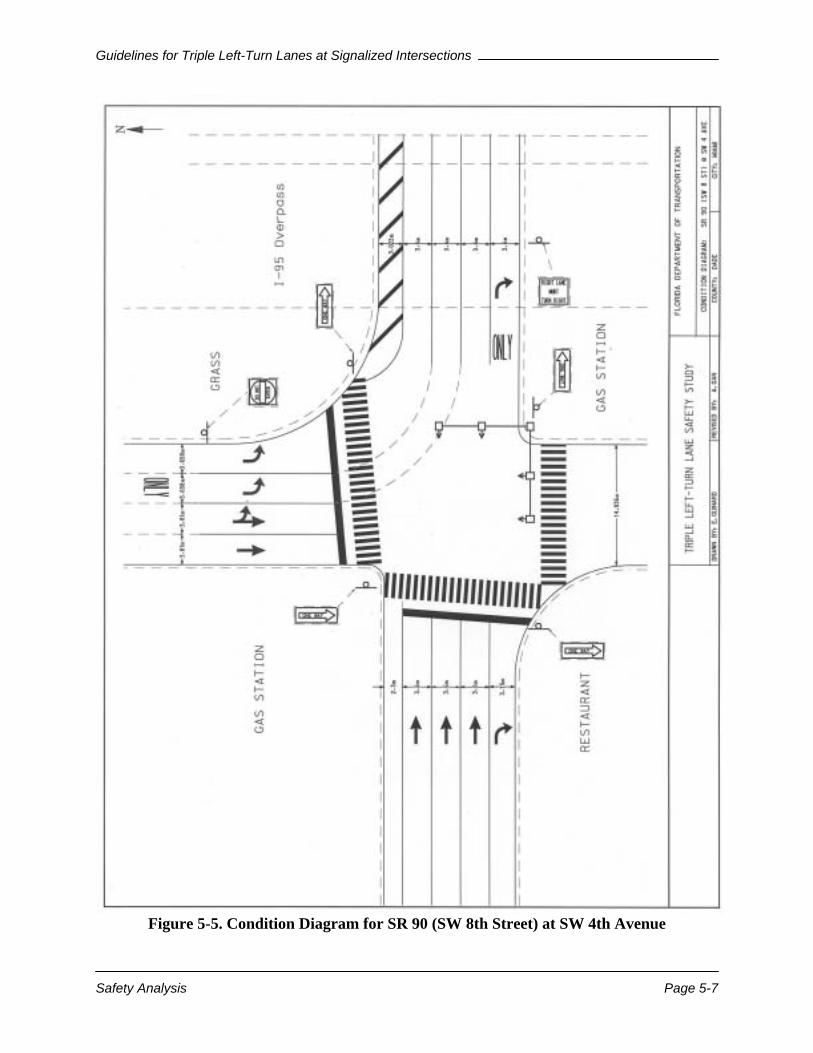
Guidelines for Triple Left-Turn Lanes at Signalized Intersections
Safety Analysis Page 5-7
Figure 5-5. Condition Diagram for SR 90 (SW 8th Street) at SW 4th Avenue

Guidelines for Triple Left-Turn Lanes at Signalized Intersections
Safety Analysis Page 5-8
Figure 5-6. Collision Diagram for SR 90 (SW 8th Street) at SW 4th Avenue
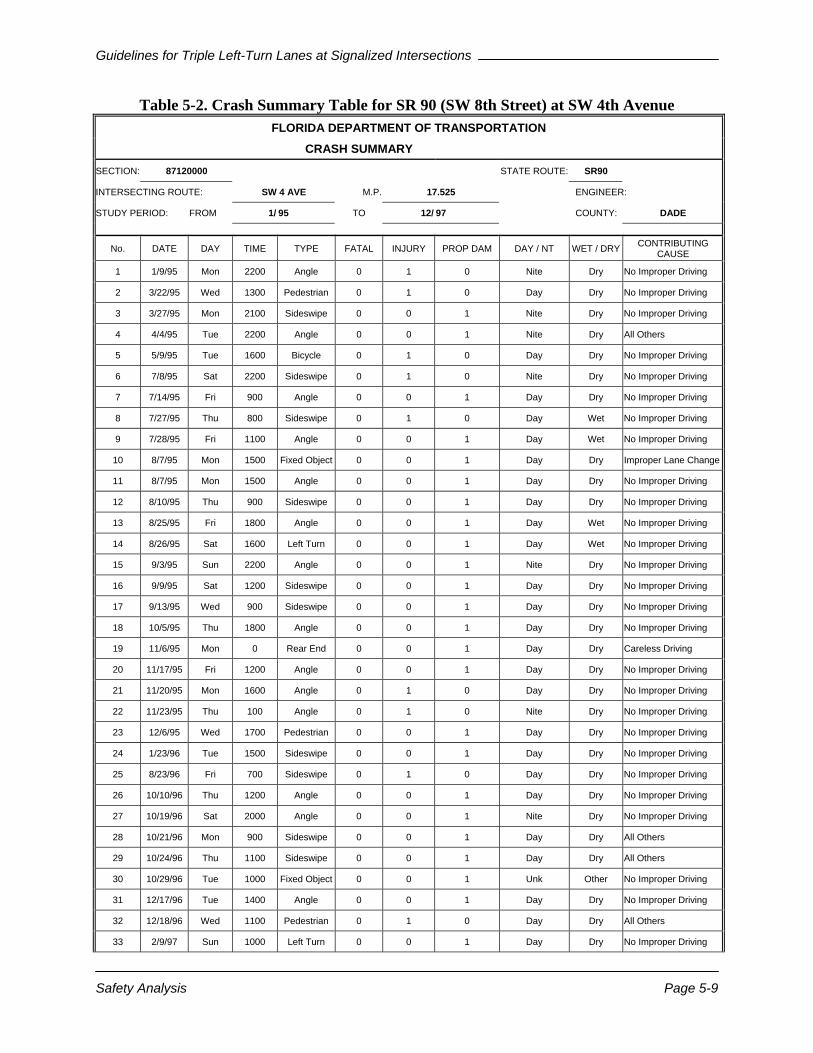
Guidelines for Triple Left-Turn Lanes at Signalized Intersections
Safety Analysis Page 5-9
Table 5-2. Crash Summary Table for SR 90 (SW 8th Street) at SW 4th Avenue FLORIDA DEPARTMENT OF TRANSPORTATION
CRASH SUMMARY SECTION: 87120000 STATE ROUTE: SR90
INTERSECTING ROUTE: SW 4 AVE M.P. 17.525 ENGINEER:
STUDY PERIOD: FROM 1/ 95 TO 12/ 97 COUNTY: DADE
No. DATE DAY TIME TYPE FATAL INJURY PROP DAM DAY / NT WET / DRY CONTRIBUTING CAUSE
1 1/9/95 Mon 2200 Angle 0 1 0 Nite Dry No Improper Driving
2 3/22/95 Wed 1300 Pedestrian 0 1 0 Day Dry No Improper Driving
3 3/27/95 Mon 2100 Sideswipe 0 0 1 Nite Dry No Improper Driving
4 4/4/95 Tue 2200 Angle 0 0 1 Nite Dry All Others
5 5/9/95 Tue 1600 Bicycle 0 1 0 Day Dry No Improper Driving
6 7/8/95 Sat 2200 Sideswipe 0 1 0 Nite Dry No Improper Driving
7 7/14/95 Fri 900 Angle 0 0 1 Day Dry No Improper Driving
8 7/27/95 Thu 800 Sideswipe 0 1 0 Day Wet No Improper Driving
9 7/28/95 Fri 1100 Angle 0 0 1 Day Wet No Improper Driving
10 8/7/95 Mon 1500 Fixed Object 0 0 1 Day Dry Improper Lane Change
11 8/7/95 Mon 1500 Angle 0 0 1 Day Dry No Improper Driving
12 8/10/95 Thu 900 Sideswipe 0 0 1 Day Dry No Improper Driving
13 8/25/95 Fri 1800 Angle 0 0 1 Day Wet No Improper Driving
14 8/26/95 Sat 1600 Left Turn 0 0 1 Day Wet No Improper Driving
15 9/3/95 Sun 2200 Angle 0 0 1 Nite Dry No Improper Driving
16 9/9/95 Sat 1200 Sideswipe 0 0 1 Day Dry No Improper Driving
17 9/13/95 Wed 900 Sideswipe 0 0 1 Day Dry No Improper Driving
18 10/5/95 Thu 1800 Angle 0 0 1 Day Dry No Improper Driving
19 11/6/95 Mon 0 Rear End 0 0 1 Day Dry Careless Driving
20 11/17/95 Fri 1200 Angle 0 0 1 Day Dry No Improper Driving
21 11/20/95 Mon 1600 Angle 0 1 0 Day Dry No Improper Driving
22 11/23/95 Thu 100 Angle 0 1 0 Nite Dry No Improper Driving
23 12/6/95 Wed 1700 Pedestrian 0 0 1 Day Dry No Improper Driving
24 1/23/96 Tue 1500 Sideswipe 0 0 1 Day Dry No Improper Driving
25 8/23/96 Fri 700 Sideswipe 0 1 0 Day Dry No Improper Driving
26 10/10/96 Thu 1200 Angle 0 0 1 Day Dry No Improper Driving
27 10/19/96 Sat 2000 Angle 0 0 1 Nite Dry No Improper Driving
28 10/21/96 Mon 900 Sideswipe 0 0 1 Day Dry All Others
29 10/24/96 Thu 1100 Sideswipe 0 0 1 Day Dry All Others
30 10/29/96 Tue 1000 Fixed Object 0 0 1 Unk Other No Improper Driving
31 12/17/96 Tue 1400 Angle 0 0 1 Day Dry No Improper Driving
32 12/18/96 Wed 1100 Pedestrian 0 1 0 Day Dry All Others
33 2/9/97 Sun 1000 Left Turn 0 0 1 Day Dry No Improper Driving
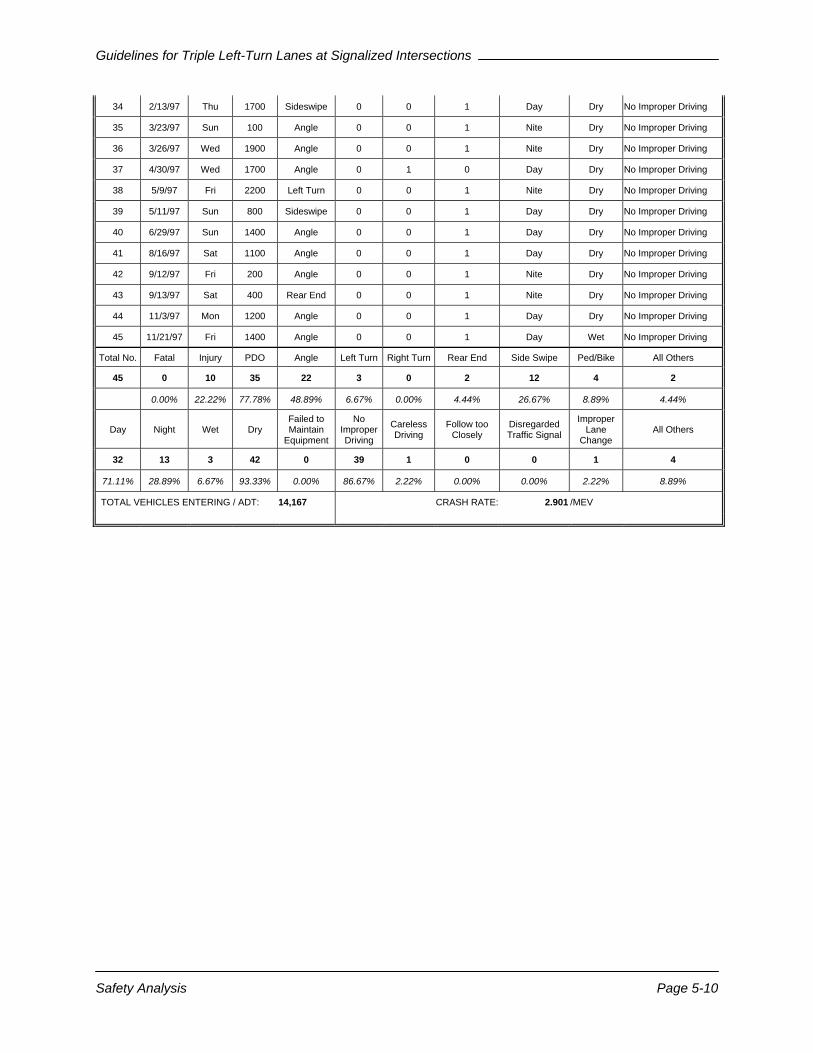
Guidelines for Triple Left-Turn Lanes at Signalized Intersections
Safety Analysis Page 5-10
34 2/13/97 Thu 1700 Sideswipe 0 0 1 Day Dry No Improper Driving
35 3/23/97 Sun 100 Angle 0 0 1 Nite Dry No Improper Driving
36 3/26/97 Wed 1900 Angle 0 0 1 Nite Dry No Improper Driving
37 4/30/97 Wed 1700 Angle 0 1 0 Day Dry No Improper Driving
38 5/9/97 Fri 2200 Left Turn 0 0 1 Nite Dry No Improper Driving
39 5/11/97 Sun 800 Sideswipe 0 0 1 Day Dry No Improper Driving
40 6/29/97 Sun 1400 Angle 0 0 1 Day Dry No Improper Driving
41 8/16/97 Sat 1100 Angle 0 0 1 Day Dry No Improper Driving
42 9/12/97 Fri 200 Angle 0 0 1 Nite Dry No Improper Driving
43 9/13/97 Sat 400 Rear End 0 0 1 Nite Dry No Improper Driving
44 11/3/97 Mon 1200 Angle 0 0 1 Day Dry No Improper Driving
45 11/21/97 Fri 1400 Angle 0 0 1 Day Wet No Improper Driving
Total No. Fatal Injury PDO Angle Left Turn Right Turn Rear End Side Swipe Ped/Bike All Others
45 0 10 35 22 3 0 2 12 4 2
0.00% 22.22% 77.78% 48.89% 6.67% 0.00% 4.44% 26.67% 8.89% 4.44%
Day Night Wet Dry Failed to Maintain
Equipment
No Improper Driving
Careless Driving
Follow too Closely
Disregarded Traffic Signal
Improper Lane
Change All Others
32 13 3 42 0 39 1 0 0 1 4
71.11% 28.89% 6.67% 93.33% 0.00% 86.67% 2.22% 0.00% 0.00% 2.22% 8.89%
TOTAL VEHICLES ENTERING / ADT: 14,167 CRASH RATE: 2.901 /MEV
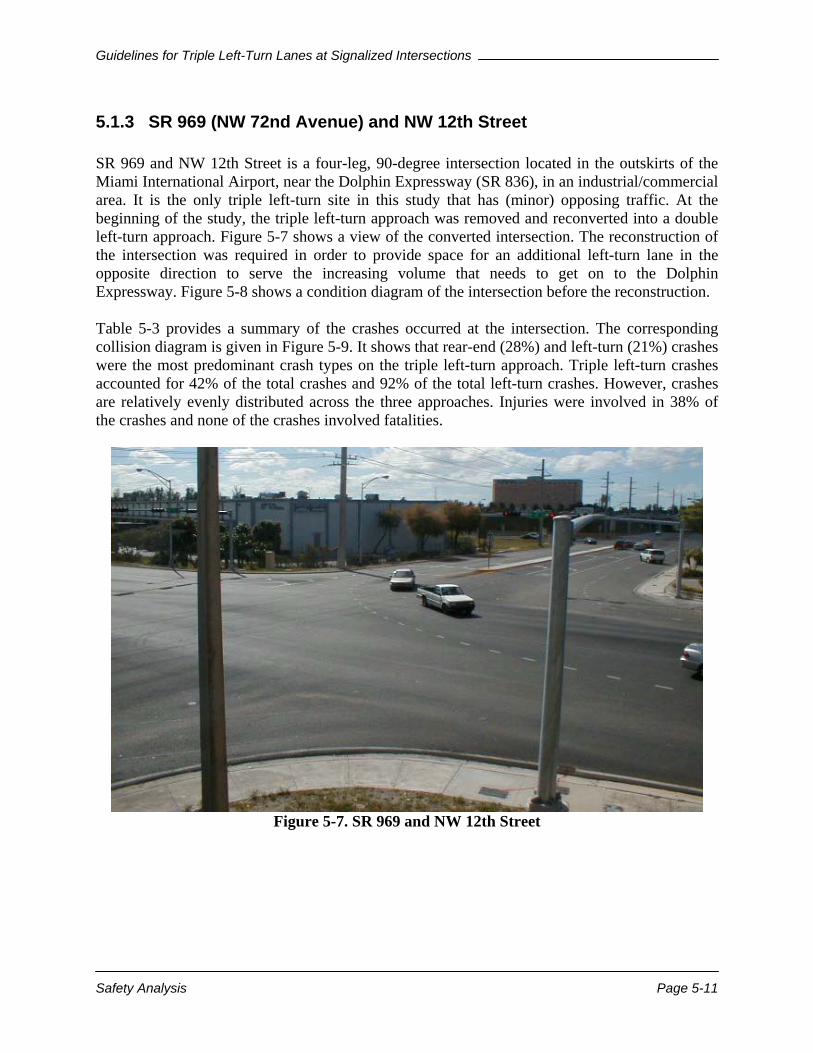
Guidelines for Triple Left-Turn Lanes at Signalized Intersections
Safety Analysis Page 5-11
5.1.3 SR 969 (NW 72nd Avenue) and NW 12th Street SR 969 and NW 12th Street is a four-leg, 90-degree intersection located in the outskirts of the Miami International Airport, near the Dolphin Expressway (SR 836), in an industrial/commercial area. It is the only triple left-turn site in this study that has (minor) opposing traffic. At the beginning of the study, the triple left-turn approach was removed and reconverted into a double left-turn approach. Figure 5-7 shows a view of the converted intersection. The reconstruction of the intersection was required in order to provide space for an additional left-turn lane in the opposite direction to serve the increasing volume that needs to get on to the Dolphin Expressway. Figure 5-8 shows a condition diagram of the intersection before the reconstruction. Table 5-3 provides a summary of the crashes occurred at the intersection. The corresponding collision diagram is given in Figure 5-9. It shows that rear-end (28%) and left-turn (21%) crashes were the most predominant crash types on the triple left-turn approach. Triple left-turn crashes accounted for 42% of the total crashes and 92% of the total left-turn crashes. However, crashes are relatively evenly distributed across the three approaches. Injuries were involved in 38% of the crashes and none of the crashes involved fatalities.
Figure 5-7. SR 969 and NW 12th Street
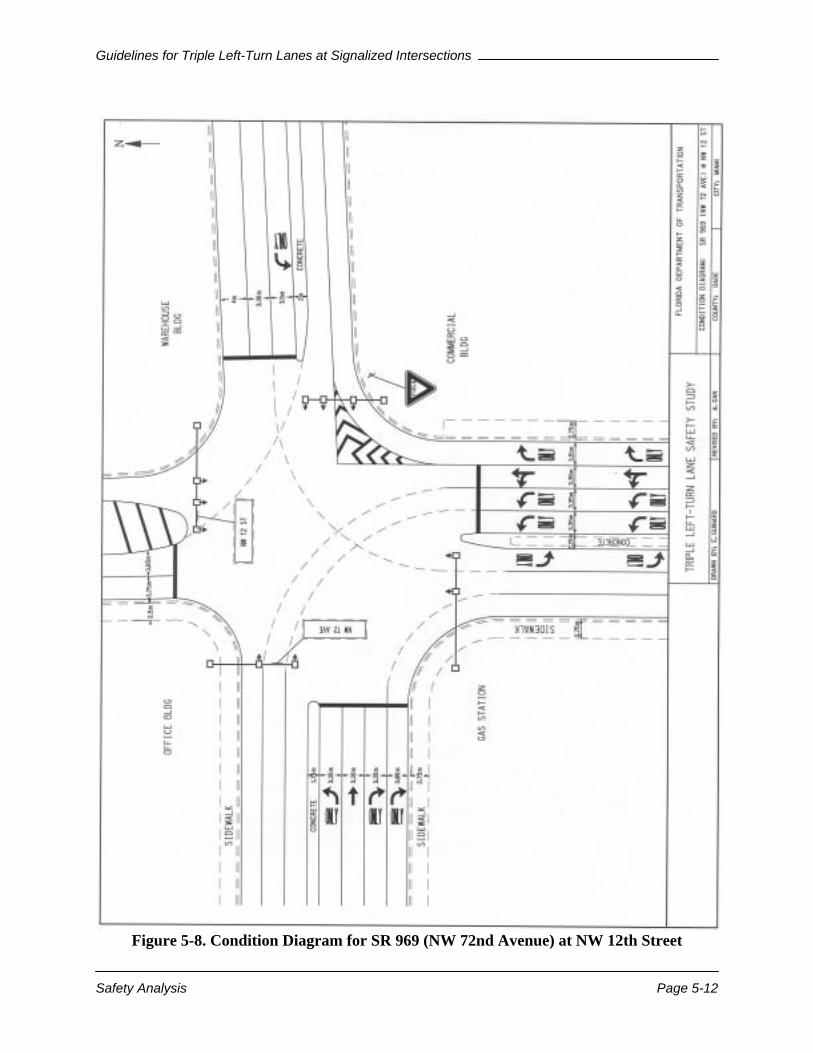
Guidelines for Triple Left-Turn Lanes at Signalized Intersections
Safety Analysis Page 5-12
Figure 5-8. Condition Diagram for SR 969 (NW 72nd Avenue) at NW 12th Street
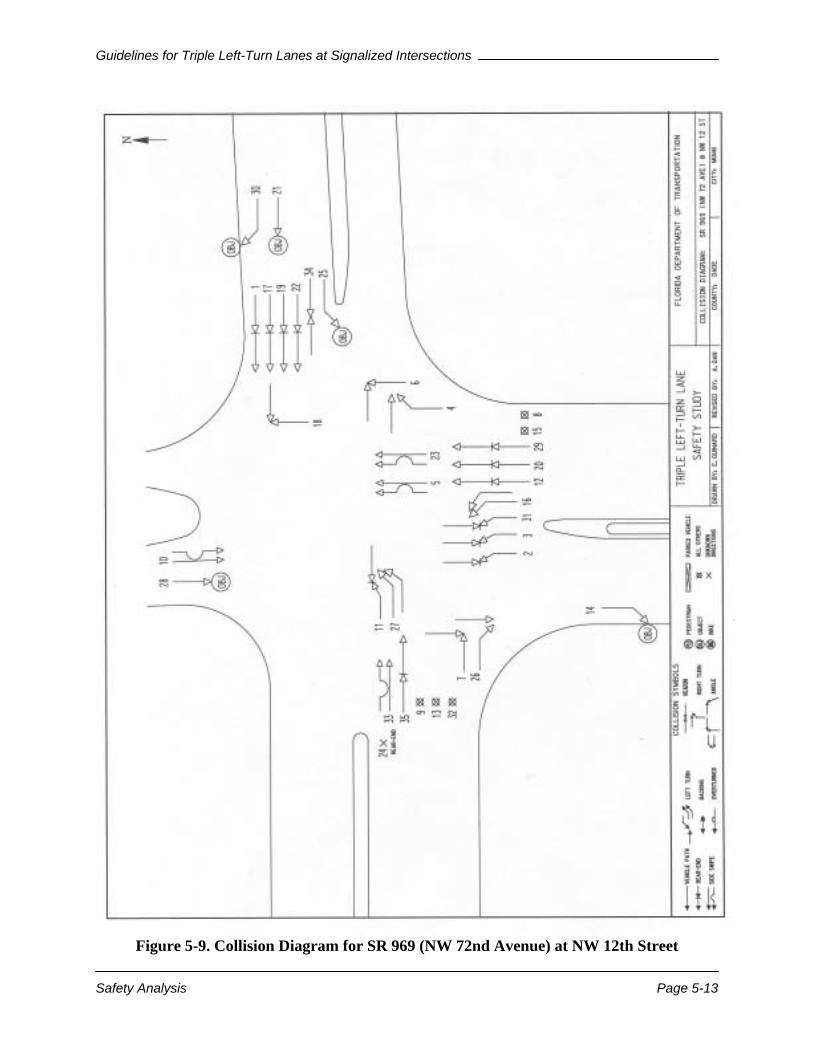
Guidelines for Triple Left-Turn Lanes at Signalized Intersections
Safety Analysis Page 5-13
Figure 5-9. Collision Diagram for SR 969 (NW 72nd Avenue) at NW 12th Street
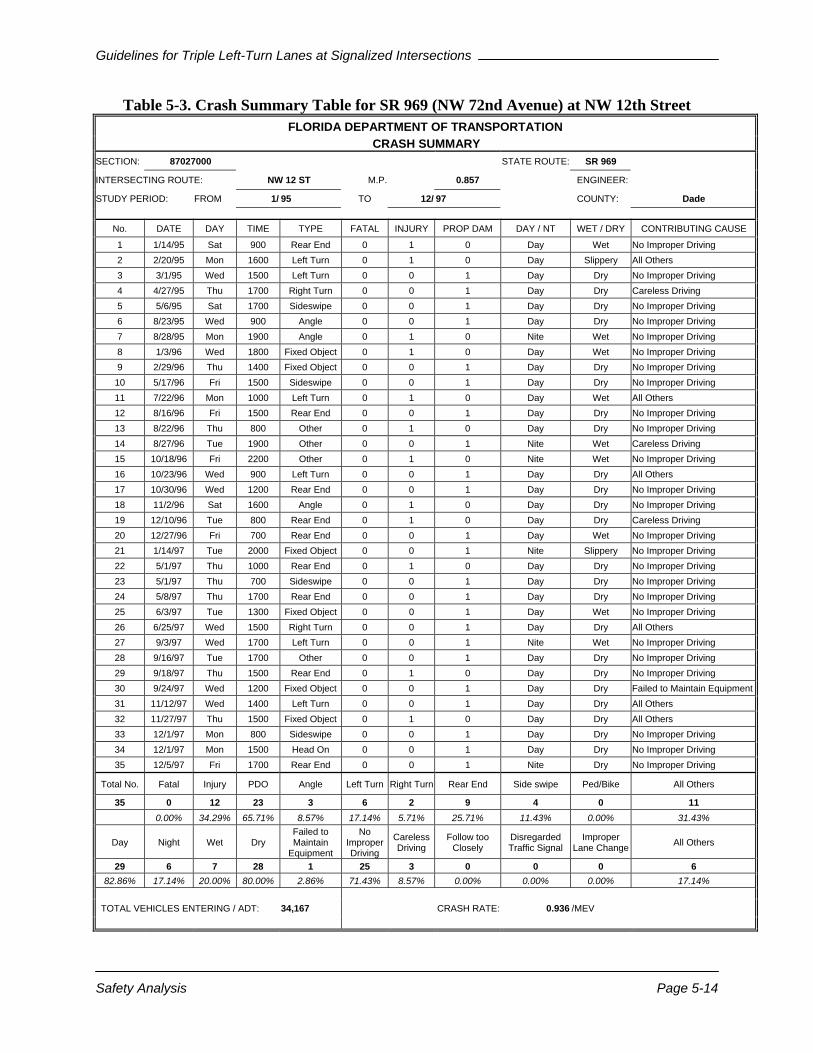
Guidelines for Triple Left-Turn Lanes at Signalized Intersections
Safety Analysis Page 5-14
Table 5-3. Crash Summary Table for SR 969 (NW 72nd Avenue) at NW 12th Street FLORIDA DEPARTMENT OF TRANSPORTATION
CRASH SUMMARY SECTION: 87027000 STATE ROUTE: SR 969
INTERSECTING ROUTE: NW 12 ST M.P. 0.857 ENGINEER:
STUDY PERIOD: FROM 1/ 95 TO 12/ 97 COUNTY: Dade
No. DATE DAY TIME TYPE FATAL INJURY PROP DAM DAY / NT WET / DRY CONTRIBUTING CAUSE
1 1/14/95 Sat 900 Rear End 0 1 0 Day Wet No Improper Driving 2 2/20/95 Mon 1600 Left Turn 0 1 0 Day Slippery All Others 3 3/1/95 Wed 1500 Left Turn 0 0 1 Day Dry No Improper Driving 4 4/27/95 Thu 1700 Right Turn 0 0 1 Day Dry Careless Driving 5 5/6/95 Sat 1700 Sideswipe 0 0 1 Day Dry No Improper Driving 6 8/23/95 Wed 900 Angle 0 0 1 Day Dry No Improper Driving 7 8/28/95 Mon 1900 Angle 0 1 0 Nite Wet No Improper Driving 8 1/3/96 Wed 1800 Fixed Object 0 1 0 Day Wet No Improper Driving 9 2/29/96 Thu 1400 Fixed Object 0 0 1 Day Dry No Improper Driving
10 5/17/96 Fri 1500 Sideswipe 0 0 1 Day Dry No Improper Driving 11 7/22/96 Mon 1000 Left Turn 0 1 0 Day Wet All Others 12 8/16/96 Fri 1500 Rear End 0 0 1 Day Dry No Improper Driving 13 8/22/96 Thu 800 Other 0 1 0 Day Dry No Improper Driving 14 8/27/96 Tue 1900 Other 0 0 1 Nite Wet Careless Driving 15 10/18/96 Fri 2200 Other 0 1 0 Nite Wet No Improper Driving 16 10/23/96 Wed 900 Left Turn 0 0 1 Day Dry All Others 17 10/30/96 Wed 1200 Rear End 0 0 1 Day Dry No Improper Driving 18 11/2/96 Sat 1600 Angle 0 1 0 Day Dry No Improper Driving 19 12/10/96 Tue 800 Rear End 0 1 0 Day Dry Careless Driving 20 12/27/96 Fri 700 Rear End 0 0 1 Day Wet No Improper Driving 21 1/14/97 Tue 2000 Fixed Object 0 0 1 Nite Slippery No Improper Driving 22 5/1/97 Thu 1000 Rear End 0 1 0 Day Dry No Improper Driving 23 5/1/97 Thu 700 Sideswipe 0 0 1 Day Dry No Improper Driving 24 5/8/97 Thu 1700 Rear End 0 0 1 Day Dry No Improper Driving 25 6/3/97 Tue 1300 Fixed Object 0 0 1 Day Wet No Improper Driving 26 6/25/97 Wed 1500 Right Turn 0 0 1 Day Dry All Others 27 9/3/97 Wed 1700 Left Turn 0 0 1 Nite Wet No Improper Driving 28 9/16/97 Tue 1700 Other 0 0 1 Day Dry No Improper Driving 29 9/18/97 Thu 1500 Rear End 0 1 0 Day Dry No Improper Driving 30 9/24/97 Wed 1200 Fixed Object 0 0 1 Day Dry Failed to Maintain Equipment31 11/12/97 Wed 1400 Left Turn 0 0 1 Day Dry All Others 32 11/27/97 Thu 1500 Fixed Object 0 1 0 Day Dry All Others 33 12/1/97 Mon 800 Sideswipe 0 0 1 Day Dry No Improper Driving 34 12/1/97 Mon 1500 Head On 0 0 1 Day Dry No Improper Driving 35 12/5/97 Fri 1700 Rear End 0 0 1 Nite Dry No Improper Driving
Total No. Fatal Injury PDO Angle Left Turn Right Turn Rear End Side swipe Ped/Bike All Others
35 0 12 23 3 6 2 9 4 0 11 0.00% 34.29% 65.71% 8.57% 17.14% 5.71% 25.71% 11.43% 0.00% 31.43%
Day Night Wet Dry Failed to Maintain
Equipment
No Improper Driving
Careless Driving
Follow too Closely
Disregarded Traffic Signal
Improper Lane Change All Others
29 6 7 28 1 25 3 0 0 0 6 82.86% 17.14% 20.00% 80.00% 2.86% 71.43% 8.57% 0.00% 0.00% 0.00% 17.14%
TOTAL VEHICLES ENTERING / ADT: 34,167 CRASH RATE: 0.936 /MEV

Guidelines for Triple Left-Turn Lanes at Signalized Intersections
Safety Analysis Page 5-15
5.1.4 SR 878 and SR 5 (US 1) SR 878 intersects SR 5 at a 35-degree angle at this intersection. Both intersecting roadways are major routes located in a highly congested commercial/residential area. Figure 5-10 shows a far view of the complete intersection. Figure 5-11 shows a detailed condition diagram for the intersection. The Miami Metro-Rail overpasses the triple left turn and runs parallel to SR-5. The east approach features an off-ramp crossroad terminal from SR 878 that reaches the intersection on a downgrade and levels off as it approaches the intersection with three exclusive left-turn lanes. Heavy left-turning volume on the triple left-turn approach builds up during the morning peak hour and throughout the morning. Table 5-4 provides a summary of the crashes occurred at the intersection. The collision diagram is shown in Figure 5-12. As in the case of the SR 7/SR 9 intersection, this triple left-turn approach intersects the cross street at a favorable angle for the triple left-turn maneuvers. Rear-end crashes accounted for 68% of the total crashes of which, only one was reported to occur on the triple left-turn approach. Three angle crashes were related to the triple left turn. Most of the crashes were rear-end crashes on the south approach. Injury crashes account for a high 74% of the total crashes. The intersection appears to operate fairly well under the level of traffic volume it experienced. Even though the Metro Rail overpasses the triple left-turn approach, no major impact was exerted to the triple left-turn approach as far as visibility obstruction was concerned. Eighty four percent of the crashes coincide with the morning peak hour where the triple left turn experienced the highest amount of traffic flow traveling north.
Figure 5-10. SR 878 and SR 5 (US 1)

Guidelines for Triple Left-Turn Lanes at Signalized Intersections
Safety Analysis Page 5-16
Figure 5-11. Condition Diagram for SR 878 at SR 5 (US 1)

Guidelines for Triple Left-Turn Lanes at Signalized Intersections
Safety Analysis Page 5-17
Figure 5-12. Collision Diagram for SR 878 at SR 5 (US 1)
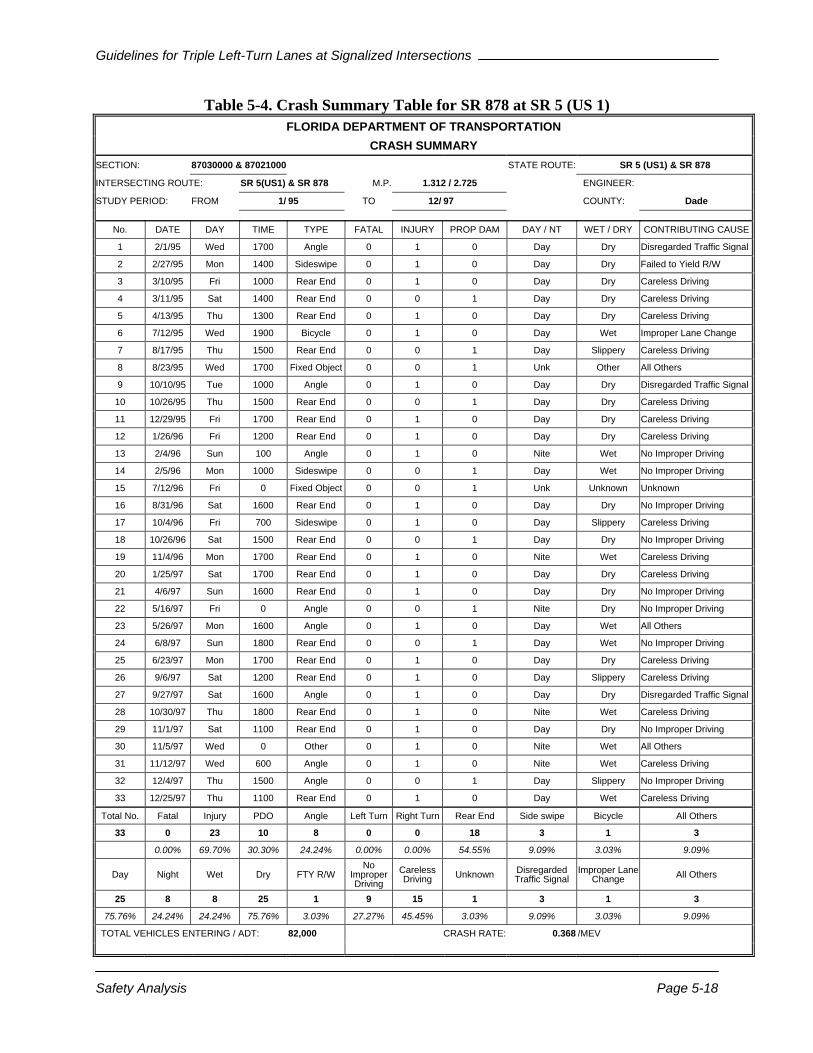
Guidelines for Triple Left-Turn Lanes at Signalized Intersections
Safety Analysis Page 5-18
Table 5-4. Crash Summary Table for SR 878 at SR 5 (US 1) FLORIDA DEPARTMENT OF TRANSPORTATION
CRASH SUMMARY SECTION: 87030000 & 87021000 STATE ROUTE: SR 5 (US1) & SR 878
INTERSECTING ROUTE: SR 5(US1) & SR 878 M.P. 1.312 / 2.725 ENGINEER:
STUDY PERIOD: FROM 1/ 95 TO 12/ 97 COUNTY: Dade
No. DATE DAY TIME TYPE FATAL INJURY PROP DAM DAY / NT WET / DRY CONTRIBUTING CAUSE
1 2/1/95 Wed 1700 Angle 0 1 0 Day Dry Disregarded Traffic Signal
2 2/27/95 Mon 1400 Sideswipe 0 1 0 Day Dry Failed to Yield R/W
3 3/10/95 Fri 1000 Rear End 0 1 0 Day Dry Careless Driving
4 3/11/95 Sat 1400 Rear End 0 0 1 Day Dry Careless Driving
5 4/13/95 Thu 1300 Rear End 0 1 0 Day Dry Careless Driving
6 7/12/95 Wed 1900 Bicycle 0 1 0 Day Wet Improper Lane Change
7 8/17/95 Thu 1500 Rear End 0 0 1 Day Slippery Careless Driving
8 8/23/95 Wed 1700 Fixed Object 0 0 1 Unk Other All Others
9 10/10/95 Tue 1000 Angle 0 1 0 Day Dry Disregarded Traffic Signal
10 10/26/95 Thu 1500 Rear End 0 0 1 Day Dry Careless Driving
11 12/29/95 Fri 1700 Rear End 0 1 0 Day Dry Careless Driving
12 1/26/96 Fri 1200 Rear End 0 1 0 Day Dry Careless Driving
13 2/4/96 Sun 100 Angle 0 1 0 Nite Wet No Improper Driving
14 2/5/96 Mon 1000 Sideswipe 0 0 1 Day Wet No Improper Driving
15 7/12/96 Fri 0 Fixed Object 0 0 1 Unk Unknown Unknown
16 8/31/96 Sat 1600 Rear End 0 1 0 Day Dry No Improper Driving
17 10/4/96 Fri 700 Sideswipe 0 1 0 Day Slippery Careless Driving
18 10/26/96 Sat 1500 Rear End 0 0 1 Day Dry No Improper Driving
19 11/4/96 Mon 1700 Rear End 0 1 0 Nite Wet Careless Driving
20 1/25/97 Sat 1700 Rear End 0 1 0 Day Dry Careless Driving
21 4/6/97 Sun 1600 Rear End 0 1 0 Day Dry No Improper Driving
22 5/16/97 Fri 0 Angle 0 0 1 Nite Dry No Improper Driving
23 5/26/97 Mon 1600 Angle 0 1 0 Day Wet All Others
24 6/8/97 Sun 1800 Rear End 0 0 1 Day Wet No Improper Driving
25 6/23/97 Mon 1700 Rear End 0 1 0 Day Dry Careless Driving
26 9/6/97 Sat 1200 Rear End 0 1 0 Day Slippery Careless Driving
27 9/27/97 Sat 1600 Angle 0 1 0 Day Dry Disregarded Traffic Signal
28 10/30/97 Thu 1800 Rear End 0 1 0 Nite Wet Careless Driving
29 11/1/97 Sat 1100 Rear End 0 1 0 Day Dry No Improper Driving
30 11/5/97 Wed 0 Other 0 1 0 Nite Wet All Others
31 11/12/97 Wed 600 Angle 0 1 0 Nite Wet Careless Driving
32 12/4/97 Thu 1500 Angle 0 0 1 Day Slippery No Improper Driving
33 12/25/97 Thu 1100 Rear End 0 1 0 Day Wet Careless Driving
Total No. Fatal Injury PDO Angle Left Turn Right Turn Rear End Side swipe Bicycle All Others
33 0 23 10 8 0 0 18 3 1 3
0.00% 69.70% 30.30% 24.24% 0.00% 0.00% 54.55% 9.09% 3.03% 9.09%
Day Night Wet Dry FTY R/W No
Improper Driving
Careless Driving Unknown Disregarded
Traffic Signal Improper Lane
Change All Others
25 8 8 25 1 9 15 1 3 1 3
75.76% 24.24% 24.24% 75.76% 3.03% 27.27% 45.45% 3.03% 9.09% 3.03% 9.09%
TOTAL VEHICLES ENTERING / ADT: 82,000 CRASH RATE: 0.368 /MEV
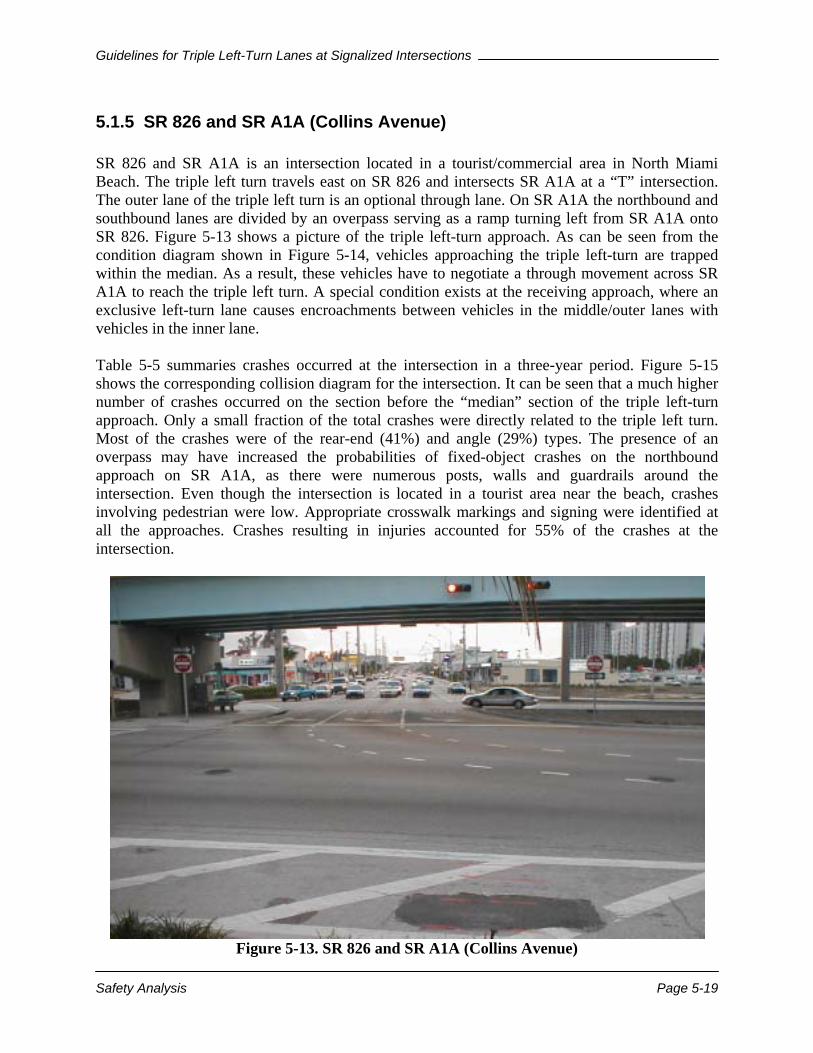
Guidelines for Triple Left-Turn Lanes at Signalized Intersections
Safety Analysis Page 5-19
5.1.5 SR 826 and SR A1A (Collins Avenue) SR 826 and SR A1A is an intersection located in a tourist/commercial area in North Miami Beach. The triple left turn travels east on SR 826 and intersects SR A1A at a “T” intersection. The outer lane of the triple left turn is an optional through lane. On SR A1A the northbound and southbound lanes are divided by an overpass serving as a ramp turning left from SR A1A onto SR 826. Figure 5-13 shows a picture of the triple left-turn approach. As can be seen from the condition diagram shown in Figure 5-14, vehicles approaching the triple left-turn are trapped within the median. As a result, these vehicles have to negotiate a through movement across SR A1A to reach the triple left turn. A special condition exists at the receiving approach, where an exclusive left-turn lane causes encroachments between vehicles in the middle/outer lanes with vehicles in the inner lane. Table 5-5 summaries crashes occurred at the intersection in a three-year period. Figure 5-15 shows the corresponding collision diagram for the intersection. It can be seen that a much higher number of crashes occurred on the section before the “median” section of the triple left-turn approach. Only a small fraction of the total crashes were directly related to the triple left turn. Most of the crashes were of the rear-end (41%) and angle (29%) types. The presence of an overpass may have increased the probabilities of fixed-object crashes on the northbound approach on SR A1A, as there were numerous posts, walls and guardrails around the intersection. Even though the intersection is located in a tourist area near the beach, crashes involving pedestrian were low. Appropriate crosswalk markings and signing were identified at all the approaches. Crashes resulting in injuries accounted for 55% of the crashes at the intersection.
Figure 5-13. SR 826 and SR A1A (Collins Avenue)
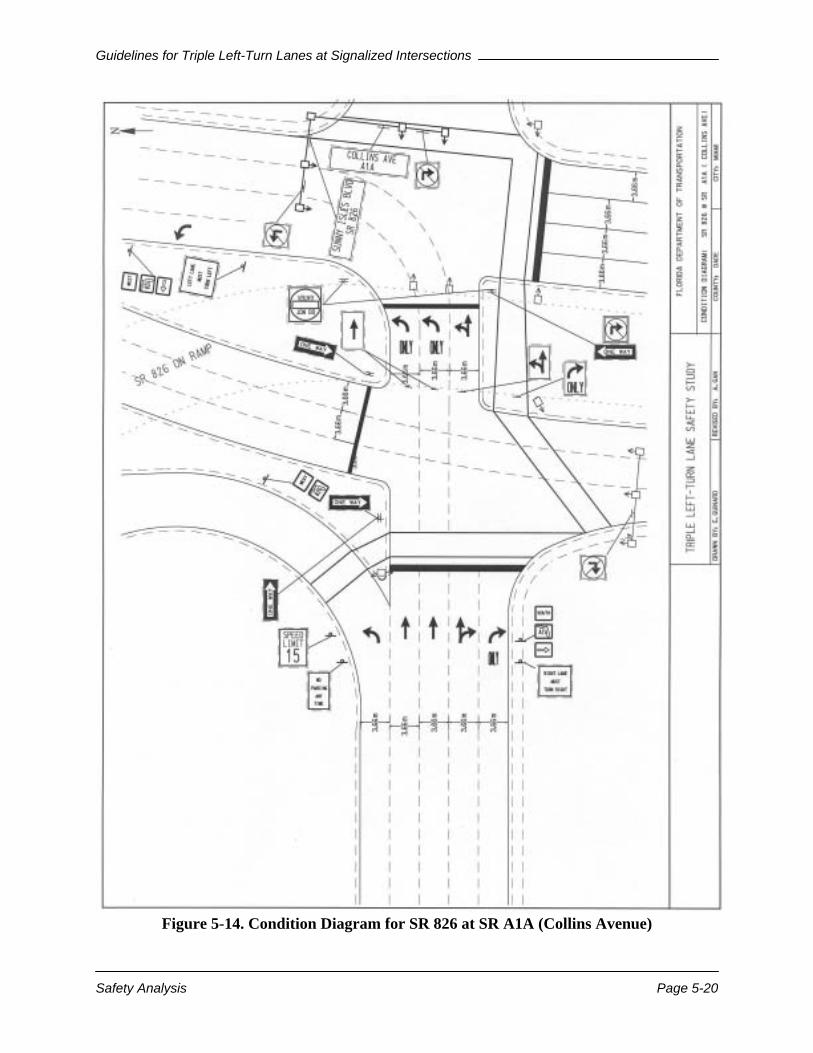
Guidelines for Triple Left-Turn Lanes at Signalized Intersections
Safety Analysis Page 5-20
Figure 5-14. Condition Diagram for SR 826 at SR A1A (Collins Avenue)
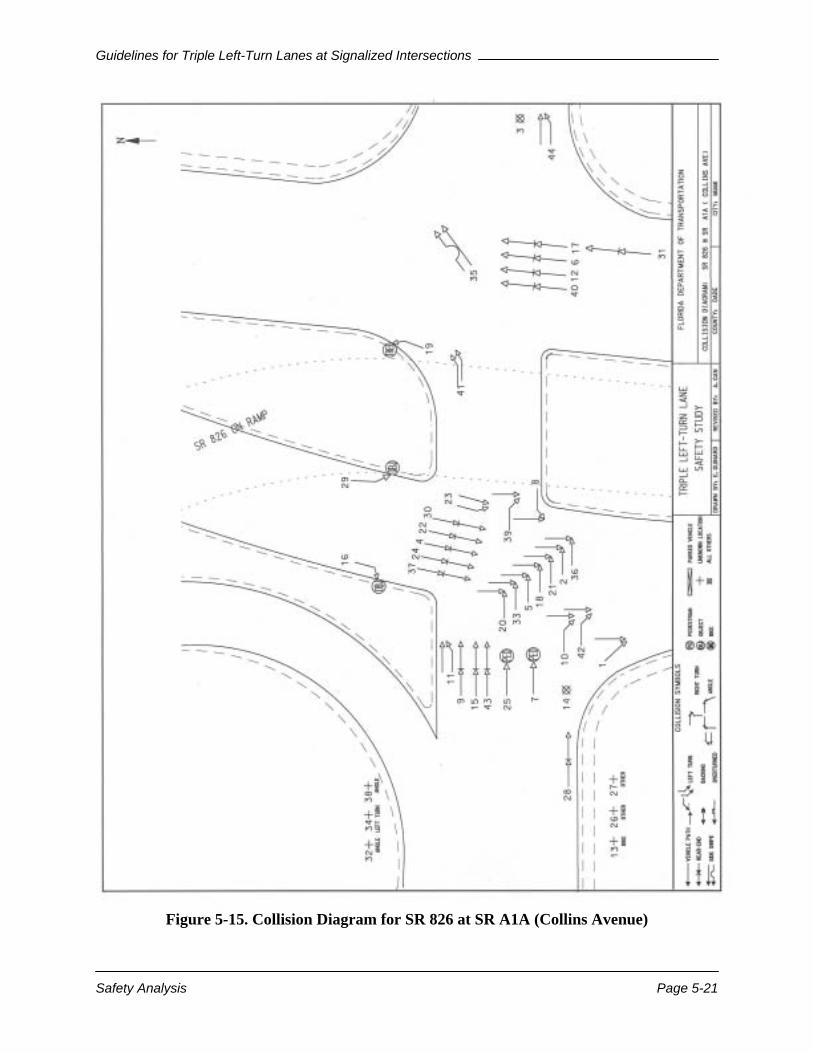
Guidelines for Triple Left-Turn Lanes at Signalized Intersections
Safety Analysis Page 5-21
Figure 5-15. Collision Diagram for SR 826 at SR A1A (Collins Avenue)
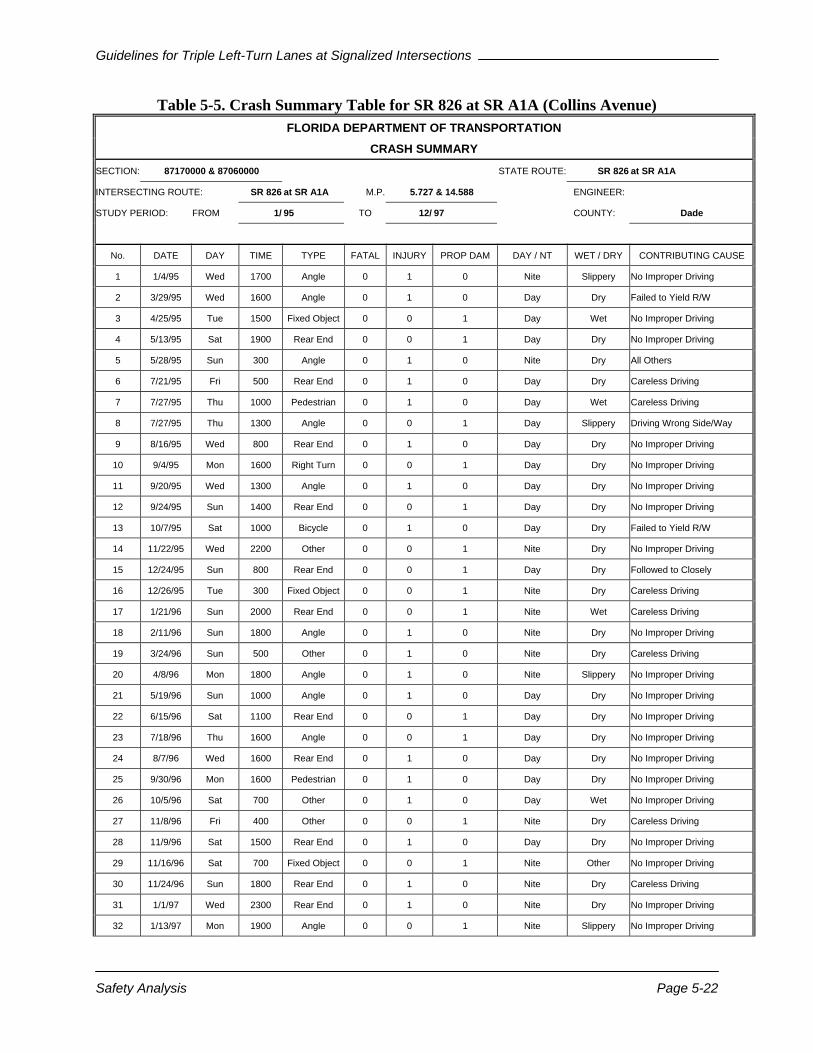
Guidelines for Triple Left-Turn Lanes at Signalized Intersections
Safety Analysis Page 5-22
Table 5-5. Crash Summary Table for SR 826 at SR A1A (Collins Avenue) FLORIDA DEPARTMENT OF TRANSPORTATION
CRASH SUMMARY SECTION: 87170000 & 87060000 STATE ROUTE: SR 826 at SR A1A
INTERSECTING ROUTE: SR 826 at SR A1A M.P. 5.727 & 14.588 ENGINEER:
STUDY PERIOD: FROM 1/ 95 TO 12/ 97 COUNTY: Dade
No. DATE DAY TIME TYPE FATAL INJURY PROP DAM DAY / NT WET / DRY CONTRIBUTING CAUSE
1 1/4/95 Wed 1700 Angle 0 1 0 Nite Slippery No Improper Driving
2 3/29/95 Wed 1600 Angle 0 1 0 Day Dry Failed to Yield R/W
3 4/25/95 Tue 1500 Fixed Object 0 0 1 Day Wet No Improper Driving
4 5/13/95 Sat 1900 Rear End 0 0 1 Day Dry No Improper Driving
5 5/28/95 Sun 300 Angle 0 1 0 Nite Dry All Others
6 7/21/95 Fri 500 Rear End 0 1 0 Day Dry Careless Driving
7 7/27/95 Thu 1000 Pedestrian 0 1 0 Day Wet Careless Driving
8 7/27/95 Thu 1300 Angle 0 0 1 Day Slippery Driving Wrong Side/Way
9 8/16/95 Wed 800 Rear End 0 1 0 Day Dry No Improper Driving
10 9/4/95 Mon 1600 Right Turn 0 0 1 Day Dry No Improper Driving
11 9/20/95 Wed 1300 Angle 0 1 0 Day Dry No Improper Driving
12 9/24/95 Sun 1400 Rear End 0 0 1 Day Dry No Improper Driving
13 10/7/95 Sat 1000 Bicycle 0 1 0 Day Dry Failed to Yield R/W
14 11/22/95 Wed 2200 Other 0 0 1 Nite Dry No Improper Driving
15 12/24/95 Sun 800 Rear End 0 0 1 Day Dry Followed to Closely
16 12/26/95 Tue 300 Fixed Object 0 0 1 Nite Dry Careless Driving
17 1/21/96 Sun 2000 Rear End 0 0 1 Nite Wet Careless Driving
18 2/11/96 Sun 1800 Angle 0 1 0 Nite Dry No Improper Driving
19 3/24/96 Sun 500 Other 0 1 0 Nite Dry Careless Driving
20 4/8/96 Mon 1800 Angle 0 1 0 Nite Slippery No Improper Driving
21 5/19/96 Sun 1000 Angle 0 1 0 Day Dry No Improper Driving
22 6/15/96 Sat 1100 Rear End 0 0 1 Day Dry No Improper Driving
23 7/18/96 Thu 1600 Angle 0 0 1 Day Dry No Improper Driving
24 8/7/96 Wed 1600 Rear End 0 1 0 Day Dry No Improper Driving
25 9/30/96 Mon 1600 Pedestrian 0 1 0 Day Dry No Improper Driving
26 10/5/96 Sat 700 Other 0 1 0 Day Wet No Improper Driving
27 11/8/96 Fri 400 Other 0 0 1 Nite Dry Careless Driving
28 11/9/96 Sat 1500 Rear End 0 1 0 Day Dry No Improper Driving
29 11/16/96 Sat 700 Fixed Object 0 0 1 Nite Other No Improper Driving
30 11/24/96 Sun 1800 Rear End 0 1 0 Nite Dry Careless Driving
31 1/1/97 Wed 2300 Rear End 0 1 0 Nite Dry No Improper Driving
32 1/13/97 Mon 1900 Angle 0 0 1 Nite Slippery No Improper Driving
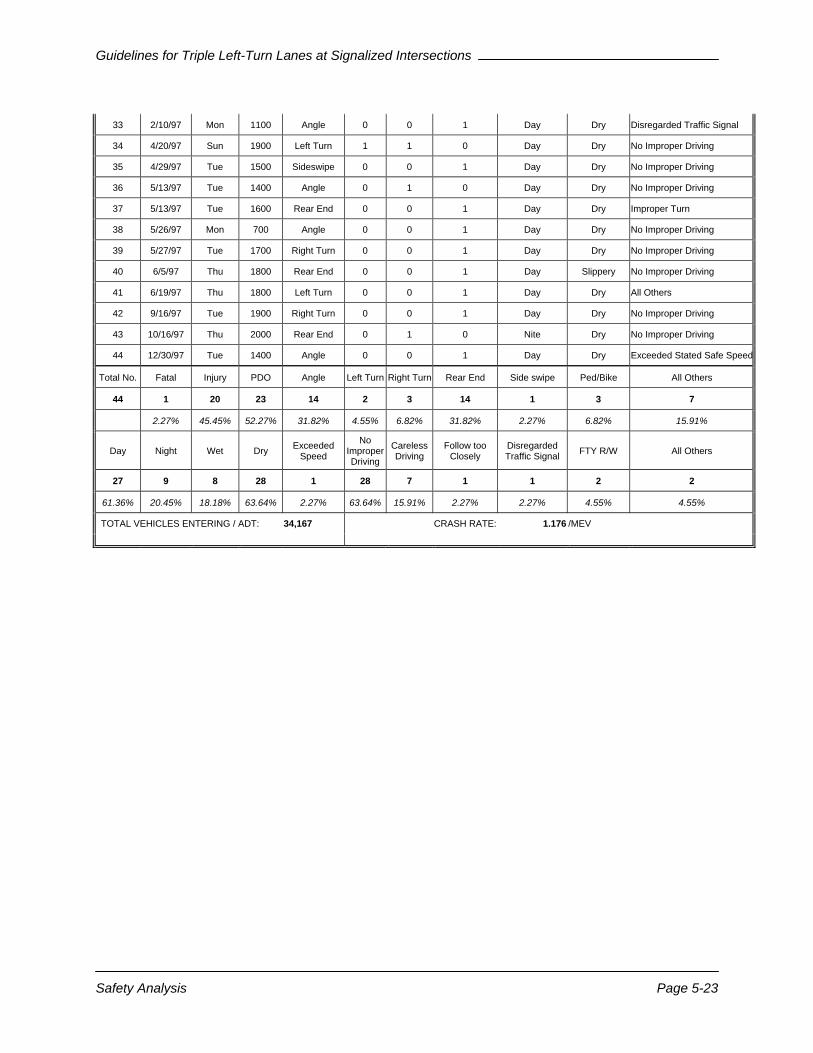
Guidelines for Triple Left-Turn Lanes at Signalized Intersections
Safety Analysis Page 5-23
33 2/10/97 Mon 1100 Angle 0 0 1 Day Dry Disregarded Traffic Signal
34 4/20/97 Sun 1900 Left Turn 1 1 0 Day Dry No Improper Driving
35 4/29/97 Tue 1500 Sideswipe 0 0 1 Day Dry No Improper Driving
36 5/13/97 Tue 1400 Angle 0 1 0 Day Dry No Improper Driving
37 5/13/97 Tue 1600 Rear End 0 0 1 Day Dry Improper Turn
38 5/26/97 Mon 700 Angle 0 0 1 Day Dry No Improper Driving
39 5/27/97 Tue 1700 Right Turn 0 0 1 Day Dry No Improper Driving
40 6/5/97 Thu 1800 Rear End 0 0 1 Day Slippery No Improper Driving
41 6/19/97 Thu 1800 Left Turn 0 0 1 Day Dry All Others
42 9/16/97 Tue 1900 Right Turn 0 0 1 Day Dry No Improper Driving
43 10/16/97 Thu 2000 Rear End 0 1 0 Nite Dry No Improper Driving
44 12/30/97 Tue 1400 Angle 0 0 1 Day Dry Exceeded Stated Safe Speed
Total No. Fatal Injury PDO Angle Left Turn Right Turn Rear End Side swipe Ped/Bike All Others
44 1 20 23 14 2 3 14 1 3 7
2.27% 45.45% 52.27% 31.82% 4.55% 6.82% 31.82% 2.27% 6.82% 15.91%
Day Night Wet Dry Exceeded Speed
No Improper Driving
Careless Driving
Follow too Closely
Disregarded Traffic Signal FTY R/W All Others
27 9 8 28 1 28 7 1 1 2 2
61.36% 20.45% 18.18% 63.64% 2.27% 63.64% 15.91% 2.27% 2.27% 4.55% 4.55%
TOTAL VEHICLES ENTERING / ADT: 34,167 CRASH RATE: 1.176 /MEV
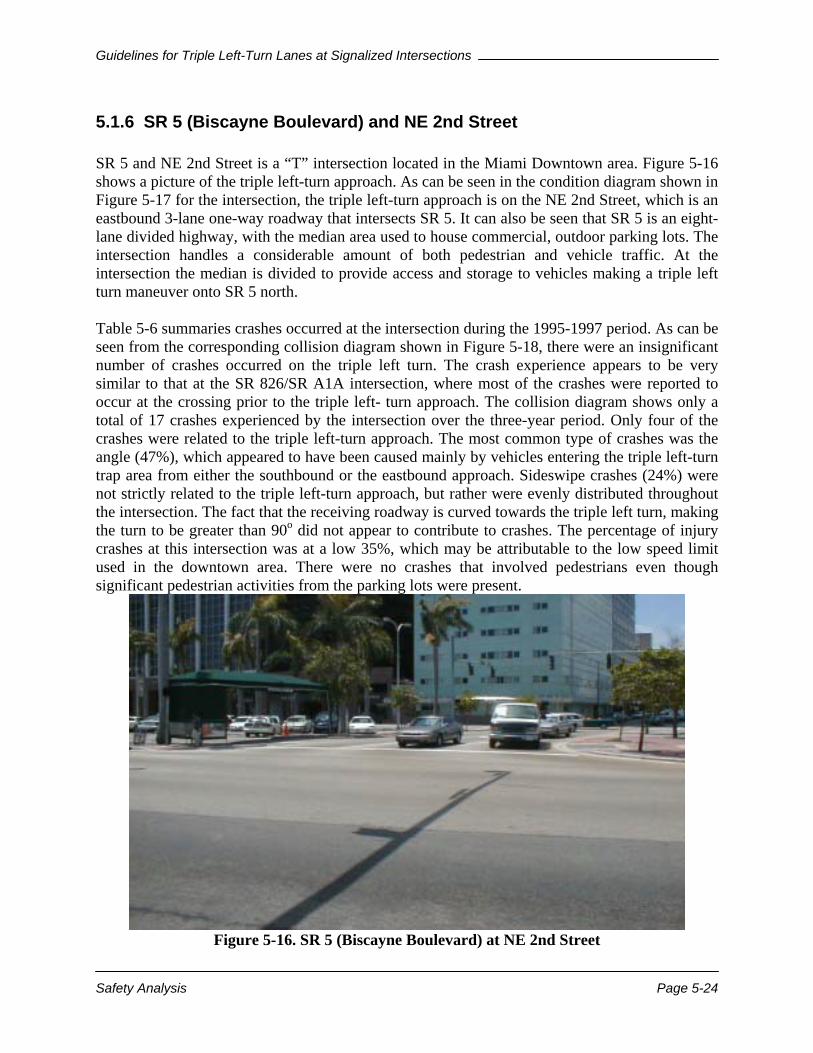
Guidelines for Triple Left-Turn Lanes at Signalized Intersections
Safety Analysis Page 5-24
5.1.6 SR 5 (Biscayne Boulevard) and NE 2nd Street SR 5 and NE 2nd Street is a “T” intersection located in the Miami Downtown area. Figure 5-16 shows a picture of the triple left-turn approach. As can be seen in the condition diagram shown in Figure 5-17 for the intersection, the triple left-turn approach is on the NE 2nd Street, which is an eastbound 3-lane one-way roadway that intersects SR 5. It can also be seen that SR 5 is an eight-lane divided highway, with the median area used to house commercial, outdoor parking lots. The intersection handles a considerable amount of both pedestrian and vehicle traffic. At the intersection the median is divided to provide access and storage to vehicles making a triple left turn maneuver onto SR 5 north. Table 5-6 summaries crashes occurred at the intersection during the 1995-1997 period. As can be seen from the corresponding collision diagram shown in Figure 5-18, there were an insignificant number of crashes occurred on the triple left turn. The crash experience appears to be very similar to that at the SR 826/SR A1A intersection, where most of the crashes were reported to occur at the crossing prior to the triple left- turn approach. The collision diagram shows only a total of 17 crashes experienced by the intersection over the three-year period. Only four of the crashes were related to the triple left-turn approach. The most common type of crashes was the angle (47%), which appeared to have been caused mainly by vehicles entering the triple left-turn trap area from either the southbound or the eastbound approach. Sideswipe crashes (24%) were not strictly related to the triple left-turn approach, but rather were evenly distributed throughout the intersection. The fact that the receiving roadway is curved towards the triple left turn, making the turn to be greater than 90o did not appear to contribute to crashes. The percentage of injury crashes at this intersection was at a low 35%, which may be attributable to the low speed limit used in the downtown area. There were no crashes that involved pedestrians even though significant pedestrian activities from the parking lots were present.
Figure 5-16. SR 5 (Biscayne Boulevard) at NE 2nd Street
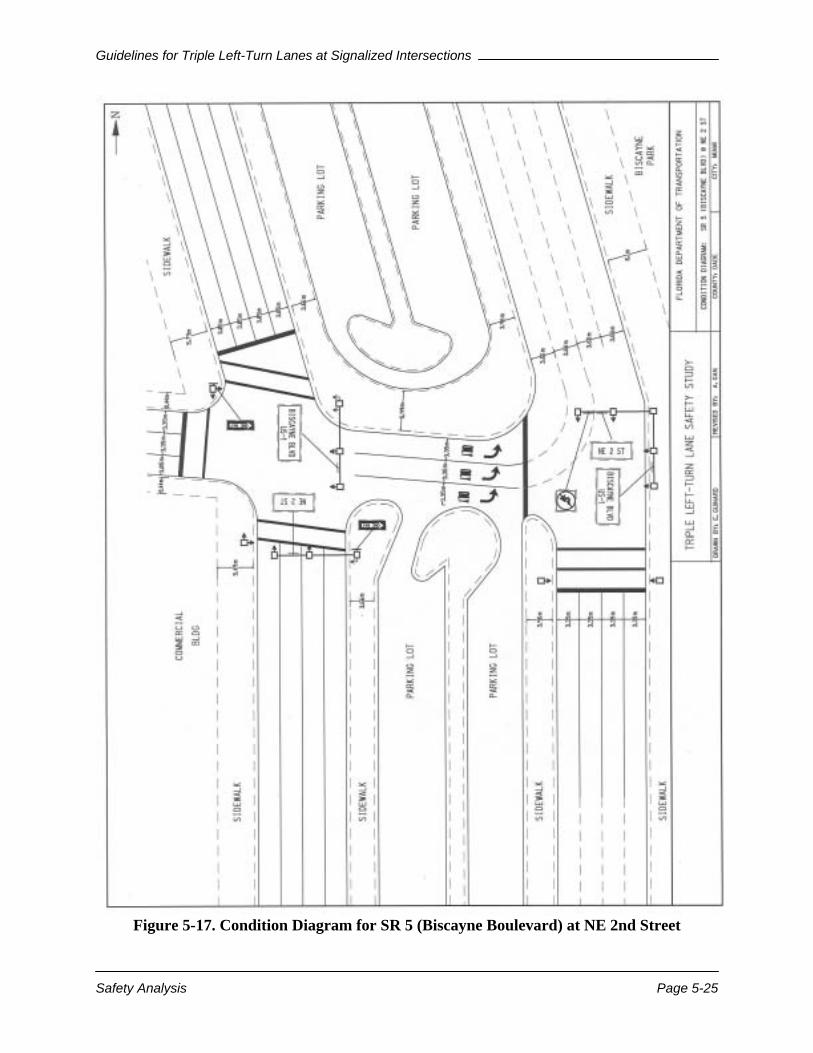
Guidelines for Triple Left-Turn Lanes at Signalized Intersections
Safety Analysis Page 5-25
Figure 5-17. Condition Diagram for SR 5 (Biscayne Boulevard) at NE 2nd Street

Guidelines for Triple Left-Turn Lanes at Signalized Intersections
Safety Analysis Page 5-26
Figure 5-18. Collision Diagram for SR 5 (Biscayne Boulevard) at NE 2nd Street
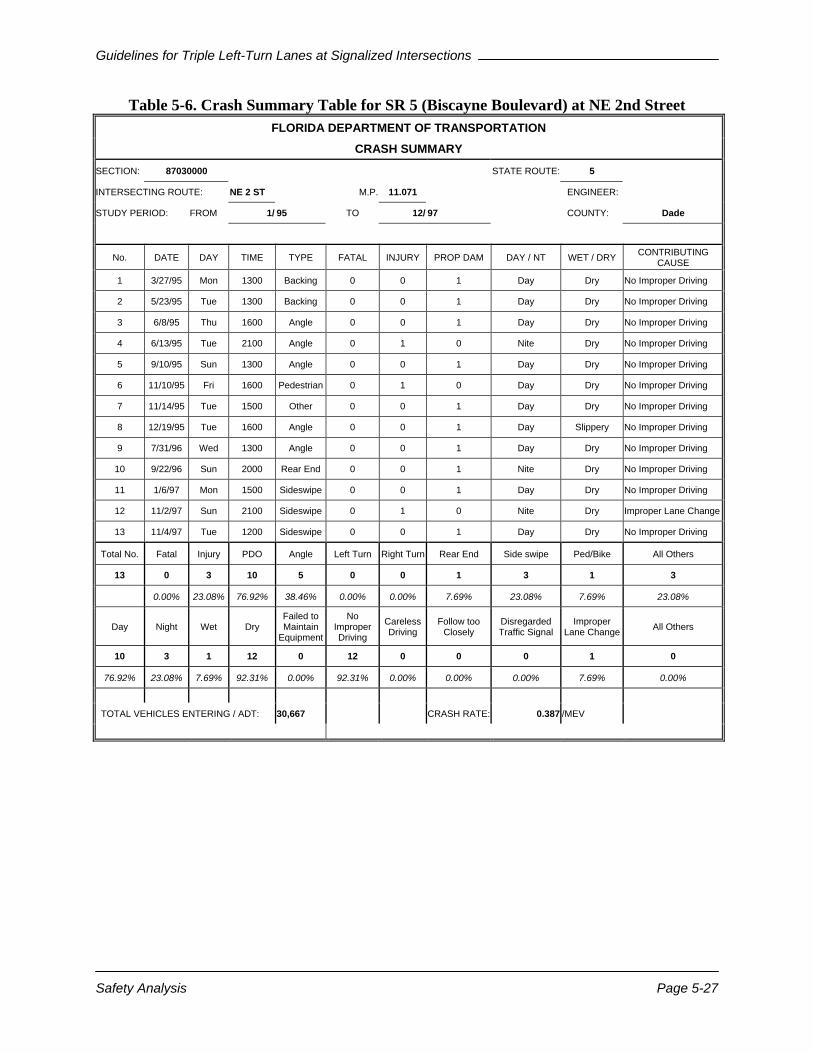
Guidelines for Triple Left-Turn Lanes at Signalized Intersections
Safety Analysis Page 5-27
Table 5-6. Crash Summary Table for SR 5 (Biscayne Boulevard) at NE 2nd Street FLORIDA DEPARTMENT OF TRANSPORTATION
CRASH SUMMARY SECTION: 87030000 STATE ROUTE: 5
INTERSECTING ROUTE: NE 2 ST M.P. 11.071 ENGINEER:
STUDY PERIOD: FROM 1/ 95 TO 12/ 97 COUNTY: Dade
No. DATE DAY TIME TYPE FATAL INJURY PROP DAM DAY / NT WET / DRY CONTRIBUTING CAUSE
1 3/27/95 Mon 1300 Backing 0 0 1 Day Dry No Improper Driving
2 5/23/95 Tue 1300 Backing 0 0 1 Day Dry No Improper Driving
3 6/8/95 Thu 1600 Angle 0 0 1 Day Dry No Improper Driving
4 6/13/95 Tue 2100 Angle 0 1 0 Nite Dry No Improper Driving
5 9/10/95 Sun 1300 Angle 0 0 1 Day Dry No Improper Driving
6 11/10/95 Fri 1600 Pedestrian 0 1 0 Day Dry No Improper Driving
7 11/14/95 Tue 1500 Other 0 0 1 Day Dry No Improper Driving
8 12/19/95 Tue 1600 Angle 0 0 1 Day Slippery No Improper Driving
9 7/31/96 Wed 1300 Angle 0 0 1 Day Dry No Improper Driving
10 9/22/96 Sun 2000 Rear End 0 0 1 Nite Dry No Improper Driving
11 1/6/97 Mon 1500 Sideswipe 0 0 1 Day Dry No Improper Driving
12 11/2/97 Sun 2100 Sideswipe 0 1 0 Nite Dry Improper Lane Change
13 11/4/97 Tue 1200 Sideswipe 0 0 1 Day Dry No Improper Driving
Total No. Fatal Injury PDO Angle Left Turn Right Turn Rear End Side swipe Ped/Bike All Others
13 0 3 10 5 0 0 1 3 1 3
0.00% 23.08% 76.92% 38.46% 0.00% 0.00% 7.69% 23.08% 7.69% 23.08%
Day Night Wet Dry Failed to Maintain
Equipment
No Improper Driving
Careless Driving
Follow too Closely
Disregarded Traffic Signal
Improper Lane Change All Others
10 3 1 12 0 12 0 0 0 1 0
76.92% 23.08% 7.69% 92.31% 0.00% 92.31% 0.00% 0.00% 0.00% 7.69% 0.00%
TOTAL VEHICLES ENTERING / ADT: 30,667 CRASH RATE: 0.387 /MEV
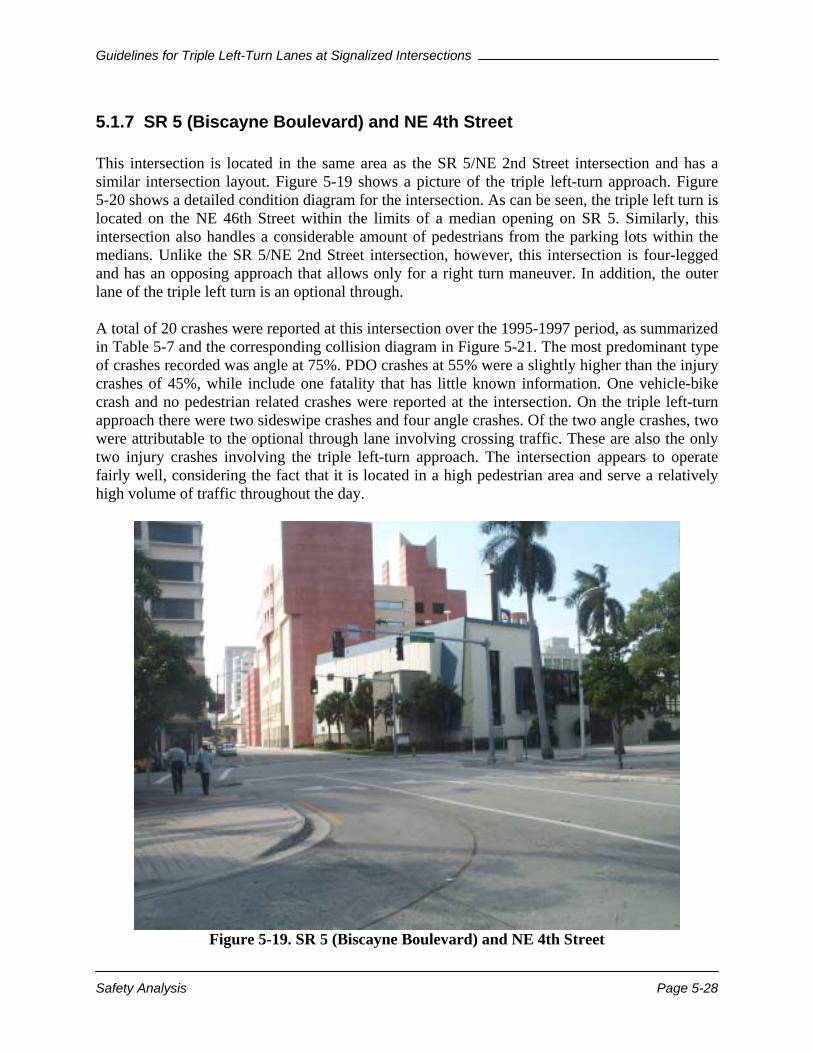
Guidelines for Triple Left-Turn Lanes at Signalized Intersections
Safety Analysis Page 5-28
5.1.7 SR 5 (Biscayne Boulevard) and NE 4th Street This intersection is located in the same area as the SR 5/NE 2nd Street intersection and has a similar intersection layout. Figure 5-19 shows a picture of the triple left-turn approach. Figure 5-20 shows a detailed condition diagram for the intersection. As can be seen, the triple left turn is located on the NE 46th Street within the limits of a median opening on SR 5. Similarly, this intersection also handles a considerable amount of pedestrians from the parking lots within the medians. Unlike the SR 5/NE 2nd Street intersection, however, this intersection is four-legged and has an opposing approach that allows only for a right turn maneuver. In addition, the outer lane of the triple left turn is an optional through. A total of 20 crashes were reported at this intersection over the 1995-1997 period, as summarized in Table 5-7 and the corresponding collision diagram in Figure 5-21. The most predominant type of crashes recorded was angle at 75%. PDO crashes at 55% were a slightly higher than the injury crashes of 45%, while include one fatality that has little known information. One vehicle-bike crash and no pedestrian related crashes were reported at the intersection. On the triple left-turn approach there were two sideswipe crashes and four angle crashes. Of the two angle crashes, two were attributable to the optional through lane involving crossing traffic. These are also the only two injury crashes involving the triple left-turn approach. The intersection appears to operate fairly well, considering the fact that it is located in a high pedestrian area and serve a relatively high volume of traffic throughout the day.
Figure 5-19. SR 5 (Biscayne Boulevard) and NE 4th Street
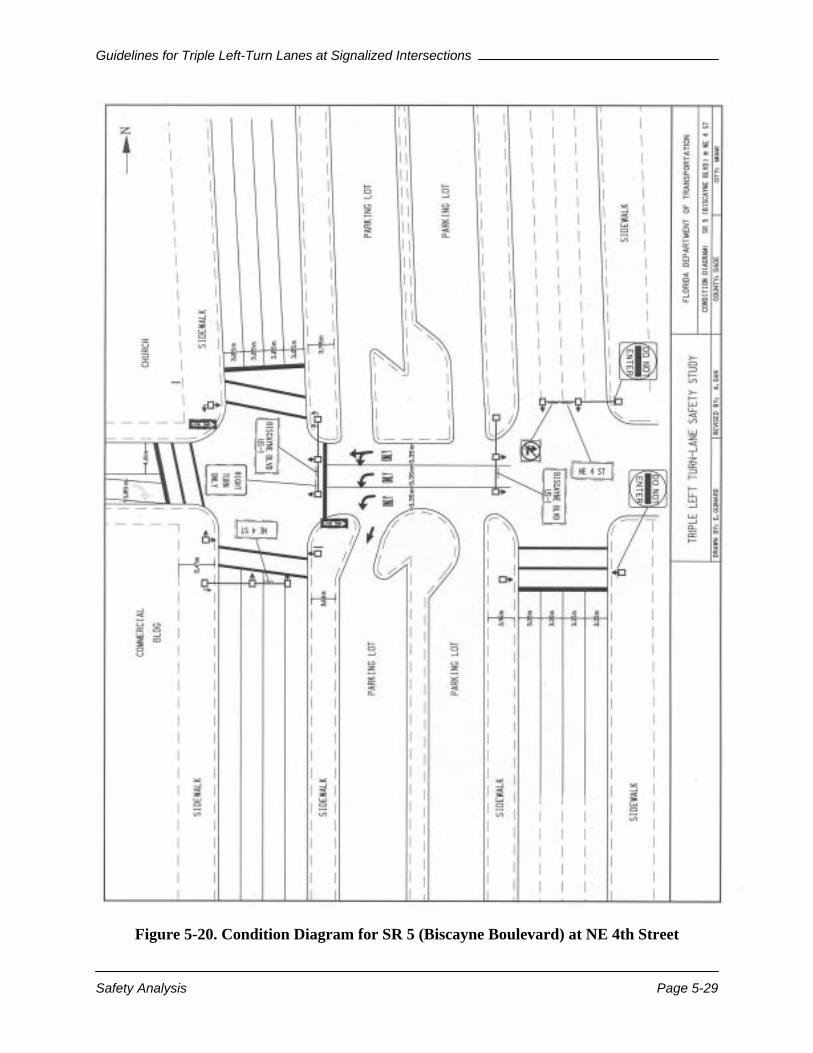
Guidelines for Triple Left-Turn Lanes at Signalized Intersections
Safety Analysis Page 5-29
Figure 5-20. Condition Diagram for SR 5 (Biscayne Boulevard) at NE 4th Street

Guidelines for Triple Left-Turn Lanes at Signalized Intersections
Safety Analysis Page 5-30
Figure 5-21. Collision Diagram for SR 5 (Biscayne Boulevard) at NE 4th Street
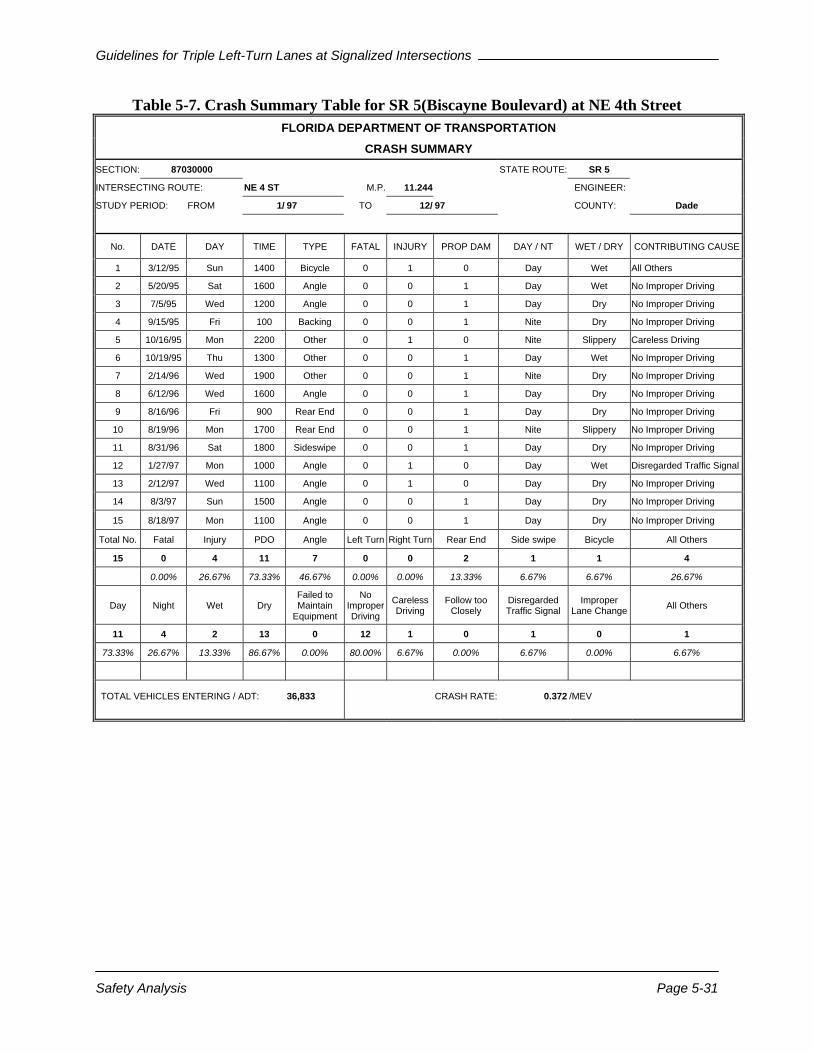
Guidelines for Triple Left-Turn Lanes at Signalized Intersections
Safety Analysis Page 5-31
Table 5-7. Crash Summary Table for SR 5(Biscayne Boulevard) at NE 4th Street FLORIDA DEPARTMENT OF TRANSPORTATION
CRASH SUMMARY SECTION: 87030000 STATE ROUTE: SR 5
INTERSECTING ROUTE: NE 4 ST M.P. 11.244 ENGINEER:
STUDY PERIOD: FROM 1/ 97 TO 12/ 97 COUNTY: Dade
No. DATE DAY TIME TYPE FATAL INJURY PROP DAM DAY / NT WET / DRY CONTRIBUTING CAUSE
1 3/12/95 Sun 1400 Bicycle 0 1 0 Day Wet All Others
2 5/20/95 Sat 1600 Angle 0 0 1 Day Wet No Improper Driving
3 7/5/95 Wed 1200 Angle 0 0 1 Day Dry No Improper Driving
4 9/15/95 Fri 100 Backing 0 0 1 Nite Dry No Improper Driving
5 10/16/95 Mon 2200 Other 0 1 0 Nite Slippery Careless Driving
6 10/19/95 Thu 1300 Other 0 0 1 Day Wet No Improper Driving
7 2/14/96 Wed 1900 Other 0 0 1 Nite Dry No Improper Driving
8 6/12/96 Wed 1600 Angle 0 0 1 Day Dry No Improper Driving
9 8/16/96 Fri 900 Rear End 0 0 1 Day Dry No Improper Driving
10 8/19/96 Mon 1700 Rear End 0 0 1 Nite Slippery No Improper Driving
11 8/31/96 Sat 1800 Sideswipe 0 0 1 Day Dry No Improper Driving
12 1/27/97 Mon 1000 Angle 0 1 0 Day Wet Disregarded Traffic Signal
13 2/12/97 Wed 1100 Angle 0 1 0 Day Dry No Improper Driving
14 8/3/97 Sun 1500 Angle 0 0 1 Day Dry No Improper Driving
15 8/18/97 Mon 1100 Angle 0 0 1 Day Dry No Improper Driving
Total No. Fatal Injury PDO Angle Left Turn Right Turn Rear End Side swipe Bicycle All Others
15 0 4 11 7 0 0 2 1 1 4
0.00% 26.67% 73.33% 46.67% 0.00% 0.00% 13.33% 6.67% 6.67% 26.67%
Day Night Wet Dry Failed to Maintain
Equipment
No Improper Driving
Careless Driving
Follow too Closely
Disregarded Traffic Signal
Improper Lane Change All Others
11 4 2 13 0 12 1 0 1 0 1
73.33% 26.67% 13.33% 86.67% 0.00% 80.00% 6.67% 0.00% 6.67% 0.00% 6.67%
TOTAL VEHICLES ENTERING / ADT: 36,833 CRASH RATE: 0.372 /MEV
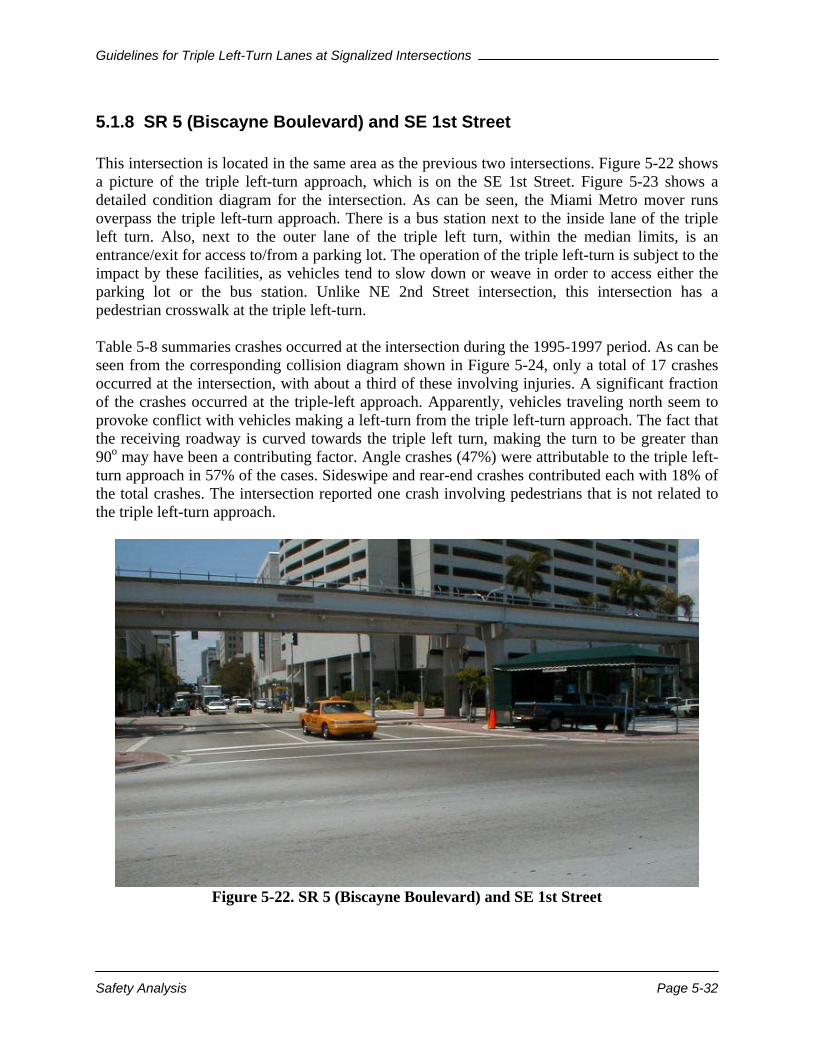
Guidelines for Triple Left-Turn Lanes at Signalized Intersections
Safety Analysis Page 5-32
5.1.8 SR 5 (Biscayne Boulevard) and SE 1st Street This intersection is located in the same area as the previous two intersections. Figure 5-22 shows a picture of the triple left-turn approach, which is on the SE 1st Street. Figure 5-23 shows a detailed condition diagram for the intersection. As can be seen, the Miami Metro mover runs overpass the triple left-turn approach. There is a bus station next to the inside lane of the triple left turn. Also, next to the outer lane of the triple left turn, within the median limits, is an entrance/exit for access to/from a parking lot. The operation of the triple left-turn is subject to the impact by these facilities, as vehicles tend to slow down or weave in order to access either the parking lot or the bus station. Unlike NE 2nd Street intersection, this intersection has a pedestrian crosswalk at the triple left-turn. Table 5-8 summaries crashes occurred at the intersection during the 1995-1997 period. As can be seen from the corresponding collision diagram shown in Figure 5-24, only a total of 17 crashes occurred at the intersection, with about a third of these involving injuries. A significant fraction of the crashes occurred at the triple-left approach. Apparently, vehicles traveling north seem to provoke conflict with vehicles making a left-turn from the triple left-turn approach. The fact that the receiving roadway is curved towards the triple left turn, making the turn to be greater than 90o may have been a contributing factor. Angle crashes (47%) were attributable to the triple left-turn approach in 57% of the cases. Sideswipe and rear-end crashes contributed each with 18% of the total crashes. The intersection reported one crash involving pedestrians that is not related to the triple left-turn approach.
Figure 5-22. SR 5 (Biscayne Boulevard) and SE 1st Street
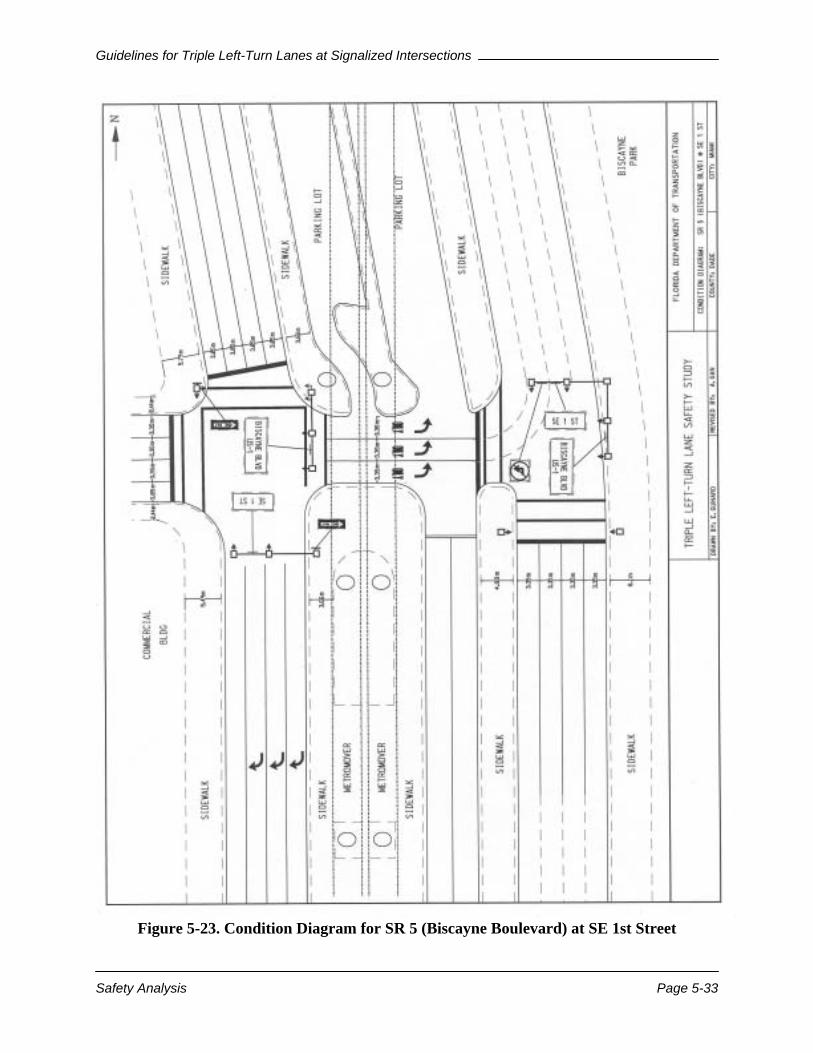
Guidelines for Triple Left-Turn Lanes at Signalized Intersections
Safety Analysis Page 5-33
Figure 5-23. Condition Diagram for SR 5 (Biscayne Boulevard) at SE 1st Street
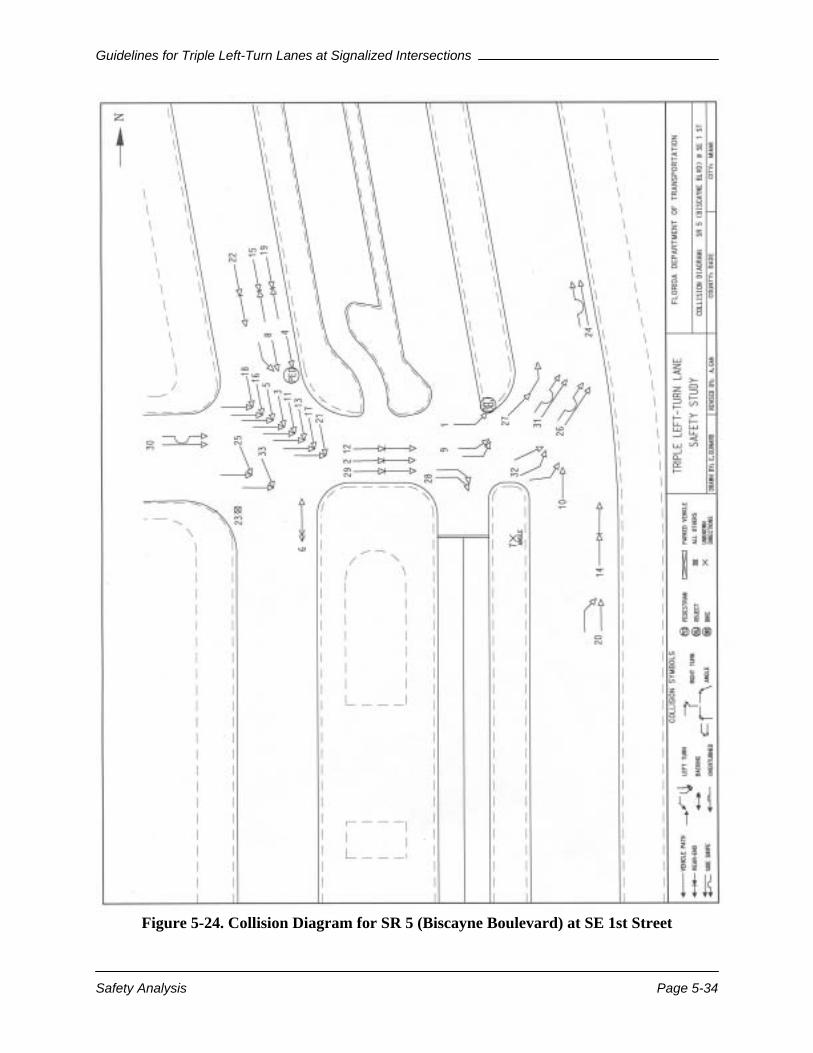
Guidelines for Triple Left-Turn Lanes at Signalized Intersections
Safety Analysis Page 5-34
Figure 5-24. Collision Diagram for SR 5 (Biscayne Boulevard) at SE 1st Street
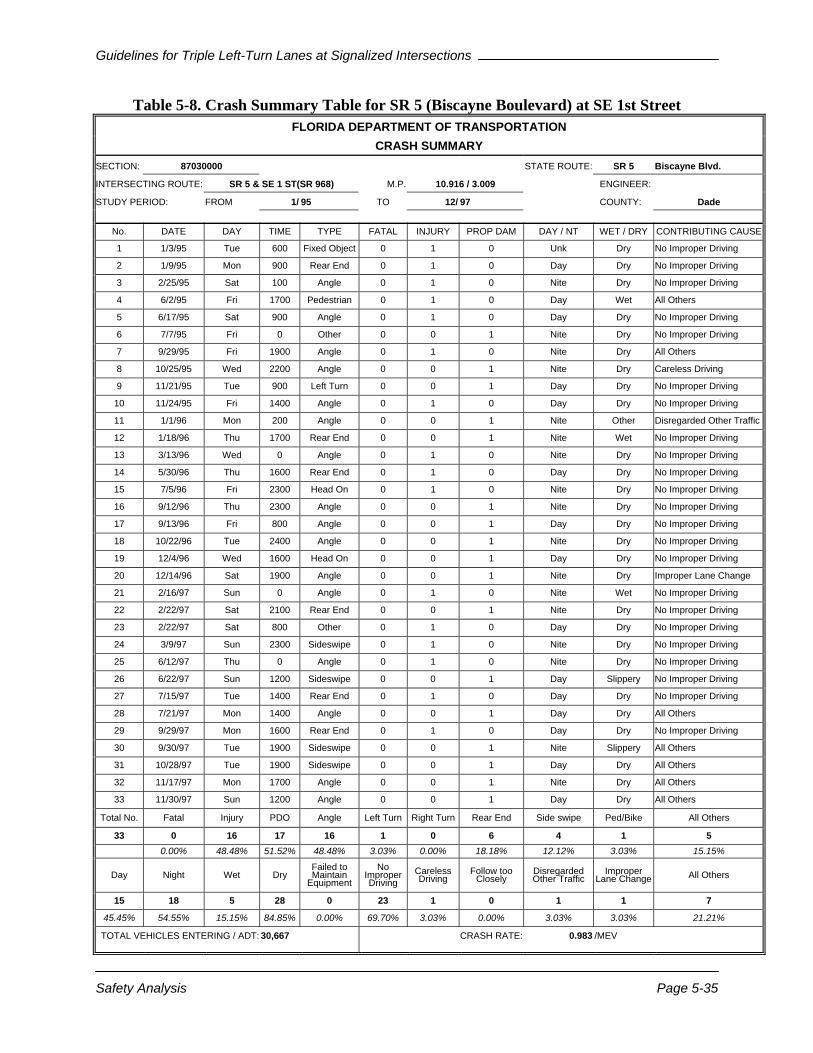
Guidelines for Triple Left-Turn Lanes at Signalized Intersections
Safety Analysis Page 5-35
Table 5-8. Crash Summary Table for SR 5 (Biscayne Boulevard) at SE 1st Street FLORIDA DEPARTMENT OF TRANSPORTATION
CRASH SUMMARY SECTION: 87030000 STATE ROUTE: SR 5 Biscayne Blvd.
INTERSECTING ROUTE: SR 5 & SE 1 ST(SR 968) M.P. 10.916 / 3.009 ENGINEER:
STUDY PERIOD: FROM 1/ 95 TO 12/ 97 COUNTY: Dade
No. DATE DAY TIME TYPE FATAL INJURY PROP DAM DAY / NT WET / DRY CONTRIBUTING CAUSE
1 1/3/95 Tue 600 Fixed Object 0 1 0 Unk Dry No Improper Driving
2 1/9/95 Mon 900 Rear End 0 1 0 Day Dry No Improper Driving
3 2/25/95 Sat 100 Angle 0 1 0 Nite Dry No Improper Driving
4 6/2/95 Fri 1700 Pedestrian 0 1 0 Day Wet All Others
5 6/17/95 Sat 900 Angle 0 1 0 Day Dry No Improper Driving
6 7/7/95 Fri 0 Other 0 0 1 Nite Dry No Improper Driving
7 9/29/95 Fri 1900 Angle 0 1 0 Nite Dry All Others
8 10/25/95 Wed 2200 Angle 0 0 1 Nite Dry Careless Driving
9 11/21/95 Tue 900 Left Turn 0 0 1 Day Dry No Improper Driving
10 11/24/95 Fri 1400 Angle 0 1 0 Day Dry No Improper Driving
11 1/1/96 Mon 200 Angle 0 0 1 Nite Other Disregarded Other Traffic
12 1/18/96 Thu 1700 Rear End 0 0 1 Nite Wet No Improper Driving
13 3/13/96 Wed 0 Angle 0 1 0 Nite Dry No Improper Driving
14 5/30/96 Thu 1600 Rear End 0 1 0 Day Dry No Improper Driving
15 7/5/96 Fri 2300 Head On 0 1 0 Nite Dry No Improper Driving
16 9/12/96 Thu 2300 Angle 0 0 1 Nite Dry No Improper Driving
17 9/13/96 Fri 800 Angle 0 0 1 Day Dry No Improper Driving
18 10/22/96 Tue 2400 Angle 0 0 1 Nite Dry No Improper Driving
19 12/4/96 Wed 1600 Head On 0 0 1 Day Dry No Improper Driving
20 12/14/96 Sat 1900 Angle 0 0 1 Nite Dry Improper Lane Change
21 2/16/97 Sun 0 Angle 0 1 0 Nite Wet No Improper Driving
22 2/22/97 Sat 2100 Rear End 0 0 1 Nite Dry No Improper Driving
23 2/22/97 Sat 800 Other 0 1 0 Day Dry No Improper Driving
24 3/9/97 Sun 2300 Sideswipe 0 1 0 Nite Dry No Improper Driving
25 6/12/97 Thu 0 Angle 0 1 0 Nite Dry No Improper Driving
26 6/22/97 Sun 1200 Sideswipe 0 0 1 Day Slippery No Improper Driving
27 7/15/97 Tue 1400 Rear End 0 1 0 Day Dry No Improper Driving
28 7/21/97 Mon 1400 Angle 0 0 1 Day Dry All Others
29 9/29/97 Mon 1600 Rear End 0 1 0 Day Dry No Improper Driving
30 9/30/97 Tue 1900 Sideswipe 0 0 1 Nite Slippery All Others
31 10/28/97 Tue 1900 Sideswipe 0 0 1 Day Dry All Others
32 11/17/97 Mon 1700 Angle 0 0 1 Nite Dry All Others
33 11/30/97 Sun 1200 Angle 0 0 1 Day Dry All Others
Total No. Fatal Injury PDO Angle Left Turn Right Turn Rear End Side swipe Ped/Bike All Others
33 0 16 17 16 1 0 6 4 1 5 0.00% 48.48% 51.52% 48.48% 3.03% 0.00% 18.18% 12.12% 3.03% 15.15%
Day Night Wet Dry Failed to Maintain
Equipment
No Improper Driving
Careless Driving
Follow too Closely
Disregarded Other Traffic
Improper Lane Change All Others
15 18 5 28 0 23 1 0 1 1 7
45.45% 54.55% 15.15% 84.85% 0.00% 69.70% 3.03% 0.00% 3.03% 3.03% 21.21%
TOTAL VEHICLES ENTERING / ADT: 30,667 CRASH RATE: 0.983 /MEV
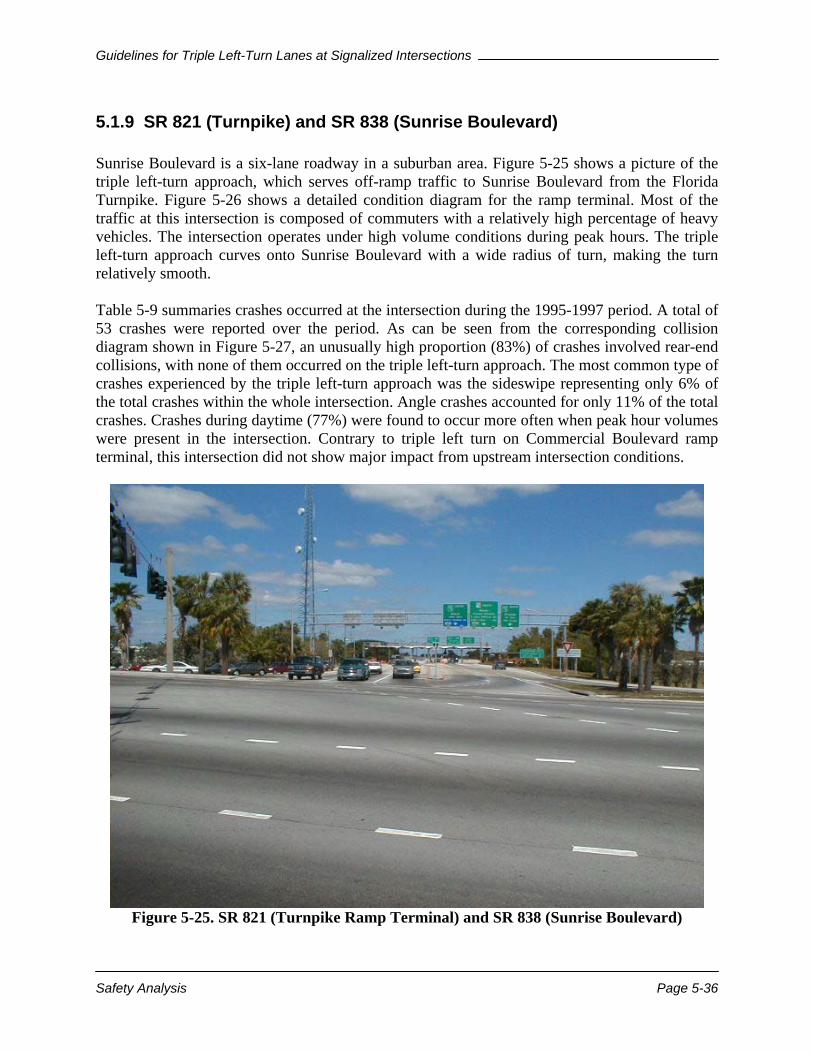
Guidelines for Triple Left-Turn Lanes at Signalized Intersections
Safety Analysis Page 5-36
5.1.9 SR 821 (Turnpike) and SR 838 (Sunrise Boulevard) Sunrise Boulevard is a six-lane roadway in a suburban area. Figure 5-25 shows a picture of the triple left-turn approach, which serves off-ramp traffic to Sunrise Boulevard from the Florida Turnpike. Figure 5-26 shows a detailed condition diagram for the ramp terminal. Most of the traffic at this intersection is composed of commuters with a relatively high percentage of heavy vehicles. The intersection operates under high volume conditions during peak hours. The triple left-turn approach curves onto Sunrise Boulevard with a wide radius of turn, making the turn relatively smooth. Table 5-9 summaries crashes occurred at the intersection during the 1995-1997 period. A total of 53 crashes were reported over the period. As can be seen from the corresponding collision diagram shown in Figure 5-27, an unusually high proportion (83%) of crashes involved rear-end collisions, with none of them occurred on the triple left-turn approach. The most common type of crashes experienced by the triple left-turn approach was the sideswipe representing only 6% of the total crashes within the whole intersection. Angle crashes accounted for only 11% of the total crashes. Crashes during daytime (77%) were found to occur more often when peak hour volumes were present in the intersection. Contrary to triple left turn on Commercial Boulevard ramp terminal, this intersection did not show major impact from upstream intersection conditions.
Figure 5-25. SR 821 (Turnpike Ramp Terminal) and SR 838 (Sunrise Boulevard)
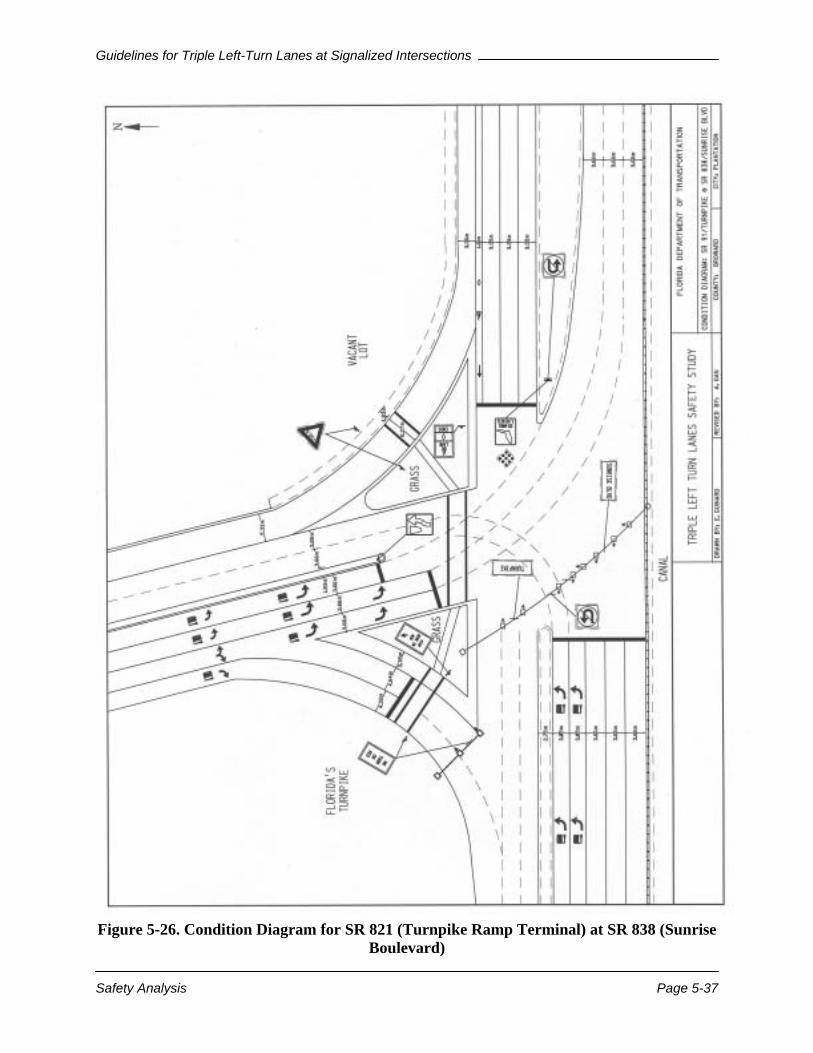
Guidelines for Triple Left-Turn Lanes at Signalized Intersections
Safety Analysis Page 5-37
Figure 5-26. Condition Diagram for SR 821 (Turnpike Ramp Terminal) at SR 838 (Sunrise
Boulevard)
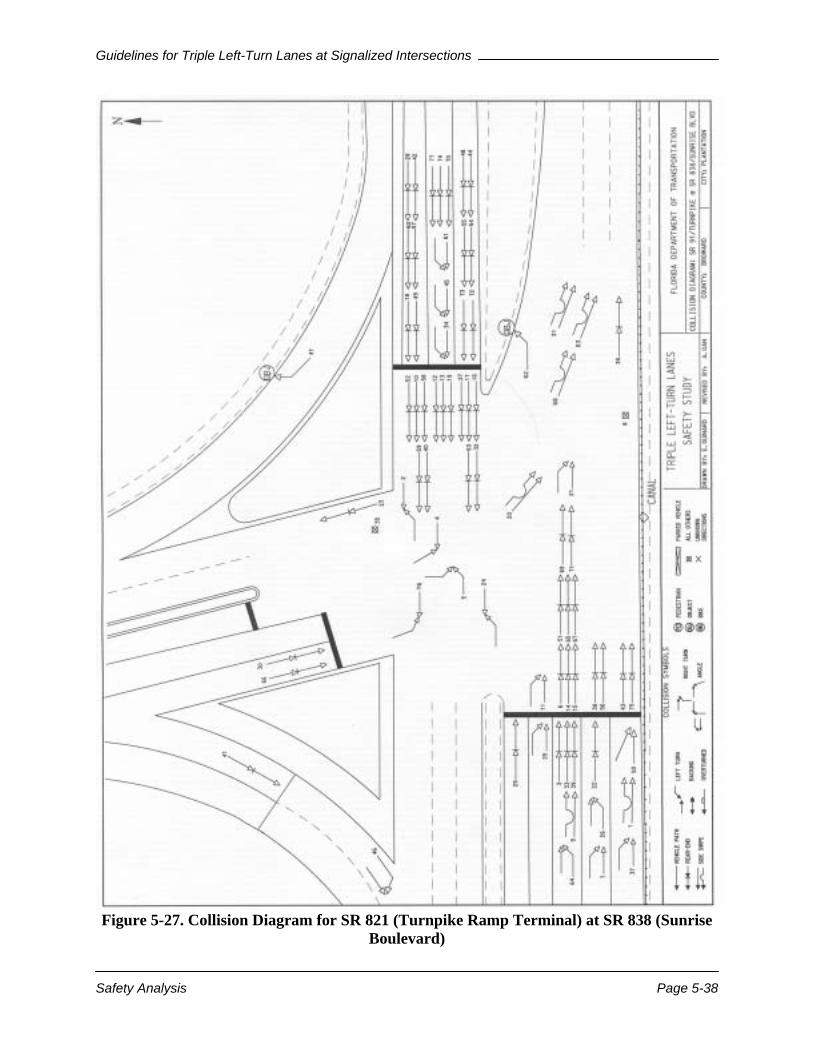
Guidelines for Triple Left-Turn Lanes at Signalized Intersections
Safety Analysis Page 5-38
Figure 5-27. Collision Diagram for SR 821 (Turnpike Ramp Terminal) at SR 838 (Sunrise
Boulevard)
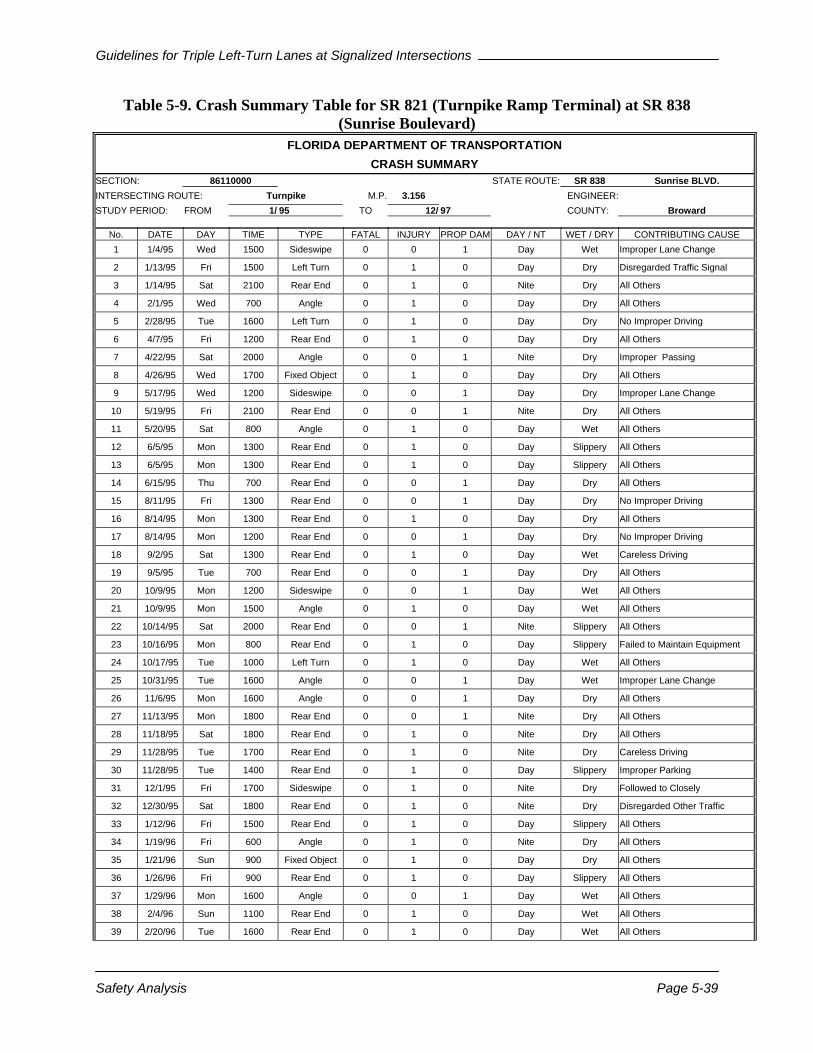
Guidelines for Triple Left-Turn Lanes at Signalized Intersections
Safety Analysis Page 5-39
Table 5-9. Crash Summary Table for SR 821 (Turnpike Ramp Terminal) at SR 838 (Sunrise Boulevard)
FLORIDA DEPARTMENT OF TRANSPORTATION CRASH SUMMARY
SECTION: 86110000 STATE ROUTE: SR 838 Sunrise BLVD. INTERSECTING ROUTE: Turnpike M.P. 3.156 ENGINEER: STUDY PERIOD: FROM 1/ 95 TO 12/ 97 COUNTY: Broward
No. DATE DAY TIME TYPE FATAL INJURY PROP DAM DAY / NT WET / DRY CONTRIBUTING CAUSE 1 1/4/95 Wed 1500 Sideswipe 0 0 1 Day Wet Improper Lane Change
2 1/13/95 Fri 1500 Left Turn 0 1 0 Day Dry Disregarded Traffic Signal
3 1/14/95 Sat 2100 Rear End 0 1 0 Nite Dry All Others
4 2/1/95 Wed 700 Angle 0 1 0 Day Dry All Others
5 2/28/95 Tue 1600 Left Turn 0 1 0 Day Dry No Improper Driving
6 4/7/95 Fri 1200 Rear End 0 1 0 Day Dry All Others
7 4/22/95 Sat 2000 Angle 0 0 1 Nite Dry Improper Passing
8 4/26/95 Wed 1700 Fixed Object 0 1 0 Day Dry All Others
9 5/17/95 Wed 1200 Sideswipe 0 0 1 Day Dry Improper Lane Change
10 5/19/95 Fri 2100 Rear End 0 0 1 Nite Dry All Others
11 5/20/95 Sat 800 Angle 0 1 0 Day Wet All Others
12 6/5/95 Mon 1300 Rear End 0 1 0 Day Slippery All Others
13 6/5/95 Mon 1300 Rear End 0 1 0 Day Slippery All Others
14 6/15/95 Thu 700 Rear End 0 0 1 Day Dry All Others
15 8/11/95 Fri 1300 Rear End 0 0 1 Day Dry No Improper Driving
16 8/14/95 Mon 1300 Rear End 0 1 0 Day Dry All Others
17 8/14/95 Mon 1200 Rear End 0 0 1 Day Dry No Improper Driving
18 9/2/95 Sat 1300 Rear End 0 1 0 Day Wet Careless Driving
19 9/5/95 Tue 700 Rear End 0 0 1 Day Dry All Others
20 10/9/95 Mon 1200 Sideswipe 0 0 1 Day Wet All Others
21 10/9/95 Mon 1500 Angle 0 1 0 Day Wet All Others
22 10/14/95 Sat 2000 Rear End 0 0 1 Nite Slippery All Others
23 10/16/95 Mon 800 Rear End 0 1 0 Day Slippery Failed to Maintain Equipment
24 10/17/95 Tue 1000 Left Turn 0 1 0 Day Wet All Others
25 10/31/95 Tue 1600 Angle 0 0 1 Day Wet Improper Lane Change
26 11/6/95 Mon 1600 Angle 0 0 1 Day Dry All Others
27 11/13/95 Mon 1800 Rear End 0 0 1 Nite Dry All Others
28 11/18/95 Sat 1800 Rear End 0 1 0 Nite Dry All Others
29 11/28/95 Tue 1700 Rear End 0 1 0 Nite Dry Careless Driving
30 11/28/95 Tue 1400 Rear End 0 1 0 Day Slippery Improper Parking
31 12/1/95 Fri 1700 Sideswipe 0 1 0 Nite Dry Followed to Closely
32 12/30/95 Sat 1800 Rear End 0 1 0 Nite Dry Disregarded Other Traffic
33 1/12/96 Fri 1500 Rear End 0 1 0 Day Slippery All Others
34 1/19/96 Fri 600 Angle 0 1 0 Nite Dry All Others
35 1/21/96 Sun 900 Fixed Object 0 1 0 Day Dry All Others
36 1/26/96 Fri 900 Rear End 0 1 0 Day Slippery All Others
37 1/29/96 Mon 1600 Angle 0 0 1 Day Wet All Others
38 2/4/96 Sun 1100 Rear End 0 1 0 Day Wet All Others
39 2/20/96 Tue 1600 Rear End 0 1 0 Day Wet All Others
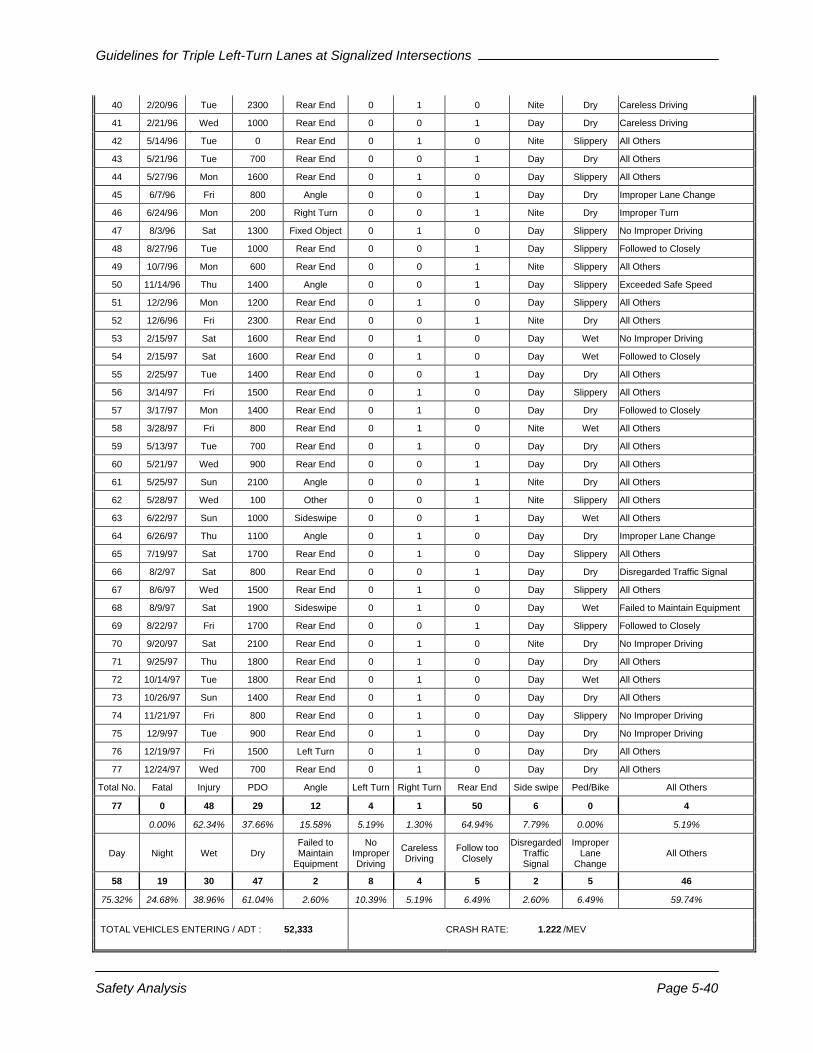
Guidelines for Triple Left-Turn Lanes at Signalized Intersections
Safety Analysis Page 5-40
40 2/20/96 Tue 2300 Rear End 0 1 0 Nite Dry Careless Driving
41 2/21/96 Wed 1000 Rear End 0 0 1 Day Dry Careless Driving
42 5/14/96 Tue 0 Rear End 0 1 0 Nite Slippery All Others
43 5/21/96 Tue 700 Rear End 0 0 1 Day Dry All Others
44 5/27/96 Mon 1600 Rear End 0 1 0 Day Slippery All Others
45 6/7/96 Fri 800 Angle 0 0 1 Day Dry Improper Lane Change
46 6/24/96 Mon 200 Right Turn 0 0 1 Nite Dry Improper Turn
47 8/3/96 Sat 1300 Fixed Object 0 1 0 Day Slippery No Improper Driving
48 8/27/96 Tue 1000 Rear End 0 0 1 Day Slippery Followed to Closely
49 10/7/96 Mon 600 Rear End 0 0 1 Nite Slippery All Others
50 11/14/96 Thu 1400 Angle 0 0 1 Day Slippery Exceeded Safe Speed
51 12/2/96 Mon 1200 Rear End 0 1 0 Day Slippery All Others
52 12/6/96 Fri 2300 Rear End 0 0 1 Nite Dry All Others
53 2/15/97 Sat 1600 Rear End 0 1 0 Day Wet No Improper Driving
54 2/15/97 Sat 1600 Rear End 0 1 0 Day Wet Followed to Closely
55 2/25/97 Tue 1400 Rear End 0 0 1 Day Dry All Others
56 3/14/97 Fri 1500 Rear End 0 1 0 Day Slippery All Others
57 3/17/97 Mon 1400 Rear End 0 1 0 Day Dry Followed to Closely
58 3/28/97 Fri 800 Rear End 0 1 0 Nite Wet All Others
59 5/13/97 Tue 700 Rear End 0 1 0 Day Dry All Others
60 5/21/97 Wed 900 Rear End 0 0 1 Day Dry All Others
61 5/25/97 Sun 2100 Angle 0 0 1 Nite Dry All Others
62 5/28/97 Wed 100 Other 0 0 1 Nite Slippery All Others
63 6/22/97 Sun 1000 Sideswipe 0 0 1 Day Wet All Others
64 6/26/97 Thu 1100 Angle 0 1 0 Day Dry Improper Lane Change
65 7/19/97 Sat 1700 Rear End 0 1 0 Day Slippery All Others
66 8/2/97 Sat 800 Rear End 0 0 1 Day Dry Disregarded Traffic Signal
67 8/6/97 Wed 1500 Rear End 0 1 0 Day Slippery All Others
68 8/9/97 Sat 1900 Sideswipe 0 1 0 Day Wet Failed to Maintain Equipment
69 8/22/97 Fri 1700 Rear End 0 0 1 Day Slippery Followed to Closely
70 9/20/97 Sat 2100 Rear End 0 1 0 Nite Dry No Improper Driving
71 9/25/97 Thu 1800 Rear End 0 1 0 Day Dry All Others
72 10/14/97 Tue 1800 Rear End 0 1 0 Day Wet All Others
73 10/26/97 Sun 1400 Rear End 0 1 0 Day Dry All Others
74 11/21/97 Fri 800 Rear End 0 1 0 Day Slippery No Improper Driving
75 12/9/97 Tue 900 Rear End 0 1 0 Day Dry No Improper Driving
76 12/19/97 Fri 1500 Left Turn 0 1 0 Day Dry All Others
77 12/24/97 Wed 700 Rear End 0 1 0 Day Dry All Others
Total No. Fatal Injury PDO Angle Left Turn Right Turn Rear End Side swipe Ped/Bike All Others
77 0 48 29 12 4 1 50 6 0 4
0.00% 62.34% 37.66% 15.58% 5.19% 1.30% 64.94% 7.79% 0.00% 5.19%
Day Night Wet Dry Failed to Maintain
Equipment
No Improper Driving
Careless Driving
Follow too Closely
Disregarded Traffic Signal
Improper Lane
Change All Others
58 19 30 47 2 8 4 5 2 5 46
75.32% 24.68% 38.96% 61.04% 2.60% 10.39% 5.19% 6.49% 2.60% 6.49% 59.74%
TOTAL VEHICLES ENTERING / ADT : 52,333 CRASH RATE: 1.222 /MEV
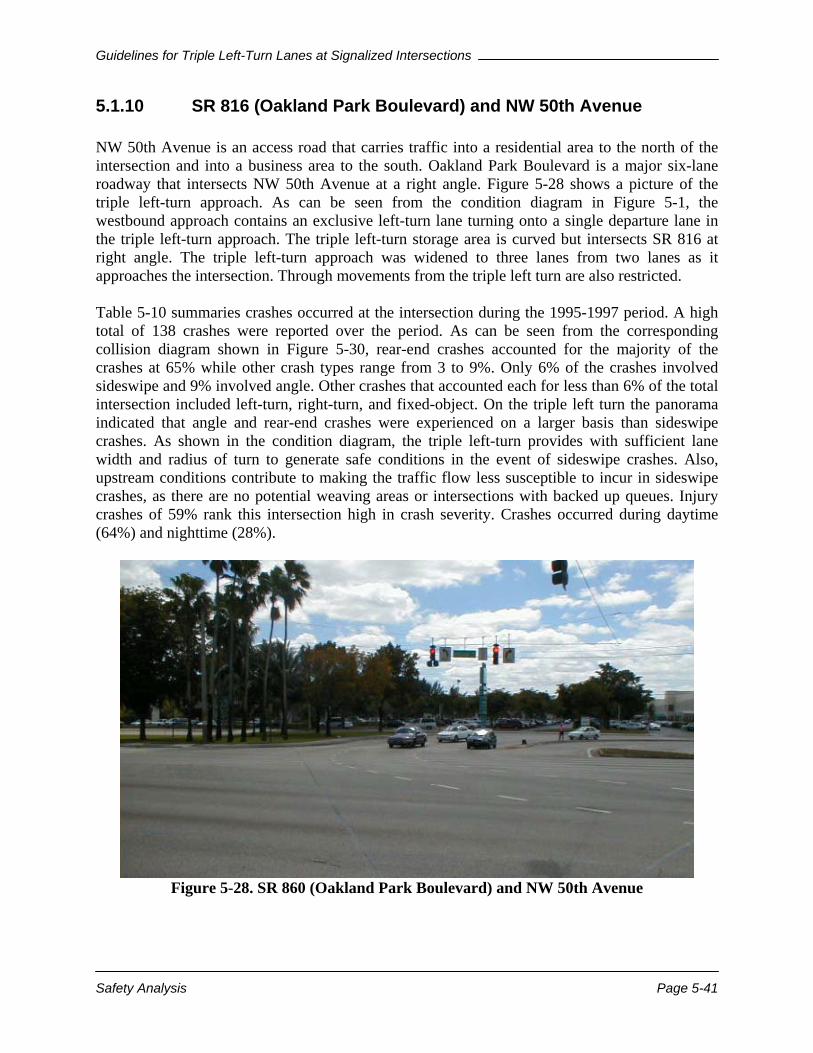
Guidelines for Triple Left-Turn Lanes at Signalized Intersections
Safety Analysis Page 5-41
5.1.10 SR 816 (Oakland Park Boulevard) and NW 50th Avenue NW 50th Avenue is an access road that carries traffic into a residential area to the north of the intersection and into a business area to the south. Oakland Park Boulevard is a major six-lane roadway that intersects NW 50th Avenue at a right angle. Figure 5-28 shows a picture of the triple left-turn approach. As can be seen from the condition diagram in Figure 5-1, the westbound approach contains an exclusive left-turn lane turning onto a single departure lane in the triple left-turn approach. The triple left-turn storage area is curved but intersects SR 816 at right angle. The triple left-turn approach was widened to three lanes from two lanes as it approaches the intersection. Through movements from the triple left turn are also restricted. Table 5-10 summaries crashes occurred at the intersection during the 1995-1997 period. A high total of 138 crashes were reported over the period. As can be seen from the corresponding collision diagram shown in Figure 5-30, rear-end crashes accounted for the majority of the crashes at 65% while other crash types range from 3 to 9%. Only 6% of the crashes involved sideswipe and 9% involved angle. Other crashes that accounted each for less than 6% of the total intersection included left-turn, right-turn, and fixed-object. On the triple left turn the panorama indicated that angle and rear-end crashes were experienced on a larger basis than sideswipe crashes. As shown in the condition diagram, the triple left-turn provides with sufficient lane width and radius of turn to generate safe conditions in the event of sideswipe crashes. Also, upstream conditions contribute to making the traffic flow less susceptible to incur in sideswipe crashes, as there are no potential weaving areas or intersections with backed up queues. Injury crashes of 59% rank this intersection high in crash severity. Crashes occurred during daytime (64%) and nighttime (28%).
Figure 5-28. SR 860 (Oakland Park Boulevard) and NW 50th Avenue
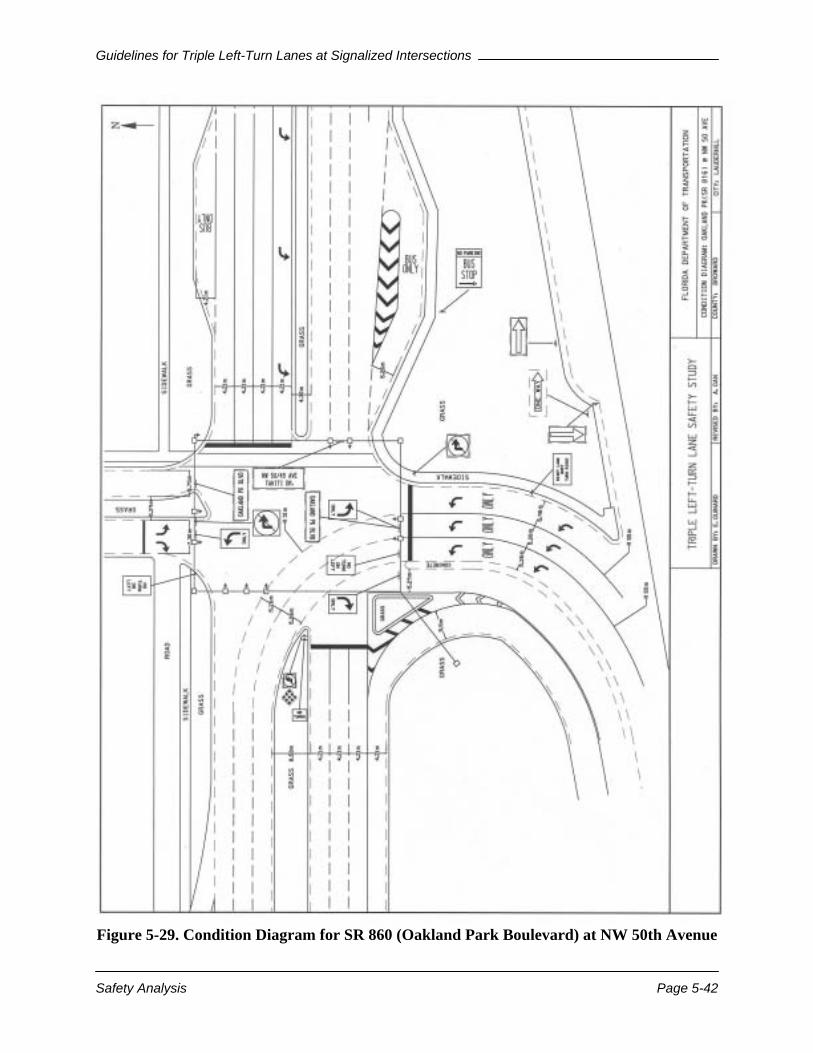
Guidelines for Triple Left-Turn Lanes at Signalized Intersections
Safety Analysis Page 5-42
Figure 5-29. Condition Diagram for SR 860 (Oakland Park Boulevard) at NW 50th Avenue

Guidelines for Triple Left-Turn Lanes at Signalized Intersections
Safety Analysis Page 5-43
Figure 5-30. Collision Diagram for SR 860 (Oakland Park Boulevard) at NW 50th Avenue
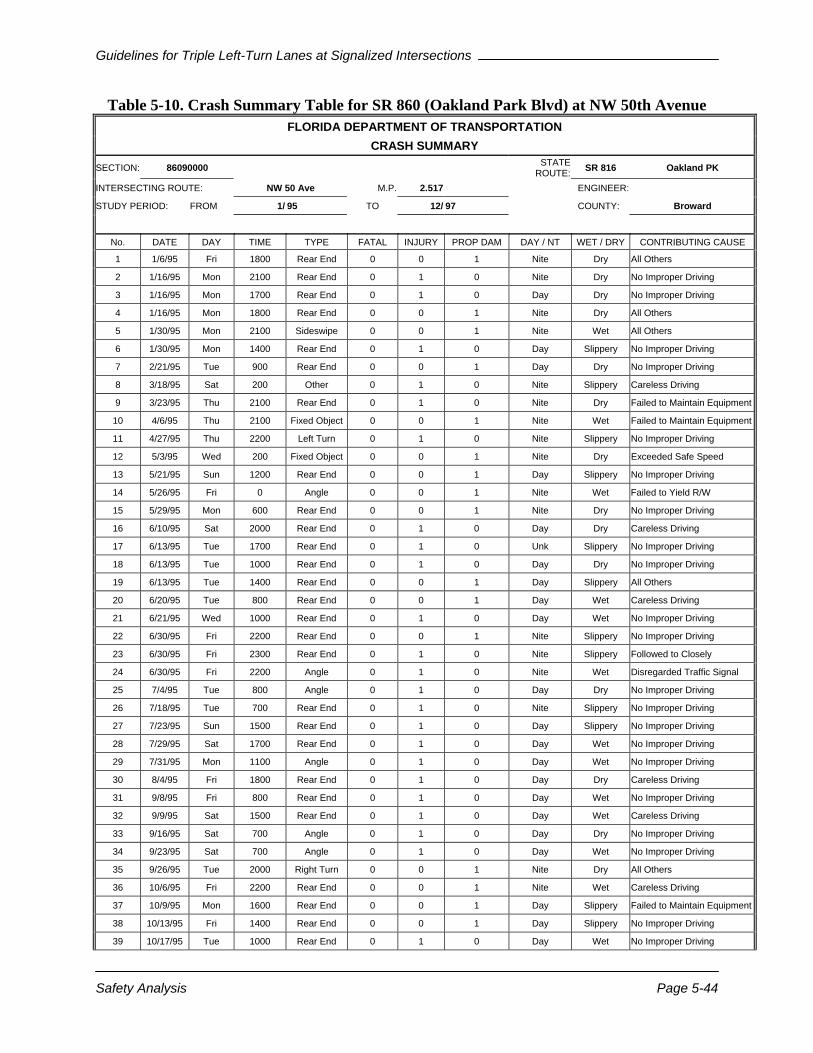
Guidelines for Triple Left-Turn Lanes at Signalized Intersections
Safety Analysis Page 5-44
Table 5-10. Crash Summary Table for SR 860 (Oakland Park Blvd) at NW 50th Avenue FLORIDA DEPARTMENT OF TRANSPORTATION
CRASH SUMMARY SECTION: 86090000 STATE
ROUTE: SR 816 Oakland PK
INTERSECTING ROUTE: NW 50 Ave M.P. 2.517 ENGINEER:
STUDY PERIOD: FROM 1/ 95 TO 12/ 97 COUNTY: Broward
No. DATE DAY TIME TYPE FATAL INJURY PROP DAM DAY / NT WET / DRY CONTRIBUTING CAUSE
1 1/6/95 Fri 1800 Rear End 0 0 1 Nite Dry All Others
2 1/16/95 Mon 2100 Rear End 0 1 0 Nite Dry No Improper Driving
3 1/16/95 Mon 1700 Rear End 0 1 0 Day Dry No Improper Driving
4 1/16/95 Mon 1800 Rear End 0 0 1 Nite Dry All Others
5 1/30/95 Mon 2100 Sideswipe 0 0 1 Nite Wet All Others
6 1/30/95 Mon 1400 Rear End 0 1 0 Day Slippery No Improper Driving
7 2/21/95 Tue 900 Rear End 0 0 1 Day Dry No Improper Driving
8 3/18/95 Sat 200 Other 0 1 0 Nite Slippery Careless Driving
9 3/23/95 Thu 2100 Rear End 0 1 0 Nite Dry Failed to Maintain Equipment
10 4/6/95 Thu 2100 Fixed Object 0 0 1 Nite Wet Failed to Maintain Equipment
11 4/27/95 Thu 2200 Left Turn 0 1 0 Nite Slippery No Improper Driving
12 5/3/95 Wed 200 Fixed Object 0 0 1 Nite Dry Exceeded Safe Speed
13 5/21/95 Sun 1200 Rear End 0 0 1 Day Slippery No Improper Driving
14 5/26/95 Fri 0 Angle 0 0 1 Nite Wet Failed to Yield R/W
15 5/29/95 Mon 600 Rear End 0 0 1 Nite Dry No Improper Driving
16 6/10/95 Sat 2000 Rear End 0 1 0 Day Dry Careless Driving
17 6/13/95 Tue 1700 Rear End 0 1 0 Unk Slippery No Improper Driving
18 6/13/95 Tue 1000 Rear End 0 1 0 Day Dry No Improper Driving
19 6/13/95 Tue 1400 Rear End 0 0 1 Day Slippery All Others
20 6/20/95 Tue 800 Rear End 0 0 1 Day Wet Careless Driving
21 6/21/95 Wed 1000 Rear End 0 1 0 Day Wet No Improper Driving
22 6/30/95 Fri 2200 Rear End 0 0 1 Nite Slippery No Improper Driving
23 6/30/95 Fri 2300 Rear End 0 1 0 Nite Slippery Followed to Closely
24 6/30/95 Fri 2200 Angle 0 1 0 Nite Wet Disregarded Traffic Signal
25 7/4/95 Tue 800 Angle 0 1 0 Day Dry No Improper Driving
26 7/18/95 Tue 700 Rear End 0 1 0 Nite Slippery No Improper Driving
27 7/23/95 Sun 1500 Rear End 0 1 0 Day Slippery No Improper Driving
28 7/29/95 Sat 1700 Rear End 0 1 0 Day Wet No Improper Driving
29 7/31/95 Mon 1100 Angle 0 1 0 Day Wet No Improper Driving
30 8/4/95 Fri 1800 Rear End 0 1 0 Day Dry Careless Driving
31 9/8/95 Fri 800 Rear End 0 1 0 Day Wet No Improper Driving
32 9/9/95 Sat 1500 Rear End 0 1 0 Day Wet Careless Driving
33 9/16/95 Sat 700 Angle 0 1 0 Day Dry No Improper Driving
34 9/23/95 Sat 700 Angle 0 1 0 Day Wet No Improper Driving
35 9/26/95 Tue 2000 Right Turn 0 0 1 Nite Dry All Others
36 10/6/95 Fri 2200 Rear End 0 0 1 Nite Wet Careless Driving
37 10/9/95 Mon 1600 Rear End 0 0 1 Day Slippery Failed to Maintain Equipment
38 10/13/95 Fri 1400 Rear End 0 0 1 Day Slippery No Improper Driving
39 10/17/95 Tue 1000 Rear End 0 1 0 Day Wet No Improper Driving
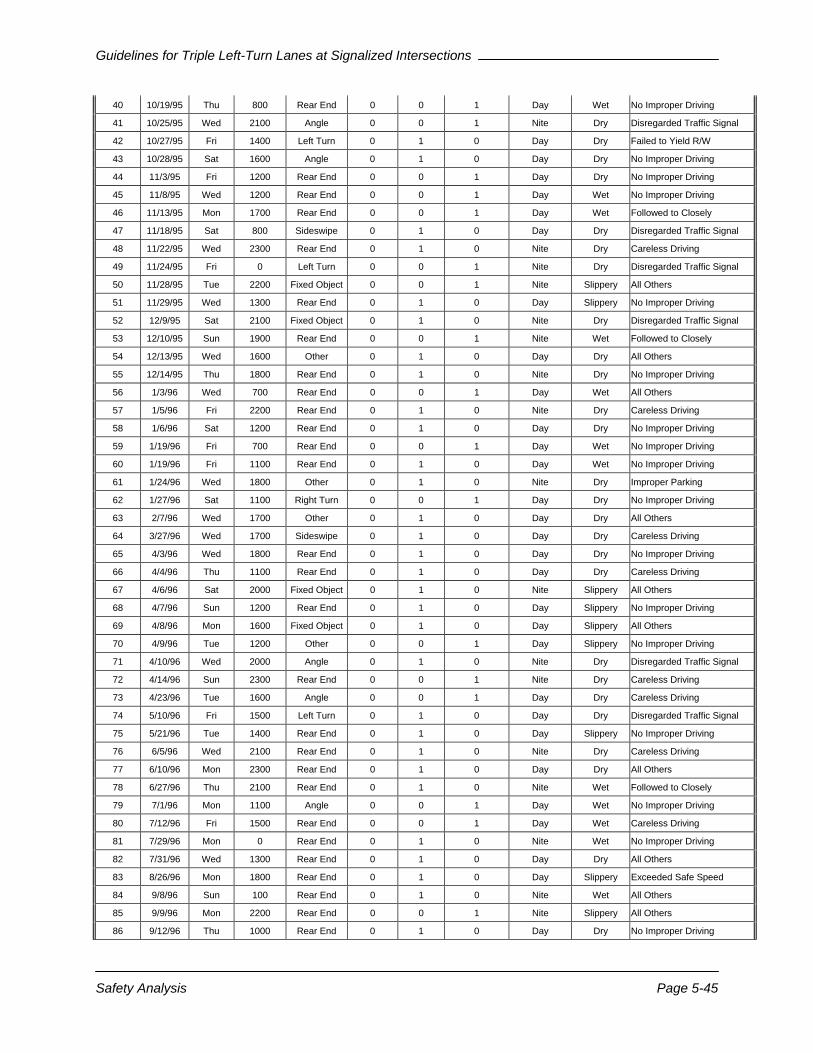
Guidelines for Triple Left-Turn Lanes at Signalized Intersections
Safety Analysis Page 5-45
40 10/19/95 Thu 800 Rear End 0 0 1 Day Wet No Improper Driving
41 10/25/95 Wed 2100 Angle 0 0 1 Nite Dry Disregarded Traffic Signal
42 10/27/95 Fri 1400 Left Turn 0 1 0 Day Dry Failed to Yield R/W
43 10/28/95 Sat 1600 Angle 0 1 0 Day Dry No Improper Driving
44 11/3/95 Fri 1200 Rear End 0 0 1 Day Dry No Improper Driving
45 11/8/95 Wed 1200 Rear End 0 0 1 Day Wet No Improper Driving
46 11/13/95 Mon 1700 Rear End 0 0 1 Day Wet Followed to Closely
47 11/18/95 Sat 800 Sideswipe 0 1 0 Day Dry Disregarded Traffic Signal
48 11/22/95 Wed 2300 Rear End 0 1 0 Nite Dry Careless Driving
49 11/24/95 Fri 0 Left Turn 0 0 1 Nite Dry Disregarded Traffic Signal
50 11/28/95 Tue 2200 Fixed Object 0 0 1 Nite Slippery All Others
51 11/29/95 Wed 1300 Rear End 0 1 0 Day Slippery No Improper Driving
52 12/9/95 Sat 2100 Fixed Object 0 1 0 Nite Dry Disregarded Traffic Signal
53 12/10/95 Sun 1900 Rear End 0 0 1 Nite Wet Followed to Closely
54 12/13/95 Wed 1600 Other 0 1 0 Day Dry All Others
55 12/14/95 Thu 1800 Rear End 0 1 0 Nite Dry No Improper Driving
56 1/3/96 Wed 700 Rear End 0 0 1 Day Wet All Others
57 1/5/96 Fri 2200 Rear End 0 1 0 Nite Dry Careless Driving
58 1/6/96 Sat 1200 Rear End 0 1 0 Day Dry No Improper Driving
59 1/19/96 Fri 700 Rear End 0 0 1 Day Wet No Improper Driving
60 1/19/96 Fri 1100 Rear End 0 1 0 Day Wet No Improper Driving
61 1/24/96 Wed 1800 Other 0 1 0 Nite Dry Improper Parking
62 1/27/96 Sat 1100 Right Turn 0 0 1 Day Dry No Improper Driving
63 2/7/96 Wed 1700 Other 0 1 0 Day Dry All Others
64 3/27/96 Wed 1700 Sideswipe 0 1 0 Day Dry Careless Driving
65 4/3/96 Wed 1800 Rear End 0 1 0 Day Dry No Improper Driving
66 4/4/96 Thu 1100 Rear End 0 1 0 Day Dry Careless Driving
67 4/6/96 Sat 2000 Fixed Object 0 1 0 Nite Slippery All Others
68 4/7/96 Sun 1200 Rear End 0 1 0 Day Slippery No Improper Driving
69 4/8/96 Mon 1600 Fixed Object 0 1 0 Day Slippery All Others
70 4/9/96 Tue 1200 Other 0 0 1 Day Slippery No Improper Driving
71 4/10/96 Wed 2000 Angle 0 1 0 Nite Dry Disregarded Traffic Signal
72 4/14/96 Sun 2300 Rear End 0 0 1 Nite Dry Careless Driving
73 4/23/96 Tue 1600 Angle 0 0 1 Day Dry Careless Driving
74 5/10/96 Fri 1500 Left Turn 0 1 0 Day Dry Disregarded Traffic Signal
75 5/21/96 Tue 1400 Rear End 0 1 0 Day Slippery No Improper Driving
76 6/5/96 Wed 2100 Rear End 0 1 0 Nite Dry Careless Driving
77 6/10/96 Mon 2300 Rear End 0 1 0 Day Dry All Others
78 6/27/96 Thu 2100 Rear End 0 1 0 Nite Wet Followed to Closely
79 7/1/96 Mon 1100 Angle 0 0 1 Day Wet No Improper Driving
80 7/12/96 Fri 1500 Rear End 0 0 1 Day Wet Careless Driving
81 7/29/96 Mon 0 Rear End 0 1 0 Nite Wet No Improper Driving
82 7/31/96 Wed 1300 Rear End 0 1 0 Day Dry All Others
83 8/26/96 Mon 1800 Rear End 0 1 0 Day Slippery Exceeded Safe Speed
84 9/8/96 Sun 100 Rear End 0 1 0 Nite Wet All Others
85 9/9/96 Mon 2200 Rear End 0 0 1 Nite Slippery All Others
86 9/12/96 Thu 1000 Rear End 0 1 0 Day Dry No Improper Driving
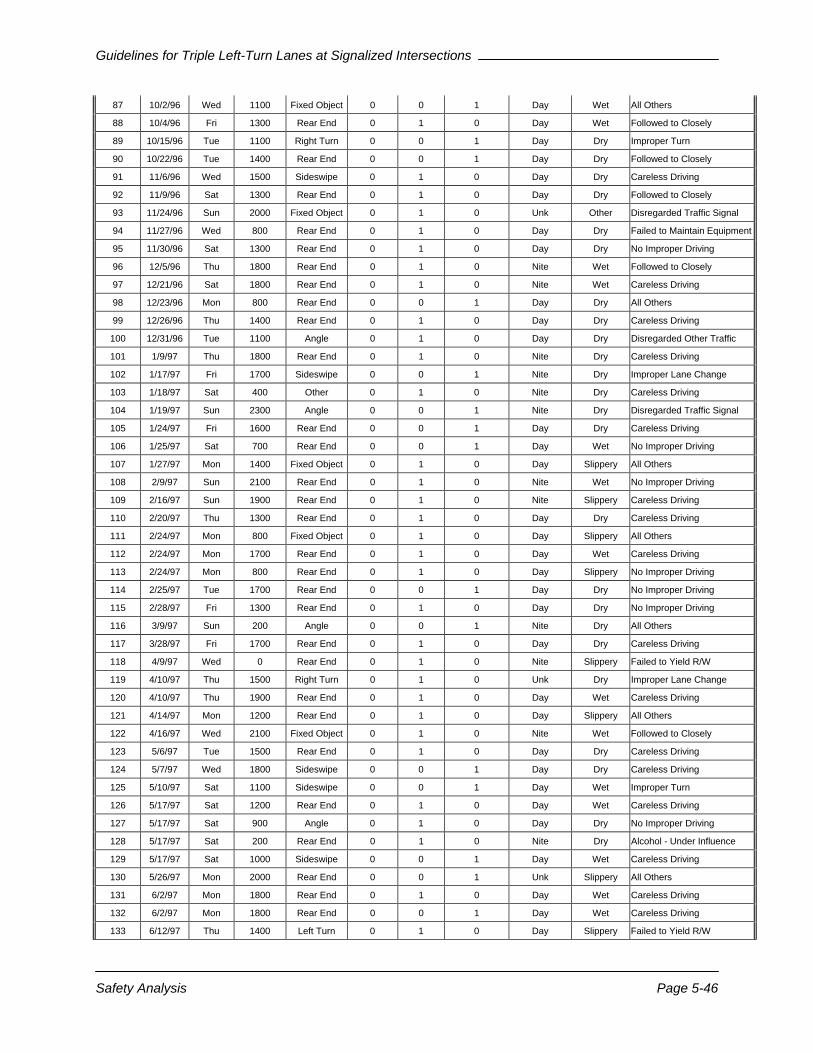
Guidelines for Triple Left-Turn Lanes at Signalized Intersections
Safety Analysis Page 5-46
87 10/2/96 Wed 1100 Fixed Object 0 0 1 Day Wet All Others
88 10/4/96 Fri 1300 Rear End 0 1 0 Day Wet Followed to Closely
89 10/15/96 Tue 1100 Right Turn 0 0 1 Day Dry Improper Turn
90 10/22/96 Tue 1400 Rear End 0 0 1 Day Dry Followed to Closely
91 11/6/96 Wed 1500 Sideswipe 0 1 0 Day Dry Careless Driving
92 11/9/96 Sat 1300 Rear End 0 1 0 Day Dry Followed to Closely
93 11/24/96 Sun 2000 Fixed Object 0 1 0 Unk Other Disregarded Traffic Signal
94 11/27/96 Wed 800 Rear End 0 1 0 Day Dry Failed to Maintain Equipment
95 11/30/96 Sat 1300 Rear End 0 1 0 Day Dry No Improper Driving
96 12/5/96 Thu 1800 Rear End 0 1 0 Nite Wet Followed to Closely
97 12/21/96 Sat 1800 Rear End 0 1 0 Nite Wet Careless Driving
98 12/23/96 Mon 800 Rear End 0 0 1 Day Dry All Others
99 12/26/96 Thu 1400 Rear End 0 1 0 Day Dry Careless Driving
100 12/31/96 Tue 1100 Angle 0 1 0 Day Dry Disregarded Other Traffic
101 1/9/97 Thu 1800 Rear End 0 1 0 Nite Dry Careless Driving
102 1/17/97 Fri 1700 Sideswipe 0 0 1 Nite Dry Improper Lane Change
103 1/18/97 Sat 400 Other 0 1 0 Nite Dry Careless Driving
104 1/19/97 Sun 2300 Angle 0 0 1 Nite Dry Disregarded Traffic Signal
105 1/24/97 Fri 1600 Rear End 0 0 1 Day Dry Careless Driving
106 1/25/97 Sat 700 Rear End 0 0 1 Day Wet No Improper Driving
107 1/27/97 Mon 1400 Fixed Object 0 1 0 Day Slippery All Others
108 2/9/97 Sun 2100 Rear End 0 1 0 Nite Wet No Improper Driving
109 2/16/97 Sun 1900 Rear End 0 1 0 Nite Slippery Careless Driving
110 2/20/97 Thu 1300 Rear End 0 1 0 Day Dry Careless Driving
111 2/24/97 Mon 800 Fixed Object 0 1 0 Day Slippery All Others
112 2/24/97 Mon 1700 Rear End 0 1 0 Day Wet Careless Driving
113 2/24/97 Mon 800 Rear End 0 1 0 Day Slippery No Improper Driving
114 2/25/97 Tue 1700 Rear End 0 0 1 Day Dry No Improper Driving
115 2/28/97 Fri 1300 Rear End 0 1 0 Day Dry No Improper Driving
116 3/9/97 Sun 200 Angle 0 0 1 Nite Dry All Others
117 3/28/97 Fri 1700 Rear End 0 1 0 Day Dry Careless Driving
118 4/9/97 Wed 0 Rear End 0 1 0 Nite Slippery Failed to Yield R/W
119 4/10/97 Thu 1500 Right Turn 0 1 0 Unk Dry Improper Lane Change
120 4/10/97 Thu 1900 Rear End 0 1 0 Day Wet Careless Driving
121 4/14/97 Mon 1200 Rear End 0 1 0 Day Slippery All Others
122 4/16/97 Wed 2100 Fixed Object 0 1 0 Nite Wet Followed to Closely
123 5/6/97 Tue 1500 Rear End 0 1 0 Day Dry Careless Driving
124 5/7/97 Wed 1800 Sideswipe 0 0 1 Day Dry Careless Driving
125 5/10/97 Sat 1100 Sideswipe 0 0 1 Day Wet Improper Turn
126 5/17/97 Sat 1200 Rear End 0 1 0 Day Wet Careless Driving
127 5/17/97 Sat 900 Angle 0 1 0 Day Dry No Improper Driving
128 5/17/97 Sat 200 Rear End 0 1 0 Nite Dry Alcohol - Under Influence
129 5/17/97 Sat 1000 Sideswipe 0 0 1 Day Wet Careless Driving
130 5/26/97 Mon 2000 Rear End 0 0 1 Unk Slippery All Others
131 6/2/97 Mon 1800 Rear End 0 1 0 Day Wet Careless Driving
132 6/2/97 Mon 1800 Rear End 0 0 1 Day Wet Careless Driving
133 6/12/97 Thu 1400 Left Turn 0 1 0 Day Slippery Failed to Yield R/W
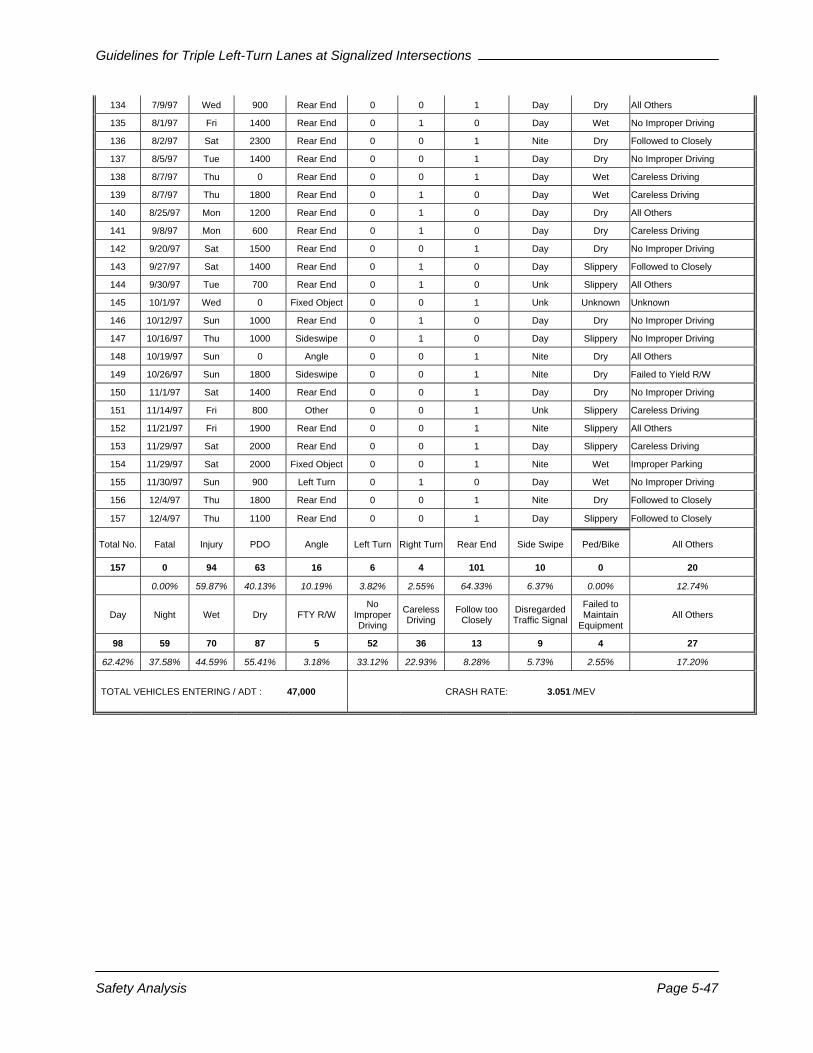
Guidelines for Triple Left-Turn Lanes at Signalized Intersections
Safety Analysis Page 5-47
134 7/9/97 Wed 900 Rear End 0 0 1 Day Dry All Others
135 8/1/97 Fri 1400 Rear End 0 1 0 Day Wet No Improper Driving
136 8/2/97 Sat 2300 Rear End 0 0 1 Nite Dry Followed to Closely
137 8/5/97 Tue 1400 Rear End 0 0 1 Day Dry No Improper Driving
138 8/7/97 Thu 0 Rear End 0 0 1 Day Wet Careless Driving
139 8/7/97 Thu 1800 Rear End 0 1 0 Day Wet Careless Driving
140 8/25/97 Mon 1200 Rear End 0 1 0 Day Dry All Others
141 9/8/97 Mon 600 Rear End 0 1 0 Day Dry Careless Driving
142 9/20/97 Sat 1500 Rear End 0 0 1 Day Dry No Improper Driving
143 9/27/97 Sat 1400 Rear End 0 1 0 Day Slippery Followed to Closely
144 9/30/97 Tue 700 Rear End 0 1 0 Unk Slippery All Others
145 10/1/97 Wed 0 Fixed Object 0 0 1 Unk Unknown Unknown
146 10/12/97 Sun 1000 Rear End 0 1 0 Day Dry No Improper Driving
147 10/16/97 Thu 1000 Sideswipe 0 1 0 Day Slippery No Improper Driving
148 10/19/97 Sun 0 Angle 0 0 1 Nite Dry All Others
149 10/26/97 Sun 1800 Sideswipe 0 0 1 Nite Dry Failed to Yield R/W
150 11/1/97 Sat 1400 Rear End 0 0 1 Day Dry No Improper Driving
151 11/14/97 Fri 800 Other 0 0 1 Unk Slippery Careless Driving
152 11/21/97 Fri 1900 Rear End 0 0 1 Nite Slippery All Others
153 11/29/97 Sat 2000 Rear End 0 0 1 Day Slippery Careless Driving
154 11/29/97 Sat 2000 Fixed Object 0 0 1 Nite Wet Improper Parking
155 11/30/97 Sun 900 Left Turn 0 1 0 Day Wet No Improper Driving
156 12/4/97 Thu 1800 Rear End 0 0 1 Nite Dry Followed to Closely
157 12/4/97 Thu 1100 Rear End 0 0 1 Day Slippery Followed to Closely
Total No. Fatal Injury PDO Angle Left Turn Right Turn Rear End Side Swipe Ped/Bike All Others
157 0 94 63 16 6 4 101 10 0 20
0.00% 59.87% 40.13% 10.19% 3.82% 2.55% 64.33% 6.37% 0.00% 12.74%
Day Night Wet Dry FTY R/W No
Improper Driving
Careless Driving
Follow too Closely
Disregarded Traffic Signal
Failed to Maintain
Equipment All Others
98 59 70 87 5 52 36 13 9 4 27
62.42% 37.58% 44.59% 55.41% 3.18% 33.12% 22.93% 8.28% 5.73% 2.55% 17.20%
TOTAL VEHICLES ENTERING / ADT : 47,000 CRASH RATE: 3.051 /MEV

Guidelines for Triple Left-Turn Lanes at Signalized Intersections
Safety Analysis Page 5-48
5.1.11 SR 821 (Turnpike) and SR 870 (Commercial Boulevard) Commercial Boulevard is a six-lane roadway with configuration similar to that of the Sunrise Boulevard. The eastbound exclusive double left-turn provides with an access to the Florida Turnpike. Figure 5-31 shows a picture of the triple left-turn approach. As can be seen from the condition diagram in Figure 5-32, Florida Turnpike junction is linked to Commercial Boulevard through a “T” signalized intersection at an angle of approximately 80° and located in a suburban area. The intersection has been found to operate at an unacceptable level of service during the morning peak hours. Downstream conditions were found to exert great impact on the intersection performance as backed up queues interfered with left-turning vehicles causing these to weave as back up vehicles piled up all the way down to the triple left-turn approach. Table 5-11 summaries crashes occurred at the intersection during the 1995-1997 period. A total of 78 crashes were reported over the period. As can be seen from the corresponding collision diagram shown in Figure 5-33, eighty five percent of the crashes were related to the rear end type, with about 65% of them resulting in injuries. Only one sideswipe and one angle crashes were attributable to the triple left turn. Eighty five percent of the crashes occurred during daytime peak hours. Crashes resulting in injuries accounted for 49% of the total crashes, which translates to medium severity, not as critical as that on Sunrise Boulevard.
Figure 5-31. SR 821 (Turnpike Ramp Terminal) and SR 870 (Commercial Boulevard)
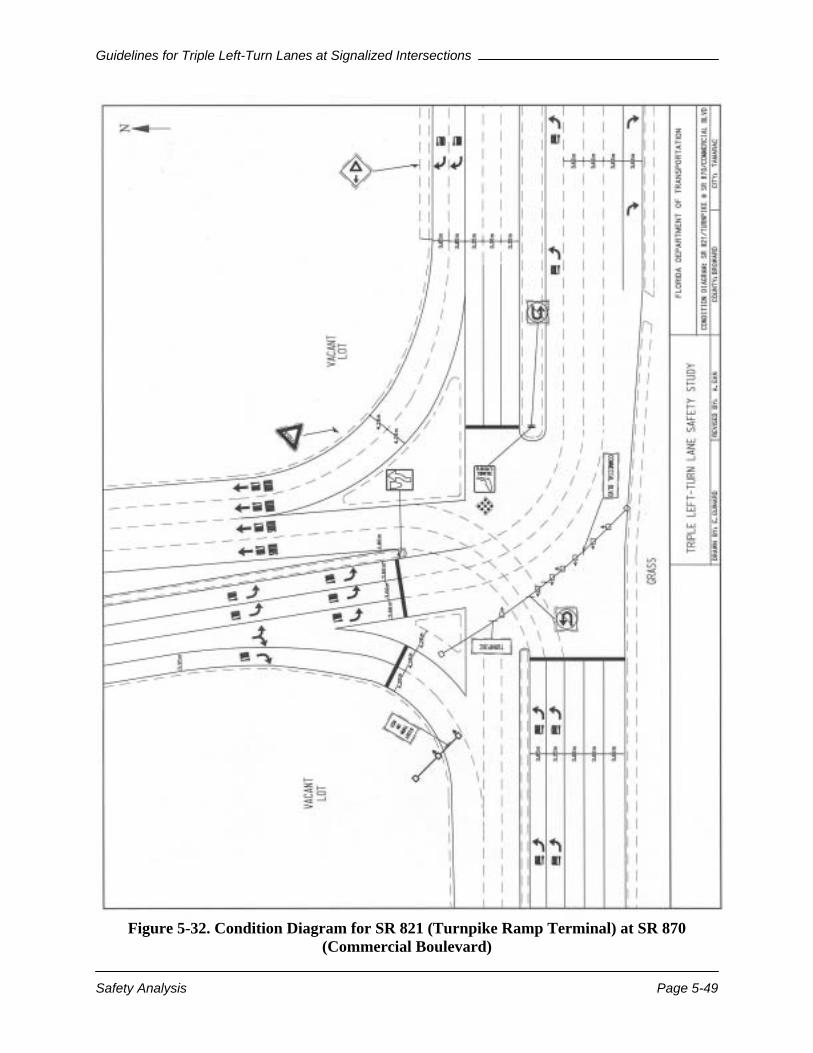
Guidelines for Triple Left-Turn Lanes at Signalized Intersections
Safety Analysis Page 5-49
Figure 5-32. Condition Diagram for SR 821 (Turnpike Ramp Terminal) at SR 870
(Commercial Boulevard)

Guidelines for Triple Left-Turn Lanes at Signalized Intersections
Safety Analysis Page 5-50
Figure 5-33. Collision Diagram for SR 821 (Turnpike Ramp Terminal) at SR 870 (Commercial Boulevard)
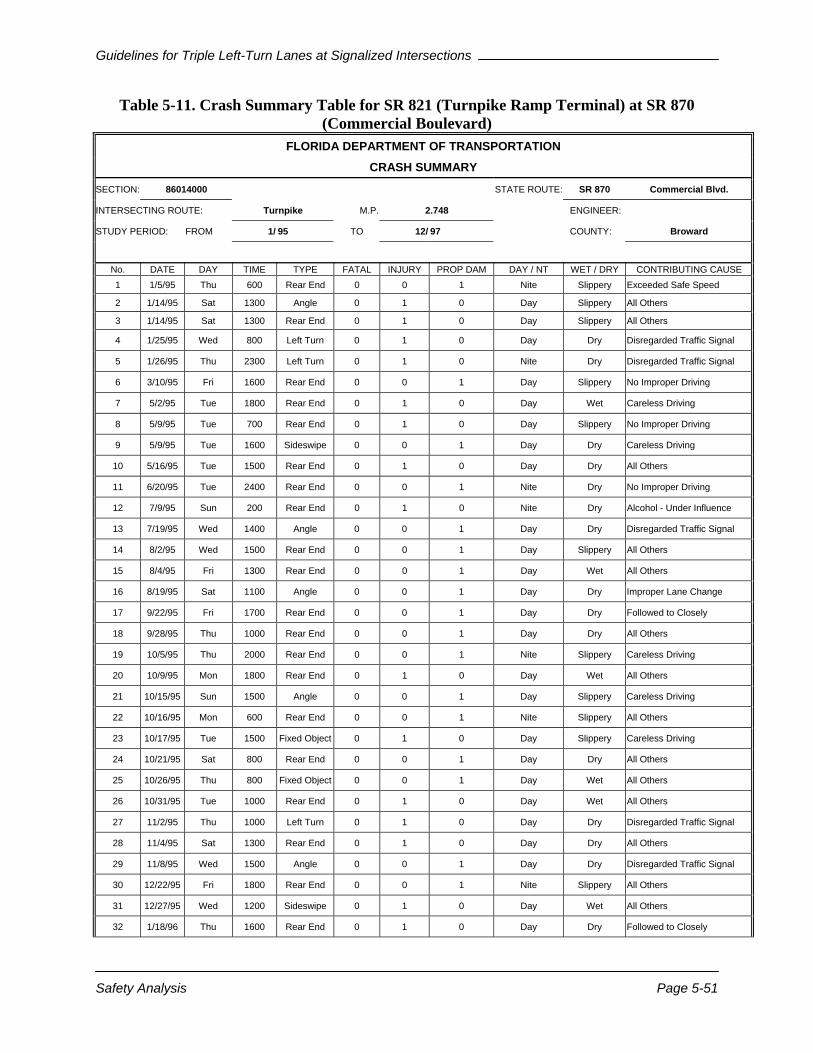
Guidelines for Triple Left-Turn Lanes at Signalized Intersections
Safety Analysis Page 5-51
Table 5-11. Crash Summary Table for SR 821 (Turnpike Ramp Terminal) at SR 870 (Commercial Boulevard)
FLORIDA DEPARTMENT OF TRANSPORTATION CRASH SUMMARY
SECTION: 86014000 STATE ROUTE: SR 870 Commercial Blvd.
INTERSECTING ROUTE: Turnpike M.P. 2.748 ENGINEER:
STUDY PERIOD: FROM 1/ 95 TO 12/ 97 COUNTY: Broward
No. DATE DAY TIME TYPE FATAL INJURY PROP DAM DAY / NT WET / DRY CONTRIBUTING CAUSE 1 1/5/95 Thu 600 Rear End 0 0 1 Nite Slippery Exceeded Safe Speed
2 1/14/95 Sat 1300 Angle 0 1 0 Day Slippery All Others
3 1/14/95 Sat 1300 Rear End 0 1 0 Day Slippery All Others
4 1/25/95 Wed 800 Left Turn 0 1 0 Day Dry Disregarded Traffic Signal
5 1/26/95 Thu 2300 Left Turn 0 1 0 Nite Dry Disregarded Traffic Signal
6 3/10/95 Fri 1600 Rear End 0 0 1 Day Slippery No Improper Driving
7 5/2/95 Tue 1800 Rear End 0 1 0 Day Wet Careless Driving
8 5/9/95 Tue 700 Rear End 0 1 0 Day Slippery No Improper Driving
9 5/9/95 Tue 1600 Sideswipe 0 0 1 Day Dry Careless Driving
10 5/16/95 Tue 1500 Rear End 0 1 0 Day Dry All Others
11 6/20/95 Tue 2400 Rear End 0 0 1 Nite Dry No Improper Driving
12 7/9/95 Sun 200 Rear End 0 1 0 Nite Dry Alcohol - Under Influence
13 7/19/95 Wed 1400 Angle 0 0 1 Day Dry Disregarded Traffic Signal
14 8/2/95 Wed 1500 Rear End 0 0 1 Day Slippery All Others
15 8/4/95 Fri 1300 Rear End 0 0 1 Day Wet All Others
16 8/19/95 Sat 1100 Angle 0 0 1 Day Dry Improper Lane Change
17 9/22/95 Fri 1700 Rear End 0 0 1 Day Dry Followed to Closely
18 9/28/95 Thu 1000 Rear End 0 0 1 Day Dry All Others
19 10/5/95 Thu 2000 Rear End 0 0 1 Nite Slippery Careless Driving
20 10/9/95 Mon 1800 Rear End 0 1 0 Day Wet All Others
21 10/15/95 Sun 1500 Angle 0 0 1 Day Slippery Careless Driving
22 10/16/95 Mon 600 Rear End 0 0 1 Nite Slippery All Others
23 10/17/95 Tue 1500 Fixed Object 0 1 0 Day Slippery Careless Driving
24 10/21/95 Sat 800 Rear End 0 0 1 Day Dry All Others
25 10/26/95 Thu 800 Fixed Object 0 0 1 Day Wet All Others
26 10/31/95 Tue 1000 Rear End 0 1 0 Day Wet All Others
27 11/2/95 Thu 1000 Left Turn 0 1 0 Day Dry Disregarded Traffic Signal
28 11/4/95 Sat 1300 Rear End 0 1 0 Day Dry All Others
29 11/8/95 Wed 1500 Angle 0 0 1 Day Dry Disregarded Traffic Signal
30 12/22/95 Fri 1800 Rear End 0 0 1 Nite Slippery All Others
31 12/27/95 Wed 1200 Sideswipe 0 1 0 Day Wet All Others
32 1/18/96 Thu 1600 Rear End 0 1 0 Day Dry Followed to Closely
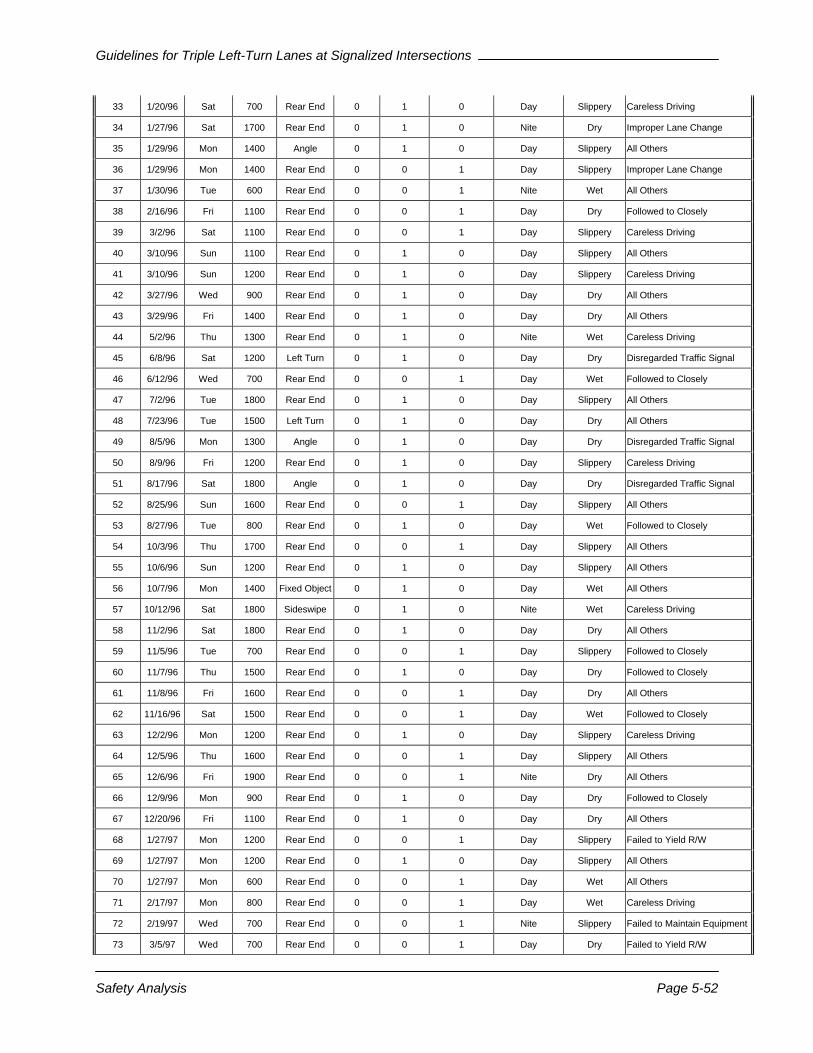
Guidelines for Triple Left-Turn Lanes at Signalized Intersections
Safety Analysis Page 5-52
33 1/20/96 Sat 700 Rear End 0 1 0 Day Slippery Careless Driving
34 1/27/96 Sat 1700 Rear End 0 1 0 Nite Dry Improper Lane Change
35 1/29/96 Mon 1400 Angle 0 1 0 Day Slippery All Others
36 1/29/96 Mon 1400 Rear End 0 0 1 Day Slippery Improper Lane Change
37 1/30/96 Tue 600 Rear End 0 0 1 Nite Wet All Others
38 2/16/96 Fri 1100 Rear End 0 0 1 Day Dry Followed to Closely
39 3/2/96 Sat 1100 Rear End 0 0 1 Day Slippery Careless Driving
40 3/10/96 Sun 1100 Rear End 0 1 0 Day Slippery All Others
41 3/10/96 Sun 1200 Rear End 0 1 0 Day Slippery Careless Driving
42 3/27/96 Wed 900 Rear End 0 1 0 Day Dry All Others
43 3/29/96 Fri 1400 Rear End 0 1 0 Day Dry All Others
44 5/2/96 Thu 1300 Rear End 0 1 0 Nite Wet Careless Driving
45 6/8/96 Sat 1200 Left Turn 0 1 0 Day Dry Disregarded Traffic Signal
46 6/12/96 Wed 700 Rear End 0 0 1 Day Wet Followed to Closely
47 7/2/96 Tue 1800 Rear End 0 1 0 Day Slippery All Others
48 7/23/96 Tue 1500 Left Turn 0 1 0 Day Dry All Others
49 8/5/96 Mon 1300 Angle 0 1 0 Day Dry Disregarded Traffic Signal
50 8/9/96 Fri 1200 Rear End 0 1 0 Day Slippery Careless Driving
51 8/17/96 Sat 1800 Angle 0 1 0 Day Dry Disregarded Traffic Signal
52 8/25/96 Sun 1600 Rear End 0 0 1 Day Slippery All Others
53 8/27/96 Tue 800 Rear End 0 1 0 Day Wet Followed to Closely
54 10/3/96 Thu 1700 Rear End 0 0 1 Day Slippery All Others
55 10/6/96 Sun 1200 Rear End 0 1 0 Day Slippery All Others
56 10/7/96 Mon 1400 Fixed Object 0 1 0 Day Wet All Others
57 10/12/96 Sat 1800 Sideswipe 0 1 0 Nite Wet Careless Driving
58 11/2/96 Sat 1800 Rear End 0 1 0 Day Dry All Others
59 11/5/96 Tue 700 Rear End 0 0 1 Day Slippery Followed to Closely
60 11/7/96 Thu 1500 Rear End 0 1 0 Day Dry Followed to Closely
61 11/8/96 Fri 1600 Rear End 0 0 1 Day Dry All Others
62 11/16/96 Sat 1500 Rear End 0 0 1 Day Wet Followed to Closely
63 12/2/96 Mon 1200 Rear End 0 1 0 Day Slippery Careless Driving
64 12/5/96 Thu 1600 Rear End 0 0 1 Day Slippery All Others
65 12/6/96 Fri 1900 Rear End 0 0 1 Nite Dry All Others
66 12/9/96 Mon 900 Rear End 0 1 0 Day Dry Followed to Closely
67 12/20/96 Fri 1100 Rear End 0 1 0 Day Dry All Others
68 1/27/97 Mon 1200 Rear End 0 0 1 Day Slippery Failed to Yield R/W
69 1/27/97 Mon 1200 Rear End 0 1 0 Day Slippery All Others
70 1/27/97 Mon 600 Rear End 0 0 1 Day Wet All Others
71 2/17/97 Mon 800 Rear End 0 0 1 Day Wet Careless Driving
72 2/19/97 Wed 700 Rear End 0 0 1 Nite Slippery Failed to Maintain Equipment
73 3/5/97 Wed 700 Rear End 0 0 1 Day Dry Failed to Yield R/W
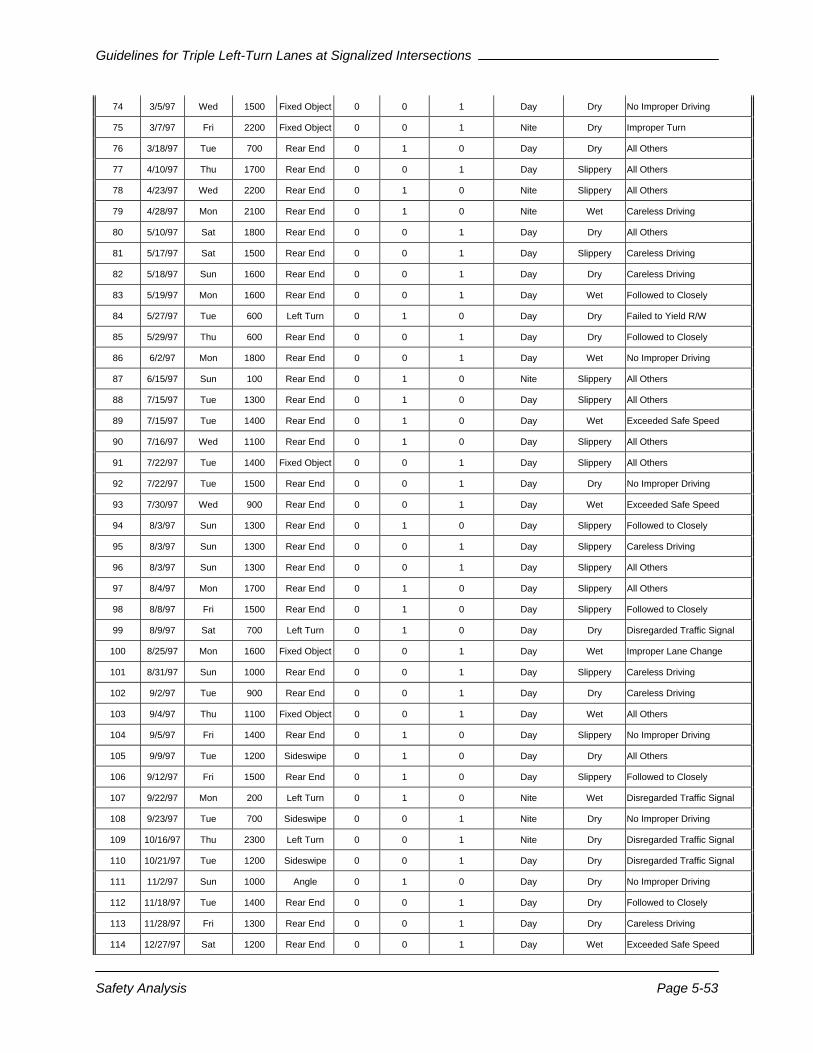
Guidelines for Triple Left-Turn Lanes at Signalized Intersections
Safety Analysis Page 5-53
74 3/5/97 Wed 1500 Fixed Object 0 0 1 Day Dry No Improper Driving
75 3/7/97 Fri 2200 Fixed Object 0 0 1 Nite Dry Improper Turn
76 3/18/97 Tue 700 Rear End 0 1 0 Day Dry All Others
77 4/10/97 Thu 1700 Rear End 0 0 1 Day Slippery All Others
78 4/23/97 Wed 2200 Rear End 0 1 0 Nite Slippery All Others
79 4/28/97 Mon 2100 Rear End 0 1 0 Nite Wet Careless Driving
80 5/10/97 Sat 1800 Rear End 0 0 1 Day Dry All Others
81 5/17/97 Sat 1500 Rear End 0 0 1 Day Slippery Careless Driving
82 5/18/97 Sun 1600 Rear End 0 0 1 Day Dry Careless Driving
83 5/19/97 Mon 1600 Rear End 0 0 1 Day Wet Followed to Closely
84 5/27/97 Tue 600 Left Turn 0 1 0 Day Dry Failed to Yield R/W
85 5/29/97 Thu 600 Rear End 0 0 1 Day Dry Followed to Closely
86 6/2/97 Mon 1800 Rear End 0 0 1 Day Wet No Improper Driving
87 6/15/97 Sun 100 Rear End 0 1 0 Nite Slippery All Others
88 7/15/97 Tue 1300 Rear End 0 1 0 Day Slippery All Others
89 7/15/97 Tue 1400 Rear End 0 1 0 Day Wet Exceeded Safe Speed
90 7/16/97 Wed 1100 Rear End 0 1 0 Day Slippery All Others
91 7/22/97 Tue 1400 Fixed Object 0 0 1 Day Slippery All Others
92 7/22/97 Tue 1500 Rear End 0 0 1 Day Dry No Improper Driving
93 7/30/97 Wed 900 Rear End 0 0 1 Day Wet Exceeded Safe Speed
94 8/3/97 Sun 1300 Rear End 0 1 0 Day Slippery Followed to Closely
95 8/3/97 Sun 1300 Rear End 0 0 1 Day Slippery Careless Driving
96 8/3/97 Sun 1300 Rear End 0 0 1 Day Slippery All Others
97 8/4/97 Mon 1700 Rear End 0 1 0 Day Slippery All Others
98 8/8/97 Fri 1500 Rear End 0 1 0 Day Slippery Followed to Closely
99 8/9/97 Sat 700 Left Turn 0 1 0 Day Dry Disregarded Traffic Signal
100 8/25/97 Mon 1600 Fixed Object 0 0 1 Day Wet Improper Lane Change
101 8/31/97 Sun 1000 Rear End 0 0 1 Day Slippery Careless Driving
102 9/2/97 Tue 900 Rear End 0 0 1 Day Dry Careless Driving
103 9/4/97 Thu 1100 Fixed Object 0 0 1 Day Wet All Others
104 9/5/97 Fri 1400 Rear End 0 1 0 Day Slippery No Improper Driving
105 9/9/97 Tue 1200 Sideswipe 0 1 0 Day Dry All Others
106 9/12/97 Fri 1500 Rear End 0 1 0 Day Slippery Followed to Closely
107 9/22/97 Mon 200 Left Turn 0 1 0 Nite Wet Disregarded Traffic Signal
108 9/23/97 Tue 700 Sideswipe 0 0 1 Nite Dry No Improper Driving
109 10/16/97 Thu 2300 Left Turn 0 0 1 Nite Dry Disregarded Traffic Signal
110 10/21/97 Tue 1200 Sideswipe 0 0 1 Day Dry Disregarded Traffic Signal
111 11/2/97 Sun 1000 Angle 0 1 0 Day Dry No Improper Driving
112 11/18/97 Tue 1400 Rear End 0 0 1 Day Dry Followed to Closely
113 11/28/97 Fri 1300 Rear End 0 0 1 Day Dry Careless Driving
114 12/27/97 Sat 1200 Rear End 0 0 1 Day Wet Exceeded Safe Speed
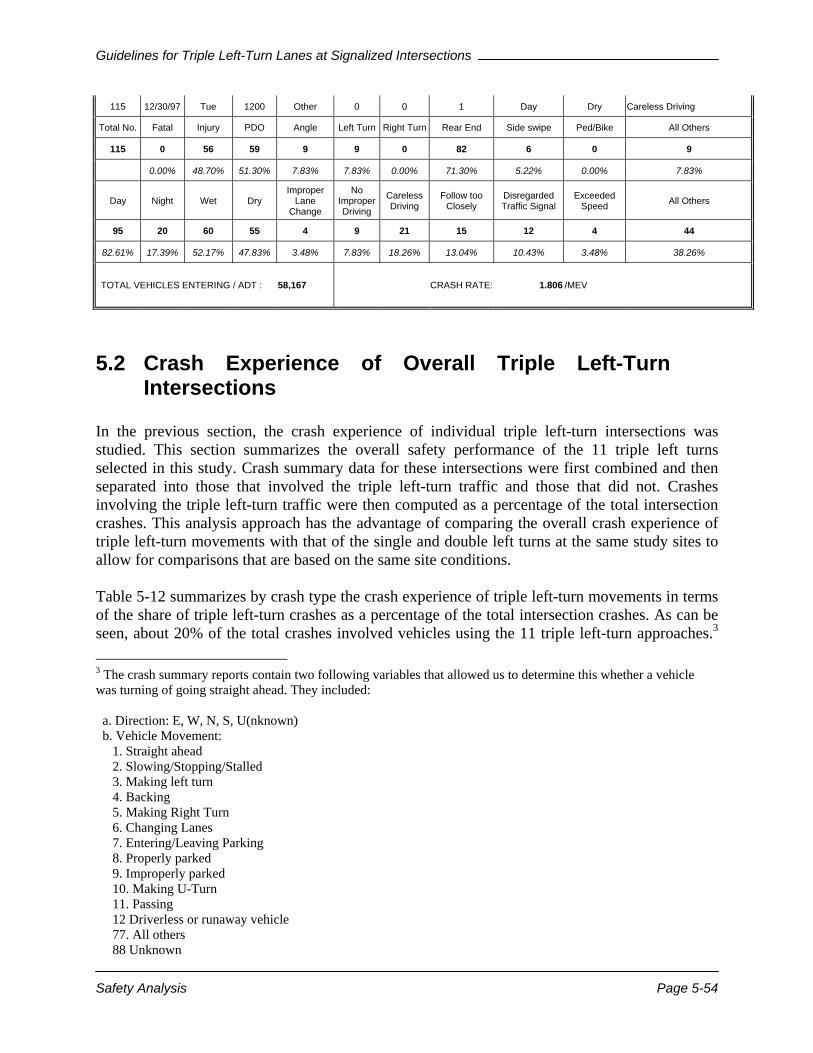
Guidelines for Triple Left-Turn Lanes at Signalized Intersections
Safety Analysis Page 5-54
115 12/30/97 Tue 1200 Other 0 0 1 Day Dry Careless Driving
Total No. Fatal Injury PDO Angle Left Turn Right Turn Rear End Side swipe Ped/Bike All Others
115 0 56 59 9 9 0 82 6 0 9
0.00% 48.70% 51.30% 7.83% 7.83% 0.00% 71.30% 5.22% 0.00% 7.83%
Day Night Wet Dry Improper
Lane Change
No Improper Driving
Careless Driving
Follow too Closely
Disregarded Traffic Signal
Exceeded Speed All Others
95 20 60 55 4 9 21 15 12 4 44
82.61% 17.39% 52.17% 47.83% 3.48% 7.83% 18.26% 13.04% 10.43% 3.48% 38.26%
TOTAL VEHICLES ENTERING / ADT : 58,167 CRASH RATE: 1.806 /MEV
5.2 Crash Experience of Overall Triple Left-Turn Intersections
In the previous section, the crash experience of individual triple left-turn intersections was studied. This section summarizes the overall safety performance of the 11 triple left turns selected in this study. Crash summary data for these intersections were first combined and then separated into those that involved the triple left-turn traffic and those that did not. Crashes involving the triple left-turn traffic were then computed as a percentage of the total intersection crashes. This analysis approach has the advantage of comparing the overall crash experience of triple left-turn movements with that of the single and double left turns at the same study sites to allow for comparisons that are based on the same site conditions. Table 5-12 summarizes by crash type the crash experience of triple left-turn movements in terms of the share of triple left-turn crashes as a percentage of the total intersection crashes. As can be seen, about 20% of the total crashes involved vehicles using the 11 triple left-turn approaches.3 3 The crash summary reports contain two following variables that allowed us to determine this whether a vehicle was turning of going straight ahead. They included: a. Direction: E, W, N, S, U(nknown) b. Vehicle Movement: 1. Straight ahead 2. Slowing/Stopping/Stalled 3. Making left turn 4. Backing 5. Making Right Turn 6. Changing Lanes 7. Entering/Leaving Parking 8. Properly parked 9. Improperly parked 10. Making U-Turn 11. Passing 12 Driverless or runaway vehicle 77. All others 88 Unknown
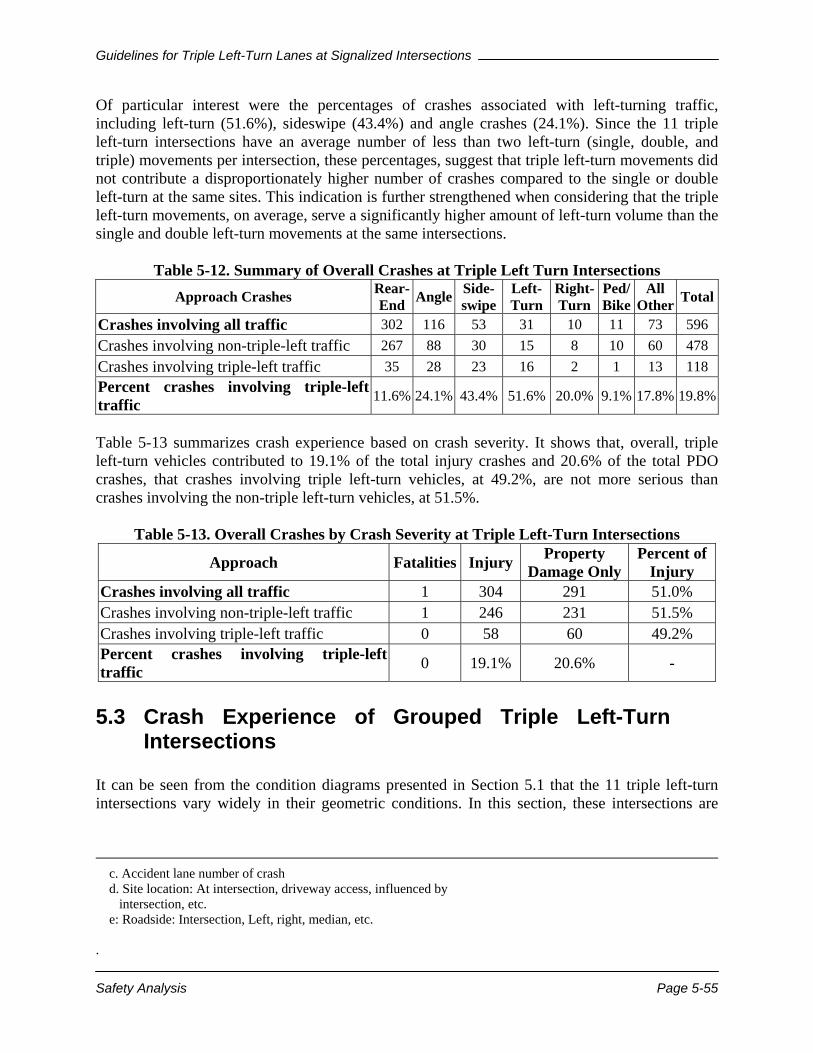
Guidelines for Triple Left-Turn Lanes at Signalized Intersections
Safety Analysis Page 5-55
Of particular interest were the percentages of crashes associated with left-turning traffic, including left-turn (51.6%), sideswipe (43.4%) and angle crashes (24.1%). Since the 11 triple left-turn intersections have an average number of less than two left-turn (single, double, and triple) movements per intersection, these percentages, suggest that triple left-turn movements did not contribute a disproportionately higher number of crashes compared to the single or double left-turn at the same sites. This indication is further strengthened when considering that the triple left-turn movements, on average, serve a significantly higher amount of left-turn volume than the single and double left-turn movements at the same intersections.
Table 5-12. Summary of Overall Crashes at Triple Left Turn Intersections Approach Crashes Rear-
End Angle Side-swipe
Left-Turn
Right-Turn
Ped/Bike
All Other Total
Crashes involving all traffic 302 116 53 31 10 11 73 596 Crashes involving non-triple-left traffic 267 88 30 15 8 10 60 478 Crashes involving triple-left traffic 35 28 23 16 2 1 13 118 Percent crashes involving triple-left traffic 11.6% 24.1% 43.4% 51.6% 20.0% 9.1% 17.8% 19.8%
Table 5-13 summarizes crash experience based on crash severity. It shows that, overall, triple left-turn vehicles contributed to 19.1% of the total injury crashes and 20.6% of the total PDO crashes, that crashes involving triple left-turn vehicles, at 49.2%, are not more serious than crashes involving the non-triple left-turn vehicles, at 51.5%.
Table 5-13. Overall Crashes by Crash Severity at Triple Left-Turn Intersections
Approach Fatalities Injury Property Damage Only
Percent of Injury
Crashes involving all traffic 1 304 291 51.0% Crashes involving non-triple-left traffic 1 246 231 51.5% Crashes involving triple-left traffic 0 58 60 49.2% Percent crashes involving triple-left traffic 0 19.1% 20.6% -
5.3 Crash Experience of Grouped Triple Left-Turn Intersections
It can be seen from the condition diagrams presented in Section 5.1 that the 11 triple left-turn intersections vary widely in their geometric conditions. In this section, these intersections are
c. Accident lane number of crash d. Site location: At intersection, driveway access, influenced by intersection, etc. e: Roadside: Intersection, Left, right, median, etc. .
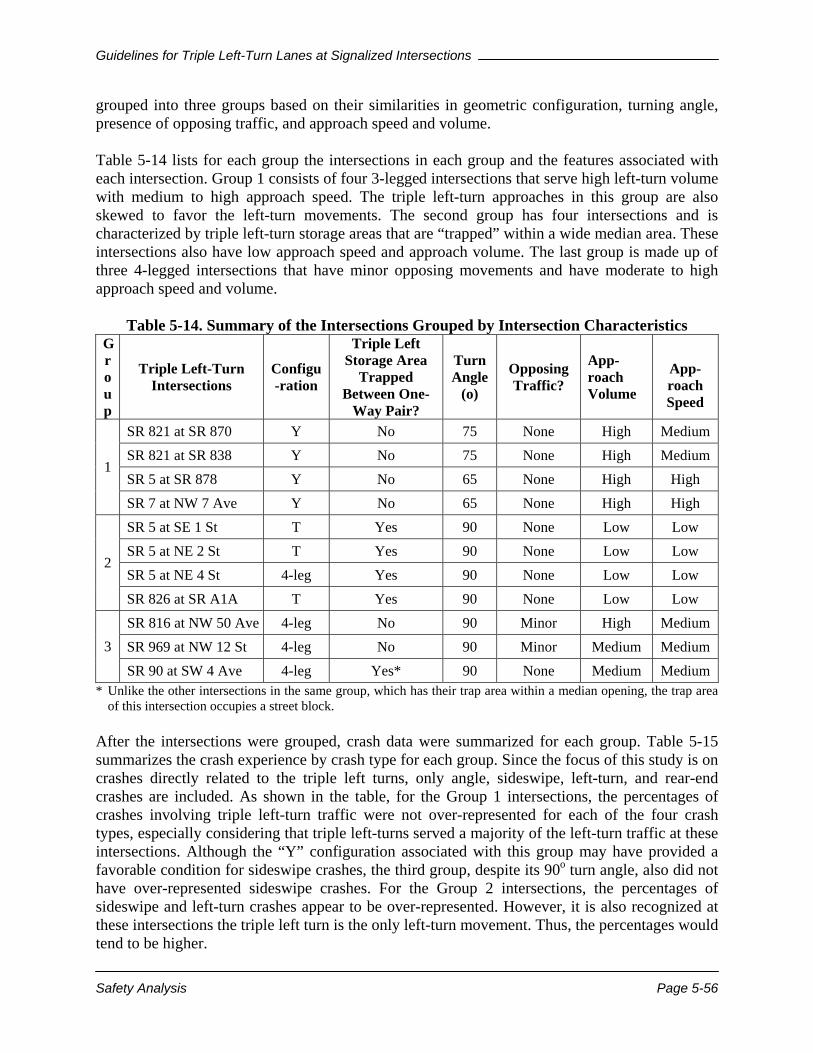
Guidelines for Triple Left-Turn Lanes at Signalized Intersections
Safety Analysis Page 5-56
grouped into three groups based on their similarities in geometric configuration, turning angle, presence of opposing traffic, and approach speed and volume. Table 5-14 lists for each group the intersections in each group and the features associated with each intersection. Group 1 consists of four 3-legged intersections that serve high left-turn volume with medium to high approach speed. The triple left-turn approaches in this group are also skewed to favor the left-turn movements. The second group has four intersections and is characterized by triple left-turn storage areas that are “trapped” within a wide median area. These intersections also have low approach speed and approach volume. The last group is made up of three 4-legged intersections that have minor opposing movements and have moderate to high approach speed and volume.
Table 5-14. Summary of the Intersections Grouped by Intersection Characteristics Group
Triple Left-Turn Intersections
Configu-ration
Triple Left Storage Area
Trapped Between One-
Way Pair?
Turn Angle
(o)
Opposing Traffic?
App-roach Volume
App-roach Speed
SR 821 at SR 870 Y No 75 None High Medium SR 821 at SR 838 Y No 75 None High Medium SR 5 at SR 878 Y No 65 None High High
1
SR 7 at NW 7 Ave Y No 65 None High High SR 5 at SE 1 St T Yes 90 None Low Low SR 5 at NE 2 St T Yes 90 None Low Low SR 5 at NE 4 St 4-leg Yes 90 None Low Low
2
SR 826 at SR A1A T Yes 90 None Low Low SR 816 at NW 50 Ave 4-leg No 90 Minor High Medium SR 969 at NW 12 St 4-leg No 90 Minor Medium Medium 3
SR 90 at SW 4 Ave 4-leg Yes* 90 None Medium Medium * Unlike the other intersections in the same group, which has their trap area within a median opening, the trap area
of this intersection occupies a street block. After the intersections were grouped, crash data were summarized for each group. Table 5-15 summarizes the crash experience by crash type for each group. Since the focus of this study is on crashes directly related to the triple left turns, only angle, sideswipe, left-turn, and rear-end crashes are included. As shown in the table, for the Group 1 intersections, the percentages of crashes involving triple left-turn traffic were not over-represented for each of the four crash types, especially considering that triple left-turns served a majority of the left-turn traffic at these intersections. Although the “Y” configuration associated with this group may have provided a favorable condition for sideswipe crashes, the third group, despite its 90o turn angle, also did not have over-represented sideswipe crashes. For the Group 2 intersections, the percentages of sideswipe and left-turn crashes appear to be over-represented. However, it is also recognized at these intersections the triple left turn is the only left-turn movement. Thus, the percentages would tend to be higher.

Guidelines for Triple Left-Turn Lanes at Signalized Intersections
Safety Analysis Page 5-57
Table 5-15. Summary of Crashes by Crash Type for Each Group Approach Angle Sideswipe Left-Turn Rear-End
Group 1 Crashes involving all traffic 33 18 13 167 Crashes involving non-triple-left traffic 19 12 8 146 Crashes involving triple-left traffic 14 6 5 21 Percent crashes involving triple-lefttraffic 42.4 33.3% 38.5% 12.6%
Group 2 Crashes involving all traffic 42 9 3 23 Crashes involving non-triple-left traffic 38 4 1 18 Crashes involving triple-left traffic 4 5 2 5 Percent crashes involving triple-left traffic 9.5% 55.6% 66.7% 21.7%
Group 3 Crashes involving all traffic 41 26 15 112 Crashes involving non-triple-left traffic 31 14 6 103 Crashes involving triple-left traffic 10 12 9 9 Percent crashes involving triple-left traffic 24.4% 46.2% 60.0% 8.0%
Table 5-16 summarizes crash experience by crash severity for each of the three triple left-turn intersection groups. For Group 1, the table shows that 64.7% of the crashes involving triple left-turn traffic resulted in an injury, compared to 55.2% of those crashes involving non-triple-left traffic. This suggests that, when a crash occurs, it is about 10% more likely to result in an injury if the crash involves vehicles from the triple left-turn approach. This over-representation is likely a result of the higher approach speed associated with the Group 1 triple left-turn movements. On the other hand, statistics for Group 2 shows comparable percentages of injury, at about 40%. For Group 3 intersections, the statistics show that crashes involving triple left-turn traffic were less likely to result in an injury.
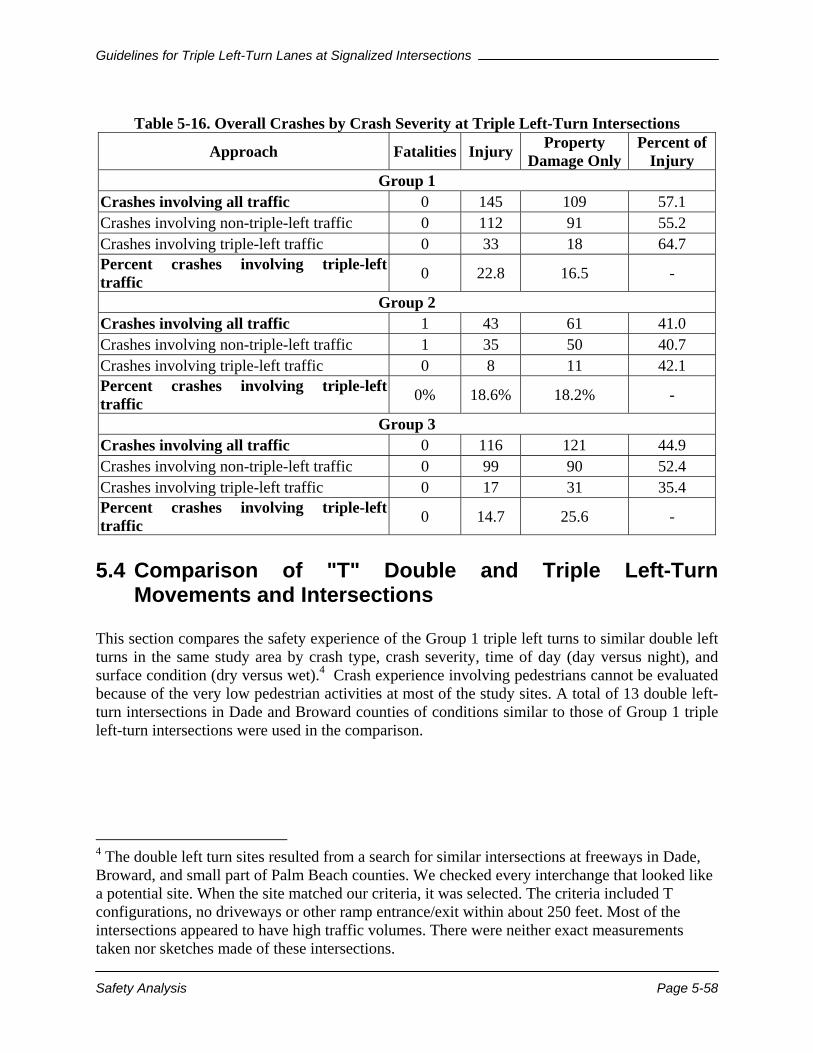
Guidelines for Triple Left-Turn Lanes at Signalized Intersections
Safety Analysis Page 5-58
Table 5-16. Overall Crashes by Crash Severity at Triple Left-Turn Intersections
Approach Fatalities Injury Property Damage Only
Percent of Injury
Group 1 Crashes involving all traffic 0 145 109 57.1 Crashes involving non-triple-left traffic 0 112 91 55.2 Crashes involving triple-left traffic 0 33 18 64.7 Percent crashes involving triple-left traffic 0 22.8 16.5 -
Group 2 Crashes involving all traffic 1 43 61 41.0 Crashes involving non-triple-left traffic 1 35 50 40.7 Crashes involving triple-left traffic 0 8 11 42.1 Percent crashes involving triple-left traffic 0% 18.6% 18.2% -
Group 3 Crashes involving all traffic 0 116 121 44.9 Crashes involving non-triple-left traffic 0 99 90 52.4 Crashes involving triple-left traffic 0 17 31 35.4 Percent crashes involving triple-left traffic 0 14.7 25.6 -
5.4 Comparison of "T" Double and Triple Left-Turn Movements and Intersections
This section compares the safety experience of the Group 1 triple left turns to similar double left turns in the same study area by crash type, crash severity, time of day (day versus night), and surface condition (dry versus wet).4 Crash experience involving pedestrians cannot be evaluated because of the very low pedestrian activities at most of the study sites. A total of 13 double left-turn intersections in Dade and Broward counties of conditions similar to those of Group 1 triple left-turn intersections were used in the comparison.
4 The double left turn sites resulted from a search for similar intersections at freeways in Dade, Broward, and small part of Palm Beach counties. We checked every interchange that looked like a potential site. When the site matched our criteria, it was selected. The criteria included T configurations, no driveways or other ramp entrance/exit within about 250 feet. Most of the intersections appeared to have high traffic volumes. There were neither exact measurements taken nor sketches made of these intersections.
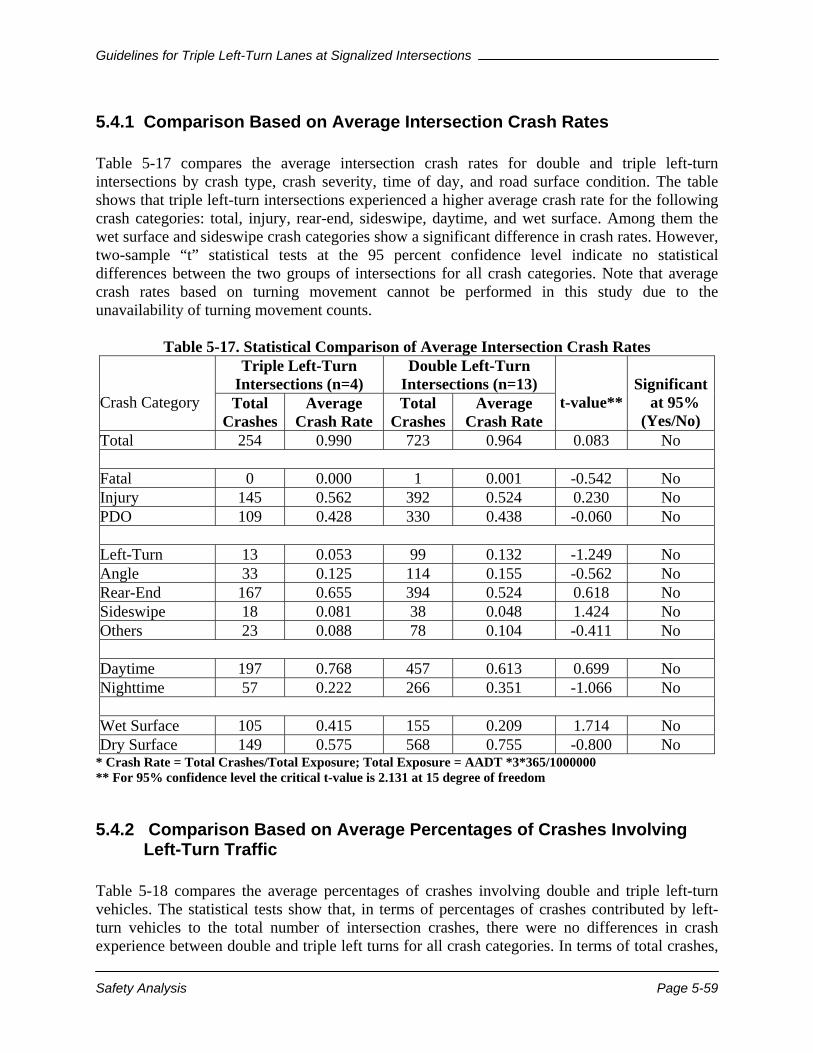
Guidelines for Triple Left-Turn Lanes at Signalized Intersections
Safety Analysis Page 5-59
5.4.1 Comparison Based on Average Intersection Crash Rates Table 5-17 compares the average intersection crash rates for double and triple left-turn intersections by crash type, crash severity, time of day, and road surface condition. The table shows that triple left-turn intersections experienced a higher average crash rate for the following crash categories: total, injury, rear-end, sideswipe, daytime, and wet surface. Among them the wet surface and sideswipe crash categories show a significant difference in crash rates. However, two-sample “t” statistical tests at the 95 percent confidence level indicate no statistical differences between the two groups of intersections for all crash categories. Note that average crash rates based on turning movement cannot be performed in this study due to the unavailability of turning movement counts.
Table 5-17. Statistical Comparison of Average Intersection Crash Rates Triple Left-Turn
Intersections (n=4) Double Left-Turn
Intersections (n=13) Crash Category
Total
Crashes Average
Crash Rate Total
CrashesAverage
Crash Rate t-value**
Significant at 95% (Yes/No)
Total 254 0.990 723 0.964 0.083 No
Fatal 0 0.000 1 0.001 -0.542 No Injury 145 0.562 392 0.524 0.230 No PDO 109 0.428 330 0.438 -0.060 No Left-Turn 13 0.053 99 0.132 -1.249 No Angle 33 0.125 114 0.155 -0.562 No Rear-End 167 0.655 394 0.524 0.618 No Sideswipe 18 0.081 38 0.048 1.424 No Others 23 0.088 78 0.104 -0.411 No Daytime 197 0.768 457 0.613 0.699 No Nighttime 57 0.222 266 0.351 -1.066 No
Wet Surface 105 0.415 155 0.209 1.714 No Dry Surface 149 0.575 568 0.755 -0.800 No
* Crash Rate = Total Crashes/Total Exposure; Total Exposure = AADT *3*365/1000000 ** For 95% confidence level the critical t-value is 2.131 at 15 degree of freedom
5.4.2 Comparison Based on Average Percentages of Crashes Involving Left-Turn Traffic
Table 5-18 compares the average percentages of crashes involving double and triple left-turn vehicles. The statistical tests show that, in terms of percentages of crashes contributed by left-turn vehicles to the total number of intersection crashes, there were no differences in crash experience between double and triple left turns for all crash categories. In terms of total crashes,
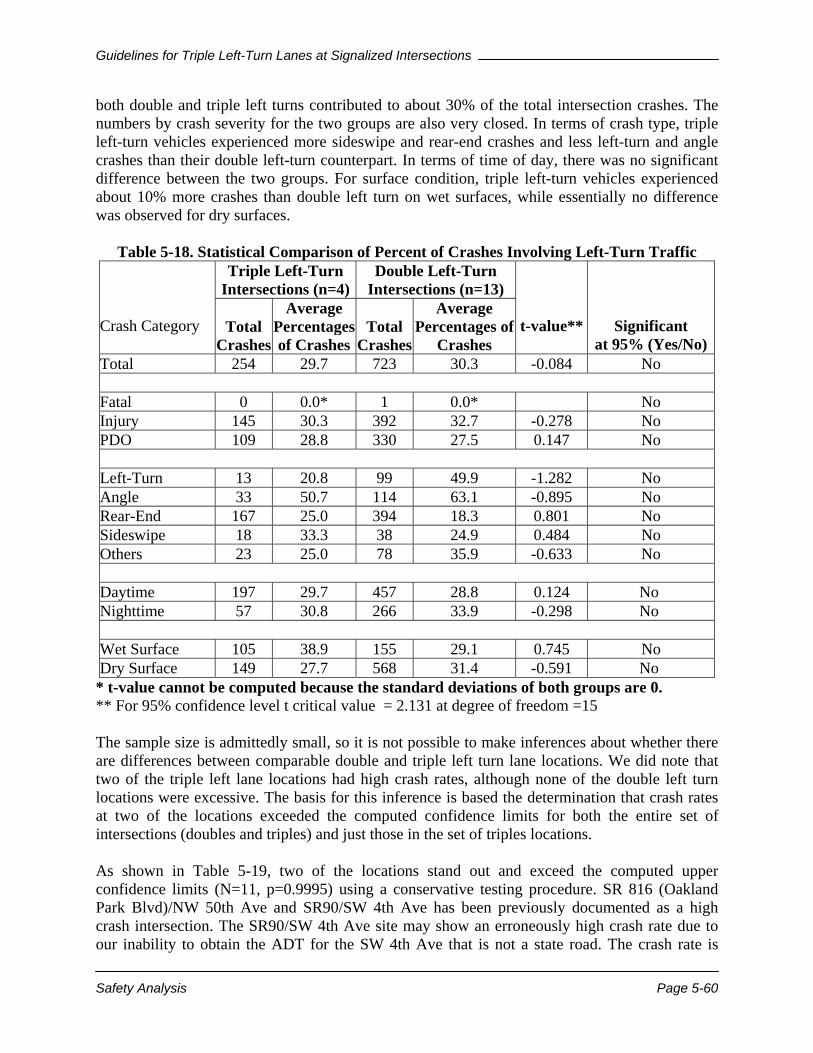
Guidelines for Triple Left-Turn Lanes at Signalized Intersections
Safety Analysis Page 5-60
both double and triple left turns contributed to about 30% of the total intersection crashes. The numbers by crash severity for the two groups are also very closed. In terms of crash type, triple left-turn vehicles experienced more sideswipe and rear-end crashes and less left-turn and angle crashes than their double left-turn counterpart. In terms of time of day, there was no significant difference between the two groups. For surface condition, triple left-turn vehicles experienced about 10% more crashes than double left turn on wet surfaces, while essentially no difference was observed for dry surfaces.
Table 5-18. Statistical Comparison of Percent of Crashes Involving Left-Turn Traffic Triple Left-Turn
Intersections (n=4)Double Left-Turn
Intersections (n=13)
Crash Category
Total Crashes
Average Percentages of Crashes
Total Crashes
Average Percentages of
Crashes t-value**
Significant
at 95% (Yes/No)Total 254 29.7 723 30.3 -0.084 No Fatal 0 0.0* 1 0.0* No Injury 145 30.3 392 32.7 -0.278 No PDO 109 28.8 330 27.5 0.147 No Left-Turn 13 20.8 99 49.9 -1.282 No Angle 33 50.7 114 63.1 -0.895 No Rear-End 167 25.0 394 18.3 0.801 No Sideswipe 18 33.3 38 24.9 0.484 No Others 23 25.0 78 35.9 -0.633 No
Daytime 197 29.7 457 28.8 0.124 No Nighttime 57 30.8 266 33.9 -0.298 No
Wet Surface 105 38.9 155 29.1 0.745 No Dry Surface 149 27.7 568 31.4 -0.591 No
* t-value cannot be computed because the standard deviations of both groups are 0. ** For 95% confidence level t critical value = 2.131 at degree of freedom =15 The sample size is admittedly small, so it is not possible to make inferences about whether there are differences between comparable double and triple left turn lane locations. We did note that two of the triple left lane locations had high crash rates, although none of the double left turn locations were excessive. The basis for this inference is based the determination that crash rates at two of the locations exceeded the computed confidence limits for both the entire set of intersections (doubles and triples) and just those in the set of triples locations. As shown in Table 5-19, two of the locations stand out and exceed the computed upper confidence limits (N=11, p=0.9995) using a conservative testing procedure. SR 816 (Oakland Park Blvd)/NW 50th Ave and SR90/SW 4th Ave has been previously documented as a high crash intersection. The SR90/SW 4th Ave site may show an erroneously high crash rate due to our inability to obtain the ADT for the SW 4th Ave that is not a state road. The crash rate is
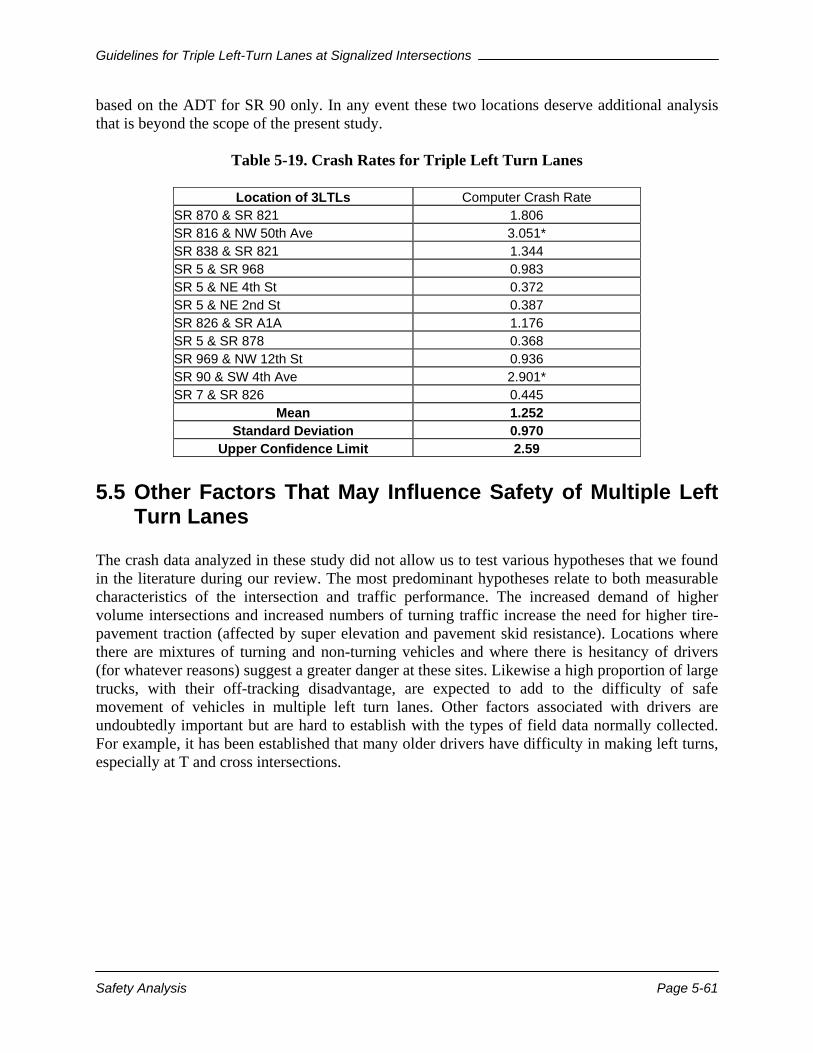
Guidelines for Triple Left-Turn Lanes at Signalized Intersections
Safety Analysis Page 5-61
based on the ADT for SR 90 only. In any event these two locations deserve additional analysis that is beyond the scope of the present study.
Table 5-19. Crash Rates for Triple Left Turn Lanes
Location of 3LTLs Computer Crash Rate SR 870 & SR 821 1.806 SR 816 & NW 50th Ave 3.051* SR 838 & SR 821 1.344 SR 5 & SR 968 0.983 SR 5 & NE 4th St 0.372 SR 5 & NE 2nd St 0.387 SR 826 & SR A1A 1.176 SR 5 & SR 878 0.368 SR 969 & NW 12th St 0.936 SR 90 & SW 4th Ave 2.901* SR 7 & SR 826 0.445
Mean 1.252 Standard Deviation 0.970
Upper Confidence Limit 2.59
5.5 Other Factors That May Influence Safety of Multiple Left Turn Lanes
The crash data analyzed in these study did not allow us to test various hypotheses that we found in the literature during our review. The most predominant hypotheses relate to both measurable characteristics of the intersection and traffic performance. The increased demand of higher volume intersections and increased numbers of turning traffic increase the need for higher tire-pavement traction (affected by super elevation and pavement skid resistance). Locations where there are mixtures of turning and non-turning vehicles and where there is hesitancy of drivers (for whatever reasons) suggest a greater danger at these sites. Likewise a high proportion of large trucks, with their off-tracking disadvantage, are expected to add to the difficulty of safe movement of vehicles in multiple left turn lanes. Other factors associated with drivers are undoubtedly important but are hard to establish with the types of field data normally collected. For example, it has been established that many older drivers have difficulty in making left turns, especially at T and cross intersections.
Guidelines for Triple Left-Turn Lanes at Signalized Intersections
Overall Assessment Page 6-1
6. OVERALL ASSESSMENT This project has reviewed several considerations associated with triple left-turn lanes, including:
• Previously published literature on multiple left turn studies and experience; • Experience of other states with double and triple left turns; • Operational studies at intersections in Florida; • Crash experience at intersections in Florida and • Traffic model applications for multiple left turns.
None of these sources of information indicated the existence of universally accepted standards for triple left-turn lane design and operation, although Ackeret’s 1994 guidelines are fairly complete and well recognized.
6.1 General Observations Based on the information compiled by the study the following general observations are offered:
1. Although the developers of the models investigated for this project do appear to have envisioned triple left turn lanes, all the models can be used to represent triple left turn lanes as three-lane movements that happen to be turning left. Several states that have constructed triple-left turn lanes extrapolate the guidelines developed for double left-turn lanes. Guidance has been derived primarily from NCHRP Report No 279 or the use of the Highway Capacity Manual or other performance evaluation models. Several of the state responses suggest that vehicle hourly left-turn volumes must exceed 600 to be considered as a candidates for adding a third left turning lane.
2. The combined saturation flow rates measured at a single location in Gainesville and six
locations in South Florida varied from 1544 to 2150 pcphgpl. Analysis suggests that the best performers are at Y and T intersections with simple geometrics. These results are generally consistent with the few other operational studies of the ideal capacity of triple left turn lanes. There is sufficient variation in the types triple left turn configurations. Accordingly we believe more analysis is required before developing a table of capacity adjustments for triple left turn lanes.
3. Although the literature suggests that, in general, one lane or another may service more
vehicles than the other two, the data we obtained did not appear to support such a hypothesis. It would appear that the location of nearby intersections and specific geometrics (e.g., number of intersection legs, angle of intersecting roadways), and other traffic factors determine lane preferences.
4. Analysis of crash data from eleven intersections with triple left turning lanes indicated
that, in general, safety is not compromised. When crash rates at these locations are

Guidelines for Triple Left-Turn Lanes at Signalized Intersections
Overall Assessment Page 6-2
compared with intersections with double left turn lanes with similar characteristics, there are no significant differences in the crash rates.
5. Crash rates are high at a few of the study locations. These appear related to conflicting
vehicle movements due to closely spaced intersections and complex geometric designs.
6.2 Existing Design Guidelines and Issues for Double Left Turns
The NCHRP 279 criteria form the basis for design in several states. A value of 300 vehicles per hour is a common threshold for the consideration of double left-turn lanes. The consensus appears to favor a 30 ft throat width for receiving the turning traffic, but a range of 26 to 36 feet was reported. Two design criteria for accommodating large vehicles were mentioned. The first would accommodate two WB 50 vehicles turning simultaneously and the second would accommodate one WB50 and one SU 30 vehicle.
6.3 Existing Design Guidelines for Triple Left Turns Ackeret’s guidelines developed in 1994 are widely recognized and are a good candidate for at least an interim standard. These guidelines begin by suggesting that the following conditions are inappropriate for triple left-turn lane installations:
• There is a potential for higher number of pedestrian-vehicle conflicts; • Left-turning vehicles are not anticipated to queue uniformly within the provided left-turn
storage due to downstream conditions; • Conditions exist that obscure, or result in, confusing pavement markings within the
intersection; • Right-of-way restrictions prohibit adequate design-vehicle turning maneuver space within
the intersection; and • The installation is not economically justified when compared with other alternatives to
improve intersection capacity. Ackeret’s recommendations on the geometric design of triple left turns include the following recommendations:
1. Select the design vehicle governed by single-unit truck/bus for roadways on truck-restricted areas, or by WB-50 otherwise;

Guidelines for Triple Left-Turn Lanes at Signalized Intersections
Overall Assessment Page 6-3
2. The lateral clearance between the running design vehicles should be maintained with a minimum clearance of 2 feet on each side of the design vehicle overhang limits within turning maneuvers;
3. Concurrent opposing left turns should have at least 10 feet vehicle clearance between opposing left turns;
4. Left-turn approach lane widths should have at least 11 feet in width with a desirable width of 12 feet;
5. The downstream departure lane widths should have an absolute minimum of 11 feet with a desirable width of 12 feet;
6. The receiving leg should have a raised median island of at least 2 feet in width to provide drivers on the inside lane with a visual point of reference to guide the vehicle through the left-turn maneuver;
7. Determine storage bay length based on anticipated left-turn arrival rates, cycle length, need to prevent spillover to thru lanes, and presence of adjacent upstream intersections and driveways;
8. Determine approach taper length based on design speed and local preference for reverse curves versus taper sections;
9. Advance overhead should be used to inform drivers of lane options. These signs should be supplemented with appropriate downstream lane destination messages if they will reduce downstream weaving maneuvers; and
10. Skip lines, preferably comprised of raised markers, should be used through the intersection with appropriate spacing to control the multiple turning path and keep each vehicle within its lane.
6.4 Traffic Model Applications The value of traffic models in analyzing triple left-turn operations is well recognized, especially when any complications are present from upstream or downstream intersections. An investigation of the most common software products that model signalized intersection operations suggested the following:
1. None of the models investigated recognizes the unique characteristics of triple left turns. Instead, they all model triple left turns as three-lane movements that happen to be turning left. There is little or no difference between three-lane through movements and triple left turns;
2. The single intersection models, HCM and SIDRA, are easier to use and are probably adequate for the analysis of relatively simple triple left turn situations. When complexities arise from upstream or downstream conditions, one of the signal network models (CORSIM or TRANSYT-7F) should be used;
Guidelines for Triple Left-Turn Lanes at Signalized Intersections
Overall Assessment Page 6-4
3. The network models appear to do a reasonable job of modeling spillback into the
intersection from downstream bottlenecks, but they are not able to recognize problems associated with such phenomena as multiple trucks turning simultaneously;
4. Maintenance of capacity (i.e., avoiding capacity reductions) is a promising criterion for determining the minimum merging section length when a triple left turn must enter a two-lane street. Avoidance of spillback may be a better criteria criterion, because of its increased sensitivity and potential as a safety surrogate. Both of these criteria require signalized intersection performance estimation software (Star Network Simulation);
5. Both CORSIM and TRANSYT-7F are able to recognize spillover explicitly and to make adjustment to the effective capacity of an approach to reflect the blockage caused by spillback;
6. CORSIM has several parameters in its input data structure that should be useful in creating an operation that could represent triple left turns more realistically, but most of these items had no influence on the CORSIM performance estimations. This suggests that heir effects are minimal, or that they are not implemented as per the CORSIM documentation; and
7. The star-network mapped into both CORSIM and TRANSYT-7F by the new version of the Arterial Analysis Package is an effective tool for analyzing most intersections that have triple left turns with adjacent-intersection effects.
6.5 Additional Analysis Needed The data collected in this study provides a clear indication that the third lane for a triple left-turn lane configuration increases the capacity of the intersection by approximately one-third. We did not have a direct basis for making a comparison between two and three left-turn lanes. Accordingly, we can not say with confidence that the addition of a third turn lane to an existing configuration or building a new left turn lane configuration with three lanes would provide such an increase. Existing literature suggests that the improvement would be somewhat less than a full one-third increase in the number of vehicles serviced for each traffic signal cycle. Empirically, the only way to establish the magnitude of the increase is to obtain before and after data for a variety of configurations that are upgraded. Because the number of such projects is expected to be limited in the near future, uniform data would have to drawn from the nation, rather than Florida alone. The crash data in this study is limited but does suggest that for certain configurations, such as Y junctions, triple left turn lanes has no adverse influence of safety. For locations with more complex intersections (e.g., roads with medians, closely spaced adjacent intersection, 4-leg intersections) there is a hint that triple left-turn lanes may reduce safety. Again, without direct “before-after” comparisons for upgraded intersections or analyses using rigid control of geometric and traffic characteristics, there is no empirical way to establish the impact triples will make on safety.
Guidelines for Triple Left-Turn Lanes at Signalized Intersections
Overall Assessment Page 6-5
For moderate to high traffic volume facilities, it is hard to conceive of situations where triple left-turn lanes will not increase the intersection capacity over single or double left-turn lanes. If safety is indeed compromised for more complex road environments then some form of tradeoff analysis is warranted. Without more empirical data, modeling of both service and safety appears to be only practical way to assess the impacts of triples. We expect that a comprehensive analysis using the models used in this study will yield mixed results because different models make different assumptions, but can provide a more sensitive decision tool to judge whether road users are best served by the construction of triple left-turn configurations.
6.6 Recommended Modifications to the Traffic Engineering Manual
The FDOT has developed the Traffic Engineering Manual (TEM) to provide traffic engineering standards and guidelines to be used on the State Highway System by the Department's District Traffic Operations Offices. To fulfill the technology transfer requirements of this research project, it is recommended that the coverage of the TEM be extended to include requirements and guidelines for multiple left turns. It is also recommended that material covering triple left turn lanes be added to the FDOT Design Standards. Specifically, Index 17346, Sheet 8 of 13 now covers markings for single and double left turn lanes. This treatment should be extended to cover triple left turn lanes. The current version of the TEM covers left turn treatments at signalized intersections in Section 3.2. The following text is recommended for addition to Section 3.2 as Section 3.2.7:
MULTIPLE LEFT TURN LANES It is common practice at signalized intersections on the state highway system to provide an exclusive lane for left-turning traffic unless the volume of left turns is negligible. At intersections with heavy left turns, it may be necessary to consider providing more than one left turn lane to accommodate a given movement. Double left turn lanes are commonly used for this purpose. Triple left turn lanes have been implemented successfully throughout the state, but are much less common. Multiple left turn lanes provide additional capacity for left turning movements and will usually produce an improvement in the overall intersection delay and level of service. The operational benefits are offset to some extent by additional exposure for cyclists and pedestrians, and by a generally increased complexity of the driving task. The operational benefits are relatively easy to estimate using accepted analysis techniques. The effect on driver performance and on safety to all road users is much harder to quantify. With this in mind, the following guidelines are offered:
Guidelines for Triple Left-Turn Lanes at Signalized Intersections
Overall Assessment Page 6-6
Double Left Turn Lanes Double left turn lanes may be used for specific movements when the following conditions apply:
1. An operational analysis of the intersection indicates that the provision of a double left turn lane would correct a situation in which the overall capacity of the intersection is not sufficient to meet the demand.
2. Two downstream lanes are available to receive the left turning traffic for at
least 300 feet from the intersection.
3. No problems are evident with respect to bicycle and pedestrian safety. In addition, the following conditions are desirable for double left turn lanes:
1. Continuous downstream receiving lanes should be provided to avoid a lane drop.
2. Left turn lanes should be fully shadowed by storage bays whenever
possible.
3. The signal timing plan should provide adequate clearance times for bicycles and pedestrians
4. Lane line extensions should normally be used to delineate the proper
turning path through the intersection for the double left-turn maneuver to reduce the sideswipe collision potential and to promote efficient double left-turn operations. The markings should be carefully planned to coincide closely with normal vehicular turning paths
5. Lane lines (or guide lines) and width requirements should be determined
by plotting the swept paths of the selected design vehicles. For most intersections on the State Highway System, design of double lane turns should consider as a minimum an SU vehicle and P vehicle turning simultaneously. More guidance on the determination of turning radii and other geometric design parameters is given in Chapter 3 of the Florida Department of Transportation Intersection Design Guide.
6. Concurrent opposing left turns should have at least 8 feet clearance
between opposing left turns. If adequate separation cannot be achieved, separate left turn phases for each direction will be necessary.
Guidelines for Triple Left-Turn Lanes at Signalized Intersections
Overall Assessment Page 6-7
Triple Left Turn Lanes Triple left turn lanes require more specific justification and more attention to detail in the design. All of the requirements listed above for double left turn lanes apply to triple left turn lanes. The following additional requirements should be met for triple left turn lanes, and their use should only be considered when the following conditions are fully met:
1. An operational analysis of the intersection indicates that the provision of a triple left turn lane would correct a situation in which the overall capacity of the intersection would be seriously deficient, and that no other geometric or signal modifications would correct the deficiency. The operational analysis must take into account the effects of adjacent intersections, including:
a. Backup from a downstream signal on the receiving roadway
b. Relative turning movement distribution at a downstream
intersection that would compromise the ability of the receiving lanes to store the left turning vehicles
c. Heavy volumes from other approaches that are also
accommodated by the roadway that receives the left turns.
d. Upstream effects that could make it difficult to distribute the approaching left turns over the three left turning lanes (e.g. a heavy single lane exit ramp from a freeway).
The Highway Capacity Manual should be used for operational analysis only when there are no complicating factors of the type listed above. If there are any upstream or downstream influences, a microscopic simulation should be performed.
2. Lane lines (or guide lines) and width requirements should be determined
by plotting the swept paths of the selected design vehicles. For most intersections on the State Highway System, design of triple lane turns should consider as a minimum an SU vehicle and two P vehicles turning simultaneously with a minimum 4 feet separation between the swept paths of the vehicles. The SU vehicle should be able to turn in all lanes. More guidance on the determination of turning radii and other geometric design parameters is given in Chapter 3 of the Florida Department of Transportation Intersection Design Guide.
3. Three downstream lanes are available to receive the left turning traffic for
at least 300 feet from the intersection, and at least two continuous downstream lanes exist beyond that point.

Guidelines for Triple Left-Turn Lanes at Signalized Intersections
Overall Assessment Page 6-8
4. There are no conditions that obscure, or result in, confusing pavement
markings within the intersection.
5. The safety record (number and type of collisions) at the intersection suggests that the proposed operation would not aggravate a demonstrated safety problem.
6. No problems are evident with respect to bicycle and pedestrian safety.
7. The signal-timing plan must be able to provide adequate walk and don’t
walk clearance intervals for all phases that accommodate through movements, taking the increased roadway width into account.
In addition, the following conditions are desirable for triple left turn lanes:
1. Continuous downstream receiving lanes should be provided to avoid a lane drop.
2. The literature (Ackeret, Reference 1) identifies three categories of triple
left turn configurations illustrated in the figure on the next page.:
• Type A: Three exclusive left turn bays • Type B: Two exclusive left turn bays plus an exclusive left turn trap
lane • Type C: Two exclusive left turn bays plus an optional through-left
lane
The Type A configuration should be used whenever possible to avoid the trap lanes associated with Type B configurations and to avoid the operational complexities of an optional through and left turn lane associated with Type C configurations.
3. Ackeret’s 1994 guidelines should be followed where applicable
4. All configurations require adequate signing and marking to make the intended operation clear to every road user. Each turn lane should be marked with turn arrows and “ONLY” legends as appropriate Type B and C configurations require special attention because of their potential for confusing drivers
5. The receiving leg should have a raised median island of at least 2 feet in
width to provide drivers on the inside lane with a visual point of reference to guide the vehicle through the left-turn maneuver.
Guidelines for Triple Left-Turn Lanes at Signalized Intersections
Overall Assessment Page 6-9
6. Special attention should be given to the signal timing intervals that are sensitive to bicycle and pedestrian requirements, including the walk and don’t walk clearance intervals for pedestrians and the yellow and all-red intervals for bicycles.
Reference
1. Ackeret, K. W., “Criteria for the Geometric Design of Triple Left-Turn Lanes,”
ITE Journal, Institute of Transportation Engineers, vol. 64, no. 12, pp. 27-33, December 1994.
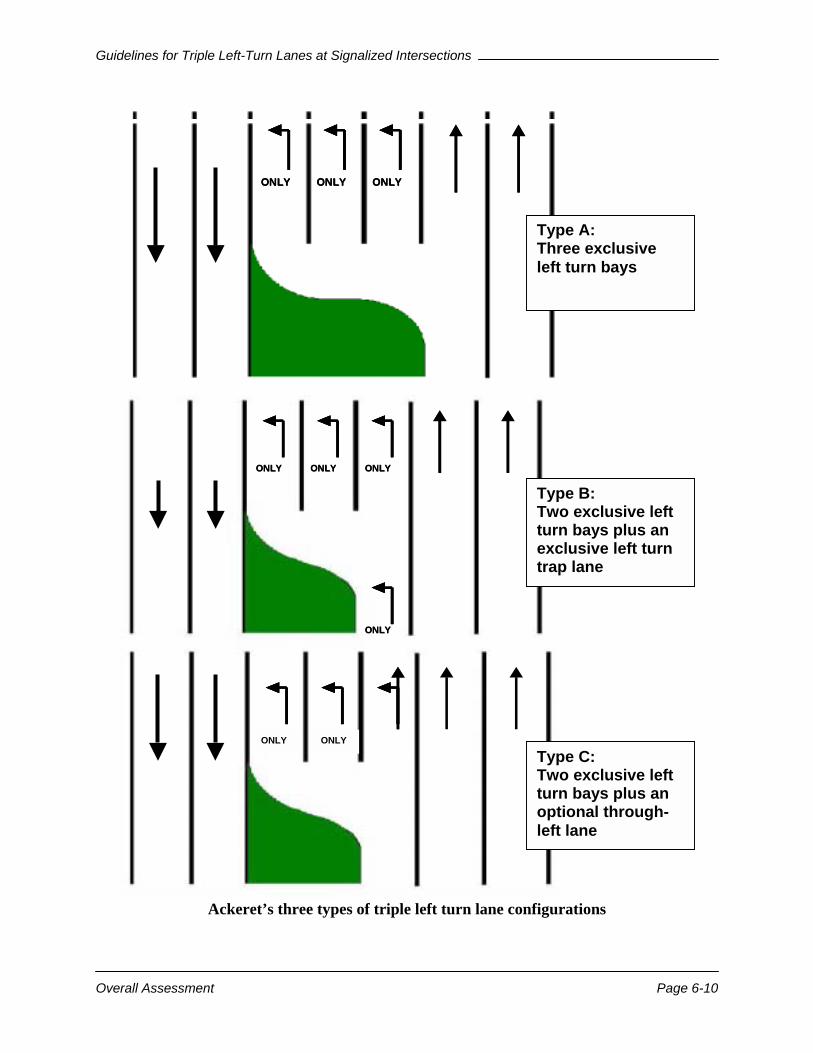
Guidelines for Triple Left-Turn Lanes at Signalized Intersections
Overall Assessment Page 6-10
Ackeret’s three types of triple left turn lane configurations
ONLY ONLY ONLYONLY ONLY ONLYONLY ONLY ONLY
ONLY ONLY
ONLY ONLY ONLY
ONLY
ONLY ONLY ONLY
ONLY
ONLY ONLY ONLY
ONLY
Type C: Two exclusive left turn bays plus an optional through-left lane
Type B: Two exclusive left turn bays plus an exclusive left turn trap lane
Type A: Three exclusive left turn bays
Guidelines for Triple Left-Turn Lanes at Signalized Intersections
References Page R-1
REFERENCES Ackeret, K. W., “Criteria for the Geometric Design of Triple Left-Turn Lanes,” ITE Journal, Institute of Transportation Engineers, vol. 64, no. 12, pp. 27-33, December 1994. Ackeret, K.W. R. Menon, and S. S. Nambisan, “Evaluation of Sideswipe Crashes at Triple and Dual Left-Turn Lanes in Las Vegas, Nevada,” Presented at the 69th Annual Meeting of the Institute of Transportation Engineers, Las Vegas, Nevada, 1999. Assmus, W. E., “Operational Performance of Exclusive Double Left-Turn Lanes,” Master’s Thesis, Northwestern University, April 1970. Belluccia, A. G., G. L. Harter, and M. J. Rechtorik, “Triple Left-Turn Lanes: Getting the First One Approved,” Dames & Moore, 1996. Capelle, D. G. and C. Pinnell, “Capacity Study of Signalized Diamond Interchanges,” Highway Research Board Bulletin, 1961. Coleman, W. F., “Operational Aspects of Dual Left Turns,” Paving and Transportation Conference Proceedings, pp. 143-150, 1989. Florida Department of Transportation, “Three Lane Left Turns Versus Two Lane Left Turns: An Operational Study,” October 1991. Highway Research Board, “Highway Capacity Manual – 1965,” HRB Special Report, 1965. ITE Technical Council Committee 4L-M, “The Use and Effectiveness of Double Left-Turn Maneuvers,” Traffic Engineering, vol. 45, no. 7, July 1975. ITE Technical Council Committee 5P-5, “Capacities of Multiple Left-Turn Lanes,” Institute of Transportation Engineers, September 1993. ITE Technical Council Committees 5P-5 and 5P-1, “Capacities of Double and Triple Left-Turn Lanes,” ITE Compendium of Technical Papers, Institute of Transportation Engineers,1995. Jolicoeur, Philippe “Modeling of Signalized Approaches with Multiple Left Turn,” Masters Paper, University of Florida,(unpublished), 1999. Kagolanu, K. and D. Szplett, “Saturation Flow Rates of Dual Left-Turn Lanes,” Proceedings of the Second International Symposium on Highway Capacity, vol. 1, pp. 325-334, 1994. Kunzman, W., “Another Look at Signalized Intersection Capacity,” ITE Journal, Institute of Traffic Eigineers, 1970. Leisch, J. E., “Capacity Analysis Techniques for Design of Signalized Intersections,” Public Roads, 1967.

Guidelines for Triple Left-Turn Lanes at Signalized Intersections
References Page R-2
Leonard, J. D., “Operational Characteristics of Triple Left Turns,” Transportation Research Record 1457, Transportation Research Board, Washington, D.C., pp. 104-110, 1994. Leonard, J. D., “Triple Left-Turns: An Analysis of Capacity and Other Issues,” Institute of Transportation Studies, University of California, Irvine, March 1994. Mitchell, R. “Tracking the Rise of the Triple Left-Turn,” Compendium of Technical Papers, Institute of Transportation Engineers, pp. 271-276, 1993. Marcus, C. T., “Designing and Evaluating Single and Dual Left-Turning Lanes at Urban Intersections,” Master’s Thesis, University of Texas, Austin, May 1989. Marcus, C. T., R. B. Machemehl, and C. E. Lee, “Auxiliary Turning Lanes at Urban Intersections,” Center for Transportation Research, Bureau of Engineering Research, the University of Texas at Austin, January 1990. Nicholas, A. C., “Exclusive Double Left-Turn Lanes: Delay and Accidents,” Operations Review, vol. 6, no. 1, pp. 13-21,1989. Nune, C., “Modeling the Efficiency of Exclusive Double Left-Turn Lane Intersections in Charlotte,” Master Thesis, The University of North Carolina at Charlotte, 1995. Pline, J. L., “Left-Turn Treatments at Intersections,” Synthesis of Highway Practice 225, Transportation Research Board, National Academy Press, Washington, D.C., 1996. Ray, J. C., “Two Lane Left Turns Studied at Signalized Intersections,” Traffic Engineering, Institute of Traffic Engineering, vol. 35, no. 7, pp. 17-58, 1965. Shaik, R. A. and J. R. Graham, “Efficiency of Dual Left-Turn Lane Intersections in Charlotte: A Study Using TRAF-NETSIM,” ITE Journal, Institute of Transportation Engineers, pp. 26-33, April 1996. Shen, Qiong, “Minimum Merging Section Lengths for Triple Left-Turns with Downstream Lane Reductions”, ITE Journal, pp 40-45, March 2001 Spring, G. S. and A. Thomas, “Double Left-Turn Lanes in Medium-Size Cities,” Journal of Transportation Engineers, vol. 125, no. 2., pp. 138-143, March/April 1999. Stokes, R. W., “Saturation Flows of Exclusive Double Left-Turn Lanes,” Ph.D. Dissertation, The Graduate College of Texas A&M University, December 1984. Stokes, Robert W., Carroll J. Messer, and Vergil G. Stover, “Saturation Flows of Exclusive Double Left-Turn Lanes,” Transportation Research Record 1091, pp. 86-94, 1986. Stokes, R.W., C. J. Messer, and V. G. Stover, “Left Turns on Amber and Red from Exclusive Double Left-Turn Lanes,” ITE Journal, vol. 56, no. 1, January 1986.
Guidelines for Triple Left-Turn Lanes at Signalized Intersections
References Page R-3
Stokes, R. W., “Capacities of Triple Left-Turn Lanes,” ITE Technical Council Committee 5P-5A, Institute of Transportation Engineers, September 1995. Traffic Signal Technical Committee of the Colorado/Wyoming Section of ITE, “Permissive Double Left Turns: Are They Safe?” Compendium of Technical Papers, Institute of Transportation Engineers, pp. 214-218, 1995.
Guidelines for Triple Left-Turn Lanes at Signalized Intersections
Appendices Page A-1
APPENDIX A – TRAFFIC DATA COLLECTION AND ANALYSIS METHODOLOGY
Several methods have to be performed in order to do a study of multiple left-turn lanes. The steps of the methodology to be followed are: the site selection, the data collection that involves the camera selection, the installation of the sound transmitter and the setup of the system, the data reduction, the data analysis and the data flow infrastructure. SITE SELECTION Appropriate sites for this study are busy intersections with multiple left-turn lanes. The intersection should have long queues of cars waiting to make a left turn, there should be some unusual events happening at the intersection involving different types of vehicles. The Multiple Left-Turn Lane Site Selection Summary Form presented in Figure A-1 should be used to confirm that the selected site fits the requirements for the study. The form includes some general information about the name and the location of the intersection, the peak hour times, the percentages of trucks and the presence of pedestrian accommodations. The form also asks for some approach and exit parameters. The last important item in the selection of the site form is the “Vantage Point Characteristics for Video Taping.” One of the objectives of the study is to test different video cameras. A good location must be available to install the camera so that it gives a good view of the whole intersection. Usually the far-right corner from the approach is a good position to install the camera. There must not be any visibility problems and no physical obstructions to the camera view. DATA COLLECTION The data for the study are obtained by installing a video camera at the selected intersection and recording left-turn activities at desired time, usually during peak periods. The camera is mounted either on a concrete or wooden pole and placed on the far-right side of the intersection from the approach. The camera should have a lens with a wide enough angle to cover both the approach and exit sections. Different types of cameras can be used to do this study. A sound transmitter is used to register the periodic changes in the signal phases. Both the camera and the sound transmitter are connected to a VCR that records the activities. A 12-Volt battery supplies power to the whole system.
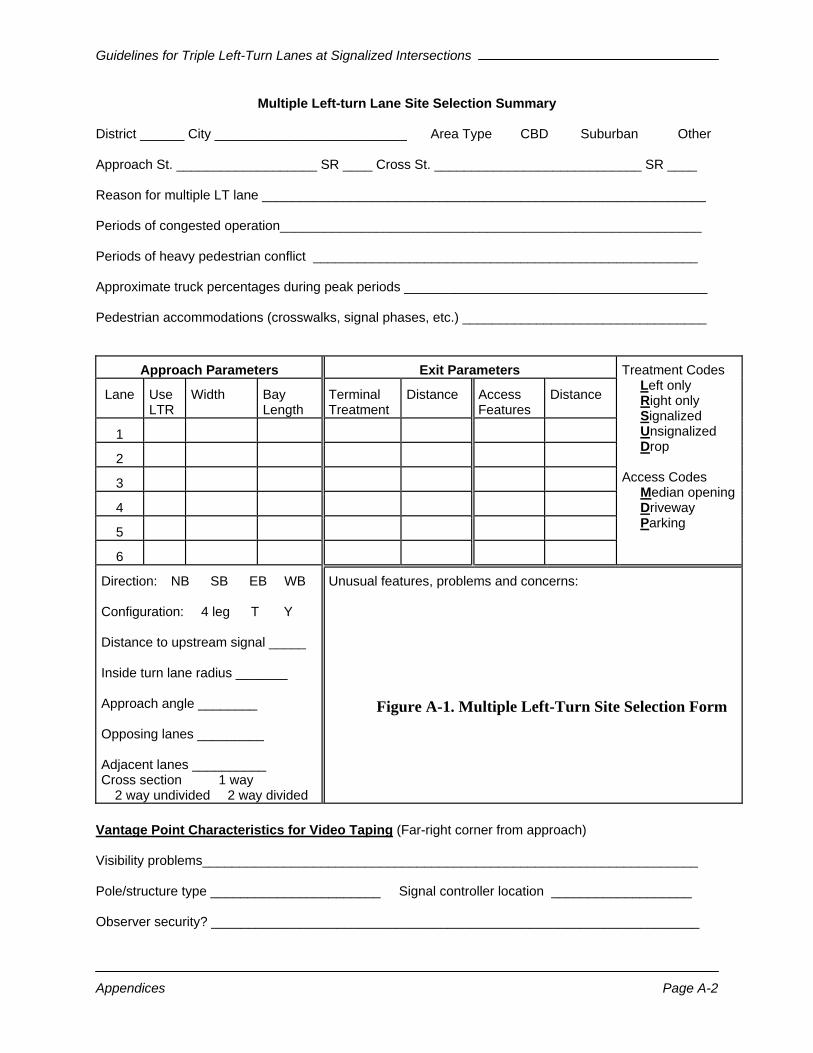
Guidelines for Triple Left-Turn Lanes at Signalized Intersections
Appendices Page A-2
Multiple Left-turn Lane Site Selection Summary District ______ City __________________________ Area Type �CBD � Suburban � Other Approach St. ___________________ SR ____ Cross St. ____________________________ SR ____ Reason for multiple LT lane ____________________________________________________________ Periods of congested operation_________________________________________________________ Periods of heavy pedestrian conflict ____________________________________________________ Approximate truck percentages during peak periods _________________________________________ Pedestrian accommodations (crosswalks, signal phases, etc.) _________________________________
Approach Parameters Exit Parameters
Lane Use LTR
Width Bay Length
Terminal Treatment
Distance Access Features
Distance
1
2
3
4
5
6
Treatment Codes Left only Right only Signalized Unsignalized Drop Access Codes Median opening Driveway Parking
Direction: �NB �SB �EB �WB Configuration: �4 leg �T �Y Distance to upstream signal _____ Inside turn lane radius _______ Approach angle ________ Opposing lanes _________ Adjacent lanes __________ Cross section � 1 way � 2 way undivided � 2 way divided
Unusual features, problems and concerns: Figure A-1. Multiple Left-Turn Site Selection Form
Vantage Point Characteristics for Video Taping (Far-right corner from approach) Visibility problems___________________________________________________________________ Pole/structure type _______________________ Signal controller location ___________________ Observer security? __________________________________________________________________
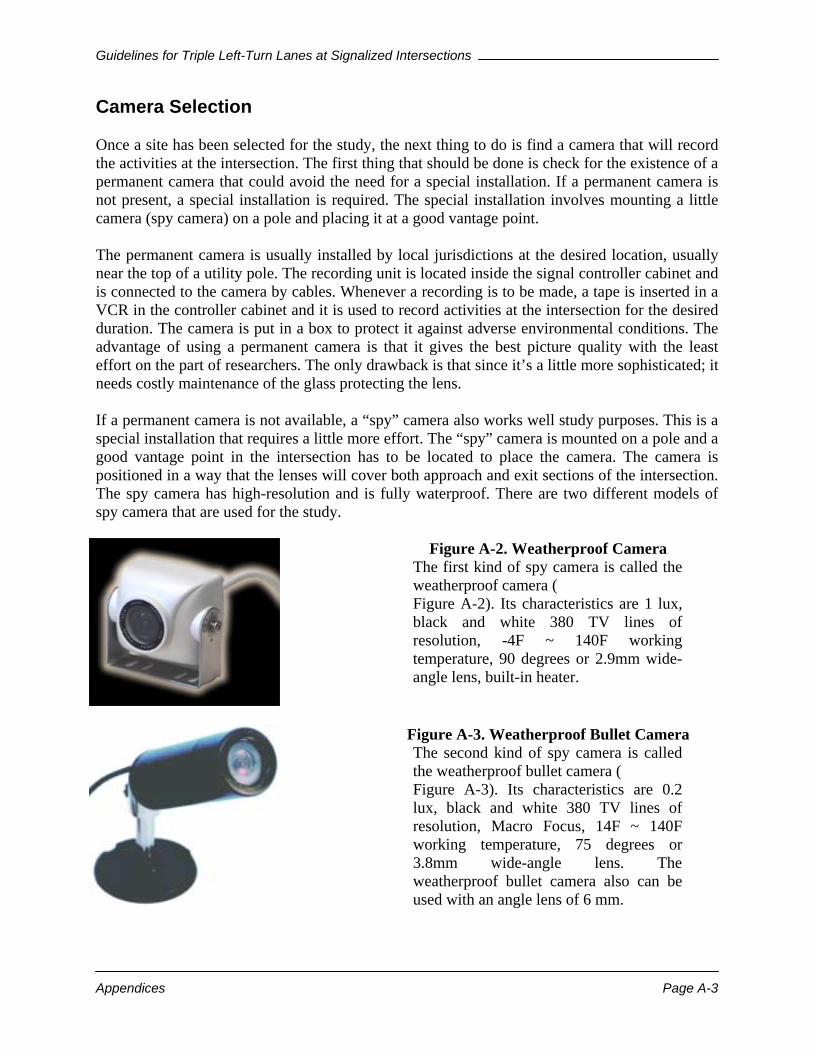
Guidelines for Triple Left-Turn Lanes at Signalized Intersections
Appendices Page A-3
Camera Selection Once a site has been selected for the study, the next thing to do is find a camera that will record the activities at the intersection. The first thing that should be done is check for the existence of a permanent camera that could avoid the need for a special installation. If a permanent camera is not present, a special installation is required. The special installation involves mounting a little camera (spy camera) on a pole and placing it at a good vantage point. The permanent camera is usually installed by local jurisdictions at the desired location, usually near the top of a utility pole. The recording unit is located inside the signal controller cabinet and is connected to the camera by cables. Whenever a recording is to be made, a tape is inserted in a VCR in the controller cabinet and it is used to record activities at the intersection for the desired duration. The camera is put in a box to protect it against adverse environmental conditions. The advantage of using a permanent camera is that it gives the best picture quality with the least effort on the part of researchers. The only drawback is that since it’s a little more sophisticated; it needs costly maintenance of the glass protecting the lens. If a permanent camera is not available, a “spy” camera also works well study purposes. This is a special installation that requires a little more effort. The “spy” camera is mounted on a pole and a good vantage point in the intersection has to be located to place the camera. The camera is positioned in a way that the lenses will cover both approach and exit sections of the intersection. The spy camera has high-resolution and is fully waterproof. There are two different models of spy camera that are used for the study.
Figure A-2. Weatherproof Camera The first kind of spy camera is called the weatherproof camera ( Figure A-2). Its characteristics are 1 lux, black and white 380 TV lines of resolution, -4F ~ 140F working temperature, 90 degrees or 2.9mm wide-angle lens, built-in heater.
Figure A-3. Weatherproof Bullet Camera The second kind of spy camera is called the weatherproof bullet camera ( Figure A-3). Its characteristics are 0.2 lux, black and white 380 TV lines of resolution, Macro Focus, 14F ~ 140F working temperature, 75 degrees or 3.8mm wide-angle lens. The weatherproof bullet camera also can be used with an angle lens of 6 mm.
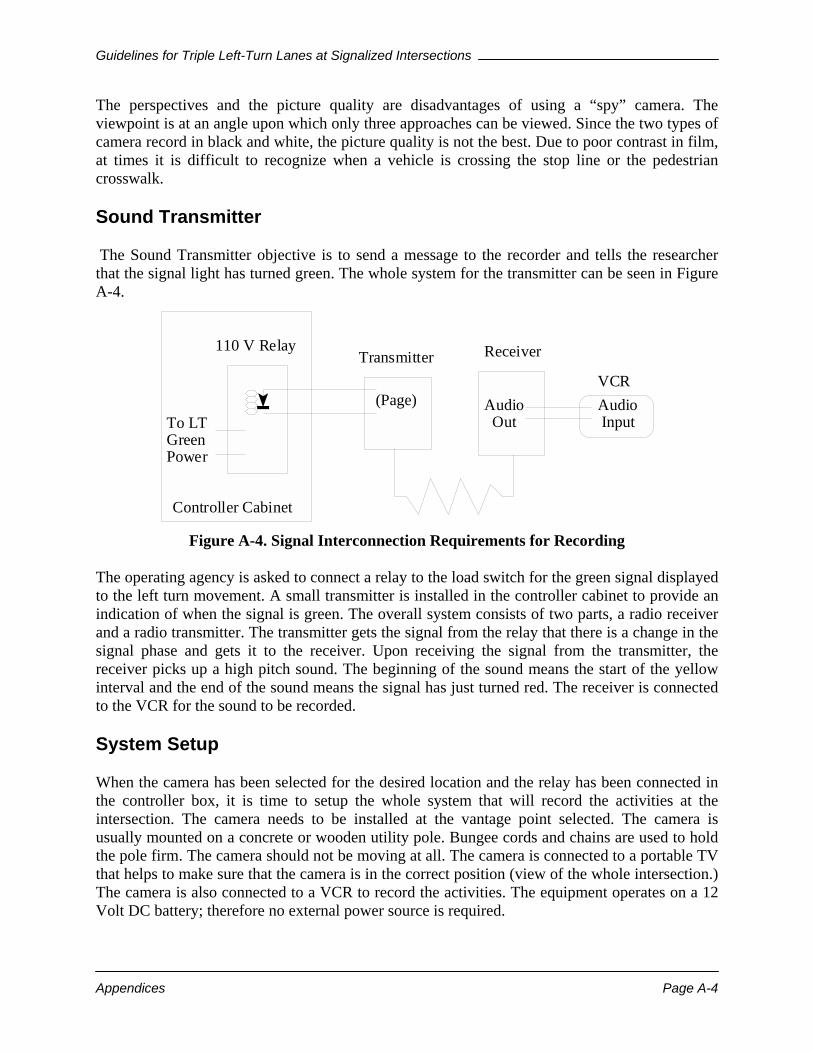
Guidelines for Triple Left-Turn Lanes at Signalized Intersections
Appendices Page A-4
The perspectives and the picture quality are disadvantages of using a “spy” camera. The viewpoint is at an angle upon which only three approaches can be viewed. Since the two types of camera record in black and white, the picture quality is not the best. Due to poor contrast in film, at times it is difficult to recognize when a vehicle is crossing the stop line or the pedestrian crosswalk. Sound Transmitter The Sound Transmitter objective is to send a message to the recorder and tells the researcher that the signal light has turned green. The whole system for the transmitter can be seen in Figure A-4.
Figure A-4. Signal Interconnection Requirements for Recording The operating agency is asked to connect a relay to the load switch for the green signal displayed to the left turn movement. A small transmitter is installed in the controller cabinet to provide an indication of when the signal is green. The overall system consists of two parts, a radio receiver and a radio transmitter. The transmitter gets the signal from the relay that there is a change in the signal phase and gets it to the receiver. Upon receiving the signal from the transmitter, the receiver picks up a high pitch sound. The beginning of the sound means the start of the yellow interval and the end of the sound means the signal has just turned red. The receiver is connected to the VCR for the sound to be recorded. System Setup When the camera has been selected for the desired location and the relay has been connected in the controller box, it is time to setup the whole system that will record the activities at the intersection. The camera needs to be installed at the vantage point selected. The camera is usually mounted on a concrete or wooden utility pole. Bungee cords and chains are used to hold the pole firm. The camera should not be moving at all. The camera is connected to a portable TV that helps to make sure that the camera is in the correct position (view of the whole intersection.) The camera is also connected to a VCR to record the activities. The equipment operates on a 12 Volt DC battery; therefore no external power source is required.
To LTGreen Power
Controller Cabinet
110 V RelayTransmitter Receiver
VCR(Page) Audio
OutAudio Input
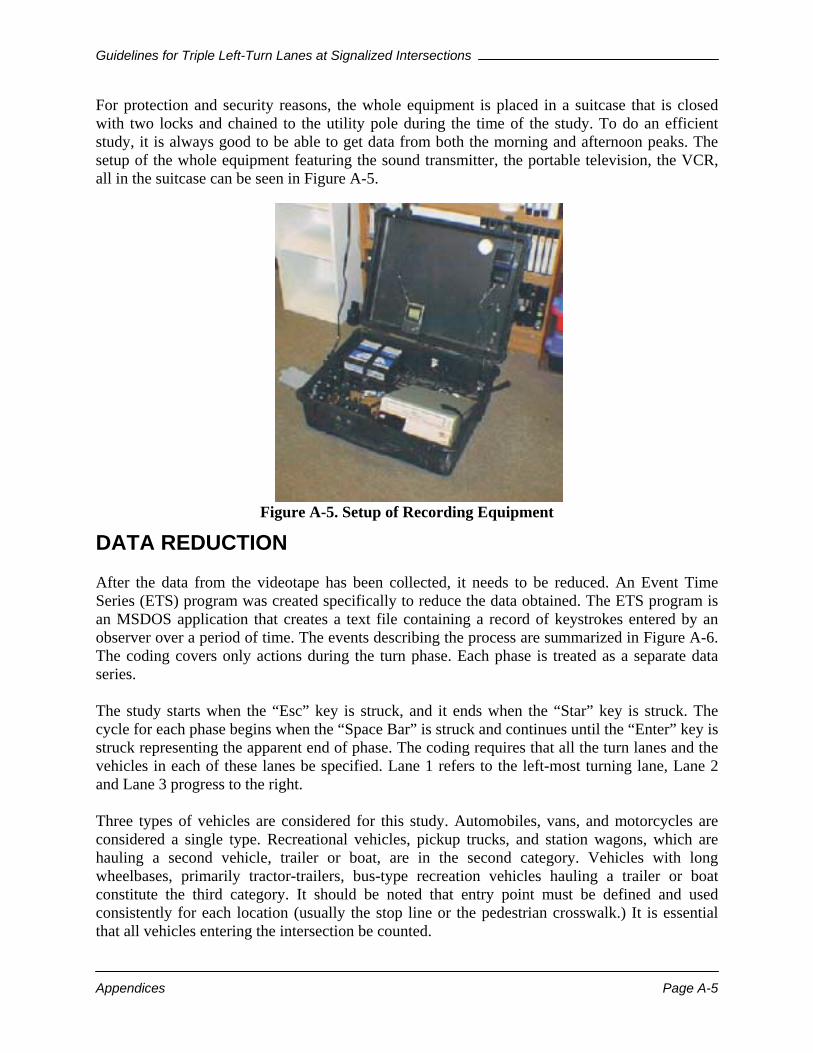
Guidelines for Triple Left-Turn Lanes at Signalized Intersections
Appendices Page A-5
For protection and security reasons, the whole equipment is placed in a suitcase that is closed with two locks and chained to the utility pole during the time of the study. To do an efficient study, it is always good to be able to get data from both the morning and afternoon peaks. The setup of the whole equipment featuring the sound transmitter, the portable television, the VCR, all in the suitcase can be seen in Figure A-5.
Figure A-5. Setup of Recording Equipment
DATA REDUCTION After the data from the videotape has been collected, it needs to be reduced. An Event Time Series (ETS) program was created specifically to reduce the data obtained. The ETS program is an MSDOS application that creates a text file containing a record of keystrokes entered by an observer over a period of time. The events describing the process are summarized in Figure A-6. The coding covers only actions during the turn phase. Each phase is treated as a separate data series. The study starts when the “Esc” key is struck, and it ends when the “Star” key is struck. The cycle for each phase begins when the “Space Bar” is struck and continues until the “Enter” key is struck representing the apparent end of phase. The coding requires that all the turn lanes and the vehicles in each of these lanes be specified. Lane 1 refers to the left-most turning lane, Lane 2 and Lane 3 progress to the right. Three types of vehicles are considered for this study. Automobiles, vans, and motorcycles are considered a single type. Recreational vehicles, pickup trucks, and station wagons, which are hauling a second vehicle, trailer or boat, are in the second category. Vehicles with long wheelbases, primarily tractor-trailers, bus-type recreation vehicles hauling a trailer or boat constitute the third category. It should be noted that entry point must be defined and used consistently for each location (usually the stop line or the pedestrian crosswalk.) It is essential that all vehicles entering the intersection be counted.
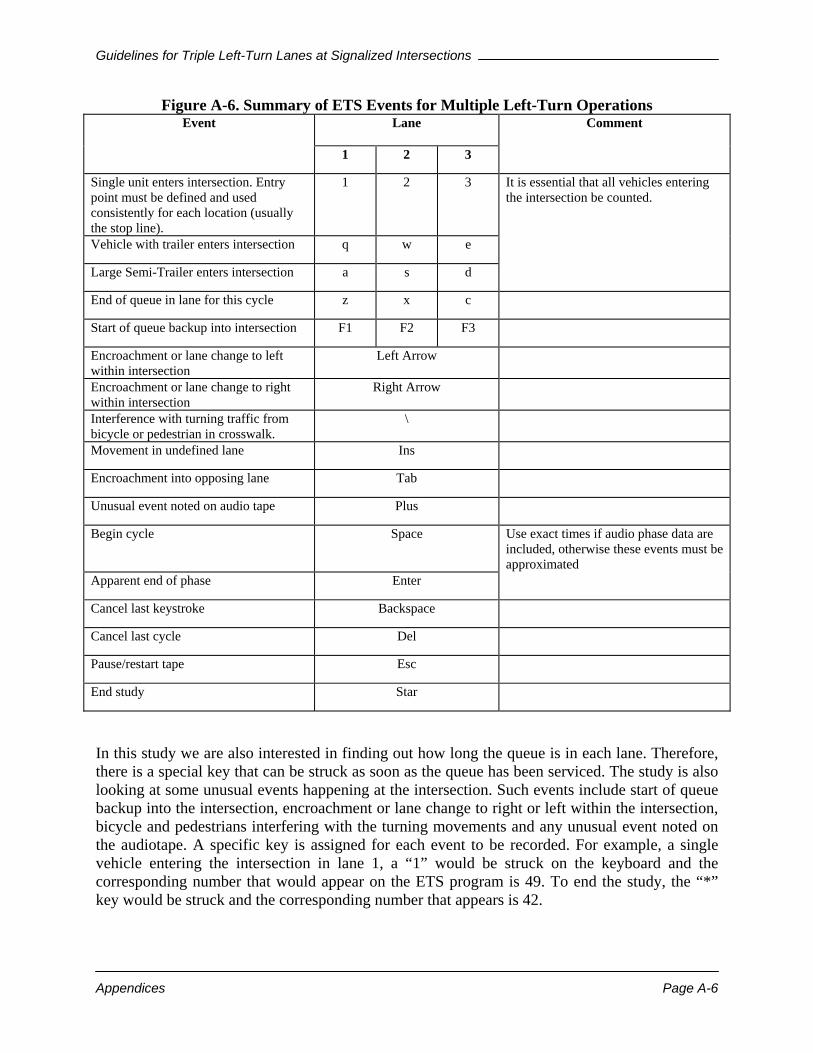
Guidelines for Triple Left-Turn Lanes at Signalized Intersections
Appendices Page A-6
Figure A-6. Summary of ETS Events for Multiple Left-Turn Operations Event Lane Comment
1 2 3
Single unit enters intersection. Entry point must be defined and used consistently for each location (usually the stop line).
1 2 3 It is essential that all vehicles entering the intersection be counted.
Vehicle with trailer enters intersection q w e
Large Semi-Trailer enters intersection a s d
End of queue in lane for this cycle z x c
Start of queue backup into intersection F1 F2 F3
Encroachment or lane change to left within intersection
Left Arrow
Encroachment or lane change to right within intersection
Right Arrow
Interference with turning traffic from bicycle or pedestrian in crosswalk.
\
Movement in undefined lane Ins
Encroachment into opposing lane Tab
Unusual event noted on audio tape Plus
Begin cycle Space Use exact times if audio phase data are included, otherwise these events must be approximated
Apparent end of phase Enter
Cancel last keystroke Backspace
Cancel last cycle Del
Pause/restart tape Esc
End study Star
In this study we are also interested in finding out how long the queue is in each lane. Therefore, there is a special key that can be struck as soon as the queue has been serviced. The study is also looking at some unusual events happening at the intersection. Such events include start of queue backup into the intersection, encroachment or lane change to right or left within the intersection, bicycle and pedestrians interfering with the turning movements and any unusual event noted on the audiotape. A specific key is assigned for each event to be recorded. For example, a single vehicle entering the intersection in lane 1, a “1” would be struck on the keyboard and the corresponding number that would appear on the ETS program is 49. To end the study, the “*” key would be struck and the corresponding number that appears is 42.

Guidelines for Triple Left-Turn Lanes at Signalized Intersections
Appendices Page A-7
The opening screen of the Event Time Series (ETS) program asks for the name of the study which is (MULTS) for multiple left-turns study, the data file name, usually the date that the recording was done, the elapsed time for the each cycle and the entire study, the cycle number, the event number and the number that associated with the key that was struck on the keyboard. An observer watches the videotape and records the left-turn activities in each lane for all the cycle. Each time a vehicle crossed the desired entry point in each of the left-turn lanes, a specific key is struck. When the data from the tape has been entered, the program produces an output that contains the tile “ETS DATA TYPE MULTS,” the name of the file, the date and time that the data was reduced, each event key number and the time that key was struck on the keyboard for each cycle. The output of the ETS program is a text file with the extension “ETS.” DATA ANALYSIS
Once the data from the videotape has been collected and reduced through the ETS program, the next step is to analyze that data. A program called MULTS for (multiple left-turns) was created in the QBASIC programming language to analyze the data from the ETS file. The purpose of the program is to take the information given in the output of the ETS file and obtain some parameters such as average headways, vehicle type, and lane distribution. Figure A-7 shows a part of the output from the MULTS Program. Before running the program, a few questions are asked like the name of the file with extension (ETS), and the number of lanes involved. If both entries are correct, the program runs and produces a comma delimited text file. If one of the entries is incorrect, an error message pops up. The comma delimited text file can be opened in excel for better observations. Following are some of the information contained in the excel output file: cycle number, lane number, start delay, relative start, number of cars, trucks and trailers, number of vehicles in the queue, number of vehicles after the queue as been serviced, average headway and headway for each vehicle. The last two rows of the output show the average values of all the cycles for the start delay, relative start and average headway for lane 1 and 2. The last two rows also show the total number of each type of vehicles that turned left at the intersection, the total number of queued vehicles and total number of vehicles after the queue has been serviced. One of the most important for the study is the average headway. From this value the saturation flow rate for each lane can be found. Other things that are important from the output are lost time, lane distribution, and vehicle classification.

Guidelines for Triple Left-Turn Lanes at Signalized Intersections
Appendices Page A-8
Figure A-7. Sample Output from the MULTS Program Cycle Lane StartDel RelSLT Cars Trailers Trucks Queued Free Av Hdwy
1 1 1.4 0 9 0 0 9 0 1.92 1 2 1.4 0.4 10 0 0 6 4 1.6 2 1 1.5 0.8 9 0 0 9 0 2.2 2 2 1.5 0 10 0 0 8 2 1.95 3 1 0.9 0 7 1 0 8 0 2.25 3 2 0.9 0.7 7 0 0 7 0 2.1 4 1 1.8 0.2 13 0 1 14 0 1.87 4 2 1.8 0 12 0 1 12 1 1.83 5 1 1.5 2 12 0 0 11 1 2.31 5 2 1.5 0 14 0 0 12 2 2.03 6 1 1.3 0.8 14 0 0 9 5 1.8 6 2 1.3 0 12 0 0 7 5 1.7 7 1 1.3 0 0 0 0 0 0 0 7 2 1.3 0 0 0 0 0 0 0 8 1 1.2 0.8 8 0 0 8 0 2.03 8 2 1.2 0 4 0 0 3 1 0 9 1 1.4 1.2 11 0 0 11 0 1.74 9 2 1.4 0 8 0 0 8 0 2.1
10 1 1.2 0.4 10 0 0 9 1 2.06 10 2 1.2 0 11 0 0 10 1 1.87 11 1 1.6 0 11 0 0 10 1 2.1 11 2 1.6 0.8 9 0 0 9 0 2.04 12 1 1.1 1.2 15 0 0 15 0 1.68 12 2 1.1 0 14 0 0 14 0 1.85 13 1 1.3 0.6 13 0 0 12 1 1.89 13 2 1.3 0 11 0 0 10 1 1.55 14 1 1.3 0.6 14 0 0 14 0 1.83 14 2 1.3 0 12 0 0 12 0 1.89 15 1 0.9 0.5 13 0 0 12 1 1.66 15 2 0.9 0 13 0 0 12 1 1.7 16 1 1.8 0.6 9 0 0 8 1 1.8 16 2 1.8 0 8 0 0 7 1 1.7 17 1 1.9 0 7 0 1 8 0 1.88 17 2 1.9 0.4 7 0 0 7 0 2.07 18 1 1.4 0 9 0 0 8 1 2.92 18 2 1.4 2.8 6 0 0 5 1 2 19 1 1.2 0.2 8 0 1 9 0 2.5 19 2 1.2 0 10 0 0 10 0 1.98 20 1 0.9 0 6 0 0 5 1 2 20 2 0.9 1.4 5 0 0 4 1 0
Ave 1 1.34 0.5 198 1 3 189 13 1.92 Ave 2 1.34 0.32 183 0 1 163 21 1.6
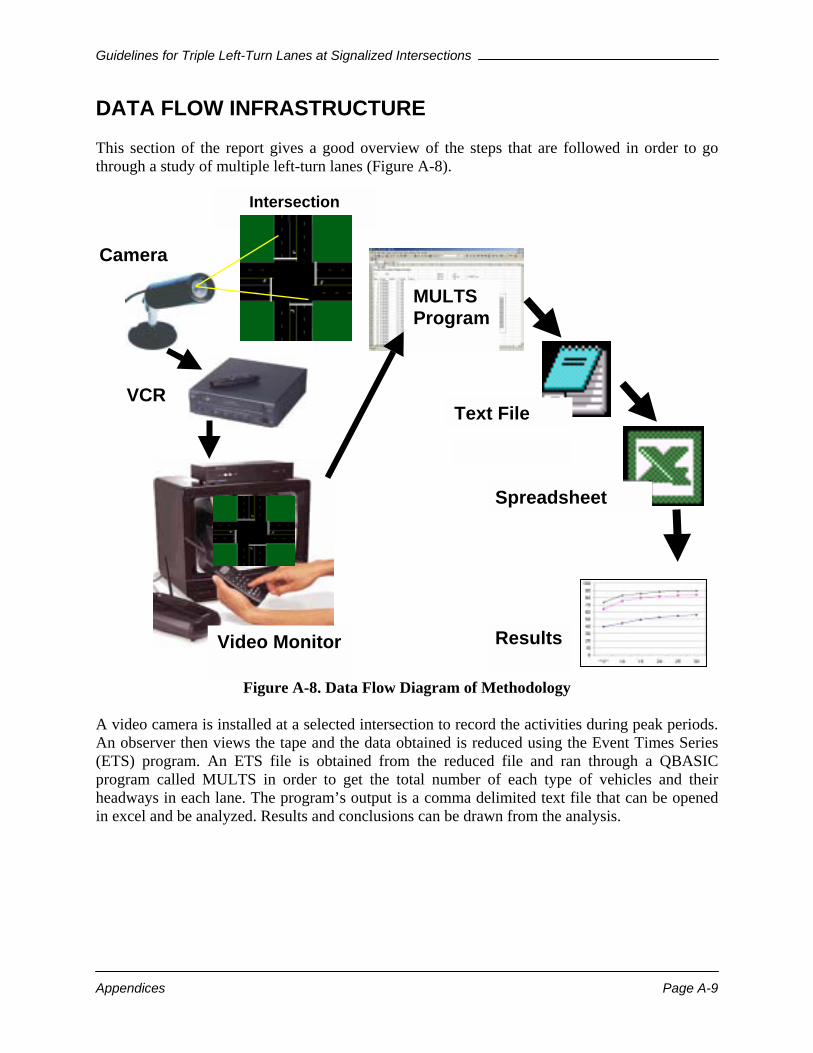
Guidelines for Triple Left-Turn Lanes at Signalized Intersections
Appendices Page A-9
DATA FLOW INFRASTRUCTURE This section of the report gives a good overview of the steps that are followed in order to go through a study of multiple left-turn lanes (Figure A-8).
Figure A-8. Data Flow Diagram of Methodology A video camera is installed at a selected intersection to record the activities during peak periods. An observer then views the tape and the data obtained is reduced using the Event Times Series (ETS) program. An ETS file is obtained from the reduced file and ran through a QBASIC program called MULTS in order to get the total number of each type of vehicles and their headways in each lane. The program’s output is a comma delimited text file that can be opened in excel and be analyzed. Results and conclusions can be drawn from the analysis.
Video Monitor
Spreadsheet
Text File
MULTS Program
VCR
Camera
Results
Intersection
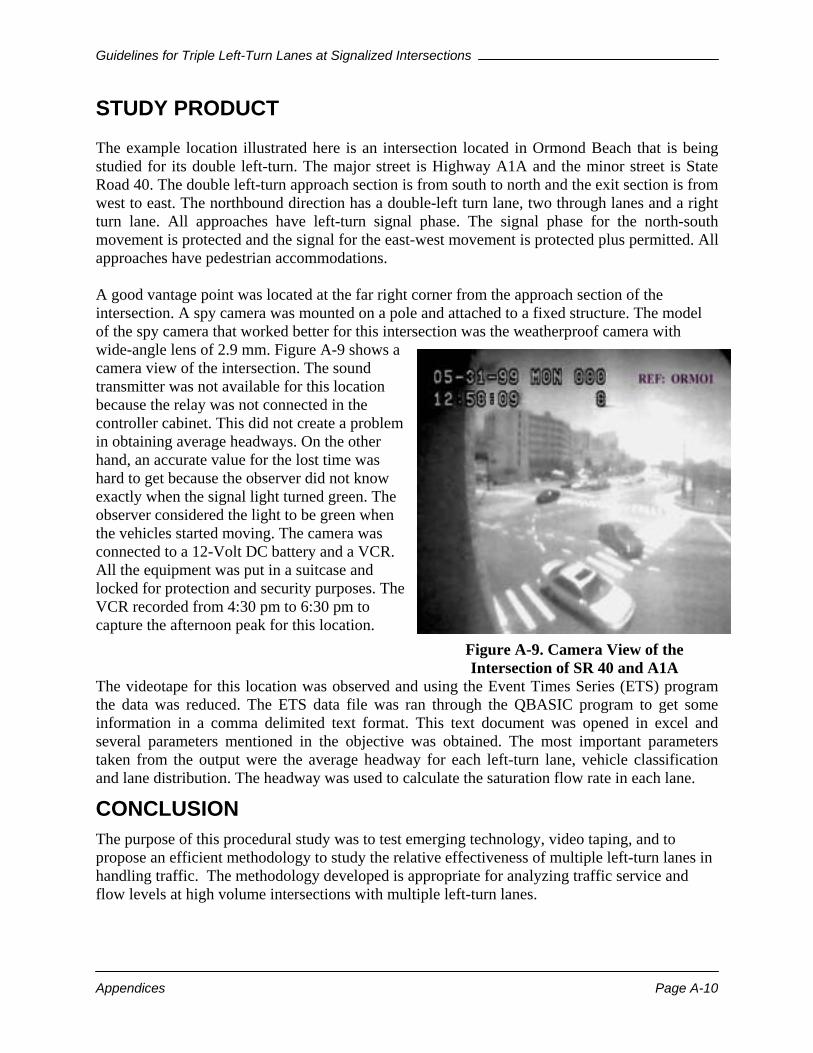
Guidelines for Triple Left-Turn Lanes at Signalized Intersections
Appendices Page A-10
STUDY PRODUCT The example location illustrated here is an intersection located in Ormond Beach that is being studied for its double left-turn. The major street is Highway A1A and the minor street is State Road 40. The double left-turn approach section is from south to north and the exit section is from west to east. The northbound direction has a double-left turn lane, two through lanes and a right turn lane. All approaches have left-turn signal phase. The signal phase for the north-south movement is protected and the signal for the east-west movement is protected plus permitted. All approaches have pedestrian accommodations. A good vantage point was located at the far right corner from the approach section of the intersection. A spy camera was mounted on a pole and attached to a fixed structure. The model of the spy camera that worked better for this intersection was the weatherproof camera with wide-angle lens of 2.9 mm. Figure A-9 shows a camera view of the intersection. The sound transmitter was not available for this location because the relay was not connected in the controller cabinet. This did not create a problem in obtaining average headways. On the other hand, an accurate value for the lost time was hard to get because the observer did not know exactly when the signal light turned green. The observer considered the light to be green when the vehicles started moving. The camera was connected to a 12-Volt DC battery and a VCR. All the equipment was put in a suitcase and locked for protection and security purposes. The VCR recorded from 4:30 pm to 6:30 pm to capture the afternoon peak for this location.
Figure A-9. Camera View of the Intersection of SR 40 and A1A
The videotape for this location was observed and using the Event Times Series (ETS) program the data was reduced. The ETS data file was ran through the QBASIC program to get some information in a comma delimited text format. This text document was opened in excel and several parameters mentioned in the objective was obtained. The most important parameters taken from the output were the average headway for each left-turn lane, vehicle classification and lane distribution. The headway was used to calculate the saturation flow rate in each lane.
CONCLUSION
The purpose of this procedural study was to test emerging technology, video taping, and to propose an efficient methodology to study the relative effectiveness of multiple left-turn lanes in handling traffic. The methodology developed is appropriate for analyzing traffic service and flow levels at high volume intersections with multiple left-turn lanes.

Guidelines for Triple Left Turns at Signalized Intersections
Appendices Page B-1
APPENDIX B – CRASH SUMMARY TABLES FOR DOUBLE LEFT-TURN INTERSECTIONS
Table B-1. Crash Summary Table for SR 814 (Atlantic Blvd.) at SR 849 FLORIDA DEPARTMENT OF TRANSPORTATION
CRASH SUMMARY SECTION: 86130000 STATE ROUTE: 814 (Atlantic Blvd.)
INTERSECTING ROUTE: SR 849 M.P. 3.228 ENGINEER:
STUDY PERIOD: FROM 1/ 95 TO 12/ 97 COUNTY: Broward
No. DATE DAY TIME TYPE FATAL INJURY PROP DAM DAY / NT WET / DRY CONTRIBUTING CAUSE
1 3/19/95 Sun 1900 Rear End 0 0 1 Nite Dry No Improper Driving
2 4/21/95 Fri 2300 Rear End 0 0 1 Nite Dry No Improper Driving
3 4/24/95 Mon 2100 Angle 0 0 1 Nite Dry No Improper Driving
4 6/9/95 Fri 1500 Rear End 0 0 1 Day Dry No Improper Driving
5 7/7/95 Fri 1100 Rear End 0 0 1 Day Dry No Improper Driving
6 7/26/95 Wed 1300 Angle 0 0 1 Day Wet Failed to Yield R/W
7 7/31/95 Mon 2100 Rear End 0 0 1 Nite Wet No Improper Driving
8 8/21/95 Mon 800 Rear End 0 0 1 Day Dry Followed to Closely
9 8/28/95 Mon 700 Rear End 0 0 1 Day Dry No Improper Driving
10 10/19/95 Thu 400 Pedestrian 0 1 0 Nite Wet No Improper Driving
11 10/29/95 Sun 2100 Rear End 0 0 1 Nite Dry All Others
12 12/1/95 Fri 2100 Sideswipe 0 0 1 Nite Dry No Improper Driving
13 12/4/95 Mon 1600 Angle 0 0 1 Day Dry All Others
14 12/7/95 Thu 1500 Angle 0 0 1 Day Dry Failed to Yield R/W
15 12/16/95 Sat 800 Rear End 0 1 0 Day Dry No Improper Driving
16 1/2/96 Tue 1000 Rear End 0 0 1 Day Dry No Improper Driving
17 1/28/96 Sun 100 Left Turn 0 1 0 Nite Dry All Others
18 2/29/96 Thu 1400 Left Turn 0 1 0 Day Dry Failed to Yield R/W
19 4/19/96 Fri 2100 Rear End 0 1 0 Nite Dry All Others
20 4/24/96 Wed 0 Left Turn 0 0 1 Day Slippery Improper Turn
21 4/26/96 Fri 900 Rear End 0 1 0 Day Dry Followed to Closely
22 5/24/96 Fri 1200 Rear End 0 1 0 Day Dry All Others
23 6/1/96 Sat 0 Rear End 0 0 1 Nite Dry No Improper Driving
24 7/5/96 Fri 0 Sideswipe 0 0 1 Nite Dry No Improper Driving
25 7/9/96 Tue 700 Left Turn 0 1 0 Day Dry Disregarded Traffic Signal
26 7/12/96 Fri 1400 Left Turn 0 0 1 Day Dry Failed to Yield R/W
27 9/1/96 Sun 200 Rear End 0 0 1 Nite Wet Alcohol - Under Influence
28 9/26/96 Thu 700 Angle 0 0 1 Day Dry Failed to Yield R/W
29 10/26/96 Sat 1200 Rear End 0 0 1 Day Dry No Improper Driving
30 11/8/96 Fri 1400 Rear End 0 1 0 Day Dry Followed to Closely
31 12/7/96 Sat 1500 Rear End 0 0 1 Day Dry No Improper Driving
32 12/7/96 Sat 2300 Rear End 0 0 1 Nite Slippery All Others
33 12/8/96 Sun 0 Rear End 0 1 0 Nite Wet Followed to Closely
34 12/11/96 Wed 2000 Head On 0 1 0 Nite Dry Failed to Yield R/W
35 12/31/96 Tue 2200 Left Turn 0 1 0 Nite Dry No Improper Driving
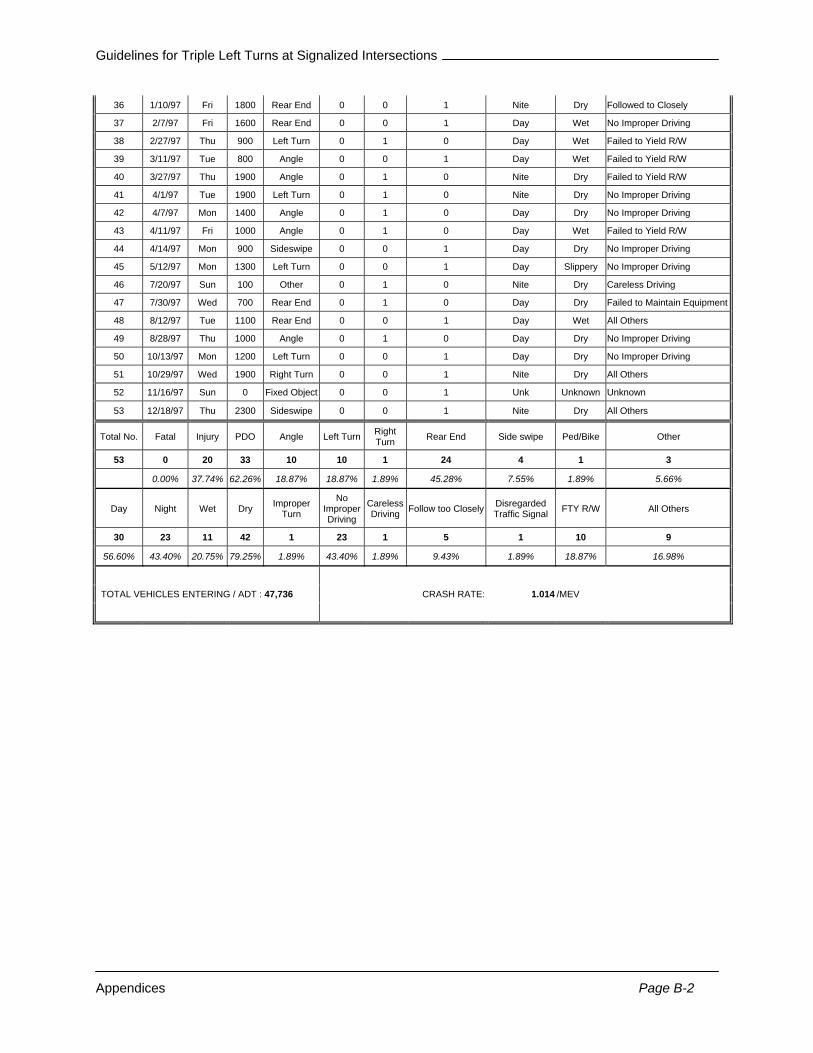
Guidelines for Triple Left Turns at Signalized Intersections
Appendices Page B-2
36 1/10/97 Fri 1800 Rear End 0 0 1 Nite Dry Followed to Closely
37 2/7/97 Fri 1600 Rear End 0 0 1 Day Wet No Improper Driving
38 2/27/97 Thu 900 Left Turn 0 1 0 Day Wet Failed to Yield R/W
39 3/11/97 Tue 800 Angle 0 0 1 Day Wet Failed to Yield R/W
40 3/27/97 Thu 1900 Angle 0 1 0 Nite Dry Failed to Yield R/W
41 4/1/97 Tue 1900 Left Turn 0 1 0 Nite Dry No Improper Driving
42 4/7/97 Mon 1400 Angle 0 1 0 Day Dry No Improper Driving
43 4/11/97 Fri 1000 Angle 0 1 0 Day Wet Failed to Yield R/W
44 4/14/97 Mon 900 Sideswipe 0 0 1 Day Dry No Improper Driving
45 5/12/97 Mon 1300 Left Turn 0 0 1 Day Slippery No Improper Driving
46 7/20/97 Sun 100 Other 0 1 0 Nite Dry Careless Driving
47 7/30/97 Wed 700 Rear End 0 1 0 Day Dry Failed to Maintain Equipment
48 8/12/97 Tue 1100 Rear End 0 0 1 Day Wet All Others
49 8/28/97 Thu 1000 Angle 0 1 0 Day Dry No Improper Driving
50 10/13/97 Mon 1200 Left Turn 0 0 1 Day Dry No Improper Driving
51 10/29/97 Wed 1900 Right Turn 0 0 1 Nite Dry All Others
52 11/16/97 Sun 0 Fixed Object 0 0 1 Unk Unknown Unknown
53 12/18/97 Thu 2300 Sideswipe 0 0 1 Nite Dry All Others
Total No. Fatal Injury PDO Angle Left Turn Right Turn Rear End Side swipe Ped/Bike Other
53 0 20 33 10 10 1 24 4 1 3
0.00% 37.74% 62.26% 18.87% 18.87% 1.89% 45.28% 7.55% 1.89% 5.66%
Day Night Wet Dry Improper Turn
No Improper Driving
Careless Driving Follow too Closely Disregarded
Traffic Signal FTY R/W All Others
30 23 11 42 1 23 1 5 1 10 9
56.60% 43.40% 20.75% 79.25% 1.89% 43.40% 1.89% 9.43% 1.89% 18.87% 16.98%
TOTAL VEHICLES ENTERING / ADT : 47,736 CRASH RATE: 1.014 /MEV
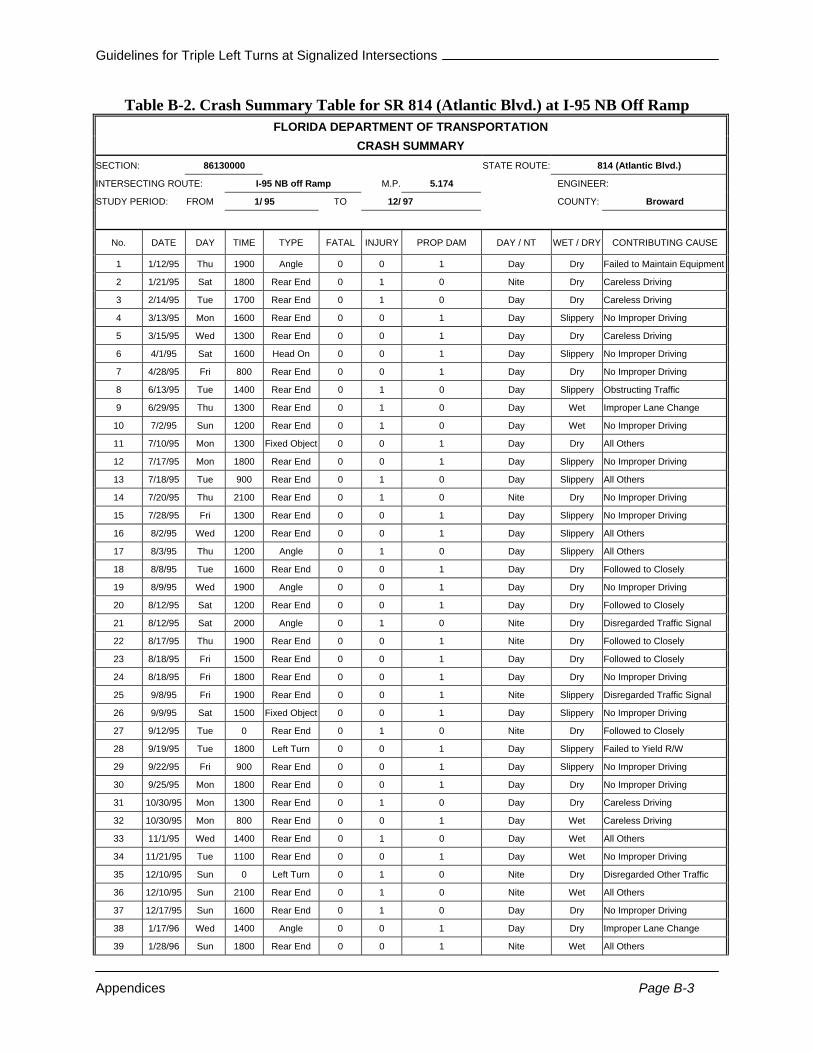
Guidelines for Triple Left Turns at Signalized Intersections
Appendices Page B-3
Table B-2. Crash Summary Table for SR 814 (Atlantic Blvd.) at I-95 NB Off Ramp FLORIDA DEPARTMENT OF TRANSPORTATION
CRASH SUMMARY SECTION: 86130000 STATE ROUTE: 814 (Atlantic Blvd.)
INTERSECTING ROUTE: I-95 NB off Ramp M.P. 5.174 ENGINEER:
STUDY PERIOD: FROM 1/ 95 TO 12/ 97 COUNTY: Broward
No. DATE DAY TIME TYPE FATAL INJURY PROP DAM DAY / NT WET / DRY CONTRIBUTING CAUSE
1 1/12/95 Thu 1900 Angle 0 0 1 Day Dry Failed to Maintain Equipment
2 1/21/95 Sat 1800 Rear End 0 1 0 Nite Dry Careless Driving
3 2/14/95 Tue 1700 Rear End 0 1 0 Day Dry Careless Driving
4 3/13/95 Mon 1600 Rear End 0 0 1 Day Slippery No Improper Driving
5 3/15/95 Wed 1300 Rear End 0 0 1 Day Dry Careless Driving
6 4/1/95 Sat 1600 Head On 0 0 1 Day Slippery No Improper Driving
7 4/28/95 Fri 800 Rear End 0 0 1 Day Dry No Improper Driving
8 6/13/95 Tue 1400 Rear End 0 1 0 Day Slippery Obstructing Traffic
9 6/29/95 Thu 1300 Rear End 0 1 0 Day Wet Improper Lane Change
10 7/2/95 Sun 1200 Rear End 0 1 0 Day Wet No Improper Driving
11 7/10/95 Mon 1300 Fixed Object 0 0 1 Day Dry All Others
12 7/17/95 Mon 1800 Rear End 0 0 1 Day Slippery No Improper Driving
13 7/18/95 Tue 900 Rear End 0 1 0 Day Slippery All Others
14 7/20/95 Thu 2100 Rear End 0 1 0 Nite Dry No Improper Driving
15 7/28/95 Fri 1300 Rear End 0 0 1 Day Slippery No Improper Driving
16 8/2/95 Wed 1200 Rear End 0 0 1 Day Slippery All Others
17 8/3/95 Thu 1200 Angle 0 1 0 Day Slippery All Others
18 8/8/95 Tue 1600 Rear End 0 0 1 Day Dry Followed to Closely
19 8/9/95 Wed 1900 Angle 0 0 1 Day Dry No Improper Driving
20 8/12/95 Sat 1200 Rear End 0 0 1 Day Dry Followed to Closely
21 8/12/95 Sat 2000 Angle 0 1 0 Nite Dry Disregarded Traffic Signal
22 8/17/95 Thu 1900 Rear End 0 0 1 Nite Dry Followed to Closely
23 8/18/95 Fri 1500 Rear End 0 0 1 Day Dry Followed to Closely
24 8/18/95 Fri 1800 Rear End 0 0 1 Day Dry No Improper Driving
25 9/8/95 Fri 1900 Rear End 0 0 1 Nite Slippery Disregarded Traffic Signal
26 9/9/95 Sat 1500 Fixed Object 0 0 1 Day Slippery No Improper Driving
27 9/12/95 Tue 0 Rear End 0 1 0 Nite Dry Followed to Closely
28 9/19/95 Tue 1800 Left Turn 0 0 1 Day Slippery Failed to Yield R/W
29 9/22/95 Fri 900 Rear End 0 0 1 Day Slippery No Improper Driving
30 9/25/95 Mon 1800 Rear End 0 0 1 Day Dry No Improper Driving
31 10/30/95 Mon 1300 Rear End 0 1 0 Day Dry Careless Driving
32 10/30/95 Mon 800 Rear End 0 0 1 Day Wet Careless Driving
33 11/1/95 Wed 1400 Rear End 0 1 0 Day Wet All Others
34 11/21/95 Tue 1100 Rear End 0 0 1 Day Wet No Improper Driving
35 12/10/95 Sun 0 Left Turn 0 1 0 Nite Dry Disregarded Other Traffic
36 12/10/95 Sun 2100 Rear End 0 1 0 Nite Wet All Others
37 12/17/95 Sun 1600 Rear End 0 1 0 Day Dry No Improper Driving
38 1/17/96 Wed 1400 Angle 0 0 1 Day Dry Improper Lane Change
39 1/28/96 Sun 1800 Rear End 0 0 1 Nite Wet All Others
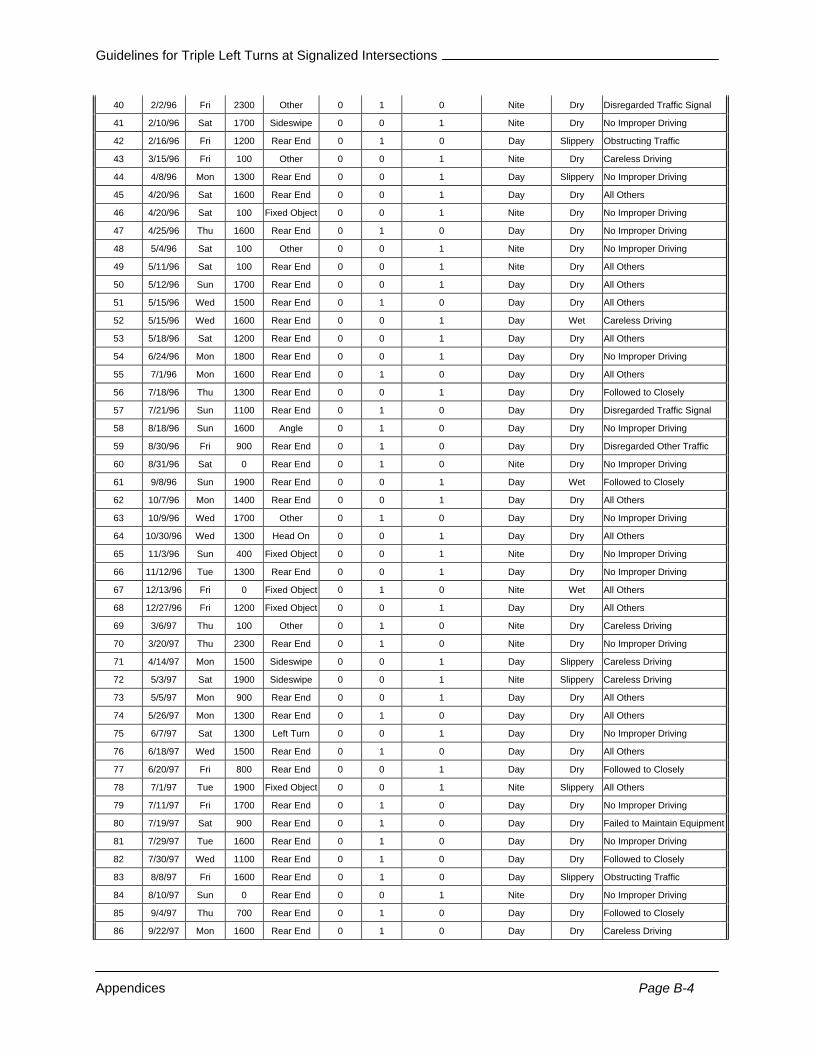
Guidelines for Triple Left Turns at Signalized Intersections
Appendices Page B-4
40 2/2/96 Fri 2300 Other 0 1 0 Nite Dry Disregarded Traffic Signal
41 2/10/96 Sat 1700 Sideswipe 0 0 1 Nite Dry No Improper Driving
42 2/16/96 Fri 1200 Rear End 0 1 0 Day Slippery Obstructing Traffic
43 3/15/96 Fri 100 Other 0 0 1 Nite Dry Careless Driving
44 4/8/96 Mon 1300 Rear End 0 0 1 Day Slippery No Improper Driving
45 4/20/96 Sat 1600 Rear End 0 0 1 Day Dry All Others
46 4/20/96 Sat 100 Fixed Object 0 0 1 Nite Dry No Improper Driving
47 4/25/96 Thu 1600 Rear End 0 1 0 Day Dry No Improper Driving
48 5/4/96 Sat 100 Other 0 0 1 Nite Dry No Improper Driving
49 5/11/96 Sat 100 Rear End 0 0 1 Nite Dry All Others
50 5/12/96 Sun 1700 Rear End 0 0 1 Day Dry All Others
51 5/15/96 Wed 1500 Rear End 0 1 0 Day Dry All Others
52 5/15/96 Wed 1600 Rear End 0 0 1 Day Wet Careless Driving
53 5/18/96 Sat 1200 Rear End 0 0 1 Day Dry All Others
54 6/24/96 Mon 1800 Rear End 0 0 1 Day Dry No Improper Driving
55 7/1/96 Mon 1600 Rear End 0 1 0 Day Dry All Others
56 7/18/96 Thu 1300 Rear End 0 0 1 Day Dry Followed to Closely
57 7/21/96 Sun 1100 Rear End 0 1 0 Day Dry Disregarded Traffic Signal
58 8/18/96 Sun 1600 Angle 0 1 0 Day Dry No Improper Driving
59 8/30/96 Fri 900 Rear End 0 1 0 Day Dry Disregarded Other Traffic
60 8/31/96 Sat 0 Rear End 0 1 0 Nite Dry No Improper Driving
61 9/8/96 Sun 1900 Rear End 0 0 1 Day Wet Followed to Closely
62 10/7/96 Mon 1400 Rear End 0 0 1 Day Dry All Others
63 10/9/96 Wed 1700 Other 0 1 0 Day Dry No Improper Driving
64 10/30/96 Wed 1300 Head On 0 0 1 Day Dry All Others
65 11/3/96 Sun 400 Fixed Object 0 0 1 Nite Dry No Improper Driving
66 11/12/96 Tue 1300 Rear End 0 0 1 Day Dry No Improper Driving
67 12/13/96 Fri 0 Fixed Object 0 1 0 Nite Wet All Others
68 12/27/96 Fri 1200 Fixed Object 0 0 1 Day Dry All Others
69 3/6/97 Thu 100 Other 0 1 0 Nite Dry Careless Driving
70 3/20/97 Thu 2300 Rear End 0 1 0 Nite Dry No Improper Driving
71 4/14/97 Mon 1500 Sideswipe 0 0 1 Day Slippery Careless Driving
72 5/3/97 Sat 1900 Sideswipe 0 0 1 Nite Slippery Careless Driving
73 5/5/97 Mon 900 Rear End 0 0 1 Day Dry All Others
74 5/26/97 Mon 1300 Rear End 0 1 0 Day Dry All Others
75 6/7/97 Sat 1300 Left Turn 0 0 1 Day Dry No Improper Driving
76 6/18/97 Wed 1500 Rear End 0 1 0 Day Dry All Others
77 6/20/97 Fri 800 Rear End 0 0 1 Day Dry Followed to Closely
78 7/1/97 Tue 1900 Fixed Object 0 0 1 Nite Slippery All Others
79 7/11/97 Fri 1700 Rear End 0 1 0 Day Dry No Improper Driving
80 7/19/97 Sat 900 Rear End 0 1 0 Day Dry Failed to Maintain Equipment
81 7/29/97 Tue 1600 Rear End 0 1 0 Day Dry No Improper Driving
82 7/30/97 Wed 1100 Rear End 0 1 0 Day Dry Followed to Closely
83 8/8/97 Fri 1600 Rear End 0 1 0 Day Slippery Obstructing Traffic
84 8/10/97 Sun 0 Rear End 0 0 1 Nite Dry No Improper Driving
85 9/4/97 Thu 700 Rear End 0 1 0 Day Dry Followed to Closely
86 9/22/97 Mon 1600 Rear End 0 1 0 Day Dry Careless Driving
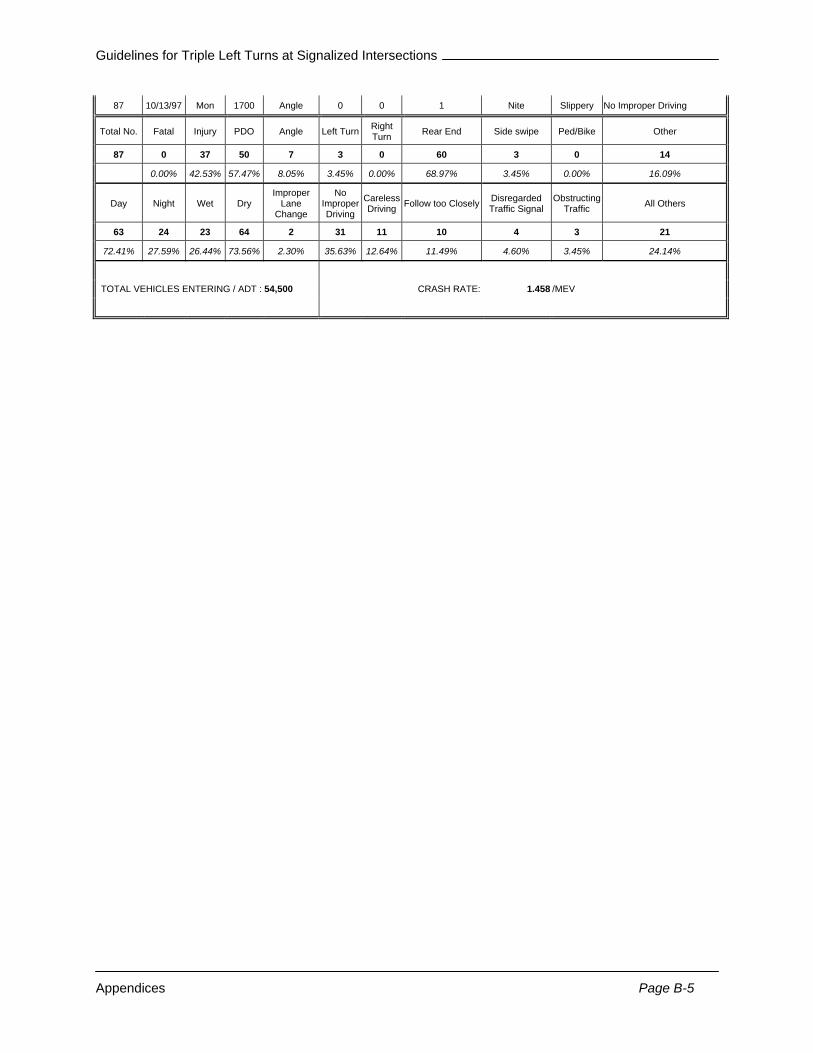
Guidelines for Triple Left Turns at Signalized Intersections
Appendices Page B-5
87 10/13/97 Mon 1700 Angle 0 0 1 Nite Slippery No Improper Driving
Total No. Fatal Injury PDO Angle Left Turn Right Turn Rear End Side swipe Ped/Bike Other
87 0 37 50 7 3 0 60 3 0 14
0.00% 42.53% 57.47% 8.05% 3.45% 0.00% 68.97% 3.45% 0.00% 16.09%
Day Night Wet Dry Improper
Lane Change
No Improper Driving
Careless Driving Follow too Closely Disregarded
Traffic Signal Obstructing
Traffic All Others
63 24 23 64 2 31 11 10 4 3 21
72.41% 27.59% 26.44% 73.56% 2.30% 35.63% 12.64% 11.49% 4.60% 3.45% 24.14%
TOTAL VEHICLES ENTERING / ADT : 54,500 CRASH RATE: 1.458 /MEV
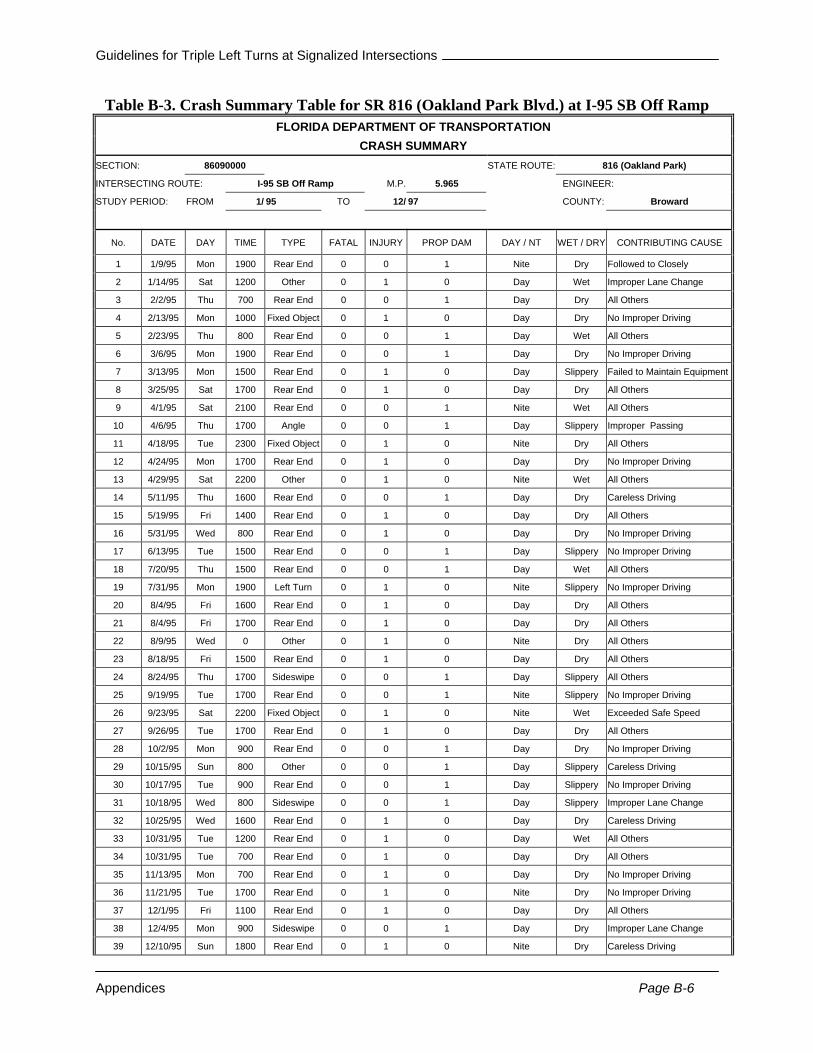
Guidelines for Triple Left Turns at Signalized Intersections
Appendices Page B-6
Table B-3. Crash Summary Table for SR 816 (Oakland Park Blvd.) at I-95 SB Off Ramp FLORIDA DEPARTMENT OF TRANSPORTATION
CRASH SUMMARY SECTION: 86090000 STATE ROUTE: 816 (Oakland Park)
INTERSECTING ROUTE: I-95 SB Off Ramp M.P. 5.965 ENGINEER:
STUDY PERIOD: FROM 1/ 95 TO 12/ 97 COUNTY: Broward
No. DATE DAY TIME TYPE FATAL INJURY PROP DAM DAY / NT WET / DRY CONTRIBUTING CAUSE
1 1/9/95 Mon 1900 Rear End 0 0 1 Nite Dry Followed to Closely
2 1/14/95 Sat 1200 Other 0 1 0 Day Wet Improper Lane Change
3 2/2/95 Thu 700 Rear End 0 0 1 Day Dry All Others
4 2/13/95 Mon 1000 Fixed Object 0 1 0 Day Dry No Improper Driving
5 2/23/95 Thu 800 Rear End 0 0 1 Day Wet All Others
6 3/6/95 Mon 1900 Rear End 0 0 1 Day Dry No Improper Driving
7 3/13/95 Mon 1500 Rear End 0 1 0 Day Slippery Failed to Maintain Equipment
8 3/25/95 Sat 1700 Rear End 0 1 0 Day Dry All Others
9 4/1/95 Sat 2100 Rear End 0 0 1 Nite Wet All Others
10 4/6/95 Thu 1700 Angle 0 0 1 Day Slippery Improper Passing
11 4/18/95 Tue 2300 Fixed Object 0 1 0 Nite Dry All Others
12 4/24/95 Mon 1700 Rear End 0 1 0 Day Dry No Improper Driving
13 4/29/95 Sat 2200 Other 0 1 0 Nite Wet All Others
14 5/11/95 Thu 1600 Rear End 0 0 1 Day Dry Careless Driving
15 5/19/95 Fri 1400 Rear End 0 1 0 Day Dry All Others
16 5/31/95 Wed 800 Rear End 0 1 0 Day Dry No Improper Driving
17 6/13/95 Tue 1500 Rear End 0 0 1 Day Slippery No Improper Driving
18 7/20/95 Thu 1500 Rear End 0 0 1 Day Wet All Others
19 7/31/95 Mon 1900 Left Turn 0 1 0 Nite Slippery No Improper Driving
20 8/4/95 Fri 1600 Rear End 0 1 0 Day Dry All Others
21 8/4/95 Fri 1700 Rear End 0 1 0 Day Dry All Others
22 8/9/95 Wed 0 Other 0 1 0 Nite Dry All Others
23 8/18/95 Fri 1500 Rear End 0 1 0 Day Dry All Others
24 8/24/95 Thu 1700 Sideswipe 0 0 1 Day Slippery All Others
25 9/19/95 Tue 1700 Rear End 0 0 1 Nite Slippery No Improper Driving
26 9/23/95 Sat 2200 Fixed Object 0 1 0 Nite Wet Exceeded Safe Speed
27 9/26/95 Tue 1700 Rear End 0 1 0 Day Dry All Others
28 10/2/95 Mon 900 Rear End 0 0 1 Day Dry No Improper Driving
29 10/15/95 Sun 800 Other 0 0 1 Day Slippery Careless Driving
30 10/17/95 Tue 900 Rear End 0 0 1 Day Slippery No Improper Driving
31 10/18/95 Wed 800 Sideswipe 0 0 1 Day Slippery Improper Lane Change
32 10/25/95 Wed 1600 Rear End 0 1 0 Day Dry Careless Driving
33 10/31/95 Tue 1200 Rear End 0 1 0 Day Wet All Others
34 10/31/95 Tue 700 Rear End 0 1 0 Day Dry All Others
35 11/13/95 Mon 700 Rear End 0 1 0 Day Dry No Improper Driving
36 11/21/95 Tue 1700 Rear End 0 1 0 Nite Dry No Improper Driving
37 12/1/95 Fri 1100 Rear End 0 1 0 Day Dry All Others
38 12/4/95 Mon 900 Sideswipe 0 0 1 Day Dry Improper Lane Change
39 12/10/95 Sun 1800 Rear End 0 1 0 Nite Dry Careless Driving

Guidelines for Triple Left Turns at Signalized Intersections
Appendices Page B-7
40 12/10/95 Sun 2300 Rear End 0 0 1 Nite Dry Followed to Closely
41 12/14/95 Thu 800 Rear End 0 1 0 Day Dry No Improper Driving
42 1/1/96 Mon 200 Rear End 0 0 1 Nite Wet No Improper Driving
43 1/10/96 Wed 2300 Fixed Object 0 0 1 Nite Dry Improper Turn
44 1/22/96 Mon 1500 Rear End 0 1 0 Day Dry Followed to Closely
45 1/24/96 Wed 1300 Angle 0 1 0 Day Dry All Others
46 1/27/96 Sat 0 Rear End 0 0 1 Day Dry All Others
47 1/28/96 Sun 0 Left Turn 0 1 0 Nite Dry Disregarded Traffic Signal
48 2/4/96 Sun 1900 Rear End 0 1 0 Nite Dry Followed to Closely
49 2/7/96 Wed 1300 Rear End 0 1 0 Day Dry Careless Driving
50 2/9/96 Fri 1100 Rear End 0 1 0 Day Dry Careless Driving
51 2/15/96 Thu 2100 Rear End 0 0 1 Nite Dry Followed to Closely
52 2/27/96 Tue 1700 Rear End 0 0 1 Day Dry No Improper Driving
53 3/4/96 Mon 600 Rear End 0 0 1 Day Dry All Others
54 3/26/96 Tue 2000 Rear End 0 1 0 Nite Dry Careless Driving
55 4/21/96 Sun 2100 Rear End 0 0 1 Nite Dry No Improper Driving
56 4/24/96 Wed 600 Rear End 0 1 0 Day Dry Followed to Closely
57 4/24/96 Wed 700 Fixed Object 0 1 0 Day Dry No Improper Driving
58 5/14/96 Tue 1300 Sideswipe 0 1 0 Day Dry Improper Lane Change
59 5/24/96 Fri 900 Rear End 0 1 0 Day Dry Followed to Closely
60 6/4/96 Tue 1000 Rear End 0 1 0 Day Slippery Followed to Closely
61 6/5/96 Wed 2100 Left Turn 0 1 0 Nite Dry Disregarded Traffic Signal
62 6/8/96 Sat 2100 Left Turn 0 0 1 Day Dry All Others
63 7/23/96 Tue 1700 Rear End 0 1 0 Day Dry No Improper Driving
64 7/30/96 Tue 2200 Fixed Object 0 1 0 Nite Dry No Improper Driving
65 8/2/96 Fri 1500 Rear End 0 1 0 Day Dry Followed to Closely
66 8/16/96 Fri 1500 Rear End 0 1 0 Day Wet No Improper Driving
67 8/23/96 Fri 1700 Rear End 0 1 0 Day Wet Followed to Closely
68 8/26/96 Mon 1600 Rear End 0 0 1 Day Slippery Careless Driving
69 9/5/96 Thu 2200 Left Turn 0 0 1 Nite Dry Improper Turn
70 9/12/96 Thu 700 Rear End 0 0 1 Day Dry Followed to Closely
71 9/21/96 Sat 1800 Rear End 0 1 0 Nite Wet Careless Driving
72 9/24/96 Tue 2000 Rear End 0 1 0 Nite Dry No Improper Driving
73 10/28/96 Mon 800 Rear End 0 0 1 Day Dry No Improper Driving
74 11/7/96 Thu 1900 Rear End 0 0 1 Nite Dry Careless Driving
75 11/13/96 Wed 900 Angle 0 0 1 Day Dry Improper Lane Change
76 11/14/96 Thu 1500 Angle 0 1 0 Day Wet Disregarded Traffic Signal
77 11/16/96 Sat 700 Rear End 0 0 1 Day Wet Followed to Closely
78 11/19/96 Tue 1700 Angle 0 0 1 Nite Dry All Others
79 11/20/96 Wed 1400 Rear End 0 1 0 Day Dry Exceeded Safe Speed
80 11/21/96 Thu 700 Angle 0 0 1 Day Dry Failed to Yield R/W
81 11/23/96 Sat 1700 Angle 0 0 1 Nite Dry Disregarded Other Traffic
82 11/24/96 Sun 2200 Angle 0 1 0 Nite Dry No Improper Driving
83 12/9/96 Mon 1800 Rear End 0 1 0 Nite Dry No Improper Driving
84 12/11/96 Wed 1800 Sideswipe 0 0 1 Day Dry Improper Passing
85 12/22/96 Sun 1900 Left Turn 0 1 0 Nite Dry All Others
86 12/22/96 Sun 200 Left Turn 0 0 1 Nite Dry No Improper Driving
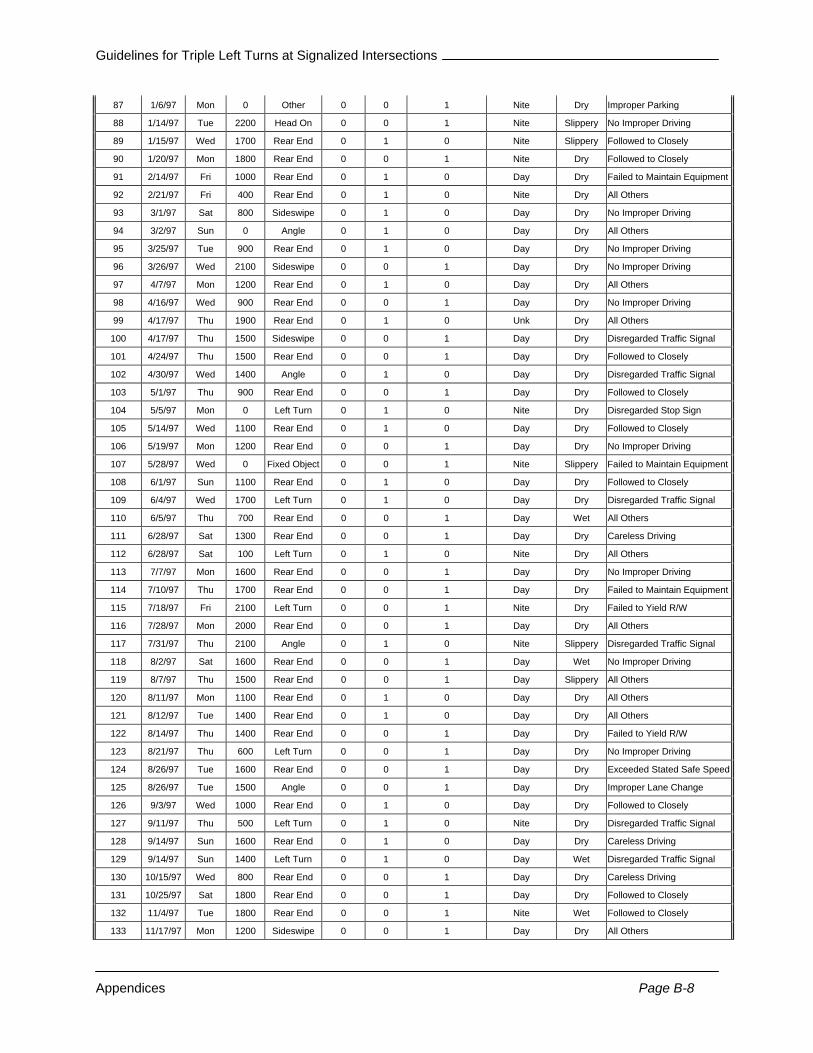
Guidelines for Triple Left Turns at Signalized Intersections
Appendices Page B-8
87 1/6/97 Mon 0 Other 0 0 1 Nite Dry Improper Parking
88 1/14/97 Tue 2200 Head On 0 0 1 Nite Slippery No Improper Driving
89 1/15/97 Wed 1700 Rear End 0 1 0 Nite Slippery Followed to Closely
90 1/20/97 Mon 1800 Rear End 0 0 1 Nite Dry Followed to Closely
91 2/14/97 Fri 1000 Rear End 0 1 0 Day Dry Failed to Maintain Equipment
92 2/21/97 Fri 400 Rear End 0 1 0 Nite Dry All Others
93 3/1/97 Sat 800 Sideswipe 0 1 0 Day Dry No Improper Driving
94 3/2/97 Sun 0 Angle 0 1 0 Day Dry All Others
95 3/25/97 Tue 900 Rear End 0 1 0 Day Dry No Improper Driving
96 3/26/97 Wed 2100 Sideswipe 0 0 1 Day Dry No Improper Driving
97 4/7/97 Mon 1200 Rear End 0 1 0 Day Dry All Others
98 4/16/97 Wed 900 Rear End 0 0 1 Day Dry No Improper Driving
99 4/17/97 Thu 1900 Rear End 0 1 0 Unk Dry All Others
100 4/17/97 Thu 1500 Sideswipe 0 0 1 Day Dry Disregarded Traffic Signal
101 4/24/97 Thu 1500 Rear End 0 0 1 Day Dry Followed to Closely
102 4/30/97 Wed 1400 Angle 0 1 0 Day Dry Disregarded Traffic Signal
103 5/1/97 Thu 900 Rear End 0 0 1 Day Dry Followed to Closely
104 5/5/97 Mon 0 Left Turn 0 1 0 Nite Dry Disregarded Stop Sign
105 5/14/97 Wed 1100 Rear End 0 1 0 Day Dry Followed to Closely
106 5/19/97 Mon 1200 Rear End 0 0 1 Day Dry No Improper Driving
107 5/28/97 Wed 0 Fixed Object 0 0 1 Nite Slippery Failed to Maintain Equipment
108 6/1/97 Sun 1100 Rear End 0 1 0 Day Dry Followed to Closely
109 6/4/97 Wed 1700 Left Turn 0 1 0 Day Dry Disregarded Traffic Signal
110 6/5/97 Thu 700 Rear End 0 0 1 Day Wet All Others
111 6/28/97 Sat 1300 Rear End 0 0 1 Day Dry Careless Driving
112 6/28/97 Sat 100 Left Turn 0 1 0 Nite Dry All Others
113 7/7/97 Mon 1600 Rear End 0 0 1 Day Dry No Improper Driving
114 7/10/97 Thu 1700 Rear End 0 0 1 Day Dry Failed to Maintain Equipment
115 7/18/97 Fri 2100 Left Turn 0 0 1 Nite Dry Failed to Yield R/W
116 7/28/97 Mon 2000 Rear End 0 0 1 Day Dry All Others
117 7/31/97 Thu 2100 Angle 0 1 0 Nite Slippery Disregarded Traffic Signal
118 8/2/97 Sat 1600 Rear End 0 0 1 Day Wet No Improper Driving
119 8/7/97 Thu 1500 Rear End 0 0 1 Day Slippery All Others
120 8/11/97 Mon 1100 Rear End 0 1 0 Day Dry All Others
121 8/12/97 Tue 1400 Rear End 0 1 0 Day Dry All Others
122 8/14/97 Thu 1400 Rear End 0 0 1 Day Dry Failed to Yield R/W
123 8/21/97 Thu 600 Left Turn 0 0 1 Day Dry No Improper Driving
124 8/26/97 Tue 1600 Rear End 0 0 1 Day Dry Exceeded Stated Safe Speed
125 8/26/97 Tue 1500 Angle 0 0 1 Day Dry Improper Lane Change
126 9/3/97 Wed 1000 Rear End 0 1 0 Day Dry Followed to Closely
127 9/11/97 Thu 500 Left Turn 0 1 0 Nite Dry Disregarded Traffic Signal
128 9/14/97 Sun 1600 Rear End 0 1 0 Day Dry Careless Driving
129 9/14/97 Sun 1400 Left Turn 0 1 0 Day Wet Disregarded Traffic Signal
130 10/15/97 Wed 800 Rear End 0 0 1 Day Dry Careless Driving
131 10/25/97 Sat 1800 Rear End 0 0 1 Day Dry Followed to Closely
132 11/4/97 Tue 1800 Rear End 0 0 1 Nite Wet Followed to Closely
133 11/17/97 Mon 1200 Sideswipe 0 0 1 Day Dry All Others

Guidelines for Triple Left Turns at Signalized Intersections
Appendices Page B-9
134 11/23/97 Sun 200 Sideswipe 0 1 0 Nite Wet No Improper Driving
135 12/2/97 Tue 500 Rear End 0 0 1 Nite Wet No Improper Driving
136 12/13/97 Sat 2200 Angle 0 0 1 Nite Dry No Improper Driving
137 12/26/97 Fri 400 Left Turn 0 1 0 Nite Dry No Improper Driving
138 12/30/97 Tue 1000 Sideswipe 0 0 1 Day Dry Improper Lane Change
Total No. Fatal Injury PDO Angle Left Turn Right Turn Rear End Side swipe Ped/Bike Other
138 0 72 66 13 15 0 86 11 0 13
0.00% 52.17% 47.83% 9.42% 10.87% 0.00% 62.32% 7.97% 0.00% 9.42%
Day Night Wet Dry Improper
Lane Change
No Improper Driving
Careless Driving Follow too Closely Disregarded
Traffic Signal FTY R/W All Others
91 47 27 111 7 37 13 21 9 3 34
65.94% 34.06% 19.57% 80.43% 5.07% 26.81% 9.42% 15.22% 6.52% 2.17% 24.64%
TOTAL VEHICLES ENTERING / ADT : 64,500 CRASH RATE: 1.954 /MEV
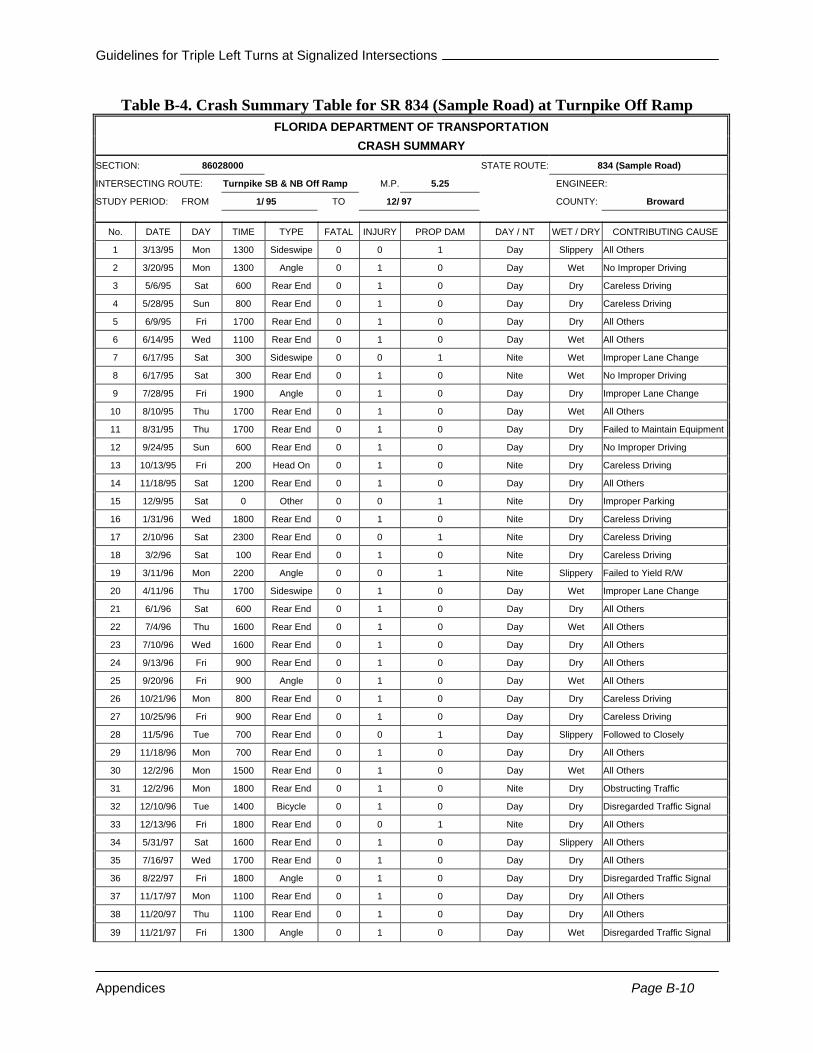
Guidelines for Triple Left Turns at Signalized Intersections
Appendices Page B-10
Table B-4. Crash Summary Table for SR 834 (Sample Road) at Turnpike Off Ramp FLORIDA DEPARTMENT OF TRANSPORTATION
CRASH SUMMARY SECTION: 86028000 STATE ROUTE: 834 (Sample Road)
INTERSECTING ROUTE: Turnpike SB & NB Off Ramp M.P. 5.25 ENGINEER:
STUDY PERIOD: FROM 1/ 95 TO 12/ 97 COUNTY: Broward
No. DATE DAY TIME TYPE FATAL INJURY PROP DAM DAY / NT WET / DRY CONTRIBUTING CAUSE
1 3/13/95 Mon 1300 Sideswipe 0 0 1 Day Slippery All Others
2 3/20/95 Mon 1300 Angle 0 1 0 Day Wet No Improper Driving
3 5/6/95 Sat 600 Rear End 0 1 0 Day Dry Careless Driving
4 5/28/95 Sun 800 Rear End 0 1 0 Day Dry Careless Driving
5 6/9/95 Fri 1700 Rear End 0 1 0 Day Dry All Others
6 6/14/95 Wed 1100 Rear End 0 1 0 Day Wet All Others
7 6/17/95 Sat 300 Sideswipe 0 0 1 Nite Wet Improper Lane Change
8 6/17/95 Sat 300 Rear End 0 1 0 Nite Wet No Improper Driving
9 7/28/95 Fri 1900 Angle 0 1 0 Day Dry Improper Lane Change
10 8/10/95 Thu 1700 Rear End 0 1 0 Day Wet All Others
11 8/31/95 Thu 1700 Rear End 0 1 0 Day Dry Failed to Maintain Equipment
12 9/24/95 Sun 600 Rear End 0 1 0 Day Dry No Improper Driving
13 10/13/95 Fri 200 Head On 0 1 0 Nite Dry Careless Driving
14 11/18/95 Sat 1200 Rear End 0 1 0 Day Dry All Others
15 12/9/95 Sat 0 Other 0 0 1 Nite Dry Improper Parking
16 1/31/96 Wed 1800 Rear End 0 1 0 Nite Dry Careless Driving
17 2/10/96 Sat 2300 Rear End 0 0 1 Nite Dry Careless Driving
18 3/2/96 Sat 100 Rear End 0 1 0 Nite Dry Careless Driving
19 3/11/96 Mon 2200 Angle 0 0 1 Nite Slippery Failed to Yield R/W
20 4/11/96 Thu 1700 Sideswipe 0 1 0 Day Wet Improper Lane Change
21 6/1/96 Sat 600 Rear End 0 1 0 Day Dry All Others
22 7/4/96 Thu 1600 Rear End 0 1 0 Day Wet All Others
23 7/10/96 Wed 1600 Rear End 0 1 0 Day Dry All Others
24 9/13/96 Fri 900 Rear End 0 1 0 Day Dry All Others
25 9/20/96 Fri 900 Angle 0 1 0 Day Wet All Others
26 10/21/96 Mon 800 Rear End 0 1 0 Day Dry Careless Driving
27 10/25/96 Fri 900 Rear End 0 1 0 Day Dry Careless Driving
28 11/5/96 Tue 700 Rear End 0 0 1 Day Slippery Followed to Closely
29 11/18/96 Mon 700 Rear End 0 1 0 Day Dry All Others
30 12/2/96 Mon 1500 Rear End 0 1 0 Day Wet All Others
31 12/2/96 Mon 1800 Rear End 0 1 0 Nite Dry Obstructing Traffic
32 12/10/96 Tue 1400 Bicycle 0 1 0 Day Dry Disregarded Traffic Signal
33 12/13/96 Fri 1800 Rear End 0 0 1 Nite Dry All Others
34 5/31/97 Sat 1600 Rear End 0 1 0 Day Slippery All Others
35 7/16/97 Wed 1700 Rear End 0 1 0 Day Dry All Others
36 8/22/97 Fri 1800 Angle 0 1 0 Day Dry Disregarded Traffic Signal
37 11/17/97 Mon 1100 Rear End 0 1 0 Day Dry All Others
38 11/20/97 Thu 1100 Rear End 0 1 0 Day Dry All Others
39 11/21/97 Fri 1300 Angle 0 1 0 Day Wet Disregarded Traffic Signal
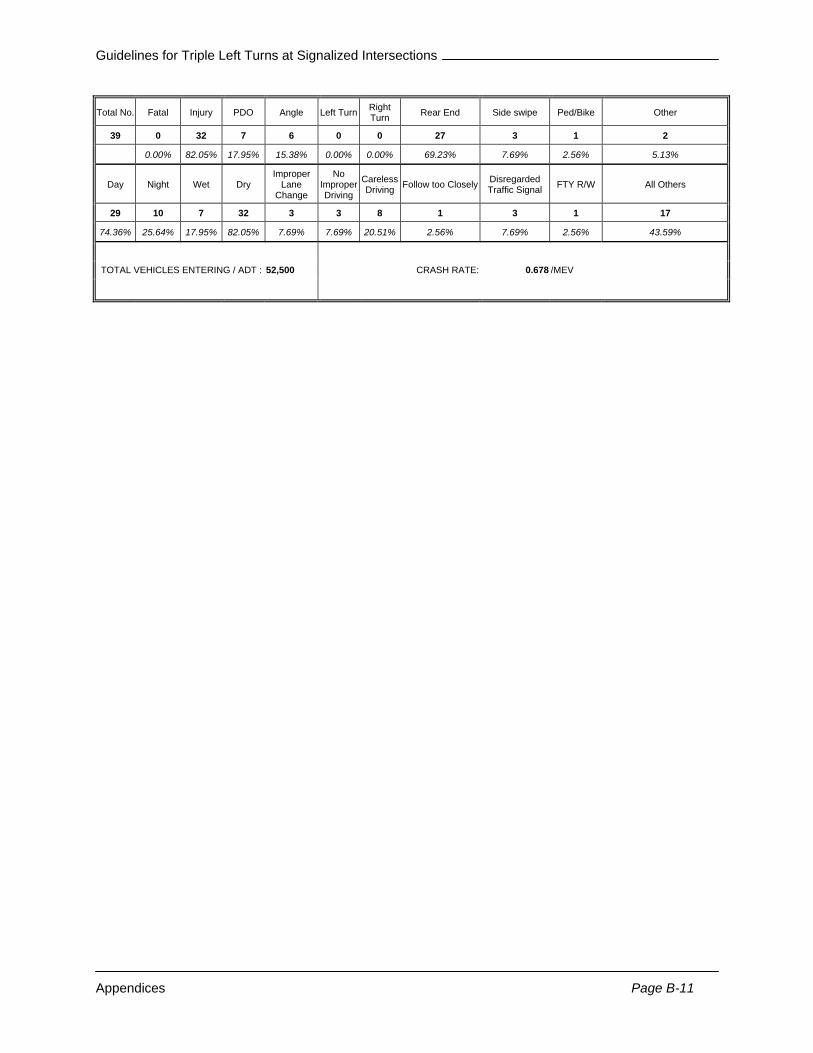
Guidelines for Triple Left Turns at Signalized Intersections
Appendices Page B-11
Total No. Fatal Injury PDO Angle Left Turn Right Turn Rear End Side swipe Ped/Bike Other
39 0 32 7 6 0 0 27 3 1 2
0.00% 82.05% 17.95% 15.38% 0.00% 0.00% 69.23% 7.69% 2.56% 5.13%
Day Night Wet Dry Improper
Lane Change
No Improper Driving
Careless Driving Follow too Closely Disregarded
Traffic Signal FTY R/W All Others
29 10 7 32 3 3 8 1 3 1 17
74.36% 25.64% 17.95% 82.05% 7.69% 7.69% 20.51% 2.56% 7.69% 2.56% 43.59%
TOTAL VEHICLES ENTERING / ADT : 52,500 CRASH RATE: 0.678 /MEV
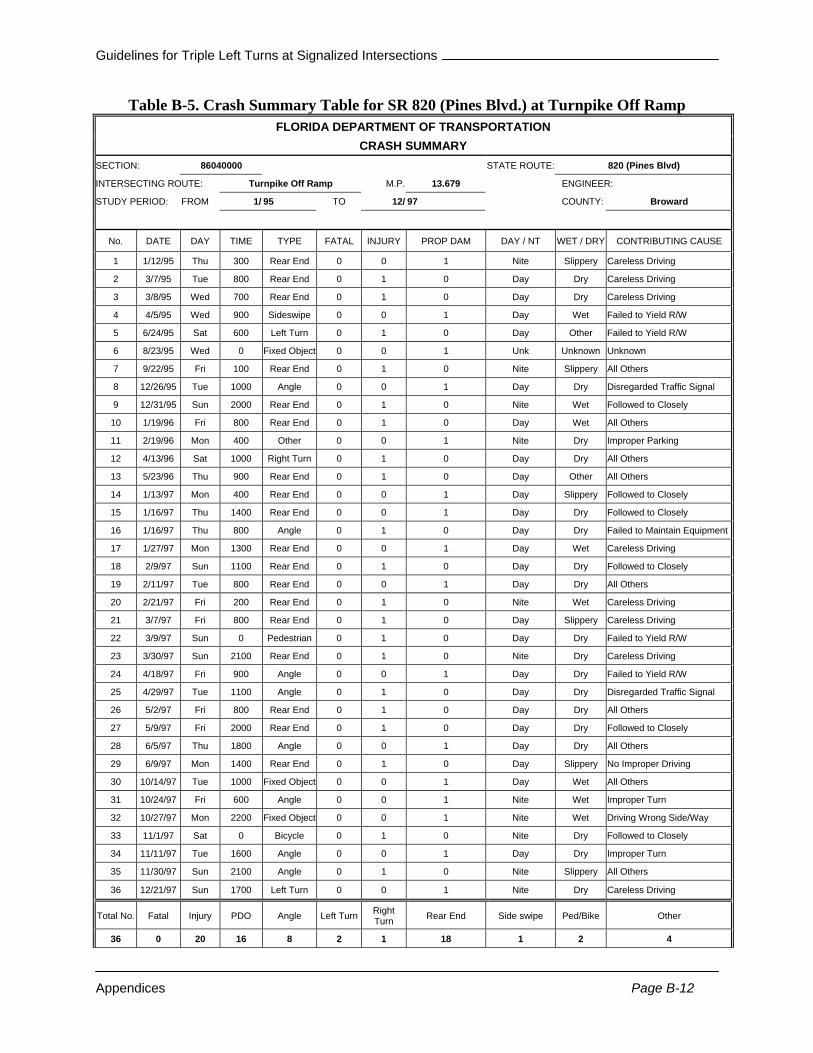
Guidelines for Triple Left Turns at Signalized Intersections
Appendices Page B-12
Table B-5. Crash Summary Table for SR 820 (Pines Blvd.) at Turnpike Off Ramp FLORIDA DEPARTMENT OF TRANSPORTATION
CRASH SUMMARY SECTION: 86040000 STATE ROUTE: 820 (Pines Blvd)
INTERSECTING ROUTE: Turnpike Off Ramp M.P. 13.679 ENGINEER:
STUDY PERIOD: FROM 1/ 95 TO 12/ 97 COUNTY: Broward
No. DATE DAY TIME TYPE FATAL INJURY PROP DAM DAY / NT WET / DRY CONTRIBUTING CAUSE
1 1/12/95 Thu 300 Rear End 0 0 1 Nite Slippery Careless Driving
2 3/7/95 Tue 800 Rear End 0 1 0 Day Dry Careless Driving
3 3/8/95 Wed 700 Rear End 0 1 0 Day Dry Careless Driving
4 4/5/95 Wed 900 Sideswipe 0 0 1 Day Wet Failed to Yield R/W
5 6/24/95 Sat 600 Left Turn 0 1 0 Day Other Failed to Yield R/W
6 8/23/95 Wed 0 Fixed Object 0 0 1 Unk Unknown Unknown
7 9/22/95 Fri 100 Rear End 0 1 0 Nite Slippery All Others
8 12/26/95 Tue 1000 Angle 0 0 1 Day Dry Disregarded Traffic Signal
9 12/31/95 Sun 2000 Rear End 0 1 0 Nite Wet Followed to Closely
10 1/19/96 Fri 800 Rear End 0 1 0 Day Wet All Others
11 2/19/96 Mon 400 Other 0 0 1 Nite Dry Improper Parking
12 4/13/96 Sat 1000 Right Turn 0 1 0 Day Dry All Others
13 5/23/96 Thu 900 Rear End 0 1 0 Day Other All Others
14 1/13/97 Mon 400 Rear End 0 0 1 Day Slippery Followed to Closely
15 1/16/97 Thu 1400 Rear End 0 0 1 Day Dry Followed to Closely
16 1/16/97 Thu 800 Angle 0 1 0 Day Dry Failed to Maintain Equipment
17 1/27/97 Mon 1300 Rear End 0 0 1 Day Wet Careless Driving
18 2/9/97 Sun 1100 Rear End 0 1 0 Day Dry Followed to Closely
19 2/11/97 Tue 800 Rear End 0 0 1 Day Dry All Others
20 2/21/97 Fri 200 Rear End 0 1 0 Nite Wet Careless Driving
21 3/7/97 Fri 800 Rear End 0 1 0 Day Slippery Careless Driving
22 3/9/97 Sun 0 Pedestrian 0 1 0 Day Dry Failed to Yield R/W
23 3/30/97 Sun 2100 Rear End 0 1 0 Nite Dry Careless Driving
24 4/18/97 Fri 900 Angle 0 0 1 Day Dry Failed to Yield R/W
25 4/29/97 Tue 1100 Angle 0 1 0 Day Dry Disregarded Traffic Signal
26 5/2/97 Fri 800 Rear End 0 1 0 Day Dry All Others
27 5/9/97 Fri 2000 Rear End 0 1 0 Day Dry Followed to Closely
28 6/5/97 Thu 1800 Angle 0 0 1 Day Dry All Others
29 6/9/97 Mon 1400 Rear End 0 1 0 Day Slippery No Improper Driving
30 10/14/97 Tue 1000 Fixed Object 0 0 1 Day Wet All Others
31 10/24/97 Fri 600 Angle 0 0 1 Nite Wet Improper Turn
32 10/27/97 Mon 2200 Fixed Object 0 0 1 Nite Wet Driving Wrong Side/Way
33 11/1/97 Sat 0 Bicycle 0 1 0 Nite Dry Followed to Closely
34 11/11/97 Tue 1600 Angle 0 0 1 Day Dry Improper Turn
35 11/30/97 Sun 2100 Angle 0 1 0 Nite Slippery All Others
36 12/21/97 Sun 1700 Left Turn 0 0 1 Nite Dry Careless Driving
Total No. Fatal Injury PDO Angle Left Turn Right Turn Rear End Side swipe Ped/Bike Other
36 0 20 16 8 2 1 18 1 2 4
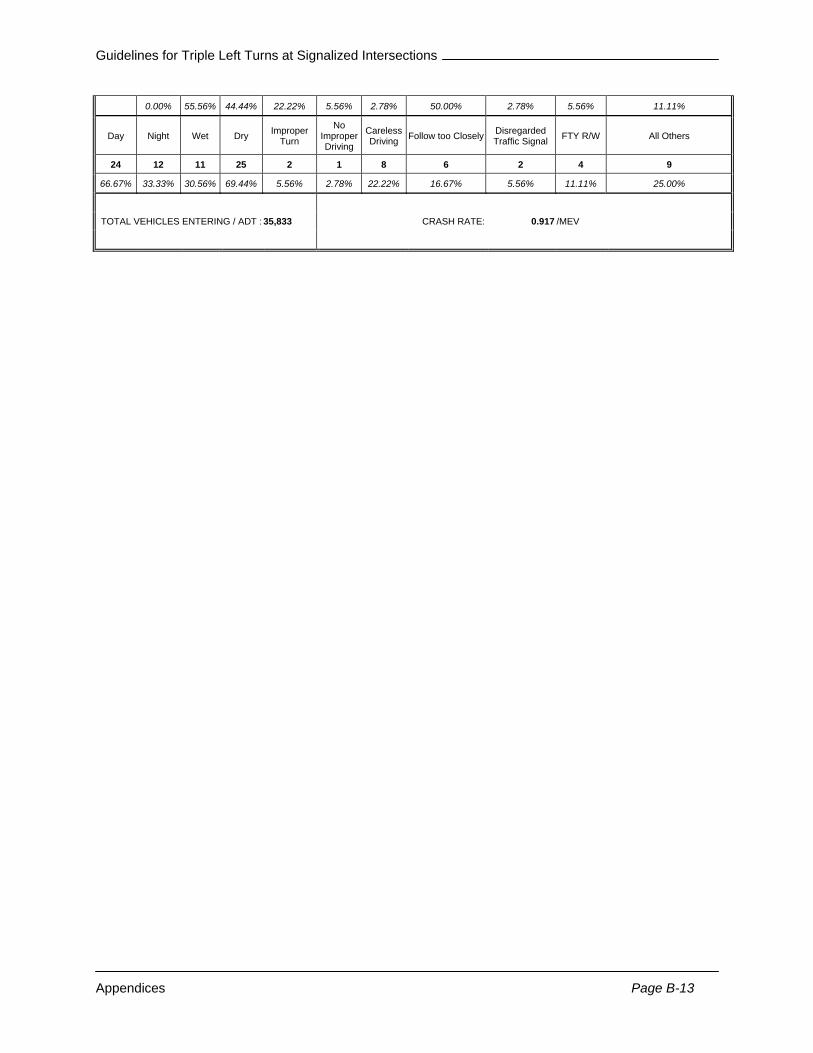
Guidelines for Triple Left Turns at Signalized Intersections
Appendices Page B-13
0.00% 55.56% 44.44% 22.22% 5.56% 2.78% 50.00% 2.78% 5.56% 11.11%
Day Night Wet Dry Improper Turn
No Improper Driving
Careless Driving Follow too Closely Disregarded
Traffic Signal FTY R/W All Others
24 12 11 25 2 1 8 6 2 4 9
66.67% 33.33% 30.56% 69.44% 5.56% 2.78% 22.22% 16.67% 5.56% 11.11% 25.00%
TOTAL VEHICLES ENTERING / ADT : 35,833 CRASH RATE: 0.917 /MEV
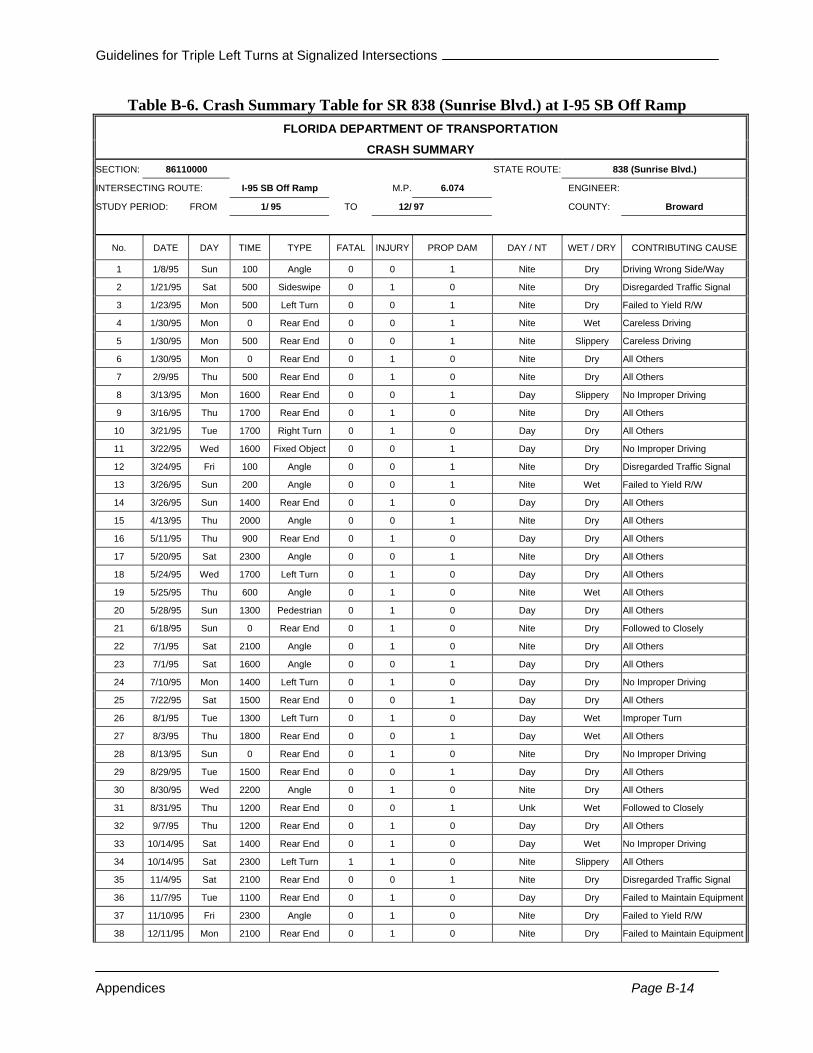
Guidelines for Triple Left Turns at Signalized Intersections
Appendices Page B-14
Table B-6. Crash Summary Table for SR 838 (Sunrise Blvd.) at I-95 SB Off Ramp FLORIDA DEPARTMENT OF TRANSPORTATION
CRASH SUMMARY SECTION: 86110000 STATE ROUTE: 838 (Sunrise Blvd.)
INTERSECTING ROUTE: I-95 SB Off Ramp M.P. 6.074 ENGINEER:
STUDY PERIOD: FROM 1/ 95 TO 12/ 97 COUNTY: Broward
No. DATE DAY TIME TYPE FATAL INJURY PROP DAM DAY / NT WET / DRY CONTRIBUTING CAUSE
1 1/8/95 Sun 100 Angle 0 0 1 Nite Dry Driving Wrong Side/Way
2 1/21/95 Sat 500 Sideswipe 0 1 0 Nite Dry Disregarded Traffic Signal
3 1/23/95 Mon 500 Left Turn 0 0 1 Nite Dry Failed to Yield R/W
4 1/30/95 Mon 0 Rear End 0 0 1 Nite Wet Careless Driving
5 1/30/95 Mon 500 Rear End 0 0 1 Nite Slippery Careless Driving
6 1/30/95 Mon 0 Rear End 0 1 0 Nite Dry All Others
7 2/9/95 Thu 500 Rear End 0 1 0 Nite Dry All Others
8 3/13/95 Mon 1600 Rear End 0 0 1 Day Slippery No Improper Driving
9 3/16/95 Thu 1700 Rear End 0 1 0 Nite Dry All Others
10 3/21/95 Tue 1700 Right Turn 0 1 0 Day Dry All Others
11 3/22/95 Wed 1600 Fixed Object 0 0 1 Day Dry No Improper Driving
12 3/24/95 Fri 100 Angle 0 0 1 Nite Dry Disregarded Traffic Signal
13 3/26/95 Sun 200 Angle 0 0 1 Nite Wet Failed to Yield R/W
14 3/26/95 Sun 1400 Rear End 0 1 0 Day Dry All Others
15 4/13/95 Thu 2000 Angle 0 0 1 Nite Dry All Others
16 5/11/95 Thu 900 Rear End 0 1 0 Day Dry All Others
17 5/20/95 Sat 2300 Angle 0 0 1 Nite Dry All Others
18 5/24/95 Wed 1700 Left Turn 0 1 0 Day Dry All Others
19 5/25/95 Thu 600 Angle 0 1 0 Nite Wet All Others
20 5/28/95 Sun 1300 Pedestrian 0 1 0 Day Dry All Others
21 6/18/95 Sun 0 Rear End 0 1 0 Nite Dry Followed to Closely
22 7/1/95 Sat 2100 Angle 0 1 0 Nite Dry All Others
23 7/1/95 Sat 1600 Angle 0 0 1 Day Dry All Others
24 7/10/95 Mon 1400 Left Turn 0 1 0 Day Dry No Improper Driving
25 7/22/95 Sat 1500 Rear End 0 0 1 Day Dry All Others
26 8/1/95 Tue 1300 Left Turn 0 1 0 Day Wet Improper Turn
27 8/3/95 Thu 1800 Rear End 0 0 1 Day Wet All Others
28 8/13/95 Sun 0 Rear End 0 1 0 Nite Dry No Improper Driving
29 8/29/95 Tue 1500 Rear End 0 0 1 Day Dry All Others
30 8/30/95 Wed 2200 Angle 0 1 0 Nite Dry All Others
31 8/31/95 Thu 1200 Rear End 0 0 1 Unk Wet Followed to Closely
32 9/7/95 Thu 1200 Rear End 0 1 0 Day Dry All Others
33 10/14/95 Sat 1400 Rear End 0 1 0 Day Wet No Improper Driving
34 10/14/95 Sat 2300 Left Turn 1 1 0 Nite Slippery All Others
35 11/4/95 Sat 2100 Rear End 0 0 1 Nite Dry Disregarded Traffic Signal
36 11/7/95 Tue 1100 Rear End 0 1 0 Day Dry Failed to Maintain Equipment
37 11/10/95 Fri 2300 Angle 0 1 0 Nite Dry Failed to Yield R/W
38 12/11/95 Mon 2100 Rear End 0 1 0 Nite Dry Failed to Maintain Equipment
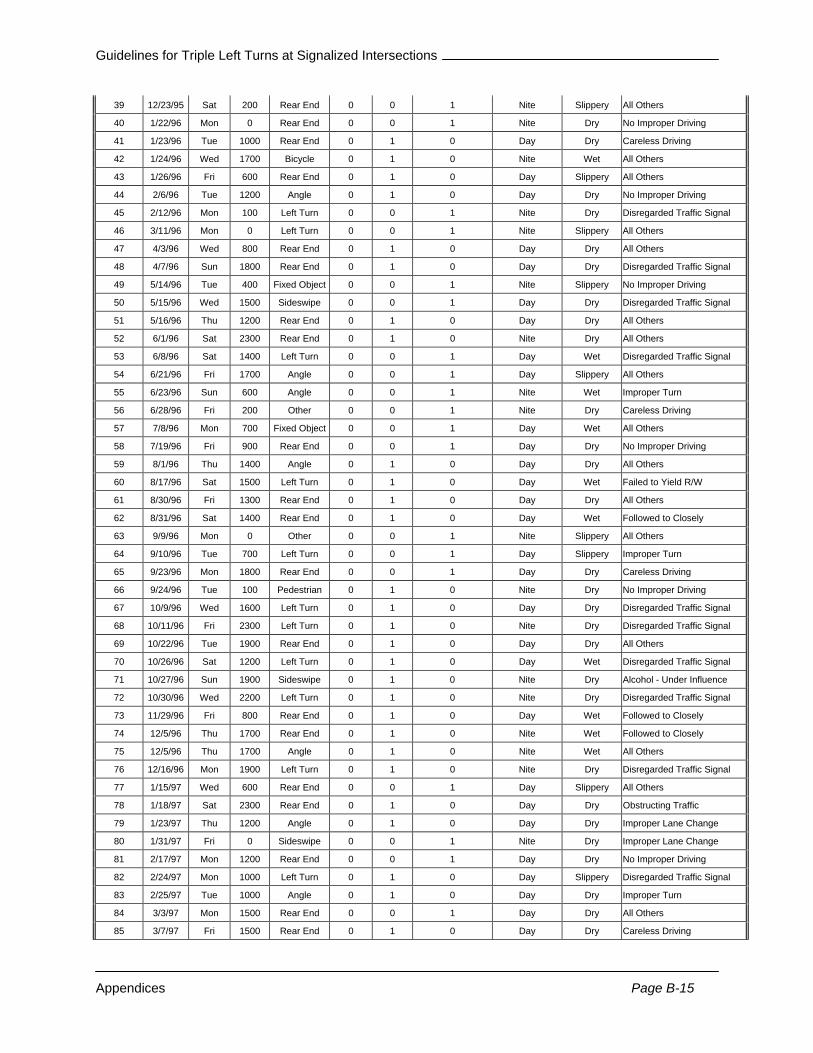
Guidelines for Triple Left Turns at Signalized Intersections
Appendices Page B-15
39 12/23/95 Sat 200 Rear End 0 0 1 Nite Slippery All Others
40 1/22/96 Mon 0 Rear End 0 0 1 Nite Dry No Improper Driving
41 1/23/96 Tue 1000 Rear End 0 1 0 Day Dry Careless Driving
42 1/24/96 Wed 1700 Bicycle 0 1 0 Nite Wet All Others
43 1/26/96 Fri 600 Rear End 0 1 0 Day Slippery All Others
44 2/6/96 Tue 1200 Angle 0 1 0 Day Dry No Improper Driving
45 2/12/96 Mon 100 Left Turn 0 0 1 Nite Dry Disregarded Traffic Signal
46 3/11/96 Mon 0 Left Turn 0 0 1 Nite Slippery All Others
47 4/3/96 Wed 800 Rear End 0 1 0 Day Dry All Others
48 4/7/96 Sun 1800 Rear End 0 1 0 Day Dry Disregarded Traffic Signal
49 5/14/96 Tue 400 Fixed Object 0 0 1 Nite Slippery No Improper Driving
50 5/15/96 Wed 1500 Sideswipe 0 0 1 Day Dry Disregarded Traffic Signal
51 5/16/96 Thu 1200 Rear End 0 1 0 Day Dry All Others
52 6/1/96 Sat 2300 Rear End 0 1 0 Nite Dry All Others
53 6/8/96 Sat 1400 Left Turn 0 0 1 Day Wet Disregarded Traffic Signal
54 6/21/96 Fri 1700 Angle 0 0 1 Day Slippery All Others
55 6/23/96 Sun 600 Angle 0 0 1 Nite Wet Improper Turn
56 6/28/96 Fri 200 Other 0 0 1 Nite Dry Careless Driving
57 7/8/96 Mon 700 Fixed Object 0 0 1 Day Wet All Others
58 7/19/96 Fri 900 Rear End 0 0 1 Day Dry No Improper Driving
59 8/1/96 Thu 1400 Angle 0 1 0 Day Dry All Others
60 8/17/96 Sat 1500 Left Turn 0 1 0 Day Wet Failed to Yield R/W
61 8/30/96 Fri 1300 Rear End 0 1 0 Day Dry All Others
62 8/31/96 Sat 1400 Rear End 0 1 0 Day Wet Followed to Closely
63 9/9/96 Mon 0 Other 0 0 1 Nite Slippery All Others
64 9/10/96 Tue 700 Left Turn 0 0 1 Day Slippery Improper Turn
65 9/23/96 Mon 1800 Rear End 0 0 1 Day Dry Careless Driving
66 9/24/96 Tue 100 Pedestrian 0 1 0 Nite Dry No Improper Driving
67 10/9/96 Wed 1600 Left Turn 0 1 0 Day Dry Disregarded Traffic Signal
68 10/11/96 Fri 2300 Left Turn 0 1 0 Nite Dry Disregarded Traffic Signal
69 10/22/96 Tue 1900 Rear End 0 1 0 Day Dry All Others
70 10/26/96 Sat 1200 Left Turn 0 1 0 Day Wet Disregarded Traffic Signal
71 10/27/96 Sun 1900 Sideswipe 0 1 0 Nite Dry Alcohol - Under Influence
72 10/30/96 Wed 2200 Left Turn 0 1 0 Nite Dry Disregarded Traffic Signal
73 11/29/96 Fri 800 Rear End 0 1 0 Day Wet Followed to Closely
74 12/5/96 Thu 1700 Rear End 0 1 0 Nite Wet Followed to Closely
75 12/5/96 Thu 1700 Angle 0 1 0 Nite Wet All Others
76 12/16/96 Mon 1900 Left Turn 0 1 0 Nite Dry Disregarded Traffic Signal
77 1/15/97 Wed 600 Rear End 0 0 1 Day Slippery All Others
78 1/18/97 Sat 2300 Rear End 0 1 0 Day Dry Obstructing Traffic
79 1/23/97 Thu 1200 Angle 0 1 0 Day Dry Improper Lane Change
80 1/31/97 Fri 0 Sideswipe 0 0 1 Nite Dry Improper Lane Change
81 2/17/97 Mon 1200 Rear End 0 0 1 Day Dry No Improper Driving
82 2/24/97 Mon 1000 Left Turn 0 1 0 Day Slippery Disregarded Traffic Signal
83 2/25/97 Tue 1000 Angle 0 1 0 Day Dry Improper Turn
84 3/3/97 Mon 1500 Rear End 0 0 1 Day Dry All Others
85 3/7/97 Fri 1500 Rear End 0 1 0 Day Dry Careless Driving

Guidelines for Triple Left Turns at Signalized Intersections
Appendices Page B-16
86 3/22/97 Sat 2200 Rear End 0 1 0 Nite Dry All Others
87 3/28/97 Fri 900 Rear End 0 1 0 Day Dry No Improper Driving
88 4/3/97 Thu 800 Rear End 0 0 1 Day Dry Careless Driving
89 4/5/97 Sat 2000 Angle 0 0 1 Nite Dry All Others
90 4/6/97 Sun 1200 Left Turn 0 1 0 Day Dry Careless Driving
91 4/14/97 Mon 600 Angle 0 1 0 Day Dry Disregarded Traffic Signal
92 4/18/97 Fri 2100 Angle 0 1 0 Nite Dry All Others
93 4/18/97 Fri 800 Left Turn 0 0 1 Day Dry No Improper Driving
94 4/28/97 Mon 1100 Rear End 0 1 0 Day Dry All Others
95 5/9/97 Fri 2300 Rear End 0 1 0 Nite Dry Improper Lane Change
96 5/23/97 Fri 400 Angle 0 0 1 Nite Dry No Improper Driving
97 6/9/97 Mon 1800 Rear End 0 0 1 Nite Slippery Careless Driving
98 6/9/97 Mon 1600 Rear End 0 1 0 Day Slippery Exceeded Safe Speed
99 6/10/97 Tue 1700 Sideswipe 0 0 1 Day Dry All Others
100 6/21/97 Sat 1300 Rear End 0 1 0 Day Dry No Improper Driving
101 6/22/97 Sun 1300 Angle 0 1 0 Day Dry All Others
102 7/2/97 Wed 1100 Rear End 0 1 0 Day Wet Followed to Closely
103 7/4/97 Fri 1600 Rear End 0 1 0 Day Dry No Improper Driving
104 7/4/97 Fri 1400 Rear End 0 0 1 Day Dry All Others
105 7/13/97 Sun 300 Left Turn 0 1 0 Nite Dry Disregarded Traffic Signal
106 8/2/97 Sat 1300 Rear End 0 1 0 Nite Wet Followed to Closely
107 8/11/97 Mon 2200 Rear End 0 0 1 Nite Dry Careless Driving
108 8/19/97 Tue 1600 Rear End 0 0 1 Day Dry All Others
109 8/21/97 Thu 600 Angle 0 1 0 Day Wet All Others
110 10/2/97 Thu 2300 Other 0 0 1 Nite Wet Careless Driving
111 10/3/97 Fri 700 Fixed Object 0 1 0 Unk Other Disregarded Traffic Signal
112 10/11/97 Sat 500 Rear End 0 1 0 Nite Dry Followed to Closely
113 11/22/97 Sat 400 Left Turn 0 1 0 Nite Slippery No Improper Driving
114 11/29/97 Sat 1200 Rear End 0 1 0 Day Slippery All Others
115 12/9/97 Tue 0 Fixed Object 0 0 1 Unk Unknown Unknown
116 12/27/97 Sat 1500 Rear End 0 0 1 Day Dry No Improper Driving
Total No. Fatal Injury PDO Angle Left Turn Right Turn Rear End Side swipe Ped/Bike Other
116 1 68 47 23 20 1 56 5 3 8
0.86% 58.62% 40.52% 19.83% 17.24% 0.86% 48.28% 4.31% 2.59% 6.90%
Day Night Wet Dry Improper Turn
No Improper Driving
Careless Driving Follow too Closely Disregarded
Traffic Signal FTY R/W All Others
62 54 23 93 4 18 11 8 16 4 45
53.45% 46.55% 19.83% 80.17% 3.45% 15.52% 9.48% 6.90% 13.79% 3.45% 38.79%
TOTAL VEHICLES ENTERING / ADT : 54,167 CRASH RATE: 1.956 /MEV
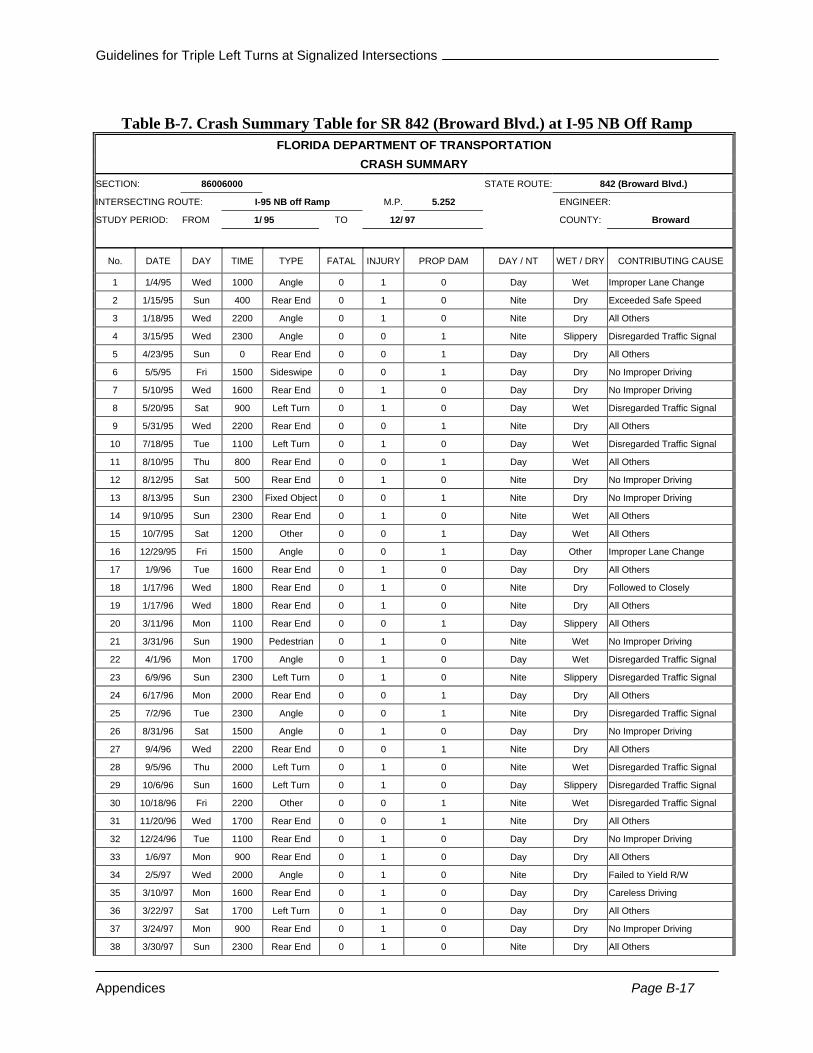
Guidelines for Triple Left Turns at Signalized Intersections
Appendices Page B-17
Table B-7. Crash Summary Table for SR 842 (Broward Blvd.) at I-95 NB Off Ramp
FLORIDA DEPARTMENT OF TRANSPORTATION CRASH SUMMARY
SECTION: 86006000 STATE ROUTE: 842 (Broward Blvd.)
INTERSECTING ROUTE: I-95 NB off Ramp M.P. 5.252 ENGINEER:
STUDY PERIOD: FROM 1/ 95 TO 12/ 97 COUNTY: Broward
No. DATE DAY TIME TYPE FATAL INJURY PROP DAM DAY / NT WET / DRY CONTRIBUTING CAUSE
1 1/4/95 Wed 1000 Angle 0 1 0 Day Wet Improper Lane Change
2 1/15/95 Sun 400 Rear End 0 1 0 Nite Dry Exceeded Safe Speed
3 1/18/95 Wed 2200 Angle 0 1 0 Nite Dry All Others
4 3/15/95 Wed 2300 Angle 0 0 1 Nite Slippery Disregarded Traffic Signal
5 4/23/95 Sun 0 Rear End 0 0 1 Day Dry All Others
6 5/5/95 Fri 1500 Sideswipe 0 0 1 Day Dry No Improper Driving
7 5/10/95 Wed 1600 Rear End 0 1 0 Day Dry No Improper Driving
8 5/20/95 Sat 900 Left Turn 0 1 0 Day Wet Disregarded Traffic Signal
9 5/31/95 Wed 2200 Rear End 0 0 1 Nite Dry All Others
10 7/18/95 Tue 1100 Left Turn 0 1 0 Day Wet Disregarded Traffic Signal
11 8/10/95 Thu 800 Rear End 0 0 1 Day Wet All Others
12 8/12/95 Sat 500 Rear End 0 1 0 Nite Dry No Improper Driving
13 8/13/95 Sun 2300 Fixed Object 0 0 1 Nite Dry No Improper Driving
14 9/10/95 Sun 2300 Rear End 0 1 0 Nite Wet All Others
15 10/7/95 Sat 1200 Other 0 0 1 Day Wet All Others
16 12/29/95 Fri 1500 Angle 0 0 1 Day Other Improper Lane Change
17 1/9/96 Tue 1600 Rear End 0 1 0 Day Dry All Others
18 1/17/96 Wed 1800 Rear End 0 1 0 Nite Dry Followed to Closely
19 1/17/96 Wed 1800 Rear End 0 1 0 Nite Dry All Others
20 3/11/96 Mon 1100 Rear End 0 0 1 Day Slippery All Others
21 3/31/96 Sun 1900 Pedestrian 0 1 0 Nite Wet No Improper Driving
22 4/1/96 Mon 1700 Angle 0 1 0 Day Wet Disregarded Traffic Signal
23 6/9/96 Sun 2300 Left Turn 0 1 0 Nite Slippery Disregarded Traffic Signal
24 6/17/96 Mon 2000 Rear End 0 0 1 Day Dry All Others
25 7/2/96 Tue 2300 Angle 0 0 1 Nite Dry Disregarded Traffic Signal
26 8/31/96 Sat 1500 Angle 0 1 0 Day Dry No Improper Driving
27 9/4/96 Wed 2200 Rear End 0 0 1 Nite Dry All Others
28 9/5/96 Thu 2000 Left Turn 0 1 0 Nite Wet Disregarded Traffic Signal
29 10/6/96 Sun 1600 Left Turn 0 1 0 Day Slippery Disregarded Traffic Signal
30 10/18/96 Fri 2200 Other 0 0 1 Nite Wet Disregarded Traffic Signal
31 11/20/96 Wed 1700 Rear End 0 0 1 Nite Dry All Others
32 12/24/96 Tue 1100 Rear End 0 1 0 Day Dry No Improper Driving
33 1/6/97 Mon 900 Rear End 0 1 0 Day Dry All Others
34 2/5/97 Wed 2000 Angle 0 1 0 Nite Dry Failed to Yield R/W
35 3/10/97 Mon 1600 Rear End 0 1 0 Day Dry Careless Driving
36 3/22/97 Sat 1700 Left Turn 0 1 0 Day Dry All Others
37 3/24/97 Mon 900 Rear End 0 1 0 Day Dry No Improper Driving
38 3/30/97 Sun 2300 Rear End 0 1 0 Nite Dry All Others
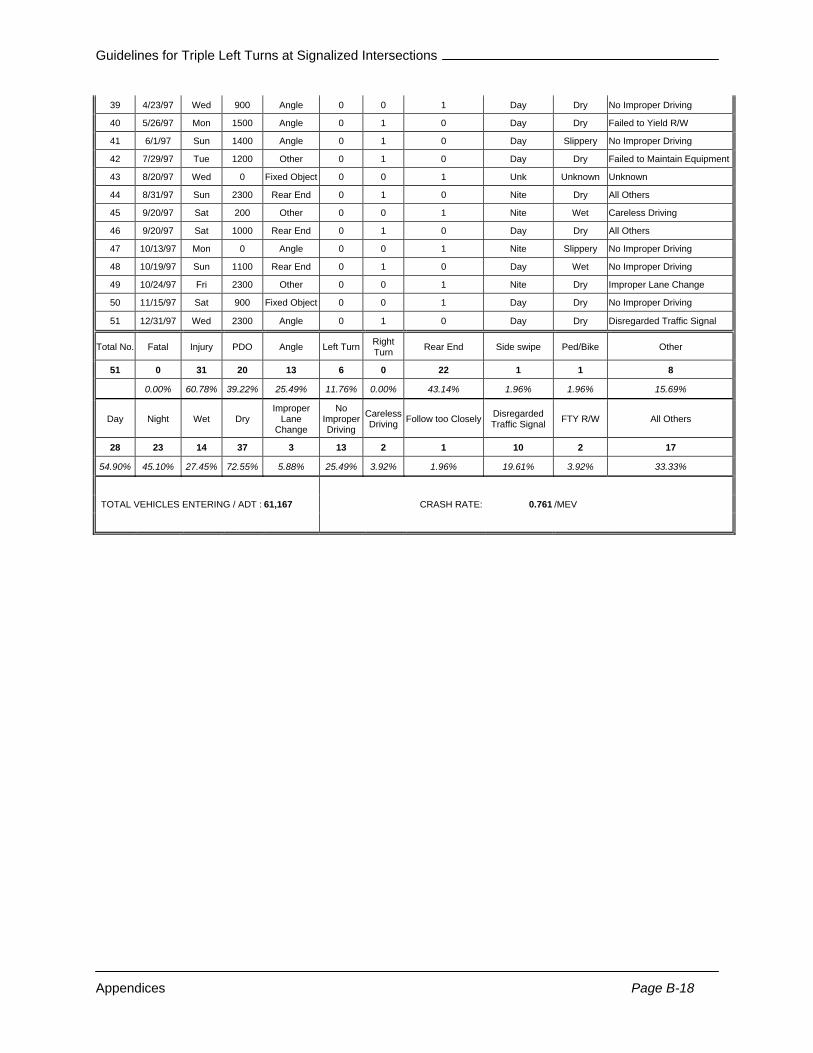
Guidelines for Triple Left Turns at Signalized Intersections
Appendices Page B-18
39 4/23/97 Wed 900 Angle 0 0 1 Day Dry No Improper Driving
40 5/26/97 Mon 1500 Angle 0 1 0 Day Dry Failed to Yield R/W
41 6/1/97 Sun 1400 Angle 0 1 0 Day Slippery No Improper Driving
42 7/29/97 Tue 1200 Other 0 1 0 Day Dry Failed to Maintain Equipment
43 8/20/97 Wed 0 Fixed Object 0 0 1 Unk Unknown Unknown
44 8/31/97 Sun 2300 Rear End 0 1 0 Nite Dry All Others
45 9/20/97 Sat 200 Other 0 0 1 Nite Wet Careless Driving
46 9/20/97 Sat 1000 Rear End 0 1 0 Day Dry All Others
47 10/13/97 Mon 0 Angle 0 0 1 Nite Slippery No Improper Driving
48 10/19/97 Sun 1100 Rear End 0 1 0 Day Wet No Improper Driving
49 10/24/97 Fri 2300 Other 0 0 1 Nite Dry Improper Lane Change
50 11/15/97 Sat 900 Fixed Object 0 0 1 Day Dry No Improper Driving
51 12/31/97 Wed 2300 Angle 0 1 0 Day Dry Disregarded Traffic Signal
Total No. Fatal Injury PDO Angle Left Turn Right Turn Rear End Side swipe Ped/Bike Other
51 0 31 20 13 6 0 22 1 1 8
0.00% 60.78% 39.22% 25.49% 11.76% 0.00% 43.14% 1.96% 1.96% 15.69%
Day Night Wet Dry Improper
Lane Change
No Improper Driving
Careless Driving Follow too Closely Disregarded
Traffic Signal FTY R/W All Others
28 23 14 37 3 13 2 1 10 2 17
54.90% 45.10% 27.45% 72.55% 5.88% 25.49% 3.92% 1.96% 19.61% 3.92% 33.33%
TOTAL VEHICLES ENTERING / ADT : 61,167 CRASH RATE: 0.761 /MEV
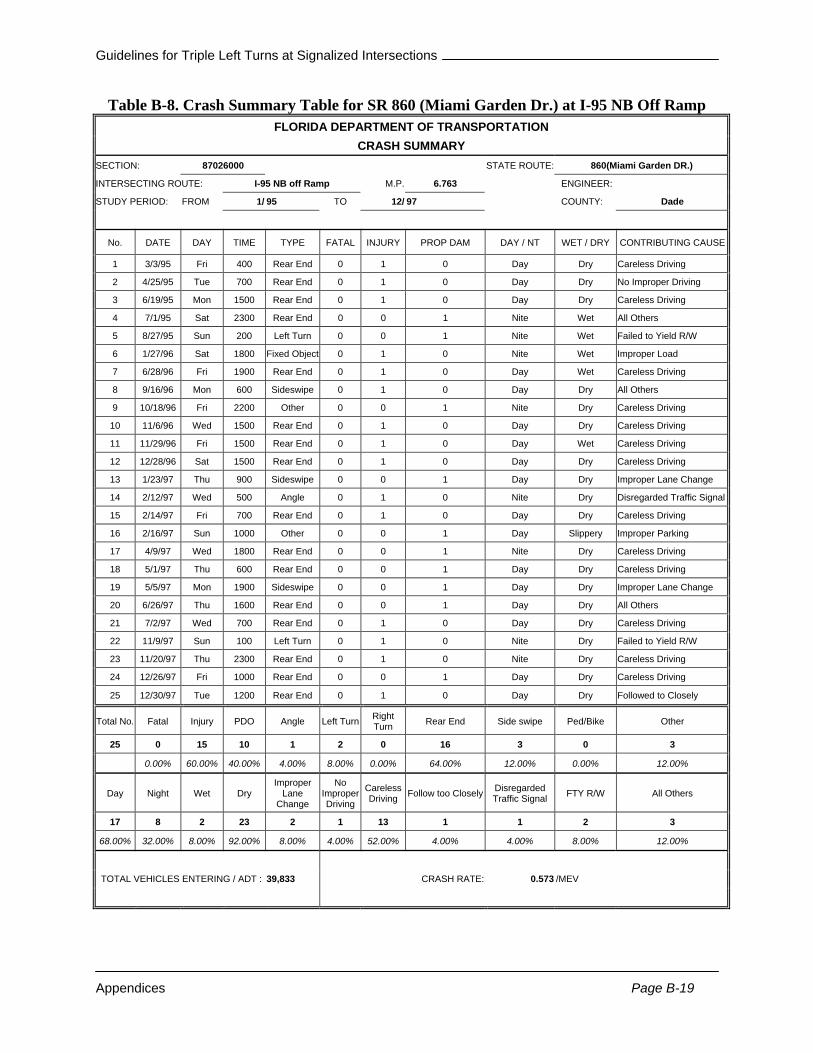
Guidelines for Triple Left Turns at Signalized Intersections
Appendices Page B-19
Table B-8. Crash Summary Table for SR 860 (Miami Garden Dr.) at I-95 NB Off Ramp FLORIDA DEPARTMENT OF TRANSPORTATION
CRASH SUMMARY SECTION: 87026000 STATE ROUTE: 860(Miami Garden DR.)
INTERSECTING ROUTE: I-95 NB off Ramp M.P. 6.763 ENGINEER:
STUDY PERIOD: FROM 1/ 95 TO 12/ 97 COUNTY: Dade
No. DATE DAY TIME TYPE FATAL INJURY PROP DAM DAY / NT WET / DRY CONTRIBUTING CAUSE
1 3/3/95 Fri 400 Rear End 0 1 0 Day Dry Careless Driving
2 4/25/95 Tue 700 Rear End 0 1 0 Day Dry No Improper Driving
3 6/19/95 Mon 1500 Rear End 0 1 0 Day Dry Careless Driving
4 7/1/95 Sat 2300 Rear End 0 0 1 Nite Wet All Others
5 8/27/95 Sun 200 Left Turn 0 0 1 Nite Wet Failed to Yield R/W
6 1/27/96 Sat 1800 Fixed Object 0 1 0 Nite Wet Improper Load
7 6/28/96 Fri 1900 Rear End 0 1 0 Day Wet Careless Driving
8 9/16/96 Mon 600 Sideswipe 0 1 0 Day Dry All Others
9 10/18/96 Fri 2200 Other 0 0 1 Nite Dry Careless Driving
10 11/6/96 Wed 1500 Rear End 0 1 0 Day Dry Careless Driving
11 11/29/96 Fri 1500 Rear End 0 1 0 Day Wet Careless Driving
12 12/28/96 Sat 1500 Rear End 0 1 0 Day Dry Careless Driving
13 1/23/97 Thu 900 Sideswipe 0 0 1 Day Dry Improper Lane Change
14 2/12/97 Wed 500 Angle 0 1 0 Nite Dry Disregarded Traffic Signal
15 2/14/97 Fri 700 Rear End 0 1 0 Day Dry Careless Driving
16 2/16/97 Sun 1000 Other 0 0 1 Day Slippery Improper Parking
17 4/9/97 Wed 1800 Rear End 0 0 1 Nite Dry Careless Driving
18 5/1/97 Thu 600 Rear End 0 0 1 Day Dry Careless Driving
19 5/5/97 Mon 1900 Sideswipe 0 0 1 Day Dry Improper Lane Change
20 6/26/97 Thu 1600 Rear End 0 0 1 Day Dry All Others
21 7/2/97 Wed 700 Rear End 0 1 0 Day Dry Careless Driving
22 11/9/97 Sun 100 Left Turn 0 1 0 Nite Dry Failed to Yield R/W
23 11/20/97 Thu 2300 Rear End 0 1 0 Nite Dry Careless Driving
24 12/26/97 Fri 1000 Rear End 0 0 1 Day Dry Careless Driving
25 12/30/97 Tue 1200 Rear End 0 1 0 Day Dry Followed to Closely
Total No. Fatal Injury PDO Angle Left Turn Right Turn Rear End Side swipe Ped/Bike Other
25 0 15 10 1 2 0 16 3 0 3
0.00% 60.00% 40.00% 4.00% 8.00% 0.00% 64.00% 12.00% 0.00% 12.00%
Day Night Wet Dry Improper
Lane Change
No Improper Driving
Careless Driving Follow too Closely Disregarded
Traffic Signal FTY R/W All Others
17 8 2 23 2 1 13 1 1 2 3
68.00% 32.00% 8.00% 92.00% 8.00% 4.00% 52.00% 4.00% 4.00% 8.00% 12.00%
TOTAL VEHICLES ENTERING / ADT : 39,833 CRASH RATE: 0.573 /MEV
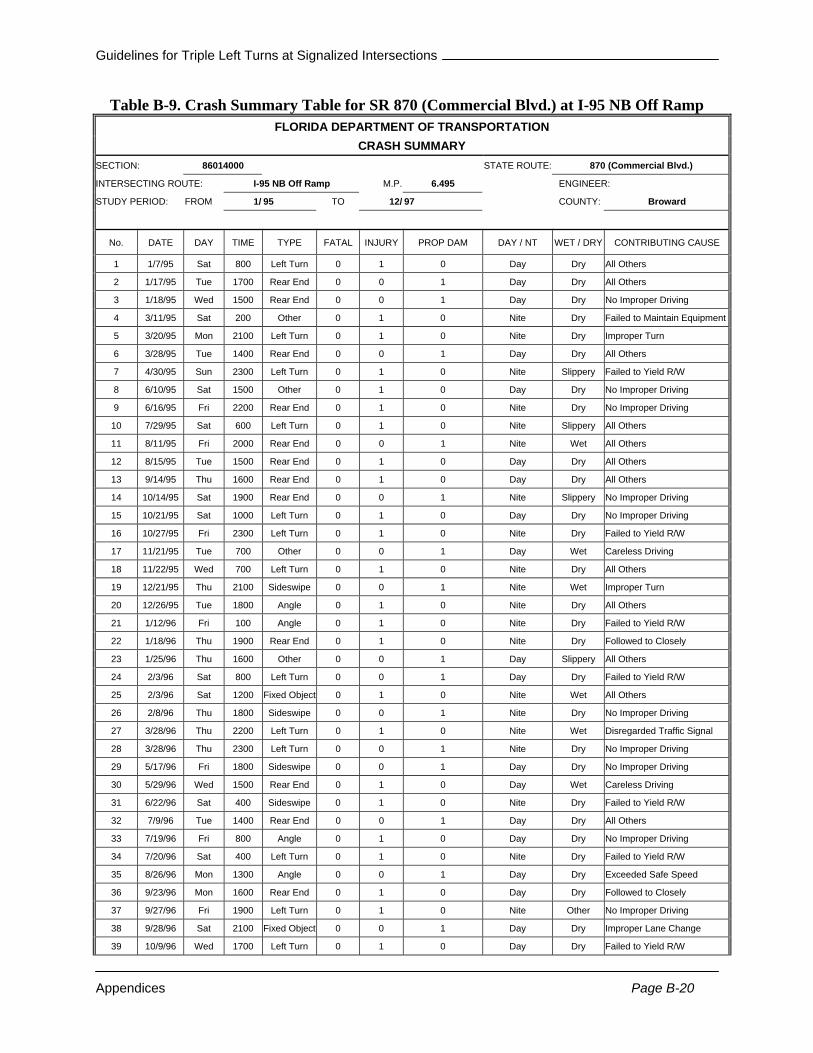
Guidelines for Triple Left Turns at Signalized Intersections
Appendices Page B-20
Table B-9. Crash Summary Table for SR 870 (Commercial Blvd.) at I-95 NB Off Ramp FLORIDA DEPARTMENT OF TRANSPORTATION
CRASH SUMMARY SECTION: 86014000 STATE ROUTE: 870 (Commercial Blvd.)
INTERSECTING ROUTE: I-95 NB Off Ramp M.P. 6.495 ENGINEER:
STUDY PERIOD: FROM 1/ 95 TO 12/ 97 COUNTY: Broward
No. DATE DAY TIME TYPE FATAL INJURY PROP DAM DAY / NT WET / DRY CONTRIBUTING CAUSE
1 1/7/95 Sat 800 Left Turn 0 1 0 Day Dry All Others
2 1/17/95 Tue 1700 Rear End 0 0 1 Day Dry All Others
3 1/18/95 Wed 1500 Rear End 0 0 1 Day Dry No Improper Driving
4 3/11/95 Sat 200 Other 0 1 0 Nite Dry Failed to Maintain Equipment
5 3/20/95 Mon 2100 Left Turn 0 1 0 Nite Dry Improper Turn
6 3/28/95 Tue 1400 Rear End 0 0 1 Day Dry All Others
7 4/30/95 Sun 2300 Left Turn 0 1 0 Nite Slippery Failed to Yield R/W
8 6/10/95 Sat 1500 Other 0 1 0 Day Dry No Improper Driving
9 6/16/95 Fri 2200 Rear End 0 1 0 Nite Dry No Improper Driving
10 7/29/95 Sat 600 Left Turn 0 1 0 Nite Slippery All Others
11 8/11/95 Fri 2000 Rear End 0 0 1 Nite Wet All Others
12 8/15/95 Tue 1500 Rear End 0 1 0 Day Dry All Others
13 9/14/95 Thu 1600 Rear End 0 1 0 Day Dry All Others
14 10/14/95 Sat 1900 Rear End 0 0 1 Nite Slippery No Improper Driving
15 10/21/95 Sat 1000 Left Turn 0 1 0 Day Dry No Improper Driving
16 10/27/95 Fri 2300 Left Turn 0 1 0 Nite Dry Failed to Yield R/W
17 11/21/95 Tue 700 Other 0 0 1 Day Wet Careless Driving
18 11/22/95 Wed 700 Left Turn 0 1 0 Nite Dry All Others
19 12/21/95 Thu 2100 Sideswipe 0 0 1 Nite Wet Improper Turn
20 12/26/95 Tue 1800 Angle 0 1 0 Nite Dry All Others
21 1/12/96 Fri 100 Angle 0 1 0 Nite Dry Failed to Yield R/W
22 1/18/96 Thu 1900 Rear End 0 1 0 Nite Dry Followed to Closely
23 1/25/96 Thu 1600 Other 0 0 1 Day Slippery All Others
24 2/3/96 Sat 800 Left Turn 0 0 1 Day Dry Failed to Yield R/W
25 2/3/96 Sat 1200 Fixed Object 0 1 0 Nite Wet All Others
26 2/8/96 Thu 1800 Sideswipe 0 0 1 Nite Dry No Improper Driving
27 3/28/96 Thu 2200 Left Turn 0 1 0 Nite Wet Disregarded Traffic Signal
28 3/28/96 Thu 2300 Left Turn 0 0 1 Nite Dry No Improper Driving
29 5/17/96 Fri 1800 Sideswipe 0 0 1 Day Dry No Improper Driving
30 5/29/96 Wed 1500 Rear End 0 1 0 Day Wet Careless Driving
31 6/22/96 Sat 400 Sideswipe 0 1 0 Nite Dry Failed to Yield R/W
32 7/9/96 Tue 1400 Rear End 0 0 1 Day Dry All Others
33 7/19/96 Fri 800 Angle 0 1 0 Day Dry No Improper Driving
34 7/20/96 Sat 400 Left Turn 0 1 0 Nite Dry Failed to Yield R/W
35 8/26/96 Mon 1300 Angle 0 0 1 Day Dry Exceeded Safe Speed
36 9/23/96 Mon 1600 Rear End 0 1 0 Day Dry Followed to Closely
37 9/27/96 Fri 1900 Left Turn 0 1 0 Nite Other No Improper Driving
38 9/28/96 Sat 2100 Fixed Object 0 0 1 Day Dry Improper Lane Change
39 10/9/96 Wed 1700 Left Turn 0 1 0 Day Dry Failed to Yield R/W

Guidelines for Triple Left Turns at Signalized Intersections
Appendices Page B-21
40 11/21/96 Thu 2300 Angle 0 0 1 Nite Dry Disregarded Traffic Signal
41 12/4/96 Wed 1400 Rear End 0 1 0 Day Wet Careless Driving
42 12/8/96 Sun 1800 Rear End 0 0 1 Nite Dry Failed to Maintain Equipment
43 12/27/96 Fri 1200 Rear End 0 1 0 Day Wet Failed to Maintain Equipment
44 1/7/97 Tue 2200 Rear End 0 0 1 Nite Dry No Improper Driving
45 1/28/97 Tue 1300 Rear End 0 1 0 Day Dry Exceeded Safe Speed
46 1/29/97 Wed 1900 Rear End 0 1 0 Nite Wet All Others
47 2/4/97 Tue 1000 Rear End 0 0 1 Day Wet No Improper Driving
48 2/6/97 Thu 2000 Rear End 0 0 1 Day Dry No Improper Driving
49 3/10/97 Mon 2000 Rear End 0 1 0 Nite Dry Careless Driving
50 4/23/97 Wed 1100 Rear End 0 0 1 Day Dry Careless Driving
51 4/28/97 Mon 2000 Other 0 0 1 Nite Wet Exceeded Safe Speed
52 5/25/97 Sun 600 Left Turn 0 1 0 Nite Dry Failed to Yield R/W
53 6/7/97 Sat 800 Rear End 0 0 1 Day Dry No Improper Driving
54 6/16/97 Mon 200 Left Turn 0 1 0 Nite Dry Failed to Yield R/W
55 7/14/97 Mon 700 Angle 0 0 1 Day Dry No Improper Driving
56 8/30/97 Sat 0 Left Turn 0 0 1 Unk Dry Failed to Yield R/W
57 9/14/97 Sun 1200 Angle 0 0 1 Day Wet No Improper Driving
58 10/13/97 Mon 600 Left Turn 0 0 1 Nite Dry Failed to Yield R/W
59 10/22/97 Wed 1300 Rear End 0 1 0 Day Dry Careless Driving
60 11/1/97 Sat 1500 Left Turn 0 0 1 Day Dry Disregarded Traffic Signal
61 11/21/97 Fri 1100 Rear End 0 1 0 Day Wet All Others
62 12/4/97 Thu 1000 Left Turn 0 0 1 Day Slippery All Others
63 12/31/97 Wed 2300 Angle 0 0 1 Nite Dry Improper Lane Change
Total No. Fatal Injury PDO Angle Left Turn Right Turn Rear End Side swipe Ped/Bike Other
63 0 33 30 8 19 0 25 4 0 7
0.00% 52.38% 47.62% 12.70% 30.16% 0.00% 39.68% 6.35% 0.00% 11.11%
Day Night Wet Dry Improper Turn
No Improper Driving
Careless Driving Follow too Closely Disregarded
Traffic Signal FTY R/W All Others
32 31 13 50 2 16 6 2 3 11 15
50.79% 49.21% 20.63% 79.37% 3.17% 25.40% 9.52% 3.17% 4.76% 17.46% 23.81%
TOTAL VEHICLES ENTERING / ADT : 63,500 CRASH RATE: 0.906 /MEV
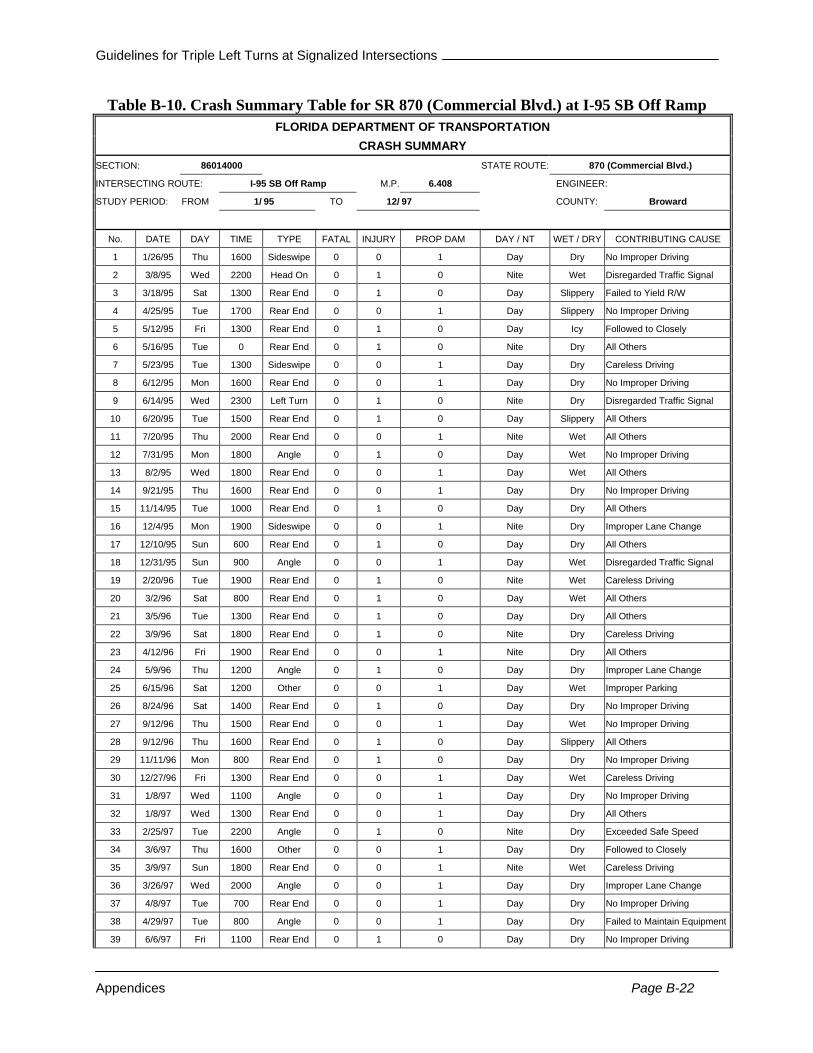
Guidelines for Triple Left Turns at Signalized Intersections
Appendices Page B-22
Table B-10. Crash Summary Table for SR 870 (Commercial Blvd.) at I-95 SB Off Ramp FLORIDA DEPARTMENT OF TRANSPORTATION
CRASH SUMMARY SECTION: 86014000 STATE ROUTE: 870 (Commercial Blvd.)
INTERSECTING ROUTE: I-95 SB Off Ramp M.P. 6.408 ENGINEER:
STUDY PERIOD: FROM 1/ 95 TO 12/ 97 COUNTY: Broward
No. DATE DAY TIME TYPE FATAL INJURY PROP DAM DAY / NT WET / DRY CONTRIBUTING CAUSE
1 1/26/95 Thu 1600 Sideswipe 0 0 1 Day Dry No Improper Driving
2 3/8/95 Wed 2200 Head On 0 1 0 Nite Wet Disregarded Traffic Signal
3 3/18/95 Sat 1300 Rear End 0 1 0 Day Slippery Failed to Yield R/W
4 4/25/95 Tue 1700 Rear End 0 0 1 Day Slippery No Improper Driving
5 5/12/95 Fri 1300 Rear End 0 1 0 Day Icy Followed to Closely
6 5/16/95 Tue 0 Rear End 0 1 0 Nite Dry All Others
7 5/23/95 Tue 1300 Sideswipe 0 0 1 Day Dry Careless Driving
8 6/12/95 Mon 1600 Rear End 0 0 1 Day Dry No Improper Driving
9 6/14/95 Wed 2300 Left Turn 0 1 0 Nite Dry Disregarded Traffic Signal
10 6/20/95 Tue 1500 Rear End 0 1 0 Day Slippery All Others
11 7/20/95 Thu 2000 Rear End 0 0 1 Nite Wet All Others
12 7/31/95 Mon 1800 Angle 0 1 0 Day Wet No Improper Driving
13 8/2/95 Wed 1800 Rear End 0 0 1 Day Wet All Others
14 9/21/95 Thu 1600 Rear End 0 0 1 Day Dry No Improper Driving
15 11/14/95 Tue 1000 Rear End 0 1 0 Day Dry All Others
16 12/4/95 Mon 1900 Sideswipe 0 0 1 Nite Dry Improper Lane Change
17 12/10/95 Sun 600 Rear End 0 1 0 Day Dry All Others
18 12/31/95 Sun 900 Angle 0 0 1 Day Wet Disregarded Traffic Signal
19 2/20/96 Tue 1900 Rear End 0 1 0 Nite Wet Careless Driving
20 3/2/96 Sat 800 Rear End 0 1 0 Day Wet All Others
21 3/5/96 Tue 1300 Rear End 0 1 0 Day Dry All Others
22 3/9/96 Sat 1800 Rear End 0 1 0 Nite Dry Careless Driving
23 4/12/96 Fri 1900 Rear End 0 0 1 Nite Dry All Others
24 5/9/96 Thu 1200 Angle 0 1 0 Day Dry Improper Lane Change
25 6/15/96 Sat 1200 Other 0 0 1 Day Wet Improper Parking
26 8/24/96 Sat 1400 Rear End 0 1 0 Day Dry No Improper Driving
27 9/12/96 Thu 1500 Rear End 0 0 1 Day Wet No Improper Driving
28 9/12/96 Thu 1600 Rear End 0 1 0 Day Slippery All Others
29 11/11/96 Mon 800 Rear End 0 1 0 Day Dry No Improper Driving
30 12/27/96 Fri 1300 Rear End 0 0 1 Day Wet Careless Driving
31 1/8/97 Wed 1100 Angle 0 0 1 Day Dry No Improper Driving
32 1/8/97 Wed 1300 Rear End 0 0 1 Day Dry All Others
33 2/25/97 Tue 2200 Angle 0 1 0 Nite Dry Exceeded Safe Speed
34 3/6/97 Thu 1600 Other 0 0 1 Day Dry Followed to Closely
35 3/9/97 Sun 1800 Rear End 0 0 1 Nite Wet Careless Driving
36 3/26/97 Wed 2000 Angle 0 0 1 Day Dry Improper Lane Change
37 4/8/97 Tue 700 Rear End 0 0 1 Day Dry No Improper Driving
38 4/29/97 Tue 800 Angle 0 0 1 Day Dry Failed to Maintain Equipment
39 6/6/97 Fri 1100 Rear End 0 1 0 Day Dry No Improper Driving
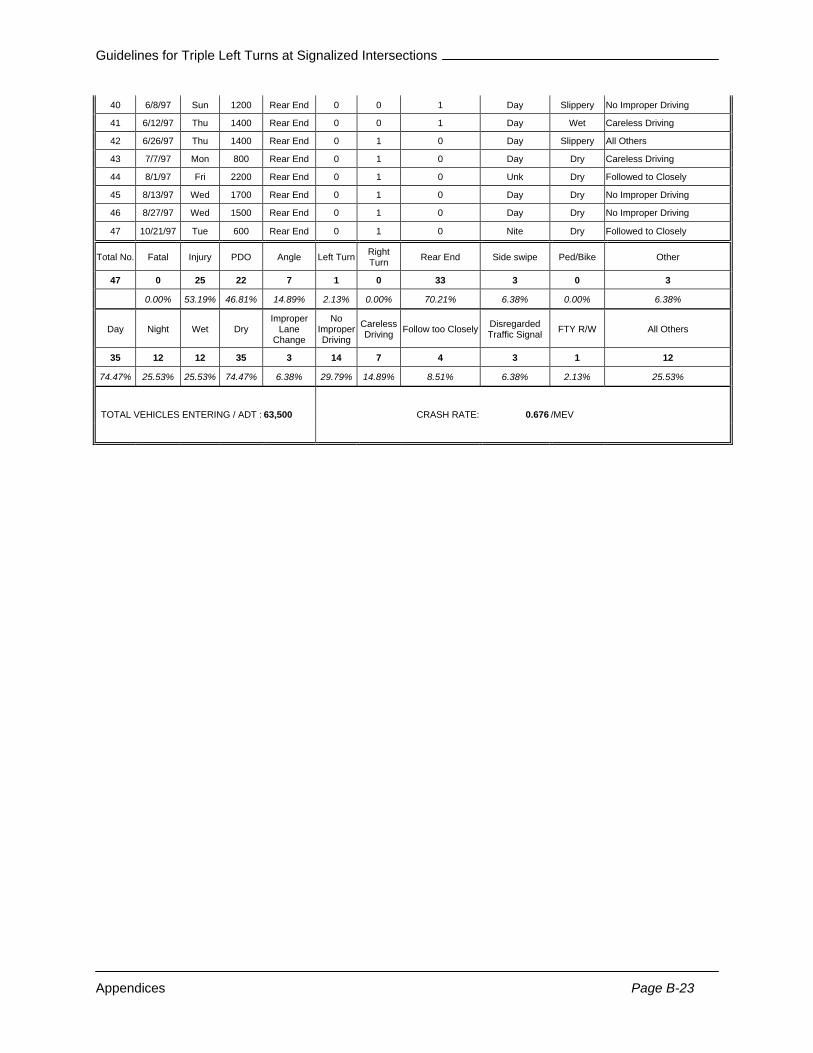
Guidelines for Triple Left Turns at Signalized Intersections
Appendices Page B-23
40 6/8/97 Sun 1200 Rear End 0 0 1 Day Slippery No Improper Driving
41 6/12/97 Thu 1400 Rear End 0 0 1 Day Wet Careless Driving
42 6/26/97 Thu 1400 Rear End 0 1 0 Day Slippery All Others
43 7/7/97 Mon 800 Rear End 0 1 0 Day Dry Careless Driving
44 8/1/97 Fri 2200 Rear End 0 1 0 Unk Dry Followed to Closely
45 8/13/97 Wed 1700 Rear End 0 1 0 Day Dry No Improper Driving
46 8/27/97 Wed 1500 Rear End 0 1 0 Day Dry No Improper Driving
47 10/21/97 Tue 600 Rear End 0 1 0 Nite Dry Followed to Closely
Total No. Fatal Injury PDO Angle Left Turn Right Turn Rear End Side swipe Ped/Bike Other
47 0 25 22 7 1 0 33 3 0 3
0.00% 53.19% 46.81% 14.89% 2.13% 0.00% 70.21% 6.38% 0.00% 6.38%
Day Night Wet Dry Improper
Lane Change
No Improper Driving
Careless Driving Follow too Closely Disregarded
Traffic Signal FTY R/W All Others
35 12 12 35 3 14 7 4 3 1 12
74.47% 25.53% 25.53% 74.47% 6.38% 29.79% 14.89% 8.51% 6.38% 2.13% 25.53%
TOTAL VEHICLES ENTERING / ADT : 63,500 CRASH RATE: 0.676 /MEV
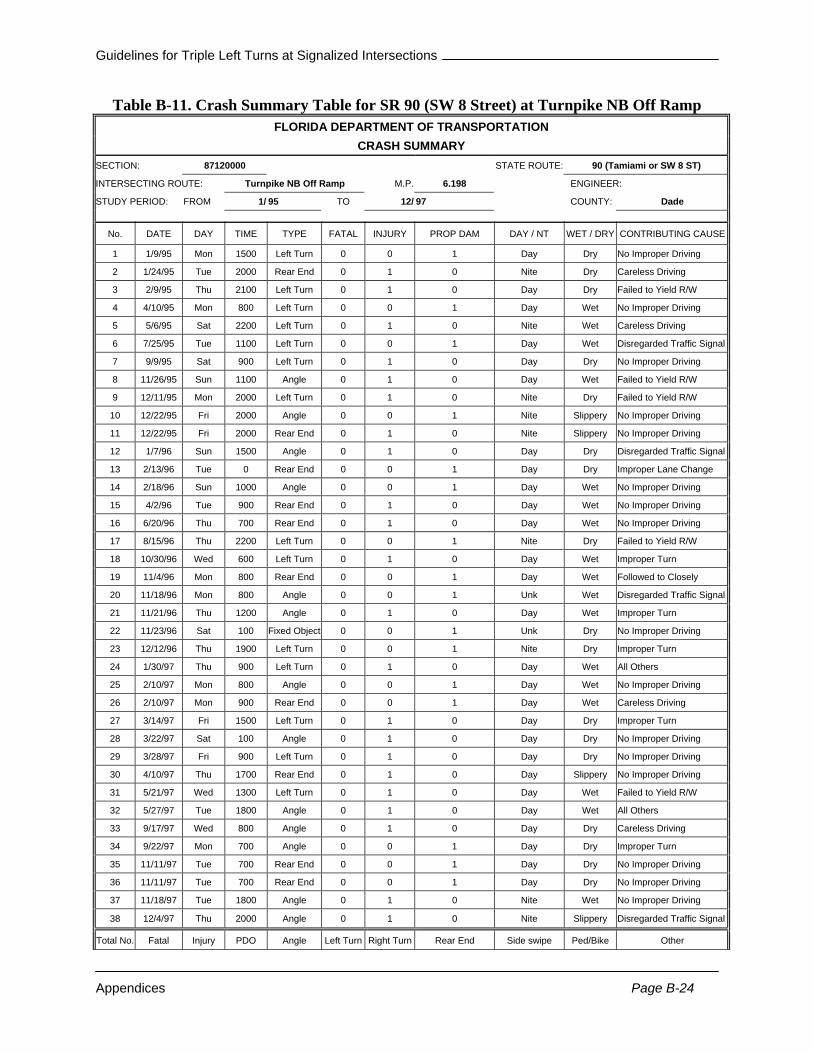
Guidelines for Triple Left Turns at Signalized Intersections
Appendices Page B-24
Table B-11. Crash Summary Table for SR 90 (SW 8 Street) at Turnpike NB Off Ramp FLORIDA DEPARTMENT OF TRANSPORTATION
CRASH SUMMARY SECTION: 87120000 STATE ROUTE: 90 (Tamiami or SW 8 ST)
INTERSECTING ROUTE: Turnpike NB Off Ramp M.P. 6.198 ENGINEER:
STUDY PERIOD: FROM 1/ 95 TO 12/ 97 COUNTY: Dade
No. DATE DAY TIME TYPE FATAL INJURY PROP DAM DAY / NT WET / DRY CONTRIBUTING CAUSE
1 1/9/95 Mon 1500 Left Turn 0 0 1 Day Dry No Improper Driving
2 1/24/95 Tue 2000 Rear End 0 1 0 Nite Dry Careless Driving
3 2/9/95 Thu 2100 Left Turn 0 1 0 Day Dry Failed to Yield R/W
4 4/10/95 Mon 800 Left Turn 0 0 1 Day Wet No Improper Driving
5 5/6/95 Sat 2200 Left Turn 0 1 0 Nite Wet Careless Driving
6 7/25/95 Tue 1100 Left Turn 0 0 1 Day Wet Disregarded Traffic Signal
7 9/9/95 Sat 900 Left Turn 0 1 0 Day Dry No Improper Driving
8 11/26/95 Sun 1100 Angle 0 1 0 Day Wet Failed to Yield R/W
9 12/11/95 Mon 2000 Left Turn 0 1 0 Nite Dry Failed to Yield R/W
10 12/22/95 Fri 2000 Angle 0 0 1 Nite Slippery No Improper Driving
11 12/22/95 Fri 2000 Rear End 0 1 0 Nite Slippery No Improper Driving
12 1/7/96 Sun 1500 Angle 0 1 0 Day Dry Disregarded Traffic Signal
13 2/13/96 Tue 0 Rear End 0 0 1 Day Dry Improper Lane Change
14 2/18/96 Sun 1000 Angle 0 0 1 Day Wet No Improper Driving
15 4/2/96 Tue 900 Rear End 0 1 0 Day Wet No Improper Driving
16 6/20/96 Thu 700 Rear End 0 1 0 Day Wet No Improper Driving
17 8/15/96 Thu 2200 Left Turn 0 0 1 Nite Dry Failed to Yield R/W
18 10/30/96 Wed 600 Left Turn 0 1 0 Day Wet Improper Turn
19 11/4/96 Mon 800 Rear End 0 0 1 Day Wet Followed to Closely
20 11/18/96 Mon 800 Angle 0 0 1 Unk Wet Disregarded Traffic Signal
21 11/21/96 Thu 1200 Angle 0 1 0 Day Wet Improper Turn
22 11/23/96 Sat 100 Fixed Object 0 0 1 Unk Dry No Improper Driving
23 12/12/96 Thu 1900 Left Turn 0 0 1 Nite Dry Improper Turn
24 1/30/97 Thu 900 Left Turn 0 1 0 Day Wet All Others
25 2/10/97 Mon 800 Angle 0 0 1 Day Wet No Improper Driving
26 2/10/97 Mon 900 Rear End 0 0 1 Day Wet Careless Driving
27 3/14/97 Fri 1500 Left Turn 0 1 0 Day Dry Improper Turn
28 3/22/97 Sat 100 Angle 0 1 0 Day Dry No Improper Driving
29 3/28/97 Fri 900 Left Turn 0 1 0 Day Dry No Improper Driving
30 4/10/97 Thu 1700 Rear End 0 1 0 Day Slippery No Improper Driving
31 5/21/97 Wed 1300 Left Turn 0 1 0 Day Wet Failed to Yield R/W
32 5/27/97 Tue 1800 Angle 0 1 0 Day Wet All Others
33 9/17/97 Wed 800 Angle 0 1 0 Day Dry Careless Driving
34 9/22/97 Mon 700 Angle 0 0 1 Day Dry Improper Turn
35 11/11/97 Tue 700 Rear End 0 0 1 Day Dry No Improper Driving
36 11/11/97 Tue 700 Rear End 0 0 1 Day Dry No Improper Driving
37 11/18/97 Tue 1800 Angle 0 1 0 Nite Wet No Improper Driving
38 12/4/97 Thu 2000 Angle 0 1 0 Nite Slippery Disregarded Traffic Signal
Total No. Fatal Injury PDO Angle Left Turn Right Turn Rear End Side swipe Ped/Bike Other

Guidelines for Triple Left Turns at Signalized Intersections
Appendices Page B-25
38 0 22 16 13 14 0 10 0 0 1
0.00% 57.89% 42.11% 34.21% 36.84% 0.00% 26.32% 0.00% 0.00% 2.63%
Day Night Wet Dry Improper Turn
No Improper Driving
Careless Driving Follow too Closely Disregarded
Traffic Signal FTY R/W All Others
27 11 6 32 5 16 4 1 4 5 2
71.05% 28.95% 15.79% 84.21% 13.16% 42.11% 10.53% 2.63% 10.53% 13.16% 5.26%
TOTAL VEHICLES ENTERING / ADT : 43,333 CRASH RATE: 0.801 /MEV

Guidelines for Triple Left Turns at Signalized Intersections
Appendices Page B-26
Table B-12. Crash Summary Table for SR 976 (Bird Road) at Turnpike SB Off Ramp FLORIDA DEPARTMENT OF TRANSPORTATION
CRASH SUMMARY SECTION: 87044000 STATE ROUTE: 976 (Bird Road)
INTERSECTING ROUTE: Turnpike SB Off Ramp M.P. 0.012 ENGINEER:
STUDY PERIOD: FROM 1/ 95 TO 12/ 97 COUNTY: Dade
No. DATE DAY TIME TYPE FATAL INJURY PROP DAM DAY / NT WET / DRY CONTRIBUTING CAUSE
1 1/20/95 Fri 900 Rear End 0 1 0 Day Dry Careless Driving
2 5/14/95 Sun 2000 Left Turn 0 1 0 Nite Dry Disregarded Other Traffic
3 9/5/95 Tue 1700 Angle 0 1 0 Day Wet Improper Turn
4 9/12/95 Tue 900 Angle 0 0 1 Day Dry No Improper Driving
5 1/17/96 Wed 2200 Left Turn 0 0 1 Nite Dry No Improper Driving
6 4/26/96 Fri 900 Left Turn 0 1 0 Day Dry No Improper Driving
7 5/6/96 Mon 1500 Rear End 0 1 0 Day Dry No Improper Driving
8 8/28/96 Wed 2300 Left Turn 0 1 0 Nite Dry All Others
9 12/19/96 Thu 600 Left Turn 0 0 1 Nite Dry No Improper Driving
10 2/3/97 Mon 1600 Rear End 0 1 0 Day Dry No Improper Driving
11 3/6/97 Thu 2100 Rear End 0 0 1 Nite Dry No Improper Driving
12 3/14/97 Fri 700 Rear End 0 0 1 Day Wet No Improper Driving
13 7/2/97 Wed 1300 Left Turn 0 0 1 Day Dry No Improper Driving
14 7/19/97 Sat 1800 Rear End 0 1 0 Day Dry Careless Driving
15 11/22/97 Sat 1800 Angle 0 1 0 Nite Dry Improper Turn
16 11/23/97 Sun 100 Angle 0 1 0 Nite Dry Failed to Yield R/W
17 11/25/97 Tue 2000 Left Turn 0 0 1 Nite Dry All Others
18 12/12/97 Fri 1200 Rear End 0 0 1 Day Dry No Improper Driving
Total No. Fatal Injury PDO Angle Left Turn Right Turn Rear End Side swipe Ped/Bike Other
18 0 10 8 4 7 0 7 0 0 0
0.00% 55.56% 44.44% 22.22% 38.89% 0.00% 38.89% 0.00% 0.00% 0.00%
Day Night Wet Dry Improper Turn
No Improper Driving
Careless Driving Follow too Closely Disregarded
Other Traffic FTY R/W All Others
10 8 1 17 2 10 2 0 1 1 2
55.56% 44.44% 5.56% 94.44% 11.11% 55.56% 11.11% 0.00% 5.56% 5.56% 11.11%
TOTAL VEHICLES ENTERING / ADT : 41,500 CRASH RATE: 0.396 /MEV
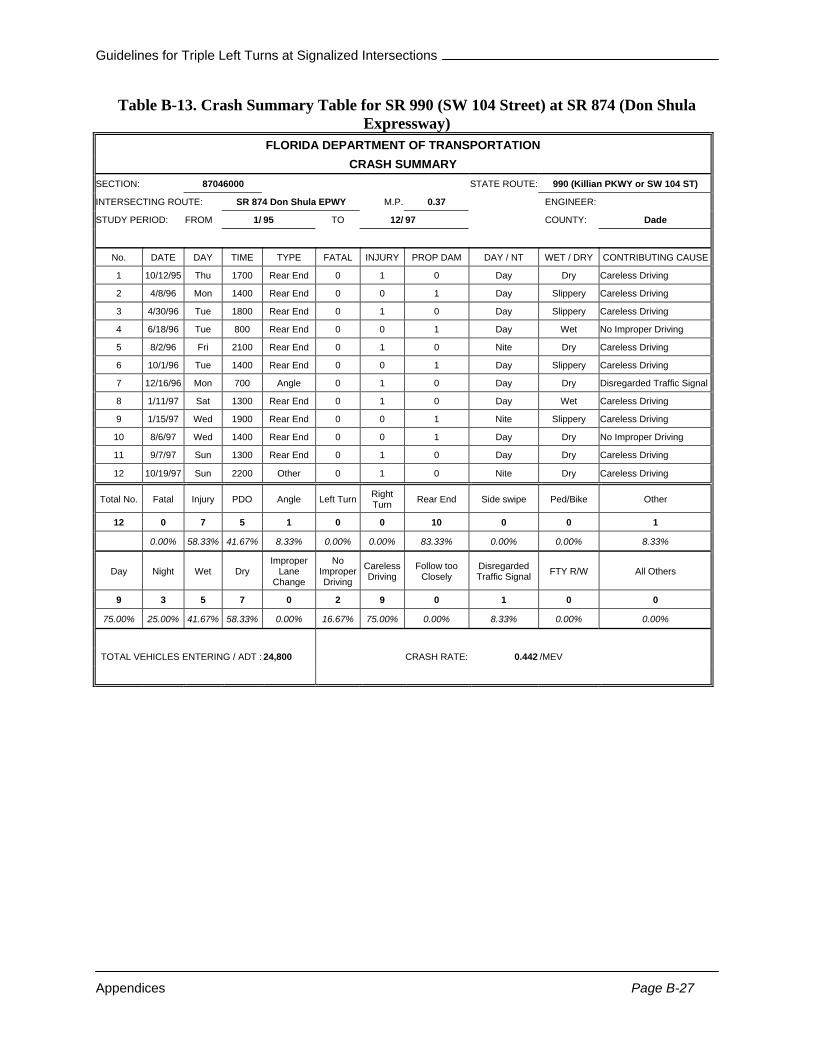
Guidelines for Triple Left Turns at Signalized Intersections
Appendices Page B-27
Table B-13. Crash Summary Table for SR 990 (SW 104 Street) at SR 874 (Don Shula Expressway)
FLORIDA DEPARTMENT OF TRANSPORTATION CRASH SUMMARY
SECTION: 87046000 STATE ROUTE: 990 (Killian PKWY or SW 104 ST)
INTERSECTING ROUTE: SR 874 Don Shula EPWY M.P. 0.37 ENGINEER:
STUDY PERIOD: FROM 1/ 95 TO 12/ 97 COUNTY: Dade
No. DATE DAY TIME TYPE FATAL INJURY PROP DAM DAY / NT WET / DRY CONTRIBUTING CAUSE
1 10/12/95 Thu 1700 Rear End 0 1 0 Day Dry Careless Driving
2 4/8/96 Mon 1400 Rear End 0 0 1 Day Slippery Careless Driving
3 4/30/96 Tue 1800 Rear End 0 1 0 Day Slippery Careless Driving
4 6/18/96 Tue 800 Rear End 0 0 1 Day Wet No Improper Driving
5 8/2/96 Fri 2100 Rear End 0 1 0 Nite Dry Careless Driving
6 10/1/96 Tue 1400 Rear End 0 0 1 Day Slippery Careless Driving
7 12/16/96 Mon 700 Angle 0 1 0 Day Dry Disregarded Traffic Signal
8 1/11/97 Sat 1300 Rear End 0 1 0 Day Wet Careless Driving
9 1/15/97 Wed 1900 Rear End 0 0 1 Nite Slippery Careless Driving
10 8/6/97 Wed 1400 Rear End 0 0 1 Day Dry No Improper Driving
11 9/7/97 Sun 1300 Rear End 0 1 0 Day Dry Careless Driving
12 10/19/97 Sun 2200 Other 0 1 0 Nite Dry Careless Driving
Total No. Fatal Injury PDO Angle Left Turn Right Turn Rear End Side swipe Ped/Bike Other
12 0 7 5 1 0 0 10 0 0 1
0.00% 58.33% 41.67% 8.33% 0.00% 0.00% 83.33% 0.00% 0.00% 8.33%
Day Night Wet Dry Improper
Lane Change
No Improper Driving
Careless Driving
Follow too Closely
Disregarded Traffic Signal FTY R/W All Others
9 3 5 7 0 2 9 0 1 0 0
75.00% 25.00% 41.67% 58.33% 0.00% 16.67% 75.00% 0.00% 8.33% 0.00% 0.00%
TOTAL VEHICLES ENTERING / ADT : 24,800 CRASH RATE: 0.442 /MEV