Embed Size (px)
Citation preview
Independence among physiological traits suggests flexibilityin the face of ecological demands on phenotypes
D. M. BUEHLER*� , F. VEZINA� , W. GOYMANN§, I. SCHWABL§, M. VERSTEEGH– ,
B. I. TIELEMAN– & T. PIERSMA–**
*Ecology and Evolutionary Biology, University of Toronto, Toronto, Ontario, Canada
�Natural History, Royal Ontario Museum, Toronto, Ontario, Canada
�Departement de Biologie, Chimie et Geographie, Groupe de recherche sur les environnements nordiques BOREAS, Centre d’etudes nordiques, Universite du Quebec a
Rimouski, Rimouski, Quebec, Canada
§Abteilung fur Verhaltensneurobiologie, Max-Planck-Institut fur Ornithologie, Seewiesen, Germany
–Animal Ecology Group, Centre for Ecological and Evolutionary Studies, University of Groningen, Groningen, The Netherlands
**Department of Marine Ecology, Royal Netherlands Institute for Sea Research (NIOZ), Texel, The Netherlands
Introduction
Organismal traits can show amazing flexibility, with
physiological characteristics from gut size, to metabolic
rate, to immune function showing as much variation as
behaviour (Piersma & van Gils, 2011). This phenotypic
flexibility allows animals to adjust their physiology to
diverse environmental conditions and can potentially
influence evolution through selection operating on
suites of flexible but linked traits with downstream
consequences for the genome (West-Eberhard, 2003),
and ⁄ or, through the accumulation and release of cryptic
genetic variation (reviewed by Pfennig et al., 2010).
Therefore, studying how flexible traits relate to each
other – how they covary – adds a layer of complexity
needed to gain insight into the constraints or freedoms
that may shape evolutionary trajectories (Lande &
Arnold, 1983).
Trait covariances, for example those among morpho-
logical traits, can have profound evolutionary
implications (Lande & Arnold, 1983) because they affect
how populations respond to selection by constraining
responses, generating trade-offs, or otherwise shap-
ing evolutionary trajectories (Roff & Fairbairn, 2007).
Correspondence: Deborah Buehler, Office of the Vice President, Research
12 Queen’s Park Crescent, Toronto, ON, M5S 1S8.
Tel.: +1 416 978 3205; fax: +1 416 946 3707; e-mail: [email protected]
ª 2 0 1 2 T H E A U T H O R S . J . E V O L . B I O L .
J O U R N A L O F E V O L U T I O N A R Y B I O L O G Y ª 2 0 1 2 E U R O P E A N S O C I E T Y F O R E V O L U T I O N A R Y B I O L O G Y 1
Keywords:
basal metabolic rate;
constitutive immune function;
corticosterone;
flexible phenotype;
haematocrit;
pace-of-life;
shorebirds.
Abstract
Phenotypic flexibility allows animals to adjust their physiology to diverse
environmental conditions encountered over the year. Examining how these
varying traits covary gives insights into potential constraints or freedoms that
may shape evolutionary trajectories. In this study, we examined relationships
among haematocrit, baseline corticosterone concentration, constitutive
immune function and basal metabolic rate in red knot Calidris canutus islandica
individuals subjected to experimentally manipulated temperature treatments
over an entire annual cycle. If covariation among traits is constrained, we
predict consistent covariation within and among individuals. We further
predict consistent correlations between physiological and metabolic traits if
constraints underlie species-level patterns found along the slow-fast pace-of-
life continuum. We found no consistent correlations among haematocrit,
baseline corticosterone concentration, immune function and basal metabolic
rate either within or among individuals. This provides no evidence for
constraints limiting relationships among these measures of the cardiovascular,
endocrine, immune and metabolic systems in individual red knots. Rather, our
data suggest that knots are free to adjust individual parts of their physiology
independently. This makes good sense if one places the animal within its
ecological context where different aspects of the environment might put
different pressures on different aspects of physiology.
doi: 10.1111/j.1420-9101.2012.02543.x

Therefore, the way that physiological traits covary at the
individual level may be relevant for testing hypotheses
about how these same traits covary at the species level.
For example, the pace-of-life hypothesis (Ricklefs &
Wikelski, 2002) argues that observed correlations be-
tween demographic and metabolic traits along a slow-fast
continuum (Promislow & Harvey, 1990) might indicate
that individual responses to different environments are
limited by physiological mechanisms. In other words,
different physiological systems are intricately linked and
thus constrained (i.e. the endocrine system, the immune
system and the metabolic system; Dhabhar et al., 1995;
Lochmiller & Deerenberg, 2000; Speakman, 2005; Lan-
dys et al., 2006; Ardia et al., 2011). If such constraints
underlie the slow–fast continuum seen at the species
level, then physiological traits should covary in the same
way at the species and individual levels (Lande, 1979).
This line of thinking also predicts consistent correlations
among physiological traits, and between these traits and
metabolic traits (i.e. basal metabolic rate, BMR) at the
individual level.
Thus, at the individual level, consistent correlations
among physiological traits are predicted if functional
interactions among suites of traits limit trait evolution –
functional constraint (Schwenk & Wagner, 2001). How-
ever, traits may also be negatively correlated in some
environments or parts of the year due to trade-offs
necessitated by the allocation of limited resources (Ardia
et al., 2011). Finally, phenotypic flexibility may allow
organisms to adjust individual aspects of their physio-
logy independently. This may reflect the fact that an
organism’s overall physiology must serve multiple func-
tions, with each physiological system responding to
environmental conditions particular to its function
(Piersma & van Gils, 2011). This freedom to adjust
individual aspects of physiology might be important in
environments with, or during times of the year when,
incompatible demands result in physiological conflicts
(Ramenofsky & Wingfield, 2006; Vezina et al., 2010,
2012).
Though seemingly clear-cut, these hypotheses may be
difficult to tease apart. Consider a simplified and hypo-
thetical example of two physiological traits (A and B)
over the annual cycle (Fig. 1a). The scenarios detailed in
the figure show that relationships between the traits in
different periods of the year (columns represent Jan, May
and Aug) could indicate: (a1) true functional constraint;
(a2) negative relationships during periods of scarcity
(trade-offs) and positive relationships during periods of
abundance even though traits are independent; (a3)
negative or positive relationships due to parallel or
opposite responses to the environment (Ricklefs, 2000)
even thought traits are independent; or (a4) a consistent
lack of correlations indicating independent traits
responding to independent aspects of the environment.
Importantly, the negative correlations in column one
(Jan) in a1–a3 could be interpreted as constraint if
studied in isolation, but only a1, where the traits are
correlated in the same way in all months, represents true
functional constraint. This complexity highlights the
importance of sampling traits in different environments
and over time.
At the individual level, physiological syndromes (akin
to behavioural syndromes reviewed by Bell, 2007) may
exist if physiological traits are consistently correlated
within an individual over time and across environments.
The scenarios detailed in Fig. 1b show that relationships
between traits measured repeatedly in different individ-
uals (columns represent birds 1–3) could indicate:
(b1) physiological syndromes caused by functional
constraint; (b2) consistent syndromes within an individ-
ual over time, but because at least two relationships are
possible in the population, no evidence for constraints
that operate consistently in all individuals (i.e. if they
exist, they are not universal); (b3 and b4) no syndromes
or functional constraint. The pattern in b2 may also be
caused by ecological constraints (e.g. individuals using
different habitats). In b3, the strategy of ‘no relationship’
is not a syndrome because the relationship is not
consistent over time (dots in the data could represent
multiple samplings within the individual, and all possible
combinations are present).
Red knots Calidris canutus (Linnaeus 1758) of the
northerly wintering subspecies C. c. islandica (hereafter
knots) are medium-sized (100–200 g) long-distance
migrant shorebirds. Because they live well in captivity
and have well-studied annual cycles and physiology
(Piersma, 2007; Buehler & Piersma, 2008; Piersma & van
Gils, 2011), we used them as a model to investigate
covariation among different physiological traits over
time and among individuals. Although many aspects of
knot physiology are flexible, in this study, we focus on
four traits: (i) haematocrit to represent the cardiovascu-
lar system, (ii) baseline corticosterone to represent the
endocrine system, (iii) BMR to represent metabolism
and (iv) aspects of constitutive (noninduced) immune
function to represent the immune system. Haematocrit is
the proportion of red blood cells per total blood volume
and, along with haemoglobin concentration and oxygen
affinity, determines blood oxygen-carrying capacity.
Increased haematocrit is associated with increased
oxygen-carrying capacity during increased workload in
migrating birds (Bairlein & Totzke, 1992; Piersma et al.,
1996; Prats et al., 1996), including associations between
haematocrit and premigratory mass gain in knots (Piersma
et al., 2000a; D.M. Buehler, unpublished); and with
cardiovascular responses accompanying changes in body
temperature in lizards (Snyder, 1977) and frogs (Withers
et al., 1991). Thus, haematocrit represents an easily
obtainable and widely measured aspect of the caridiovas-
cular system’s ability to deliver oxygen. Corticosterone is a
widely measured glucocorticoid hormone involved in the
onset and regulation of migratory movements and is
elevated in association with migration and arrival at
2 D. M. BUEHLER ET AL.
ª 2 0 1 2 T H E A U T H O R S . J . E V O L . B I O L . d o i : 1 0 . 1 1 1 1 / j . 1 4 2 0 - 9 1 0 1 . 2 0 1 2 . 0 2 5 4 3 . x
J O U R N A L O F E V O L U T I O N A R Y B I O L O G Y ª 2 0 1 2 E U R O P E A N S O C I E T Y F O R E V O L U T I O N A R Y B I O L O G Y

the breeding grounds in knots (Piersma et al., 2000b;
Reneerkens et al., 2002; Landys et al., 2004). Corti-
costerone may therefore be correlated with other
physiological processes known to vary in association
with migration including haematocrit (Piersma et al.,
1996, 2000a; Landys-Ciannelli et al., 2002), immune
function (Buehler et al., 2008b) and BMR (Vezina et al.,
2011).
In this study, we describe annual variation in
haematocrit and baseline corticosterone and combine
these data with previously published datasets of
immune function (Buehler et al., 2008b) and BMR
(Vezina et al., 2011) measured in the same individuals.
These birds were part of a yearlong experiment in
which we exposed them to cold, warm (thermoneutral)
or variable (tracking seasonal conditions) temperatures
to manipulate thermoregulatory costs and to uncouple
seasonal changes from physiological adjustments to
ambient temperature (see Buehler et al., 2008b; Vezina
et al., 2011 for details). Indices of immune function
were chosen to cover a range of protective functions
including the functional capacity of blood to limit
microbial infection (Tieleman et al., 2005; Millet et al.,
2007), concentrations of circulating immune cells and
levels of complement and natural antibodies. These
immune indices are seasonally variable but also repeat-
able characteristics of individual birds (Buehler et al.,
2008b); furthermore, they assay an evolutionarily
important branch of the immune system that provides
broad spectrum and immediate protection against
invaders. We used these combined data on haematocrit,
corticosterone, immune function and BMR to look at
covariation among traits over time and at the individual
level. If functional constraints give rise to physiological
syndromes, then we predict consistent covariation
within and among individuals. Furthermore, if func-
tional constraints underlie species-level patterns found
along the slow-fast pace-of-life continuum, then we
predict consistent correlations between physiological
and metabolic traits.
Functional constraint underlies relationships over time (relationships could also bepositive but must be consistent).
(a1) (b1)
(b2)
(b3)
(b4)
(a2)
(a3)
(a4)
No functional constraint: Trade-off necessary when food sources are frozen and ambienttemperature is low (Jan), however when resources are abundant both traits increase (May),while traits vary independently the rest of the year (Aug).
No functional constraint: In Jan trait A increases with short days while B decreases withlow temperature (independent responses to correlated aspects of the environment), in Mayboth traits increase with food intake (parallel responses to environment), in Aug trait Aincreases while B decreases with feather growth (opposite responses to the environment).
No functional constraint: A and B are independent and responding to independentaspects of the environment.
Trait A
Trai
t B
Trait A
Trai
t B
Trait A
Trai
t B
Trait A
Trai
t B
Trait A
Trai
t B
Trait A
Trai
t B
Trait A
Trai
t B
Trait A
Trai
t B
Trait A
Trai
t B
Trait A
Trai
t B
Trait A
Trai
t B
Trait A
Trai
t B
Winter (Jan) Peak Molt (Aug) Pre-migratory fattening (May)
Functional constraint underlies a single syndrome: All individuals show the same patternand pattern is the same as that seen among months.
No syndromes or functional constraint: Bird 2 shows all possible relationships over time(points represent multiple samplings) thus has no consistent syndrome.
Two syndromes are consistent over time within individuals, but all individuals are notlimited to a single relationship between A and B, therefore if physiological or otherconstraints exist, they are not universal.
No syndromes or functional constraint
Trait ATr
ait B
Trait A
Trai
t B
Trait A
Trai
t B
Trait A
Trai
t B
Trait A
Trai
t B
Trait A
Trai
t B
Trait A
Trai
t B
Trait ATr
ait B
Trait A
Trai
t B
Bird 1 Bird 2 Bird 3
Trait A
Trai
t B
Trait A
Trai
t B
Trait A
Trai
t B
(a) (b)
Fig. 1 Hypothetical scenarios illustrating how physiological traits A and B might covary both over time (a) and among individuals (b). Data
clouds are represented by ellipses, where the tilt, narrowness and colour of the ellipse represent the direction, strength and significance of
the correlations. In A points in the data cloud are individuals, and each graph in a row represents a month in the annual cycle (Jan, May or
Aug). In B points in the data cloud represent repeated samplings of the same individual, and each graph in a row represents a different
individual.
Lack of relationships among individual physiological traits 3
ª 2 0 1 2 T H E A U T H O R S . J . E V O L . B I O L . d o i : 1 0 . 1 1 1 1 / j . 1 4 2 0 - 9 1 0 1 . 2 0 1 2 . 0 2 5 4 3 . x
J O U R N A L O F E V O L U T I O N A R Y B I O L O G Y ª 2 0 1 2 E U R O P E A N S O C I E T Y F O R E V O L U T I O N A R Y B I O L O G Y

Materials and methods
Birds and experimental treatments
Knots were captured in the Dutch Wadden Sea (53�31¢N,
6�23¢E) in August and September 2004. We ringed,
weighed and aged (all > 2 years; Prater et al., 1977) birds
at capture, and sex was later determined using molecular
techniques (Baker et al., 1999). The birds were then
brought into captivity at the Royal Netherlands Institute
for Sea Research (NIOZ) where they had at least 1 month
to acclimate to captivity before the start of measure-
ments. The birds had free access to food (mudsnails
Hydrobia ulvae) and fresh water for drinking, and we set
photoperiod to track the seasonal changes in day length
in the northern Netherlands.
We randomly assigned birds (total n = 30, 21 females,
9 males) to three treatment groups in identical indoor
aviaries (4.5 · 1.5 · 2.3 m high). Birds in the variable
treatment (n = 12) were divided equally between two
aviaries ventilated with outdoor air and maintained at
outdoortemperature(meantemperatureof15.4 ± 4.8 �C).
Birds in the warm treatment (n = 12) were also divided
between two aviaries and were maintained at
24.7 ± 1.8 �C. Finally, birds in the cold treatment
(n = 6) were kept in a single aviary at 4.9 ± 1.2 �C (see
Buehler et al., 2008b and Vezina et al., 2006 for details).
All groups were similar in terms of sex ratio and
morphometrics (Vezina et al., 2006).
Over the course of the experiment, three individuals
died (all female, two from the cold treatment and one from
the warm treatment). Two of the causalities were replaced
meaning that a total of 32 individuals were studied during
the course of a year. We include all 12 months and
32 individuals in our univariate analysis of corticosterone
concentration and haematocrit. However, we use only
11 months (because we lack microbicidal capacity data for
1 month) and the 27 birds for which we have data for all
months for our analysis of covariation.
Measuring haematocrit, corticosterone and immunefunction
We took blood samples to assess haematocrit, baseline
levels of corticosterone and immune function every
month from March 2005 to March 2006 (mean ±
SD = 10 : 44 ± 5 min). Because both corticosterone con-
centration and aspects of immune function can be
affected by capture and handling, we took samples for
corticosterone analysis within 2 to 4 min of entering an
aviary (Wingfield et al., 1995) and samples for assays of
immune function within 20 min of entering an aviary
(Buehler et al., 2008a).
Haematocrit data were obtained by centrifuging 25 lL
of blood in a capillary tube for 12 min at 12 000 g and
reading the relative proportion of red blood cells to total
volume. Similarly, we obtained plasma for corticosterone
and plasma-based assays of immune function by centri-
fuging blood samples for 12 min at 12 000 g.
Plasma for corticosterone analysis was stored at )80 �Cand then shipped on dry ice to the Max Planck Institute
for Ornithology, Andechs. Corticosterone concentrations
were determined by direct radioimmunoassay (Goymann
et al., 2006), using antibody obtained from Esoterix
Endocrinology (Calabasas Hills, CA, USA). Extraction
efficiency was 87.7 ± 4.6% (± SD), as calculated from
trace amounts of tritiated hormone added to each sample
(NET 399; Perkin Elmer, Rodgau, Germany). Due to the
large number of samples, two assay runs were needed.
Intra-assay coefficients of variation (CV) were 10.7% and
10.6%, and inter-assay CV was 12.2%. The limits of
detection were 6.6 and 6.1 pg per tube in each assay run
(all samples were well above this limit).
We used data on aspects of constitutive (noninduced)
immune function published by Buehler et al. (2008b).
These data comprise three general protocols measuring
microbicidal capacity, leucocyte concentrations and com-
plement-like and natural antibody activity. Microbicidal
capacity measures the functional capacity of blood to
limit microbial infection (Tieleman et al., 2005; Millet
et al., 2007). This assay is commonly known as the
bacteria killing assay (BKA), but we stick to microbicidal
capacity because we also measure killing of yeast.
Differential leucocyte concentrations provide informa-
tion on circulating immune cells (Campbell & Ellis, 2007)
and are useful in their relationship to functional immune
assays such as microbicidal capacity (Buehler et al.,
2008b). Complement-like activity and natural antibodies
provide a first line of defence against spreading infections
and link innate and acquired immunity (Ochsenbein &
Zinkernagel, 2000). Here, we focus on the microbicidal
capacities of whole blood against E. coli (after 10 min
incubation), C. albicans (after 60 min) and S. aureus (after
120 min); circulating concentrations of heterophils, lym-
phocytes and monocytes; and haemolysis and hemag-
glutination titres assaying complement-like and natural
antibody activity against rabbit red blood cells.
Measuring metabolic rate
We used data on BMR published by Vezina et al. (2011).
Briefly, BMR was measured on two birds from the same
aviary each day over 15 consecutive days. The order in
which specific birds were measured was randomly
chosen, and the same order was kept for the duration
of the experiment. We removed food from the aviary at
17h00 the day before measuring BMR and the next
morning at 10h00 placed the two birds to be measured in
a holding box with water but without food (food was
returned to the other birds in the aviary). Measurements
began at 16h00 and lasted until 9h00 the following
morning. Birds were weighed before and after BMR
sessions, and average mass was used in the analysis. We
4 D. M. BUEHLER ET AL.
ª 2 0 1 2 T H E A U T H O R S . J . E V O L . B I O L . d o i : 1 0 . 1 1 1 1 / j . 1 4 2 0 - 9 1 0 1 . 2 0 1 2 . 0 2 5 4 3 . x
J O U R N A L O F E V O L U T I O N A R Y B I O L O G Y ª 2 0 1 2 E U R O P E A N S O C I E T Y F O R E V O L U T I O N A R Y B I O L O G Y

define BMR as the oxygen consumption ⁄ energy expen-
diture of a resting post-absorptive knot measured at night
and at thermoneutrality (see Vezina et al., 2006, 2007 for
setup and methods). In our analyses, we examine both
whole-organism BMR and mass-corrected BMR (the
residuals of a linear model between log BMR and log
body mass), the latter of which is a predictor of tissue-
level processes.
Statistical analyses
We performed all statistical analyses using the RR pro-
gramming environment (R Development Core Team,
2011) and report packages used in specific analyses
below. We used visual examination of histograms to
check data and model residuals for normality, and log10
transformed corticosterone and leucocyte concentrations
for all analyses.
Haematocrit and corticosterone among treatments andover the annual cycleWe used nested general linear models (lme in lme4 and
nlme) to investigate how haematocrit and baseline
corticosterone vary between treatments (main effect of
treatment) and over the annual cycle (main effect of
month). We also examined whether any differences
between the treatments depended on the time of year
(month · treatment) and whether there were sex
effects (main effect of sex, month · sex). Cage and
individual bird were included in all models as random
effects. We used similar nested general linear models to
generate residuals (corrected for the effects of treatment,
cage and month) for use in principle component
analysis. For univariate analyses examining how treat-
ment and season affect immune measures (including
immune PCs) and metabolism, we refer the reader to
Buehler et al. (2008b) and Vezina et al. (2011), respec-
tively.
Bivariate correlations to examine covariation over timeand among individualsBivariate correlations provide a simple way to look at
covariation among variables across multiple samplings
(or groups) without assuming that relationships among
variables are the same across samplings (Buehler et al.,
2011). We calculated Pearson correlation coefficients
within and among birds as described by Buehler et al.
(2011) and present these correlations as ellipses (Mur-
doch & Chow, 1996) modified to include representa-
tion of both r- and P-values (using ellipse, lattice,
Matrix, Hmisc; A. Cohen, pers. com.). Rather than
presenting a matrix with all pairwise correlations for
each month or individual, we reorganized the plots to
show BMR in columns (one column for each month or
bird) and the other physiological traits in rows. These
plots allow us to see how measures of immune
function, corticosterone and haematocrit covary with
metabolic rate and to gauge the consistency and
strength of correlations over time and among individ-
uals. We also present mean correlation coefficients (the
mean of 27 individuals per month or the mean of
11 months per individual), t-tests, 95% confidence
intervals and ranges for all trait pairs as a supplemen-
tary table (excluding immune index pairs that are
presented by Buehler et al., 2011). To determine
thresholds for statistical significance while accounting
for multiple comparisons, we employ two methods of
correction: sequential Bonferroni correction (Rice,
1989) and an approach based on False Discovery Rates
(Pike, 2011).
Principal component analysis (PCA) to examinecovariation among individualsWe were also interested in how metabolic rate, cortico-
sterone and haematocrit covary with immune function,
and we used PCA to reduce the number of immune
variables to a few orthogonal components. We calculated
principal component scores using varimax rotation
(psych), for consistency with Buehler et al. (2008b) using
the residuals of general linear models to take into
account multiple sampling (each bird is represented
11 times). Essentially this means we pooled months
within each bird assuming that relationships among
immune variables were similar across months (an
assumption proven reasonable by Buehler et al., 2011).
We did not pool individuals within months for a similar
analysis because the assumption that relationships
among immune variables are the same among individ-
uals is not valid (Buehler et al., 2011).
Results
Variation in haematocrit and corticosterone amongtreatments and over time
Similar to the previously reported effects of treatment on
body mass (Vezina et al., 2007; Buehler et al., 2008b),
birds in the cold treatment had consistently higher
haematocrit than birds in the warm treatment (compare
Fig. 2a,c), although this effect did not reach statistical
significance (F2,2 = 3.11, P = 0.24). Similarly, males had
consistently higher haematocrits than females, except in
September when levels in females approached those in
males (month · sex: F11,301 = 1.95, P = 0.03). Also like
body mass, birds in the variable treatment tended to have
higher haematocrit (approaching values in the cold
treatment) during the winter months, and lower values
in summer months (approaching values in the thermo-
neutral treatment; Fig. 2a,c). Again, this interaction was
not statistically significant (month · treatment:
F11,291 = 1.17, P = 0.28) and may have been masked by
an overall pattern of higher haematocrit in winter
months and lower haematocrit in summer for all treat-
ments (F11,313 = 10.61, P < 0.0001).
Lack of relationships among individual physiological traits 5
ª 2 0 1 2 T H E A U T H O R S . J . E V O L . B I O L . d o i : 1 0 . 1 1 1 1 / j . 1 4 2 0 - 9 1 0 1 . 2 0 1 2 . 0 2 5 4 3 . x
J O U R N A L O F E V O L U T I O N A R Y B I O L O G Y ª 2 0 1 2 E U R O P E A N S O C I E T Y F O R E V O L U T I O N A R Y B I O L O G Y

We found no significant effects of thermal treatments
or sex on corticosterone concentration, either as a
main effect (treatment: F2,2 = 0.75, P = 0.57, sex:
F1,26 = 2.09, P = 0.16) or depending on the time of
year (treatment · month: F22,230 = 0.41, P = 0.99,
sex · month: F11,241 = 1.69, P = 0.08). However, corti-
costerone did vary significantly among months over the
year (F11,252 = 3.95, P < 0.0001) with a pronounced
peak in late April to May coinciding with peak body
mass in preparation for migration (Fig. 2b,c). This peak
in corticosterone concentration seems present in the
warm and variable treatments, but not in the cold
treatment. Nevertheless, differences between these
groups in May and June did not reach statistical
significance (May F2,2 = 0.58, P = 0.63; June
F2,2 = 0.69, P = 0.59).
Consistency of intra-individual inter-seasonalcorrelations over time
We used bivariate correlations to examine the consistency
of intra-individual inter-seasonal correlations at the
month level. Figure 3 shows Pearson correlations
between whole animal BMR (in columns) and mass-
corrected BMR (rBMR), immune indices, corticosterone
concentration and haematocrit (in rows). We include
rBMR so that the strong and consistent correlation
between BMR and rBMR can serve as a point of reference
for the other correlations. BMR and rBMR are correlated
because when the majority of variation in BMR is not
related to mass (e.g. in this study mass explained < 50%
of variation in BMR on average), these measures repre-
sent nearly the same variable because rBMR is BMR with
variation due to mass removed (Tieleman et al., 2009).
Correlations in Fig. 3 are depicted as ellipses with tilt
indicating the direction, narrowness the strength, and
shading the significance of the relationship.
These ellipse plots clearly show a lack of correlations,
either positive or negative, between metabolism and
immune function, corticosterone or haematocrit over the
annual cycle (Fig. 3a; see Table 1 for abbreviations used
in the figures, tables and text). Furthermore, the few
correlations found were not consistent over time (e.g. Hct
was positively correlated with BMR in April during
Bod
y m
ass
(g)
Cor
ticos
tero
ne (n
g m
L–1 )
Hem
atoc
rit (p
rop
RB
C)
120
130
140
150
160
110
170
10
20
30
40
50
0
60
0.46
0.48
0.50
0.44
0.52
Apr May Jun Jul Aug Sep Oct Nov Dec Jan Feb Mar
(a)
(b)
(c)
Fig. 2 Haematocrit (a), corticosterone con-
centration (b) and body mass (c) measured in
red knots over the annual cycle. Dots and
error bars represent mean and standard error
per month in the warm (white), variable
(grey) and cold (black) treatments. See text
for statistics.
6 D. M. BUEHLER ET AL.
ª 2 0 1 2 T H E A U T H O R S . J . E V O L . B I O L . d o i : 1 0 . 1 1 1 1 / j . 1 4 2 0 - 9 1 0 1 . 2 0 1 2 . 0 2 5 4 3 . x
J O U R N A L O F E V O L U T I O N A R Y B I O L O G Y ª 2 0 1 2 E U R O P E A N S O C I E T Y F O R E V O L U T I O N A R Y B I O L O G Y

premigratory mass gain and negatively correlated during
June when birds are losing mass). T-tests for mean
correlation coefficients differing from zero confirmed this
lack of consistent relationships for all trait pairs (Table
3a). The lack of consistent correlations appears to be due
to actual heterogeneity in the correlations over the
annual cycle (and across individuals, see below), as
detected by a nested model of correlation structure (sensu
Cohen & McGraw, 2009), despite the limited sample size.
Consistency of inter-individual correlations
We used bivariate correlations and PCA analysis to
examine the consistency of inter-individual correlations
(averaged across seasons) at the bird level. The bivariate
correlations in Fig. 3b show that the general pattern at
the individual level is also a lack of correlations between
metabolism and other physiological traits. Again, where
correlations existed, they varied among individuals (e.g.
MCSa is negatively correlated with BMR in some but not
all individuals). T-tests revealed that among individuals,
more correlations differed significantly from zero than
when examining intra-individual patterns over time
(Table 3a vs. 3b). BMR and rBMR were negatively
correlated with MCSa, a pattern driven by negative
correlations between these traits in some but not all
individuals (Fig. 3b). In addition, Hct was negatively
correlated with MCEc and positively correlated with Lys
when correlation coefficients were averaged over all
individuals; however, the range of correlations includes
zero in both cases (Table 3b).
Not surprisingly, PCA analysis on a subset of the
immune data presented by Buehler et al. (2008b) gave
very similar loadings (Table S1) with Lym and Mon
falling together on PC1, Het, MCSa and MCCa falling on
PC2, and MCEc, Lys and Agg falling on PC3. Plotting
metabolic rate, corticosterone and haematocrit against
these principal components revealed no strong positive
or negative relationships (Fig. 4) and no statistically
significant correlations (Table 2). However, the plots in
Fig. 4 do reveal substantial differences among individuals
in the multivariate levels of these traits. This suggests that
a substantial proportion of variance in multivariate
physiology may be at the individual level.
Discussion
This study explored relationships among haematocrit,
baseline corticosterone concentration, constitutive
immune function and BMR in knot individuals.
Here, we briefly discuss variation in haematocrit and
corticosterone among treatments and over the annual
cycle and then consider our main finding of no evidence
for functional constraints limiting relationships among
these aspects of the cardiovascular, endocrine, immune
and metabolic systems in red knots.
Haematocrit and corticosterone among treatmentsand over the annual cycle
Haematocrit varied throughout the year according to
seasonal variation in temperature. Not surprisingly, this
Table 1 Abbreviations used in tables and figures.
Physiological variables
BMR Basal metabolic rate
rBMR Residual (mass-corrected) BMR
Hct Haematocrit
Cort Corticosterone concentration
Het Heterophil concentration
Lym Lymphocyte concentration
Mon Monocyte concentration
MCSa Microbicidal capacity against S. aureus
MCCa Microbicidal capacity against C. albicans
MCEc Microbicidal capacity against E. coli
Lys Complement-mediated lysis
Agg Natural antibody-mediated agglutination
rBMR
MCEc
MCCa
MCSa
Agg
Lys
Het
Lym
Mon
Cort
Hct
Migration Summer &peak moult
A M J J A S O N D J F
Winter
P < 1e-04
P < 0.001
P < 0.01
P < 0.05
P < 0.1
P > 0.1
rBMRMCEcMCCaMCSa
AggLysHet
LymMonCortHct
Variable 1 Variable 2 Warm 1 Warm 2 Cold
Variable treatment Warm treatment Cold
(a)
(b)
Fig. 3 Pearson correlations between BMR (columns) and mass-
corrected BMR, corticosterone concentration, haematocrit and
immune indices (rows) over an annual cycle (a, 11 columns per
months) and in individuals (b, n = 27 columns per birds). Each
ellipse represents a correlation from (a) 27 birds within a given
month, or (b) 11 months within a given bird. Right-tilted ellipses
indicate positive correlations and left-tilted ellipses negative corre-
lations. The narrowness of ellipses is proportional to r-values and the
shading to P-values (see legend).
Lack of relationships among individual physiological traits 7
ª 2 0 1 2 T H E A U T H O R S . J . E V O L . B I O L . d o i : 1 0 . 1 1 1 1 / j . 1 4 2 0 - 9 1 0 1 . 2 0 1 2 . 0 2 5 4 3 . x
J O U R N A L O F E V O L U T I O N A R Y B I O L O G Y ª 2 0 1 2 E U R O P E A N S O C I E T Y F O R E V O L U T I O N A R Y B I O L O G Y

pattern was most pronounced in the variable treatment
where haematocrit was higher during the winter
months, approaching the cold-acclimated birds, and
lower in summer months, approaching the thermo-
neutral treatment (see trend in Fig. 2a). Furthermore,
birds in the cold treatment had higher haematocrit than
birds in the warm treatment (see trend in Fig. 2a)
consistent with previous studies examining the effect of
temperature on haematocrit (Kubena et al., 1972; Fair
et al., 2007). That these patterns associated with treat-
ments did not reach statistical significance may have
been due to small samples sizes, and we recommend that
more numerous and sex-balanced samples be used in
future studies.
Haematocrit also showed a small peak during premi-
gratory mass gain (most pronounced in the cold and
variable treatments where mass gain was also largest;
Fig. 2a,c). Increased haematocrit implies more red blood
cells and higher oxygen-carrying capacity and might
occur in conjunction with circannually programmed
muscle hypertrophy in preparation for migration (Dietz
et al., 1999). Associations between haematocrit and
premigratory mass gain have been found in captive
knots (Piersma et al., 2000a); and in free-living knots
Bas
al m
etab
olic
rate
(wat
ts)
Mas
s-co
rrec
ted
BM
R (w
atts
)C
ortic
oste
rone
(ng
mL–
1 )H
emat
ocrit
(pro
p R
BC
)
Immune PC1(Mon, Lym)
Immune PC2(Het, MCSa, MCCa)
Immune PC3(MCEc, Lys, Agg)
–1.0 –0.5 0.0 0.5 1.0 –1.0 –0.5 0.0 0.5 1.0 –1.0 –0.5 0.0 0.5 1.0
–1.0 –0.5 0.0 0.5 1.0 –1.0 –0.5 0.0 0.5 1.0 –1.0 –0.5 0.0 0.5 1.0
–1.0 –0.5 0.0 0.5 1.0 –1.0 –0.5 0.0 0.5 1.0 –1.0 –0.5 0.0 0.5 1.0
–1.0 –0.5 0.0 0.5 1.0 –1.0 –0.5 0.0 0.5 1.0 –1.0 –0.5 0.0 0.5 1.0
–0.02
0.00
0.02
0.04
–0.04
0.06
–0.04
–0.02
0.00
0.02
0.04
–0.6
–0.4
–0.2
0.0
0.2
0.4
–0.04
–0.02
0.00
0.02
0.04
0.06
–0.04
–0.02
0.00
0.02
0.04
0.06
–0.04
–0.02
0.00
0.02
0.04
–0.6
–0.4
–0.2
0.0
0.2
0.4
–0.04
–0.02
0.00
0.02
0.04
0.06
–0.04
–0.02
0.00
0.02
0.04
0.06
–0.04
–0.02
0.00
0.02
0.04
–0.6
–0.4
–0.2
0.0
0.2
0.4
–0.04
–0.02
0.00
0.02
0.04
0.06
Fig. 4 Correlations between BMR, mass-corrected BMR, corticosterone concentration and haematocrit (rows) and principle components
of immune function (see Table S2 for loadings). Data points represent the mean ± SE of 11 monthly measurements taken in individual
birds (n = 27 points). See Table 2 for statistics.
8 D. M. BUEHLER ET AL.
ª 2 0 1 2 T H E A U T H O R S . J . E V O L . B I O L . d o i : 1 0 . 1 1 1 1 / j . 1 4 2 0 - 9 1 0 1 . 2 0 1 2 . 0 2 5 4 3 . x
J O U R N A L O F E V O L U T I O N A R Y B I O L O G Y ª 2 0 1 2 E U R O P E A N S O C I E T Y F O R E V O L U T I O N A R Y B I O L O G Y

(t = 2.764, P = 0.007, D. M. Buehler, unpublished) and
bar-tailed godwits Limosa lapponica (Piersma et al., 1996;
Landys-Ciannelli et al., 2002).
Plasma corticosterone concentration peaked in late
April to early May, coinciding with peak migratory mass
gain (Fig. 2b,c), a pattern found previously in knots
(Piersma et al., 2000b; Landys et al., 2004). Differences
between the temperature treatments were largest during
this peak period with birds in the warm and variable
treatments showing pronounced peaks, whereas birds in
the cold treatment lacked the peak altogether (Fig. 2b).
This general pattern suggests that annual variation in
corticosterone is not dependent on photoperiod alone
and that ambient temperature may also play a role.
Furthermore, the link between increased corticosterone
and hyperphagia appears to be uncoupled in our data
because birds in the warm treatment had the highest
corticosterone peak but gained the least mass (Fig. 2b,c).
No evidence for functional constraint amongphysiological systems
If functional constraints limit the range of relationships
possible among physiological systems, then we expected
consistent patterns of covariation among the physiolog-
ical traits we measured (resembling Fig. 1a1,b1). Further
more, if physiological syndromes exist, then we expected
physiological traits to covary consistently within and
among individuals (Fig. 1b1,b2). Our results are not
consistent with either hypothesis. The ellipse plots clearly
show a lack of correlations, either positive or negative,
between immune function, corticosterone, haematocrit
and BMR (Fig. 3), and the few correlations that do exist
are not consistently present across months or individuals.
For example, Hct is positively correlated with BMR in
April and September, negatively correlated in June and
uncorrelated the rest of the year; and MCSa is negatively
correlated with BMR in some, but not all individuals
(akin to Fig. 1b3). Table 3b shows a few additional
relationships when averaging across all individuals,
namely a negative relationship between Hct and MCEc
and a positive relationship between Hct and Lys. How-
ever, looking at the range of possible correlations reveals
that some individuals show no correlation or even the
opposite pattern (all ranges include zero except BMR–
rBMR). This indicates the same lack of consistency as can
be seen visually in Fig. 3b for correlations between BMR
and MCSa.
Testing the simplified hypotheses presented in Fig. 1
(other than a1 and b1) will require further experiments.
For example, manipulation of access to resources to test
for trade-offs (a2) combined with measurements of
multiple physiological variables, and a multivariate
analysis of how variables covary in the experimental
groups. Nevertheless, our findings clearly indicate incon-
sistent correlation structures within-species for physio-
logical variables both across seasons and among
individuals. This is concordant with similar findings for
immune variables (Matson et al., 2006; Buehler et al.,
2011) and antioxidant measures (Cohen & McGraw,
2009).
We further predicted consistent correlations between
physiological and metabolic traits if functional con-
straints underlie species-level patterns found along the
slow-fast Pace-of-Life continuum; however, we found no
such correlations. This result agrees with a study carried
out on stonechats Saxicola torquata, which found that
neither corticosterone concentration or two of three PCs
of immune function covaried with mass-corrected BMR
(rBMR) (Versteegh, 2012), the one PC that did covary
with metabolism included Lys and Agg and showed a
negative relationship. Another study, on housewrens
Troglodytes aedon, found a negative relationship between
MCEc and rBMR at the individual level (Tieleman et al.,
2005). Both the stonechat and housewren studies
showed that patterns of covariation among immune,
endocrine and metabolic traits differed between the
levels of species, subspecies and individual birds. Fur-
thermore, relationships more complex than a single
pace-of-life axis have been found between antioxidants
and individual life-history traits at the interspecies level
(Cohen et al., 2008). Taken together, these results suggest
that the phenomenon of a single pace-of-life axis does
not result from universal physiological constraints (contra
Lande, 1979; Ricklefs & Wikelski, 2002).
It is important to remember, however, that just
because some physiological measures are not consistently
correlated, it does not follow that all are not. We only
measured one trait in each of the cardiovascular, endo-
crine and metabolic systems and only one branch of
immune function. Relationships among physiological,
metabolic and demographic traits exist at the species
level, and our findings at the individual level do not
contradict this. However, our findings, and those of
others (Tieleman et al., 2005; Cohen et al., 2008; Vers-
Table 2 Pearson correlations between BMR, mass-corrected BMR,
corticosterone concentration and haematocrit, and principle
components of immune function (see Table S1 for loadings).
Immune Function r P-value
Basal metabolic rate (watts) PC1 0.01 0.98
PC2 )0.03 0.90
PC3 )0.28 0.16
Mass-corrected BMR (watts) PC1 0.12 0.55
PC2 0.22 0.28
PC3 0.03 0.89
Corticosterone (ng mL)1) PC1 0.11 0.60
PC2 0.35 0.07
PC3 0.10 0.61
Haematocrit (prop RBC) PC1 0.14 0.47
PC2 0.07 0.72
PC3 0.08 0.68
Lack of relationships among individual physiological traits 9
ª 2 0 1 2 T H E A U T H O R S . J . E V O L . B I O L . d o i : 1 0 . 1 1 1 1 / j . 1 4 2 0 - 9 1 0 1 . 2 0 1 2 . 0 2 5 4 3 . x
J O U R N A L O F E V O L U T I O N A R Y B I O L O G Y ª 2 0 1 2 E U R O P E A N S O C I E T Y F O R E V O L U T I O N A R Y B I O L O G Y

Table 3 Mean correlation coefficients (in increasing order) between physiological variables measured in red knots (see Table 1 for
abbreviations). The mean correlation coefficient over the annual cycle (a) is calculated from 11 correlations (months) each with n = 27
birds. The mean correlation coefficient among birds (b) is calculated from 27 correlations (birds) each with n = 11 months. Unadjusted
P-values are presented, and bold text denotes correlations significantly different from zero using thresholds determined by sequential
Bonferroni correction (Rice, 1989) and all three False Discovery Rate methods (Pike, 2011). Only 38 of 66 possible pairs are shown here;
pairs of immune variables (e.g. Het-MCSa or Lym-Mon) are reported by Buehler et al. (2011).
Pair of variables Mean r over the year t-value d.f. P-value 95% confidence interval Range
(a)
BMR-MCEc )0.135 )1.999 10 0.0735 )0.279 to 0.016 )0.277 to 0.078
BMR-Mon )0.133 )3.283 10 0.0083 )0.220 to )0.043 )0.426 to 0.213
BMR-Cort )0.101 )1.571 10 0.1473 )0.240 to 0.042 )0.397 to 0.280
rBMR-MCCa )0.090 )1.384 10 0.1966 )0.232 to 0.055 )0.376 to 0.198
BMR-MCCa )0.068 )1.150 10 0.2768 )0.197 to 0.063 )0.297 to 0.240
BMR-Lys )0.066 )1.203 10 0.2566 )0.186 to 0.056 )0.241 to 0.300
Hct-MCSa )0.065 )0.701 10 0.4994 )0.266 to 0.141 )0.378 to 0.292
BMR-Agg )0.043 )0.526 10 0.6104 )0.220 to 0.137 )0.358 to 0.255
BMR-MCSa )0.038 )0.737 10 0.4779 )0.153 to 0.077 )0.417 to 0.270
rBMR-Mon )0.038 )0.903 10 0.3878 )0.131 to 0.056 )0.249 to 0.306
rBMR-MCSa )0.035 )0.639 10 0.5375 )0.154 to 0.086 )0.230 to 0.274
Cort-MCSa )0.035 )0.599 10 0.5623 )0.162 to 0.094 )0.319 to 0.159
rBMR-Cort )0.030 )0.423 10 0.6813 )0.186 to 0.128 )0.344 to 0.330
rBMR-MCEc )0.023 )0.385 10 0.7083 )0.153 to 0.108 )0.293 to 0.329
Cort-Hct )0.017 )0.223 10 0.8278 )0.188 to 0.154 )0.506 to 0.432
Hct-Agg )0.009 )0.149 10 0.8848 )0.143 to 0.125 )0.245 to 0.442
rBMR-Het )0.003 )0.042 10 0.9670 )0.148 to 0.142 )0.225 to 0.413
Hct-MCCa 0.006 0.079 10 0.9390 )0.158 to 0.169 )0.410 to 0.339
BMR-Het 0.014 0.224 10 0.8273 )0.126 to 0.153 )0.321 to 0.211
Cort-MCCa 0.016 0.258 10 0.8016 )0.121 to 0.152 )0.490 to 0.358
BMR-Lym 0.023 0.374 10 0.7164 )0.112 to 0.156 )0.304 to 0.323
rBMR-Lym 0.033 0.563 10 0.5856 )0.098 to 0.163 )0.325 to 0.397
rBMR-Lys 0.041 0.793 10 0.4463 )0.074 to 0.155 )0.388 to 0.336
Hct-MCEc 0.048 0.745 10 0.4732 )0.096 to 0.190 )0.287 to 0.484
Cort-Mon 0.049 0.557 10 0.5898 )0.145 to 0.239 )0.149 to 0.404
rBMR-Agg 0.050 0.629 10 0.5437 )0.126 to 0.222 )0.342 to 0.459
Hct-Lys 0.054 0.983 10 0.3488 )0.069 to 0.176 )0.313 to 0.655
Hct-Het 0.055 0.813 10 0.4352 )0.095 to 0.203 )0.303 to 0.317
Cort-Agg 0.056 0.995 10 0.3432 )0.070 to 0.180 )0.322 to 0.343
Cort-Het 0.075 1.053 10 0.3170 )0.083 to 0.229 )0.220 to 0.497
rBMR-Hct 0.096 1.181 10 0.2650 )0.085 to 0.270 )0.244 to 0.248
Cort-Lym 0.106 1.563 10 0.1491 )0.045 to 0.253 )0.305 to 0.410
Cort-Lys 0.115 2.113 10 0.0607 )0.006 to 0.232 )0.465 to 0.435
Hct-Mon 0.117 2.213 10 0.0513 )0.001 to 0.231 )0.466 to 0.404
BMR-Hct 0.124 1.446 10 0.1787 )0.067 to 0.306 )0.373 to 0.398
Cort-MCEc 0.135 1.573 10 0.1467 )0.056 to 0.316 )0.126 to 0.364
Hct-Lym 0.162 3.483 10 0.0059 0.059–0.261 )0.105 to 0.317
BMR–rBMR 0.854 11.777 10 < 0.0001 0.774–0.907 0.573–0.954
(b)
Hct-MCEc )0.403 )6.217 26 < 0.0001 )0.514 to )0.279 )0.749 to 0.256
rBMR-MCSa )0.299 )4.045 26 0.0004 )0.434 to )0.151 )0.789 to 0.350
BMR-MCSa )0.289 )3.761 26 0.0009 )0.430 to )0.134 )0.849 to 0.382
rBMR-Cort )0.231 )2.564 26 0.0165 )0.401 to )0.047 )0.934 to 0.523
rBMR-MCCa )0.187 )2.555 26 0.0168 )0.329 to )0.037 )0.798 to 0.574
rBMR-Het )0.162 )1.897 26 0.0690 )0.327 to 0.014 )0.728 to 0.614
rBMR-Hct )0.157 )2.114 26 0.0443 )0.302 to )0.004 )0.651 to 0.791
BMR-Cort )0.135 )1.459 26 0.1566 )0.316 to 0.056 )0.646 to 0.476
BMR-MCEc )0.103 )1.381 26 0.1790 )0.252 to 0.050 )0.843 to 0.442
rBMR-Lys )0.097 )1.436 26 0.1630 )0.233 to 0.042 )0.777 to 0.597
BMR-MCCa )0.081 )0.996 26 0.3284 )0.243 to 0.086 )0.758 to 0.416
BMR-Mon )0.076 )0.928 26 0.3620 )0.240 to 0.092 )0.477 to 0.650
BMR-Hct )0.074 )1.133 26 0.2674 )0.206 to 0.060 )0.729 to 0.443
10 D. M. BUEHLER ET AL.
ª 2 0 1 2 T H E A U T H O R S . J . E V O L . B I O L . d o i : 1 0 . 1 1 1 1 / j . 1 4 2 0 - 9 1 0 1 . 2 0 1 2 . 0 2 5 4 3 . x
J O U R N A L O F E V O L U T I O N A R Y B I O L O G Y ª 2 0 1 2 E U R O P E A N S O C I E T Y F O R E V O L U T I O N A R Y B I O L O G Y
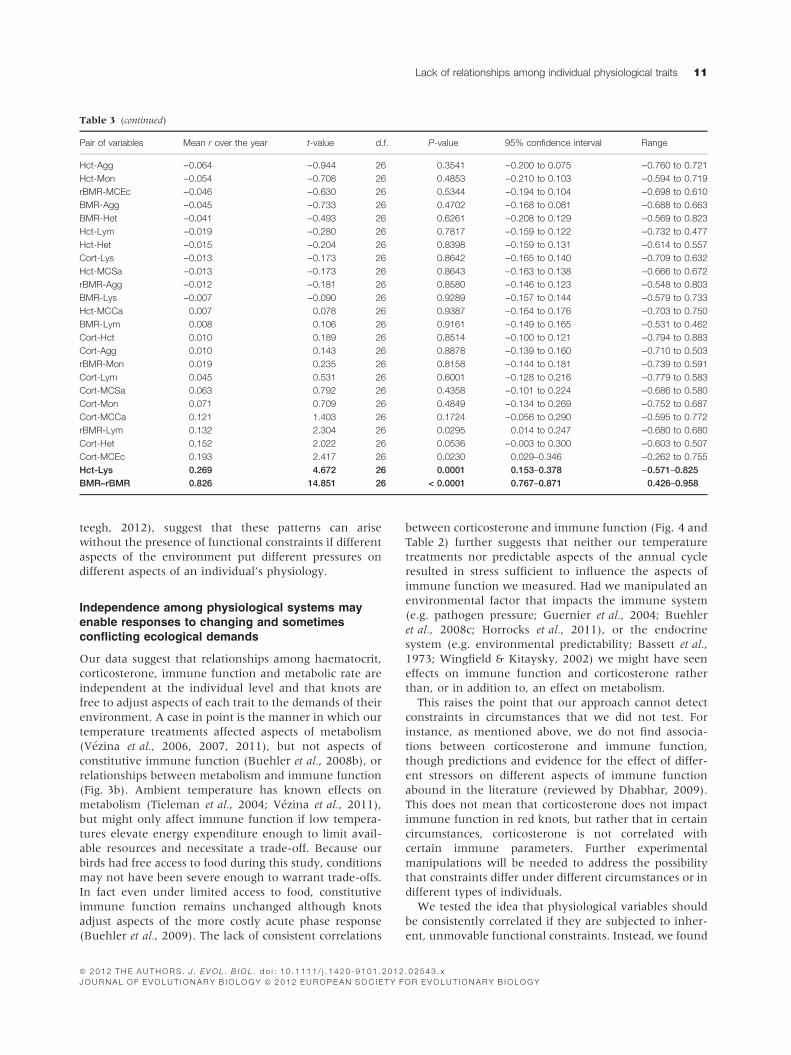
teegh, 2012), suggest that these patterns can arise
without the presence of functional constraints if different
aspects of the environment put different pressures on
different aspects of an individual’s physiology.
Independence among physiological systems mayenable responses to changing and sometimesconflicting ecological demands
Our data suggest that relationships among haematocrit,
corticosterone, immune function and metabolic rate are
independent at the individual level and that knots are
free to adjust aspects of each trait to the demands of their
environment. A case in point is the manner in which our
temperature treatments affected aspects of metabolism
(Vezina et al., 2006, 2007, 2011), but not aspects of
constitutive immune function (Buehler et al., 2008b), or
relationships between metabolism and immune function
(Fig. 3b). Ambient temperature has known effects on
metabolism (Tieleman et al., 2004; Vezina et al., 2011),
but might only affect immune function if low tempera-
tures elevate energy expenditure enough to limit avail-
able resources and necessitate a trade-off. Because our
birds had free access to food during this study, conditions
may not have been severe enough to warrant trade-offs.
In fact even under limited access to food, constitutive
immune function remains unchanged although knots
adjust aspects of the more costly acute phase response
(Buehler et al., 2009). The lack of consistent correlations
between corticosterone and immune function (Fig. 4 and
Table 2) further suggests that neither our temperature
treatments nor predictable aspects of the annual cycle
resulted in stress sufficient to influence the aspects of
immune function we measured. Had we manipulated an
environmental factor that impacts the immune system
(e.g. pathogen pressure; Guernier et al., 2004; Buehler
et al., 2008c; Horrocks et al., 2011), or the endocrine
system (e.g. environmental predictability; Bassett et al.,
1973; Wingfield & Kitaysky, 2002) we might have seen
effects on immune function and corticosterone rather
than, or in addition to, an effect on metabolism.
This raises the point that our approach cannot detect
constraints in circumstances that we did not test. For
instance, as mentioned above, we do not find associa-
tions between corticosterone and immune function,
though predictions and evidence for the effect of differ-
ent stressors on different aspects of immune function
abound in the literature (reviewed by Dhabhar, 2009).
This does not mean that corticosterone does not impact
immune function in red knots, but rather that in certain
circumstances, corticosterone is not correlated with
certain immune parameters. Further experimental
manipulations will be needed to address the possibility
that constraints differ under different circumstances or in
different types of individuals.
We tested the idea that physiological variables should
be consistently correlated if they are subjected to inher-
ent, unmovable functional constraints. Instead, we found
Table 3 (continued)
Pair of variables Mean r over the year t-value d.f. P-value 95% confidence interval Range
Hct-Agg )0.064 )0.944 26 0.3541 )0.200 to 0.075 )0.760 to 0.721
Hct-Mon )0.054 )0.708 26 0.4853 )0.210 to 0.103 )0.594 to 0.719
rBMR-MCEc )0.046 )0.630 26 0.5344 )0.194 to 0.104 )0.698 to 0.610
BMR-Agg )0.045 )0.733 26 0.4702 )0.168 to 0.081 )0.688 to 0.663
BMR-Het )0.041 )0.493 26 0.6261 )0.208 to 0.129 )0.569 to 0.823
Hct-Lym )0.019 )0.280 26 0.7817 )0.159 to 0.122 )0.732 to 0.477
Hct-Het )0.015 )0.204 26 0.8398 )0.159 to 0.131 )0.614 to 0.557
Cort-Lys )0.013 )0.173 26 0.8642 )0.165 to 0.140 )0.709 to 0.632
Hct-MCSa )0.013 )0.173 26 0.8643 )0.163 to 0.138 )0.666 to 0.672
rBMR-Agg )0.012 )0.181 26 0.8580 )0.146 to 0.123 )0.548 to 0.803
BMR-Lys )0.007 )0.090 26 0.9289 )0.157 to 0.144 )0.579 to 0.733
Hct-MCCa 0.007 0.078 26 0.9387 )0.164 to 0.176 )0.703 to 0.750
BMR-Lym 0.008 0.106 26 0.9161 )0.149 to 0.165 )0.531 to 0.462
Cort-Hct 0.010 0.189 26 0.8514 )0.100 to 0.121 )0.794 to 0.883
Cort-Agg 0.010 0.143 26 0.8878 )0.139 to 0.160 )0.710 to 0.503
rBMR-Mon 0.019 0.235 26 0.8158 )0.144 to 0.181 )0.739 to 0.591
Cort-Lym 0.045 0.531 26 0.6001 )0.128 to 0.216 )0.779 to 0.583
Cort-MCSa 0.063 0.792 26 0.4358 )0.101 to 0.224 )0.686 to 0.580
Cort-Mon 0.071 0.709 26 0.4849 )0.134 to 0.269 )0.752 to 0.687
Cort-MCCa 0.121 1.403 26 0.1724 )0.056 to 0.290 )0.595 to 0.772
rBMR-Lym 0.132 2.304 26 0.0295 0.014 to 0.247 )0.680 to 0.680
Cort-Het 0.152 2.022 26 0.0536 )0.003 to 0.300 )0.603 to 0.507
Cort-MCEc 0.193 2.417 26 0.0230 0.029–0.346 )0.262 to 0.755
Hct-Lys 0.269 4.672 26 0.0001 0.153–0.378 )0.571–0.825
BMR–rBMR 0.826 14.851 26 < 0.0001 0.767–0.871 0.426–0.958
Lack of relationships among individual physiological traits 11
ª 2 0 1 2 T H E A U T H O R S . J . E V O L . B I O L . d o i : 1 0 . 1 1 1 1 / j . 1 4 2 0 - 9 1 0 1 . 2 0 1 2 . 0 2 5 4 3 . x
J O U R N A L O F E V O L U T I O N A R Y B I O L O G Y ª 2 0 1 2 E U R O P E A N S O C I E T Y F O R E V O L U T I O N A R Y B I O L O G Y

independence among physiological traits; independence
that makes sense if one places the animal firmly within
its environment where constraints might differ under
different circumstances. Although each physiological
system may function as a cohesive module (i.e. sym-
morphosis Weibel, 2000; Piersma & van Gils, 2011),
these systems must flexibly ‘cooperate’ to maximize
fitness in different ecological contexts (Schlichting &
Smith, 2002). Our findings highlight the notion that
ecological as well as functional constraints should be
considered when examining patterns of covariance
among phenotypic traits.
Acknowledgments
We thank Y. Verkuil for helpful discussions and B.
Sheldon, A. Cohen and anonymous reviewers for
improvements on earlier drafts. Financial support came
from grants to DMB from the Natural Science and
Engineering Council of Canada (NSERC-PDF) and the
Netherlands Organization for Scientific Research (NWO-
Rubicon); to TP from The Royal Netherlands Institute for
Sea Research; to BIT from NWO and a Rosalind Franklin
fellowship from the University of Groningen; and to FV
from NSERC and NWO.
References
Ardia, D.R., Parmentier, H.K. & Vogel, L.A. 2011. The role of
constraints and limitation in driving individual variation in
immune response. Funct. Ecol. 25: 61–73.
Bairlein, F. & Totzke, U. 1992. New aspects on migratory
physiology of trans-saharan passerine migrants. Ornis Scand.
23: 244–250.
Baker, A.J., Piersma, T. & Greenslade, A.D. 1999. Molecular vs.
phenotypic sexing in red knots. Condor 101: 887–893.
Bassett, J.R., Cairncross, K.D. & King, M.G. 1973. Parameters of
novelty, shock predictability and response contingency in
corticosterone release in the rat. Horm. Behav. 10: 901–907.
Bell, A.M. 2007. Future directions in behavioural syndromes
research. P. Roy. Soc. B Bio. 274: 755–761.
Buehler, D.M. & Piersma, T. 2008. Travelling on a budget:
predictions and ecological evidence for bottlenecks in the
annual cycle of long-distance migrants. Philos. T Roy. Soc. B
363: 247–266.
Buehler, D.M., Bhola, N., Barjaktarov, D., Goymann, W.,
Schwabl, I., Tieleman, B.I. et al. 2008a. Constitutive immune
function responds more slowly to handling stress than
corticosterone in a shorebird. Physiol. Biochem. Zool. 81: 673–
681.
Buehler, D.M., Piersma, T., Matson, K. & Tieleman, B.I. 2008b.
Seasonal redistribution of immune function in a shorebird:
annual-cycle effects override adjustments to thermal regime.
Amer. Nat. 172: 783–796.
Buehler, D.M., Piersma, T. & Tieleman, B.I. 2008c. Captive
and free-living red knots Calidris canutus exhibit differences
in non-induced immunity that suggest different immune
strategies in different environments. J. Avian Biol. 39: 560–
566.
Buehler, D.M., Encinas-Viso, F., Petit, M., Vezina, F., Tieleman,
B.I. & Piersma, T. 2009. Limited access to food and physio-
logical trade-offs in a long distance migrant shorebird part II:
constitutive immune function and the acute-phase response.
Physiol. Biochem. Zool. 82: 561–571.
Buehler, D.M., Versteegh, M., Matson, K.D. & Tieleman, B.I.
2011. One problem, many solutions: simple statistical
approaches help unravel the complexity of the immune
system in an ecological context. PLoS ONE 6: e18592.
Campbell, T.W. & Ellis, C.K. 2007. Avian and Exotic Animal
Hematology and Cytology, 3rd edn. Wiley-Blackwell, Ames, IA.
Cohen, A.A. & McGraw, K.J. 2009. No simple measures for
antioxidant status in birds: complexity in inter- and intraspe-
cific correlations among circulating antioxidant types. Funct.
Ecol. 23: 310–320.
Cohen, A., McGraw, K., Wiersma, P., Williams, J., Robinson, W.,
Robinson, T. et al. 2008. Interspecific associations between
circulating antioxidant levels and life-history variation in
birds. Am. Nat. 172: 178–193.
Dhabhar, F.S. 2009. A hassle a day may keep the pathogens
away: the fight-or-flight stress response and the augmentation
of immune function. Int. Comp. Biol. 49: 215–236.
Dhabhar, F.S., Miller, A.H., McEwen, B.S. & Spencer, R.L. 1995.
Effects of stress on immune cell distribution. Dynamics and
hormonal mechanisms. J. Immunol. 154: 5511–5527.
Dietz, M., Piersma, T. & Dekinga, A. 1999. Body building without
power training: endogenously regulated pectoral muscle hyper-
trophy in confined shorebirds. J. Exp. Biol. 202: 2831–2837.
Fair, J., Whitaker, S. & Pearson, B. 2007. Sources of variation in
haematocrit in birds. Ibis 149: 535–552.
Goymann, W., Trappschuh, M., Jensen, W. & Schwabl, I. 2006.
Low ambient temperature increases food intake and dropping
production, leading to incorrect estimates of hormone
metabolite concentrations in European stonechats. Horm.
Behav. 49: 644–653.
Guernier, V., Hochberg, M.E. & Guegan, J.-F. 2004. Ecology
drives the worldwide distribution of human diseases. PLoS
Biol. 2: e141.
Horrocks, N.P.C., Matson, K.D. & Tieleman, B.I. 2011. Pathogen
pressure puts immune defence into perspective. Int. Comp. Biol.
51: 563–576.
Kubena, L.F., May, J.D., Reece, F.N. & Deaton, J.W. 1972.
Hematocrit and hemoglobin of broilers as influenced by
environmental temperature and dietary iron level. Poultry
Sci. 51: 759–763.
Lande, R. 1979. Quantitative genetic-analysis of multivariate
evolution, applied to brain – body size allometry. Evolution 33:
402–416.
Lande, R. & Arnold, S.J. 1983. The measurement of selection on
correlated characters. Evolution 37: 1210–1226.
Landys, M.M., Piersma, T., Ramenofsky, M. & Wingfield, J.C.
2004. Role of the low-affinity glucocorticoid receptor in the
regulation of behavior and energy metabolism in the migra-
tory red knot Calidris canutus islandica. Physiol. Biochem. Zool.
77: 658–668.
Landys, M.M., Ramenofsky, M. & Wingfield, J.C. 2006. Actions
of glucocorticoids at seasonal baseline versus stress-related
levels in the regulation of periodic life processes. Gen. Comp.
Endocr. 148: 132–149.
Landys-Ciannelli, M.M., Jukema, J. & Piersma, T. 2002. Blood
parameter changes during stopover in a long-distance migra-
12 D. M. BUEHLER ET AL.
ª 2 0 1 2 T H E A U T H O R S . J . E V O L . B I O L . d o i : 1 0 . 1 1 1 1 / j . 1 4 2 0 - 9 1 0 1 . 2 0 1 2 . 0 2 5 4 3 . x
J O U R N A L O F E V O L U T I O N A R Y B I O L O G Y ª 2 0 1 2 E U R O P E A N S O C I E T Y F O R E V O L U T I O N A R Y B I O L O G Y

tory shorebird, the bar-tailed godwit Limosa lapponica taymyr-
ensis. J. Avian Biol. 33: 451–455.
Lochmiller, R.L. & Deerenberg, C. 2000. Trade-offs in evolu-
tionary immunology: just what is the cost of immunity? Oikos
88: 87–98.
Matson, K.D., Cohen, A.A., Klasing, K.C., Ricklefs, R.E. &
Scheuerlein, A. 2006. No simple answers for ecological
immunology: relationships among immune indices at the
individual level break down at the species level in waterfowl.
P. Roy. Soc. B Bio. 273: 815–822.
Millet, S., Bennet, J., Lee, K.A., Hau, M. & Klasing, K.C. 2007.
Quantifying and comparing constitutive immunity across
avian species. Dev. Comp. Immunol. 31: 188–201.
Murdoch, D. & Chow, E. 1996. A graphical display of large
correlation matrices. Am. Stat. 50: 178–180.
Ochsenbein, A.F. & Zinkernagel, R.M. 2000. Natural antibodies
and complement link innate and acquired immunity. Immu-
nol. Today 21: 624–630.
Pfennig, D.W., Wund, M.A., Snell-Rood, E.C., Cruickshank, T.,
Schlichting, C.D. & Moczek, A.P. 2010. Phenotypic plasticity’s
impacts on diversification and speciation. Trends Ecol. Evol. 25:
459–467.
Piersma, T. 2007. Using the power of comparison to explain
habitat use and migration strategies of shorebirds worldwide.
J. Ornithol. 148: S45–S59.
Piersma, T. & van Gils, J. 2011. The Flexible Phenotype. A Body-
Centered Integration of Ecology, Physiology and Behaviour. Oxford
University Press, Oxford.
Piersma, T., Everaarts, J.M. & Jukema, J. 1996. Build-up of red
blood cells in refueling bar-tailed godwits in relation to
individual migratory quality. Condor 98: 363–370.
Piersma, T., Koolhaas, A., Dekinga, A. & Gwinner, E. 2000a. Red
blood cell and white blood cell counts in sandpipers (Philo-
machus pugnax, Calidris canutus): effects of captivity, season,
nutritional status and frequent bleedings. Can. J. Zool. 78:
1349–1355.
Piersma, T., Reneerkens, J. & Ramenofsky, M. 2000b. Baseline
corticosterone peaks in shorebirds with maximal energy stores
for migration: a general preparatory mechanism for rapid
behavioral and metabolic transitions? Gen. Comp. Endocr. 120:
118–126.
Pike, N. 2011. Using false discovery rates for multiple compar-
isons in ecology and evolution. Method Ecol. Evol. 2: 278–282.
Prater, A.J., Marchant, J.H. & Vuorinen, J. 1977. Guide to the
Identification and Aging of Holarctic Waders. British Trust for
Ornithology, Tring, UK.
Prats, M.-T., Palacios, L., Gallego, S. & Riera, M. 1996. Blood
oxygen transport properties during migration to higher alti-
tude of wild quail, Coturnix coturnix coturnix. Physiol. Zool. 69:
912–929.
Promislow, D.E.L. & Harvey, P.H. 1990. Living fast and dying
young: a comparative analysis of life-history variation among
mammals. J. Zool. 220: 417–437.
R Development Core Team. 2011. R: A Language and Environment
for Statistical Computing. R Foundation for Statistical Comput-
ing, http://www.R-project.org, Vienna, Austria.
Ramenofsky, M. & Wingfield, J.C. 2006. Behavioural and
physiological conflicts in migrants: the transition between
migration and breeding. J. Ornithol. 147: 135–145.
Reneerkens, J., Morrison, R.I.G., Ramenofsky, M., Piersma, T. &
Wingfield, J.C. 2002. Baseline and stress-induced levels of the
corticosterone during different life cycle substages in a
shorebird on the High Arctic breeding grounds. Physiol.
Biochem. Zool. 75: 200–208.
Rice, W.R. 1989. Analyzing tables of statistical tests. Evolution 43:
223–225.
Ricklefs, R.E. 2000. Density dependence, evolutionary optimi-
zation, and the diversification of avian life histories. Condor
102: 9–22.
Ricklefs, R.E. & Wikelski, M. 2002. The physiology ⁄ lifehistory
nexus. Trends Ecol. Evol. 17: 462–468.
Roff, D.A. & Fairbairn, D.J. 2007. The evolution of trade-offs:
where are we? J. Evol. Biol. 20: 433–447.
Schlichting, C.D. & Smith, H. 2002. Phenotypic plasticity: linking
molecular mechanisms with evolutionary outcomes. Evol.
Ecol. 16: 189–211.
Schwenk, K. & Wagner, G.P. 2001. Function and the evolution
of phenotypic stability: connecting pattern to process. Am.
Zool. 41: 552–563.
Snyder, G.K. 1977. Influence of temperature and hematocrit on
blood viscosity. Am. J. Physiol. 220: 1667–1672.
Speakman, J.R. 2005. Body size, energy metabolism and
lifespan. J. Exp. Biol. 208: 1717–1730.
Tieleman, B.I., Williams, J.B. & Visser, G.H. 2004. Energy and
water budgets of larks in a life history perspective: parental
effort varies with aridity. Ecology 85: 1399–1410.
Tieleman, B.I., Williams, J.B., Ricklefs, R.E. & Klasing, K.C.
2005. Constitutive innate immunity is a component of the
pace-of-life syndrome in tropical birds. P. Roy. Soc. B Bio. 272:
1715–1720.
Tieleman, B.I., Versteegh, M.A., Helm, B. & Dingemanse, N.J.
2009. Quantitative genetics parameters show partial
independent evolutionary potential for body mass and
metabolism in stonechats from different populations. J. Zool.
279: 129–136.
Versteegh, M.A. 2012. Physiology in a Life History Perspective. PhD
thesis, University of Groningen, Groningen, The Netherlands.
Vezina, F., Jalvingh, K.M., Dekinga, A. & Piersma, T. 2006.
Acclimation to different thermal conditions in a northerly
wintering shorebird is driven by body mass-related changes in
organ size. J. Exp. Biol. 209: 3141–3154.
Vezina, F., Jalvingh, K.M., Dekinga, A. & Piersma, T. 2007.
Thermogenic side effects to migratory predisposition in
shorebirds. Am. J. Physiol. – Reg I. 292: 1287–1297.
Vezina, F., Dekinga, A. & Piersma, T. 2010. Phenotypic
compromise in the face of conflicting ecological demands: an
example in red knots Calidris canutus. J. Avian Biol. 41: 88–93.
Vezina, F., Dekinga, A. & Piersma, T. 2011. Shorebirds’
seasonal adjustments in thermogenic capacity are reflected
by changes in body mass: how preprogrammed and instan-
taneous acclimation work together Int. Comp. Biol. 51: 394–
408.
Vezina, F., Williams, T.D., Piersma, T. & Morrison, R.I.G. 2012.
Phenotypic compromises in long-distance migrating shore-
birds: consequences of coping with cold during the life-stage
transition from migration to reproduction in the High Arctic.
Funct. Ecol. 26: 500–512.
Weibel, E.R. 2000. Symmorphosis: On Form and Function in Shaping
Life. Harvard University Press, Cambridge, MA.
West-Eberhard, M.J. 2003. Developmental Plasticity and Evolution.
Oxford University Press, New York, NY.
Wingfield, J.C. & Kitaysky, A.S. 2002. Endocrine responses to
unpredictable environmental events: stress or anti-stress
hormones? Int. Comp. Biol. 42: 600–609.
Lack of relationships among individual physiological traits 13
ª 2 0 1 2 T H E A U T H O R S . J . E V O L . B I O L . d o i : 1 0 . 1 1 1 1 / j . 1 4 2 0 - 9 1 0 1 . 2 0 1 2 . 0 2 5 4 3 . x
J O U R N A L O F E V O L U T I O N A R Y B I O L O G Y ª 2 0 1 2 E U R O P E A N S O C I E T Y F O R E V O L U T I O N A R Y B I O L O G Y

Wingfield, J.C., O’Reilly, K.M. & Astheimer, L.B. 1995. Modu-
lation of the adrenocortical responses to acute stress in arctic
birds: a possible ecological basis. Am. Zool. 35: 285–294.
Withers, P.C., Hillman, S.S., Hedrick, M.S. & Kimmel, P.B. 1991.
Optimal hematocrit theory during activity in the bullfrog
(Rana catesbeiana). Comp. Biochem. Physiol. A 99: 55–60.
Supporting information
Additional Supporting Information may be found in the
online version of this article:
Table S1 Principal component loadings (after varimax
rotation) among individuals (monthly measures pooled).
The highest loading for a measure across the components
is shown in bold.
As a service to our authors and readers, this journal
provides supporting information supplied by the authors.
Such materials are peer-reviewed and may be re-
organized for online delivery, but are not copy-edited
or typeset. Technical support issues arising from support-
ing information (other than missing files) should be
addressed to the authors.
Data deposited at Dryad: doi: 10.5061/dryad.4q6f1
Received 1 March 2012; revised 18 April 2012; accepted 23 April 2012
14 D. M. BUEHLER ET AL.
ª 2 0 1 2 T H E A U T H O R S . J . E V O L . B I O L . d o i : 1 0 . 1 1 1 1 / j . 1 4 2 0 - 9 1 0 1 . 2 0 1 2 . 0 2 5 4 3 . x
J O U R N A L O F E V O L U T I O N A R Y B I O L O G Y ª 2 0 1 2 E U R O P E A N S O C I E T Y F O R E V O L U T I O N A R Y B I O L O G Y