Embed Size (px)
Citation preview

INDIA METEOROLOGICAL DEPARTMENT
(MINISTRY OF EARTH SCIENCES)
SOUTHWEST MONSOON
� For the country as a whole, the rainfall for the season (June
long period average (LPA). However, for the North West India this figure came out to
79% and 53% of its LPA for the Uttar Pradesh.
� Seasonal rainfall was 58% of its LPA over East Uttar Prasad and 44% of its LPA over
West Uttar Pradesh.
� Out of the total 71 districts of Uttar Pradesh 01 district constituting 01% of the total
area of the State received excess season rainfall, 02 districts constituting 03% of the
total area of the State received normal season rainfall, 42 districts constituting 59% of
the total area of the State received deficient season rainfall and 26 districts constituting
37% of the total area of the State received scanty rainfall.
� Monthly rainfall over the state Uttar Pradesh a whole was 40% of LPA in June, 70% of
LPA in July, 39% of LPA in August and 56% of LPA in September.
� Monsoon current advanced over the Andaman Sea 2 days earlier than its normal date
of 20th May. However, it set in over Kerala on 6th June, 5 days later than its normal
date of 1st June. It entered in East Uttar Prad
normal dates of 15th
June and covered whole Uttar Pradesh 14 days later i.e. on 14
July. The southwest monsoon currents covered the entire country by 17th July, 2 days
later than its normal date of 15th July.
� Withdrawal of monsoon from West Uttar Pradesh commenced on 27
against its normal date of 15
18th
October.
� During the season, 1 Cyclonic Storm (Nanauk), 2 monsoon depressions and 10
monsoon low pressure areas were formed as against the normal of 6 monsoon
depressions and 6 monsoon low pressure areas per season.
� The forecast for monsoon onset over Kerala for this year was correct, which is the tenth
consecutive correct forecast for this event s
started in 2005.
� Forecast Probability for below normal monsoon was 71% for North West India as per
the operational long range forecasts for the southwest monsoon 2014 forecast update
issued in August 2014. The fo
August) and that for the second half of the monsoon season over the North West India
as a whole remained within the forecast limits.
INDIA METEOROLOGICAL DEPARTMENT
(MINISTRY OF EARTH SCIENCES)
SOUTHWEST MONSOON-2014
END OF SEASON REPORT
For the state of
UTTAR PRADESH
HIGHLIGHTS
For the country as a whole, the rainfall for the season (June-September) was 88% of its
long period average (LPA). However, for the North West India this figure came out to
79% and 53% of its LPA for the Uttar Pradesh.
Seasonal rainfall was 58% of its LPA over East Uttar Prasad and 44% of its LPA over
1 districts of Uttar Pradesh 01 district constituting 01% of the total
area of the State received excess season rainfall, 02 districts constituting 03% of the
total area of the State received normal season rainfall, 42 districts constituting 59% of
al area of the State received deficient season rainfall and 26 districts constituting
37% of the total area of the State received scanty rainfall.
Monthly rainfall over the state Uttar Pradesh a whole was 40% of LPA in June, 70% of
A in August and 56% of LPA in September.
Monsoon current advanced over the Andaman Sea 2 days earlier than its normal date
of 20th May. However, it set in over Kerala on 6th June, 5 days later than its normal
date of 1st June. It entered in East Uttar Pradesh on 17th
June, 2 days later than its
June and covered whole Uttar Pradesh 14 days later i.e. on 14
July. The southwest monsoon currents covered the entire country by 17th July, 2 days
later than its normal date of 15th July.
drawal of monsoon from West Uttar Pradesh commenced on 27th
against its normal date of 15th
September and it completely withdrew from the state on
During the season, 1 Cyclonic Storm (Nanauk), 2 monsoon depressions and 10
ow pressure areas were formed as against the normal of 6 monsoon
depressions and 6 monsoon low pressure areas per season.
The forecast for monsoon onset over Kerala for this year was correct, which is the tenth
consecutive correct forecast for this event since issuing of forecast for the event was
Forecast Probability for below normal monsoon was 71% for North West India as per
the operational long range forecasts for the southwest monsoon 2014 forecast update
issued in August 2014. The forecasts for the monthly rainfall (for the months July and
August) and that for the second half of the monsoon season over the North West India
as a whole remained within the forecast limits.
September) was 88% of its
long period average (LPA). However, for the North West India this figure came out to
Seasonal rainfall was 58% of its LPA over East Uttar Prasad and 44% of its LPA over
1 districts of Uttar Pradesh 01 district constituting 01% of the total
area of the State received excess season rainfall, 02 districts constituting 03% of the
total area of the State received normal season rainfall, 42 districts constituting 59% of
al area of the State received deficient season rainfall and 26 districts constituting
Monthly rainfall over the state Uttar Pradesh a whole was 40% of LPA in June, 70% of
Monsoon current advanced over the Andaman Sea 2 days earlier than its normal date
of 20th May. However, it set in over Kerala on 6th June, 5 days later than its normal
June, 2 days later than its
June and covered whole Uttar Pradesh 14 days later i.e. on 14th
July. The southwest monsoon currents covered the entire country by 17th July, 2 days
th September
September and it completely withdrew from the state on
During the season, 1 Cyclonic Storm (Nanauk), 2 monsoon depressions and 10
ow pressure areas were formed as against the normal of 6 monsoon
The forecast for monsoon onset over Kerala for this year was correct, which is the tenth
ince issuing of forecast for the event was
Forecast Probability for below normal monsoon was 71% for North West India as per
the operational long range forecasts for the southwest monsoon 2014 forecast update
recasts for the monthly rainfall (for the months July and
August) and that for the second half of the monsoon season over the North West India
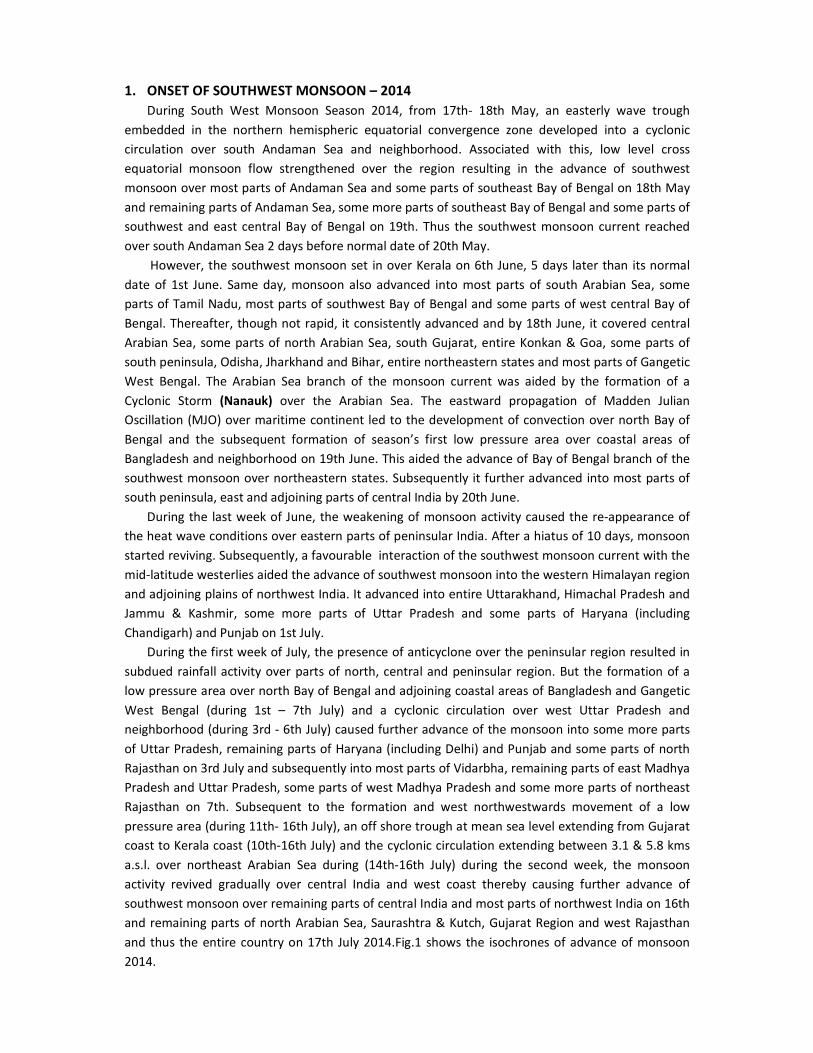
1. ONSET OF SOUTHWEST MONSOON – 2014
During South West Monsoon Season 2014, from 17th- 18th May, an easterly wave trough
embedded in the northern hemispheric equatorial convergence zone developed into a cyclonic
circulation over south Andaman Sea and neighborhood. Associated with this, low level cross
equatorial monsoon flow strengthened over the region resulting in the advance of southwest
monsoon over most parts of Andaman Sea and some parts of southeast Bay of Bengal on 18th May
and remaining parts of Andaman Sea, some more parts of southeast Bay of Bengal and some parts of
southwest and east central Bay of Bengal on 19th. Thus the southwest monsoon current reached
over south Andaman Sea 2 days before normal date of 20th May.
However, the southwest monsoon set in over Kerala on 6th June, 5 days later than its normal
date of 1st June. Same day, monsoon also advanced into most parts of south Arabian Sea, some
parts of Tamil Nadu, most parts of southwest Bay of Bengal and some parts of west central Bay of
Bengal. Thereafter, though not rapid, it consistently advanced and by 18th June, it covered central
Arabian Sea, some parts of north Arabian Sea, south Gujarat, entire Konkan & Goa, some parts of
south peninsula, Odisha, Jharkhand and Bihar, entire northeastern states and most parts of Gangetic
West Bengal. The Arabian Sea branch of the monsoon current was aided by the formation of a
Cyclonic Storm (Nanauk) over the Arabian Sea. The eastward propagation of Madden Julian
Oscillation (MJO) over maritime continent led to the development of convection over north Bay of
Bengal and the subsequent formation of season’s first low pressure area over coastal areas of
Bangladesh and neighborhood on 19th June. This aided the advance of Bay of Bengal branch of the
southwest monsoon over northeastern states. Subsequently it further advanced into most parts of
south peninsula, east and adjoining parts of central India by 20th June.
During the last week of June, the weakening of monsoon activity caused the re-appearance of
the heat wave conditions over eastern parts of peninsular India. After a hiatus of 10 days, monsoon
started reviving. Subsequently, a favourable interaction of the southwest monsoon current with the
mid-latitude westerlies aided the advance of southwest monsoon into the western Himalayan region
and adjoining plains of northwest India. It advanced into entire Uttarakhand, Himachal Pradesh and
Jammu & Kashmir, some more parts of Uttar Pradesh and some parts of Haryana (including
Chandigarh) and Punjab on 1st July.
During the first week of July, the presence of anticyclone over the peninsular region resulted in
subdued rainfall activity over parts of north, central and peninsular region. But the formation of a
low pressure area over north Bay of Bengal and adjoining coastal areas of Bangladesh and Gangetic
West Bengal (during 1st – 7th July) and a cyclonic circulation over west Uttar Pradesh and
neighborhood (during 3rd - 6th July) caused further advance of the monsoon into some more parts
of Uttar Pradesh, remaining parts of Haryana (including Delhi) and Punjab and some parts of north
Rajasthan on 3rd July and subsequently into most parts of Vidarbha, remaining parts of east Madhya
Pradesh and Uttar Pradesh, some parts of west Madhya Pradesh and some more parts of northeast
Rajasthan on 7th. Subsequent to the formation and west northwestwards movement of a low
pressure area (during 11th- 16th July), an off shore trough at mean sea level extending from Gujarat
coast to Kerala coast (10th-16th July) and the cyclonic circulation extending between 3.1 & 5.8 kms
a.s.l. over northeast Arabian Sea during (14th-16th July) during the second week, the monsoon
activity revived gradually over central India and west coast thereby causing further advance of
southwest monsoon over remaining parts of central India and most parts of northwest India on 16th
and remaining parts of north Arabian Sea, Saurashtra & Kutch, Gujarat Region and west Rajasthan
and thus the entire country on 17th July 2014.Fig.1 shows the isochrones of advance of monsoon
2014.

Fig.1: Isochrones of advance of Monsoon 2014
2. CHIEF SYNOPTIC FEATURES:
Strong cross equatorial flow prevailed during July and August. The presence of ridge and
formation of Cyclonic Storm over Arabian Sea prevented the cross equatorial flow to actually reach
the west coast of peninsular India during first half of June. It was weak during later part of the
September as well.
The axis of monsoon trough mostly remained normal/South of its normal position during
July and first half of September. It extended up to mid troposphere levels without its characteristic
tilt. It mostly remained North of its normal position /close to foot hills of Himalayas during August.
The seasonal ‘heat low’ was less demarcated since second half of August except for first half of
September, when it became noticeable. Thereafter, it became less apparent and subsequently, the
axis of monsoon trough also weakened thereby becoming less delineated since 22nd September.
With the shifting of monsoon trough to the foot hills of Himalayas during the month of August, the
circulation features and rainfall pattern resembled typical break like situation during 15th – 21st
August.
During the season, 13 low pressure systems formed. These included 10 low pressure areas,
one cyclonic storm (CS), a land depression and a deep depression. Tracks of the depressions and the
CS are given in Fig.2. Out of the 10 low pressure areas formed during the season (against the season
normal of 6), 8 (3 of them well marked) formed over the Bay of Bengal and two (as well marked)
over the Arabian Sea. The monthly break up is 1 in June, 3 in July, 3 in August and 3 in September.
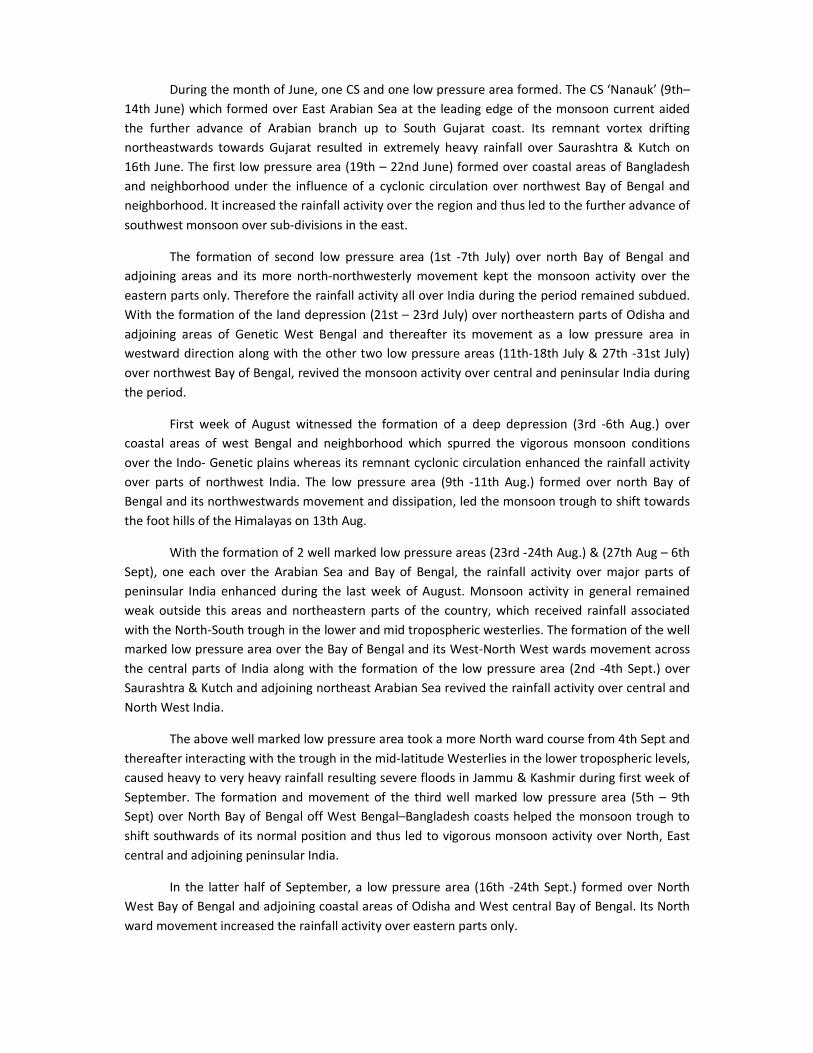
During the month of June, one CS and one low pressure area formed. The CS ‘Nanauk’ (9th–
14th June) which formed over East Arabian Sea at the leading edge of the monsoon current aided
the further advance of Arabian branch up to South Gujarat coast. Its remnant vortex drifting
northeastwards towards Gujarat resulted in extremely heavy rainfall over Saurashtra & Kutch on
16th June. The first low pressure area (19th – 22nd June) formed over coastal areas of Bangladesh
and neighborhood under the influence of a cyclonic circulation over northwest Bay of Bengal and
neighborhood. It increased the rainfall activity over the region and thus led to the further advance of
southwest monsoon over sub-divisions in the east.
The formation of second low pressure area (1st -7th July) over north Bay of Bengal and
adjoining areas and its more north-northwesterly movement kept the monsoon activity over the
eastern parts only. Therefore the rainfall activity all over India during the period remained subdued.
With the formation of the land depression (21st – 23rd July) over northeastern parts of Odisha and
adjoining areas of Genetic West Bengal and thereafter its movement as a low pressure area in
westward direction along with the other two low pressure areas (11th-18th July & 27th -31st July)
over northwest Bay of Bengal, revived the monsoon activity over central and peninsular India during
the period.
First week of August witnessed the formation of a deep depression (3rd -6th Aug.) over
coastal areas of west Bengal and neighborhood which spurred the vigorous monsoon conditions
over the Indo- Genetic plains whereas its remnant cyclonic circulation enhanced the rainfall activity
over parts of northwest India. The low pressure area (9th -11th Aug.) formed over north Bay of
Bengal and its northwestwards movement and dissipation, led the monsoon trough to shift towards
the foot hills of the Himalayas on 13th Aug.
With the formation of 2 well marked low pressure areas (23rd -24th Aug.) & (27th Aug – 6th
Sept), one each over the Arabian Sea and Bay of Bengal, the rainfall activity over major parts of
peninsular India enhanced during the last week of August. Monsoon activity in general remained
weak outside this areas and northeastern parts of the country, which received rainfall associated
with the North-South trough in the lower and mid tropospheric westerlies. The formation of the well
marked low pressure area over the Bay of Bengal and its West-North West wards movement across
the central parts of India along with the formation of the low pressure area (2nd -4th Sept.) over
Saurashtra & Kutch and adjoining northeast Arabian Sea revived the rainfall activity over central and
North West India.
The above well marked low pressure area took a more North ward course from 4th Sept and
thereafter interacting with the trough in the mid-latitude Westerlies in the lower tropospheric levels,
caused heavy to very heavy rainfall resulting severe floods in Jammu & Kashmir during first week of
September. The formation and movement of the third well marked low pressure area (5th – 9th
Sept) over North Bay of Bengal off West Bengal–Bangladesh coasts helped the monsoon trough to
shift southwards of its normal position and thus led to vigorous monsoon activity over North, East
central and adjoining peninsular India.
In the latter half of September, a low pressure area (16th -24th Sept.) formed over North
West Bay of Bengal and adjoining coastal areas of Odisha and West central Bay of Bengal. Its North
ward movement increased the rainfall activity over eastern parts only.
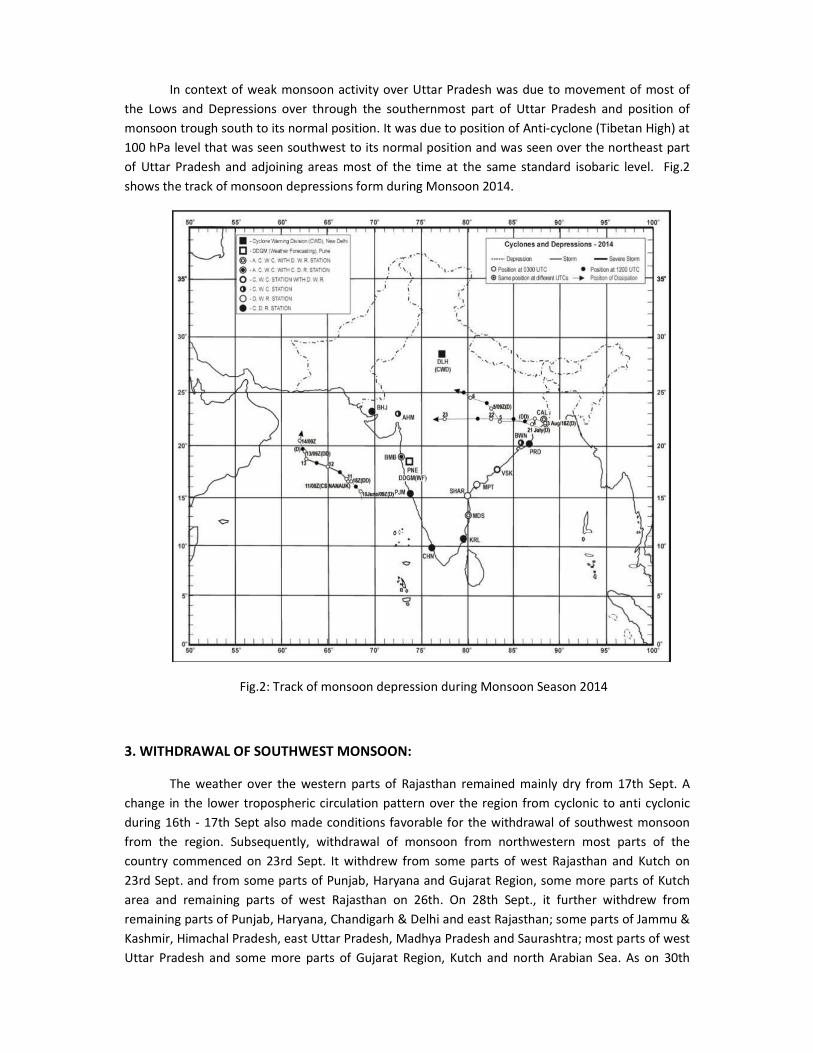
In context of weak monsoon activity over Uttar Pradesh was due to movement of most of
the Lows and Depressions over through the southernmost part of Uttar Pradesh and position of
monsoon trough south to its normal position. It was due to position of Anti-cyclone (Tibetan High) at
100 hPa level that was seen southwest to its normal position and was seen over the northeast part
of Uttar Pradesh and adjoining areas most of the time at the same standard isobaric level. Fig.2
shows the track of monsoon depressions form during Monsoon 2014.
Fig.2: Track of monsoon depression during Monsoon Season 2014
3. WITHDRAWAL OF SOUTHWEST MONSOON:
The weather over the western parts of Rajasthan remained mainly dry from 17th Sept. A
change in the lower tropospheric circulation pattern over the region from cyclonic to anti cyclonic
during 16th - 17th Sept also made conditions favorable for the withdrawal of southwest monsoon
from the region. Subsequently, withdrawal of monsoon from northwestern most parts of the
country commenced on 23rd Sept. It withdrew from some parts of west Rajasthan and Kutch on
23rd Sept. and from some parts of Punjab, Haryana and Gujarat Region, some more parts of Kutch
area and remaining parts of west Rajasthan on 26th. On 28th Sept., it further withdrew from
remaining parts of Punjab, Haryana, Chandigarh & Delhi and east Rajasthan; some parts of Jammu &
Kashmir, Himachal Pradesh, east Uttar Pradesh, Madhya Pradesh and Saurashtra; most parts of west
Uttar Pradesh and some more parts of Gujarat Region, Kutch and north Arabian Sea. As on 30th

September, the withdrawal line passed through Jammu, Una, Bareilly, Kanpur, Nowgong, Ujjain,
Vadodara, Porbandar , Lat. 22 N/ Long. 65 E and Lat. 22 N / Long. 60 E. On 15th
October monsoon
completely withdrew from Uttar Pradesh. Fig.3 shows the isochrones of withdrawal of Monsoon
2014.
. Fig.3: Isochrones of withdrawal of Monsoon 2014
4. RAINFALL DISTRIBUTION (JUNE- SEPTEMBER 2014):
The rainfall during monsoon season (June to September) for the State as a whole and its two
meteorological sub- divisions are as follows :
Region Actual
(in mm)
Long period average
(LPA)
( in mm)
Departure from
normal
( in %)
Uttar Pradesh 447.6 846.5 -47
East- UP 518.1 897.5 -42
West-UP 340.3 768.8 -56
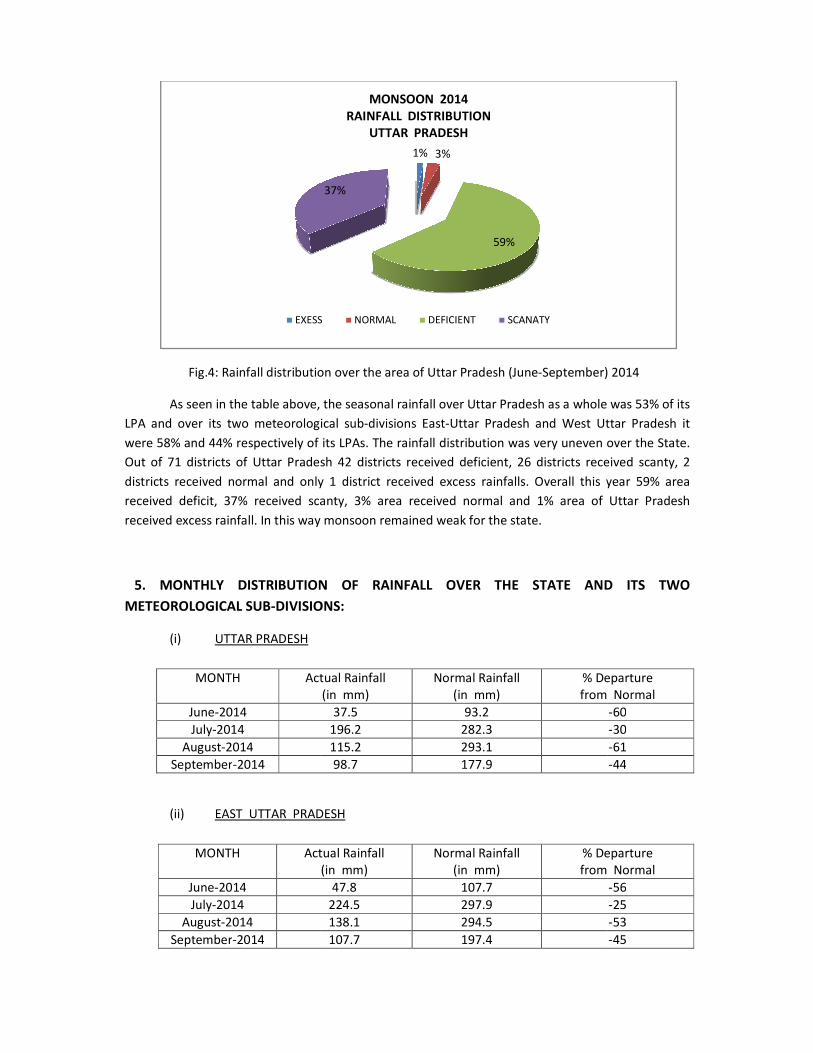
Fig.4: Rainfall distribution over the area of Uttar Pradesh (June
As seen in the table above, t
LPA and over its two meteorological sub
were 58% and 44% respectively of its LPA
Out of 71 districts of Uttar Pradesh 42 districts received deficient, 26 districts received scanty, 2
districts received normal and only 1 district received excess rainfalls. Overall this year 59% area
received deficit, 37% received scanty, 3% area received normal and 1% area of Uttar Pradesh
received excess rainfall. In this way monsoon remained weak for the state.
5. MONTHLY DISTRIBUTION
METEOROLOGICAL SUB-DIVISIONS:
(i) UTTAR PRADESH
MONTH Actual Rainfall
June-2014
July-2014
August-2014
September-2014
(ii) EAST UTTAR PRADESH
MONTH Actual Rainfall
(in mm)
June-2014
July-2014
August-2014
September-2014
EXESS
Fig.4: Rainfall distribution over the area of Uttar Pradesh (June-September) 2014
seen in the table above, the seasonal rainfall over Uttar Pradesh as a whole was 53% of its
LPA and over its two meteorological sub-divisions East-Uttar Pradesh and West Uttar Pradesh
of its LPAs. The rainfall distribution was very uneven over the State.
Out of 71 districts of Uttar Pradesh 42 districts received deficient, 26 districts received scanty, 2
districts received normal and only 1 district received excess rainfalls. Overall this year 59% area
received scanty, 3% area received normal and 1% area of Uttar Pradesh
received excess rainfall. In this way monsoon remained weak for the state.
MONTHLY DISTRIBUTION OF RAINFALL OVER THE STATE AND I
DIVISIONS:
Actual Rainfall
(in mm)
Normal Rainfall
(in mm)
% Departure
from Normal
37.5 93.2
196.2 282.3
115.2 293.1
98.7 177.9
EAST UTTAR PRADESH
Actual Rainfall
(in mm)
Normal Rainfall
(in mm)
% Departure
from Normal
47.8 107.7
224.5 297.9
138.1 294.5
107.7 197.4
1% 3%
59%
37%
MONSOON 2014
RAINFALL DISTRIBUTION
UTTAR PRADESH
EXESS NORMAL DEFICIENT SCANATY
September) 2014
as a whole was 53% of its
Uttar Pradesh and West Uttar Pradesh it
was very uneven over the State.
Out of 71 districts of Uttar Pradesh 42 districts received deficient, 26 districts received scanty, 2
districts received normal and only 1 district received excess rainfalls. Overall this year 59% area
received scanty, 3% area received normal and 1% area of Uttar Pradesh
OVER THE STATE AND ITS TWO
% Departure
from Normal
-60
-30
-61
-44
% Departure
from Normal
-56
-25
-53
-45
(iii) WEST UTTAR PRADESH
MONTH
June-2014
July-2014
August-2014
September-2014
Fig.5: Rainfall distribution over the area of East
Fig.6: Rainfall distribution over the area of
MONSOON 2014 RAINFALL DISTRIBUTION EAST UTTAR PRADESH
EXESS
MONSOON 2014 RAINFALL DISTRIBUTION WEST UTTAR PRADESH
WEST UTTAR PRADESH
Actual Rainfall
(in mm)
Normal Rainfall
(in mm)
% Departure
from
218 71.1
153.1 258.4
80.4 291.0
85.0 148.3
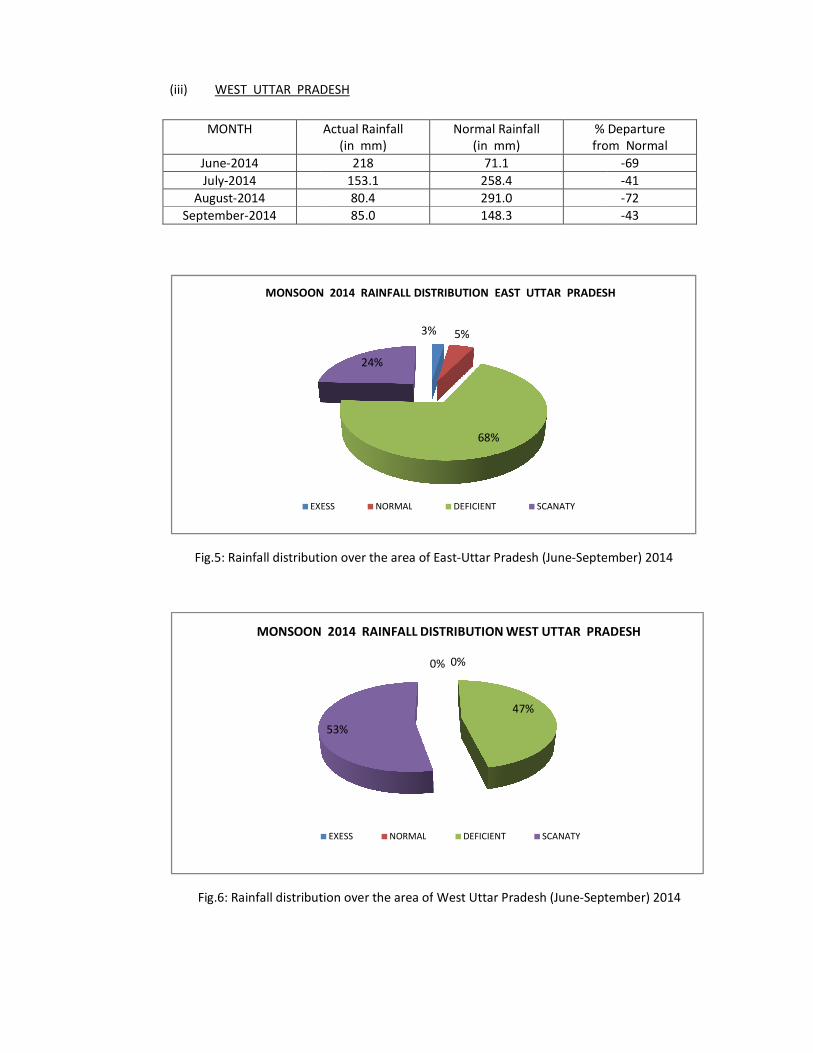
Fig.5: Rainfall distribution over the area of East-Uttar Pradesh (June-September) 2014
distribution over the area of West Uttar Pradesh (June-September) 2014
3% 5%
68%
24%
MONSOON 2014 RAINFALL DISTRIBUTION EAST UTTAR PRADESH
EXESS NORMAL DEFICIENT SCANATY
0% 0%
47%
53%
MONSOON 2014 RAINFALL DISTRIBUTION WEST UTTAR PRADESH
EXESS NORMAL DEFICIENT SCANATY
% Departure
from Normal
-69
-41
-72
-43
September) 2014
September) 2014
MONSOON 2014 RAINFALL DISTRIBUTION EAST UTTAR PRADESH
MONSOON 2014 RAINFALL DISTRIBUTION WEST UTTAR PRADESH
From the above tables, the month wise rainfall over the state during June and
August was scanty and July and September was deficient and was of the order of 40%, 70%,
39% and 56% for June, July, August and September respectively of its monthly LPAs. The
amount of rainfall (in terms of % of LPA) was more over the East-UP as compare to West-UP
during all four months June-September of monsoon 2014. This year 68% areas of East-UP
received deficient rainfall, 24% areas received scanty rainfall, 5% areas received normal
rainfall and only 3% areas received excess rainfall. In the West-UP, 53% areas received
scanty rainfall and 47% areas received deficient rainfall. In this way performance of
monsoon 2014 was poor over West-UP in compare to East-UP.
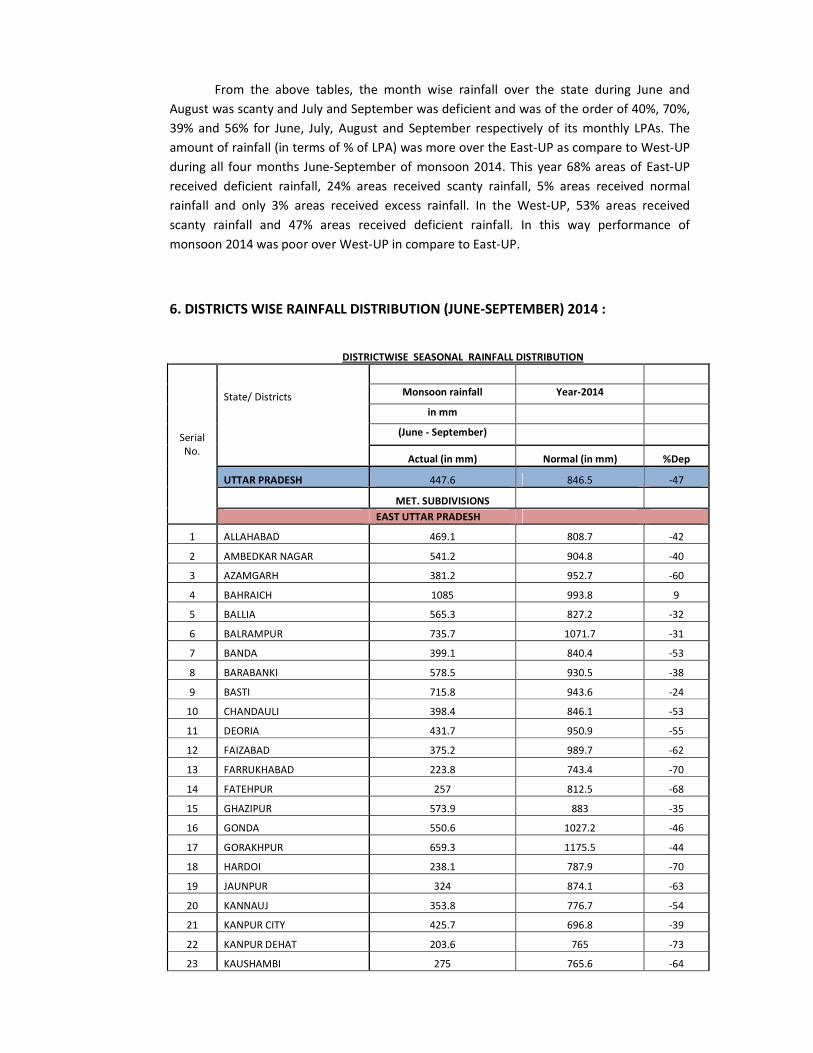
6. DISTRICTS WISE RAINFALL DISTRIBUTION (JUNE-SEPTEMBER) 2014 :
DISTRICTWISE SEASONAL RAINFALL DISTRIBUTION
Serial
No.
State/ Districts Monsoon rainfall Year-2014
in mm
(June - September)
Actual (in mm) Normal (in mm) %Dep
UTTAR PRADESH 447.6 846.5 -47
MET. SUBDIVISIONS
EAST UTTAR PRADESH
1 ALLAHABAD 469.1 808.7 -42
2 AMBEDKAR NAGAR 541.2 904.8 -40
3 AZAMGARH 381.2 952.7 -60
4 BAHRAICH 1085 993.8 9
5 BALLIA 565.3 827.2 -32
6 BALRAMPUR 735.7 1071.7 -31
7 BANDA 399.1 840.4 -53
8 BARABANKI 578.5 930.5 -38
9 BASTI 715.8 943.6 -24
10 CHANDAULI 398.4 846.1 -53
11 DEORIA 431.7 950.9 -55
12 FAIZABAD 375.2 989.7 -62
13 FARRUKHABAD 223.8 743.4 -70
14 FATEHPUR 257 812.5 -68
15 GHAZIPUR 573.9 883 -35
16 GONDA 550.6 1027.2 -46
17 GORAKHPUR 659.3 1175.5 -44
18 HARDOI 238.1 787.9 -70
19 JAUNPUR 324 874.1 -63
20 KANNAUJ 353.8 776.7 -54
21 KANPUR CITY 425.7 696.8 -39
22 KANPUR DEHAT 203.6 765 -73
23 KAUSHAMBI 275 765.6 -64
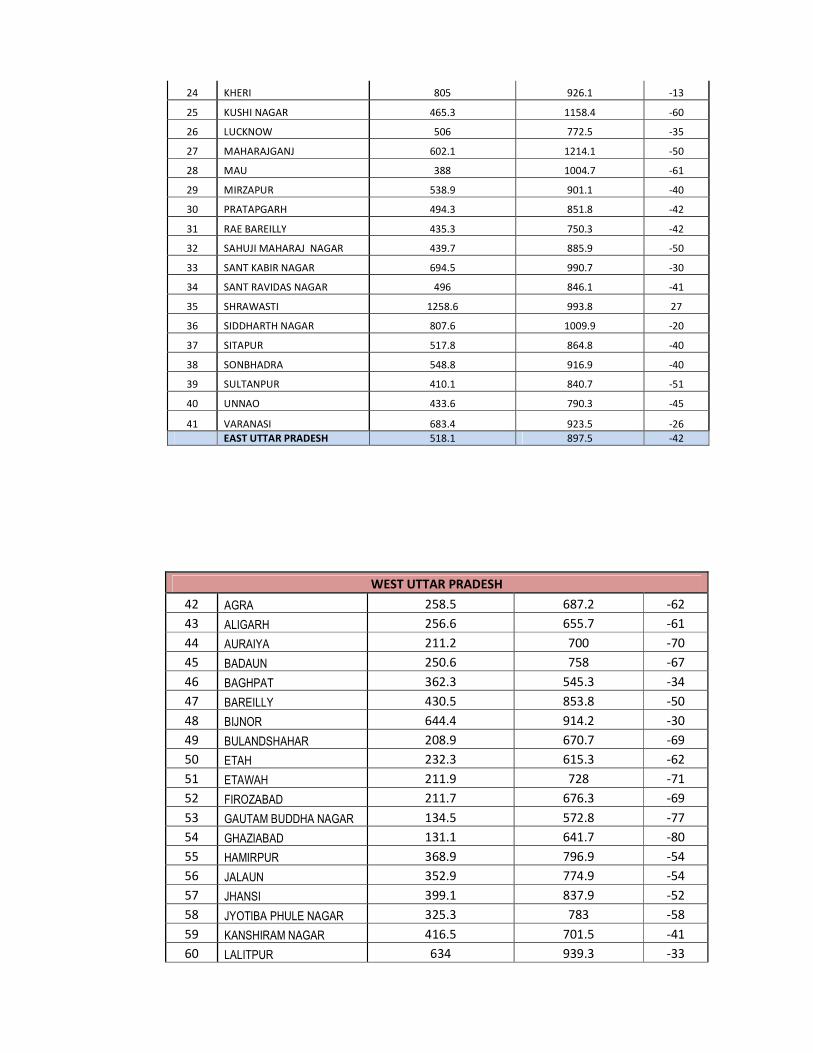
24 KHERI 805 926.1 -13
25 KUSHI NAGAR 465.3 1158.4 -60
26 LUCKNOW 506 772.5 -35
27 MAHARAJGANJ 602.1 1214.1 -50
28 MAU 388 1004.7 -61
29 MIRZAPUR 538.9 901.1 -40
30 PRATAPGARH 494.3 851.8 -42
31 RAE BAREILLY 435.3 750.3 -42
32 SAHUJI MAHARAJ NAGAR 439.7 885.9 -50
33 SANT KABIR NAGAR 694.5 990.7 -30
34 SANT RAVIDAS NAGAR 496 846.1 -41
35 SHRAWASTI 1258.6 993.8 27
36 SIDDHARTH NAGAR 807.6 1009.9 -20
37 SITAPUR 517.8 864.8 -40
38 SONBHADRA 548.8 916.9 -40
39 SULTANPUR 410.1 840.7 -51
40 UNNAO 433.6 790.3 -45
41 VARANASI 683.4 923.5 -26
EAST UTTAR PRADESH 518.1 897.5 -42
WEST UTTAR PRADESH
42 AGRA 258.5 687.2 -62
43 ALIGARH 256.6 655.7 -61
44 AURAIYA 211.2 700 -70
45 BADAUN 250.6 758 -67
46 BAGHPAT 362.3 545.3 -34
47 BAREILLY 430.5 853.8 -50
48 BIJNOR 644.4 914.2 -30
49 BULANDSHAHAR 208.9 670.7 -69
50 ETAH 232.3 615.3 -62
51 ETAWAH 211.9 728 -71
52 FIROZABAD 211.7 676.3 -69
53 GAUTAM BUDDHA NAGAR 134.5 572.8 -77
54 GHAZIABAD 131.1 641.7 -80
55 HAMIRPUR 368.9 796.9 -54
56 JALAUN 352.9 774.9 -54
57 JHANSI 399.1 837.9 -52
58 JYOTIBA PHULE NAGAR 325.3 783 -58
59 KANSHIRAM NAGAR 416.5 701.5 -41
60 LALITPUR 634 939.3 -33

T
The cumulative seasonal rainfall for the State as a whole was
Uttar Pradesh 58% of its LPA and West Uttar Pradesh
was very uneven over the State. Out of 71 districts of Uttar Pradesh 42 districts received
deficient rainfall, 26 districts received scanty
only 1 district received excess rainfall. Shrawasti district got
Gautam Buddh Nagar least rainfall (23%) of
6. WEEKLY RAINFALL DIST
Weekly rainfall distribution over the two Meteorological sub
shown in the following charts.
Fig.7: Weekly progress of Monsoon Rainfall
0
20
40
60
80
100
2.5 1
14.7
25.517.6
4-J
un
11
-Ju
n
18
-Ju
n
25
-Ju
n
2-J
ul
Weekly Rainfall Distribution Monsoon
Ra
infa
ll (i
nm
m)
→
61 MAHAMAYA NAGAR
62 MAHOBA
63 MAINPURI
64 MATHURA
65 MEERUT
66 MORADABAD
67 MUZAFFARNAGAR
68 PILIBHIT
69 RAMPUR
70 SAHARANPUR
71 SHAHJAHANPUR
WEST UTTAR PRADESH
he cumulative seasonal rainfall for the State as a whole was 53% of its LPA, East
% of its LPA and West Uttar Pradesh 44% of its LPA. The rainfall distribution
was very uneven over the State. Out of 71 districts of Uttar Pradesh 42 districts received
, 26 districts received scanty rainfall, 2 districts received normal
only 1 district received excess rainfall. Shrawasti district got the highest rainfall (127%)
Gautam Buddh Nagar least rainfall (23%) of its LPA.
WEEKLY RAINFALL DISTRIBUTION :
Weekly rainfall distribution over the two Meteorological sub-divisions of the state is
shown in the following charts.
: Weekly progress of Monsoon Rainfall-2014 over East-UP
17.6
80.9
20.7
79.9
29.1
51.1
37.541.5
6.814.7
19.5
60
10.55.6
2-J
ul
9-J
ul
16
-Ju
l
23
-Ju
l
30
-Ju
l
6-A
ug
13
-Au
g
20
-Au
g
27
-Au
g
3-S
ep
10
-Se
p
17
-Se
p
24
-Se
p
30
-Se
p
Weekly Rainfall Distribution Monsoon
2014 East Uttar Pradesh
Week ending → Actual Rainfall
MAHAMAYA NAGAR 264.5 625.4
258.8 776.4
191 655.3
206 579.9
281 778.5
514.6 855.2
313.3 736.8
396.5 988.6
326.5 915.5
341.3 804.6
423.8 859.2
WEST UTTAR PRADESH 340.3 768.8
% of its LPA, East-
% of its LPA. The rainfall distribution
was very uneven over the State. Out of 71 districts of Uttar Pradesh 42 districts received
, 2 districts received normal rainfall and
the highest rainfall (127%) and
divisions of the state is
5.6
30
-Se
p
Actual Rainfall
-58
-67
-71
-64
-64
-40
-57
-60
-64
-58
-51
-56

Fig. 8 Week-by-Week departure
Practically, on weekly basi
15 mm) during the week ending 4
amount of rainfall (80 mm) was observed during the week ending on 9
During the first three weeks of August rainfall was moderate after then it
last week of August. With a revival of monsoon in
increased. On week ending 17
rainfall activity gradually decreased
Fig.9: Weekly progress of Monsoon Rainfall
-100
-80
-60
-40
-20
0
-96 -94
-61
-41
← %
D
ep
art
ure
4-J
un
11
-Ju
n
18
-Ju
n
25
-Ju
n
2-J
ul
Percentage Departure of Cummulative Weekly
Rainfall
0
20
40
60
80
100
1.1 0
10.45.3
14.6
4-J
un
11
-Ju
n
18
-Ju
n
25
-Ju
n
2-J
ul
Weekly Rainfall Distribution Monsoon 2014
Ra
infa
ll
(in
mm
) →
departure of the Monsoon Rainfall 2014 over East-UP (Cumulative)
Practically, on weekly basis the rainfall over East Uttar Pradesh was insignificant
week ending 4th
June, 11th
June, 27th
August and 30th
September.
of rainfall (80 mm) was observed during the week ending on 9th
During the first three weeks of August rainfall was moderate after then it decreased
August. With a revival of monsoon in fist two weeks of September
increased. On week ending 17th
September rainfall activity increased suddenly
ll activity gradually decreased.
Fig.9: Weekly progress of Monsoon Rainfall-2014 over West-UP
-52
-22
-38
-27-32 -31 -33 -35
-39 -42 -43 -41 -
2-J
ul
9-J
ul
16
-Ju
l
23
-Ju
l
30
-Ju
l
6-A
ug
13
-Au
g
20
-Au
g
27
-Au
g
3-S
ep
10
-Se
p
17
-Se
p
Week ending → % Dep
Percentage Departure of Cummulative Weekly
Rainfall Monsoon 2014 East Uttar Pradesh
14.610.3 14
85.2
31.8
50.1
16.711.9
0.3
14.9
40.9
29.5
2.9
9-J
ul
16
-Ju
l
23
-Ju
l
30
-Ju
l
6-A
ug
13
-Au
g
20
-Au
g
27
-Au
g
3-S
ep
10
-Se
p
17
-Se
p
24
-Se
p
Weekly Rainfall Distribution Monsoon 2014
West Uttar Pradesh
Week ending → Actual Rainfall
UP (Cumulative)
the rainfall over East Uttar Pradesh was insignificant (<
September. Highest
and 23rd
July.
decreased during
fist two weeks of September rainfall slowly
suddenly thereafter
UP
-41 -42
24
-Se
p
30
-Se
p
% Dep
0
24
-Se
p
30
-Se
p
Actual Rainfall
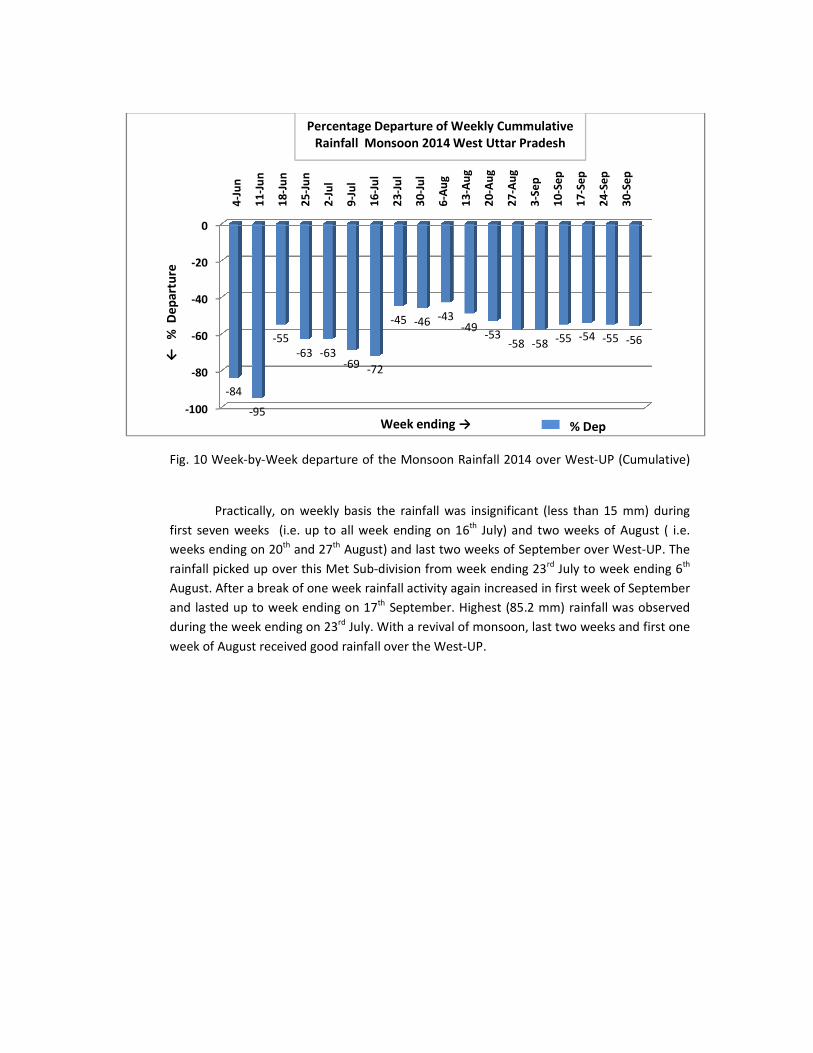
Fig. 10 Week-by-Week departure
Practically, on weekly bas
first seven weeks (i.e. up to all week ending on 16
weeks ending on 20th
and 27
rainfall picked up over this Met Sub
August. After a break of one week rainfall activity again increased in first week of September
and lasted up to week ending on 17
during the week ending on 23
week of August received good rainfall over the West
-100
-80
-60
-40
-20
0
-84
-95
-55
-63 -← %
D
ep
art
ure
4-J
un
11
-Ju
n
18
-Ju
n
25
-Ju
n
2-J
ul
Percentage Departure of Weekly Cummulative
Rainfall
departure of the Monsoon Rainfall 2014 over West-UP (Cumulative)
Practically, on weekly basis the rainfall was insignificant (less than 15 mm)
first seven weeks (i.e. up to all week ending on 16th
July) and two weeks of August ( i.e.
and 27th
August) and last two weeks of September over West
rainfall picked up over this Met Sub-division from week ending 23rd
July to week ending 6
August. After a break of one week rainfall activity again increased in first week of September
and lasted up to week ending on 17th
September. Highest (85.2 mm) rainfall was observed
during the week ending on 23rd
July. With a revival of monsoon, last two weeks and first one
good rainfall over the West-UP.
-63-69 -72
-45 -46 -43-49
-53-58 -58 -55 -54 -55
2-J
ul
9-J
ul
16
-Ju
l
23
-Ju
l
30
-Ju
l
6-A
ug
13
-Au
g
20
-Au
g
27
-Au
g
3-S
ep
10
-Se
p
17
-Se
p
24
-Se
p
Week ending → % Dep
Percentage Departure of Weekly Cummulative
Rainfall Monsoon 2014 West Uttar Pradesh
UP (Cumulative)
s the rainfall was insignificant (less than 15 mm) during
July) and two weeks of August ( i.e.
August) and last two weeks of September over West-UP. The
uly to week ending 6th
August. After a break of one week rainfall activity again increased in first week of September
September. Highest (85.2 mm) rainfall was observed
l of monsoon, last two weeks and first one
55 -56
24
-Se
p
30
-Se
p

7. DISTRICT-WISE SPATIAL AND INTENSITY SEASONAL RAINFALL DISTRIBUTION :
Fig. 11 Districtwise Spatial Distribution Rainfall during monsoon 2014 over East-UP
In the East-UP, maximum rainfall days were 83 days over Gorakhpur district and minimum
rainfall days were 24 days over Santravidas Nagar district. Fairly wide spread to wide spread rainfall
occurred on 13 days (minimum) over Mau district and 44 days (maximum) over Varanasi district.
Fig. 12 District wise Spatial Distribution Rainfall during monsoon 2014 over West-UP
22
0 0 0
17
08
25
0 0 0 0 0 0
22 2012 15 12
013 10
013
0
19
0 0 0 0
21
0 0 0 0
21 2411 15 15
0
15
0
22 27
10
25
25
15
140
2011 11
20
8 1336
16 18
15
9 12
5
20
30
18
2614 15
22
14
19
37
0
25
22 16
1517
9
16
12
0
14
2517
0
9
12
16
0
012 12
178
19
14
715
0
9 9
5
9
0
12
0
011
10
9
0
0
0
0
18
10
9
15
1018
16
26
15
1424
24
11
11
26
35
229 9
0
190
21
8
12
16
1910
18
19
24
15
28
13
16
19
16
10
0
24
30
012
24
16
11
26
0
10
20
30
40
50
60
70
80
90
ALL
AH
AB
AD
AM
BE
DK
AR
NA
GA
R
AZ
AM
GA
RH
BA
HR
AIC
H
BA
LLIA
BA
LRA
MP
UR
BA
ND
A
BA
RA
BA
NK
I
BA
ST
I
CH
AN
DA
ULI
DE
OR
IA
FA
IZA
BA
D
FA
RR
UK
HA
BA
D
FA
TE
HP
UR
GH
AZ
IPU
R
GO
ND
A
GO
RA
KH
PU
R
HA
RD
OI
JAU
NP
UR
KA
NN
AU
J
KA
NP
UR
CIT
Y
KA
NP
UR
DE
HA
T
KA
US
HA
MB
I
KH
ER
I
KU
SH
I NA
GA
R
LUC
KN
OW
MA
HA
RA
JGA
NJ
MA
U
MIR
ZA
PU
R
PR
AT
AP
GA
RH
RA
E B
AR
EIL
LY
SA
HU
JI M
AH
AR
AJ
…
SA
NT
KA
BIR
NA
GA
R
SA
NT
RA
VID
AS
…
SH
RA
WA
ST
I NA
GA
R
SID
DH
AR
TH
NA
GA
R
SIT
AP
UR
SO
NB
HA
DR
A
SU
LTA
NP
UR
UN
NA
O
VA
RA
NA
SI
MOST MANY SCT ISOL
NU
MB
ER
OF
D
AY
S
DISTRICTS
MONSOON 2014 DAILY RAINFALL
DISTRIBUTION OVER EAST UTTAR PRADESH
18
0 0
13
0
1015 16
0 0 0 0 0
14 1523
0 0 0 0 0 0 08
15
0
19
0 0
13
19
22 19
625
15 410
1813
18
0
13
1216
9
13
2517 16
24 2215
9
12
14
12
15 12
9
3
911
40
18
116
10
10 0
0
0
5
7 6
0
0
0 0
00
0
8
9
11
11
1312
12
7
8
06 0
11
135
78
14
13
7
159
19
10
021
110
13
9
5
12
0
0
13
11
6
0
10
20
30
40
50
60
MOST MANY SCT ISOL
NU
MB
ER
OF
D
AY
S
DISTRICTS
MONSOON 2014 DAILY RAINFALL DISTRIBUTION
OVER WEST UTTAR PRADESH
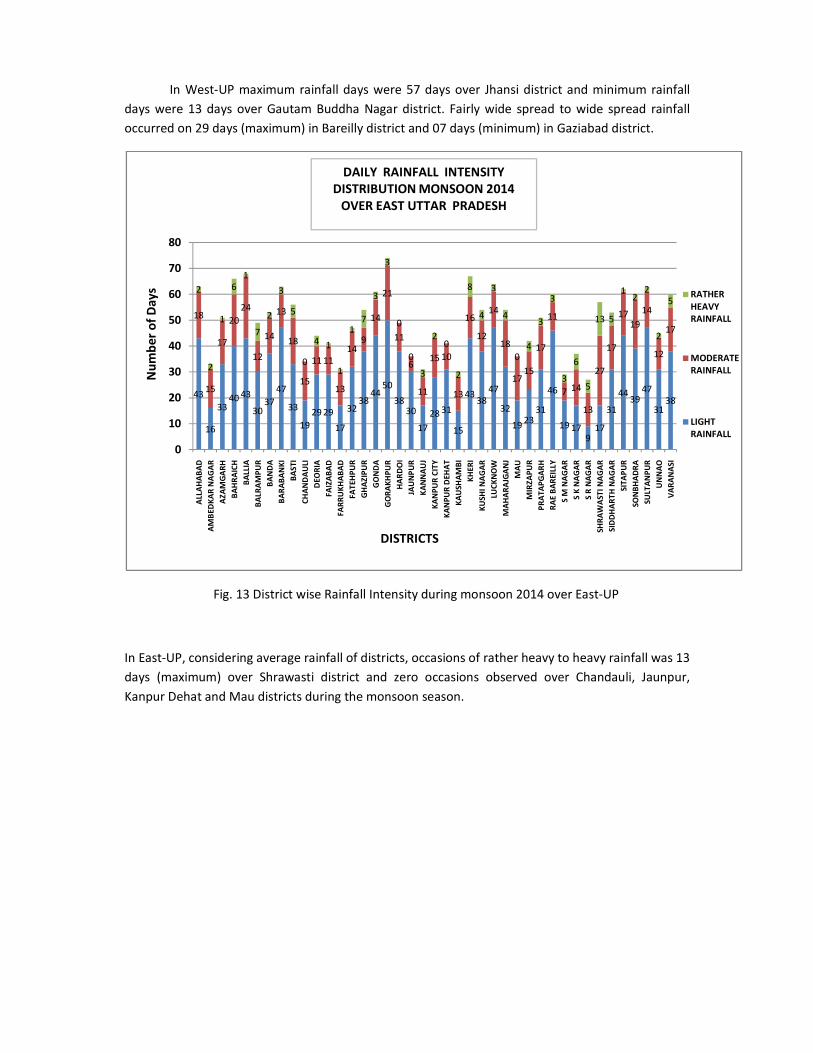
In West-UP maximum rainfall days were 57 days over Jhansi district and minimum rainfall
days were 13 days over Gautam Buddha Nagar district. Fairly wide spread to wide spread rainfall
occurred on 29 days (maximum) in Bareilly district and 07 days (minimum) in Gaziabad district.
Fig. 13 District wise Rainfall Intensity during monsoon 2014 over East-UP
In East-UP, considering average rainfall of districts, occasions of rather heavy to heavy rainfall was 13
days (maximum) over Shrawasti district and zero occasions observed over Chandauli, Jaunpur,
Kanpur Dehat and Mau districts during the monsoon season.
43
16
3340 43
3037
47
33
19
29 29
17
3238
4450
3830
17
28 31
15
4338
47
32
1923
31
46
19 179
17
31
4439
47
3138
18
15
17
20
24
12
14
13
18
15
11 11
13
149
14
21
11
6
11
15 10
13
16
12
14
18
1715
17
11
7 14
13
27
17
1719
14
12
17
2
2
1
6
1
7
2
3
5
0
4 1
1
17
3
3
0
0
3
20
2
8
4
3
4
04
3
3
3
6
5
13 5
12
2
2
5
0
10
20
30
40
50
60
70
80
ALL
AH
AB
AD
AM
BE
DK
AR
NA
GA
R
AZ
AM
GA
RH
BA
HR
AIC
H
BA
LLIA
BA
LR
AM
PU
R
BA
ND
A
BA
RA
BA
NK
I
BA
ST
I
CH
AN
DA
ULI
DE
OR
IA
FA
IZA
BA
D
FA
RR
UK
HA
BA
D
FA
TE
HP
UR
GH
AZ
IPU
R
GO
ND
A
GO
RA
KH
PU
R
HA
RD
OI
JAU
NP
UR
KA
NN
AU
J
KA
NP
UR
CIT
Y
KA
NP
UR
DE
HA
T
KA
US
HA
MB
I
KH
ER
I
KU
SH
I N
AG
AR
LUC
KN
OW
MA
HA
RA
JGA
NJ
MA
U
MIR
ZA
PU
R
PR
AT
AP
GA
RH
RA
E B
AR
EIL
LY
S M
NA
GA
R
S K
NA
GA
R
S R
NA
GA
R
SH
RA
WA
ST
I N
AG
AR
SID
DH
AR
TH
NA
GA
R
SIT
AP
UR
SO
NB
HA
DR
A
SU
LTA
NP
UR
UN
NA
O
VA
RA
NA
SI
RATHER
HEAVY
RAINFALL
MODERATE
RAINFALL
LIGHT
RAINFALL
Nu
mb
er
of
Da
ys
DAILY RAINFALL INTENSITY
DISTRIBUTION MONSOON 2014
OVER EAST UTTAR PRADESH
DISTRICTS
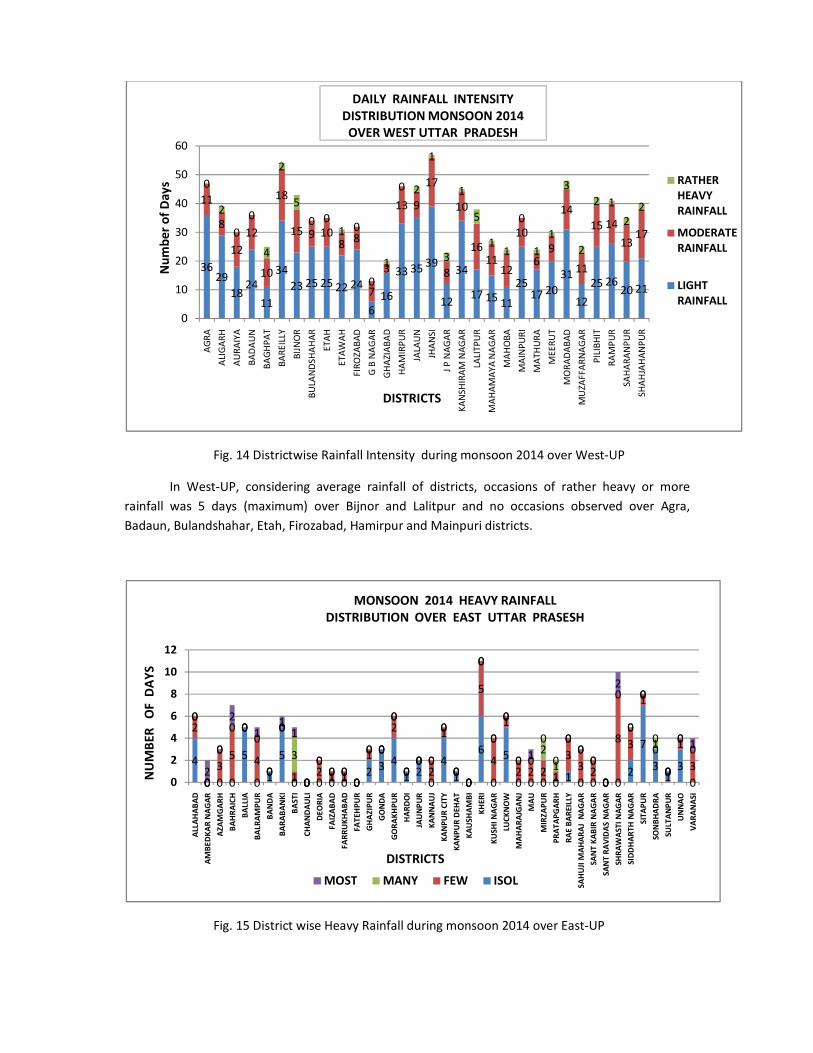
Fig. 14 Districtwise Rainfall Intensity during monsoon 2014 over West-UP
In West-UP, considering average rainfall of districts, occasions of rather heavy or more
rainfall was 5 days (maximum) over Bijnor and Lalitpur and no occasions observed over Agra,
Badaun, Bulandshahar, Etah, Firozabad, Hamirpur and Mainpuri districts.
Fig. 15 District wise Heavy Rainfall during monsoon 2014 over East-UP
3629
1824
11
34
23 25 25 22 24
6
16
33 3539
12
34
17 1511
2517 20
31
12
25 2620 21
11
8
12
12
10
18
15 9 108
8
7
3
13 9
17
8
10
1611
12
10
69
14
11
15 14
1317
0
2
0
0
4
2
5
0 01 0
0
1
0 2
1
3
1
5
11
0
1
1
3
2
2 1
2
2
0
10
20
30
40
50
60
AG
RA
ALI
GA
RH
AU
RA
IYA
BA
DA
UN
BA
GH
PA
T
BA
RE
ILLY
BIJ
NO
R
BU
LAN
DS
HA
HA
R
ET
AH
ET
AW
AH
FIR
OZ
AB
AD
G B
NA
GA
R
GH
AZ
IAB
AD
HA
MIR
PU
R
JALA
UN
JHA
NS
I
J P
NA
GA
R
KA
NS
HIR
AM
NA
GA
R
LALI
TP
UR
MA
HA
MA
YA
NA
GA
R
MA
HO
BA
MA
INP
UR
I
MA
TH
UR
A
ME
ER
UT
MO
RA
DA
BA
D
MU
ZA
FF
AR
NA
GA
R
PIL
IBH
IT
RA
MP
UR
SA
HA
RA
NP
UR
SH
AH
JAH
AN
PU
R
RATHER
HEAVY
RAINFALL
MODERATE
RAINFALL
LIGHT
RAINFALL
Nu
mb
er
of
Da
ys
DAILY RAINFALL INTENSITY
DISTRIBUTION MONSOON 2014
OVER WEST UTTAR PRADESH
DISTRICTS
4
0 0 0
5
01
5
0 0 0 0 0 02
3 4
1 20
4
10
6
0
5
0 0 0 01
0 0 0 02
7
31
3
0
2
0
35
0
40
0
10
2 1 10
10
2
00
2
1
00
5
4
1
2 2 2 1
33
20
83
1
0
0
1
3
0
0
0
0 00
0
0
3
0
00 0
0
0 0
0
00 0
0
00
0
0
0
0 02
1
00
0
0
0
0
0
1
0
00
0
2
0
20
1
0
11
0
00 0
0
0 0
0
00 0
0
00
0
0
0
01
0
0
00
0
0
2
0
0
0
0
01
0
2
4
6
8
10
12
ALL
AH
AB
AD
AM
BE
DK
AR
NA
GA
R
AZ
AM
GA
RH
BA
HR
AIC
H
BA
LLIA
BA
LR
AM
PU
R
BA
ND
A
BA
RA
BA
NK
I
BA
ST
I
CH
AN
DA
ULI
DE
OR
IA
FA
IZA
BA
D
FA
RR
UK
HA
BA
D
FA
TE
HP
UR
GH
AZ
IPU
R
GO
ND
A
GO
RA
KH
PU
R
HA
RD
OI
JAU
NP
UR
KA
NN
AU
J
KA
NP
UR
CIT
Y
KA
NP
UR
DE
HA
T
KA
US
HA
MB
I
KH
ER
I
KU
SH
I N
AG
AR
LUC
KN
OW
MA
HA
RA
JGA
NJ
MA
U
MIR
ZA
PU
R
PR
AT
AP
GA
RH
RA
E B
AR
EIL
LY
SA
HU
JI M
AH
AR
AJ
NA
GA
R
SA
NT
KA
BIR
NA
GA
R
SA
NT
RA
VID
AS
NA
GA
R
SH
RA
WA
ST
I N
AG
AR
SID
DH
AR
TH
NA
GA
R
SIT
AP
UR
SO
NB
HA
DR
A
SU
LTA
NP
UR
UN
NA
O
VA
RA
NA
SI
MOST MANY FEW ISOL
MONSOON 2014 HEAVY RAINFALL
DISTRIBUTION OVER EAST UTTAR PRASESH
NU
MB
ER
O
F D
AY
S
DISTRICTS
.In East-UP, maximum number of days of heavy rainfall was experienced in area of Kheri district. The
districts namely Chandauli, Fatehpur,Kausambi and Sant Ravodas Nagar have experienced no
occasions of Heavy Rainfall in their area. It was 37 districts where in their area at least one or more
days were experienced heavy rainfall during the monsoon season.
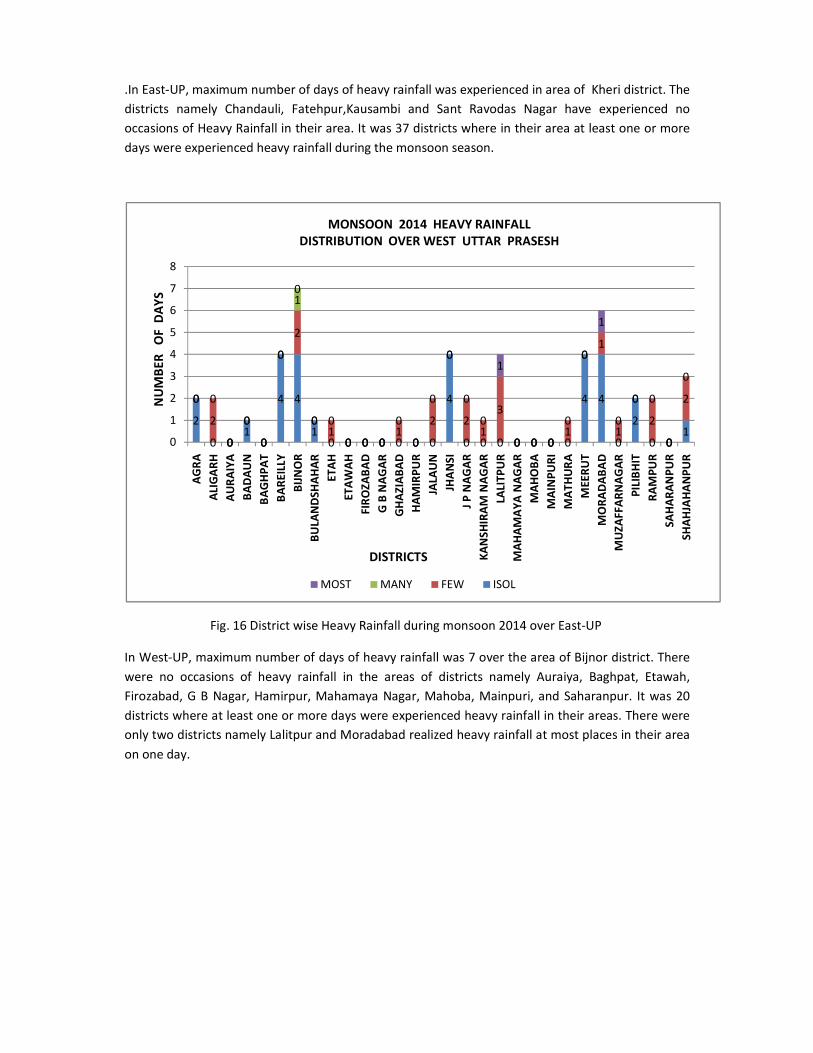
Fig. 16 District wise Heavy Rainfall during monsoon 2014 over East-UP
In West-UP, maximum number of days of heavy rainfall was 7 over the area of Bijnor district. There
were no occasions of heavy rainfall in the areas of districts namely Auraiya, Baghpat, Etawah,
Firozabad, G B Nagar, Hamirpur, Mahamaya Nagar, Mahoba, Mainpuri, and Saharanpur. It was 20
districts where at least one or more days were experienced heavy rainfall in their areas. There were
only two districts namely Lalitpur and Moradabad realized heavy rainfall at most places in their area
on one day.
2
0 01
0
4 4
10 0 0 0 0 0 0
4
0 0 0 0 0 0 0
4 4
0
2
0 01
0
2
0
0
0
0
2
01
0 0 01
0
2
0
21
3
0 0 01
01
1
0
2
0
2
1
0 0
0
0
0
0
0
0 0
0 0 0
0
0
0
0
0
0
1
0 0 0
0
0
1
0
0 0
0
0
0
1
2
3
4
5
6
7
8
AG
RA
ALI
GA
RH
AU
RA
IYA
BA
DA
UN
BA
GH
PA
T
BA
RE
ILLY
BIJ
NO
R
BU
LAN
DS
HA
HA
R
ET
AH
ET
AW
AH
FIR
OZ
AB
AD
G B
NA
GA
R
GH
AZ
IAB
AD
HA
MIR
PU
R
JALA
UN
JHA
NS
I
J P
NA
GA
R
KA
NS
HIR
AM
NA
GA
R
LALI
TP
UR
MA
HA
MA
YA
NA
GA
R
MA
HO
BA
MA
INP
UR
I
MA
TH
UR
A
ME
ER
UT
MO
RA
DA
BA
D
MU
ZA
FF
AR
NA
GA
R
PIL
IBH
IT
RA
MP
UR
SA
HA
RA
NP
UR
SH
AH
JAH
AN
PU
R
MOST MANY FEW ISOL
MONSOON 2014 HEAVY RAINFALL
DISTRIBUTION OVER WEST UTTAR PRASESH
NU
MB
ER
O
F
DA
YS
DISTRICTS

Weekly district-wise rainfall (in mm) over East Uttar Pradesh during Monsoon Season 2014
Week ending 4-
Jun 11-
Jun 18-
Jun 25- Jun
2- Jul
9- Jul
16- Jul
23- Jul
30- Jul
6- Aug
13- Aug
20- Aug
27-Aug
3- Sep
10-Sep
17-Sep
24-Sep
30-Sep
ALLAHABAD 0.0 0.0 11.0 26.3 0.8 48.5 14.5 110.0 28.1 102.4 40.7 10.5 2.1 11.7 41.6 18.8 0.7 1.2
AMBEDKAR NAGAR 0.0 0.0 0.0 4.3 2.0 48.5 14.5 110.0 28.1 37.2 32.0 17.0 0.0 1.0 0.0 51.3 21.0 5.0
AZAMGARH 0.0 0.0 0.0 30.4 4.7 40.2 16.3 89.3 17.1 53.7 22.6 26.7 0.0 7.8 8.7 45.3 18.4 0.0
BAHRAICH 0.0 0.0 23.9 13.8 27.3 378.5 44.7 79.2 54.8 50.5 47.3 114.7 13.6 7.3 14.2 185.8 18.3 11.3
BALLIA 0.0 2.0 17.4 38.9 22.6 65.2 7.6 70.1 34.3 29.1 28.1 95.6 25.4 14.8 10.6 39.0 36.8 27.9
BALRAMPUR 0.0 1.6 6.4 60.1 12.7 122.9 82.1 44.8 28.2 36.7 50.9 182.6 10.8 2.8 0.0 56.2 22.6 14.5
BANDA 3.0 0.0 28.4 18.6 4.3 6.2 5.8 46.9 44.7 92.3 28.3 27.2 6.8 26.9 47.8 11.6 0.2 0.0
BARABANKI 0.0 0.0 13.1 13.2 11.9 207.7 27.8 68.2 55.1 20.1 36.2 8.4 9.2 17.0 13.2 74.5 0.0 1.7
BASTI 0.0 0.0 5.2 72.3 85.3 120.7 7.5 112.9 30.5 19.7 26.1 45.2 1.3 49.7 13.4 113.3 9.1 2.6
CHANDAULI 0.0 0.0 0.0 0.0 39.0 34.5 9.5 33.0 26.5 34.2 75.0 30.4 0.0 4.4 5.2 18.0 6.4 3.0
DEORIA 0.0 0.0 18.3 49.5 28.9 89.1 1.5 43.5 22.5 53.6 6.5 79.4 40.0 4.5 0.0 19.0 1.5 4.0
FAIZABAD 0.0 0.0 1.6 9.7 4.9 12.0 2.8 42.7 16.5 37.2 30.5 20.5 0.0 9.7 11.6 75.2 0.0 0.8
FARRUKHABAD 0.0 0.0 11.5 5.1 0.3 32.4 3.2 83.7 15.6 0.7 7.1 0.1 0.0 9.8 24.1 91.1 0.0 0.0
FATEHPUR 0.0 0.0 8.8 15.0 22.6 58.6 33.5 73.2 11.8 28.6 7.4 0.7 0.0 24.3 14.2 23.2 0.0 0.0
GHAZIPUR 0.0 1.3 0.5 62.1 12.6 95.9 2.6 83.9 18.2 42.5 76.9 26.5 9.0 15.3 30.4 51.1 54.3 0.0
GONDA 0.0 0.0 24.0 37.4 37.0 67.6 14.7 25.0 52.1 70.1 47.1 51.2 0.5 6.6 6.7 87.3 10.7 3.3
GORAKHPUR 0.0 2.5 12.8 93.0 10.5 16.8 7.2 42.2 43.8 19.3 18.5 129.8 26.7 19.0 9.9 53.7 32.1 36.9
HARDOI 0.0 0.0 1.6 3.2 2.3 58.9 12.6 78.2 5.6 30.1 10.7 0.0 0.0 22.7 27.8 35.7 0.0 0.0
JAUNPUR 0.0 0.0 0.0 11.6 2.7 0.0 0.0 0.0 0.0 30.3 52.6 11.9 4.0 7.1 2.5 37.5 3.0 0.3
KANNAUJ 0.0 0.0 50.1 2.7 0.0 8.5 0.0 66.2 28.5 59.0 8.1 0.0 0.0 13.8 33.6 77.3 0.0 2.5
KANPUR CITY 0.0 0.0 18.8 6.4 4.8 15.8 40.8 86.8 36.1 38.0 11.9 3.8 0.0 16.9 38.0 98.0 0.0 0.0
KANPUR DEHAT 0.0 0.0 7.2 5.0 1.5 2.0 5.8 58.7 25.8 79.2 13.1 0.3 0.0 6.7 18.5 19.2 0.0 0.0
KAUSHAMBI 0.0 0.0 0.0 6.9 0.0 41.2 0.0 70.6 12.5 91.7 17.9 48.6 0.0 25.9 25.5 5.9 0.0 0.0
KHERI 1.9 0.0 61.6 22.4 20.1 155.1 86.0 77.2 26.7 8.5 14.5 190.5 18.0 8.9 26.9 137.3 3.6 3.7
KUSHI NAGAR 0.0 2.5 6.0 29.0 46.0 32.8 5.5 7.5 6.5 6.5 14.5 190.5 18.0 2.0 0.0 68.0 20.5 9.5
LUCKNOW 0.0 0.2 7.4 7.6 14.4 64.1 25.5 180.1 13.0 35.9 31.8 3.5 0.0 13.3 43.1 66.1 0.0 0.2
MAHARAJGANJ 0.0 27.5 28.0 46.5 52.5 36.0 4.0 19.5 29.5 6.5 6.5 183.8 51.0 12.5 0.0 51.6 17.5 29.3
MAU 0.0 4.5 3.5 45.0 15.0 32.0 0.0 49.5 38.0 31.0 1.5 63.0 18.0 4.0 3.0 18.0 31.0 31.0
MIRZAPUR 0.0 0.0 1.0 46.1 5.3 74.7 2.3 162.5 1.7 35.1 101.2 12.0 0.0 4.7 18.3 42.5 30.5 1.0
PRATAPGARH 0.0 0.0 15.0 18.7 10.7 66.7 13.3 156.3 13.0 81.3 46.7 5.3 1.3 17.0 30.3 16.7 2.0 0.0
RAE BAREILLY 0.0 0.0 7.0 17.7 3.3 140.6 1.2 111.7 18.1 33.1 17.3 4.7 0.9 9.9 10.2 56.4 0.7 0.2
SAHUJI MAHARAJ NAGAR 0.0 0.0 0.0 14.5 8.0 16.7 2.5 56.5 43.3 107.3 7.3 6.3 0.0 38.5 74.5 6.5 25.5 0.0
SANT KABIR NAGAR 0.0 10.0 0.0 4.0 109.5 97.0 15.0 42.0 34.0 57.0 4.0 132.0 30.0 25.0 0.0 54.0 22.0 30.0
SANT RAVIDAS NAGAR 0.0 0.0 12.6 44.1 13.9 50.0 0.0 238.0 0.0 0.0 93.0 2.0 0.0 28.0 29.0 13.0 0.0 0.0
SHRAWASTI NAGAR 0.0 1.2 4.4 97.9 49.4 287.0 163.9 111.6 122.4 116.6 25.8 112.2 57.7 14.0 9.9 109.8 11.0 23.7
SIDDHARTH NAGAR 0.0 0.0 36.9 7.8 23.5 74.8 21.5 40.6 5.9 61.5 15.1 170.7 22.5 12.8 0.0 130.2 27.0 38.1
SITAPUR 0.0 0.0 19.0 12.9 22.6 136.8 17.1 75.7 46.5 37.3 34.3 11.1 1.6 19.7 15.4 65.9 2.9 1.0
SONBHADRA 0.0 0.0 4.7 42.1 1.7 24.2 14.8 57.9 58.1 64.1 151.0 35.7 3.5 21.0 22.3 22.4 18.8 0.0
SULTANPUR 0.0 0.0 4.7 42.1 6.1 71.6 3.3 86.5 28.4 43.7 45.5 9.1 0.3 23.2 12.2 33.6 0.0 0.0
UNNAO 0.0 0.0 13.5 13.3 2.3 26.8 22.8 108.5 6.4 74.6 9.3 0.3 0.0 11.3 33.2 108.8 0.0 1.0
VARANASI 0.0 0.0 2.9 16.5 8.3 74.7 17.0 219.6 6.2 39.7 149.7 13.2 16.7 9.5 26.1 68.9 11.9 2.3

Weekly district-wise rainfall (in mm) over West Uttar Pradesh during Monsoon Season 2014
Report Prepared by- R P Kuril, AM-II
Week ending 4-
Jun 11-
Jun 18-
Jun 25- Jun
2- Jul
9- Jul
16- Jul
23- Jul
30- Jul
6- Aug
13- Aug
20- Aug
27-Aug
3- Sep
10-Sep
17-Sep
24-Sep
30-Sep
AGRA 0.0 0.0 3.3 9.0 0.0 9.4 13.3 40.9 10.4 93.9 15.1 0.0 0.0 20.7 29.2 12.0 0.0 0.0
ALIGARH 0.0 0.0 24.8 11.8 0.0 13.2 1.3 76.5 7.4 22.4 20.6 1.1 0.0 2.5 20.1 53.8 0.0 0.0
AURAIYA 0.0 0.0 4.8 3.5 0.0 0.0 23.5 60.3 31.5 29.8 15.6 0.0 0.0 9.0 31.5 4.0 0.0 0.0
BADAUN 0.0 0.0 1.4 2.0 12.6 2.2 0.0 56.0 46.6 73.6 7.8 1.0 0.0 3.4 14.8 29.2 0.0 0.0
BAGHPAT 0.0 0.0 52.6 2.5 48.7 13.2 0.0 54.9 9.3 43.8 10.1 0.0 0.0 28.6 99.6 1.0 0.0 0.0
BAREILLY 0.0 0.0 11.0 2.9 39.3 22.6 24.1 116.6 31.0 17.6 10.5 48.1 0.0 6.4 59.2 27.2 4.5 0.0
BIJNOR 0.0 0.0 6.1 0.0 53.9 3.6 5.5 262.2 67.3 36.5 10.0 43.6 0.0 15.9 99.5 36.3 4.0 0.0
BULANDSHAHAR 0.0 0.0 10.4 3.7 8.5 0.0 3.2 60.4 7.4 24.0 7.0 0.0 0.0 12.1 39.7 35.7 0.0 0.0
ETAH 0.0 0.0 1.3 2.3 0.0 0.5 0.7 52.0 39.4 38.8 24.7 0.0 0.0 6.7 21.3 36.8 0.0 0.0
ETAWAH 0.0 0.0 14.5 0.3 0.7 0.5 13.9 44.6 8.3 31.1 40.3 0.0 0.0 1.3 29.3 27.1 0.0 0.0
FIROZABAD 0.0 0.0 0.0 23.1 0.0 10.0 5.7 21.1 10.7 15.6 22.4 2.0 0.0 10.8 38.9 47.9 0.0 0.0
GAUTAM BUDDHA NAGAR 0.0 0.0 15.0 0.0 0.0 12.0 0.0 15.5 0.0 8.0 17.0 0.0 0.0 0.0 56.0 11.0 0.0 0.0
GHAZIABAD 0.0 0.0 5.7 0.0 39.3 0.0 0.0 25.1 2.8 16.6 1.0 0.0 0.0 1.3 26.5 12.9 0.0 0.0
HAMIRPUR 3.7 0.0 24.2 1.1 0.8 9.0 2.3 65.8 26.3 83.3 13.0 7.5 0.8 38.5 38.0 28.5 0.0 0.0
JALAUN 11.7 0.0 3.2 5.5 2.8 4.2 33.6 20.6 74.8 52.6 6.9 0.0 3.5 36.8 73.8 13.3 8.8 0.0
JHANSI 0.9 0.0 2.4 19.7 3.7 8.4 26.5 90.7 15.3 82.3 22.9 0.3 2.9 33.3 49.1 40.7 0.0 0.0
JYOTIBA PHULE NAGAR 0.0 0.0 1.5 0.0 7.0 0.5 8.0 106.5 118.5 10.0 0.0 15.0 0.0 1.5 28.8 8.0 20.0 0.0
KANSHIRAM NAGAR 0.0 0.0 18.0 0.0 6.0 0.0 0.0 57.5 83.0 45.0 16.1 6.5 0.4 15.3 39.5 22.7 8.6 0.0
LALITPUR 0.0 0.0 20.5 4.0 0.0 29.5 43.0 159.0 7.0 196.5 51.5 4.0 0.0 35.0 2.0 82.0 0.0 0.0
MAHAMAYA NAGAR 0.0 0.0 3.0 5.5 1.0 11.5 15.5 47.0 49.5 54.5 9.5 0.0 0.0 0.5 11.0 53.5 0.0 0.0
MAHOBA 0.0 0.0 5.2 0.0 0.0 3.0 8.4 64.4 5.4 54.2 29.6 0.0 0.0 10.0 76.6 2.0 0.0 0.0
MAINPURI 0.0 0.0 12.2 3.0 0.0 1.5 22.8 31.4 45.6 18.3 11.4 1.5 0.0 5.1 6.6 31.1 0.0 0.0
MATHURA 0.0 0.0 3.6 14.3 2.2 1.0 0.0 32.3 35.5 39.6 18.8 0.0 0.0 16.3 34.9 8.3 0.0 0.0
MEERUT 0.0 0.0 6.7 0.0 27.8 2.8 0.0 82.0 23.7 24.0 4.3 0.0 0.0 21.7 54.4 33.6 0.0 0.0
MORADABAD 0.0 0.0 4.2 4.0 34.7 8.9 10.0 211.9 24.3 30.2 22.5 37.1 0.0 5.7 50.0 42.5 28.1 0.5
MUZAFFARNAGAR 0.0 0.0 17.0 2.1 35.8 1.0 0.0 104.7 8.4 46.6 0.0 0.0 0.0 31.1 66.7 0.0 0.0 0.0
PILIBHIT 0.0 0.0 28.8 22.
4 7.4 41.7 13.2 102.2 24.9 18.2 18.6 69.0 0.0 8.4 29.7 10.1 2.0 0.0
RAMPUR 0.0 0.0 2.5 0.8 25.6 2.4 6.9 94.6 36.8 18.7 20.9 39.9 0.0 12.6 30.9 14.1 19.5 0.0
SAHARANPUR 0.0 0.0 20.0 0.0 47.0 1.7 0.0 76.0 22.3 49.7 8.0 0.3 0.0 20.7 55.0 40.7 0.0 0.0
SHAHJAHANPUR 0.0 0.0 14.1 0.0 10.5 55.3 67.5 71.2 62.8 25.9 9.6 36.9 0.0 12.5 12.9 44.6 0.0 0.0